report - defense technical information center · rt',ort report divllpetof utafine ... and a...
TRANSCRIPT
Final ReportF-C3013
Report
DEVELOPMENT OF ULTR'A FINE GRAIN SIZE
TITANIUM WITH IMPROVED MECHANICAL PROPERTIESReproducod by
NATIONAL TECHNICALINFORMATION SERVICE
,,5prd, Va. 212,5, D D C
Robin L. Jones .O AP 2,7 191
March 1972 - .
Prepared for
"NAVAL AIR SYSTEMS COMMAND ru-Oi- LI PU BFUG E fr
DISTRIBUMITUO UIT•J -)D
Contract No. tU00019-71-C0133
T V! FAN•IM4 #NSYITUT• lSt|ARCNI• tAT ILI*gNIAMN PANMN #A~NAY p~ILAA MCIt .~~4 #*
IiF-;ial Rt',ort
Report
DIVLLPETOF UTAFINE GRAIN SIZE :TITANIUM WITH IMPROVEDJ MECHANICAL P'ROPCERTIES
By
Robin L. Jones
March 1972
Prepared for
NJAVAL AIR SYSTEMS COMMANiD APPOVED FOR PUBLIC RELEaSE;
Contract No. IN00019-71-C0133
Th i~documentt .%s subject^ special/ ~ort cont 0s and eatr4ns'~i~t ta I o orey9ngeen or re ign at Apna Is
made y wtt nZaprova hte~'a-ir Sy Co nd.
TIRiN'E FRANtIUN INSTITUTE RESEARCH LADONATORIESSbIENJANIN FRANKLIN P40AKWAY *PHILACELPNIA. PStNNA 13103

pi F-C3013
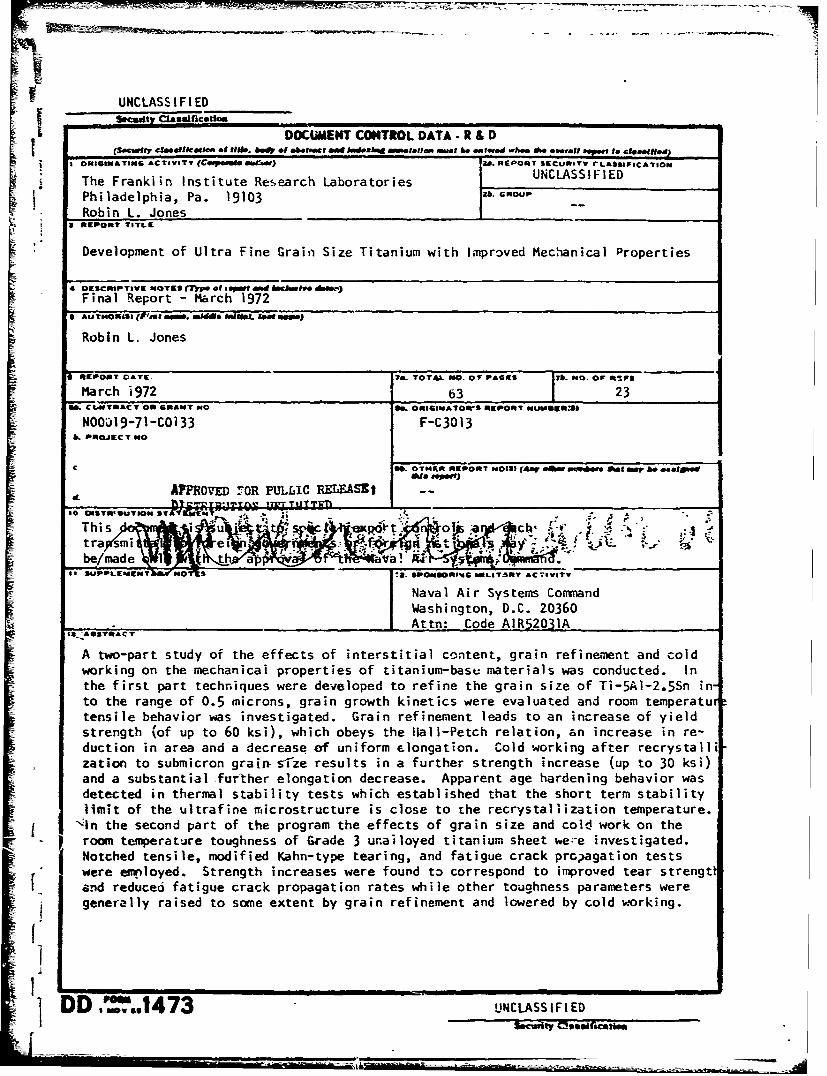
7'- ABSTRACTWC
A two-part study of the effects of interstitial content, grainj, refinement and cold working on the mechanical properties of titanium-base
materials was conducte'i. In the first part techniques were developed torefine the grain size of Ti-5Al-2.5Sn into the range of 0.5 microns, graingrowth kinetics were evaluated and room temperature tensile behavior wasinvestigated. Grain refinement leads to an increase of yield strength(of up to 60 ksi), which obeys the Hall-Petch relation, an increase in
* -reduction in area and a dezrease of uniform elongation. Cold workingafter recrystallization to submicron grain size results in a furtherstrength increase (up to 30 ksi) and a substantial further elonoationdecrease Apparent age hardening behavior was detected in therma± sta-bility tests which established that the short term stability limit of theultrafine microstructure is close to the recrystallization temperature.In the second part of the program the effects of grain size and cold workon the room temperature toughness of Grade 3 unalloyed titinium sheetwere investigated. Notched -ensile, modified Kahn-type tearing, and faLig,,pcrazk propagation tests were employed. Strength increases were found tocoirespond to improved tear strength and reduced fatigue cra~k propaga-tion rates while other toughness parameters were gc-erally raised to someextent by grain refinement aid lowered by cold working.
.A -
i R
I i
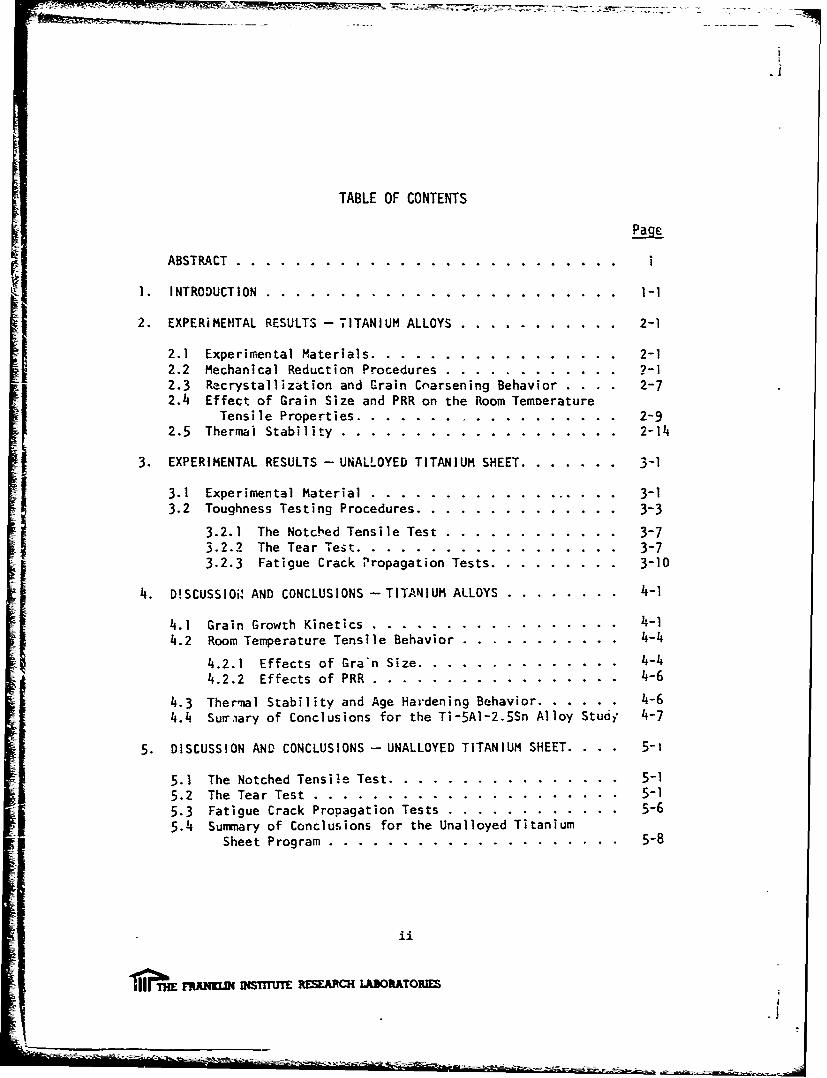
TABLE OF CONTENTS
Page
ABSTRACT ............. .......................... .
1. INTRODUCTION ............... ........................ . -
2. EXPERiMENTAL RESULTS - TITANIUM ALLOYS .............. .... 2-1
2.1 Experimental Materials ........ ................. 2-12.2 Mechanical Reduction Procedures ..... .. .......... 2-12.3 Recrystallization and Grain Coarsening Behavior . . .. 2-7
2.4 Effect of Grain Size and PRR on the Room TemoeratureTensile Properties ...... .................. ... 2-9
2.5 Thermal Stability ............. ................... 2-14
3. EXPERIMENTAL RESULTS - UNALLOYED TITANIUM SHEET ........... 3-1
3.1 Experimental Material ......................... 3-13.2 Toughness Testing Procedures ..... .............. ... 3-3
3.2.1 The Notched Tensile Test .... ............ ... 3-73.2.2 The Tear Test ...... .................. ... 3-73.2.3 Fatigue Crack Propagation Tests ........... .... 3-10
4. D!SCUSSIOi' AND CONCLUSIONS - TITANIUM ALLOYS ........... ... 4-1
4.1 Grain Growth Kinetics ........................... .... 4-14.2 Room Temperature Tensile Behavior .... ........... 4-4
4.2.1 Effects of Gran Size ..... .............. ... 4-44.2.2 Effects of PRR ...... ................. ... 4-6
4.3 Thermal Stability and Age Hardening Behavior ......... 4-64.4 Surr.ary of Conclusions for the Ti-5AI-2.5Sn Alloy Studi 4-7
5. DISCUSSION AND CONCLUSIONS - UNALLOYED TITANIUM SHEET. . . . 5-
5.1 The Notched Tensile Test ..... ................ ... 5-15.2 The Tear Test ............. ..................... 5-15.3 Fatigue Crack Propagation Tests .... ............ ... 5-65.4 Summary of Conclusions for the Unalloyed Titanium
Sheet Program ........... .................... 5-8
ii
N IlE Aiu nhmT arswAcH iA.DOwAOmi
.1
-- -~--.
UNCLASSIFIEDSj •~Smtt, C~1~aaficaitoe .
II S &C lit ci ssii ca iceD O C U M E N T C O N IT R O L D A T A . -I & D(SM ett comelfkallea of #086. b| of afaet onde mb uaot wsal h. .. Iemd nho , ... eman ". £i..eef
ORIGINATING ACTIVITr 20. REPORT S(CCU.IT. pt.*IuICAYION
The Franklin Institute Research Laboratories UCASFE
Philadelphia, Pa. 19103 3b. GROUP
• ~Robin L. Jones1
Development of Ultra Fine Grain Size Titanium with Improved Mechanical Properties
"4 DESCRIPTIVE NGOTES (T"W Of a 0 Sod b•CIhueI dhIc~J
Final Report - March 19722 AUTH4OMAS) (*'001 AN. =1ide NINMmIL SOW m.
Robin L. Jones
REPORT DATE. 74. TOT4L NO. Ol PAGES NO. OP RACs
March 1972 63 23GA. C.MTRACT TO GRANT NO 4L. ORIGINATOWS REPORT NUUSERSI:
NOal9-71-C0i33 F-C3013l6- PRli•IKc T noI
C 6. OTNftR REPORT MOtH) (Any odibr ueahboe "iet My 6e oaftIoned
ALa AiOV SyR PteLLIC RELEASKo
10O ISTWOUTbON 2~~~NDA~~
This t S 4-c. R,tra smi eM4r f 4 IL
be,/made t a ___________
SI SUPLEMNT N S!2. SPOheuOUI.G &NLITSMY ACTIVITY
Naval Air Systems CormmandWashington, D.C. 20360Attn: Code AIR52031A
1- ASSR"
A two-part study of the effects of interstitial content, grain refinement and coldworking on the mechanical properties of titanium-basu materials was conducted. Inthe first part techniques were developed to refine the grain size of Ti-5A]-2.5Sn in-to the range of 0.5 microns, grain growth kinetics were evaluated and room temperaturtensile behavior was investigated. Grain refinement leads to an increase of yieldstrength (of up to 60 ksi), which obeys the tlall-Petch relation, an increase in re-duction in area and a decrease of uniform elongation. Cold working after recrystallization to submicron grain-sfize results in a further strength increase (up to 30 ksi)and a substantial-further elongation decrease. Apparent age hardening behavior wasdetected in thermal stability tests which established that the short term stabilitylimit of the ultrafine microstructure is close to the recrystallization temperature.In the second part of the program the effects of grain size and cold work on theI room temperature toughness of Grade 3 unailoyed titanium sheet we:e investigated.Notched tensile, modified Kahn-type tearing, and fatigue crack prcpagation testswere employed. Strength increases were found to correspond to improved tear strengtland reduced fatigue crack propagation rates while other toughness parameters weregenerally raised to some extent by grain refinement and lowered by cold working.
DD s?.t473 UNCLASSIFIEDSauly €fkte
4..,-• . .• • • -.. . .i. . . •- . .

~~UNCLASSIFIED
KE OSCLONK A LINgK 0 LINK ciiKE somfot1
It .a O OL 7 iK W
seut =1aets
SIF -C3013Oh
TABLE OF CONTENTS (Cont.)
6. AREAS FOR FURTHER STUDY ...... ................... .... 6-16.1 Titanium Alloy Study .......... .................. 6-1
6.2 Unalloyed Titanium Sheet Study ....... ............. 6-1
7. ACKNOWLEDGEMENTS ......... ..... ...................... 7-1
"8. REFERENCES .B........ ......... ......... ........... ... 8-1
I
H Riii
"f1 AKID INTTT RESEARCH LAIORATOURh3
F-C3013
SgNLIST OF FIGURES
SFig. No. Page
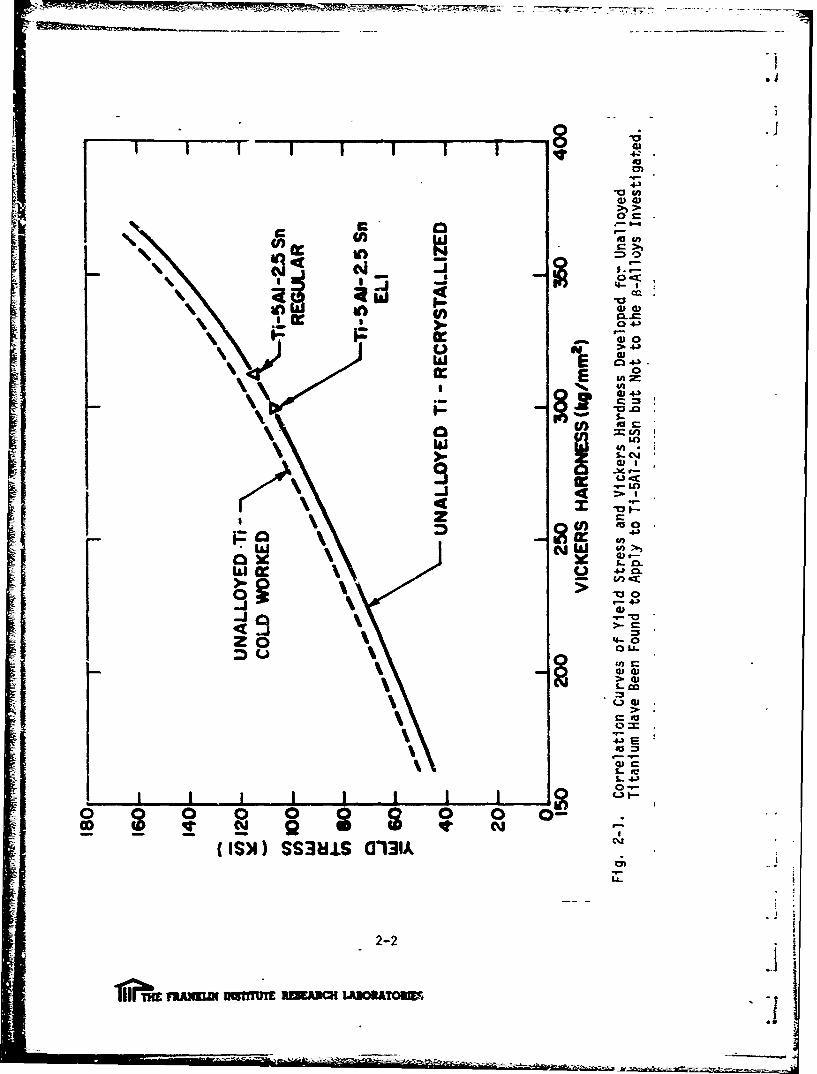
2-I Correlation Curves of Yield Stress and Vickers HardnessDeveloped for Unalloyed Titanium Have Been Found to Applyto Ti-5AI-2.5Sn but Not to the a-alloys Investigated. . . . 2-2
2-2 Variation in Vickers Hardness Produced oy Short and LongTerm Isothermal Annealing of Initially 90% Cold SwagedTi-5A1-2.5Sn Alloy Wires ...... .................. ... 2-B
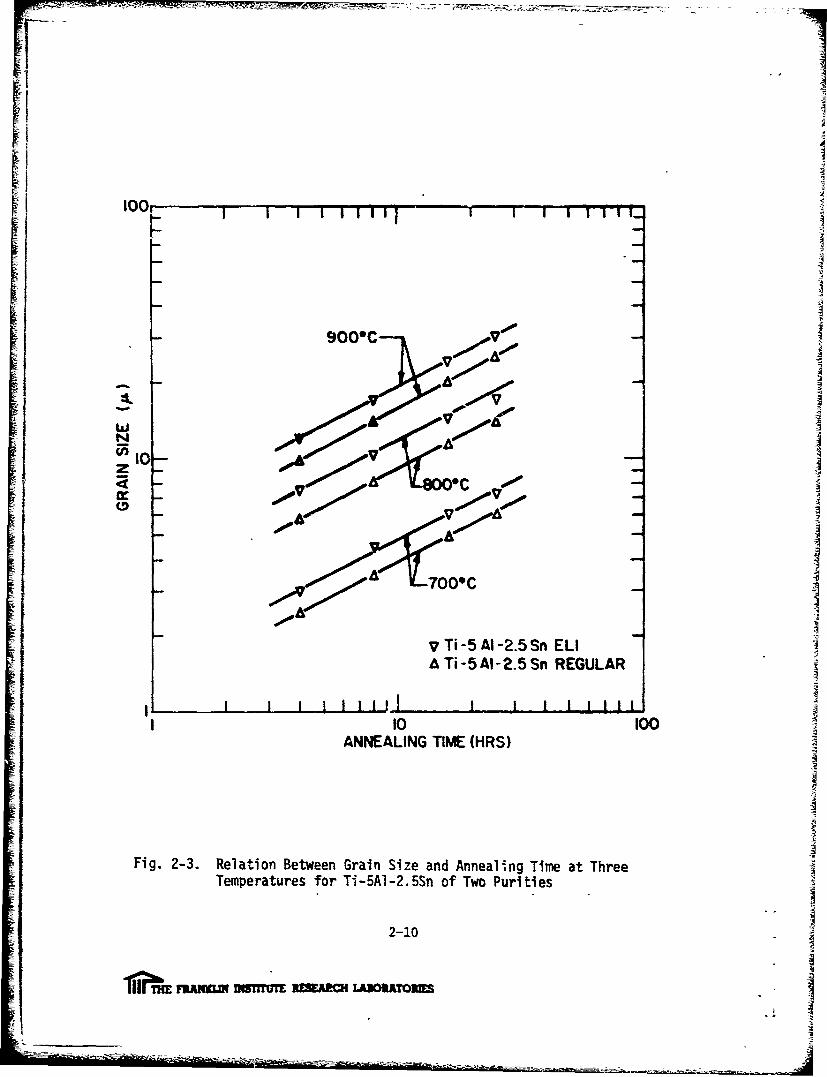
2-3 Relation Between Grain Size and Annealing Time at ThreeTemperatures for Ti-5A1-2.5Sn of Two Purities ......... .. 2-10
2-4 Relation Between the Square of the Grain Size and theAnnealing Time at Three Temperatures for Regular and ELIPurity Ti-5A1-2.5Sn ......... .................... .. 2-11
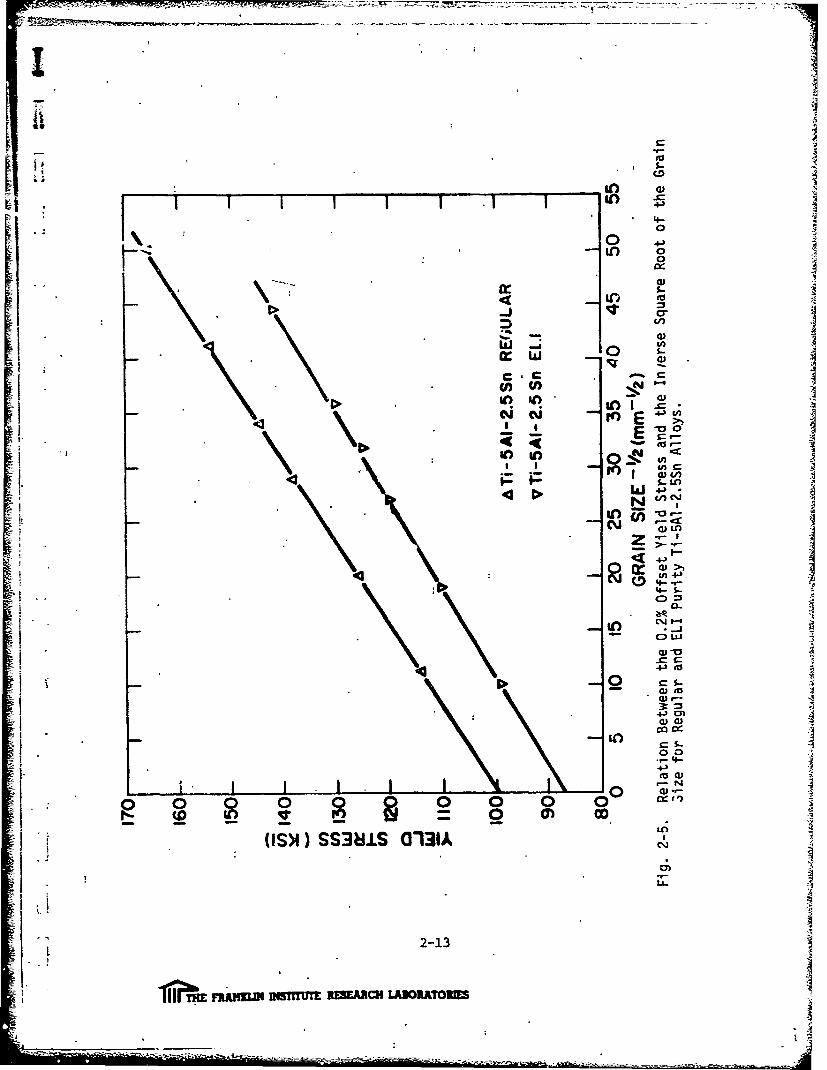
2-5 Relation Between the 0.2% Offset Yield Stress and theInverse Square Root of the Grain Size for Regular andELI Purity Ti-5AI-2.5Sn Alloys ..... ............... .. 2-13
3-1 SEM Fractograph of 5 Micron Grain Size Grade 3 Sheet,Broken by SCC in FeC1 3/Methanol and Used for Grain SizeDeterminations at Intermediate Grain Sizes ............. 3-2
3-2 Basal Textures for Grade 3 Sheet Samples ............. .. 3-4
3-3 Test Samples Used in Toughness Stufies .............. ... 3-8
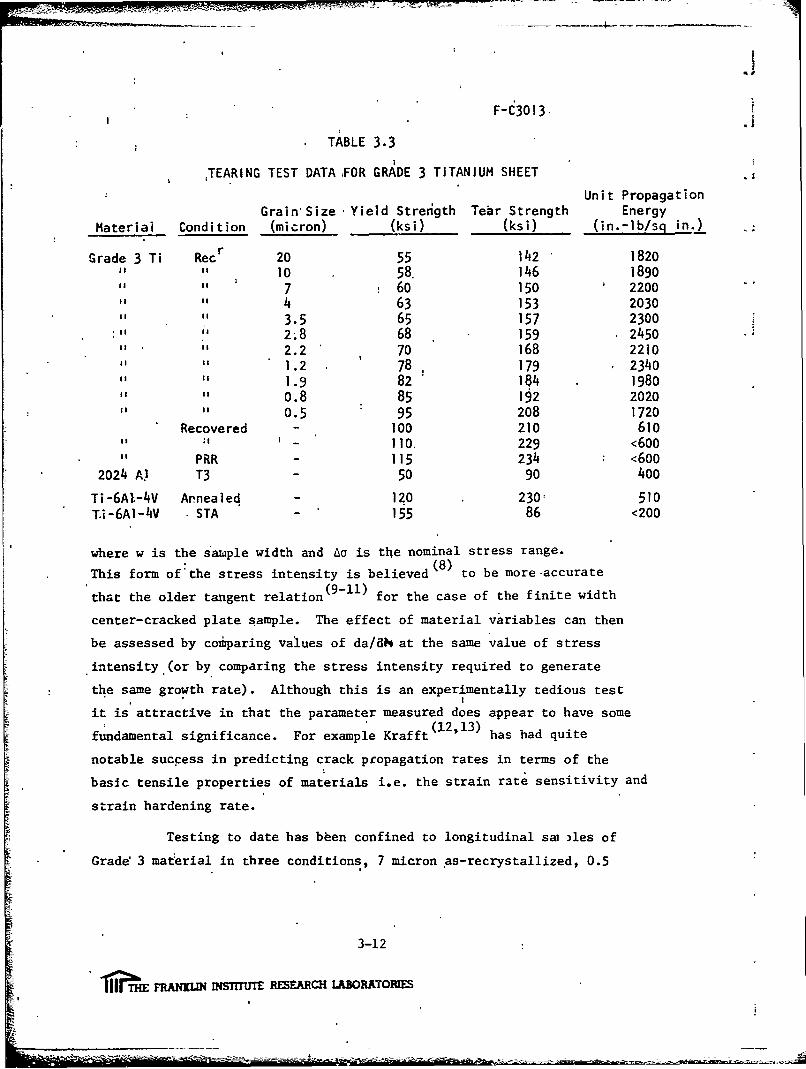
3-4 Variation of Tear Strength (Open Points, Solid Line) and UPE(Closed Points, Broken Line) with Yield Strength for 3Materials in Modified Kahn-Type Tearing Tests .... ....... 3-11
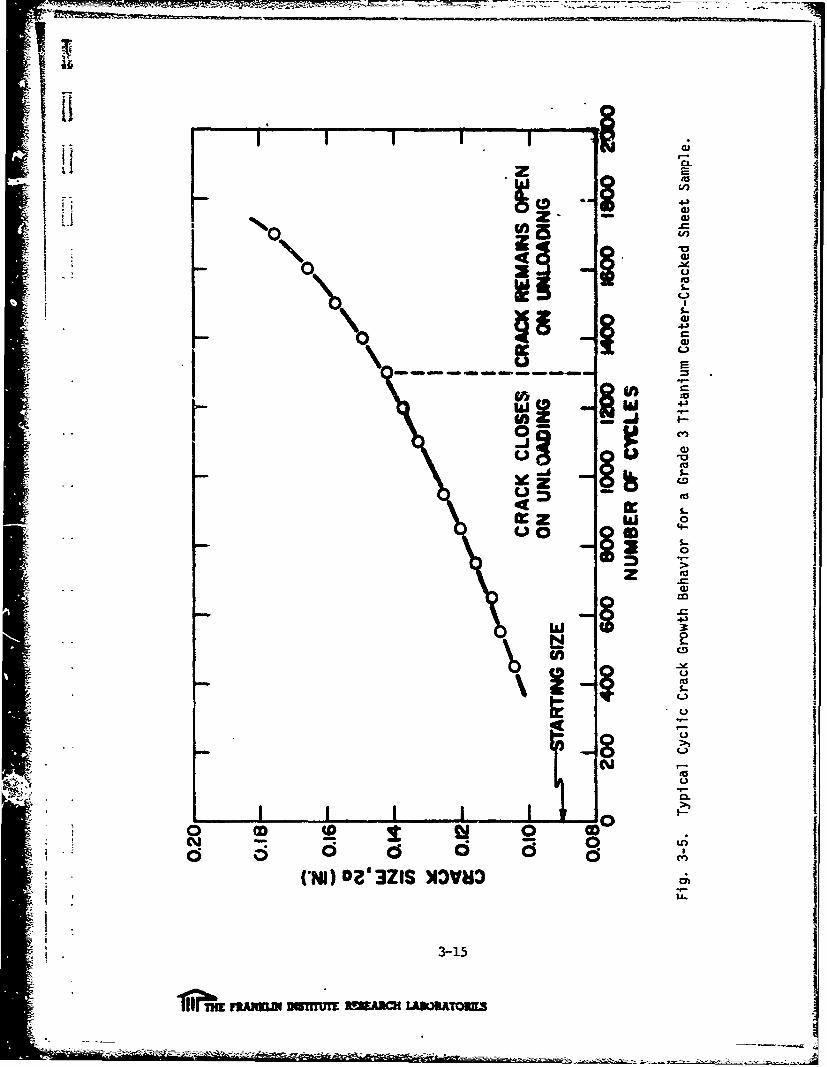
3-5 Typical Cyclic Crack Growth Behavior for a Grade 3 TitaniumCenter-Cracked Sheet Sample . ............... 3-15
4-1 Comparison of the Temperature Dependence of the GrainGrowth Rate of Ti-5AI-2.5Sn of Two Purities with theBehavior Observed in Previous Work (4,14) for UnalloyedTitanium ............ ... .......................... 4-2
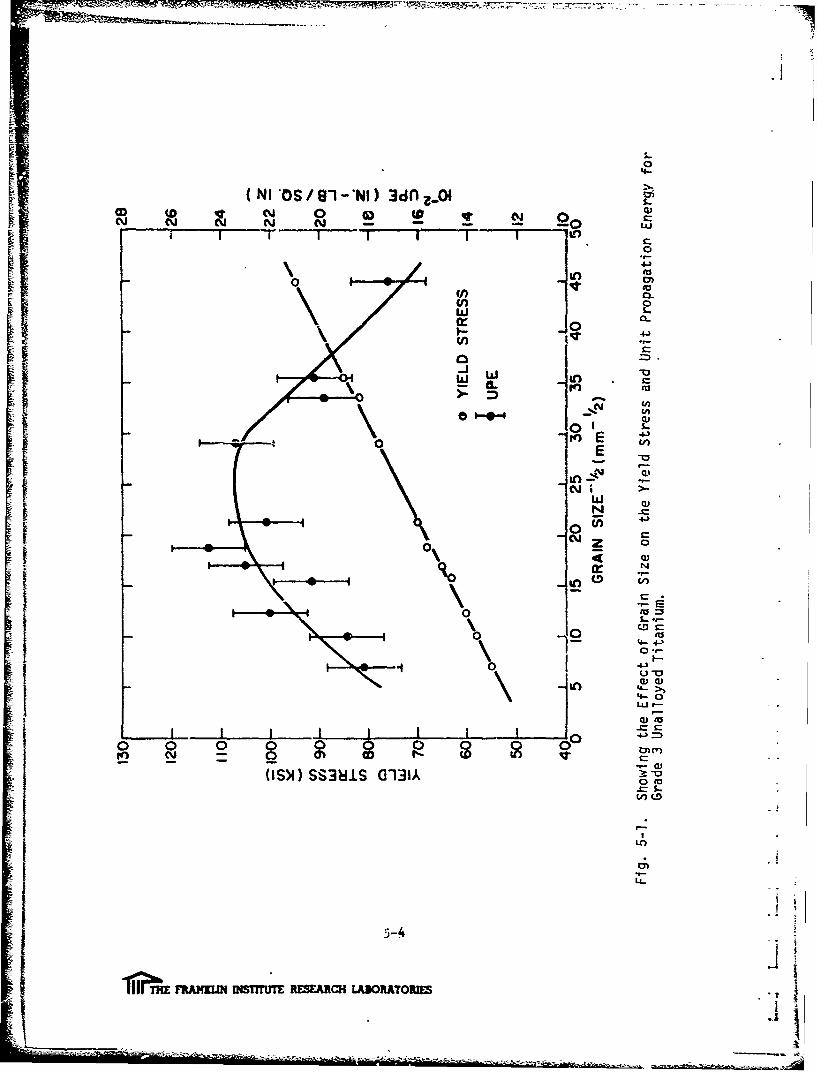
5-I Showii; the Effect of Grain Size on the Yield Stress andUnit Propagation Energy for Grade 3 Unalloyed Titanium. . . 5-4
iv
T10TbH.E FRANKIUN INSTMITTE RESEARCH LABORATORIES

' IF-C3013
-- LIST OF FIGURES (Cont.)
Fig -No.- Page
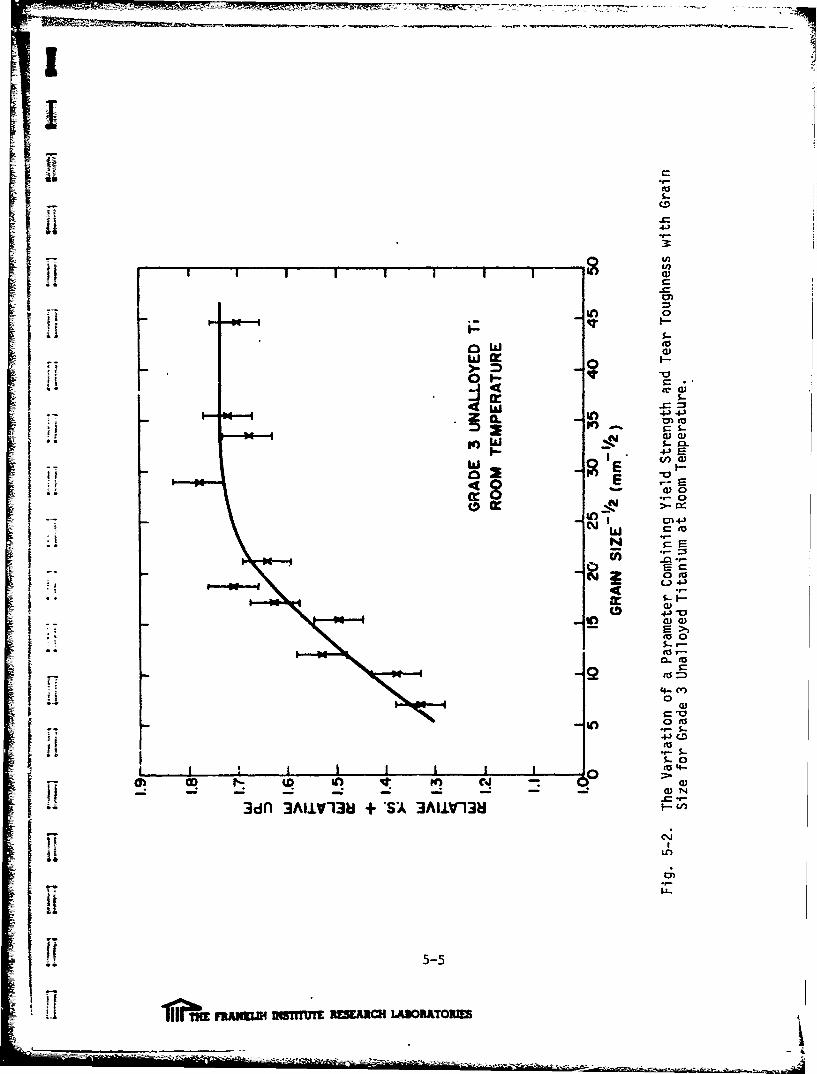
5-2 Tý- Variati'-i of a Parameter Combining Yield Strengthdn,' Tear Toughness wth Grain Size for Grade 3Uno-,ov-l Titanium at Room Ten.Derature ...... .......... 5-5
.- 3 V.," i of Fatigue r.rack Growth Rate with Stress,cy Range for tirade 3 Unalloyed Titanium In Three
C- C. . 'ions at Room Temperature .................. . -.. 5-7
v
I E FRANKLIS• MiSTT] RESEARC, LABORATOREES

- 7- - -
LIST OF TABLES
Table No. Title Page
2.1 Manufacturers Analyses tor the ExperimentalMaterials "................... .....2-3
2.2 As-Received Mechanical Properties of theExperimental Materials... . ..... ............ 2-4
2.3 Effect of Cold Reduction on the Hardness ofTi-5AI-2.5Sn of Two Purities ................. 2-4
2.4 The Effect of 90,% Cold Reduction on the Hardnessof Three 3-Titanium Alloys in the SolutionTreated Condition ...... ....... ........... 2-6
2.5 Root Temperature Tensile Data for Ti-5AI-2.5Sn
Alloy Wires .................. ... . ....... 2-14
2.6 Room Temperature Hardness Rpulting from 1 HourAnneals for Ti-5AI-2.5Sn Wires in the 40% PRRCondition ....... ...................... 2-14
2.7 Room Temperature Hardness Resultini from Iso-thermal Annealing at 500CC of 90% Cold SwagedELI Material...... ..... .................. .. 2-15
3.1 As-Received Analysis of Grade 3 Billet .......... 3-1
3.2 Tensile Data for Notched G-rade 3 Sheet Samples ... .3-8
3.3 Tearing Test Data for Grade 3 Titanium Sheet......3-11
3.4 Variation of Fatigue Crack Growth Rate withStress Intensity and Material Condition forGrade _ Titanium ....... ............... . 3-13
4.1 Values of the Activation Parameters for GrainCoarsening for Ti-5AI-2.5Sn and Unalloyed Titanium. .4-3
4.2 Hall-Petch Parameters for Unalloyed Titanium and Ti.5Ai-2.5Sn Alloys ...... .................. 4-4
5.1 Correlation of UPE with K for the ExnerimentalMaterials ....... ...................... .. 5-2
5.2 Correlation of Uniaxial Tensile Data and the UPE. . .5-6
vi
nufM lZ InSTI EESEA~Ci UMUT
- -|-- - ~ - i
F-C3013
Li
1. INTRODUCTION
In the course of two previous research programs supported by
Naval Air Systems Command (1,2) it was established that the room tempera-
ture strength of commercial purity unalloyed tita-ium wire and sheet couldbe raised by up to a factor of two without serious loss of ductility by
combining the effects of grain refinement and cold deformation. Duringhe scon proram(2)the second program it was demonstrated that inprovements in fatigue
behavior (particularly low cycle fatigue) and stress corrosion resistance
in FeCl 3 /methanol accompanied the strength increase. The thermal stability
of the fine grain size and cold worked microstructures was investigated
and it was shown that at room temperature the resistance of the strengthened
materials to stress raising notches remained high.
The initial major objective of the present program was to in-
vestigate the feasibility of applying thermomechanical processing pro-
cedures similar to tnose developed for the grain refinement of unalloyed
titanium to commercially available single phase titanium alloys in order
to determine whether or not similar improvements in mechanical properties
could be obtained in alloyed materials. A second major objective, in-
troduced by the sponsor during the program, was to investigate in detail
the effects of grain size refinement and cold deformation on the room
temperature toughness of unal'oyed titanium sheet produced by the methods
developed previously. In order to accommodate this second objective the
program plan was somewhat changed from that originally proposed. Studies
on alloyed materials were chiefly confined to the a-alloy Ti-5AI-2.5Sn
and only preparatory experiments were performed with single phase bcc
alloys. The experimental program thus consisted of two distinct parts,
which for the sake of clarity, are discussed separately throughout this
report.
1-I
1ii 11rj'gI INSTITUTE RES.RCH OA•RAORIFS•
F ' F-C3013
2. EXPERIMENTAL RESULTS - TITANIUM ALLOYS
t ~ 2.1 Experimental Materials
One a-alloy and three a-alloys were investigated during theSprogram. The a-alloy, Ti-5AI-2.SSn was obtained in two purities called
"regular grade and ELi (extra low interstitial) grade throughout the re-
S• port. All materials were obtained in the form of 1/4 inch drawn rod for
I •wire experiments and the two grades of a-alloy were also obtained in the
.. form of 1/2 inch plate for sheet studies. The ELI purity plate and the
a-alloy rods were kindly provided by NRL and Standard Pressed Steel res-
I -pectively. The other materials were obtained commercially. As-received
analyses and mechanical properties are tabulated in Tables 2A1 and 2.2.
All materials were received in the annealed or solution treated condition.
2.2 Mechanical Reduction Procedures
In the previous work on unalloyed titanium (1,2) it was found
t•,at the largest possible cold reduction before annealing was required
to obtain the finest recrystallized grain sizes. The initial step in
the alloy investigation was therefore aimed at assessing the cold re-
duction attainable by swaging and rolling which did not result in seriously
flawed raterial. The effect of tLhe cold reduction on mechanical pro-
perties was followed by Vickers hardness measurements. The correlation
curve for hardness and yield strength obtained previously for unalloyed
titanium is reproduced as Figure 2-1. Data for the a-alloys were found
to agree with this correlation while a-alloys were found to exhibit lower
hardness values for a given yield strength thw'n a-alloys or unalloyed
material. The effect of swaging reduction on hardness for Ti-5A1-2.SSn
of two purities is shown in Table 2.3. As observei for unalloyed material
the hardness rises continuously with reduction indicating the necessity
I for a large initial reduction if the finest grain sizes are to be obtained.
I 2-1
iIiME FRANLI BMTffUTE RESEARCH LABORA70REFS
4-:j
0)-4 -0U)
4A0
)P- '4J
woy
-> 4
E F'
C)) 4J
U)
U))-SW 4J
z 0-4-0
4, aI >. cu
ico
IL C3W
Q) a
L- 4.
0~ 0 0-
(IS)O) SSUIWS all).
2-2
=bFL~nM OW MREWAM LAUTO1
F-C3013
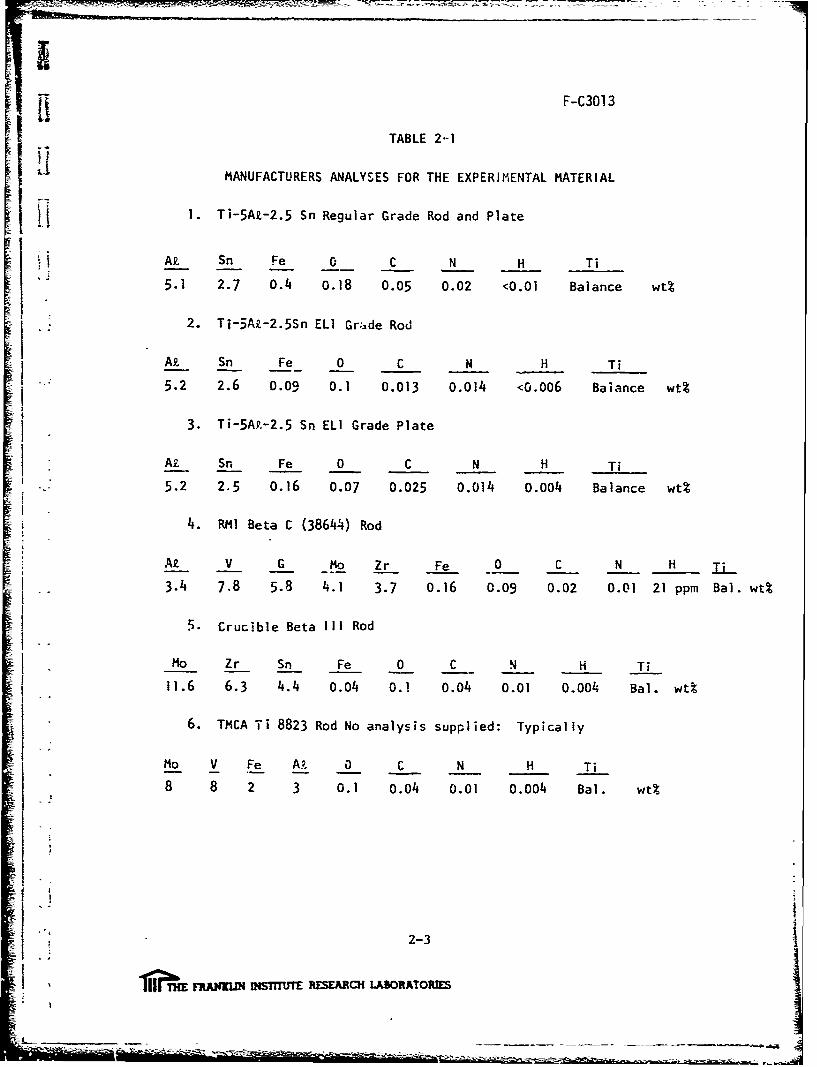
TABLE 2--1
A MANUFACTURERS ANALYSES FOR THE EXPERIMENTAL MATERIAL
~ j ~1. Ti-5AZ-2.5 Sn Regular Grade Rod and Plate
At Sn Fe 0C N H Ti
5.1 2.7 0.4 0.18 0.05 0.02 <0.01 Balance wt%
1 2. Ti-5AR-2.5Sn ELI Gr:,de Rod
At Sn Fe 0 C N H Ti
5.2 2.6 0.09 0.1 0.013 0.014 <0.006 Baiance wt%
3. Ti-5Ay,-2.5 Sn ELI Grade Plate
AZ Sn Fe 0 C N H Ti5.2 2.5 0.16 0.07 0.025 0.014 0.004 Balance wt;
4. RMI Beta C (38644) Rod
At V G - Mo Zr Fe 0 C N H TL. 3.4 7.8 5.8 4.1 3.7 0.16 0.09 0.02 0.01 21 ppm Bal. wt%
5. Crucible Beta III Rod
Mo Zr Sn Fe 0 C N H Ti, 11.6 6.3 4.4 0.04 O.1 0.04 0.01 0.004 Bal. wt%
6. TMCA Ti 8823 Rod No analysis supplied: Typically
Mo V Fe Ak 0 C N H Ti
8 8 2 3 0.1 0.04 0.01 0.004 Bal. wt%
1 2-3
i , jS t TtJmTE RESEARCH LAUORATORIES
AL - - - -- ~ - - -

F-C3013
TABLE 2-2
AS-RECEIVED MECHANICAL PROPERTIES OF THE EXPERIMENTAL MATERIALS
Material Form 0.2% Yield Tensile Elong. R.A.
ksi ksi %%
5-21 Regular Rod/Plate 116 123 12 28
5-24 ELI Rod 107 120 13.5 33
5-24 ELI Plate 114 124 19 41
RMI Beta C Rod 138 142 15 53
Crucible Beta III Rod 130 142 28 70
TMCA Ti 8823 Rod 133 137 22 69
TABLE 2.3
EFFECT OF COLD REDUCTION ON THE HARDNESS OF Ti-SAI-2.5 Sn OF TWO PURITES
Material Reduction % Vickers Hardness (kq/mm2)
Regular Grade 0 312
31 345
"61 353
" 73 374
"87 381
" 90 409
ELI Grade a 300""1 51 341
" 67 345
"79 350
"92 368
2-4
1II~iE nAmKIN qjSTffuTE R•FS•icH LA.ORATOU1_ I
7 -I
F-C3013
The rate of hardness increase is more rapid for the higher interstitial
content material. The a-alloy wires were found to be more difficult to
swage than unalloyed material. In order to produce consistently soundw°iires very careful lubrication (using paraffian wax as before) was
necessary and intermediate stress relief anneals were found to be advan-
tageous. The final swaging procedure which proved to be most successful
was as follows: cold swage to 50% reduction; stress relieve @ 400*C
1 hr; cold swage to overall 75% reduction; stress relieve @ 400*C 1 hr;
cold swage to final reduction. The stress relheving treatments were found
-tL have little or no effect on the observed hardness after swaging but
prevented premature failure.
The three B-alloys were all substantially more difficult to
cold swage than the a-alijys showing a marked tendency towards galling
to the swaging die, sometimes with quite spectacular pyrophoric results.
Sound material could only be obtained with the strictest attention to
lubrication and with slow feed rates into the swager. The same stress
relief procedures were employed as those detailed above and these allowed
reduction to 90% to be attained for all 3 alloys. The effect of swaging
on the Vickers hardness was somewhat curious; although the hardness in-
creased with reduction -s before the rate of increase was slow compared
with that obserjed for the a-alloys, particularly for the B-111 material.
Table 2.4 shows the initial and final hardnesses before and after 90%
cold reduction. On the basis of these data it appears that the strength
of 8-C in the solution treated condition might be increased by thermo-
mechanical processing by up to 70 ksi while the maximum increase for
the other two alloys is probably about 40 ,s•. In order to allow the
iuclusion in the program of the toughness studies discussed in Section 3,
work on the 8-alloys was terminated at this point. The questions left
unanswered are; what effect does grain refinement have on the ductility
and toughness of the 8-alloys; why does the relation between reduction
- and hardness differ so markedly from that of unalloyed material and the
a-alloys; why does 8-C differ from the other a-alloys (possibly a stress-
induced precipitation reaction or transformation); is the strengthening
2-5
T10jIM FM1 UtjpITuTJT_ RESEARCH LABORATORIES
F-C3013
contribution due to grain refinement in the solution annealed condition
maintained after aging and does a fine grain structure or heavily cold
worked substructure modify the ageing characteristics? It is hoped that
these questions can be investigated during future programs.
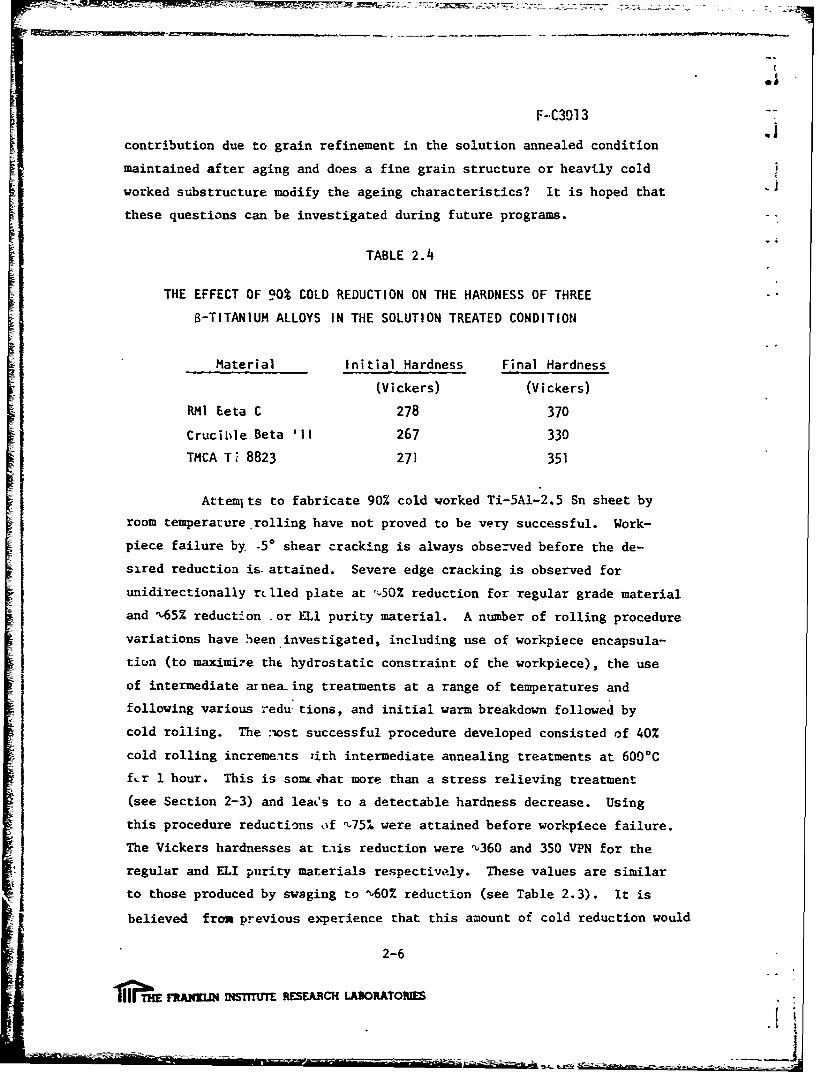
TABLE 2.4
THE EFFECT OF 90% COLD REDUCTION ON THE HARDNESS OF THREE
8-TITANIUM ALLOYS IN THE SOLUTION TREATED CONDITION
Material Initial Hardness Final Hardness
(Vickers) (Vickers)
RMl Eeta C 278 370
Crucible Beta '11 267 330
TMCA Ti 8823 271 351
AttemIts to fabricate 90% cold worked Ti-5A1-2.5 Sn sheet by
room temperature rolling have not proved to be very successful. Work-
piece failure by -5* shear cracking is always observed before the de-
sired reduction is. attained. Severe edge cracking is observed for
unidirectionally rclied plate at ".50% reduction for regular grade material
and '65% reduction or M1 purity material. A number of rolling procedure
variations have been investigated, including use of workpiece encapsula-
tion (to maximi-e the hydrostatic constraint of the workpiece), the use
of intermediate arnea, ing treatments at a range of temperatures and
following various redu-tions, and initial warm breakdown followed by
cold rolling. The :ost successful procedure developed consisted of 40%
cold rolling increme.nts rith intermediate annealing treatments at 600%C
f.r 1 hour. This is some ,hat more than a stress relieving treatment
(see Section 2-3) and leaes to a detectable hardness decrease. Using
this procedure reductions of 4751 were attained before workpiece failure.
The Vickers hardnesses at tais reduction were %360 and 350 VPN for the
regular and ELI purity materials respectively. These values are similar
to those produced by swaging to n,60% reduction (see Table 2.3). It is
believed from previous experience that this amount of cold reduction would
2-6
1olpM fANKI BMWISITU RESECH LADORATOPMES
.1 •
F-C3013BAallow a minimum grain size of % . micron to be attained using an optimum
heat treatment. It appears that to attain finer grain sizes than this
in alloy sheet materials a completely different approach may be needed.
Two alternative routes appear feasible in concept; powder metallurgicalfabrication using prealloyed powders, or grain refinement by dynamic re-
crystallization during working near the recrystallization temperature.
-Abrahamson( has obtained submicron grain sizes in lightly alloyed
titanium by the latter route. It is intended to pursue thesL possibili-
ties during the program presently beginning. No attempt has been made
to evaluate alloy sheet produced during the present program since wider
variations in the variables of interest were attainable in wire samples,(1,2)
and the results of the previous program indicate that sheet pro-
perties are likely to closely resemble those observed in wires.
2.3 Recrystallization and Grain Coarsening Behavior
The recrystallization and grain growth characteristics of
Ti-5A1-2.5Sn of two purities have been investigated for wire samples
initially cold swaged to 90% total reduction with intermediate stress
relief anneals. Figure 2-2 shows the variation in Vickers hardness pro-
duced by both short and long term isothermal anneals. The 20 second
annealing treatments were carried out by immersion in molten lead while
the 1 hour annealing treatments were performed in a resistance heated
vacuum furnace at a pressure of 'i10-6 torr. The surprising observation
is that both materials show hardness increases for I hour anneals at
temperatures near 500%C. This observation was subsequently investigated
further and is thought to be due to a previously unreported precipitation
reaction. The hardness increase is not apparent for short term anneals,
probably because the precipitation kinetics are too slow to allow signifi-
cant decomposition to occur in the time available. X-ray back reflection
indicated complete recrystallization in bcth materials annealed for 1
hour at 600%C. For 20 second anneals complete recrystallization was ob-
served at 7253C and 775*C for ELI and regular purity material respectively.
Grain sizes following these latter treatments were determined by thin
2-7
1ItE FRANrUIN STITUTEESEARCH LAWORATORIES

XI
140
0
0
c3A 0
__ 4.3
-00v(D)
D cZ <
-j 0 Z
N- Zz 0 4
0-
-J.1 C-4 -40
w~ oFr cr w w A14J
(,ww/ 64) SS3NOGiVH 8)1 L
2-8
1iE ?12bFlANEn= vnU5TJTE RESER3I LABORATORIES
-~~~~-- --------
I( F-C3013
foil transmission microscopy to be 0.5 microns and 0.4 microns for the
SELI and regular purity grades respectively. NG indications of the pre-
sence of second phase particles were observed in these thin foils.
I ~ The kinetics of grain growth for both regular and ELI purity
material were investigated by determining grain sizes as a function of
•I annealing time at 703°C, 800 0 C and 900 0 C. Anneals were performed in a
dynamic vacuum of ^10-6 torr and the grain size was equated with the
mean linear intercept throughout. Grain sizes below 5 microns were
determined by transmission microscopy. Larger grain sizes were measured
optically. Figuie 2-3 is a log-log plot of the grain size data obtained
as a function of annealing time which indicates a parabolic dependence
between grain size and annealing time. The grain size squared is accord-
ingly plotted against anealing time in Figure 2-4. Growth rates for
ELI are more rapid than :hose for regular purity material at all tempera-
tures in accordance with the effect of inrarstitials on grain growth rate
observed for unalloyed titanium(1, 2 , 4 ). A curious observation noted
during this study was tl-e appearance of surface cases up to 0.01 in. in
"thickness on samp~es anttealed at 900*C, which showed different etching
characteristics from those of the interior. Microhardness measurements
indicated that the cases were harder than the interiors of the samples
by up to a factor of 2 suggesting that interstitial (probably oxygen)
pickup from the dynamic vacumm had occurred. The curious aspect of the
observation was that .he grain size in the presumably high interstitial
c&se was larger than :hat in the sample interior by up to a factor of
about 2. It thus api ears possible that the retardation of grain growth
kinetics which we normally associate with increasing interstitial content
only occurs at the relatively low contents typical of commercial purity
materials. At higher contents interstitials may cause accelt.rated grain
growth. The grain sizes in the center of these samples are those plotted
in Figures 2-3 and 2-4.
2.4 Effect of Grain Size and PRR on the Room Temperature Tensile Properties
Recry-stallized wire samples with grain sizes in the range 0.4
microns to 10 microns were prepared for both ELI and regular purity
2-9
,ftE FRANKLIN INSTiUTE RESEARCH LAORATORIES
j -
looot-
U 10 - 000ý-Aa-Z -
-7009C
STi -5 Al1-2.5 Sn ELIA Ti -5 Al-2.5 Sn REGULAR
Ii 1 I I I I II 1 I I 1 1 1 1
10 100ANNEALING TIME (HRS)
Fig. 2-3. Relation Between Grain Size and Annealing Time at ThreeTemperatures for Ti-5A-2.Sn of Two Purities
2-10
T1,• nhNnm nvalm= MARCHu LADMITOMM
A

1000
90 i5I-. nELI 'Ti ri5A1.-.2
5 Sn REGULAR
800
700
NA
j50o
0'4009 000C
7'7O
I I0812
16 20 24 2J'ig.2-4.ANNEALING rIME~ (cCj2Fi 2 4. ReA t o Be e n the Square Of the Grain Size and theAnnealing Tim~ at Three Temperatures for Regular and ELI
ftanM REMCU WItaATORMS
material by %90% cold swaging (with intermediate stress relief annea]iL.&)
followed by isothermal annealing in the temperature range 700-800*C.
Grain sizes less than about 2 microns were produced by short anneals in
molten lead while longer anneals in the vacuum furnace were used fcr the
larger grain sizes. Chemical po]ishing was used to produce a 1/2 inch
long reduced gage section on the 0.078 inch diameter wires and then the
diameter of the entire sample was further reduced by chemical polishing
to facilitate testing. The final samples had '-0.06 in. diameter shoulders
and %0.05 in. diameter gage sections. Tensile tests were conducted at
room temperature at a nominal strain rate of 3 x 10 sec . Duplicate
tests were run for all grain sizes and tensile data averaged. While
yield strengths were found to be quite reproducible, flow properties,
particularly elongations, were not very consistent for fine grain size
samples. This appears to result from slight nonuniformities in the
gage diameter which are almost inevitably produced by the chemical
polishing procedure. Accordingly, additional samples with the finest
grain sizes were fabricated and tested so as to obtain reasonably accurate
estimates of the elongation and UTS. Table 2.5 contains the average
data obtained for 0.4 micron regular grade and 0.5 micron ELI grade
wires. Data for 10 micron ELI and 8 micron regular grade are included
for comparison. The table also contains data for 40% PRR samples dis-
cussed later. Figure 2-5 shows all the data for the 0.2% procf stress
for both materials plotted against the inverse square root of the grain
size.
Wire samples for PRR studies were initially swaged 84% (with
intermediate stress relief anneals) and heat treated for 0 .seconds at
725%C (ELI) and 775%C (Regular). The effect of additional swaging re-
duction was initially monitored by hardness measurements. As noted pre-
viously for unalloyed material, hardness increased quite rapidly with
reduction up to about 30-40% followed by a slow rise thereafter. 40%
reduction was therefore selected as the PRR reduction for tensile investiga-
tion and test samnles were fabricated for material in this condition and
tested in the manner described above, Ten samples were tested for each
material and the average tensile data obtained are recorded in Table 2.5.
STTO2-12
TII~E FRANKLIN ISTITUT RESEARCH LABORATCIUES
-om
I- 'C D
-7- 0 4J0 0~
(fU) U)
In in
4~d Lc)4
41
4 ~~g7n ~4J.4-.-
-- S.-
C) L
-4-x M"too• (IS l~l) S S3 1 1S O q •l,1
111
41,,-00
4-)
0 0 0 0 0 0 00
ij - ~ (S>) SM3I±S (131A -ý
?~IniFRW!imD INSTffURESUEARCH LABORATORIE
F-C3013
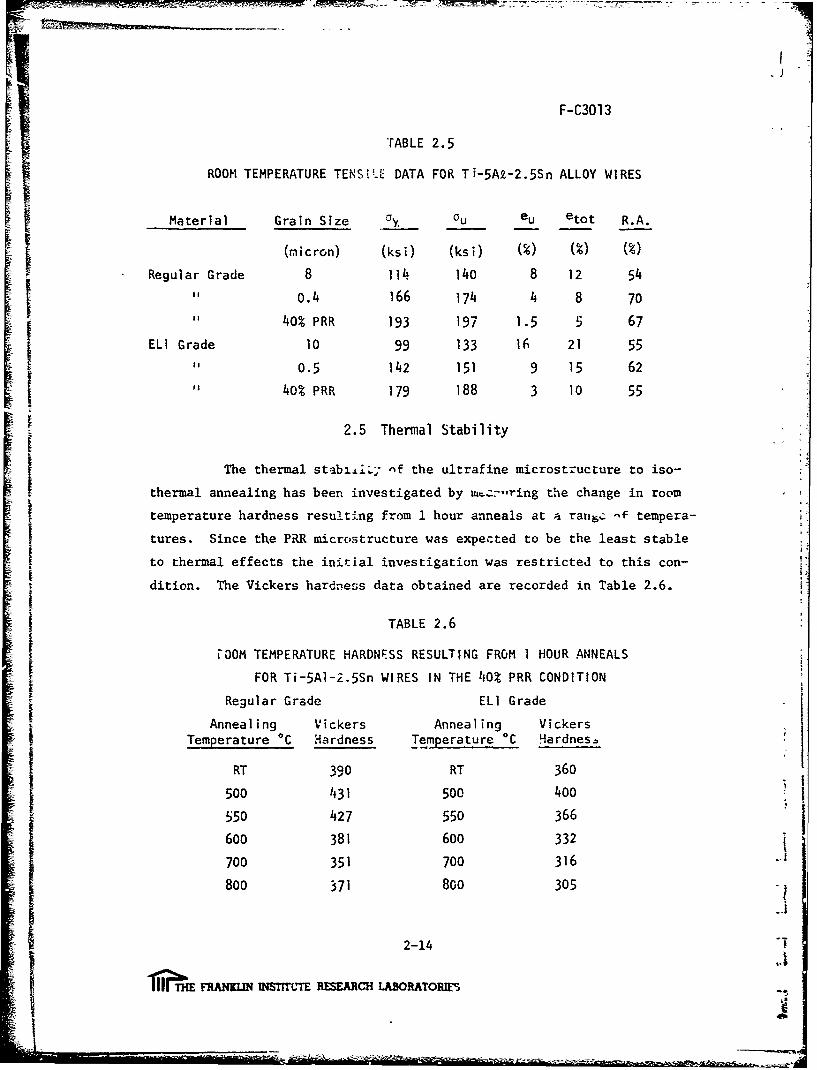
""rABLE 2.5
ROOM TEMPERATURE TENSILE DATA FOR Ti-5Ak-2.5Sn ALLOY WIRES
Material Grain Size Gý ou eu etot R.A.
(micron) (ksi) (ksi) (M) (%) (M)
Regular Grade 8 114 140 8 12 54
0.4 166 174 4 8 70
40% PRR 193 197 1.5 5 67
ELI Grade 10 99 133 16 21 55" 0.5 142 151 9 15 62
40% PRR 179 188 3 10 55
2.5 Thermal Stability
The thermal stabL±iL; nf the ultrafine microstructure to iso-
thermal annealing has been investigated by n-.-,,ring the change in room
temperature hardness resulting from I hour anneals at a ranic -f tempera-
tures. Since the PRR microstructure was expected to be the least stable
to thermal effects the initial investigation was restricted to this con-
dition. The Vickers hardness data obtained are recorded in Table 2.6.
TABLE 2.6
O00M TEMPERATURE HARDNESS RESULTING FROM 1 HOUR ANNEALS
FOR Ti-5AI-2.5Sn WIRES IN THE 40% PRR CONDITION
Regular Grade ELI Grade
Annealing Vickers Annealing VickersTemperature 0C Hardness Temperature *C Hardnes..
RT 390 RT 360
500 431 500 400
550 427 550 366
600 381 600 332
700 351 700 316
S800 371 800 305
I 2-14
iFRANKLIN USTITTE RESEARCH LAWOATORIES M -
I!AF-C3013
As noted in the recrystallization studies, a hardness increase
is observed on annealing at 500%C for both materials. At 600 0 C, therecrystallizatior. temperature determined in the recrystallization study
(Section 2.3), both materials show hardnesses below the initial "alueLi and further hardness decreases are observed at higher temperatures.
The hardness increase on annealing at 500*C was briefly investi-
gated further using 90% cold swaged ELl material. The effect of annealing
time at 500*C on the room temperature hardness was measured for this
material and the resulting data are reported in Table 2.7, and show a
hardness peak corresponding to an annealing time of 30 minute3.
1ABLE 2.7
ROOM TEMPERATURE HARDNESS RESULTING FROM ISOTHERMAL ANNEALING
AT 500 0C OF 90% COLD SWAGED ELI MATERIAL
Annealing Time Vickers Hardness
(Min.) (Kg/mm2)
15 375
30 400
60 382
120 370(
"i ii
2-15 1
"•--•- ~TII~ M F-•R-";T-nm ,v--'-•• --•, . • ..- iS-•n-U•- RESEARCH LABORATORIES..- . .. ..
F-C301 3
3. EXPERIMENTAL RESULTS - UNALLOYED TITANIUM SHEET
1. 3.1 Experimental Material
The material chosen for the sheet toughness study was that re-
ferred to previously as Grade 3(1,2). It conforms to ASIM Spec. #B265-58T
Grade 3 and the as-received analysis is given below.
TABLE 3.1
AS-RECEIVED ANALYSIS OF GRADE 3 BILLET
O(rpvm) C• N(n•). i(-l Hp Fr,(VIDmI
+'i'1200 200 50 < 10O0 I 00
Recrystallized sheet samples with grain sizes in the range 0.5 - 20 mic-
rons were produced by an initial cold reduction of 90%, without intermediate
annealing, followed by isothermal annealing in the range 550 0 C - 700*C.
Grain sizes less than about 2 microns were produced by shcrt annealing
" treatments in the molten lead bath while the longer anneals required for
coarser grain sizes were performed in a resistance heated vacuum anneal-
ing furnace. Test samples were prepared before annealing, and following
heat treatment were surface ground to a 600 grit final finish. The grind-
ing direction was parallel to the tensile axis of the sample which in,j
the present series of tests was parallel to the rolling direction. Grain
sizes were identified with mean linear intercepts measured by one of
three procedures. Fine grain sizes (< 1 microns) were measured by trans-
mission electron microscopy of thin foils. Coarse grain sizes (> 5 microns)
were determined by optical microscopy while for intermediate grain sizes
a novel technique was developed. This consisted of fracturing a sample
- by 3 point loading in 0.lN FeCl 3 /methanol and examiniag the fracture
surface by SEM. Since the stress corrosion cracking is entirely inter-
ij granular in nature this is a convenient method of revealing both the
grain shape and size. A typical fractograph is shown in Figure 3-1.
"3-1
Tjj.,b E FpJNKM VtS q R• EP.pJ"H LIBORTORIES

Fig. 3-1. SEM Fractograph of 5 Micron Grain Size Grade 3 Sheet,Broken by SCC in FeC13/Methanol and Used for Grain Size
Determinat-ions at Intermediate Grain Sizes.
I1Il
3-2I_]
F-C3013
-i Yield strengths weze monitored using room temperature hardness measure-i °ments in conjunction with the hardness/yield strength relation developed
P ~(1,2)previously'2). The fabrication procedure resulted in very similar
crystallographic textures for all recrystallized samples. A typical ex-
ample of a basal texture is shown as Figure 3-2a.
In order to obtain worked sheet with the same thickness as the
recrystallized sheet (n 1/16 in.) a slightly different fabrication pro-I (2)cedure was used from that employed previously2. Grade 3 plate was cold
worked "t 75%, recrystallized to a grain size of " 1 micron, then subjected
to a 50% post recrystallization reduction (PRR) so as to obtain 1/16 in.
thick sheet. The rolling direction for PRR was parallel to the rolling
direction for the pre-recrystallization cold reduction and this led to
"the development of a very similar crystallographic texture to that of
"the rolled and recrystallized material (Fig. 3-2b). Two recovery treat-
ments were used to provide samples with lower levels of stored energy,
namely 20 sec @ 500*C; 5 min @ 500*C. Yield strengths for samples in
the three worked conditions were determined by tensile testing at room
temperature. Values obtained were 100 ksi, 110 ksi and 115 ksi for the5 mn @ 500'C, 20 sec @ 5000 C and as-worked conditions respectively with
the tensile axis parallel to the rolling direction. The value for the
as-worked samples is about 10 ksi less than that reported previously( 2 )
probably reflecting the somewhat larger intermediate grain size obtained
by the present fabrication procedure. (The previous fabý.ication pro-
cedur_ was cold work 90%, recrystallize to 0.5 microns + 50% PRR. It
was not possible to duplicate this in the present instance because of
the desire to obtain a final sheet thickness of 1/16 in.)
"3.2 Toughness Testing Procedures
It is important to know whether or not the increases in strengtn
which accompany grain refinement and cold wcrk in a-titanium are accom-
panied by changes in the toughness of the mazerial. The most general
definition of toughness is the energy required to break a material and
thus in the simplest case the 'rea under the tensile stress-strain curve
3-3
1 V1IAIjUnW DaTff UT 3REbMCH LAJORATOUIM

(a) 0.5 Micron Recrystallized Sheet
PRO
b) 5%P.. She
Fi. -. aslTetue frGrde3ShetSmpe
3-
FRAIMM(I.&IRVIM AWT
F-C2013
gives a measure of the toughness. However, in many materials the pre-
sence of a crack causes a low-stress failure. That is to say, the failure
stress is reduced to a greater extent than wculd be predicted by simply
considering the reduction of cross-sectional area due to the cracks.
In such a material a more meaningful definition of toughness is the re-
sistance of the material to crack propagation since this determines the
strength that the material will exhibit in the presence of a crack.
This definition is the basis of the approach known as fracture toughness.
V IThe extensive analytical and experimental work in this area since the
late 1 9 5 0 's has lead to the emergence of a parameter, Klc, which is con-
SI sidered to be a true material constant expressing the resistance of a
material to crack propagation. KIc, the plane-strain fracture toughness,
is defined as the critical value of the stress intensity factor KI at
I• the point of instability of crack extension. The subscript I refers to
-. the opening (plane strain) mode of crack extension.
Kkc is of particular importance because it represents a practicalit lower limit to the fracture toughness of a material under given conditions.
SIn the present tnstance it is impossible to directly measure the variationof KIc with the paiameters cf interest (grain size and cold work) and
( j further, it may be argued that the plane strain fracture toughness of
the present materials is of no direct significance, since they will
never fail in the crack opening mode. To see this let us consider the
requirements for obtaining predominantly plane-strain failure.
The concept of Kl due to Irwin et al entails two indepen-
dent size effects associated with the two theoretically essential condl-
tions of linear elastic behavior of the material over a field which is
large compared with the plastic enclave that surrounds the crack front,
and tritensile plane strain constraint within this enclave and somewhat
beyond it. Any useful Klc test method must provide for these basic limita-
tions by restriction of the valid range of a test to that for which the
plastic enclave size is within some specified fraction of the most critical
dimension of the specimen. In ASTM Method E 399-70T for example the
Splastic enclave factor R, defined as
TIii ib FRANKLIN USTMJTE RESEAROC LA•O•UTOMI

F- C3013
R = -- IJ w.here a is the 0.2% proof stress (3-1)y
is restricted to the smaller of 0.4 a or 0.4B where a is the initial0 0
crack size and B is the specimen thickness. In the present case B % 0.06 in.,
hence the maximum value of Klc which can be determined for the present
material (at a yield stress level of 100 ksi) is n- 15.5 ksi /1 For
commercial purity titanium of conventional grain size a typical value of
Kc is > 80 ksi /i.. Thus unless a truly catastrophic reduction in K k
"accompanies grain refinement or cold work (which is extremely unlikely)
it is impossible to measure values for K for the present sheet materials.
Furthermore the fabrication techniques used to prepare these sheet materials
cannot be utilized at much larger thicknesses (for instance, the flash
heat treatments necessary for obtaining the finest grain sizes are im-
practical at thicknesses greater than about 0.2 in. because of thermal
conductivity limitations) so that plane strain failures cannot be expected
to occur in service.
From this discussion it is evident that we must measure toughnessparameters other than K if we wish to characterize the effects of grain
Icsize and cold work on the toughness of unalloyed titanium sheet. Since
no other toughness parameters have the material constant characteristic
of K it seems most appropriate to investigate the effects of the materialIc
variables on a range of toughness parameters corresponding to various
situations which the materials might encounter in service. Three dis-
tinct types of test have been employed and are discussed below.
3.2.1 The Notched Tensile Test
This test, which explores the notch resistance of the material
under simple uniaxial tensile loading was used during the previous pro-
gram (2). The tensile properties are measured for symmetrical edge-notched
sheet samples as a function of the stress concentration factor of the
notch kt defined as
3-6
Tli7ME FANMNfI 26YMTITE RESEARCH LADORATOI!E S
7 1
F-C3013
k 1 + 2 7a-/r (3-2)L
where a is the half length of the notch and r is tihe root radiusTwo parameters of interest can be deduced from this test. The Potch
strength ratio (NSR) defined as notched UTS/unnotched UTS is a measure
of the notch sensitivity of the material. Since this parameter does not
depend in any way on the absolute stress level its most obvious utility
as a toughness indicator occurs when comparing materials of equal or
similar strengths. A second parameter which can be deduced from the test
which we shall call the unit fracture energy (UFE) is defined as the
area under the load-elongation curve divided by the cross section of the
sample at the location of the notch. This parameter contains the stress
and hence can be used to compare the toughnesses of materials of different
strengths in the presence of a notch of constant stress concentration.
"The parameter must be used with care since it is expecteC to be sensitive
to specimen geometry and size but with this provision it should be a valid
indicator of the effect of material variables of the type of interest
here.
No i.ew experiments have been performed during this contract.
However, the data obtained previously for Grade 3 sheet in three thermo-
mechanical conditions tested longitudinally are reproduced in Table 3.2.
Values of UFE for the most severely notched samples have been obtained by
measuring the load-elongation areas with a planimeter and are included
in the table.
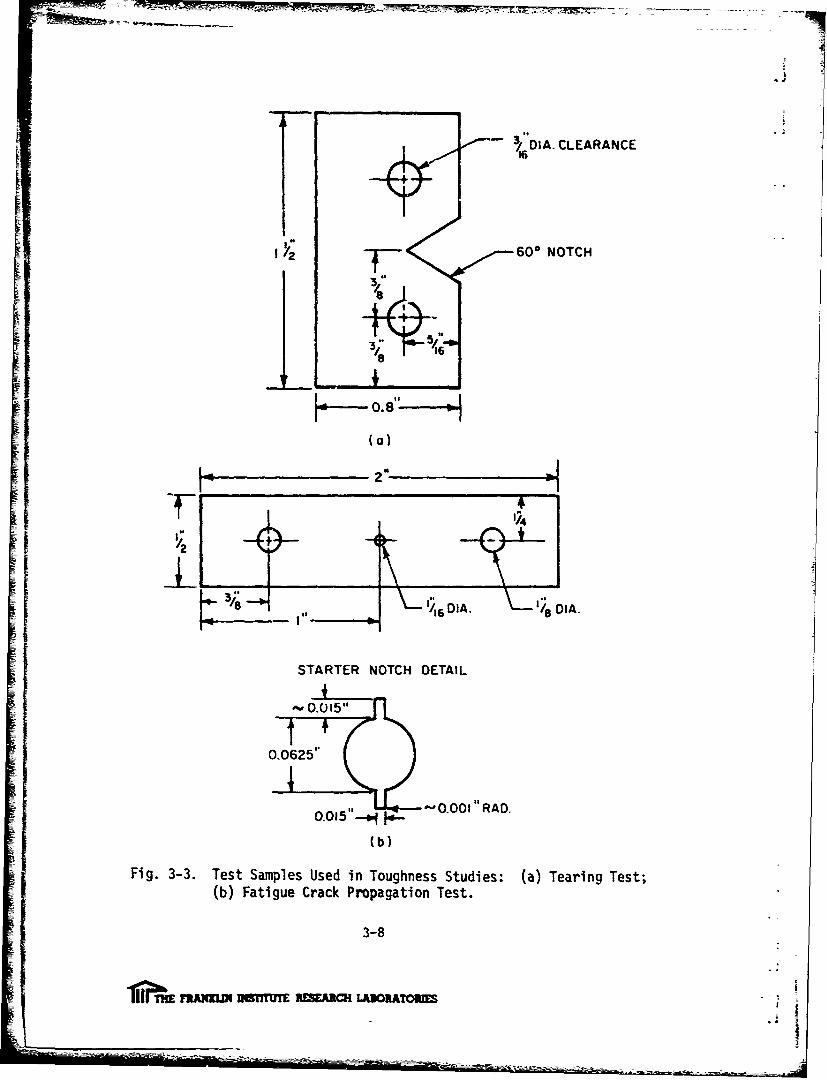
3.2.2 The Tear Test
jThis test, which is based on the approach to Kahn and Imbembo( 6 )
is used to investigate the propagation of a notch under the combined effects
f of tensile and bending stresses. The sample used, shown in Figure 3-3a,
[J Iis a single edge notched sample which is pin loaded in tension. The notch
root lies on the line joining the axes of the loading pins so that at a
1 3-7
1n ?tE FRNU INSDTTJE RESEARCLAO RAORE
,6- DIA. CLEARANCE
172 600 NOTCH
I"
H-0.8-(a)
n 4
DIA ,"-- DO .IA.
STARTER NOTCH DETAIL4
0.0625'*
0.0,Q5"1** __ 0.00 1 "ORAD.
(b)
Fig. 3-3. Test Samples Used in Toughness Studies: (a) Tearing Test;(b) Fatigue Crack Propagation Test.
3-8
f1Iibnb FWANIIV DESTITUTE 3MA3 LMROATOMM

TABLE 3.2
TENSILE DATA FOR NOTCHED GRADE 3 SHEET SAMPLES"
Grain Size Yield St-ess Ultimate Stress NSR UFE(microns) Condition kt (ksi) (ksi) (in.-lb/sq. in.)
r5.0 As rec 1 62 81 1 -
5.0 2.4 64 85 1.05 -
5.0 3.0 61 78 0.96 -
5.0 " 3.8 " 75 94 1.16 -
5.0 5.4 170 172 2.12 1 00
0.5 As rec 1 96 118 1 -
0.5 " 3.0 157 i118 1 -
0.5 " 3.8 128 137 1.16
0.5 " 5.4 125 129 1.09 1400
0.5 50% PRR 1 125 138 1 -
"0.5 " 2.4 130 143 1.040.5 3.0 132 139 1.01
0.5 3.8 125 133 0.96 -
0.5 5.4 193 195 1.41 500
"load P the notch root experiences a tensile stress of P/A and a bending
stress of 3P/A where A is the cross section at the notch(7). The notch
, propagates when the combined stress exceeds the tear strength of the
material, i.e.
•uP 3P _4P(3
Tear strength = - + L- P- (3)p.A A A
For a notch insensitive material the tear strength is expected to be re-
lated to the uniaxial tensile strength while notch sensitive materials
should show lower tear strengths. The area under the propagation part
of the load-elongation curve defines the tear propagation energy and the
unit propagation energy (UPE) is defined as the tear propagation energy
, xO-4 -4Tests at room temperature at a nominal strain rate of 3x10 sec
S R3-9
TkPTH- FRNKIN24M RESEARCH LABORATORIES
F-C3013
divided by the sample cross section. Both the tear strength and the(7)UPE are expected to be dependent on sample size7. The sample and pro-
cedures adopted here are similar to those employed by Kaufman and
Hunsicker (7) for toughness screening and alloy development of aluminum
alloys except that the sample size was decreased to allow the use of
existing Grade 3 sheet material.
Grade 3 sheet samples with a range of grain sizes were tested
at room temperature at a nominal strain rate of 1.1 x 10 sec . Iden-
tical samples of 2024 aluminum alloy in the T3 condition and Ti-6A1-4V
in the annealed and STA conditions were tested for compa-ison. The data
obtained are tabulated in Table 3.3. figure 3-4 shows the variation of
tear strength and UPE with yield strength.
For most of the samples tes-ed the root radius of the machined
notch was reduced to ^ 0.0005 in. by drawing a razor blade across thenotch root. Grade 3 titanium samples in both the recrystallized (5 micron
and 0.5 micron) and 50% PRR condition were also tested with as-machiaed
notches (^ 0.005 in. radius). The results obtained were identical to
those observed for samples with the smaller notch radius. The two strongest
Grade 3 samples and the Ti-6A1--4V STA material all showed rapid tear
propagation. For these samples the UPE was estimated as beirg less tran
the elastic energy stored in the test rig which we obtained from the area
of the loading curve.
3.2.3 Fatigue Crack Propagation Tests
This test is used to explore the resistance of a material to
crack propagation under cyclic loading and consists of measuring the
overall crack length 2a as a function of the number of fatigue cycles N.
Values of 2a and N are used to obtain values of the crack propagation
rate da/dn at specified values of a, which are used to calculate corres-
ponding values of the stress intensity range .'K, defined as
A K = 1.77Aa 1 - 0.1 -1+ I.--, a (3-4)
3-10
FRA 1 2-TTTE RESEARCH LABORATORIES .
- b- - = - -t ---H---

CNI S/-N)A9N13N3 NOliV9VdO?~d .IlNn
- -of0 0 I:N No
w 0J
00
0 0 (O0 0 Im0
0 w
>_ 0 00 2z -0C
N U)
F-C3013.
TABLE 3.3
TEARING TEST DATA ,FOR GRADE 3 TITANIUM SHEET
Unit PropagationGrain-Size Yield Strength Tear Strength Energy
Material Condition (micron) (ksi) (ksi) (in.-lb/sq in.)_
Grade 3 Ti Rec r 20 55 142 1820"I 10 58, 146 1890"11 " 7 60 150 2200If I 4 63 153 2030"" It 3.5 65 157 2300" 2.8 68 159 2450" m 2.2 70 168 2210
" " 1.2 78 , 179 2340"I 1.9 82 184 1980"am Is 0.8 85 192 2020""a 0.5 95 208 1720
Recovered - 100 210 610,, : i- 110. 229 <600" PRR - 115 234 <600
2024 A) T3 - 50 90 400
Ti-6AW-4V Annealed - 120 2301 510T1i-6A-4V STA - 155 86 <200
where w is the saiample width and Ao is the nominal stress range.
This form of:the stress intensity is believed (8) to be more accurate
that the older tangent relation(9- 1 1 ) for the case of the finite width
center-cracked plate sample. The effect of material variables can then
be assessed by coihparing values of da/dh at the same value of stress
intensity (or by comparing the stress intensity required to generate
the same growth rate). Although this is an experimentally tedious test
it is attractive in that the parameter measured does appear to have some(12,13)
fundamental significance. For example Krafft has had quite
notable success in predicting crack propagation rates in terms of the
basic tensile properties of materials i.e. the strain rate sensitivity and
strain hardening rate.
Testing to date has been confined to longitudinal sai les of
Grade'3 material in three conditions, 7 micron as-recrystallized, 0.5
3-12
TlimE FRAl UM RTl• im RESEARCH IBATOCES
I F-C3013
micron as-recrystallized and 5C% PRR as-worked. The sample used, which
is shown in Figure 3-3b, is a 1/2 inch wide, 1/16 inch thick sheet sample
with a 3/4 inch gage length loaded with pin and wedge grips. The load
- cycle is a saw-tooth, tension-zero, and the cycle rate is n- 10/minute.
For a tension-zero fatgue cycle the strain intensity range AK is equal
to the stress intensity at the maximum applied stress oax. In the center
I• of the gage is a 1/16 diameter hole. To ensure rapid crack initiation
a 0.01 in. wide jeweler's saw is used to extend the circular hole 10-15
mils ir both directions perpendicular to the tensile axis. Based on
the minimum radius of curvature of the saw cuts, the keyhole notch rep-I resents a stress concentrator of a factor of 'i5.
SCrack size measurements are started at a crack iength of 0.1
inches anJ continued up to the calculated crack size at which the stress
on the remaining section e:zceeds the yield stress. Fracture is found to
follow this point within 100 additional cycles. The crack size is measuredunder 3oad, using a traveling microscope, to an accuracy of about + .0005
"in. Best resolution of the crack was found to be provided by using very
oblique, diffuse (neon) illumination. A double cantilever displacement
gage, .;imilar in type to those commonly used in fracture toughness test-
ing has been designed and constructed. This gage clips into the central
1/16 in. diameter hole and would be used to determine the crack size by
calibrating the crack size against the displacement produced by a
constant applied load. The problem is to design a measurement procedure
which will allow a single calibration curve to be used for samples of
different yield strengths undergoing varied loading cycles. Although
such a procedure has now been designed in concept, extensive experimeatal
ch'cks will be required before it can be applied with confidence, so for
the present the direct optical measurement of Lrack size is preferred.
1 Since crack size is measured at the surface it is important to have some
knowledge of the shape of the crack front. This can be obtained from
I! e~ther a scanning electron fractography study of the shape of the fatigue
striations or by heat tinting partially cracked sa:aples, followed by
SitDfracture and examination. Both techniques will likely be used in the
future.
3-13
T.1?jTrajE RNEM UISTffTE VZSEARCH LABORATOBRhS

F-C3013
Tests have been performed for each of the three material conditions
at several stresses in the range 30-60 ksi so as to extend the obtainable
stress intensity range and permit comparison of behavior at constant
stTess intensity. A typical growth curve is 3hown in Figure 3-5. Most
of the data will be reduced digitally, using a curve-fit program to
compute values of da/dN at specified values of a. The program which
will also compute values of AK is written but not yet debugged. Pre-
liminary data obtained graphically are tabulated in Table 3.4. *The
samples were all tested at a nominal maximum applied stress of 40 ksi
-and the fatigue lifetimes were 2102, 3554 and 4546 cycles for the 7
micron, 0.5 micron and PRR samples respectively.
TABLE 3.4
VARIATION OF FATIGUE CRACK GROWTH RATE WITH STRESS
INTENSITY AND MATERIAL CONDITION FOR GRADE 3 TITANIUM
Grain Yield Crack Growth Rate (micro inches/cycle)Condition Size Strength at Stres Intensities of
16.1 17.9 19.6 21.4
(microns) (ksi) (ksi =Tin)(ksi 'nin.)(ksi Vin--)(ksi /FJ)crAs Rec 7 60 17 22 31 44
AS Recr 0.5 95 12 18 23 27
PRR - 115 11 15 20 25
3-14
rIIITbHE FWINKUN InSTIuTE RESEARCH LABORATORIES
w Q AU
0 CV)
Z 03
S-,03
o 4U)
>1~
C.)
0 ~0
0j 0 s d
3-15
-i~kb nuimM UUMM NEAM A*uOM
F-C3013ii'
4. DISCUSSION AND CONCLUSIONS - TITANIUM ALLOYS
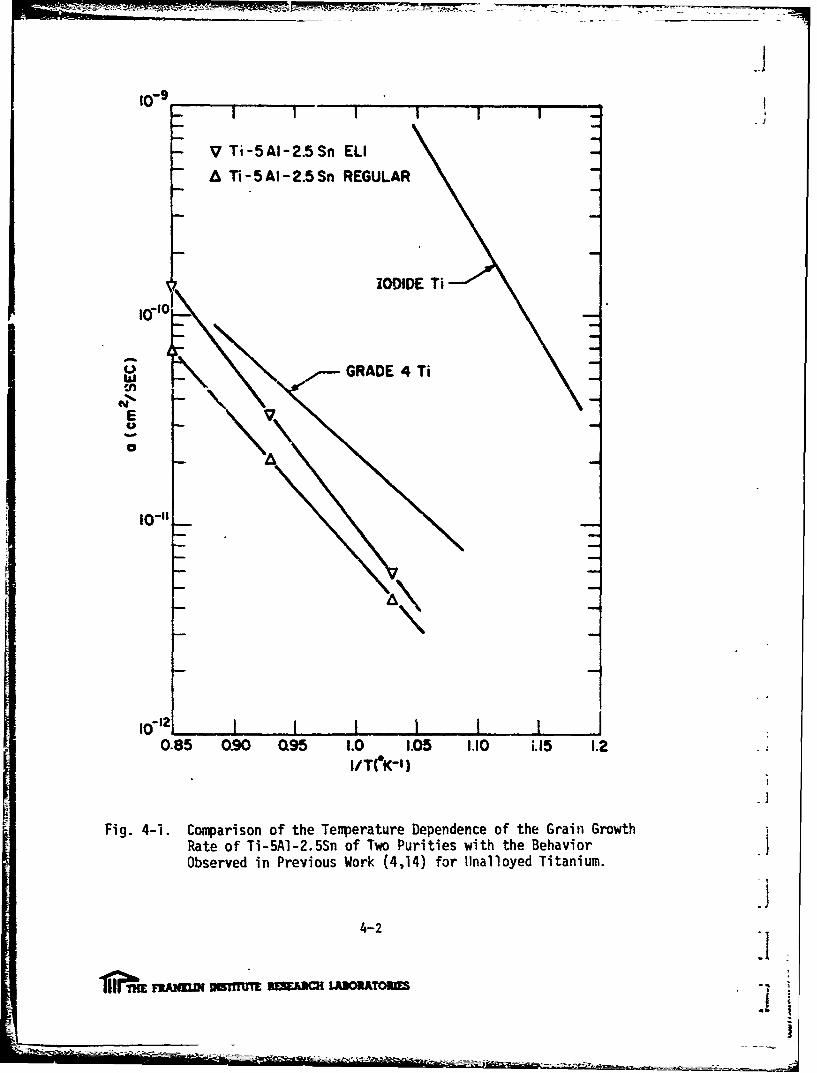
4.1 Grain Growth Kinetics!iThe grain growth data shown in Figs. 2.2 and 2.4 suggest an
isothermal grain growth relation of the type
- 2d. d2 0 (at) T (4-1)
LIwhere d is the grain size and t is the annealing time in seconds. Values
of the slopes, a, have been computed from Fig. 2.4 which indicates small
values of the starting grain size do in all cases.
Assuming that the temperature dependence of the grain growth
I i rate is exponential in form we can express the grain growth kinetics
by a simple relation of the form§ i
2 2 At e-Q/RT (4-2)
where Q is the activation energy of the process and T is the absolute
temperature. Hence, combining 4-1 and 4-2 and taking natural logarithms
we have
log e a =-_ + loge A (4-3)
where A, the pre-exponential factor, is a measure of the new grain
boundary area created per unit time.
The present data for ]ogl 0 a are plotted against lI/T in Fig. 4-1.
Also plotted are comparable relations for Grade 4 and iodide purity
Jj 4-1
F1 Tj1TiHE FRAIIKLD MSISTT RESEARCH LAIWfATORES
Also. plotted. comparable -
._9I°-9 I ' I I Ii .
V Ti-5AI-2.5Sn ELI
A Ti - 5 Al - 2.5 Sn REGULAR
IODIDE Ti
I0-1o
W GRADE 4 Ti
E
Io ' I I I0.85 0.90 095 1.0 1.05 1.10 i.H5 1.2
itT(*K-1 )
.!
Fig. 4-i. Comparison of the Temperature Dependence of the Grain GrowthRate of Ti-5AI-2.5Sn of Two Purities with the BehaviorObserved in Previous Work (4,14) for Unalloyed Titanium.
-j
4-2
. 1
1ii~ F3PILD D~rTU'T 3UA3~fLA3OTOU

- I F-C3013
Grade 4 and iodide purity unalloyed titanium from the data of Jones(4) (14)et. al. and Spangler and Herman respectively. The present data
are ir. good agreement with a linear relation and thus confirm equation
4-2. Values of Q and A obtained from the slope and intercept of Fig.
4.1 respectivel,, are tabulated in Table 4.1 together with comparable(15)values for unallc'yed titanium of four purities deduced previously
Table 4.1
VALUES OF THE ACTIVATION PARAMETERS FOR GRAINCOARSENING FOR TI-5AI-2.5SN AND UNALLOYED TITANIUM
Totalj( Interstitial
Content Q 2AMaterial .,(ppm)S Kcal/gim tQ Cm /sec
Zone refined 120 40 100
Iodide 160 39.5 27
Grade 2 (special) 500 23 1.5 x lo-
Grade 4 3000 23 2.4 x 10⁻⁶
Ti-5AI-2.5Sn (Reg) 2500 31 3.2 x 10⁻⁵
Ti-5AI-2.5Sn (ELI) 1270 34 3.6 x 1O0
I Froin th, ta tabulated it is evident that the effect of im-
purities and alloy g additions on the coatsening process is quite complex.
Ii The unaller.,,. titanium data show that Q and A both decrease with increas-
ing intersL.-ial content. However, the effect of A must predominate
ii since the experimental observation is that the coarsening rate decreaseswith increasing interstitial content. The data for the alloys, which
show slower coarsening kineti-s than any of the unalloyed materials,
indicate that substitutional alloying mainly affects the activation energy
since the values of A are close to those expected based on the interstitial
I contents alone. Thus the clow kinetics in the alloys result from the
superposed effects of the interstitials (low A) and the substitutionals
fi (high Q).
4
1?I~ME MANILI DMTU AESEARCH LAORATOMMIS. ' *__ _ _ _ __ _ _ _ _ _
-
rI
F-C3013
4.2 Room Temperature Tensile Behavior
4.2.1 Effect af Grain Size
Fig. 2.5 indicates that the effect of grain size on the yield
strength of Ti-5AI-2Sn follows the commonly observed Hall-Petch(1 6 ,1 7 )
relation, vis:
S= ai + kd-1 1 2 (4-4)Oy i
Values for ai, the friction stress and k, the Hall-Petch constant, for
materials of the two purities are tabulated in Table 4.2 together with
comperative values for unalloyed titanium sheet and wire deduced in
previous work( 1 ' 2 ' 1 5 .
Table 4.2
HALL-PETCH PARAMETERS FOR UNALLOYED 1ITANIUM ANDTI-5AI-2.SN ALLOYS
TotalInterstitial
Content 0. k 1Material (ppm) k ~i) (ksi-mmI/2)
Grade 2 1100 36 1.1
Grade 3 1450 47 1.2
Grade 4 3800 65 1.4TI-5AL-2.5 Sn (Reg) 2500 99 1.35
TI-5AL-2.5 Sn (ELI) 1270 1.2
The data in Table 4.2 show that 5% Al and 2.5%Sn in solid
solution in titanium increase the friction stress a. but have little1
effect on the Hall-Petch slope k which depends on interstitial content
in a similar manner to that previously observed in unalloyed material.
In a datailed investigation of the origin of the grain size dependence
of the strength of unalloyed titanium 16) it was concluded that the
friction stress a could be identified with the short range component
4-4.R
1~E p.~erwiINSITUT REEARC IAORATRIE

F-C3013
of the yield stress which is believed to result from the interactionbetween dislocations and individual interstitial atoms (4, 15 , 1 7 , 1 8 )
The long range component, which in unalloyed material contains the effects•= show(16)t of strain and grain size, was shown to be due principally to disloca-
tion interactions, the grain size effect arising because of an inter-
dependence of dislocation density and grain size. In order to assess
the effect of substitutional solid solution additions on this model we
have performed change-of-strain rate tests so as to obtain values for
St•the activation volume of the short range interaction. Values obtained3 3
were 15-20b' and 25-30b for regular and ELI purity materials respecLively
ji and were essentially independent of strain and grain size. These values
are similar to those observed in unalloyed materials with the same inter-
stirial contents and support the belief that the presence of the sub-
stitutional alloying elements increases the long range component of the
yield stress without effecting the short range component or the thermally
activated deformation mechanism. A similar conclusion was reached by
Cra(19)Sargent and Conrad in stress relaxation experiments on Ti-4A1. Thus
in the a-alloys the friction stress ai contains a short range component
due to the dislocation interactions and a long-range component of 35-40
ksi due to the presence of the substitutional solutes.
The data in Table 2.5 indicate that grain size refinement into
the 0.5 micron range increases the yield strength of Ti-SAI-2.5Sn by
40-50 ksi depending on interstitial content. The strain hardening rate
decreases at fine grain sizes with the consequence that the uniform elonga-
tion is reduced by about a factor of 2 and the increase in the ultimate
strength (20-30 ksi) accompanying grain refinement is therefore less
than the yield stress increase. As observed for unalloyed material the
R.A. increases slightly with grain refinement but in contrast to unalloyed
behavior the total elongation at failure is somewhat decreased by grain
refinement. Ductility remain quite adequate, however, and the decrease
in elongation appears to be more than offset by the increase in yield
strength attained.
4-5
I ?1TE bFWIKIB INSTITfUTE RESEARCH IUORATORIYS

F-C30134.2.2 Effect of PRR
Reference to the data in Table 2.5 indicates that 40% PRR raises
the yield strength by about 30 ksi beyond the strength level attainedin the recrystallized samples. Curiously, the increase is larger for
the ELI purity material which generally exhibits lower strain hardening
rates. The increase in the UTS is similar but is accompanied by a sub-
stantial decrease in uniform elongation (I- a factor of 3) and total
elongation (up to a factor of 2). Although the strtngth levels attained
are impressive in themselves it is felt that the rather low elongations
-may not prove adequate in this case, particularly in view of the effects
of PRR on the toughness of unalloyed material discussed elsewhere in this
report.
4.3 Thermal Stability and Age Hardening Behavior
The short term, static thermal stability limit appears to be
about 600% for both materials in the 40% PRR condition, which is the re-
crystallization te--perature. This is a similar result to that obtained
previously for unalloyed material (2) It is expected, on the basis of
the b. .avior of unalloyed material, that the dynamic thermal stability
I limit will prove to be somewhat lower than this.
The hardness increase observed for annealing temperatures near
500%C is worthy of further comment. Such a hardness increase could beIii due to a strain aging effect, or to interstitial pickup during annealing
(thermal stability anneals were performed in air) or to strengthening
due to the precipitation of a second phase. Strain aging is not consid-
ered to be likely explanation since the present temperature range is well
above that in which strain aging behavior is observed in unalloyed
material. A similar hardness increase was observed in tae recrystalliza-
tion studies where anneals were performed in vacuum (see Fig. 2.2) sothat any explanation based on interstitial pickup appears untenable.
Furthermore such an explanation would have difficulty explaning a hardness
peak since the rate of contamination would be expected to continuously
increase with increase in temperature. The precipitation explanation
4-6
TIIE FlANEM 2&STI= RESEARCH LABORATORIES
I
F-C3013
seems to fit the observations well. Observation of a hardness peak with
aging time as well as with aging temperature is characteristic of anSayste(20)age hardening aystem and a 5% Al content may exceed the solid sol-
"ubility of Al in Ti below 6000C,( 2 1) although the Ti-Al binary phase
diagram is still somewhat in dispute 22. A sample which was recrystal-
lized at 700%C then annealed at 500%C did not show any significant change
in hardness, indicating that the presence of a high dislocation density
is necessary to promote the hardening mechanism, possibly suggestive of
heterogeneous nucleation of prec. pitates on dislocations. Another possible
*explanation lies in the recent observation of short range order hardening(23)
in Ti-Al binary alloys
Whatever the underlying mechanism, the important point is that
a significant hardening does occur on annealing cold deformed Ti-5A1-
2.5Sn at 500%C and that the maximum hardnesses observed are equivalent
• "to yield strengths of >200ksi for both ELI and regular purity material.
From the point of view of the overall objectives of the program it is-I essential to find out whether or not the hardness increase 3 reflected
in a usable improvement in tensile properties i.e. is the material em-
brittled? Tensile samples are currently being fabricated to investigate
this question.
4.4 Summary of Conclusions for the Ti-5AI-2.5Sn Alloy Study
A i The major conclusions of this section of the program may be
summarized as follows:
ti 1. Grain coarsening kinetics for Ti-5A1-2.5Sn alloys are slowerthan those of unalloyed titanium with comparable interstitialcontents. The substitutional alloying additions principally
b influence the activation energy for grain growth. The pre-exponential factor in the grain growth equation depends uponinterstitial content in alloys in a similar manner to thatobserved in unalloyed titanium so that ELI purity materialshows more rapid grain growth than regular purity material.
2. Grain size refinement leads to an increase in yield strengthaccording to the Hall-Petch equation. Strength increases of40-60 ksi have been obtained accompanied by some decrease inuniform elongation. The substitutional alloying additions have
4-7
H11&T FRANqXujq vmSIMUT R~ESMCH L RT

F-C3013
no effect on the Hall-Petch slope which depends on irntersti-tial content in a similar manner to that observed previouslyin unalloyed titanium. The friction stress is increased by30-40 ksi compared with unalloyed material due to the presenceof the substitional additions. This increase is athermal(longrange) in nature and the presence of the solutes appears tohave no effect on the rate controlling thermally activateddeformation mechanism at room temperature.
3. The yield strength of the fine grain size samples may beiticreased further by post recrystallization reduction (PRR).40% PRR results in a strength increase of '. 30 ksi accompaniedby a further substantial decrease in elongation. The strongestsamples tested showed yield strength of \ 180 ksi (ELI) and> 190 ksi (Regular) with reduction in area of > 50% in bothcases.
4. The short term static thermal stability limit of the 40% PRRmicrostructure is close to the recrystallization temperature,as observed for unalloyed material.
5. Annealing of deformed alloy wires at about 500%C produces ahardness increase which has the general characteristics of agehardening. The nature of the hardening mechanism has not yetbeen established and it remains to be seen whether or not theobserved hardness increase corresponds to a useful strengthenchancement.
4-8
11'E FRANINo•TITTE RESEARCH LABORATORIES

F-C3013
5. DISCUSSION AND CONCLUSIONS -UNALLOYED TITANIUM SHEET
5.1 The Notched Tensile Test
t The results of the notched tensile tests presented in Table"(2)"3.2 were completely discussed in a previous report where the observa-
*tion of notch strength ratios (NSR) > 1 for the range of stress concen-
tration investigated was interpreted in terms of the combined effects of
-- strain rate and plastic constraint. It was concluded that increase of
I ~strength by grain refinement and/or PRR was accompanied by some increase
in notch sensitivity. As discussed in Section 3.2.1, since the NSR does
not explicitly contain the ab.olute stress level it is not clear how to
relate this parameter to toughness for materials with widely different
strengths. Table 3.2 also contains values of a new parameter, the unit
fracture energy (UFE) for samples in three thermomechanical conditions
"containing the most severe notches investigated. It is believed that this7
parameter may be a more significant toughness indicator for materials
with differing yield strengths. It is probably unwise to generalize
from so few data but the results obtained to date suggest that grain size
refinement increases the UFE slightly while PRR results in a substantial
t i decrease. This is a similar trend to that observed in the tearing testsdiscussed in the next section. It is planned to extend this study in
"further work so as to investigate the effects of more severe stress con-centrators on materials covering the enti.re grain size and substructuze
spectrum.$e
5.2 The Tear Test
The tear test data obtainri during the present program are
presented in Table 3.3 and Fig. 3.4. The Figure indicates that the
tear strength is directly related to the yield strength fox the unalloyed
S" FRANUN ISTITUTE RESEARCH LABICATOPIES

F-C3013
titanium samples in all thermomechanical conditions, which is the expected
result for a notch insensitive material. Note !.hat the data point for the
Ti-6A1-4V alloy in the annealed condition lies close to the unalloyet line
k ~ while the data points for the aluminum alloy and the Ti-6A1-4V in the STA
condition lie far below it, indicative of their substantially greater notch.
SIsensitivity. The data for the UPE, which are also plotted on the graph, are
quite interesting. Data for unalloyed titanium in the recrvstalli..d condl-
tion sho4 a broad maximum in the yield stiess range 70-80 ksi. Unalloyed
titanium samples in the PRR conditions show markedly lower values than those
of recrystallized samples, as do the aluminum alloy and the titanium alloy
in both heat treatments, The value for the Ti-6AI-4V alloy in the annealed
condition is cdoce to that for thc unalloyed titanium sample in the 'PRR
condition with no recore:.-y treatment, which has a similar yield strength.
Attempts have teen made in the past to correlate the UPE with
the plane strain fracture toughness Klc for aluminum alloy samples( 7 ).
Although the fundamental basis for any such correlation is somewhat
with increasing LPE as *;hown by the data in Table 5.1.
Table 5.1
CORRELATION OF UPE WITH K FOR THE EXPERIMENTAL MATERIALS
UPE Klc (Typical)
Material Condition (in.-lb/sq in.) (ksi /Fr-')
Grade 3 Ti Recrystallized (10-20I•) 1850 >80
2024 Al T3 403 40
Ti-6AI-4V Annealed 510 50
Ti-6AI-4V STA <200 30
It thus appears that the value of KIc for recrystallized samples of all
grain sizes is rrobably ý 83 ksi /in while 53% PRR reduces this to "" 50
ksi iin.
To further illustrare t.e effect of grain requirement. the yield
stress and UPE are plotted against the inverse square root of the grain
•.1I5-2
~ I F~IXWI ISTIM== RMFZACH LABOR'tTOREES

| !
F-C301 3
size in Fig. 5-1. The er-'or bars on the UPE data are based on the
experimentally observed scatter in duplicate tests. Scatter in the
yield strength data was typically t 1 ksi. While the yield sfress data
show the familiar Hall-Petch relation with grain size (ai =47 ksi, k
1.1 i-/2 ) the bPE data again show a broad raximum, centered in the•- range 20-30 .' corresponding to a grain Aze of 1-2 microns. We
"" 'ave attempted to illustrate the practica' consequences of this result
in Fig. 5-2. In this graph we have considered a hypothetical application
in which it is desired to employ Grade :3 sheet with an optimum combination
of strength and toughness, these two requirements being equally weighted.
To determine the optimum grai,, size we have plotted grain size in Fig.
5.2 against combined scrength plus toughness parameter, calculated asI : the sum of the relative yield stress (yield stress/maximum observed
yield stress) and the relative UPE (UPE/maximum observed UPE). This
parameter rises initially with decreasing grain size and reaches a plateau
at a value of about 1.72 for grain sizes below 1 micron, indicating that
materials with grain sizes below this are equivalent in the hypothetical
application., If strength was givbn a higher weighting than toughness
the finest grain" size material attainable would be optimum, while for
a higher toughness weighting the optimum grain size would lie in the
range 1-2 microsn.
While a detailed explanation of the variation of the UPE with
grain size and cold work has not been attempted, some insight can be
gained by considering that the UPE may be regarded as a parameter which
combines strength and ductility. The pertinent uniaxial paramters are
probably the yield strength. (or UTS) and the uniform elongation and a
combination of these parameters appears capable of. explaining the variation
of the UPE. We have seen previously that grain size refinement initially
increases the yield strength with little change in uniform elongation.
Below about 3 microns the uniform elongation begins to decrease signif-
Ii icantly as the yield stress increases and PRR results in a rapid decrease
of uniform elongation with a comparatively small increase of streng-h.
U• As a first attempt at a quantitative correlation we have simply multi-
plied the yield stress by the uniform elongation in selected cases to
5-3
1101&*TE FRAJIIUN nm~flTUTE UREVC A DOATPH
.Ni- .'OS 91 -- -N 3 o
a(a
0 mI I NO/a1-JI1 3flfO
4.)
0O 1 -000
4J)00
0I S.
0- 4-~
N 4-o0 U)J
0N 00c3CN
qoo
5-4
I~~~~~~~~~~~ ?I E*NLN Mf=RSACHLBRTRE
____ 77Z -:M------ -
Iii S.CD
Inin
cr 5-
-0i0I- -o
4-)1
in ) d) a)-
4-) 4 D
ma4
5-5I
Tl~lnm nu~m U~ff= EWAR LAWATO-
F-C3013 jobtain a pseudc energy per unit volume parameter. The data are snown
in Table 5.2 and it is seen that the uniayial tensile parameter varies
in a suprisingly similar manner to the UPE for Grade 3. Notice however
that the same rrelation does not apply to the Ti-6A1-4V alloy which
sAaws much smaliez values of UPE than those expected on the basis of theS.
tensile parameter. Notch sensitivity is probably the necessary factor
omitted from this simple model so that the tensile and tear data only .icortelate well if the material is essentially insensitive to the stress
concentration due to the tear notch. The simple relation between tear "
strength and yield stress (Fig. 3.4) iLdicates that this is probably the
case for the Grade 3 samples but not for the Ti-6A1-4V samples. "
Table 5.2
CORRELATION OF UNIAXIAL TENSILE DATA AND THE UPE
a e a xe UPEy uy uUP
Material Condition (ksi) (in./in.) (in.-lb/cu in.) (in.-lb/sq in.)
Grade 3 20 microns 55 0.18 9900 1820
Grade 3 1.2 microns 78 0.16 12500 2340
Grade 3 0.5 microns 95 0.1 9500 1720
Grade 3 50% PRR 115 0.025 2900 <600
Ti-6AI-4V Mill Anneal 120 0.08 9600 510
Ti-6AI-4V STA 155 0.06 9300 <200
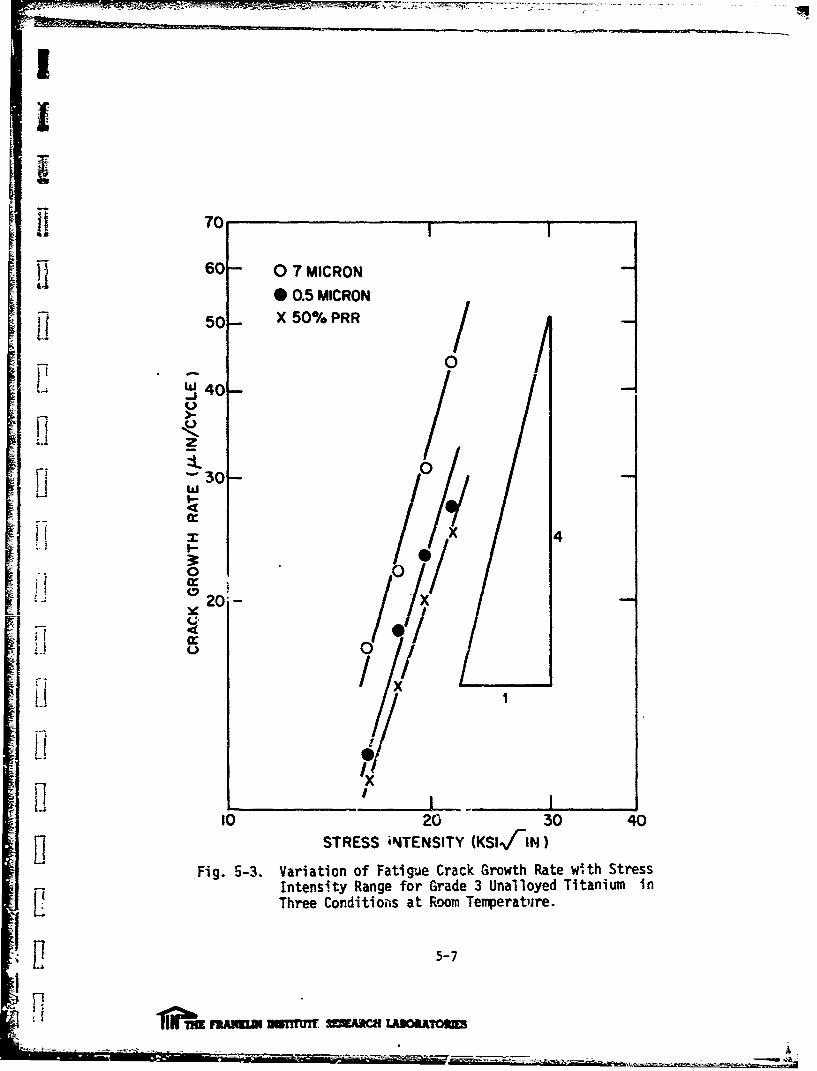
5.3 Fatigue Crack Propagation .ests
The fatigue crack growth rate data shown in Table 3.4 indicate
that the growth rate is a sensitive function of stress intensity and is
dcpendent also on mater~al condition. Krafft(12 ) predicts a fourth power
relation between growth rate and stress inteisity range (which for ten-
sion-zero fatigue iS the stress intensity at the maximum applied stress). "i
The present data are presented on a log plot in Fig. 5-3. The range
of stress ii.tensity Lovvred by the dati available at present is too small "
5- 6
iF
'5- -..-RSARH BRAORE
i I • ,• ' • - •••• •- •,t - - -- =--•- : : ; - •-.-.- -...... ....... - ..
170
60- 0 7 MICRON
0 0.5 MICRON
S0- X 50% PRR
,-, W 40-
ZL 0
LiiS4
o 20- X
S//
x
_____ I __ __
to 20 30 40
STRESS 'NTENSITY (KSIk/-IN)
Fig. 5-3. Variation of Fatigue Crack Growth Rate with StressIntensity Range for Grade 3 Unalloyed Titanium inThree Conditioms at Room Temperat'ire.
S~5-7
1Clb 11IMWW2WAWLD IO
a0 -a

F-C3013
for any definite conclusion but Fig. 5-3 certainly supports a dependence
of crack growth rate on a high power of AK and is not inconsistent with
the fourth power relation proposed by Krafft( 12 )
The crack growth rate at a constant stress intensity decreases
as the strength increases, whether the strength increase is due to grain
refinement or to cold work. Again, there are too few data for any con-
clusion to be drawn with certainty but the data are not inconsistent
with a simple inverse relation between crack growth rate and yield stress.
The fatigue lifetimes are more sensitive to yield stress than are the
crack growth rates. This follows simply from the fact that stable crack
growth to a greater size can occur in the higher strength materials pro-
vided that they are not significantly more notch sensitive. Rough cal-
culations were made of the stress on the rcmaining gage section when
fracture occurred. For all tbree material conditions this stress was
found to be close to the tensile UTS, indicating essentially notch in-
sensitive behavior.
5.4 Summary of Conclusions for the Unalloyed Titanium Sheet Program
The major conclusions for this section of the program may be
summarized as follows:
1. Grait, refinement and cold work reduce the notch resistanceof Grade 3 titanium to some extent as indicated by the notchstrength ratio. However, under all conditions investigatedthe material continues to exhibit notch insensitive properties.On the basis of a very limited number of data, grain refinementappears to improve the unit fracture energy of Grade 3 titaniumin notched tensile tests while cold work reduces this parameter.
2. In modified Kahn-type tearing tests a direct relation betweenyield strength and tearing strength is observed for Grade 3titanium irrespective of the thermomechanical condition. Othermaterials investigated show inferior tearing strengths at agiven yield stress than those predicted by the Grade 3 titanium ._
irrespeccive of the thermomechanical condition. Other materialsinvestigated show interior tearing strengths at a given yieldstress than those predicted b- the Grade 3 titanium relation.relation to yield stress. Recrystallized samples show very
1II1bn. FRANUMI I'I!TmUTE RESEARCH LABORKTORIE ?1

F-C3013
large values of this parameter in comparison to the othermaterials investigated and a maximum is observed in the 1-2micron grain size range. Cold worked samples show much smallervalues than recrystallized samples. It is possible to account
qualitatively for the observed behavior in terms of a com-bination of the uniaxial tensile yield stress and uniformelongation for Grade 3 titanium but not for Ti-6A1-4V alloy.S3. The fatigue crack propagation rate measured for a constant
stress intensity range decreases systematically with increas-
ing yield stress for Grade 3 titanium irrespective of thether-omechanical condition. The crack propagation rate is a
.- sensitive function of the stress intensity range as observedin other materials. Fatigue lifetimes are dependent on yieldstrength to a greater extent than is predictable from thedecreased crack propagation rate alone, and final fractureoccurs when the remaining section stress approaches the uniaxialUTS, indicating notch insensitive behavior.
iI
ii
LiL.
i i
III 5-9
-' H II~bm nANEM n~sTff TE R~ESEiC LABORATOMMF

6. AREAS FOR FURTHER STUDY
6.1 Titanium Alloy Study
7 This program has demonstrated that grain size refinement and
[i cold work effect the room temperature tensile properties of Ti-5A1-2.5Sn
wires in much the same manner as that observed previously for unalloyedtitanium. The fatigue and toughness behavior of the thermomechanically
strengthened alloy should be investigated to assess the changes produced
in these service-relevant properties and the tensile properties abovE
and below room temperature should be documented. The possible use of
the apparent age hardening phenomenon observed for annealing temperatures
"I near 500*C should be investigated and its origin elucidated. Possible
methods for transferring the optimum thermomechanical processing para-
meters to the fabrication of a sheet product should be explored.
Only preparatory work on B-alloys was carried out during the
present progizm. Further work is required with the objective of at
least establishing tne effect of grain size on the tensile behavior of
one or more B-alloys.
6.2 Unalloyed Titanium Sheet Study
The continuir1 E , -ay is aimed at i~vestigating in depth the
effects of macerial variables, (grain size, impurity content, thermo-
mechanical condition, texture, etc.) on the toughness of unalloyed
I 'Ititanium sheet under various types of loading. Notched tensile, tear,
I• and fatigue crack propagation tests should be continued and the scope of
the inve&tigation widened to include variables not considered to date.
I• The results obtained during the present program have been extremely
I encouraging in that they indicate that strengthening unalloyed titanium
jI by grain size refinement and/or cold work does not result in catastrophic
I ! 6-1
S1 TLE UM nIs1ffTtUTE RESEARMI LABORATOR.ES
F-C3013
reduction of any of the toughness-related parameters investigated, and
in some cases leads to significant improvements (e.g. tear strength,
fatigue crack propagation rate).
A
6--
1m -
.1
Ii
-I
.1
6-2".!
1iiE ThNE IlNSiTTUTE RESEA3OI I.A3OTOBI•
"- -
I F-C3013
I7. ACKNOWLEDGEMENTS
The author gratefully acknowledges the considerable contribu-
tion made to this work by Dr. J. D. Meakln. Thanks are also due to Dr.
R. C. May and to the technical staff of the Materials and Physical
Sciences Department for their assistance with the experimentation, and
- - to Dr. J. M. Krafft of NRL for a number of helpful suggestions regarding
the titanium sheet toughness study.
Submitted by
e R. . JonesI Project Leader
Approved by
! r-,. "') k'•'C,o
S. Francis
I DirectorMaterial and Physical Sciences Department
I '
I !I 7-1
I I 1ji~F&nuuM~ DeSTITUTE RESEARCH LA)OfATORIES
~ F-C3013
t
1 8. REFERENCES
1. R. L. Jones, FIRL Final Rept. F-C2470, Contract #N00019-69-C-0437,january 31, 1970.
2. R. L. Jones, FIRL Final Rept. F-C2739, Contract #N00019-70-C=0206,March 1971.
3. E. Abrahamson, Army Materials and Mechanics Research Center, Water-town, Mass., Unpublished work.
4. R. L. Jones, F. W. Cooke, and H. Conrad, FIRL Annual Report A-C1887,
Contract #AF33 (615)-3864, June 30, 1967.
5. G. R. Irwin, J. A. Kies and H. L. Smith, Proc. ASTM 58 (1958), 640.
6. N. A. Kahn and E. A. Imbembo, Welding Journal 27, (1948), 169.S7. J. C. Kaufman and H. Y. Hunsicker, ASTM STP 381 (1965), 290.
8. W. F. Brown, Jr. and J. E. Srawley, ASTM STP 410 (1967), 11.
"I 9. G. R. Irwin, U. S. N. R. L. Rept. #5486 (1960).
10. G. R. Irwin, 'Fracture' Ed Flugge, Springer, Berlin (1958), 551.
11. H. M. Westergaard, J. Appl. Mech. 6, 2, (1939), A29.
12. J. M. Kraffr, Trans. ASM 58 (1965), 691.
13. J. M. Krafft, "Strain Hardening vs. Stress Relaxation Effects onFatigue Crack Propagation", Paper presented to ASTM Comm. E-24/4,Atlanta, Georgia, March 1971.
"14. G. Spangler and M. Herman, FIRL Interim Rept. I-A1878-7, Contract#AF-18 (600)-1581, July 1960.
15. R. L. Jones, F. W. Cooke, H. Conrad and B. R. Banerjee, AFIIL-TR-68-28, Feb. 1968.
16. R. L. Jones and H. Conrad, "'rans. TMS-;.IME 245 (1969) 779.
17. H. Conrad and R. L. Jones 'The Science, Technology and Applicationof Titanium', Ede. Jaffee and Promisel, Pergamon Press (1970),"p. 489.
8-1
TIIHfE FRANKLIN INST RESEARCH LABORATORIES
F-C301318. R. N. Orava, G. Stone and H. Conrad,. Trans. ASM 59 (1966), 171.
-1 19. G. A. Sargent and H. Conrad, Scripta Metallurgica 4 (1970), 129.
20. A. Kelly and R. B. Nicbolson, 'Precipitation Hardening', Prog. inMat. Sci 20, 3 (1963).
21. R. P. Elliott 'Constitution of Binary Alloys' McGraw-Hill (1965)p. 59.
22. F. A. Shunk 'Constitution of Binary Alloys' McGraw-Hill (1969) p.44.
23. T. Y. Namboodhiri, H. Herman and C. McMahon, University ofPennsylvania, Unpublished research.
I
I
8-2
Iii1?nb FRANKLIN INSTITUTE RESEARCH LADORATORIFS
I