report: contributions to delisting rio grande silvery ... · pdf filerio grande silvery...
TRANSCRIPT

PROGRESS REPORT 2005
CONTRIBUTIONS TO DELISTING RIO GRANDE SILVERY MINNOW: EGG HABITAT IDENTIFICATION
U.S. Department of the Interior Bureau of Reclamation

i
PROGRESS REPORT-2005 CONTRIBUTIONS TO DELISTING RIO GRANDE SILVERY MINNOW: EGG HABITAT IDENTIFICATION January 2006 FUNDING PROVIDED BY
U.S. BUREAU OF RECLAMATION - SCIENCE AND TECHNOLOGY PROGRAM
- ENVIRONMENT DIVISION
INTERSTATE STREAM COMMISSION MIDDLE RIO GRANDE ESA COLLABORATIVE PROGRAM
PRINCIPLE INVESTIGATORS: Michael D. Porter Tamara M. Massong Environment Division Bureau of Reclamation-Albuquerque Area Office

ii
TABLE OF CONTENTS LIST OF FIGURES ....................................................................................................................................... ii LIST OF TABLES .........................................................................................................................................iii INTRODUCTION...........................................................................................................................................1 METHODS ....................................................................................................................................................2 RESULTS......................................................................................................................................................5
Macro-Habitat ...........................................................................................................................................5 Level 1 Braid Bar. .................................................................................................................................6 Level 2 Braid Bars ................................................................................................................................6 Level 1 Mid-Channel Bars ....................................................................................................................6 Level 2 Mid-Channel Bars. ...................................................................................................................6 Alternate Bars.......................................................................................................................................6 Level 1 Bank-Attached bars .................................................................................................................6 Level 2 Bank-Attached bars. ................................................................................................................6
Micro-Habitat.............................................................................................................................................8 Bankline................................................................................................................................................8 Inlet .......................................................................................................................................................8 Island. ...................................................................................................................................................8 Large woody debris ..............................................................................................................................8 Other.....................................................................................................................................................8 Shelf. ....................................................................................................................................................8 Side channel.........................................................................................................................................8
Site Results.............................................................................................................................................11 DISCUSSION..............................................................................................................................................35 ACKNOWLEDGMENTS..............................................................................................................................38 LITERATURE CITED..................................................................................................................................38 LIST OF FIGURES Figure 1. Location Map showing locations of sample sites in the 2005 nursery habitat study. ....................1 Figure 2: Hydrograph for spring runoff 2005 from the USGS Rio Grande gage at Otowi, NM.....................3 Figure 3: Northern half of the sampled area. ................................................................................................4 Figure 4: Southern half of the sampled area.................................................................................................5 Figure 5. Bankline along a terrace. ..............................................................................................................8 Figure 6. A small habitat inlet formed by an arroyo channel........................................................................8 Figure 7. Habitat inlets, islands and side channel. ......................................................................................9 Figure 8. A shallow habitat shelf. .................................................................................................................9 Figure 9. Flowing water in a side channel..................................................................................................10 Figure 10: Sampling site #1. ......................................................................................................................11 Figure 11: Sampling site #2. .......................................................................................................................12 Figure 12: Sampling site #3. .......................................................................................................................13 Figure 13: Sampling site #4. ......................................................................................................................14 Figure 14: Sampling site #5. .......................................................................................................................15 Figure 15: Sampling site #6. .......................................................................................................................16 Figure 16: Sampling site #7. .......................................................................................................................17 Figure 17: Sampling site #8. .......................................................................................................................18 Figure 18: Sampling site #9. ......................................................................................................................19 Figure 19: Sampling site #10. .....................................................................................................................20 Figure 20: Sampling site #11. .....................................................................................................................21 Figure 21: Sampling site #12. .....................................................................................................................22 Figure 22: Sampling site #13. .....................................................................................................................23 Figure 23: Sampling site #14. ....................................................................................................................24 Figure 24: Sampling site #15. ....................................................................................................................25 Figure 25: Sampling site #16. .....................................................................................................................26 Figure 26: Sampling site #17. ....................................................................................................................27 Figure 27: Sampling site #18. .....................................................................................................................28 Figure 28: Sampling site #19. .....................................................................................................................29

iii
Figure 29: Sampling site #20. ....................................................................................................................30 Figure 30: Sampling site #21. .....................................................................................................................31 Figure 31: Sampling site #22. .....................................................................................................................32 Figure 32: Sampling site #23. .....................................................................................................................33 Figure 33: Sampling site #24. .....................................................................................................................34 Figure 34: Depth distribution of beads recovered on macro-habitat features.............................................35 Figure 35: Depth distribution of beads recovered on micro-habitat features..............................................36 LIST OF TABLES Table 1: Summary of all data collected in 2005; sorted by bar type. ............................................................6 Table 2: Summary of April data sorted by bar type. .....................................................................................6 Table 3: Summary of May data sorted by bar type.......................................................................................7 Table 4: Summary of June data sorted by bar type......................................................................................7 Table 5: Distribution of gellan beads, silvery minnow eggs and larval fish by micro-habitat type. ............10 Table 6: Summary of physical features at Site 1. .......................................................................................11 Table 7: Summary of physical features at Site 2. .......................................................................................12 Table 8: Summary of physical features at Site 3. .......................................................................................13 Table 9: Summary of physical features at Site 4. .......................................................................................14 Table 10: Summary of physical features at Site 5. .....................................................................................15 Table 11: Summary of physical features at Site 6. .....................................................................................16 Table 12: Summary of physical features at Site 7. .....................................................................................17 Table 13: Summary of physical features at Site 8. .....................................................................................18 Table 14: Summary of physical features at Site 9. .....................................................................................19 Table 15: Summary of physical features at Site 10. ...................................................................................20 Table 16: Summary of physical features at Site 11. ...................................................................................21 Table 17: Summary of physical features at Site 12. ...................................................................................22 Table 18: Summary of physical features at Site 13. ...................................................................................23 Table 19: Summary of physical features at Site 14. ...................................................................................24 Table 20: Summary of physical features at Site 15. ...................................................................................25 Table 21: Summary of physical features at Site 16. ...................................................................................26 Table 22: Summary of physical features at Site 17. ...................................................................................27 Table 23: Summary of physical features at Site 18. ...................................................................................28 Table 24: Summary of physical features at Site 19. ...................................................................................29 Table 25: Summary of physical features at Site 20. ...................................................................................30 Table 26: Summary of physical features at Site 21. ...................................................................................31 Table 27: Summary of physical features at Site 22. ...................................................................................32 Table 28: Summary of physical features at Site 23. ...................................................................................33 Table 29: Summary of physical features at Site 24. ...................................................................................34

1
INTRODUCTION The nursery habitat project was initiated in 2003 with the purpose of substantiating egg
retention in constructed nursery habitat inlets. The data from 2003 indicated that inlet features retained eggs, but that retention of the eggs varied greatly between inlets. The second year of the project examined how physical features contributed to the retention of silvery minnow and artificial eggs in constructed inlets and natural habitat features that currently exist in the Rio Grande. For 2005, the project studied retention of eggs and gellan beads (a.k.a. artificial eggs) on naturally formed bars and islands in the Albuquerque Reach (Figure 1). The purpose of this report is to present the 2005 study findings, summarize the finding for the entire 3-year project and offer recommendations for future studies.
¯0 5 102.5
Kilometers
Study AreaReach sampled
Bernalillo - Alameda
Calabacillas - I-40
Albuquerque
Figure 1. Location Map showing locations of sample sites in the 2005 nursery habitat study.

2
BACKGROUND The Rio Grande silvery minnow (Hybognathus amarus) (silvery minnow) was federally
listed as an endangered species in 1994 (U.S. Department of the Interior 1994). The declining silvery minnow population in the Rio Grande and Pecos River is thought to be due to the loss of habitat following dam construction (Bestgen and Platania 1991). In recent years, channel incision has abandoned the historical floodplain in much of the Middle Rio Grande (Massong et al. 2006) which isolates floodplain habitat during years with reduced runoff discharge (Porter and Massong 2004b). As the channel has incised, in-channel surfaces such as bank attached bars and islands have begun providing floodplain-like surfaces (Tashjian and Massong 2006). As inundated floodplains provide suitable habitat for riverine larval fish to escape the current and initiate feeding (Coutant, 2004; Pease, 2004), we’ve focused this phase of the study to inspecting silvery minnow nursery habitat on the in-channel flooded surfaces in the Albuquerque Reach of the Rio Grande.
Nursery habitat for the silvery minnow contains both surfaces that retain eggs and
protolarvae as well as habitat desired by swimming larvae. In 2003, constructed inlets were examined as features for silvery minnow egg retention; the successful inlets had substantial inflow and outflow at the inlet mouth with a drift zone away from the channel. Observations in 2004 indicated that shelves along the riverbank had a higher capacity for retaining gellan beads than inlets and contained high numbers of larvae later in the runoff event. The 2005 study was designed to map both areas of gellan bead retention and locations where larvae were observed while describing the nursery habitat features present.
METHODS
Three batches of gellan beads were released at the upstream end of the study reach (Figure 1) on three different dates with different flows. Reconnaissance sampling included collecting the gellan beads on flooded surfaces that naturally exist within the active channel (e.g., bars and islands). Features/sites were accessed by raft.
Experiments were scheduled to coincide with target flow levels during the silvery minnow spawning period from mid-April to late-June. Qualitative data were collected to identify habitat types where beads and larval fish were found. The locations of null samples (zero beads or larval fish) were not recorded to increase sampling at all available features. Though sampling frequency is roughly proportional to the habitat types available, no effort was made to quantify habitat availability or occurrence of beads and larval fish on particular features.
Gellan beads (Davin et al. 1999; Reinert et al. 2004) were released upstream of the study
area at Angostura dam two hours prior to initiating sampling. Gellan beads have a similar size and specific gravity to silvery minnow eggs (Cowley et al. 2005). Gellan beads were collected using dip nets on two consecutive days from two adjacent river sub-reaches (Figure 1). Sites were selected in the field based on water depth, flow patterns and vegetation. GPS coordinates, habitat type, depth, and the number of beads were recorded for each site that contained gellan

3
beads. GPS coordinates were recorded using a Trimble GeoXT. ArcGIS 9.0 was used to map the data onto 2004 color infrared (CIR) imagery. No data were recorded for net samples that collected no gellan beads. Sites were also recorded when larval fish were either captured in the dip nets or observed inhabiting the site. Juvenile or adult fish captured in the dip nets were also recorded as well as identified to species. Data were collected at 24 sites.
Three sets of data were collected, with runs in April, May and June. The first sample,
taken on April 22-23, 2005 was during the rising hydrograph at a flow of 5,300-5,500 cfs (Figure 2). This sample was taken as spring runoff was just beginning. The May data collection run was on May 12-13, 2005 at a steady flow of 5,000 cfs. The third data collection effort occurred on June 20-21, 2005 during the rapidly descending limb of the hydrograph (3,800-4,200 cfs). From these three data collection events, 24 collection sites were designated (Figures 3 & 4).
2005 Rio Grande Spring Runoff(Otowi - San Marcial Gages)
0
1000
2000
3000
4000
5000
6000
7000
8000
9000
10000
3/29
4/18 5/
8
5/28
6/17 7/
7
7/27
Rio
Gra
nde
Dis
char
ge (c
fs)
Otowi gageCochiti gageAlbuquerque gageSan Acacia gageSan Marcial gage
Figure 2: Hydrograph for spring runoff 2005 from the USGS Rio Grande gage at Otowi, NM (Otowi gage) upstream of Cochiti Reservoir to the USGS Rio Grande floodway gage at San Marcial, NM (San Marcial gage) at the upstream end of Elephant Butte Reservoir.

4
Figure 3: Northern half of the sampled area, from NM HWY 550 bridge crossing to the North Albuquerque Metropoloitan Arroyo Flood Control Authority (NAMAFCA), locating Sampling Sites 1-10. Background photography is from Oct. 2004, scale of 1:50,000.

5
Figure 4: Southern half of the sampled area, from NAMAFCA to the I-40 bridge crossing, locating Sampling Sites 11-24. Background photography is from Oct. 2004, scale of 1:50,000.
RESULTS The results are described by both macro- and micro-habitats. Macro-habitat describes the
main feature where beads or larval fish were found (i.e., bar or island). The micro-habitat analysis describes specific features including shallow shelves, side channels, and inlets found on the bar or island.
Macro-Habitat
As the historical floodplain in this reach of the Rio Grande did not flood, beads and larvae collection was limited to in-channel surfaces consisting of islands/mid-channel bars, bank-attached bars, braid bars (Level 1 and Level 2) and linguoid bars. These surfaces were classified using the NMISC/MEI 2005 bar classification system (MEI 2005) as described below:

6
Linquoid Bar - inundated at most flows, mobile sand bar within the active channel; no vegetation.
Level 1 Braid Bar - inundated at less than the 1-year event; no vegetation. Level 2 Braid Bars - inundated at the 1-year event; no perennial (woody) vegetation, may have
non-perennial species (weeds); evolved through aggradation from a level-1 braid bar surface; located within the active channel.
Level 1 Mid-Channel Bars - inundated at the 1.5 year event; young perennial (woody) vegetation; evolved through aggradation from a level 2 braid bar; located within the active channel.
Level 2 Mid-Channel Bars - inundated at the 2 year event; older perennial (woody) vegetation than the level 1 mid-channel bar; aggraded level 2 braid bar; located within the active channel.
Alternate Bars - inundated at the 1 year event; do not have perennial (woody) vegetation; “forms along the margins of the channel”; a.k.a., point bars.
Level 1 Bank-Attached bars - inundated at the 1.5 year event, young perennial (woody) vegetation; evolved through aggradation from an alternate bar; located at the edge of the active channel and is connected to the bank.
Level 2 Bank-Attached bars - inundated at the 2 year event, older perennial (woody) vegetation; evolved through aggradation from a level 1 bank-attached bar; located at the edge of the active channel and is connected to the bank.
Review of the macro-habitat data indicated that both bead capture and the presence of
larvae varied by bar type, and that water depth not only varied between flow levels but also between different bar types at the same flow. In general, Level 2 braid bars and mid channel bars were the most effective at capturing the drifting beads from the flowing river (Table 1), however the bank attached bars were the locations where the most larvae were observed/mapped.
Table 1: Summary of all data collected in 2005; sorted by bar type. Study Summary n # beads
beads/ occurrence # larvae
larvae/ occurrence
average depth (m)
ave. max depth (m)
bank attached 9 96 11 3442 382 0.30 0.57 L1 braid 3 8 3 478 159 0.13 0.50 L2 braid 8 148 19 607 76 0.13 0.34 linguoid bar 3 1 0 85 28 0.16 0.20 mid channel 19 327 17 49 3 0.22 0.38
In the April data collection effort, only large mid-channel bars and bank attached bars
were shallow enough to sample (Table 2). Of these two bar types, the mid-channel bars captured more beads than the bank attached bars. No larvae were observed during this data collection. In general, the bank attached bars were more deeply inundated during this data collection period, however the average water depth was similar between the two bar types.
Table 2: Summary of April data sorted by bar type.
April n # beads beads/ occurrence # larvae
larvae/ occurrence
Average Depth
Ave. Max Depth
bank attached 4 50 13 0 0 0.38 0.65L1 braid -- n/a n/a n/a n/a n/a n/a L2 braid -- n/a n/a n/a n/a n/a n/a linguoid bar -- n/a n/a n/a n/a n/a n/a mid channel 7 130 19 0 0 0.32 0.45

7
In May, all bar types were sampled except the linguoid bars (Table 3) which were too deeply inundated to even be found. In these data, beads were captured best on both the Level 2 braid bars and the mid channel bars. The bank attached bars did capture numerous beads, but has noticeably lower levels. The only larvae that were observed were found on the Level 2 braid bars and the mid channel bars, however, compared to the June observations, very few larvae were observed in May. As found in the April data collection data, the bank attached bars continued to be the deepest bar types where beads were collected, while the Level 1 braid bar was the shallowest. The Level 2 braid bar and the mid channel bars had similar average depths, however the mid channel bars had greater maximum depths.
Table 3: Summary of May data sorted by bar type.
May n # beads beads/
occurrence # larvae larvae/
occurrenceAverage Depth
Ave. Max Depth
bank attached 3 36 12 0 0 0.32 0.57 L1 braid 1 1 1 0 0 0.05 0.05 L2 braid 2 51 26 7 4 0.16 0.30 linguoid bar -- n/a n/a n/a n/a n/a n/a mid channel 8 181 23 1 0 0.17 0.39
The June data collection effort sampled all five types of bars (Table 4). In this data
collection effort, the Level 2 braid bars were the most effective at retaining the drifting beads, while the other bar types were much less effective. Although larvae were abundant at every stop during this data collection effort, the bank attached bars overwhelmingly contained the most larvae. The braid bars were a distant second when compared to the bank attached bars, while the mid channel bars contained the least number of larvae observed. Although the average water depths were similar for all bar types sampled during this data collection effort, the bank attached bars and the braid bars had the deepest water depths.
Table 4: Summary of June data sorted by bar type.
June n # beads beads/
occurrence # larvae larvae/
occurrenceAverage Depth
Ave. Max Depth
bank attached 2 10 5 3442 1721 0.09 0.40 L1 braid 2 7 4 478 239 0.17 0.5 L2 braid 6 97 16 600 100 0.12 0.36 linguoid bar 3 1 <1 85 28 0.16 0.2 mid channel 4 16 4 48 12 0.17 0.25

8
Micro-Habitat The specific habitat, or micro habitat, where the beads and larval fish were collected
consisted of shallow shelves, side channels, and inlets (Table 1). Beads were sampled in shelf habitats 68% of the time (number of samples and number of beads) averaging 25 cm in depth. Beads retained in side channels, inlets and around debris were 25% of the total. Ninety-five percent of the larval fish were collected in inlets, shelves, and side channels with depths averaging 11 cm. The micro-habitat features include:
Bankline – along the base of an elevated terrestrial surface (Figure 5). Inlet – water feature enclosed on three sides (Figures 6 and 7). Island – vegetated mid-channel bar or braid bar features (Figure 7). Large woody debris – adjacent to submerged logs. Other – usually consisted of vegetation or debris features. Shelf – a relatively flat inundated surface (may be sloped) (Figure 8). Side channel – a distinct flowing channel over a surface lacking vegetation (Figures 7 and 9).
Figure 5. Bankline along a terrace.
Figure 6. A small habitat inlet formed by an arroyo channel.

9
Figure 7. Habitat inlets, islands and side channel.
Figure 8. A shallow habitat shelf.

10
Figure 9. Flowing water in a side channel.
Table 5: Distribution of gellan beads, silvery minnow eggs and larval fish by micro-habitat type. Primary Habitat Samples Number Percentage Water Depth Beads 366 639 Χ = 0.25 Bankline 7 9 1.4% 0.14 Inlet 15 54 8.5% 0.16 Island 11 15 2.3% 0.30 Large woody debris 32 47 7.4% 0.24 Other 14 20 3.1% 0.15 Shelf 249 436 68.2% 0.26 Side channel 38 58 9.1% 0.28 Larval Fish 88 4661 Χ = 0.11 Bankline 1 2 0.0% 0.20 Inlet 23 1979 42.5% 0.08 Island 6 86 1.8% 0.10 Large woody debris 4 30 0.6% 0.20 Other 2 12 0.3% 0.23 Shelf 17 1484 31.8% 0.13 Side channel 35 1068 22.9% 0.10

11
Site Results Site 1
Site 1 is located immediately downstream from the New Mexico State Highway 550 bridge crossing, in the east side braid-bar complex (Figure 5). This complex of islands and bars is separated by high flow channels that were flowing on all three data collection trips. Beads and larvae were collected in the May and June data collection trips (Table 6). Generally this complex of islands and side channels can be classified as a braid-bar complex with sporadic mid-channel bars. The beads and larvae collected in May were collected on a mid-channel bar, while the beads and larvae in the June trip were collected on the lower elevation Level-2 braid bar.
Figure 10: Sampling site #1.
Table 6: Summary of physical features at Site 1. Depth measured in meters.
Month bar type # beads # larval fish ave water depth max depth min depth May mid channel 31 1 0.18 0.40 0.01 June L2 braid 7 66 0.16 0.70 0.01

12
Site 2 Site 2 is located 1.2 kilometers downstream from the New Mexico State Highway 550
bridge crossing, in the west side braid-bar complex (Figure 6). This complex of islands and bars is separated by high flow channels that were flowing on all three data collection trips. Beads were collected at this site for both of the May and June trips (Table 7). About the same number of beads were found on both trips; however, significantly more larval fish were found in June. Generally this site is classified as a braid-bar complex with sporadic mid-channel bars, however, both the beads and larval fish were found only on the Level-2 braid bars.
Figure 11: Sampling site #2. Table 7: Summary of physical features at Site 2.
Month bar type # beads # larval fish ave water depth max depth min depth May L2 braid 45 7 0.18 0.40 0.02 June L2 braid 43 161 0.17 0.75 0.01

13
Site 3 Site 3 is located 3.1 kilometers downstream from the New Mexico State Highway 550
bridge crossing (Figure 7). This small complex of sparsely vegetated islands and bars is dissected by high flow channels that were flowing on all three data collection trips, however beads were only collected at this site on the May and June runs (Table 8). Generally this site is classified as a braid-bar complex with Level 1 and Level 2 braid bars and mid-channel bars. The beads collected in May were predominantly found on the small, deeper, mid-channel bar; however, no larval fish were observed at this site. Although some beads were found in the June run, almost 500 larval fish were observed.
Figure 12: Sampling site #3.
Table 8: Summary of physical features at Site 3.
Month bar type # beads # larval fish ave water depth max depth min depth May L1 braid 1 0 0.05 0.05 0.05 May L2 braid 6 0 0.13 0.20 0.05 May mid channel 25 0 0.17 0.50 0.05 June L1 braid 6 478 0.14 0.50 0.01 June L2 braid 2 3 0.04 0.04 0

14
Site 4 Site 4 is located 4.2 kilometers downstream from the New Mexico State Highway 550
bridge crossing (Figure 8). This site is a partially dissected bank-attached bar with a variety of vegetation densities and small side channels flowing across the surface. This was the first site where beads were collected in the April run and all of them were collected within slightly vegetated areas on the bank attached bar (Table 9). The beads collected in June were also found in the sparsely vegetated regions of this bar, while the abundant larval fish were found in both the sparsely vegetated section and the section without vegetation.
Figure 13: Sampling site #4.
Table 9: Summary of physical features at Site 4.
Month bar type # beads # larval fish ave water depth max depth min depth April bank attached 19 0 0.10 0.60 0.00 June bank attached 8 2762 0.10 0.50 0.01

15
Site 5 Site 5 is located 6 kilometers downstream from the New Mexico State Highway 550
bridge crossing (Figure 9) at the confluence of Arroyo de la Barranca (Rio Rancho WWTP#3). This site is a bank-attached bar with dense vegetation. Beads were collected from this site in all runs, with all of the April collection occurring next to the historical floodplain (Figure 9). Beads and larval fish in May were found near the historical floodplain and near the middle of the bar, while beads and fish observed in June were almost exclusively found within the interior of the bar. The water depth data shows that the depth was greatest in April and decreased into May and subsequently into June, with June having the shallowest flooded surface (Table 10).
Figure 14: Sampling site #5.
Table 10: Summary of physical features at Site 5.
Month bar type # beads # larval fish ave water depth max depth min depth April bank attached 19 0 0.78 1.00 0.30 May bank attached 26 0 0.48 0.70 0.25 June bank attached 2 680 0.08 0.30 0.01

16
Site 6 Site 6 is located 8 kilometers downstream from the New Mexico State Highway 550
bridge crossing (Figure 10). This site is a mid channel bar with dense vegetation. Beads were collected from this site only in June (Table 11) along the upstream end of the bar.
Figure 15: Sampling site #6.
Table 11: Summary of physical features at Site 6.
Month bar type # beads # larval fish
Ave water depth
max depth
min depth
June mid channel bar 8 0 0.17 0.25 0.03

17
Site 7 Site 7 is located 9 kilometers downstream from the New Mexico State Highway 550 bridge crossing which is just downstream from the Harvey Jones Channel (Figure 11). This site is a mid channel bar with dense vegetation. Beads were collected from this site only in April (Table 12) and were collected only on the edge of the island. The Rio Rancho WWTP#2 discharges into the area within the box.
Figure 16: Sampling site #7.
Table 12: Summary of physical features at Site 7.
Month bar type # beads # larval fish ave water depth max depth min depth April mid channel bar 24 0 0.33 0.50 0.15

18
Site 8 Site 8 is located 10 kilometers downstream from the New Mexico State Highway 550
bridge crossing (Figure 12). This site is a densely vegetated mid channel bar. Beads were collected from this site in May and were concentrated at the head of the island. No larval fish were observed at this site (Table 13).
Figure 17: Sampling site #8.
Table 13: Summary of physical features at Site 8.
Month bar type # beads # larval fish ave water depth max depth min depth May mid channel bar 63 0 0.17 0.60 0.03

19
Site 9 Site 9 is located 12 kilometers downstream from the New Mexico State Highway 550
bridge crossing (Figure 13). This island contains both a Level 2 braid bar and a mid channel bar (densely vegetated portion). Although beads and larval fish were found on both surfaces, most of them were found on the Level 2 braid bar which was slightly deeper (Table 14).
Figure 18: Sampling site #9.
Table 14: Summary of physical features at Site 9.
Month bar type # beads # larval fish ave water depth max depth min depth June L2 braid bar 42 100 0.13 0.30 0.01 June mid channel 2 3 0.09 0.20 0.00

20
Site 10 Site 10 is located 13.5 kilometers downstream from the New Mexico State Highway 550
bridge crossing (Figure 14). Beads were only collected on this mid channel bar in only the April run (Table 15), and were collected throughout the island (Figure 14).
Figure 19: Sampling site #10.
Table 15: Summary of physical features at Site 10.
Month bar type # beads # larval fish ave water depth max depth min depth April mid channel 62 0 0.27 0.50 0.00

21
Site 11 Site 11 is located 15.7 kilometers downstream from the New Mexico State Highway 550
bridge crossing which is just downstream from the AMAFCA North Diversion Channel confluence (Figure 15). Data were collected during both the May run and the June run, but at separate locations. The May data collection occurred on a well vegetated mid channel bar and found only beads. In June, almost 170 larval fish were observed on a Level 2 braid bar with only one bead found (Table 16).
Figure 20: Sampling site #11.
Table 16: Summary of physical features at Site 11.
Month bar type # beads # larval fish ave water depth max depth min depth May mid channel 22 0 0.21 0.60 0.05 June L2 braid bar 1 169 0.10 0.20 0.02

22
Site 12 Site 12 is located 17.6 kilometers downstream from the New Mexico State Highway 550
bridge crossing (Figure 16). This site contains data on the beads that were retained in the April run (Table 17). The portion of the island that retained the beads is the head of a well vegetated mid channel bar.
Figure 21: Sampling site #12.
Table 17: Summary of physical features at Site 12.
Month bar type # beads # larval fish ave water depth max depth min depth April mid channel 40 0 0.24 0.50 0.00

23
Site 13 Site 13 is located 19.8 kilometers downstream from the New Mexico State Highway 550
bridge crossing, located on the Arroyo Calabacillas fan (Figure 17). This site retained beads released in the April run, but did not retain any of the other released beads (Table 18). This is an arroyo fan which we categorize as a bank attached bar.
Figure 22: Sampling site #13.
Table 18: Summary of physical features at Site 13.
Month bar type # beads # larval fish ave water depth max depth min depth April bank attached 6 0 0.43 0.70 0.10

24
Site 14 Site 14 is located 19.8 kilometers downstream from the New Mexico State Highway 550
bridge crossing, located almost under the Paseo del Norte bridge (Figure 18). This site retained beads released in the May run on Arroyo Calabacillas fan which is described as a bank attached bar (Table 19).
Figure 23: Sampling site #14.
Table 19: Summary of physical features at Site 14.
Month bar type # beads # larval fish ave water depth max depth min depth May bank attached 4 0 0.15 0.20 0.10
25
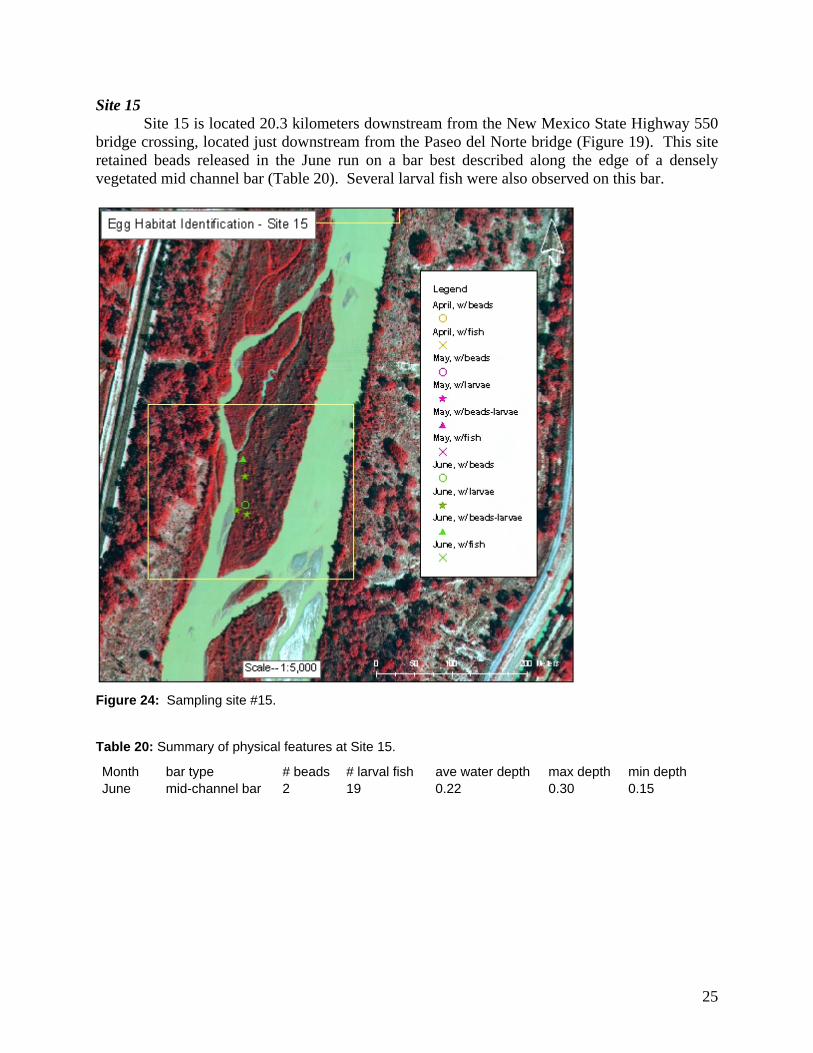
Site 15 Site 15 is located 20.3 kilometers downstream from the New Mexico State Highway 550
bridge crossing, located just downstream from the Paseo del Norte bridge (Figure 19). This site retained beads released in the June run on a bar best described along the edge of a densely vegetated mid channel bar (Table 20). Several larval fish were also observed on this bar.
Figure 24: Sampling site #15.
Table 20: Summary of physical features at Site 15.
Month bar type # beads # larval fish ave water depth max depth min depth June mid-channel bar 2 19 0.22 0.30 0.15
26
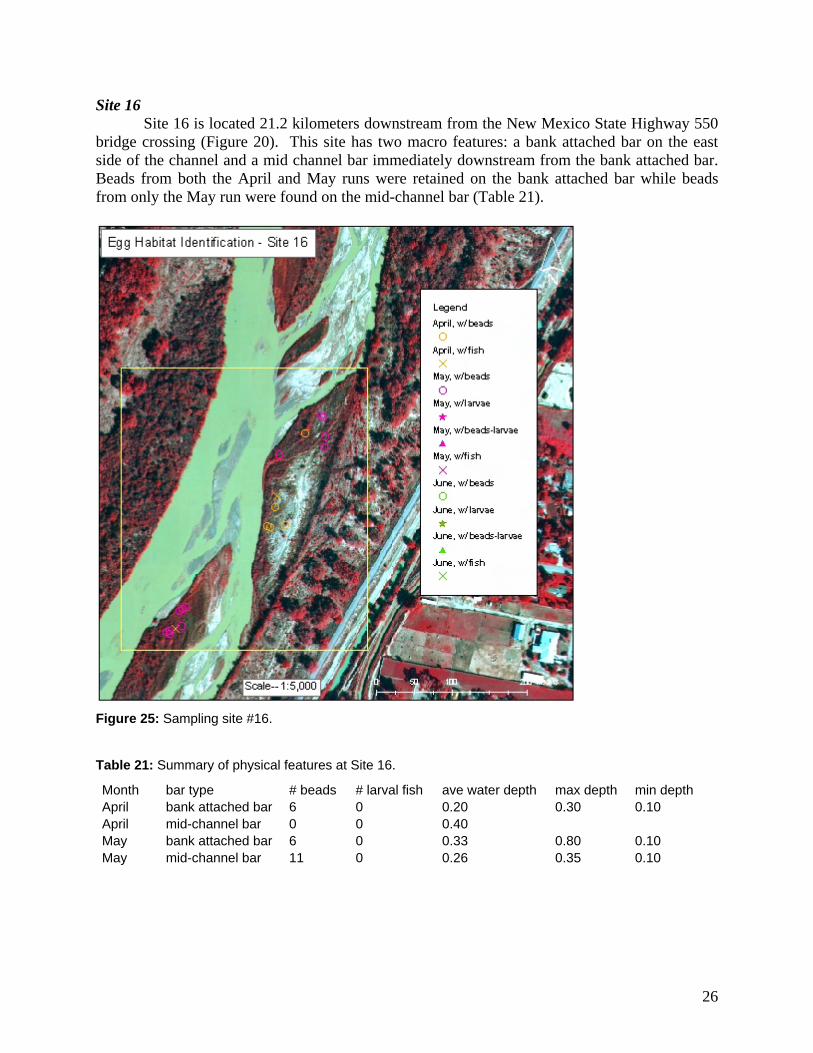
Site 16 Site 16 is located 21.2 kilometers downstream from the New Mexico State Highway 550
bridge crossing (Figure 20). This site has two macro features: a bank attached bar on the east side of the channel and a mid channel bar immediately downstream from the bank attached bar. Beads from both the April and May runs were retained on the bank attached bar while beads from only the May run were found on the mid-channel bar (Table 21).
Figure 25: Sampling site #16.
Table 21: Summary of physical features at Site 16.
Month bar type # beads # larval fish ave water depth max depth min depth April bank attached bar 6 0 0.20 0.30 0.10 April mid-channel bar 0 0 0.40 May bank attached bar 6 0 0.33 0.80 0.10 May mid-channel bar 11 0 0.26 0.35 0.10

27
Site 17 Site 17 is located 22 kilometers downstream from the New Mexico State Highway 550
bridge crossing (Figure 21). Although no beads were collected at this site, numerous larval fish were observed (Table 22). The fish were found on the downstream side of an active linguiod bar.
Figure 26: Sampling site #17.
Table 22: Summary of physical features at Site 17.
Month bar type # beads # larval fish ave water depth max depth min depth June linguoid bar 0 52 0.13 0.20 0.05

28
Site 18 Site 18 is located 22.6 kilometers downstream from the New Mexico State Highway 550
bridge crossing (Figure 22). This island is a mid channel bar with dense vegetation and a Level 2 braid bar with younger vegetation; in the June data collection run, the mid channel bar section was no longer inundated. On the Level 2 bar section, which coincides with a lower elevation, 2 beads were found with several larval fish observations (Table 23).
Figure 27: Sampling site #18.
Table 23: Summary of physical features at Site 18.
Month bar type # beads # larval fish ave water depth max depth min depth June L2 braid bar 2 101 0.12 0.15 0.10

29
Site 19 Site 19 is located 23.7 kilometers downstream from the New Mexico State Highway 550
bridge crossing (Figure 23). This small island is part of a larger complex of islands which are Level 2 braid bars. Only beads from the May run were collected on this bar (Table 24).
Figure 28: Sampling site #19.
Table 24: Summary of physical features at Site 19.
Month bar type # beads # larval fish ave water depth max depth min depth May mid-channel bar 18 0 0.12 0.30 0.05

30
Site 20 Site 20 is located 24.7 kilometers downstream from the New Mexico State Highway 550
bridge crossing (Figure 24). At this location two fish were collected, but no beads. The fish were captured on the edge of the mid channel bar (Table 25).
Figure 29: Sampling site #20.
Table 25: Summary of physical features at Site 20.
Month bar type # beads # larval fish ave water depth max depth min depth April mid-channel bar 0 0 0.10 0.20 0.00

31
Site 21 Site 21 is located 25 kilometers downstream from the New Mexico State Highway 550
bridge crossing at the Montaňo Blvd. bridge crossing (Figure 25). Two collection locations exist at this location: a mid channel bar and a braid bar complex that contains both a linguoid bar and a Level 1 braid bar (Table 26). The relatively large mid channel bar formed under the Montaňo Blvd bridge retained beads during both the April and May runs; fish were also collected on this bar. The Level 1 braid bar retained a bead, while at the linguoid bar many larval fish were observed.
Figure 30: Sampling site #21.
Table 26: Summary of physical features at Site 21.
Month bar type # beads # larval fish ave water depth max depth min depth April mid-channel bar 1 0 0.32 0.70 0.00 May mid-channel-bridge 9 0 0.12 0.20 0.05 June linguoid bar 0 33 0.10 0.20 0.05 June L1 braid bar 1 0 0.20 -- --

32
Site 22 Site 22 is located 25.4 kilometers downstream from the New Mexico State Highway 550
bridge crossing (Figure 26). This small island, a mid channel bar, retained beads along its edge during the June flows (the lowest flows sampled) but also appears to be providing edge habitat for larval fish (Table 27). A bead was also found just off the bankline on a linguoid bar.
Figure 31: Sampling site #22.
Table 27: Summary of physical features at Site 22.
Month bar type # beads # larval fish ave water depth max depth min depth June mid-channel bar 4 26 0.19 0.25 0.10 June linguoid bar 1 0 0.25 -- --

33
Site 23 Site 23 is located 26.3 kilometers downstream from the New Mexico State Highway 550
bridge crossing (Figure 23) near the City of Albuquerque’s “drinking water project”. This bar is a mid channel bar and retained beads in both the April and May runs (Table 28), but not in the June run. The retained April bead (and captured fish) were both found near the downstream end of the island, while the June beads were found in the middle of the island.
Figure 32: Sampling site #23.
Table 28: Summary of physical features at Site 23.
Month bar type # beads # larval fish ave water depth max depth min depth April mid-channel bar 1 0 0.10 -- -- May mid-channel bar 19 0 0.22 0.50 0.10

34
Site 24 Site 23 is located 27.9 kilometers downstream from the New Mexico State Highway 550
bridge crossing (Figure 28), just upstream from where I-40 crosses the river. Although this mid channel bar retained beads in both the April and May runs (Table 29), it was dry in the June run. As found at other sites, the beads collected in April were further downstream from the collection locations in May. Also noticeable at this site is that the water level was significantly higher in April than in May.
Figure 33: Sampling site #24.
Table 29: Summary of physical features at Site 24.
Month bar type # beads # larval fish ave water depth max depth min depth April mid-channel bar 3 0 0.59 0.75 0.30 May mid-channel bar 2 0 0.13 0.15 0.10

35
DISCUSSION The variation in bar types capturing beads as a function of flow levels indicates a range of
macro-habitat features that provide nursery habitat. Although both beads and larval fish were collected from each type of bar discussed in this report, some of the bars were more effective. Mid-channel bars and Level 2 braid bars appeared to be better at capturing the drifting gellan beads and presumably the silvery minnow eggs (Table 1); while the bank attached bars appear to be more favored by larval fish. Although the bank attached bars typically were deeper than the other bar types, the difference was not statistically significant (Figure 29). Also noticed, the bank attached bars behaved more like a floodplain, such that water flowed generally in one direction onto the surface with drainage (a slow flowing side channel) developing along the bankline/historic floodplain. Based solely on bar type and surface elevations within the active channel, nursery habitat availability could be quantified with a physical model based on cross section data and river discharge.
Macrohabitat
Attached bar L1 braid bar L2 braid bar Linguoid bar Mid-channel
Dep
th (m
)
0.0
0.2
0.4
0.6
0.8
1.0
1.2
Figure 34: Depth distribution of beads recovered on macro-habitat features.

36
The observed micro-habitat varied significantly with surface characteristics and flow patterns on the bar surfaces. The high occurrence of beads in the shelf habitats (68% of beads) and ranges of depths for shelves suggests that these features provide some of the best conditions for capturing silvery minnow eggs out of the current and retaining them. Relatively few beads were collected in the other micro habitats identified in this study (Table 5). As all of these micro-features tend to have shallow water depths (11-25 cm depth), water depth, although commonly used, does not appear to be the defining physical feature capturing or retaining beads or eggs (Figure 30).
Microhabitat
Bankline Inlet Island LWD Other Shelf Side channel
Dep
th (m
)
0.0
0.2
0.4
0.6
0.8
1.0
1.2
Figure 35: Depth distribution of beads recovered on micro-habitat features.
Unlike the bead data where only one micro habitat appears to be significant, large
numbers of larval fish (Table 5) were found in three micro habitats: inlets (43%), shelf (31%), and side channels (23%). Interestingly, the water depths in the larval fish micro habitat data are noticeably shallower (8-23 cm) than the shelf habitats where beads were collected (26 cm). These data indicate that water depth may be an indicator between habitat differences for egg retention versus larval habitat.
Post-larval fish were mostly collected from inlets, shelves and side channels on the bank
attached bars. These locations coincided with the bead and larval fish data, but were not

37
identical. These results suggest an active shift in habitat selection from areas of passive egg retention to areas with increased food availability or habitat that provides other needs. The floodplain-like habitat found on the bank attached bars should be studied for quantifying food types and densities.
Channel incision, an ongoing process in the Middle Rio Grande (Massong et al. 2006)
has abandoned the historical floodplain and limited the available shallow habitats apparently desirable by the silvery minnow and other small fish species during high flows such as experienced in 2005. Although many of the bars now provide overbank flow surfaces (Tashjian et al. 2006), the amount of flooded area is significantly less today then 50 years ago. Restoration strategies should include either restoring floodplains or creating floodplain-like surfaces that will both retain silvery minnow eggs and provide larval habitat.
The Rio Grande silvery minnow can release 2000-3000 eggs over several hours (Platania
1995), indicative of a high reproductive potential (r-selected). Porter and Massong (2004b) suggested that habitat degradation limited the availability of suitable areas for hatching and rearing larval silvery minnows. This reduction in floodplain habitat availability resulting from channel incision and below average spring flows has contributed to poor recruitment. The above average spring runoff in 2005 provided good habitat for rearing silvery minnows as mid channel bars (a.k.a., islands) and bank attached bars (acting as a floodplain) were inundated for several weeks. The benchmark October 2005 population monitoring surveys (Dudley et al. 2005a, 2005b) found a 50-fold increase in the number of silvery minnows from October 2004. These observations support the larval fish habitat concept as a limiting factor influencing silvery minnow populations.
The egg drift hypothesis describes how transport of silvery minnow eggs and larvae are
carried long distances downstream before the young can move into suitable rearing areas. Drift of silvery minnow offspring has been estimated at 72-150 km prior to hatching with protolarvae drifting an additional 216 km before escaping the current (Platania 1995). The egg retention hypothesis suggests that silvery minnow eggs are passively retained from the current onto suitable nursery habitat areas where the hatched larvae grow prior to returning to the river. The availability of nursery habitat appears to be determined by spring runoff with higher flows inundating terrestrial surface used as nursery areas (Porter and Massong 2004a). Habitat degradation of nursery areas results from channel incision (Porter and Massong 2004b).
Field studies examining spawning periodicity (Platania and Dudley 2005) had maximum
daily catch rates ranging from 0.09 to 14,222 eggs per 100 m3. The highest catch rate occurred in 2002 during a 500 cfs spike flow (at San Marcial gage). Similar flows in 2003 produced a maximum catch rate of 476 eggs per 100 m3. The October benchmark silvery minnow population surveys in 2002 and 2003 decreased from the previous year (Dudley et al. 2003, 2004). The lowest maximum catch rate (0.09 eggs per 100 m3) occurred during flows of 1500 cfs at San Marcial and was followed with an increased silvery minnow population in October 2004 (Dudley et al. 2005a).
There are three probable factors influencing the catch rate of eggs: silvery minnow
populations, dilution factor (eggs per volume of water) and egg retention. The silvery minnow

38
population has been declining from 1995 through 2003; seeing significant increases in 2004 and 2005. The highest catch rate (2002) occurred during a relatively small flow (500 cfs) with a low dilution and potential for egg retention. The lowest catch rate (2004) occurred during a moderate flow (1500 cfs) with moderate dilution and potential egg retention on inundated surfaces. The increased population in October 2004 provides data supporting the role of floodplain habitat for recruitment. The October 2005 surveys had a 50-fold population increase following a high spring runoff. These patterns suggest that egg drift below the flow threshold for inundating pointbars and islands results in massive downstream transport of silvery minnow eggs and larvae, reducing survival and recruitment. As flows increase the time and area of inundated terrestrial surfaces, egg drift decreases and egg retention increases with corresponding survival and recruitment.
ACKNOWLEDGMENTS This research was funded by the U.S. Bureau of Reclamation Science and Technology Program (2003-2005), U.S. Bureau of Reclamation Albuquerque Area Office, and the New Mexico Interstate Stream Commission. We appreciate the cooperation of the Middle Rio Grande Conservancy District, Sandia Pueblo, and City of Albuquerque Open Space Division in providing access to the study area. B. McAlpine, L. Curry, B. Hines, K. Hilwig, K. Bonafantine, J. Fluder, P. McKnight, S. Shoup, R. Young, P. Wilkinson, G. Dean, C. Fischer, S. Bulgrin, and W. Ford provided invaluable assistance in collecting field data. J. Fluder provided logistical support and B. McAlpine produced map layers for spatial analysis. Additional data used in the analyses were provided through projects funded through the Middle Rio Grande Endangered Species Act Collaborative Program.
LITERATURE CITED Bestgen, K. R. and S. P. Platania. 1991. Status and conservation of the Rio Grande silvery
minnow, Hybognathus amarus. Southwestern Naturalist 36(2): 225-232.
Coutant, C.C. 2004. A riparian hypothesis for successful reproduction of white sturgeon. Reviews in Fisheries Science 12:23-73.
Cowley, D.E., J. Alleman, R.R. McShane, P.D. Shirey, R. Sallenave 2005. Effects of Salinity and Suspended Sediment on Physical Properties of the Egg of the Rio Grande Silvery Minnow (Hybognathus amarus). WRRI Technical Completion Report No. 334, New Mexico Water Resources Research Institute, 19 pp.
Davin, W.T., C. Ethridge, C. Babb, and S. Hileman 1999. Estimation of Striped Bass (Morone saxatilis) egg drift rate in the lower Savannah River. Final report to the U.S. Army Corps of Engineers, Savannah District. 69 pgs.
Dudley R.K., S.J. Gottlieb , and S.P. Platania, 2003. Rio Grande Silvery Minnow Population Monitoring Program Results from 2002. Report to the Middle Rio Grande Endangered Species Act Collaborative Program. 179 pp.

39
Dudley R.K., S.P. Platania, S.J. Gottlieb 2004. Rio Grande Silvery Minnow Population Monitoring Program Results from 2003. Report to the Middle Rio Grande Endangered Species Act Collaborative Program. 176 pp.
Dudley R.K., S.P. Platania, S.J. Gottlieb 2005a. Rio Grande Silvery Minnow Population Monitoring Program Results from 2004. Report to the Middle Rio Grande Endangered Species Act Collaborative Program. 193 pp.
Dudley R.K., S.P. Platania, S.J. Gottlieb 2005b. Summary of the Rio Grande Silvery Minnow Population Monitoring Program Results from October 2005. Trip Report to the Middle Rio Grande Endangered Species Act Collaborative Program. 30 pp.
Massong, T., P. Tashjian, and P. Makar. 2006. Recent Channel Incision and Floodplain Evolution within the Middle Rio Grande, NM. Joint 8th Federal Interagency Sedimentation Conference and 3rd Federal Interagency Hydrologic Modeling Conference, Reno, NV.
MEI, 2005. Evaluation of Bar Morphology, Distribution and Dynamics as Indices of Fluvial Processes in the Middle Rio Grande, New Mexico, prepared for the New Mexico Interstate Stream Commission (MEI Project No. 04-07), Draft Report, November 2005.
Pease, A.A. 2004. An Assessment of Critical Nursery Habitat Features for Larval and Juvenile Fishes in the Middle Rio Grande, New Mexico. M.S. Thesis, University of New Mexico, Albuquerque, N.M. 34 pp.
Platania, S.P. 1995. Reproductive biology and early life history of Rio Grande silvery minnow Hybognatus amarus. Report to the US Army Corps of Engineers, 29 pp.
Platania, S.P. and R.K. Dudley, 2005. Spawning Periodicity of Rio Grande Silvery Minnow during 2004. A Report to the Middle Rio Grande Endangered Species Act Collaborative Program. 33 pgs.
Porter, M.D. and T.M. Massong. 2004a. Progress Report on Rio Grande Silvery Minnow Egg Habitat Study - FY 2003. September 30, 2003. 11 pp.
Porter, M.D. and T.M. Massong 2004b. Analyzing changing river channel morphology using GIS for Rio Grande Silvery Minnow habitat assessment. In Proceedings of the Second International Symposium on GIS/Spatial Analysis in Fishery and Aquatic Sciences, 3-6 September, 2002, University of Sussex, Brighton, U.K. Nishida, T., Kailola, P.J., Hollingworth, C.E. (Editors): 433-448.
Reinert, T.R., T. A. Will, C.A. Jennings, and W.T. Davin. 2004. Use of Egg Surrogates to Estimate Sampling Efficiency of Striped Bass Eggs in the Savannah River. North American Journal of Fisheries Management 24:704–710.
Tashjian, P., T. Massong, and P. Makar. 2006. The Implications of Recent Floodplain Evolution on Habitat. Joint 8th Federal Interagency Sedimentation Conference and 3rd Federal Interagency Hydrologic Modeling Conference, Reno, Nevada.
U.S. Department of the Interior. 1994. Endangered and Threatened Wildlife and Plants; Final rule to list the Rio Grande silvery minnow as an Endangered Species. Federal Register 59: 36988-36995.