report card on new brunswick’s anglophone high schools · pdf filethe fraser...
TRANSCRIPT
OCTOBER 2004
Report Card on New Brunswick’s
Anglophone High Schools
2004 Edition
Peter Cowley, Stephen Easton, and Darlene Savoy
Contents
Introduction .......................................................................................................3
Key academic indicators of school performance ................................................................5
Notes ..............................................................................................................8
Detailed school results ............................................................................................8
Ranking the schools .............................................................................................13
Appendix: Calculating the Overall rating out of 10 ..........................................................15
About the authors and Acknowledgments .....................................................................17
Studies in Education Policy are published periodically throughout the year by The Fraser Institute, Vancouver, British Columbia, Canada.
The Fraser Institute is an independent Canadian economic and social research and educational organization. It has asits objective the redirection of public attention to the role of competitive markets in providing for the well-being ofCanadians. Where markets work, the Institute’s interest lies in trying to discover prospects for improvement. Wheremarkets do not work, its interest lies in finding the reasons. Where competitive markets have been replaced bygovernment control, the interest of the Institute lies in documenting objectively the nature of the improvement ordeterioration resulting from government intervention. The work of the Institute is assisted by an Editorial AdvisoryBoard of internationally renowned economists. The Fraser Institute is a national, federally chartered non-profitorganization financed by the sale of its publications and the tax-deductible contributions of its members, foundations,and other supporters; it receives no government funding.
To order additional copies of Studies in Education Policy, any of our other publications, or a catalogue of theInstitute’s publications, please contact the publications coordinator via our toll-free order line: 1.800.665.3558, ext.580; via telephone: 604.688.0221, ext. 580; via fax: 604.688.8539; via e-mail: [email protected].
For media enquiries, please contact Suzanne Walters, Director of Communications via telephone: 604.714.4582; viae-mail: [email protected]
To learn more about the Institute, please visit our web site at www.fraserinstitute.ca.
Copyright© 2004 The Fraser Institute. All rights reserved. No part of this book may be reproduced in any mannerwhatsoever without written permission except in the case of brief quotations embodied in critical articles and reviews.
The authors of this study have worked independently and opinions expressed by them are, therefore, their own, anddo not necessarily reflect the opinions of the members or trustees of The Fraser Institute.
Editing and design: Kristin McCahon and Lindsey Thomas MartinTypesetting by Nick Murphy
Printed and bound in Canada.ISSN 1492–1863 Studies in Education Policy (English print edition).ISSN 1707–2395 Studies in Education Policy (English online edition).
Date of issue: October 2004
The Fraser Institute, Fourth Floor, 1770 Burrard Street, Vancouver, BC, V6J 3G7
For information about membership, please contact the Development Department: in Vancouver
• via telephone: 604.688.0221 ext. 586; via fax: 604.688.8539• via e-mail: [email protected]
in Calgary• via telephone: 403.216.7175 or, toll-free 1.866.716.7175; • via fax: 403.234.9010; via e-mail: [email protected].
in Toronto• via telephone: 416.363.6575; • via fax: 416.934.1639.
2
The Report Card on New Brunswick’s Anglophone High
Schools collects a variety of relevant, objective indi-cators of school performance into one easily accessi-ble, public document so that all interested parties—parents, school administrators, teachers, students,and taxpayers—can analyze and compare the per-formance of individual schools. Parents can use theReport Card’s indicator values, ratings, and rankingsto compare schools when they choose an educationprovider for their children. Parents and school admin-istrators can use the results to identify areas of aca-demic performance in which improvement can bemade.
The Fraser Institute’s report cards are now wellestablished in Canada. In the United States, thedepartments of education in virtually all the statespublish annual report cards on schools—for all schoollevels—many of which are not dissimilar to theInstitute’s series. In the United Kingdom, the nation-al Department for Education and Skills publishes awide variety of data on school performance.
Report cards on schools are becoming common-place. But, are they effective? Certainly, anecdotalevidence provided to the authors by parents andschool administrators confirm their usefulness.Further, research suggests that real gains in schoolperformance can result from their introduction. Inan article published in 2001, Caroline Hoxby, aHarvard professor of Economics well known for herwork related to education, showed that students inAmerican states that published report cards experi-enced faster improvement in their scores on theNational Assessment of Educational Progress(NAEP) than did students in states that did not pub-lish report cards. Hoxby concludes, “Statewide stan-dardized tests and school report cards may be unpleas-
ant for ineffectual educators, but they should not becontroversial with parents or policy makers who wantto see higher achievement. Schools conduct them-selves better when their constituents are informed.”1
We are also encouraged by recent research2 sug-gesting that annual report cards on schools are par-ticularly effective in reducing the gap in academicachievement between groups of students. The FraserInstitute began reporting achievement gaps in 2000with the introduction of the gender-gap indicators.Early in 2004, the Institute published a Report Cardon Aboriginal Education in British Columbia3 in orderto draw public attention to the chronically poor aca-demic achievement of that student group.
The Report Card helpsparents choose
Where parents can choose among several schools fortheir children, the Report Card provides a valuabletool for making a decision. Because it makes com-parisons easy, the Report Card alerts parents to thosenearby schools that appear to have more effectiveacademic programs. Parents can also determinewhether or not schools of interest are improving overtime. By first studying the Report Card, parents willbe better prepared to ask relevant questions whenthey interview the principal and teachers at theschools under consideration.
Of course, the choice of a school should not bemade solely on the basis of any one source of infor-mation. Families choosing a school for their studentsshould seek to confirm the Report Card’s findings byvisiting the school and interviewing teachers andschool administrators. In addition, a sound academic
3
Introduction
program should be complemented by effective pro-grams in areas of school activity not measured by theReport Card. Nevertheless, the Report Card provides adetailed picture of each school that is not easily avail-able elsewhere.
The Report Card encouragesschools to improve
Certainly, the act of publicly rating and rankingschools attracts attention. This attention can provideboth a carrot and a stick. Schools that perform wellor show consistent improvement are applauded.Poorly performing schools generate concern as dothose whose performance is deteriorating. Thisinevitable attention provides an incentive for all thoseconnected with a school to focus on student results.
However, the Report Card offers more than justincentive. It includes a variety of indicators, each ofwhich reports results for an aspect of school per-formance that might be improved. School adminis-trators who are dedicated to improvement use theReport Card as a source of information about oppor-tunities for improving their schools.
Some schools do better than othersTo improve a school, one must believe that improve-ment is achievable. This Report Card provides evi-dence about what can be accomplished. It demon-strates clearly that, even when we take into accountfactors such as the students’ family backgrounds,which some believe dictate the degree of academicsuccess that students will have in school, someschools do better than others. This finding confirmsthe results of research carried out in other countries.4
Indeed, it will come as no great surprise to experi-enced parents and educators that the data consis-tently suggest that what goes on in the schools makesa difference to academic results and that some schoolsmake more of a difference than others.
Comparisons are at the heart of the improvement processComparative and historical data enable parents andschool administrators to gauge their school’s effec-tiveness more accurately. By comparing a school’slatest results with those of earlier years, they can seeif the school is improving. By comparing a school’sresults with those of neighbouring schools or ofschools where the characteristics of the school and thestudent body are similar, they can identify more suc-cessful schools and learn from them. Reference tooverall provincial results places an individual school’slevel of achievement in a broader context.
There is great benefit in identifying schools thatare particularly effective. By studying the techniquesused in schools where students are successful, lesseffective schools may find ways to improve. Thisadvantage is not lost on the United Kingdom’sDepartment of Education and Skills. Its “BeaconSchools” program5 identifies schools across the coun-try that have demonstrated expertise in a wide vari-ety of challenging aspects of the management ofschools and the teaching and counselling of their stu-dents. The administrators at these Beacon Schoolsare committed to helping other schools improve.
Comparisons are at the heart of improvement:making comparisons among schools is made simplerand more meaningful by the Report Card’s indicators,ratings, and rankings.
You can contribute to theReport Card’s development
This Report Card, like those for schools in otherprovinces will be regularly improved in content anddesign. Improvements are often suggested by the com-ments and criticism provided to us by readers. Wewelcome your suggestions, comments, and criticisms.Please such direct correspondence via e-mail to:[email protected].
Report Card on New Brunswick’s Anglophone High Schools — 2004 Edition4

5
The foundation of the Report Card is an overall rat-ing of each school’s academic performance. Buildingon data about student results provided by NewBrunswick’s Department of Education, we rate eachschool on a scale from zero to 10. We base our over-all rating of each school’s academic performance onsix indicators:
1 average provincial examination mark ingrade-11 English (all levels);
2 average provincial examination mark ingrade-11 Mathematics (all levels);
3 percentage of provincial examinations (ingrade-11 English and grade-11 Mathematics)failed;
4 difference between the school mark andprovincial examination mark in these samecourses;
5 difference between male and femalestudents in the value of indicator (1) forgrade-11 English only; and,
6 difference between male and femalestudents in the value of indicator (2) forgrade-11 Mathematics only.
We have selected this set of indicators because theyprovide systematic insight into a school’s perform-ance. Because they are based on annually generateddata, we can assess not only each school’s perform-ance in a year but also its improvement or deterio-ration over time.
Three indicators ofeffective teaching
1 Average provincial examination marksThese indicators (in the tables Average exam mark –English and Average exam mark – Math) is the aver-age percentage achieved by a school’s students onthe uniform final examinations in all levels of grade-11 English and grade-11 Mathematics. For eachschool, the indicator is the average of the scoresachieved by the school’s students in all levels of thetwo courses at all sittings during the year.
Examinations are designed to achieve a distri-bution of results reflecting the differences in stu-dents’ mastery of the course work. Differencesamong students in interests, abilities, motivation,and work-habits will inevitably have some impactupon the final results. There are, however, recog-nizable differences from school to school within adistrict in the average results on the provincialexaminations. There is also variation withinschools in the results obtained in different subjectareas. Such differences in outcomes cannot bewholly explained by the individual and familycharacteristics of the school’s students. It seemsreasonable, therefore, to include the average exam-ination mark for each school as one indicator ofeffective teaching.
2 Percentage of provincialexaminations failed
For each school, this indicator (in the tables Percentageof exams failed) provides the rate of failure (as a per-centage) in the provincial examinations in all levelsof grade-11 English and grade-11 Mathematics. It was
Key academic indicatorsof school performance
derived by dividing the sum, for each school, of allthese examinations written where a failing grade wasawarded by the total number of such examinationswritten by the students of that school.
In part, effective teaching can be measured bythe ability of the students to pass any uniform exam-ination that is a requirement for successful comple-tion of a course. Schools have the responsibility ofpreparing their students to pass these final exami-nations. For this reason, it seems reasonable to usethe percentage of examinations failed in these cours-es as an additional indicator of the effectiveness ofthe teaching in high schools.
3 Difference between school mark andexamination mark
For each school, this indicator (in the tables Schoolvs exam mark difference) gives the absolute valueof the difference between the average markobtained on the provincial examinations and theaverage “school” mark—the accumulation of allthe results from tests, essays, quizzes, and so ongiven in class—for all levels of grade-11 Englishand grade-11 Mathematics.6
Effective teaching includes regular testing sothat students may be aware of their progress. Forsuch assessment to be useful, it must accuratelyreflect the student’s understanding of the course.As a systematic policy, inflation of school-award-ed grades will be counterproductive. Students whobelieve they are already successful when they arenot will be less likely to invest the extra effortneeded to master the course material. In the end,they will be poorer for not having achieved thelevel of understanding that they could have gainedthrough additional study. On the other hand, thesystematic deflation of grades can work to thedetriment of students in those situations wherepost-secondary admissions and scholarship awardsare, in part, based on school assessments. Studentsmay also lose interest in a subject when their actu-al understanding of the material is disparaged byinadequate recognition.
The effectiveness of school-based assessments
can be determined by a comparison to externalassessments of the students. In courses that includea provincial examination, the Department ofEducation, the same authority that designed thecourse, administers a uniform examination that willtest the students’ knowledge of the material con-tained in the course. If the marks assigned by theschool are a reasonably accurate reflection of stu-dents’ understanding, they should be roughly thesame as the mark gained on the provincial exami-nation. Thus, if a school has accurately assessed astudent as consistently working at a C+ level, thestudent’s examination result will be at a similarlevel. If, however, a school is consistently grantingmarks substantially different from those achieved byits students on the final examinations, then theschool is not providing an accurate indicator of theextent to which students are learning the coursematerial.
Two indicators of consistency inteaching and assessment
The Gender gap indicatorsResearch7 has shown systematic sex-based differencesin academic results in Canadian secondary schools.These differences are particularly apparent where thelocal school rather than the ministry of educationmakes assessments. However, the same research foundthat “there appears to be no compelling evidencethat girls and boys should, given effective teaching andcounselling, experience differential rates of success.”8
Further, “[t]he differences described by each indica-tor vary from school to school over a considerablerange of values.”9
The Gender gap indicators measure the difference,if any, in the average examination marks for grade-11 English and grade-11 Mathematics achieved byboys and girls at the school. The indicators reportthe size of the difference and the more successful sex.Schools experiencing high gender gaps should inves-tigate classroom practice to determine why one sexreceives better grades than the other.
Report Card on New Brunswick’s Anglophone High Schools — 2004 Edition6
In general, how is the schooldoing academically? The Overall rating out of 10
While each of the indicators is important, it is almostalways the case that a school does better on some indi-cators than on others. So, just as a teacher must makea decision about a student’s overall performance, weneed an overall indicator of school performance (inthe tables Overall rating out of 10). Just as teacherscombine test scores, homework, and class participa-tion to rate a student, we have combined all the indi-cators to produce an overall school rating. The over-all rating of school performance answers the question,“In general, how is the school doing, academically?”
To derive this rating, the results for each of the
indicators, for each school year were first standard-ized. Standardization is a statistical procedure where-by sets of raw data with different characteristics areconverted into sets of values with “standard” statis-tical properties. Standardized values can readily becombined and compared.
The standardized data were then combined asrequired to produce six standardized scores—one foreach indicator—for each school, for each year. Thestandardized scores were weighted and combined toproduce an overall standardized score. Finally, thisscore was converted into an overall rating out of 10.It is from this Overall rating out of 10 that the school’sprovincial rank is determined. (See the Appendixfor a description of the calculation of the Overallrating out of 10.)
Fraser Institute Studies in Educational Policy 7
8
1 Caroline Hoxby, Testing Is about Openness and
Openness Works (Hoover Institution, July 30,2001), <http://www-hoover.stanford.edu/ pubaffairs/we/current/hoxby_0701.html> (as of August 6, 2004).
2 Eric A. Hanushek and Margaret E. Raymond,The Effect of School Accountability Systems on the
Level and Distribution of Student Achievement,<http://edpro.stanford.edu/eah/papers/equity.jeea.nov03.pdf> (as of August 6, 2004).
3 Peter Cowley and Stephen Easton, Report Card
on Aboriginal Education in British Columbia, Studiesin Education Policy (Vancouver, BC: TheFraser Institute, 2004).
4 See, for instance, Michael Rutter et al., Fifteen
Thousand Hours: Secondary Schools and Their Effects
on Children (Cambridge, MA: HarvardUniversity Press, 1979); Peter Mortimore et al.,School Matters: The Junior Years (Wells, Somerset:Open Books, 1988); and Laura Lein et al., Hope
for Urban Education: A Study of Nine High-
Performing, High-Poverty Urban Elementary Schools
(STAR Center at the Charles A. Dana Center,
University of Texas at Austin, 1999),<http://www.ed.gov/pubs/urbanhope/index.html> (as of August 6, 2004).
5 See the Beacon Schools program site at<http://www.standards.dfee.gov.uk/ beaconschools/> (as of August 6, 2004).
6 A student’s final mark for a course is derivedfrom both the mark received on the course’s uni-form provincial examination and a mark provid-ed by the school. The final mark is a weightedaverage of the examination mark and the schoolmark. Weightings vary from course to course.
7 Peter Cowley and Stephen Easton, Boys, Girls,and Grades: Academic Gender Balance in BritishColumbia’s Secondary Schools, Public PolicySources 22 (Vancouver, BC: The FraserInstitute, 1999).
8 Cowley and Easton, Boys, Girls, and Grades:page 7.
9 Cowley and Easton, Boys, Girls, and Grades:page 17.
Notes
Detailed school reports
9
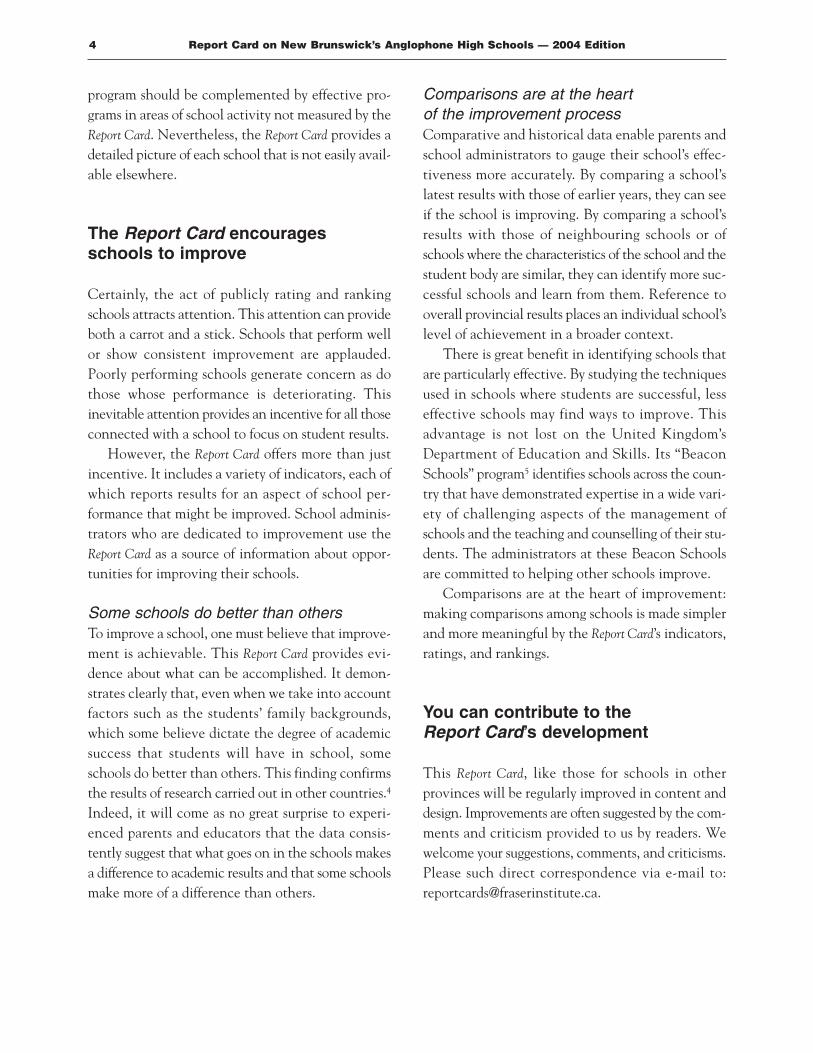
How to read these tables
Use the sample table and the explanation of eachline below to help you interpret the detailed resultsfor individual schools. Families choosing a school fortheir students should seek to confirm the Report Card’sfindings by visiting the school and interviewingteachers, school administrators, and other parents.And, of course, a sound academic program should becomplemented by effective programs in areas ofschool activity not measured by the Report Card.
More information regarding schools may be foundon the Department of Education’s web site at<http://www.gnb.ca/0000/pub_alpha-e.asp>.
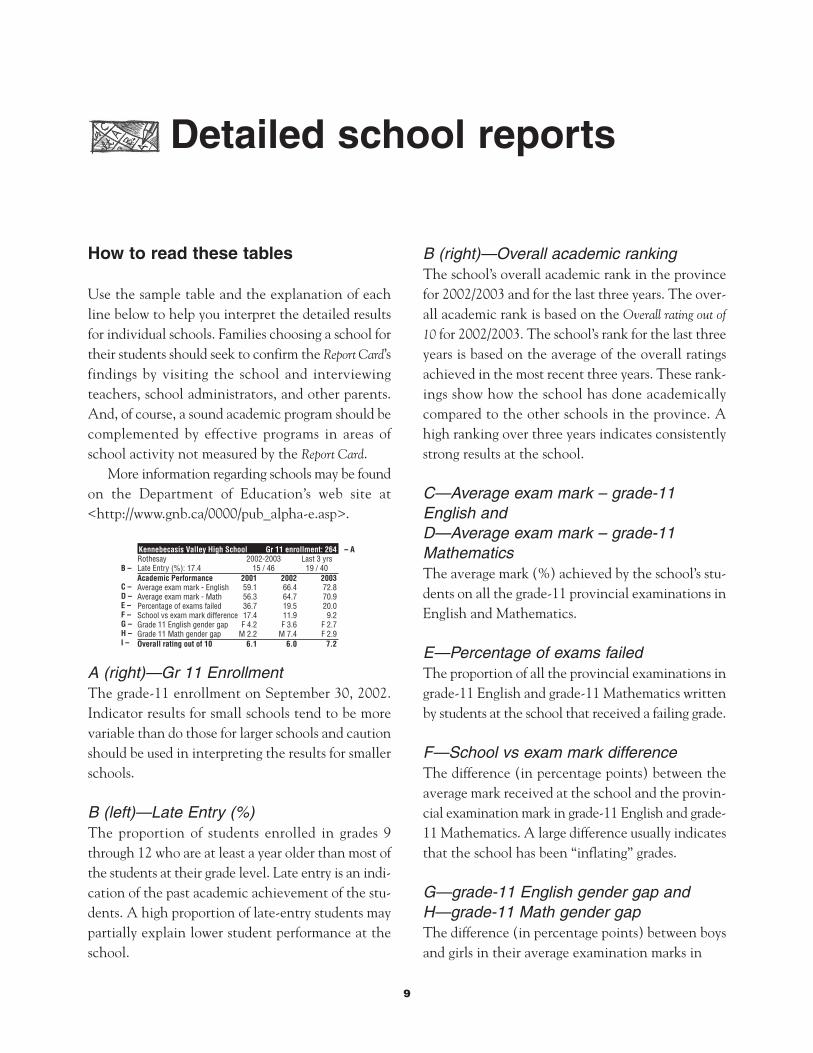
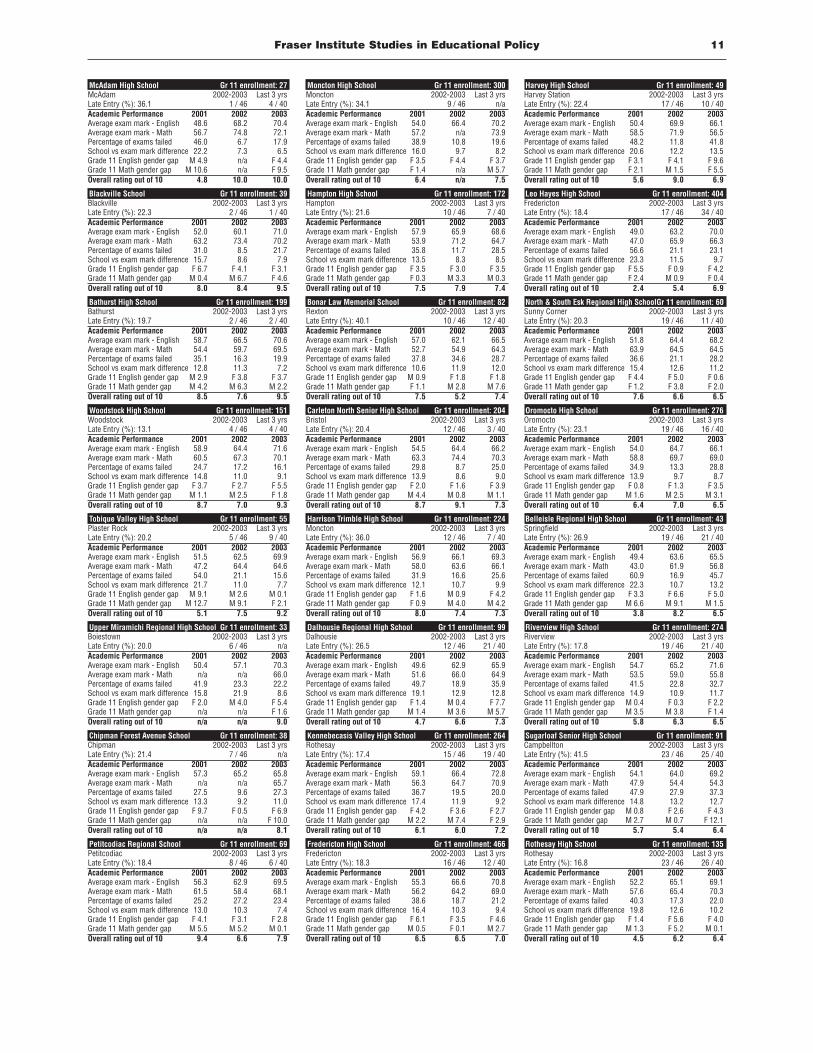
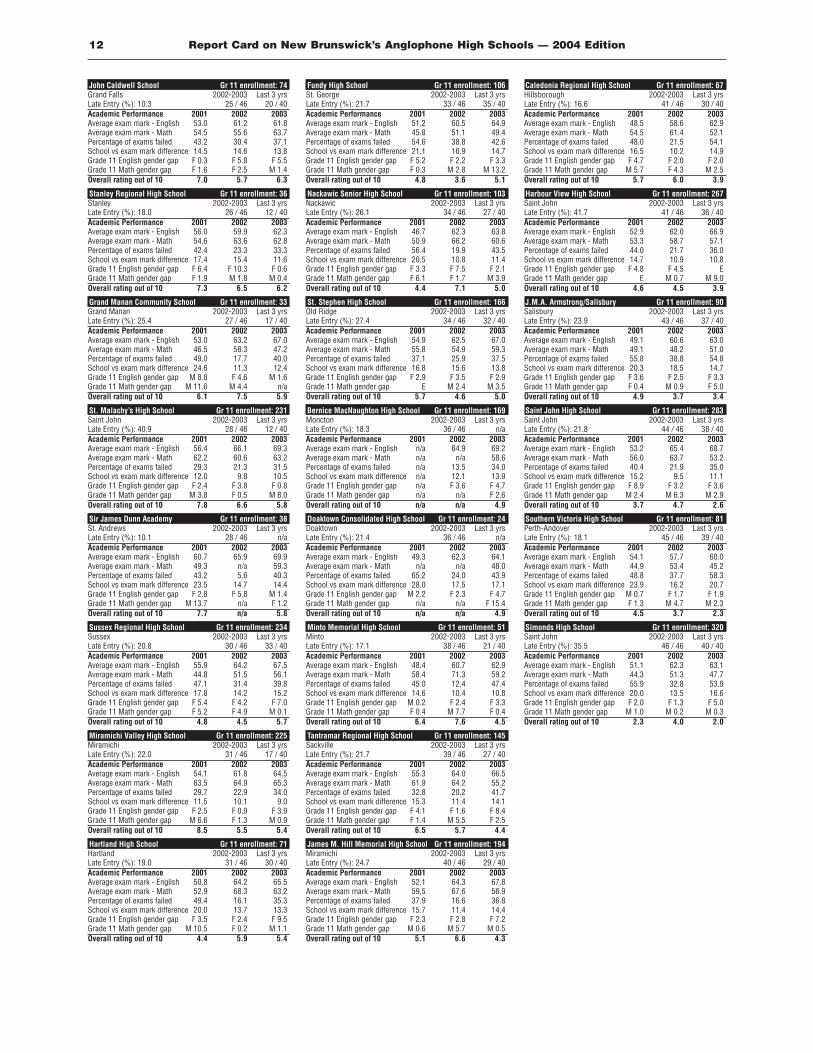
A (right)—Gr 11 EnrollmentThe grade-11 enrollment on September 30, 2002.Indicator results for small schools tend to be morevariable than do those for larger schools and cautionshould be used in interpreting the results for smallerschools.
B (left)—Late Entry (%)The proportion of students enrolled in grades 9through 12 who are at least a year older than most ofthe students at their grade level. Late entry is an indi-cation of the past academic achievement of the stu-dents. A high proportion of late-entry students maypartially explain lower student performance at theschool.
B (right)—Overall academic rankingThe school’s overall academic rank in the provincefor 2002/2003 and for the last three years. The over-all academic rank is based on the Overall rating out of
10 for 2002/2003. The school’s rank for the last threeyears is based on the average of the overall ratingsachieved in the most recent three years. These rank-ings show how the school has done academicallycompared to the other schools in the province. Ahigh ranking over three years indicates consistentlystrong results at the school.
C—Average exam mark – grade-11English andD—Average exam mark – grade-11MathematicsThe average mark (%) achieved by the school’s stu-dents on all the grade-11 provincial examinations inEnglish and Mathematics.
E—Percentage of exams failedThe proportion of all the provincial examinations ingrade-11 English and grade-11 Mathematics writtenby students at the school that received a failing grade.
F—School vs exam mark differenceThe difference (in percentage points) between theaverage mark received at the school and the provin-cial examination mark in grade-11 English and grade-11 Mathematics. A large difference usually indicatesthat the school has been “inflating” grades.
G—grade-11 English gender gap and H—grade-11 Math gender gapThe difference (in percentage points) between boysand girls in their average examination marks in
B –
C –D –E –F –G –H –I –
Kennebecasis Valley High School Gr 11 enrollment: 264Rothesay 2002-2003 Last 3 yrsLate Entry (%): 17.4 15 / 46 19 / 40Academic Performance 2001 2002 2003Average exam mark - English 59.1 66.4 72.8Average exam mark - Math 56.3 64.7 70.9Percentage of exams failed 36.7 19.5 20.0School vs exam mark difference 17.4 11.9 9.2Grade 11 English gender gap F 4.2 F 3.6 F 2.7Grade 11 Math gender gap M 2.2 M 7.4 F 2.9Overall rating out of 10 6.1 6.0 7.2
– A

Report Card on New Brunswick’s Anglophone High Schools — 2004 Edition10
grade-11 English and grade-11 Mathematics. Wherethe difference favours girls, the value is preceded byan F; where the difference favours boys, the value ispreceded by an M. An E means that there is no dif-ference between the girls and the boys on this meas-ure. Small differences indicate that the school is doinga good job for all its students.
I—Overall rating out of 10The Overall rating out of 10 takes into account theschool’s performance on all of these indicators toanswer the question, “In general, how is the schooldoing academically?”
Other notes
Note 1Not all the province’s high schools are included inthe tables or the ranking. Excluded are schools atwhich fewer than 15 students were enrolled in grade11 and schools that did not generate a sufficientlylarge set of student data to enable the calculation ofan Overall rating out of 10.
The exclusion of a school from the Report Cardshould in no way be construed as a judgement of theschool’s effectiveness.
Note 2Where there were insufficient data available withwhich to calculate an indicator or where a schoolwas not in operation during a specific year, “n/a”appears in the tables.
Note 3You can compare a school’s results with these all-schools results.
• Note: These results reflect the average size of thegender gaps. In 2002/2003, the English gender gapfavoured females at 91.5% of schools, males at 6.4%of schools, and was even at 2.1% of schools. TheMath gender gap favoured males at 60.0% of schools,and females at 40.0% of schools.
Note 4If you have questions about the Report Card, contactPeter Cowley at The Fraser Institute at 604.714.4556or by e-mail at [email protected].
Average values for all schools 2002/2003Gr 11 enrollment: 144
Late Entry (%): 23.2Academic Performance 2001 2002 2003Average exam mark - English 53.5 63.2 67.3Average exam mark - Math 54.8 62.3 61.3Percentage of exams failed 41.8 21.1 33.0School vs exam mark difference 17.1 12.2 11.6Grade 11 English gender gap * 3.7 3.3 3.9Grade 11 Math gender gap * 3.6 4.0 3.7Overall rating out of 10 6.2 6.2 6.2
Fraser Institute Studies in Educational Policy 11
McAdam High School Gr 11 enrollment: 27McAdam 2002-2003 Last 3 yrsLate Entry (%): 36.1 1 / 46 4 / 40Academic Performance 2001 2002 2003Average exam mark - English 48.6 68.2 70.4Average exam mark - Math 56.7 74.8 72.1Percentage of exams failed 46.0 6.7 17.9School vs exam mark difference 22.2 7.3 6.5Grade 11 English gender gap M 4.9 n/a F 4.4Grade 11 Math gender gap M 10.6 n/a F 9.5Overall rating out of 10 4.8 10.0 10.0
Blackville School Gr 11 enrollment: 39Blackville 2002-2003 Last 3 yrsLate Entry (%): 22.3 2 / 46 1 / 40Academic Performance 2001 2002 2003Average exam mark - English 52.0 60.1 71.0Average exam mark - Math 63.2 73.4 70.2Percentage of exams failed 31.0 8.5 21.7School vs exam mark difference 15.7 8.6 7.9Grade 11 English gender gap F 6.7 F 4.1 F 3.1Grade 11 Math gender gap M 0.4 M 6.7 F 4.6Overall rating out of 10 8.0 8.4 9.5
Bathurst High School Gr 11 enrollment: 199Bathurst 2002-2003 Last 3 yrsLate Entry (%): 19.7 2 / 46 2 / 40Academic Performance 2001 2002 2003Average exam mark - English 58.7 66.5 70.6Average exam mark - Math 54.4 59.7 69.5Percentage of exams failed 35.1 16.3 19.9School vs exam mark difference 12.8 11.3 7.2Grade 11 English gender gap M 2.9 F 3.8 F 3.7Grade 11 Math gender gap M 4.2 M 6.3 M 2.2Overall rating out of 10 8.5 7.6 9.5
Woodstock High School Gr 11 enrollment: 151Woodstock 2002-2003 Last 3 yrsLate Entry (%): 13.1 4 / 46 4 / 40Academic Performance 2001 2002 2003Average exam mark - English 58.9 64.4 71.6Average exam mark - Math 60.5 67.3 70.1Percentage of exams failed 24.7 17.2 16.1School vs exam mark difference 14.8 11.0 9.1Grade 11 English gender gap F 3.7 F 2.7 F 5.5Grade 11 Math gender gap M 1.1 M 2.5 F 1.8Overall rating out of 10 8.7 7.0 9.3
Tobique Valley High School Gr 11 enrollment: 55Plaster Rock 2002-2003 Last 3 yrsLate Entry (%): 20.2 5 / 46 9 / 40Academic Performance 2001 2002 2003Average exam mark - English 51.5 62.5 69.9Average exam mark - Math 47.2 64.4 64.6Percentage of exams failed 54.0 21.1 15.6School vs exam mark difference 21.7 11.0 7.7Grade 11 English gender gap M 9.1 M 2.6 M 0.1Grade 11 Math gender gap M 12.7 M 9.1 F 2.1Overall rating out of 10 5.1 7.5 9.2
Upper Miramichi Regional High School Gr 11 enrollment: 33Boiestown 2002-2003 Last 3 yrsLate Entry (%): 20.0 6 / 46 n/aAcademic Performance 2001 2002 2003Average exam mark - English 50.4 57.1 70.3Average exam mark - Math n/a n/a 66.0Percentage of exams failed 41.9 23.3 22.2School vs exam mark difference 15.8 21.9 8.6Grade 11 English gender gap F 2.0 M 4.0 F 5.4Grade 11 Math gender gap n/a n/a F 1.6Overall rating out of 10 n/a n/a 9.0
Chipman Forest Avenue School Gr 11 enrollment: 38Chipman 2002-2003 Last 3 yrsLate Entry (%): 21.4 7 / 46 n/aAcademic Performance 2001 2002 2003Average exam mark - English 57.3 65.2 65.8Average exam mark - Math n/a n/a 65.7Percentage of exams failed 27.5 9.6 27.3School vs exam mark difference 13.3 9.2 11.0Grade 11 English gender gap F 9.7 F 0.5 F 6.9Grade 11 Math gender gap n/a n/a F 10.0Overall rating out of 10 n/a n/a 8.1
Petitcodiac Regional School Gr 11 enrollment: 69Petitcodiac 2002-2003 Last 3 yrsLate Entry (%): 18.4 8 / 46 6 / 40Academic Performance 2001 2002 2003Average exam mark - English 56.3 62.9 69.5Average exam mark - Math 61.5 58.4 68.1Percentage of exams failed 25.2 27.2 23.4School vs exam mark difference 13.0 10.3 7.4Grade 11 English gender gap F 4.1 F 3.1 F 2.8Grade 11 Math gender gap M 5.5 M 5.2 M 0.1Overall rating out of 10 9.4 6.6 7.9
Moncton High School Gr 11 enrollment: 300Moncton 2002-2003 Last 3 yrsLate Entry (%): 34.1 9 / 46 n/aAcademic Performance 2001 2002 2003Average exam mark - English 54.0 66.4 70.2Average exam mark - Math 57.2 n/a 73.9Percentage of exams failed 38.9 10.8 19.6School vs exam mark difference 16.0 9.7 8.2Grade 11 English gender gap F 3.5 F 4.4 F 3.7Grade 11 Math gender gap F 1.4 n/a M 5.7Overall rating out of 10 6.4 n/a 7.5
Hampton High School Gr 11 enrollment: 172Hampton 2002-2003 Last 3 yrsLate Entry (%): 21.6 10 / 46 7 / 40Academic Performance 2001 2002 2003Average exam mark - English 57.9 65.9 68.6Average exam mark - Math 53.9 71.2 64.7Percentage of exams failed 35.8 11.7 28.5School vs exam mark difference 13.5 8.3 8.5Grade 11 English gender gap F 3.5 F 3.0 F 3.5Grade 11 Math gender gap F 0.3 M 3.3 M 0.3Overall rating out of 10 7.5 7.9 7.4
Bonar Law Memorial School Gr 11 enrollment: 82Rexton 2002-2003 Last 3 yrsLate Entry (%): 40.1 10 / 46 12 / 40Academic Performance 2001 2002 2003Average exam mark - English 57.0 62.1 66.5Average exam mark - Math 52.7 54.9 64.3Percentage of exams failed 37.8 34.6 28.7School vs exam mark difference 10.6 11.9 12.0Grade 11 English gender gap M 0.9 F 1.8 F 1.8Grade 11 Math gender gap F 1.1 M 2.8 M 7.6Overall rating out of 10 7.5 5.2 7.4
Carleton North Senior High School Gr 11 enrollment: 204Bristol 2002-2003 Last 3 yrsLate Entry (%): 20.4 12 / 46 3 / 40Academic Performance 2001 2002 2003Average exam mark - English 54.5 64.4 66.2Average exam mark - Math 63.3 74.4 70.3Percentage of exams failed 29.8 8.7 25.0School vs exam mark difference 13.9 8.6 9.0Grade 11 English gender gap F 2.0 F 1.6 F 3.9Grade 11 Math gender gap M 4.4 M 0.8 M 1.1Overall rating out of 10 8.7 9.1 7.3
Harrison Trimble High School Gr 11 enrollment: 224Moncton 2002-2003 Last 3 yrsLate Entry (%): 36.0 12 / 46 7 / 40Academic Performance 2001 2002 2003Average exam mark - English 56.9 66.1 69.3Average exam mark - Math 58.0 63.6 66.1Percentage of exams failed 31.9 16.6 25.6School vs exam mark difference 12.1 10.7 9.9Grade 11 English gender gap F 1.6 M 0.9 F 4.2Grade 11 Math gender gap F 0.9 M 4.0 M 4.2Overall rating out of 10 8.0 7.4 7.3
Dalhousie Regional High School Gr 11 enrollment: 99Dalhousie 2002-2003 Last 3 yrsLate Entry (%): 26.5 12 / 46 21 / 40Academic Performance 2001 2002 2003Average exam mark - English 49.6 62.9 65.9Average exam mark - Math 51.6 66.0 64.9Percentage of exams failed 49.7 18.9 35.9School vs exam mark difference 19.1 12.9 12.8Grade 11 English gender gap F 1.4 M 0.4 F 7.7Grade 11 Math gender gap M 1.4 M 3.6 M 5.7Overall rating out of 10 4.7 6.6 7.3
Kennebecasis Valley High School Gr 11 enrollment: 264Rothesay 2002-2003 Last 3 yrsLate Entry (%): 17.4 15 / 46 19 / 40Academic Performance 2001 2002 2003Average exam mark - English 59.1 66.4 72.8Average exam mark - Math 56.3 64.7 70.9Percentage of exams failed 36.7 19.5 20.0School vs exam mark difference 17.4 11.9 9.2Grade 11 English gender gap F 4.2 F 3.6 F 2.7Grade 11 Math gender gap M 2.2 M 7.4 F 2.9Overall rating out of 10 6.1 6.0 7.2
Fredericton High School Gr 11 enrollment: 466Fredericton 2002-2003 Last 3 yrsLate Entry (%): 18.3 16 / 46 12 / 40Academic Performance 2001 2002 2003Average exam mark - English 55.3 66.6 70.8Average exam mark - Math 56.2 64.2 69.0Percentage of exams failed 38.6 18.7 21.2School vs exam mark difference 16.4 10.3 9.4Grade 11 English gender gap F 6.1 F 3.5 F 4.6Grade 11 Math gender gap M 0.5 F 0.1 M 2.7Overall rating out of 10 6.5 6.5 7.0
Harvey High School Gr 11 enrollment: 49Harvey Station 2002-2003 Last 3 yrsLate Entry (%): 22.4 17 / 46 10 / 40Academic Performance 2001 2002 2003Average exam mark - English 50.4 69.9 66.1Average exam mark - Math 58.5 71.9 56.5Percentage of exams failed 48.2 11.8 41.8School vs exam mark difference 20.6 12.2 13.5Grade 11 English gender gap F 3.1 F 4.1 F 9.6Grade 11 Math gender gap F 2.1 M 1.5 F 5.5Overall rating out of 10 5.6 9.0 6.9
Leo Hayes High School Gr 11 enrollment: 404Fredericton 2002-2003 Last 3 yrsLate Entry (%): 18.4 17 / 46 34 / 40Academic Performance 2001 2002 2003Average exam mark - English 49.0 63.2 70.0Average exam mark - Math 47.0 65.9 66.3Percentage of exams failed 56.6 21.1 23.1School vs exam mark difference 23.3 11.5 9.7Grade 11 English gender gap F 5.5 F 0.9 F 4.2Grade 11 Math gender gap F 2.4 M 0.9 F 0.4Overall rating out of 10 2.4 5.4 6.9
North & South Esk Regional High SchoolGr 11 enrollment: 60Sunny Corner 2002-2003 Last 3 yrsLate Entry (%): 20.3 19 / 46 11 / 40Academic Performance 2001 2002 2003Average exam mark - English 51.8 64.4 68.2Average exam mark - Math 63.9 64.5 64.5Percentage of exams failed 36.6 21.1 28.2School vs exam mark difference 15.4 12.6 11.2Grade 11 English gender gap F 4.4 F 5.0 F 0.6Grade 11 Math gender gap F 1.2 F 3.8 F 2.0Overall rating out of 10 7.6 6.6 6.5
Oromocto High School Gr 11 enrollment: 276Oromocto 2002-2003 Last 3 yrsLate Entry (%): 23.1 19 / 46 16 / 40Academic Performance 2001 2002 2003Average exam mark - English 54.0 64.7 66.1Average exam mark - Math 58.8 69.7 69.0Percentage of exams failed 34.9 13.3 28.8School vs exam mark difference 13.9 9.7 8.7Grade 11 English gender gap F 0.8 F 1.3 F 3.5Grade 11 Math gender gap M 1.6 M 2.5 M 3.1Overall rating out of 10 6.4 7.0 6.5
Belleisle Regional High School Gr 11 enrollment: 43Springfield 2002-2003 Last 3 yrsLate Entry (%): 26.9 19 / 46 21 / 40Academic Performance 2001 2002 2003Average exam mark - English 49.4 63.6 65.5Average exam mark - Math 43.0 61.9 56.8Percentage of exams failed 60.9 16.9 45.7School vs exam mark difference 22.3 10.7 13.2Grade 11 English gender gap F 3.3 F 6.6 F 5.0Grade 11 Math gender gap M 6.6 M 9.1 M 1.5Overall rating out of 10 3.8 8.2 6.5
Riverview High School Gr 11 enrollment: 274Riverview 2002-2003 Last 3 yrsLate Entry (%): 17.8 19 / 46 21 / 40Academic Performance 2001 2002 2003Average exam mark - English 54.7 65.2 71.6Average exam mark - Math 53.5 59.0 55.8Percentage of exams failed 41.5 22.8 32.7School vs exam mark difference 14.9 10.9 11.7Grade 11 English gender gap M 0.4 F 0.3 F 2.2Grade 11 Math gender gap M 3.5 M 3.8 F 1.4Overall rating out of 10 5.8 6.3 6.5
Sugarloaf Senior High School Gr 11 enrollment: 91Campbellton 2002-2003 Last 3 yrsLate Entry (%): 41.5 23 / 46 25 / 40Academic Performance 2001 2002 2003Average exam mark - English 54.1 64.0 69.2Average exam mark - Math 47.9 54.4 54.3Percentage of exams failed 47.9 27.9 37.3School vs exam mark difference 14.8 13.2 12.7Grade 11 English gender gap M 0.8 F 2.6 F 4.3Grade 11 Math gender gap M 2.7 M 0.7 F 12.1Overall rating out of 10 5.7 5.4 6.4
Rothesay High School Gr 11 enrollment: 135Rothesay 2002-2003 Last 3 yrsLate Entry (%): 16.8 23 / 46 26 / 40Academic Performance 2001 2002 2003Average exam mark - English 52.2 65.1 69.1Average exam mark - Math 57.6 65.4 70.3Percentage of exams failed 40.3 17.3 22.0School vs exam mark difference 19.8 12.6 10.2Grade 11 English gender gap F 1.4 F 5.6 F 4.0Grade 11 Math gender gap M 1.3 F 5.2 M 0.1Overall rating out of 10 4.5 6.2 6.4
Report Card on New Brunswick’s Anglophone High Schools — 2004 Edition12
John Caldwell School Gr 11 enrollment: 74Grand Falls 2002-2003 Last 3 yrsLate Entry (%): 10.3 25 / 46 20 / 40Academic Performance 2001 2002 2003Average exam mark - English 53.0 61.2 61.8Average exam mark - Math 54.5 55.6 63.7Percentage of exams failed 43.2 30.4 37.1School vs exam mark difference 14.5 14.6 13.8Grade 11 English gender gap F 0.3 F 5.8 F 5.5Grade 11 Math gender gap F 1.6 F 2.5 M 1.4Overall rating out of 10 7.0 5.7 6.3
Stanley Regional High School Gr 11 enrollment: 36Stanley 2002-2003 Last 3 yrsLate Entry (%): 18.0 26 / 46 12 / 40Academic Performance 2001 2002 2003Average exam mark - English 56.0 59.9 62.3Average exam mark - Math 54.6 63.6 62.8Percentage of exams failed 42.4 23.3 33.3School vs exam mark difference 17.4 15.4 11.6Grade 11 English gender gap F 6.4 F 10.3 F 0.6Grade 11 Math gender gap F 1.9 M 1.8 M 0.4Overall rating out of 10 7.3 6.5 6.2
Grand Manan Community School Gr 11 enrollment: 33Grand Manan 2002-2003 Last 3 yrsLate Entry (%): 25.4 27 / 46 17 / 40Academic Performance 2001 2002 2003Average exam mark - English 53.0 63.2 67.0Average exam mark - Math 46.5 58.3 47.2Percentage of exams failed 49.0 17.7 40.0School vs exam mark difference 24.6 11.3 12.4Grade 11 English gender gap M 8.8 F 4.6 M 1.6Grade 11 Math gender gap M 11.6 M 4.4 n/aOverall rating out of 10 6.1 7.5 5.9
St. Malachy’s High School Gr 11 enrollment: 231Saint John 2002-2003 Last 3 yrsLate Entry (%): 40.9 28 / 46 12 / 40Academic Performance 2001 2002 2003Average exam mark - English 56.4 66.1 69.3Average exam mark - Math 62.2 60.6 63.2Percentage of exams failed 29.3 21.3 31.5School vs exam mark difference 12.0 9.8 10.5Grade 11 English gender gap F 2.4 F 3.8 F 0.8Grade 11 Math gender gap M 3.8 F 0.5 M 8.0Overall rating out of 10 7.8 6.6 5.8
Sir James Dunn Academy Gr 11 enrollment: 38St. Andrews 2002-2003 Last 3 yrsLate Entry (%): 10.1 28 / 46 n/aAcademic Performance 2001 2002 2003Average exam mark - English 60.7 65.9 69.9Average exam mark - Math 49.3 n/a 59.3Percentage of exams failed 43.2 5.6 40.3School vs exam mark difference 23.5 14.7 14.4Grade 11 English gender gap F 2.8 F 5.8 M 1.4Grade 11 Math gender gap M 13.7 n/a F 1.2Overall rating out of 10 7.7 n/a 5.8
Sussex Regional High School Gr 11 enrollment: 234Sussex 2002-2003 Last 3 yrsLate Entry (%): 20.8 30 / 46 33 / 40Academic Performance 2001 2002 2003Average exam mark - English 55.9 64.2 67.5Average exam mark - Math 44.8 51.5 56.1Percentage of exams failed 47.1 31.4 39.8School vs exam mark difference 17.8 14.2 15.2Grade 11 English gender gap F 5.4 F 4.2 F 7.0Grade 11 Math gender gap F 5.2 F 4.9 M 0.1Overall rating out of 10 4.8 4.5 5.7
Miramichi Valley High School Gr 11 enrollment: 225Miramichi 2002-2003 Last 3 yrsLate Entry (%): 22.0 31 / 46 17 / 40Academic Performance 2001 2002 2003Average exam mark - English 54.1 61.8 64.5Average exam mark - Math 63.5 64.9 65.3Percentage of exams failed 29.7 22.9 34.0School vs exam mark difference 11.5 10.1 9.0Grade 11 English gender gap F 2.5 F 0.9 F 3.9Grade 11 Math gender gap M 6.6 F 1.3 M 0.9Overall rating out of 10 8.5 5.5 5.4
Hartland High School Gr 11 enrollment: 71Hartland 2002-2003 Last 3 yrsLate Entry (%): 19.0 31 / 46 30 / 40Academic Performance 2001 2002 2003Average exam mark - English 50.8 64.2 65.5Average exam mark - Math 52.9 68.3 63.2Percentage of exams failed 49.4 16.1 35.3School vs exam mark difference 20.0 13.7 13.3Grade 11 English gender gap F 3.5 F 2.4 F 9.5Grade 11 Math gender gap M 10.5 F 0.2 M 1.1Overall rating out of 10 4.4 5.9 5.4
Fundy High School Gr 11 enrollment: 106St. George 2002-2003 Last 3 yrsLate Entry (%): 21.7 33 / 46 35 / 40Academic Performance 2001 2002 2003Average exam mark - English 51.2 60.5 64.9Average exam mark - Math 45.8 51.1 49.4Percentage of exams failed 54.6 38.8 42.6School vs exam mark difference 21.1 16.9 14.7Grade 11 English gender gap F 5.2 F 2.2 F 3.3Grade 11 Math gender gap F 0.3 M 2.8 M 13.2Overall rating out of 10 4.8 3.6 5.1
Nackawic Senior High School Gr 11 enrollment: 103Nackawic 2002-2003 Last 3 yrsLate Entry (%): 26.1 34 / 46 27 / 40Academic Performance 2001 2002 2003Average exam mark - English 46.7 62.3 63.8Average exam mark - Math 50.9 66.2 60.6Percentage of exams failed 56.4 19.9 43.5School vs exam mark difference 20.5 10.8 11.4Grade 11 English gender gap F 3.3 F 7.5 F 2.1Grade 11 Math gender gap F 6.1 F 1.7 M 3.9Overall rating out of 10 4.4 7.1 5.0
St. Stephen High School Gr 11 enrollment: 166Old Ridge 2002-2003 Last 3 yrsLate Entry (%): 27.4 34 / 46 32 / 40Academic Performance 2001 2002 2003Average exam mark - English 54.9 62.5 67.0Average exam mark - Math 55.8 54.9 59.3Percentage of exams failed 37.1 25.9 37.5School vs exam mark difference 16.8 15.6 13.8Grade 11 English gender gap F 2.9 F 3.5 F 2.9Grade 11 Math gender gap E M 2.4 M 3.5Overall rating out of 10 5.7 4.6 5.0
Bernice MacNaughton High School Gr 11 enrollment: 169Moncton 2002-2003 Last 3 yrsLate Entry (%): 18.3 36 / 46 n/aAcademic Performance 2001 2002 2003Average exam mark - English n/a 64.9 69.2Average exam mark - Math n/a n/a 58.6Percentage of exams failed n/a 13.5 34.0School vs exam mark difference n/a 12.1 13.9Grade 11 English gender gap n/a F 3.6 F 4.7Grade 11 Math gender gap n/a n/a F 2.6Overall rating out of 10 n/a n/a 4.9
Doaktown Consolidated High School Gr 11 enrollment: 24Doaktown 2002-2003 Last 3 yrsLate Entry (%): 21.4 36 / 46 n/aAcademic Performance 2001 2002 2003Average exam mark - English 49.3 62.3 64.1Average exam mark - Math n/a n/a 48.0Percentage of exams failed 65.2 24.0 43.9School vs exam mark difference 28.0 17.5 17.1Grade 11 English gender gap M 2.2 F 2.3 F 4.7Grade 11 Math gender gap n/a n/a F 15.4Overall rating out of 10 n/a n/a 4.9
Minto Memorial High School Gr 11 enrollment: 51Minto 2002-2003 Last 3 yrsLate Entry (%): 17.1 38 / 46 21 / 40Academic Performance 2001 2002 2003Average exam mark - English 48.4 60.7 62.9Average exam mark - Math 58.4 71.3 59.2Percentage of exams failed 45.0 12.4 47.4School vs exam mark difference 14.6 10.4 10.8Grade 11 English gender gap M 0.2 F 2.4 F 3.3Grade 11 Math gender gap F 0.4 M 7.7 F 0.4Overall rating out of 10 6.4 7.6 4.5
Tantramar Regional High School Gr 11 enrollment: 145Sackville 2002-2003 Last 3 yrsLate Entry (%): 21.7 39 / 46 27 / 40Academic Performance 2001 2002 2003Average exam mark - English 55.3 64.0 66.5Average exam mark - Math 61.9 64.2 55.2Percentage of exams failed 32.8 20.2 41.7School vs exam mark difference 15.3 11.4 14.1Grade 11 English gender gap F 4.1 F 1.6 F 8.4Grade 11 Math gender gap F 1.4 M 5.5 F 2.5Overall rating out of 10 6.5 5.7 4.4
James M. Hill Memorial High School Gr 11 enrollment: 194Miramichi 2002-2003 Last 3 yrsLate Entry (%): 24.7 40 / 46 29 / 40Academic Performance 2001 2002 2003Average exam mark - English 52.1 64.3 67.8Average exam mark - Math 59.5 67.6 56.9Percentage of exams failed 37.9 16.6 36.8School vs exam mark difference 15.7 11.4 14.4Grade 11 English gender gap F 2.3 F 2.8 F 7.2Grade 11 Math gender gap M 0.6 M 5.7 M 0.5Overall rating out of 10 5.1 6.6 4.3
Caledonia Regional High School Gr 11 enrollment: 67Hillsborough 2002-2003 Last 3 yrsLate Entry (%): 16.6 41 / 46 30 / 40Academic Performance 2001 2002 2003Average exam mark - English 48.5 58.6 62.9Average exam mark - Math 54.5 61.4 52.1Percentage of exams failed 48.0 21.5 54.1School vs exam mark difference 16.5 10.2 14.9Grade 11 English gender gap F 4.7 F 2.0 F 2.0Grade 11 Math gender gap M 5.7 F 4.3 M 2.5Overall rating out of 10 5.7 6.0 3.9
Harbour View High School Gr 11 enrollment: 267Saint John 2002-2003 Last 3 yrsLate Entry (%): 41.7 41 / 46 36 / 40Academic Performance 2001 2002 2003Average exam mark - English 52.9 62.0 66.9Average exam mark - Math 53.3 58.7 57.1Percentage of exams failed 44.0 21.7 36.0School vs exam mark difference 14.7 10.9 10.8Grade 11 English gender gap F 4.8 F 4.5 EGrade 11 Math gender gap E M 0.7 M 9.0Overall rating out of 10 4.6 4.5 3.9
J.M.A. Armstrong/Salisbury Gr 11 enrollment: 90Salisbury 2002-2003 Last 3 yrsLate Entry (%): 23.9 43 / 46 37 / 40Academic Performance 2001 2002 2003Average exam mark - English 49.1 60.6 63.0Average exam mark - Math 49.1 48.2 51.0Percentage of exams failed 55.8 38.8 54.8School vs exam mark difference 20.3 18.5 14.7Grade 11 English gender gap F 3.6 F 2.5 F 3.3Grade 11 Math gender gap F 0.4 M 0.9 F 5.0Overall rating out of 10 4.9 3.7 3.4
Saint John High School Gr 11 enrollment: 283Saint John 2002-2003 Last 3 yrsLate Entry (%): 21.8 44 / 46 38 / 40Academic Performance 2001 2002 2003Average exam mark - English 53.2 65.4 68.7Average exam mark - Math 56.0 63.7 53.2Percentage of exams failed 40.4 21.9 35.0School vs exam mark difference 15.2 9.5 11.1Grade 11 English gender gap F 8.9 F 3.2 F 3.6Grade 11 Math gender gap M 2.4 M 6.3 M 2.9Overall rating out of 10 3.7 4.7 2.6
Southern Victoria High School Gr 11 enrollment: 81Perth-Andover 2002-2003 Last 3 yrsLate Entry (%): 18.1 45 / 46 39 / 40Academic Performance 2001 2002 2003Average exam mark - English 54.1 57.7 60.0Average exam mark - Math 44.9 53.4 45.2Percentage of exams failed 48.8 37.7 58.3School vs exam mark difference 23.9 16.2 20.7Grade 11 English gender gap M 0.7 F 1.7 F 1.9Grade 11 Math gender gap F 1.3 M 4.7 M 2.3Overall rating out of 10 4.5 3.7 2.3
Simonds High School Gr 11 enrollment: 320Saint John 2002-2003 Last 3 yrsLate Entry (%): 35.5 46 / 46 40 / 40Academic Performance 2001 2002 2003Average exam mark - English 51.1 62.3 63.1Average exam mark - Math 44.3 51.3 47.7Percentage of exams failed 55.9 32.8 53.9School vs exam mark difference 20.0 13.5 16.6Grade 11 English gender gap F 2.0 F 1.3 F 5.0Grade 11 Math gender gap M 1.0 M 0.2 M 0.3Overall rating out of 10 2.3 4.0 2.0
13
Ranking the schools
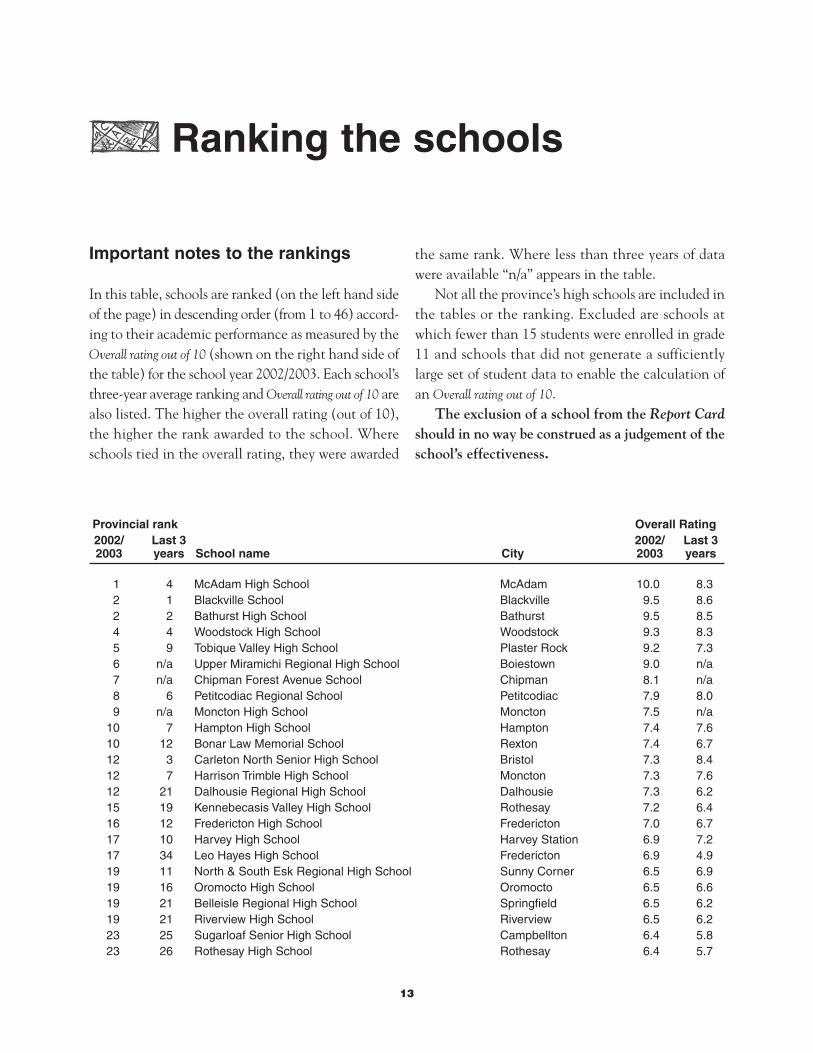
1 4 McAdam High School McAdam 10.0 8.32 1 Blackville School Blackville 9.5 8.62 2 Bathurst High School Bathurst 9.5 8.54 4 Woodstock High School Woodstock 9.3 8.35 9 Tobique Valley High School Plaster Rock 9.2 7.36 n/a Upper Miramichi Regional High School Boiestown 9.0 n/a7 n/a Chipman Forest Avenue School Chipman 8.1 n/a8 6 Petitcodiac Regional School Petitcodiac 7.9 8.09 n/a Moncton High School Moncton 7.5 n/a
10 7 Hampton High School Hampton 7.4 7.610 12 Bonar Law Memorial School Rexton 7.4 6.712 3 Carleton North Senior High School Bristol 7.3 8.412 7 Harrison Trimble High School Moncton 7.3 7.612 21 Dalhousie Regional High School Dalhousie 7.3 6.215 19 Kennebecasis Valley High School Rothesay 7.2 6.416 12 Fredericton High School Fredericton 7.0 6.717 10 Harvey High School Harvey Station 6.9 7.217 34 Leo Hayes High School Fredericton 6.9 4.919 11 North & South Esk Regional High School Sunny Corner 6.5 6.919 16 Oromocto High School Oromocto 6.5 6.619 21 Belleisle Regional High School Springfield 6.5 6.219 21 Riverview High School Riverview 6.5 6.223 25 Sugarloaf Senior High School Campbellton 6.4 5.823 26 Rothesay High School Rothesay 6.4 5.7
Provincial rank Overall Rating2002/ Last 3 2002/ Last 3 2003 years School name City 2003 years
Important notes to the rankings
In this table, schools are ranked (on the left hand sideof the page) in descending order (from 1 to 46) accord-ing to their academic performance as measured by theOverall rating out of 10 (shown on the right hand side ofthe table) for the school year 2002/2003. Each school’sthree-year average ranking and Overall rating out of 10 arealso listed. The higher the overall rating (out of 10),the higher the rank awarded to the school. Whereschools tied in the overall rating, they were awarded
the same rank. Where less than three years of datawere available “n/a” appears in the table.
Not all the province’s high schools are included inthe tables or the ranking. Excluded are schools atwhich fewer than 15 students were enrolled in grade11 and schools that did not generate a sufficientlylarge set of student data to enable the calculation ofan Overall rating out of 10.
The exclusion of a school from the Report Cardshould in no way be construed as a judgement of theschool’s effectiveness.
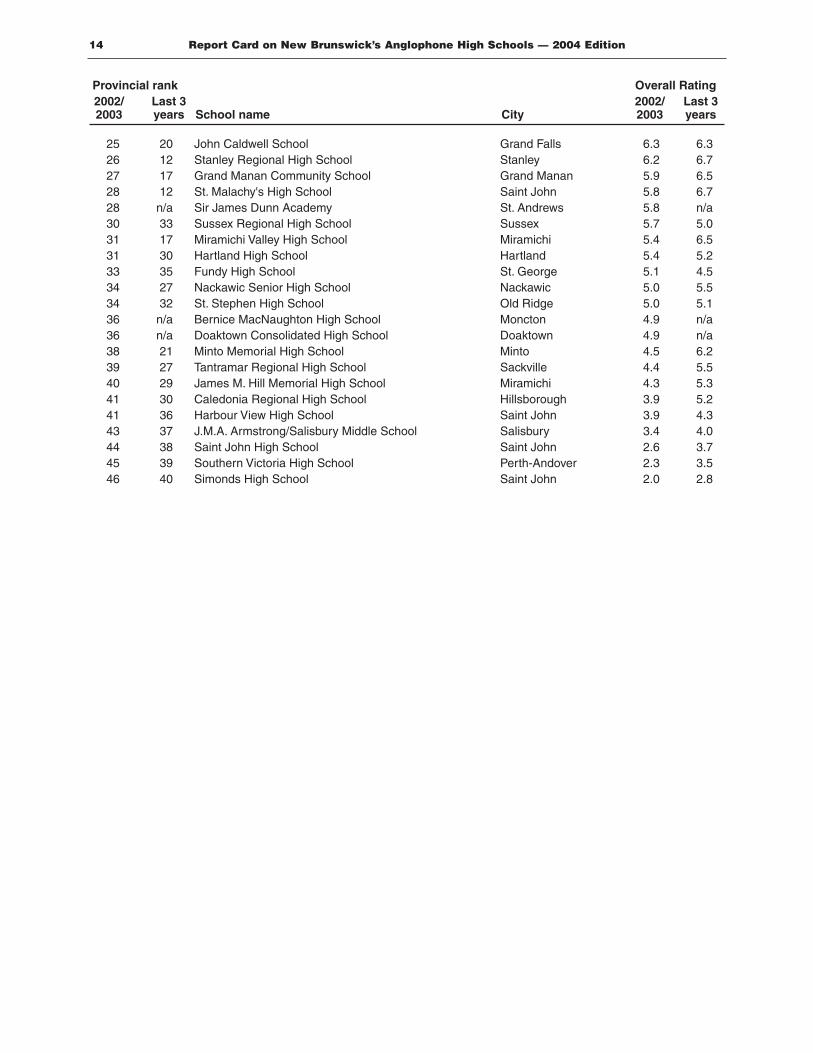
25 20 John Caldwell School Grand Falls 6.3 6.326 12 Stanley Regional High School Stanley 6.2 6.727 17 Grand Manan Community School Grand Manan 5.9 6.528 12 St. Malachy's High School Saint John 5.8 6.728 n/a Sir James Dunn Academy St. Andrews 5.8 n/a30 33 Sussex Regional High School Sussex 5.7 5.031 17 Miramichi Valley High School Miramichi 5.4 6.531 30 Hartland High School Hartland 5.4 5.233 35 Fundy High School St. George 5.1 4.534 27 Nackawic Senior High School Nackawic 5.0 5.534 32 St. Stephen High School Old Ridge 5.0 5.136 n/a Bernice MacNaughton High School Moncton 4.9 n/a36 n/a Doaktown Consolidated High School Doaktown 4.9 n/a38 21 Minto Memorial High School Minto 4.5 6.239 27 Tantramar Regional High School Sackville 4.4 5.540 29 James M. Hill Memorial High School Miramichi 4.3 5.341 30 Caledonia Regional High School Hillsborough 3.9 5.241 36 Harbour View High School Saint John 3.9 4.343 37 J.M.A. Armstrong/Salisbury Middle School Salisbury 3.4 4.044 38 Saint John High School Saint John 2.6 3.745 39 Southern Victoria High School Perth-Andover 2.3 3.546 40 Simonds High School Saint John 2.0 2.8
Report Card on New Brunswick’s Anglophone High Schools — 2004 Edition14
Provincial rank Overall Rating2002/ Last 3 2002/ Last 3 2003 years School name City 2003 years
15
The Overall rating out of 10 is intended to answer the question, “In general, how is the school doing, academ-ically?” The following is a simplified description of the procedure used to convert the raw indicator data intothe Overall rating out of 10.
1 For each indicator, for each school, for each year, the by-subject area, by-subject level results were convertedinto standardized or “Z” scores by solving the equation
Z = (X – µ) / σ
where X is the individual school’s result, µ is the mean of the all-schools distribution of results, and σ is thestandard deviation of the same all-schools distribution.
2 For each indicator, these standardized data were then aggregated to produce weighted average indicator val-ues. The weighting used was the number of examinations written in each subject area at each level at theschool relative to the total number of examinations written at the school.
3 For each indicator, these weighted average results were then re-standardized.
4 The six standardized indicator results were then combined to produce a weighted average summary stan-dardized score for the school. The weightings used in this calculation were Average exam mark-grade-11English—16.7%, Average exam mark-grade-11 Math—16.7%, Percentage of exams failed—33.3%, School vs exammark difference—16.7%, grade-11 English gender gap—8.3%, and grade-11 Math gender gap—8.3%. Forschools for which there were no gender-gap results, the School vs exam mark difference was weighted at33.3%.
5 This summary standardized score was then standardized.
This standardized score was converted into an overall rating between 0 and 10 as follows:
6 The maximum and minimum standardized scores were set at 2.0 and –3.29 respectively. Scores equal to,or greater than, 2.0 receive the highest overall rating of 10. This cut-off was chosen because it allows morethan one school in a given year to be awarded 10 out of 10. Scores of equal to, or less than, –3.29 receivethe lowest overall rating of 0. Schools with scores below –3.29 are likely to be outliers—a statistical termused to denote members of a population that appear to have characteristics substantially different from therest of the population. We chose, therefore, to set the minimum score so as to disregard such extreme dif-ferences.
Appendix: Calculating theOverall rating out of 10

Report Card on New Brunswick’s Anglophone High Schools — 2004 Edition16
7 The resulting standardized scores were converted into Overall ratings according to the formula:
OR = µ +(σ * StanScore),
where OR is the resulting Overall rating, µ is the average calculated according to the formula:
µ = (ORmin – 10 (Zmin / Zmax)) / (1 – (Zmin / Zmax))
where σ is the standard deviation calculated according to the formula:
σ = (10 – µ) / Zmax,
and StanScore is the standardized score calculated in (6) above and adjusted as required for minimum andmaximum values as noted in (7) above. As noted in (7) above, ORmin equals zero, Zmin equals –3.29; andZmax equals 2.0.
8 Finally, the derived Overall rating is rounded to one decimal place to reflect the significant number of placesof the decimal in the original raw data.
Note that the Overall rating out of 10, based as it is on standardized scores, is a relative rating. That is, in orderfor a school to show improvement in its overall rating, it must improve more than the average. If it improves,but at a rate less than the average, it will show a decline in its rating.
17
Peter CowleyPeter Cowley is the Director of School Performance Studies at The Fraser Institute. Upon graduation from theUniversity of British Columbia (B.Comm. 1974), Mr Cowley accepted a marketing post with Procter & Gamblein Toronto. Shortly thereafter he returned to Vancouver to begin a long career in marketing and general man-agement in the furniture-manufacturing sector. During his assignments in general management, process improve-ment was a special focus and interest. In 1994, Mr Cowley wrote and published The Parent’s Guide, a popularhandbook for parents of British Columbia’s secondary-school students. The Parent’s Guide web site replacedthe handbook in 1995. In 1998, Mr Cowley was co-author of The Fraser Institute’s A Secondary Schools Report
Card for British Columbia, the first of the Institute’s continuing series of annual reports on school performance.This was followed in 1999 by The 1999 Report Card on British Columbia’s Secondary Schools, Boys, Girls, and Grades:
Academic Gender Balance in British Columbia’s Secondary Schools, and The 1999 Report Card on Alberta’s High Schools.Since then, Mr Cowley has co-authored all of the Institute’s annual Report Cards. Editions published in 2003included Report Cards on secondary schools in British Columbia, Alberta, and Quebec as well as Report Cards
on elementary schools in British Columbia, Alberta, and Ontario. He continues his research on educationand related issues for The Fraser Institute.
Stephen T. EastonStephen T. Easton is a professor of Economics at Simon Fraser University and a Senior Scholar at The FraserInstitute. He received his A.B. from Oberlin College and his Ph.D. from the University of Chicago. Recentworks published by The Fraser Institute include Privatizing Prisons (editor, 1998), The Costs of Crime: WhoPays and How Much? 1998 Update (with Paul Brantingham, 1998), and Rating Global Economic Freedom (edi-tor, 1992). He was also co-author of A Secondary Schools Report Card for British Columbia (1998), The 1999Report Card on British Columbia’s Secondary Schools, Boys, Girls, and Grades: Academic Gender Balance in BritishColumbia’s Secondary Schools (1999), and The 1999 Report Card on Alberta’s High Schools. Other publicationsabout education include “Do We Have a Problem Yet? Women and Men in Higher Education,” in DavidLaidler (ed.), Renovating the Ivory Tower: Canadian Universities and the Knowledge Economy (Toronto: C.D.Howe Institute 2002), pp. 60–79; “Plus ça change, plus c’est la même chose” in Stephen B. Lawton, RodneyReed, and Fons van Wieringen, Restructuring Public Schooling (Berlin: Springer-Verlag, 1997) and Education inCanada: An Analysis of Elementary, Secondary and Vocational Schooling (Vancouver: The Fraser Institute, 1988).His editorials have been carried by the Vancouver Sun, the Globe and Mail, the Financial Post, the OttawaCitizen, and many other newspapers around the country. Professor Easton continues his work as co-author ofthe Institute’s Report Cards on schools in Alberta and British Columbia.
Darlene SavoyDarlene Savoy is Data Analyst in the department of School Performance Studies at The Fraser Institute, whereshe assembles the data for, and automates the production of, the Institute’s school report cards and the Progress
About the authors& Acknowledgments
Report Card on New Brunswick’s Anglophone High Schools — 2004 Edition18
Planner website. She was raised and educated in New Brunswick and holds a Bachelor of Computer Sciencewith a minor in Philosophy from the University of New Brunswick. Prior to joining the Institute, Ms. Savoyworked for over seven years as a computer programmer and data analyst in the private and public sectors ofCanada and the United States.
Acknowledgments
The Fraser Institute wishes to acknowledge the generous support for this project from the Max Bell Foundation.Thanks also to the employees of the Corporate Data and Analysis Section and the Data Management Servicessection of the Policy & Planning Branch at the New Brunswick Department of Education for their help in theacquisition and verification of the data.