report card on american education aa state-by-state ... · american legislative exchange...
TRANSCRIPT

ALECAmerican Legislative Exchange Council
1129 20th Street, NW • Suite 500 • Washington, DC 20036
202-466-3800 • www.alec.orgALECAmerican Legislative Exchange Council
Report Card on American EducationA State-by-State AnalysisA State-by-State Analysis
1983-1984 to 2004-2005
Report Card on American Education: A State-by-State Analysis 1983-1984 to 2004-2005

ALECAmerican Legislative Exchange Council
Report Card on American Education
A State-by-State AnalysisA State-by-State Analysis
1983-1984 to 2004-2005

iv | A Report Card on American Education: A State-by-State Analysis
Report Card on American Education: A State-by-State Analysis, 1983-1984 to 2004-2005
Andrew T. LeFevre, Author
Matt Warner, Editor
Copyright © November 2006 by the American Legislative Exchange Council
All Rights Reserved
American Legislative Exchange Council1129 20th Street, N.W., Suite 500Washington, D.C. 20036(202) 466 3800 Fax (202) 466 3801www.ALEC.org
Publications Order Code: 0618Cost to non-members: $25.00 (+S/H)For ordering information, contact the ALEC Public Affairs Offi ce.
The Report Card on American Education: A State by State Analysis, 1983-1984 to 2004-2005 has been published
by the American Legislative Exchange Council (ALEC), as part of its mission to discuss, develop and
disseminate public policies which expand free-markets, promote economic growth, limit government and
preserve individual liberty. ALEC is the nation’s largest nonpartisan, voluntary membership organization of
state legislators, with nearly 2,400 members across the nation. ALEC is governed by a Board of Directors of
state legislators, which is advised by a Private Enterprise Board representing major corporate and foundation
sponsors.
ALEC is classifi ed by the Internal Revenue Service as a 501(c)(3) non-profi t and public policy and
educational organization. Individuals, philanthropic foundations, corporations, companies, or associations
are eligible to support ALEC’s work through tax-deductible gifts. Nothing contained herein should be
construed as necessarily refl ecting the view of the American Legislative Exchange Council, its Board of
Directors, or its membership, or as an attempt to aid or hinder the passage of any bill before the U.S.
Congress or in any state legislatures.

A Report Card on American Education: A State-by-State Analysis | v
Table of Contents
1 Foreword2 About the Author3 Executive Summary and Highlights4 Table ES.1 Ranking of State Academic Achievement5 Introduction7 State Snapshots59 Chapter One: Measure of Educational Inputs
TABLE 1.1: Pupil Teacher Ratio, Ranked by 2003-2004 Figures TABLE 1.2: Instructional Staff in Public Elementary and Secondary Schools TABLE 1.3: Revenues for Public Elementary and Secondary Schools, by Source and State, Current Dollars (in thousands)TABLE 1.4: Current Expenditures for Public Elementary and Secondary Education (in thousands) TABLE 1.5 Total Expenditures for Public Elementary and Secondary Education, by Function and State 2003-2004 TABLE 1.6: Expenditures Per Public Elementary and Secondary Schools (Gross Expenditures in Thousands), Real Per Pupil ExpendituresTABLE 1.7: Expenditures per Pupil Ranked by 2003-2004 TABLE 1.8: Percent Change in Constant Expenditures per Pupil, Ranked by Percent Change 1983-1984 to 2003-2004TABLE 1.9: Staff Employed in Public School Systems, by Type of Assignment: 2003-2004 School Year TABLE 1.10A: Average Annual Salary of Teachers in Public Elementary and Secondary Schools TABLE 1.10B: Average Teachers Salary vs. Average Salary of Workers with at Least a Bachelor Degree for 2003-2004 TABLE 1.11: Breakdown of Key Federal Funding Programs 2004
83 Chapter Two: Measure of Educational OutputsTABLE 2.1A: Grades 4 and 8 Mathematics Average NAEP Scores and Profi ciency LevelsTABLE 2.1B: Grades 4 and 8 Reading Average NAEP Scores and Profi ciency LevelsTABLE 2.2A: Average 2005 NAEP Grade 8 Mathematics Scores and Profi ciency, Ranked by Percent at or Above Profi cient LevelTABLE 2.2B: Average 2005 NAEP Grade 8 Reading Scores and Profi ciency, Ranked by Percent at or Above Profi cient LevelTABLE 2.3: SAT and ACT Test Results Depending on State Usage, 2004TABLE 2.4: ACT Scores, Ranked by Composite Scores, 2004TABLE 2.5: SAT Scores, Ranked by 2004 Total ScoreTABLE 2.6: SAT ScoresTABLE 2.7: Historic SAT Scores by Sex
101 Chapter Three: Measures of Correlation between Inputs & OutputsTABLE 3.1: Educational Achievement and Enrollment/Staffi ng InputsTABLE 3.2: 2003-2004 Educational Achievement and Financial InputsTABLE 3.3: State-by-State Ranking on Educational Inputs and OutputsTABLE 3.4: Trend Relationships 1983-1984 to 2003-2004
113 Chapter Four: Demographics, Charter Schools and School ChoiceTABLE 4.1: Enrollment in Public Elementary and Secondary Schools, by Level and Grade: Fall 2004TABLE 4.2: Enrollment in Public Elementary and Secondary Schools, by State: Fall 2003, 1993, and 1983TABLE 4.3: Percent Changes in Student Enrollment in Public Elementary and Secondary Schools, Ranked by Change from 1983-84 to 2003-04TABLE 4.4: Total Student Enrollment by Year 1993-1994 to 2003-2004TABLE 4.5: Minority Enrollment in Charter Schools Compared to Public SchoolsTABLE 4.6: Basic Information on Charter Schools by State (through Fall 2005)TABLE 4.7: Ranking F Charter School Laws and Detailed Scores for Each StateTABLE 4.8A: Ranking of State School Choice ProgramsTABLE 4.8B: Ranking of State School Choice Programs By UsabilityTABLE 4.9: Public School Districts and Enrollment, by Size of District: 1994-95 to 2001-02
131 Conclusion132 Appendix135 Bibliography

vi | A Report Card on American Education: A State-by-State Analysis

A Report Card on American Education: A State-by-State Analysis | 1
The promise of a quality education is perhaps more critical for America’s young people today than ever before. Preparing American students for a global
workforce is a responsibility we all share as parents, citizens and government leaders. As we continue to debate how to deliver on the promise of a world-class education, I ask you to consider the signifi cance of the fi ndings in this new edition of the Report Card on American Education.
In short, the data analyzed in this publication show us that despite decades of pumping more and more money into America’s public schools, student achievement remains stagnant. Why is this? The problem is not a funding problem. Certainly, money matters. But money is not enough to ensure students are learning. In fact, the amount of money we spend on education will matter less and less if we continue to shut freedom and choice out of the education arena. Only when we allow parents—not government—to select the best school for their children will we see the quality of the educational services rise to meet global standards. In comparisons, American high school students lag behind their international peers. In one assessment, American 15 year-olds scored 18th in math and science behind countries like Australia, Sweden and New Zealand1 (all of which boast school choice programs2).
This year in the United States more parents than ever before are experiencing the power of choice in education. In a dozen states, low-income and minority parents and parents of students with special needs are enrolling their children in schools of their own choosing—schools they know are good schools—just as upper-income American parents have done for generations.
American prosperity, innovation and quality of life are the benefi ts of the economic freedom we enjoy in virtually every other market. But those who have a stake in protecting the government education monopoly want us to believe that, although free markets work in every other area of American life, the K-12 system is the exception. Yet research has shown these school choice programs yield signifi cant gains for participating students.3 School choice
programs help public school students, too. Faced with the prospect of losing students to other schools, residence-based public schools have responded by redoubling their efforts to increase student achievement.4 The fear of losing customers is a powerful motivator. Effi ciency, excellence and continuous improvements are the hallmarks of a competitive environment.
With choice, everybody wins. The power of choice is not magic and it’s not too good to be true—it’s simple economics. It’s the same economic principle that gives us world-class universities and a world-class standard of living. Why not give equal economic freedom to every American student to get a world-class K-12 education?
I hope lawmakers, educators and parents will recognize the shortsighted thinking behind tired and worn out solutions that have little effect on student achievement—namely per-pupil spending increases, pupil-to-teacher ratio adjustments and across-the-board raises for teachers, to name a few. As this Report Card continues to demonstrate, these efforts—taken together and individually—are not going to make the difference in raising American student achievement to international standards. Empowering parents will.
Let every American pick the best and safest school for their child through a variety of school choice alternatives: tuition tax credits, vouchers, private scholarship tax credits, charter schools, home schools and public school choice. And then we will see what we have seen in every other area of our great country—free people in free markets creating excellence.
Lori RomanExecutive DirectorAmerican Legislative Exchange Council
ForewordBy Lori Roman
1. David Salisbury and James Tooley, ed. What America Can Learn from School Choice in Other Countries (Washington, DC: Cato Institute, 2005).
2. Ibid.
3. Caroline M. Hoxby. School choice and school competition: Evidence from the United States. Swedish Economic Policy Review (2003) at: http://www.economics.harvard.edu/faculty/hoxby/papers/hoxby_2.pdf (11)
4. Ibid.

2 | A Report Card on American Education: A State-by-State Analysis
About the Author
Andrew T. LeFevre is Executive Director of the REACH Alliance and REACH Foundation in Harrisburg, Pennsylvania. Founded in 1991, REACH (Road to Educational Achievement through Choice) is the Commonwealth’s leading grassroots coalition seeking to educate the public on the benefi ts that school choice can bring to Pennsylvania’s children. REACH represents individuals, business, religious, civic, taxpayer and non-profi t organizations committed to educational achievement through choice.
Before joining REACH, Mr. LeFevre was President of LeFevre Associates, LLC, a government relations and public affairs consulting fi rm located in Northern Virginia. Prior to forming LeFevre Associates, he served as the executive director for the Association of Private Correctional and Treatment Organizations (APCTO), a 501 (c)(6) non-profi t association, serving the private correctional and treatment industry. Before joining APCTO, Mr. LeFevre served as the Director of the American Legislative Exchange Council’s (ALEC) national Task Forces on Criminal Justice and Education issues.
Throughout his career, Mr. LeFevre has written numerous articles about educational and criminal justice issues and interacted on a daily basis with legislators from all across the country discussing education and crime topics. He has testifi ed before numerous state legislatures on key education and crime issues.
Mr. LeFevre has done numerous radio, print, and television interviews on topics ranging from education reform to privatizing government functions and the Second Amendment. Partial print credits include The New York Times, New York Newsday, The Sacramento Bee, The Houston Chronicle, and The Washington Times. Partial radio credits include The G. Gordon Liddy Show, CNN Radio, and All Things Considered on National Public Radio. Partial television credits for LeFevre include Burden of Proof on CNN, Closing Bell on CNBC, Washington Journal on C-SPAN, Fox in Depth and The O’Rielly Report on the Fox National News Network, and Today’s Topic on MSNBC.
Andrew LeFevre holds a Bachelor of Arts Degree in Political Science from Temple University in Philadelphia, PA. He is married and has two children, both of whom attend public elementary school.

A Report Card on American Education: A State-by-State Analysis | 3
Earlier this year a unique class-action lawsuit was fi led in New Jersey on behalf of parents whose children are trapped in failing public schools. What makes
this lawsuit unique is that it seeks a remedy for the children trapped in failing schools and not for the educational system—like too many previous lawsuits have done.
Crawford v. Davy was fi led in the Superior Court of New Jersey in Newark, against State Commissioner of Education Lucille Davy and 30 more defendants. The case represents a class of more than 60,000 students in 96 failing schools in 25 districts and argues that the denial of basic educational opportunities violates the children’s right to a thorough and effi cient education under the state constitution, and to equal protection of the laws under the state and federal constitutions.
This national test case will bear watching since some estimates put the number of students in failing public schools on a national level at over 4 million. If this case is successful, it is almost guaranteed that parents who have grown discontented with our country’s schools will look to push the proverbial educational reform envelope and seek similar remedies in other states.
The results of the 2006 Report Card on American Education can only add fuel to this growing fi re of educational discontent. Despite substantial increases in resources being spent on primary and secondary education over the past two decades—per pupil expenditures have increased by 77.4 percent (after adjusting for infl ation), student performance has improved only slightly – 71 percent of American eighth graders are still performing below profi ciency in math according to the 2005 National Assessment of Education Progress (NAEP) test.
The 2006 Report Card, with its more than 50 tables and fi gures that display in various ways more than 100 measures of educational resources and achievement, strengthens the growing consensus that simply increasing spending on education is not enough to improve student performance. These measures and the analysis based on them confi rms that there is no evident correlation between pupil-to-teacher ratios, spending per pupil, and teacher salaries on the one hand, and educational achievement as measured by various standardized test scores, on the other hand. In other words, lawmakers working to improve America’s beleaguered education system must look beyond these conventional measures of investments in schools to fi nd the keys to educational excellence.
The tremendous growth and popularity of charter schools (40 states and the District of Columbia have enacted charter school laws governing over 3,617 operating charter schools),
educational tax credit programs, private scholarship funds, and vouchers indicate that improving student achievement is not based on dollars spent, schools constructed, or even teachers hired. Instead, improvements are realized when accountability, choice and competition are injected into our current educational system. Instituting strong accountability measures that hold both students and teachers responsible for learning will help schools to focus resources where they are most needed. Increasing parental involvement in the process by giving them a greater say in determining which educational choice best meets the needs of their child guarantees that a child’s educational future is determined on the most local level possible – their parent. And fi nally, by forcing the veritable monopoly that is our public school system to compete in an open educational market, we can harness the immense power of the free market system to bring about improvements in our nation’s schools. Faced with losing students to better educational options, public schools will have to improve.
Basic highlights of the 2006 Report Card on American Education include:
■ Massachusetts, followed by Minnesota, New Hampshire and Montana, had the top performing public elementary and secondary schools in the nation, as measured by several standardized tests. Minnesota, Massachusetts and New Hampshire were ranked fi rst, second and third respectively in last year’s Report Card. The District of Columbia, Mississippi and New Mexico ranked at the bottom of the scale (See Table ES.1).
■ Seventy one percent of public school eighth graders taking the NAEP mathematics exam in 2005 performed below the “profi ciency” level (See Table 2.1A).
■ Over the past 20 years, expenditures per pupil in constant dollar terms have increased nationwide by 77.4 percent. Maine (+140.8 percent), followed closely by Georgia and South Carolina (+135.5 percent) led the nation in increased spending since 1983-1984 (See Table 1.8).
■ There is no immediately evident correlation between conventional measures of education inputs, such as expenditures per pupil and teacher salaries, and educational outputs, such as average scores on standardized tests. In fact, of all the educational inputs measured in this study, only higher pupil-to-teacher ratios, fewer students per school, and a lower percentage of a state’s total budget received from the federal government have a positive impact on educational achievement. These results, however, are weak at best, and do not hold when measured as changes over the past two decades.
Executive Summary and Highlights

4 | A Report Card on American Education: A State-by-State Analysis
■ Of the ten states that increased their per pupil expenditures the most over the past two decades Maine (+140.8 percent), Georgia and South Carolina (+135.5 percent), Ohio (+117.0 percent), Indiana (+111.4 percent), Arkansas (+107.5 percent), Missouri (+106.8 percent), New Hampshire (+106.3 percent), Vermont (+102.0 percent), and the District of Columbia (+100.4 percent) only New Hampshire (3rd) and Vermont (5th) ranked in the top ten in academic achievement. Three states, Arkansas (41st), Georgia (45th), and the District of Columbia (51st) ranked in the bottom ten in academic achievement (See Table 1.8).
■ Of the ten states that experienced the greatest decreases in pupil-to-teacher ratios over the past two decades Alabama (-36.4 percent), Hawaii (-27.0 percent), Maine (-25.8 percent), Louisiana (-22.2 percent), Vermont (-21.5 percent), Virginia (-21.4 percent), New Mexico and Tennessee (-21.1 percent), Mississippi (-20.5 percent), and North Carolina (-19.3 percent) only Vermont (5th) ranked in the top ten in academic achievement. Five states, Hawaii (46th), Louisiana (47th), Alabama (48th), New Mexico (49th), and Mississippi (50th) all ranked in the bottom ten in academic achievement (See Table 1.1).
Other key, state-by-state fi ndings of the report include:
Forty states and the District of Columbia have passed charter school laws since 1991. There were 3,617 charter schools operating in these states and the District of Columbia as of Fall 2005, educating approximately 1,074,809 students. (See Table 4.6)
According to the Center for Education Reform’s latest ranking the District of Columbia, Minnesota, Delaware, Arizona, Michigan, Indiana, and California have the strongest charter school laws—all receiving an “A” grade. Mississippi and Iowa have the weakest charter school laws—both receiving an “F” grade. (See Table 4.7)
Arizona (15.8 percent), Oregon (12.6 percent), Alaska (3 percent), and Florida (2.3 percent) were the only states to experience a growth in the pupil-per-teacher ratio from 1983-84 to 2003-04. Nationally, the average pupil-per-teacher ratio has decreased by 10.9 percent, from 17.4 students per teacher during the 1983-84 school year to 15.5 students per teacher during the 2003-04 school year. (See Table 1.1)
In 2004 40 percent of high school graduates took the ACT Assessment test, with a national average score of 20.9. The ACT is the primary test taken in 26 states. In those 26 states, only three states Iowa (22), and Minnesota and Wisconsin (22.2) had an average score of 22 or greater in 2004 (See Table 2.3).
Of the 25 states and the District of Columbia in which the SAT was taken by more students than the ACT Assessment, eight had an average score at or above the national average of 1026 in 2004: Washington (1059), Oregon (1055), Arizona (1047), New Hampshire (1043), Massachusetts (1041), Alaska (1032), Connecticut (1030) and Vermont (1028). (See Table 2.3)
STATE RANKMassachusetts 1Minnesota 2New Hampshire 3Montana 4Vermont 5Wisconsin 6South Dakota 7Washington 8Iowa 9Nebraska 10North Dakota 11New Jersey 12Virginia 13Oregon 14Ohio 15Wyoming 16Connecticut 17Maine 18Missouri 19Pennsylvania 20Utah 21Kansas 22New York 23Idaho 24Alaska 25Indiana 26Maryland 27Colorado 28Delaware 29North Carolina 30Michigan 31Illinois 32Arizona 33Kentucky 34Rhode Island 35Texas 36Oklahoma 37Nevada 38Tennessee 39South Carolina 40Arkansas 41California 42Florida 43West Virginia 44Georgia 45Hawaii 46Louisiana 47Alabama 48New Mexico 49Mississippi 50District of Columbia 51
TABLE ES.1
2006 Ranking of States by Academic Achievement
A Report Card on American Education: A State-by-State Analysis | 5
The American Legislative Exchange Council (ALEC)
published its original Report Card on American
Education: A State-by-State Analysis in 1993. Since then, it has changed and grown, so that this year’s edition, the thirteenth, collects and provides within a single volume, the most basic and customary measures of educational resources and achievement on a state-by-state basis.
The Report Card is neither a policy manual nor an ideological document. However, ALEC believes that the information presented in this report serves a vital function in our efforts to reform our nation’s public school system. Only through a thorough examination of the “inputs” and “outputs” into the public educational system can policy makers at the local, state, and federal levels understand what public education resources produce the best public education results. It is necessary that a clear understanding of what has or has not worked in the past be gained, in order to chart a course to success in the future.
The 2006 Report Card on American Education is divided into fi ve sections:State SnapshotsChapter One: Measures of educational inputsChapter Two: Measures of educational outputsChapter Three: Measures of correlation between educational inputs and outputsChapter Four: Basic educational demographics, charter school and school choice information
The fi rst section, “State Snapshots” presents the most important measures of educational inputs, outputs, and demographic information from the following chapters for each of the fi fty states and the District of Columbia. Individual state information is provided so that policy makers can gain a clear picture of each state’s public school system for the most recent year that was studied.
Chapters One through Four present and analyze the latest available data for public elementary and secondary schools in each of the fi fty states and the District of Columbia. Historical data is presented when available and appropriate for three benchmark school years: 1983-84, 1993-94, and 2003-04. In addition, for several of the key measures of educational inputs, historical data for 1998-99 has been provided in order to examine more recent trends in educational spending. Such a dual presentation should be valuable for policymakers, as
they examine both what works over time, from state-to-state, and what has worked within a single state. Most of the data in this year’s Report Card is derived from the National Center for Education Statistics’ utilizing their Digest of Education Statistics reports and their Common Core of Data (CCD) database.
Chapter One presents basic data on educational “inputs” or the resources that states dedicate to public elementary and secondary education. Among the factors reported are fi nancial variables, such as expenditures per pupil, average teacher and instructional staff salaries, and sources of educational funding. Also recorded are several staffi ng variables, such as total number of instructional staff, total number of education personnel, pupil-to-teacher ratios, and pupil-to-staff ratios. Chapter one also includes a breakdown of the funds received by the states from several key federal education programs. In addition, chapter one more closely examines the variations in average teacher salaries as compared to the average salaries of workers with at least a bachelor degree.
Chapter Two presents basic data on the effectiveness of public education in each state—what are referred to as educational “outputs.” This chapter presents various measures that may be used as general guidelines to educational success in the American public school system, such as: Scholastic Aptitude Test (SAT) results, American Academic Testing (ACT) results, and National Assessment of Educational Progress (NAEP) test results. 2005 marked the second year that all fi fty states and the District of Columbia participated in the NAEP exams.
Chapter Three presents several methods of correlating the educational “inputs” of chapter one and the educational “outputs” of chapter two. This chapter is where we more closely examine the impact that factors such as class size, teacher salaries and per-pupil spending have on standardized test scores; and attempt to determine if, in fact, putting more money into our current educational system will result in greater student achievement. This chapter contains two basic
components. The fi rst simply presents, on a single table,
measures of various educational inputs and outputs. Thus,
SAT, ACT, and NAEP test results are presented alternatively
with measures of public school staffi ng, public school
fi nancial inputs, and trends over time in key measures of both
input categories. The fi nal section of chapter three constructs
and tests a statistical model of the correlation between a
Introduction

6 | A Report Card on American Education: A State-by-State Analysis
combination of educational inputs and outputs. Employing
all these tests substantially decreases the likelihood that
conclusions drawn from all three will be biased or misleading.
This is done in order to respond to some analysts who have
criticized each of these approaches as biased, incomplete, or
misleading. Such a diverse analysis gives policy makers the
best foundation on which to build their thinking and actions.
Chapter Four highlights some basic state educational
information, such as public school enrollment, change in
enrollment, and enrollment by size of school district. In
addition, chapter four presents basic data on the growth
of charter schools, such as number of charter schools and
enrollment, strength of each states charter school law, and
minority enrollment compared to public schools. Chapter
four also includes tables that rank those state school choice
programs in existence around the country on accessibility and
usability by parents.
The author would also like to thank Lori Drummer and Matt
Warner at ALEC for their support and guidance throughout
every stage of this report.

A Report Card on American Education: A State-by-State Analysis | 7
ALECAmerican Legislative Exchange Council
State Snapshots

8 | A Report Card on American Education: A State-by-State Analysis
Student Demographics
2004 NATIONAL NATIONAL AVERAGES AVERAGE RANK
AlabamaNational Rank of Academic Achievement
Charter Schools FALL 2005
Number of Charter Schools 0
Number of Charter School Students 0
2005 NATIONAL NATIONAL AVERAGES AVERAGE RANK
NAEP Scores Grade 8 Mathematics 262 278 49
% Above Profi ciency 15 29
Grade 4 Mathematics 225 237 49
% Above Profi ciency 21 35
Grade 8 Reading 252 260 46
% Above Profi ciency 22 29
Grade 4 Reading 208 217 45
% Above Profi ciency 22 30
ACT Scores Composite Score 20.2 20.9 44
% of Graduates Take ACT 76 40
% Change in Cumulative ACT Scores 1994-2004 1.51 0.48 22
SAT Scores Composite Score 1113 1026 17
% of Graduates Take SAT 10 48
% Change in Cumulative SAT Scores 1984-2004 10.31 2.70 1
Educational Inputs 2005 NATIONAL NATIONAL AVERAGES AVERAGE RANK
Expenditures per Pupil $7,110 $9,052 44
% Change in Expenditures per Pupil* 86.63 77.37 21
Pupil/Teacher Ratio 12.6 15.5 3
% Change in Pupil-Teacher Ratio* -36.36 -10.88 1
Average Salary of Instructional Staff $38,325 $44,133 43
*In the period between the 1983-84 school year and the 2003-2004 school year.
White 59.9%
Black 36.4%
Hispanic 2.1%
Asian/Pacifi c Islander 0.9%
American Indian/Alaskan 0.8%
Funding % from Federal Government 11.55
% from State and Local Sources 88.45
National Rank 11
Educational Outputs
48

A Report Card on American Education: A State-by-State Analysis | 9
2004 NATIONAL NATIONAL AVERAGES AVERAGE RANK
AlaskaNational Rank of Academic Achievement
Charter Schools FALL 2005
Number of Charter Schools 24
Number of Charter School Students 4,773
Student Demographics
2005 NATIONAL NATIONAL AVERAGES AVERAGE RANK
NAEP Scores Grade 8 Mathematics 279 278 29
% Above Profi ciency 29 29
Grade 4 Mathematics 236 237 33
% Above Profi ciency 34 35
Grade 8 Reading 259 260 34
% Above Profi ciency 27 29
Grade 4 Reading 211 217 42
% Above Profi ciency 26 30
ACT Scores Composite Score 21.3 20.9 28
% of Graduates Take ACT 29 40
% Change in Cumulative ACT Scores 1994-2004 1.91 0.48 13
SAT Scores Composite Score 1032 1026 31
% of Graduates Take SAT 53 48
% Change in Cumulative SAT Scores 1984-2004 -1.43 2.70 43
Educational Inputs 2005 NATIONAL NATIONAL AVERAGES AVERAGE RANK
Expenditures per Pupil $11,833 $9,052 5
% Change in Expenditures per Pupil* 0.37 77.37 51
Pupil/Teacher Ratio 17.2 15.5 42
% Change in Pupil-Teacher Ratio* 2.99 -10.88 49
Average Salary of Instructional Staff $51,736 $44,133 11
*In the period between the 1983-84 school year and the 2003-2004 school year.
White 58.9%
Black 4.7%
Hispanic 3.9%
Asian/Pacifi c Islander 6.5%
American Indian/Alaskan 26.0%
Educational Outputs
25
Funding % from Federal Government 17.71
% from State and Local Sources 82.29
National Rank 1

10 | A Report Card on American Education: A State-by-State Analysis
Student Demographics
2004 NATIONAL NATIONAL AVERAGES AVERAGE RANK
ArizonaNational Rank of Academic Achievement
Charter Schools FALL 2005
Number of Charter Schools 449
Number of Charter School Students 96,934
2005 NATIONAL NATIONAL AVERAGES AVERAGE RANK
NAEP Scores Grade 8 Mathematics 274 278 34
% Above Profi ciency 26 29
Grade 4 Mathematics 230 237 43
% Above Profi ciency 28 35
Grade 8 Reading 255 260 42
% Above Profi ciency 23 29
Grade 4 Reading 207 217 46
% Above Profi ciency 24 30
ACT Scores Composite Score 21.5 20.9 20
% of Graduates Take ACT 20 40
% Change in Cumulative ACT Scores 1994-2004 1.9 0.48 15
SAT Scores Composite Score 1047 1026 27
% of Graduates Take SAT 32 48
% Change in Cumulative SAT Scores 1984-2004 -6.35 2.70 51
Educational Inputs 2005 NATIONAL NATIONAL AVERAGES AVERAGE RANK
Expenditures per Pupil $6,704 $9,052 48
% Change in Expenditures per Pupil* 47.72 77.37 49
Pupil/Teacher Ratio 21.3 15.5 50
% Change in Pupil-Teacher Ratio* 15.76 -10.88 51
Average Salary of Instructional Staff $41,843 $44,133 28
*In the period between the 1983-84 school year and the 2003-2004 school year.
White 49.2%
Black 4.8%
Hispanic 37.2%
Asian/Pacifi c Islander 2.2%
American Indian/Alaskan 6.6%
Funding % from Federal Government 11.42
% from State and Local Sources 88.58
National Rank 12
Educational Outputs
33

A Report Card on American Education: A State-by-State Analysis | 11
Student Demographics
2004 NATIONAL NATIONAL AVERAGES AVERAGE RANK
ArkansasNational Rank of Academic Achievement
Charter Schools FALL 2005
Number of Charter Schools 17
Number of Charter School Students 3,477
2005 NATIONAL NATIONAL AVERAGES AVERAGE RANK
NAEP Scores Grade 8 Mathematics 272 278 39
% Above Profi ciency 22 29
Grade 4 Mathematics 236 237 33
% Above Profi ciency 34 35
Grade 8 Reading 258 260 37
% Above Profi ciency 26 29
Grade 4 Reading 217 217 34
% Above Profi ciency 29 30
ACT Scores Composite Score 20.4 20.9 39
% of Graduates Take ACT 73 40
% Change in Cumulative ACT Scores 1994-2004 1.49 0.48 23
SAT Scores Composite Score 1124 1026 13
% of Graduates Take SAT 6 48
% Change in Cumulative SAT Scores 1984-2004 2.55 2.70 22
Educational Inputs 2005 NATIONAL NATIONAL AVERAGES AVERAGE RANK
Expenditures per Pupil $7,117 $9,052 43
% Change in Expenditures per Pupil* 107.49 77.37 6
Pupil/Teacher Ratio 14.7 15.5 22
% Change in Pupil-Teacher Ratio* -16.00 -10.88 14
Average Salary of Instructional Staff $39,314 $44,133 38
*In the period between the 1983-84 school year and the 2003-2004 school year.
White 69.9%
Black 23.1%
Hispanic 5.3%
Asian/Pacifi c Islander 1.1%
American Indian/Alaskan 0.6%
Educational Outputs
41
Funding % from Federal Government 11.72
% from State and Local Sources 88.28
National Rank 10

12 | A Report Card on American Education: A State-by-State Analysis
Student Demographics
2004 NATIONAL NATIONAL AVERAGES AVERAGE RANK
CaliforniaNational Rank of Academic Achievement
Charter Schools FALL 2005
Number of Charter Schools 592
Number of Charter School Students 219,480
2005 NATIONAL NATIONAL AVERAGES AVERAGE RANK
NAEP Scores Grade 8 Mathematics 269 278 43
% Above Profi ciency 22 29
Grade 4 Mathematics 230 237 43
% Above Profi ciency 28 35
Grade 8 Reading 250 260 49
% Above Profi ciency 21 29
Grade 4 Reading 207 217 47
% Above Profi ciency 22 30
ACT Scores Composite Score 21.6 20.9 17
% of Graduates Take ACT 14 40
% Change in Cumulative ACT Scores 1994-2004 2.37 0.48 10
SAT Scores Composite Score 1020 1026 37
% of Graduates Take SAT 49 48
% Change in Cumulative SAT Scores 1984-2004 2.10 2.70 27
Educational Inputs 2005 NATIONAL NATIONAL AVERAGES AVERAGE RANK
Expenditures per Pupil $8,728 $9,052 25
% Change in Expenditures per Pupil* 74.58 77.37 32
Pupil/Teacher Ratio 21.1 15.5 49
% Change in Pupil-Teacher Ratio* -8.26 -10.88 28
Average Salary of Instructional Staff $56,444 $44,133 3
*In the period between the 1983-84 school year and the 2003-2004 school year.
White 32.9%
Black 8.2%
Hispanic 46.7%
Asian/Pacifi c Islander 11.3%
American Indian/Alaskan 0.8%
Funding % from Federal Government 9.87
% from State and Local Sources 90.13
National Rank 18
Educational Outputs
42

A Report Card on American Education: A State-by-State Analysis | 13
Student Demographics
2004 NATIONAL NATIONAL AVERAGES AVERAGE RANK
ColoradoNational Rank of Academic Achievement
Charter Schools FALL 2005
Number of Charter Schools 116
Number of Charter School Students 38,032
2005 NATIONAL NATIONAL AVERAGES AVERAGE RANK
NAEP Scores Grade 8 Mathematics 281 278 20
% Above Profi ciency 32 29
Grade 4 Mathematics 239 237 24
% Above Profi ciency 39 35
Grade 8 Reading 265 260 21
% Above Profi ciency 31 29
Grade 4 Reading 224 217 11
% Above Profi ciency 36 30
ACT Scores Composite Score 20.3 20.9 40
% of Graduates Take ACT 100 40
% Change in Cumulative ACT Scores 1994-2004 -5.14 0.48 51
SAT Scores Composite Score 1107 1026 19
% of Graduates Take SAT 27 48
% Change in Cumulative SAT Scores 1984-2004 1.65 2.70 30
Educational Inputs 2005 NATIONAL NATIONAL AVERAGES AVERAGE RANK
Expenditures per Pupil $8,486 $9,052 30
% Change in Expenditures per Pupil* 54.88 77.37 44
Pupil/Teacher Ratio 16.9 15.5 40
% Change in Pupil-Teacher Ratio* -7.14 -10.88 33
Average Salary of Instructional Staff $43,319 $44,133 22
*In the period between the 1983-84 school year and the 2003-2004 school year.
White 64.5%
Black 5.8%
Hispanic 25.3%
Asian/Pacifi c Islander 3.1%
American Indian/Alaskan 1.2%
Educational Outputs
28
Funding % from Federal Government 6.50
% from State and Local Sources 93.50
National Rank 44
14 | A Report Card on American Education: A State-by-State Analysis
Student Demographics
2004 NATIONAL NATIONAL AVERAGES AVERAGE RANK
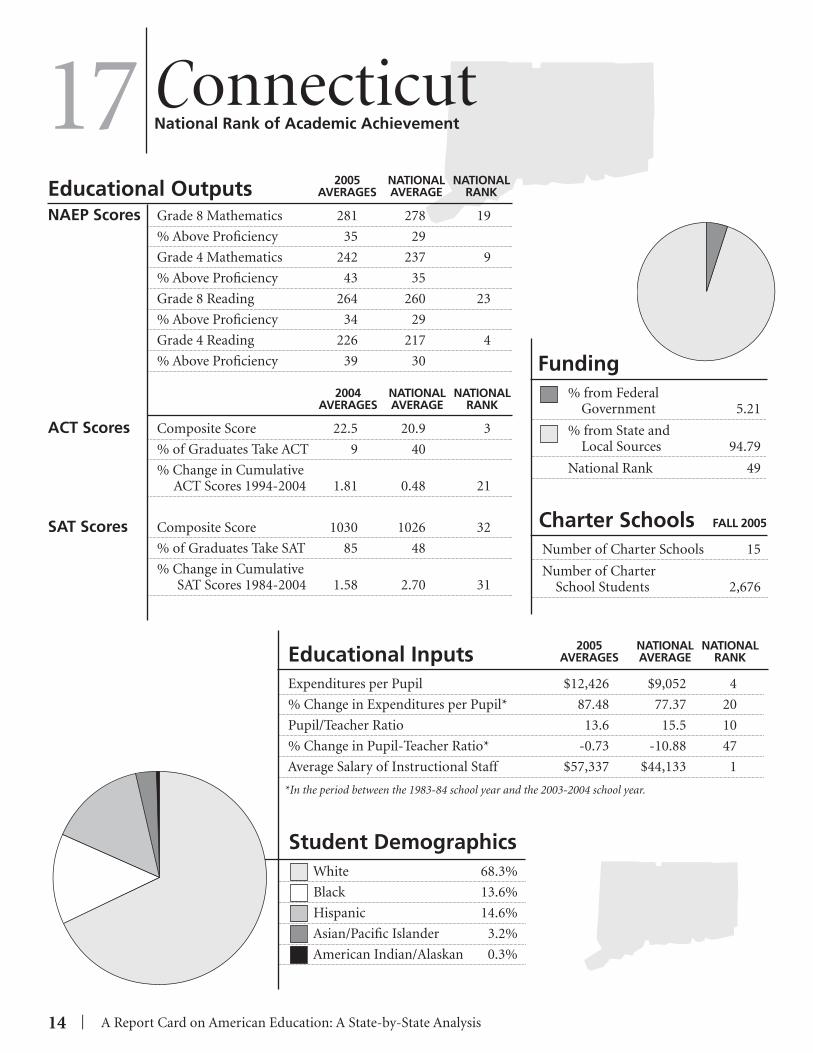
ConnecticutNational Rank of Academic Achievement
Charter Schools FALL 2005
Number of Charter Schools 15
Number of Charter School Students 2,676
2005 NATIONAL NATIONAL AVERAGES AVERAGE RANK
NAEP Scores Grade 8 Mathematics 281 278 19
% Above Profi ciency 35 29
Grade 4 Mathematics 242 237 9
% Above Profi ciency 43 35
Grade 8 Reading 264 260 23
% Above Profi ciency 34 29
Grade 4 Reading 226 217 4
% Above Profi ciency 39 30
ACT Scores Composite Score 22.5 20.9 3
% of Graduates Take ACT 9 40
% Change in Cumulative ACT Scores 1994-2004 1.81 0.48 21
SAT Scores Composite Score 1030 1026 32
% of Graduates Take SAT 85 48
% Change in Cumulative SAT Scores 1984-2004 1.58 2.70 31
Educational Inputs 2005 NATIONAL NATIONAL AVERAGES AVERAGE RANK
Expenditures per Pupil $12,426 $9,052 4
% Change in Expenditures per Pupil* 87.48 77.37 20
Pupil/Teacher Ratio 13.6 15.5 10
% Change in Pupil-Teacher Ratio* -0.73 -10.88 47
Average Salary of Instructional Staff $57,337 $44,133 1
*In the period between the 1983-84 school year and the 2003-2004 school year.
White 68.3%
Black 13.6%
Hispanic 14.6%
Asian/Pacifi c Islander 3.2%
American Indian/Alaskan 0.3%
Funding % from Federal Government 5.21
% from State and Local Sources 94.79
National Rank 49
Educational Outputs
17

A Report Card on American Education: A State-by-State Analysis | 15
Student Demographics
2004 NATIONAL NATIONAL AVERAGES AVERAGE RANK
DelawareNational Rank of Academic Achievement
Charter Schools FALL 2005
Number of Charter Schools 15
Number of Charter School Students 6,791
2005 NATIONAL NATIONAL AVERAGES AVERAGE RANK
NAEP Scores Grade 8 Mathematics 281 278 21
% Above Profi ciency 31 29
Grade 4 Mathematics 240 237 23
% Above Profi ciency 36 35
Grade 8 Reading 266 260 18
% Above Profi ciency 31 29
Grade 4 Reading 226 217 6
% Above Profi ciency 35 30
ACT Scores Composite Score 21.5 20.9 20
% of Graduates Take ACT 5 40
% Change in Cumulative ACT Scores 1994-2004 -1.83 0.48 48
SAT Scores Composite Score 999 1026 46
% of Graduates Take SAT 73 48
% Change in Cumulative SAT Scores 1984-2004 -1.87 2.70 44
Educational Inputs 2005 NATIONAL NATIONAL AVERAGES AVERAGE RANK
Expenditures per Pupil $11,228 $9,052 6
% Change in Expenditures per Pupil* 88.56 77.37 17
Pupil/Teacher Ratio 15.2 15.5 28
% Change in Pupil-Teacher Ratio* -5.00 -10.88 43
Average Salary of Instructional Staff $49,366 $44,133 13
*In the period between the 1983-84 school year and the 2003-2004 school year.
White 57.3%
Black 31.9%
Hispanic 7.9%
Asian/Pacifi c Islander 2.6%
American Indian/Alaskan 0.3%
Educational Outputs
29
Funding % from Federal Government 8.60
% from State and Local Sources 91.40
National Rank 29

16 | A Report Card on American Education: A State-by-State Analysis
Student Demographics
2004 NATIONAL NATIONAL AVERAGES AVERAGE RANK
District of ColumbiaNational Rank of Academic Achievement
Charter Schools FALL 2005
Number of Charter Schools 65
Number of Charter School Students 20,116
2005 NATIONAL NATIONAL AVERAGES AVERAGE RANK
NAEP Scores Grade 8 Mathematics 245 278 51
% Above Profi ciency 7 29
Grade 4 Mathematics 211 237 51
% Above Profi ciency 9 35
Grade 8 Reading 238 260 51
% Above Profi ciency 12 29
Grade 4 Reading 191 217 51
% Above Profi ciency 11 30
ACT Scores Composite Score 17.8 20.9 51
% of Graduates Take ACT 29 40
% Change in Cumulative ACT Scores 1994-2004 2.89 0.48 9
SAT Scores Composite Score 965 1026 51
% of Graduates Take SAT 77 48
% Change in Cumulative SAT Scores 1984-2004 8.79 2.70 5
Educational Inputs 2005 NATIONAL NATIONAL AVERAGES AVERAGE RANK
Expenditures per Pupil $14,190 $9,052 1
% Change in Expenditures per Pupil* 100.41 77.37 10
Pupil/Teacher Ratio 13.8 15.5 15
% Change in Pupil-Teacher Ratio* -3.50 -10.88 46
Average Salary of Instructional Staff $57,009 $44,133 2
*In the period between the 1983-84 school year and the 2003-2004 school year.
White 4.8%
Black 84.3%
Hispanic 9.5%
Asian/Pacifi c Islander 1.4%
American Indian/Alaskan 0.0%
Funding % from Federal Government 13.76
% from State and Local Sources 86.24
National Rank 7
Educational Outputs
51
A Report Card on American Education: A State-by-State Analysis | 17
Student Demographics
2004 NATIONAL NATIONAL AVERAGES AVERAGE RANK
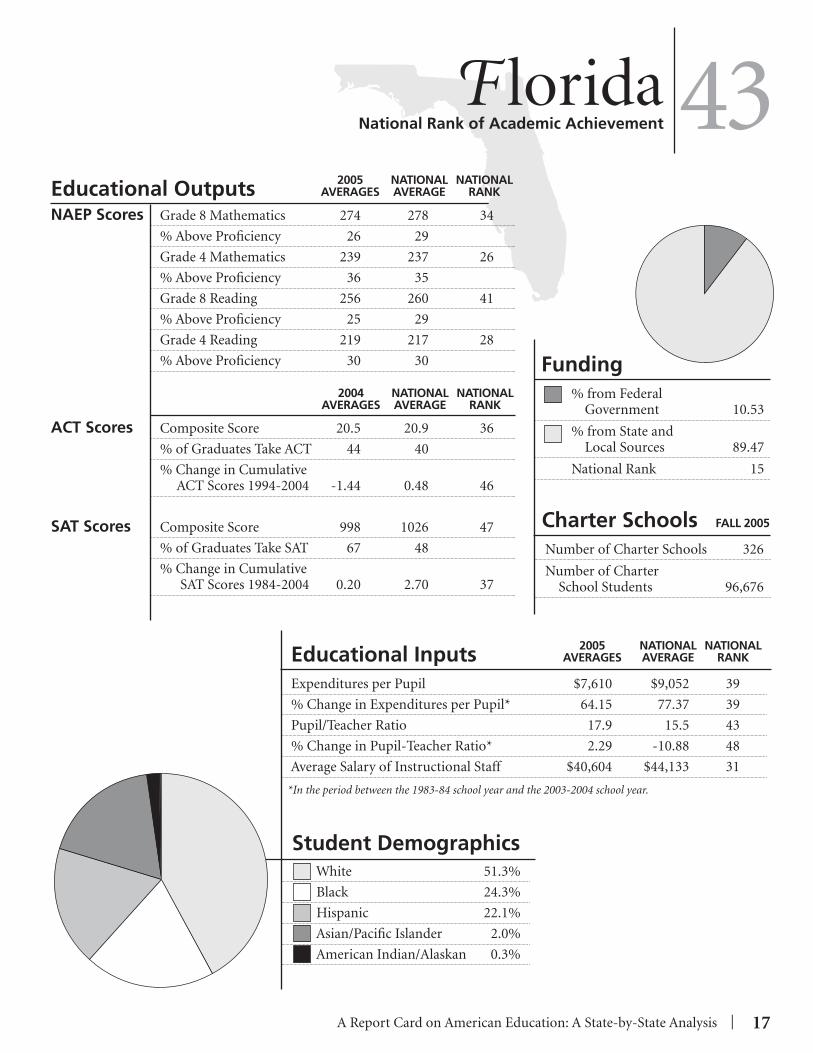
F loridaNational Rank of Academic Achievement
Charter Schools FALL 2005
Number of Charter Schools 326
Number of Charter School Students 96,676
2005 NATIONAL NATIONAL AVERAGES AVERAGE RANK
NAEP Scores Grade 8 Mathematics 274 278 34
% Above Profi ciency 26 29
Grade 4 Mathematics 239 237 26
% Above Profi ciency 36 35
Grade 8 Reading 256 260 41
% Above Profi ciency 25 29
Grade 4 Reading 219 217 28
% Above Profi ciency 30 30
ACT Scores Composite Score 20.5 20.9 36
% of Graduates Take ACT 44 40
% Change in Cumulative ACT Scores 1994-2004 -1.44 0.48 46
SAT Scores Composite Score 998 1026 47
% of Graduates Take SAT 67 48
% Change in Cumulative SAT Scores 1984-2004 0.20 2.70 37
Educational Inputs 2005 NATIONAL NATIONAL AVERAGES AVERAGE RANK
Expenditures per Pupil $7,610 $9,052 39
% Change in Expenditures per Pupil* 64.15 77.37 39
Pupil/Teacher Ratio 17.9 15.5 43
% Change in Pupil-Teacher Ratio* 2.29 -10.88 48
Average Salary of Instructional Staff $40,604 $44,133 31
*In the period between the 1983-84 school year and the 2003-2004 school year.
White 51.3%
Black 24.3%
Hispanic 22.1%
Asian/Pacifi c Islander 2.0%
American Indian/Alaskan 0.3%
Educational Outputs
43
Funding % from Federal Government 10.53
% from State and Local Sources 89.47
National Rank 15

18 | A Report Card on American Education: A State-by-State Analysis
Student Demographics
2004 NATIONAL NATIONAL AVERAGES AVERAGE RANK
GeorgiaNational Rank of Academic Achievement
Charter Schools FALL 2005
Number of Charter Schools 49
Number of Charter School Students 21,116
2005 NATIONAL NATIONAL AVERAGES AVERAGE RANK
NAEP Scores Grade 8 Mathematics 272 278 37
% Above Profi ciency 23 29
Grade 4 Mathematics 234 237 36
% Above Profi ciency 30 35
Grade 8 Reading 257 260 40
% Above Profi ciency 24 29
Grade 4 Reading 214 217 39
% Above Profi ciency 26 30
ACT Scores Composite Score 20.0 20.9 47
% of Graduates Take ACT 26 40
% Change in Cumulative ACT Scores 1994-2004 -1.48 0.48 47
SAT Scores Composite Score 987 1026 49
% of Graduates Take SAT 73 48
% Change in Cumulative SAT Scores 1984-2004 6.36 2.70 8
Educational Inputs 2005 NATIONAL NATIONAL AVERAGES AVERAGE RANK
Expenditures per Pupil $8,804 $9,052 23
% Change in Expenditures per Pupil* 135.49 77.37 2
Pupil/Teacher Ratio 15.7 15.5 32
% Change in Pupil-Teacher Ratio* -16.93 -10.88 12
Average Salary of Instructional Staff $45,988 $44,133 16
*In the period between the 1983-84 school year and the 2003-2004 school year.
White 52.1%
Black 38.3%
Hispanic 6.9%
Asian/Pacifi c Islander 2.5%
American Indian/Alaskan 0.2%
Funding % from Federal Government 8.06
% from State and Local Sources 91.94
National Rank 32
Educational Outputs
45

A Report Card on American Education: A State-by-State Analysis | 19
Student Demographics
2004 NATIONAL NATIONAL AVERAGES AVERAGE RANK
HawaiiNational Rank of Academic Achievement
Charter Schools FALL 2005
Number of Charter Schools 27
Number of Charter School Students 2,405
2005 NATIONAL NATIONAL AVERAGES AVERAGE RANK
NAEP Scores Grade 8 Mathematics 266 278 46
% Above Profi ciency 18 29
Grade 4 Mathematics 230 237 45
% Above Profi ciency 27 35
Grade 8 Reading 249 260 50
% Above Profi ciency 18 29
Grade 4 Reading 210 217 43
% Above Profi ciency 13 30
ACT Scores Composite Score 21.7 20.9 14
% of Graduates Take ACT 18 40
% Change in Cumulative ACT Scores 1994-2004 -1.36 0.48 45
SAT Scores Composite Score 1001 1026 45
% of Graduates Take SAT 60 48
% Change in Cumulative SAT Scores 1984-2004 2.98 2.70 18
Educational Inputs 2005 NATIONAL NATIONAL AVERAGES AVERAGE RANK
Expenditures per Pupil $8,733 $9,052 24
% Change in Expenditures per Pupil* 57.95 77.37 40
Pupil/Teacher Ratio 16.5 15.5 38
% Change in Pupil-Teacher Ratio* -26.99 -10.88 2
Average Salary of Instructional Staff $45,479 $44,133 18
*In the period between the 1983-84 school year and the 2003-2004 school year.
White 20.2%
Black 2.4%
Hispanic 4.5%
Asian/Pacifi c Islander 72.4%
American Indian/Alaskan 0.5%
Educational Outputs
46
Funding % from Federal Government 8.20
% from State and Local Sources 91.80
National Rank 31

20 | A Report Card on American Education: A State-by-State Analysis
Student Demographics
2004 NATIONAL NATIONAL AVERAGES AVERAGE RANK
IdahoNational Rank of Academic Achievement
Charter Schools FALL 2005
Number of Charter Schools 23
Number of Charter School Students 7,795
2005 NATIONAL NATIONAL AVERAGES AVERAGE RANK
NAEP Scores Grade 8 Mathematics 281 278 24
% Above Profi ciency 30 29
Grade 4 Mathematics 242 237 14
% Above Profi ciency 35 35
Grade 8 Reading 264 260 24
% Above Profi ciency 32 29
Grade 4 Reading 222 217 18
% Above Profi ciency 33 30
ACT Scores Composite Score 21.3 20.9 28
% of Graduates Take ACT 59 40
% Change in Cumulative ACT Scores 1994-2004 0.47 0.48 38
SAT Scores Composite Score 1079 1026 23
% of Graduates Take SAT 20 48
% Change in Cumulative SAT Scores 1984-2004 7.15 2.70 7
Educational Inputs 2005 NATIONAL NATIONAL AVERAGES AVERAGE RANK
Expenditures per Pupil $6,757 $9,052 47
% Change in Expenditures per Pupil* 88.90 77.37 16
Pupil/Teacher Ratio 17.9 15.5 43
% Change in Pupil-Teacher Ratio* -12.25 -10.88 22
Average Salary of Instructional Staff $41,080 $44,133 30
*In the period between the 1983-84 school year and the 2003-2004 school year.
White 84.1%
Black 0.9%
Hispanic 12.0%
Asian/Pacifi c Islander 1.5%
American Indian/Alaskan 1.6%
Funding % from Federal Government 9.81
% from State and Local Sources 90.19
National Rank 20
Educational Outputs
24

A Report Card on American Education: A State-by-State Analysis | 21
Student Demographics
2004 NATIONAL NATIONAL AVERAGES AVERAGE RANK
IllinoisNational Rank of Academic Achievement
Charter Schools FALL 2005
Number of Charter Schools 41
Number of Charter School Students 17,235
2005 NATIONAL NATIONAL AVERAGES AVERAGE RANK
NAEP Scores Grade 8 Mathematics 278 278 31
% Above Profi ciency 28 29
Grade 4 Mathematics 233 237 38
% Above Profi ciency 32 35
Grade 8 Reading 264 260 25
% Above Profi ciency 31 29
Grade 4 Reading 216 217 35
% Above Profi ciency 30 30
ACT Scores Composite Score 20.3 20.9 40
% of Graduates Take ACT 99 40
% Change in Cumulative ACT Scores 1994-2004 -3.79 0.48 50
SAT Scores Composite Score 1182 1026 5
% of Graduates Take SAT 10 48
% Change in Cumulative SAT Scores 1984-2004 10.06 2.70 2
Educational Inputs 2005 NATIONAL NATIONAL AVERAGES AVERAGE RANK
Expenditures per Pupil $9,580 $9,052 19
% Change in Expenditures per Pupil* 87.87 77.37 18
Pupil/Teacher Ratio 16.5 15.5 39
% Change in Pupil-Teacher Ratio* -5.17 -10.88 42
Average Salary of Instructional Staff $54,230 $44,133 7
*In the period between the 1983-84 school year and the 2003-2004 school year.
White 57.4%
Black 21.1%
Hispanic 17.7%
Asian/Pacifi c Islander 3.6%
American Indian/Alaskan 0.2%
Educational Outputs
32
Funding % from Federal Government 8.45
% from State and Local Sources 91.55
National Rank 30
22 | A Report Card on American Education: A State-by-State Analysis
Student Demographics
2004 NATIONAL NATIONAL AVERAGES AVERAGE RANK
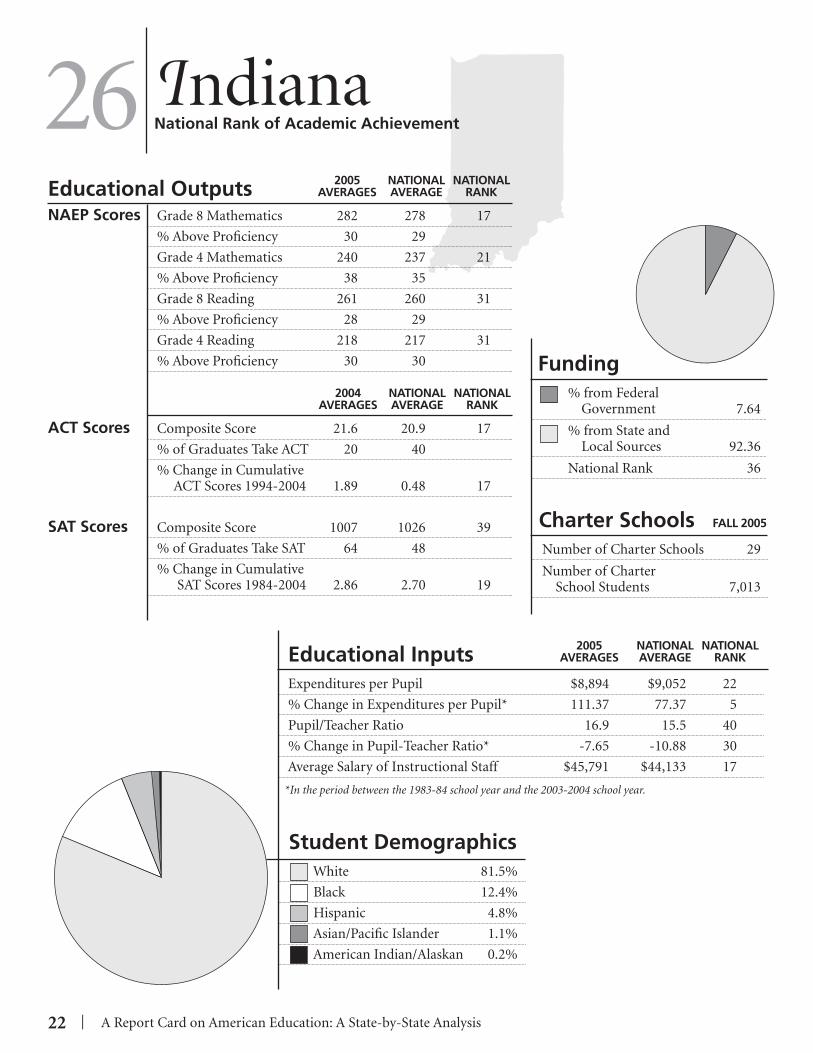
IndianaNational Rank of Academic Achievement
Charter Schools FALL 2005
Number of Charter Schools 29
Number of Charter School Students 7,013
2005 NATIONAL NATIONAL AVERAGES AVERAGE RANK
NAEP Scores Grade 8 Mathematics 282 278 17
% Above Profi ciency 30 29
Grade 4 Mathematics 240 237 21
% Above Profi ciency 38 35
Grade 8 Reading 261 260 31
% Above Profi ciency 28 29
Grade 4 Reading 218 217 31
% Above Profi ciency 30 30
ACT Scores Composite Score 21.6 20.9 17
% of Graduates Take ACT 20 40
% Change in Cumulative ACT Scores 1994-2004 1.89 0.48 17
SAT Scores Composite Score 1007 1026 39
% of Graduates Take SAT 64 48
% Change in Cumulative SAT Scores 1984-2004 2.86 2.70 19
Educational Inputs 2005 NATIONAL NATIONAL AVERAGES AVERAGE RANK
Expenditures per Pupil $8,894 $9,052 22
% Change in Expenditures per Pupil* 111.37 77.37 5
Pupil/Teacher Ratio 16.9 15.5 40
% Change in Pupil-Teacher Ratio* -7.65 -10.88 30
Average Salary of Instructional Staff $45,791 $44,133 17
*In the period between the 1983-84 school year and the 2003-2004 school year.
White 81.5%
Black 12.4%
Hispanic 4.8%
Asian/Pacifi c Islander 1.1%
American Indian/Alaskan 0.2%
Funding % from Federal Government 7.64
% from State and Local Sources 92.36
National Rank 36
Educational Outputs
26

A Report Card on American Education: A State-by-State Analysis | 23
Student Demographics
2004 NATIONAL NATIONAL AVERAGES AVERAGE RANK
IowaNational Rank of Academic Achievement
Charter Schools FALL 2005
Number of Charter Schools 7
Number of Charter School Students 1,332
2005 NATIONAL NATIONAL AVERAGES AVERAGE RANK
NAEP Scores Grade 8 Mathematics 284 278 12
% Above Profi ciency 34 29
Grade 4 Mathematics 240 237 22
% Above Profi ciency 37 35
Grade 8 Reading 267 260 15
% Above Profi ciency 34 29
Grade 4 Reading 221 217 21
% Above Profi ciency 33 30
ACT Scores Composite Score 22.0 20.9 11
% of Graduates Take ACT 67 40
% Change in Cumulative ACT Scores 1994-2004 0.46 0.48 39
SAT Scores Composite Score 1195 1026 1
% of Graduates Take SAT 5 48
% Change in Cumulative SAT Scores 1984-2004 1.70 2.70 29
Educational Inputs 2005 NATIONAL NATIONAL AVERAGES AVERAGE RANK
Expenditures per Pupil $8,602 $9,052 28
% Change in Expenditures per Pupil* 56.82 77.37 41
Pupil/Teacher Ratio 13.8 15.5 15
% Change in Pupil-Teacher Ratio* -10.97 -10.88 25
Average Salary of Instructional Staff $39,432 $44,133 37
*In the period between the 1983-84 school year and the 2003-2004 school year.
White 88.2%
Black 4.5%
Hispanic 4.9%
Asian/Pacifi c Islander 1.8%
American Indian/Alaskan 0.6%
Educational Outputs
9
Funding % from Federal Government 7.44
% from State and Local Sources 92.56
National Rank 37

24 | A Report Card on American Education: A State-by-State Analysis
Student Demographics
2004 NATIONAL NATIONAL AVERAGES AVERAGE RANK
KansasNational Rank of Academic Achievement
Charter Schools FALL 2005
Number of Charter Schools 25
Number of Charter School Students 1,950
2005 NATIONAL NATIONAL AVERAGES AVERAGE RANK
NAEP Scores Grade 8 Mathematics 264 278 47
% Above Profi ciency 34 29
Grade 4 Mathematics 246 237 2
% Above Profi ciency 47 35
Grade 8 Reading 267 260 15
% Above Profi ciency 34 29
Grade 4 Reading 220 217 25
% Above Profi ciency 33 30
ACT Scores Composite Score 21.6 20.9 17
% of Graduates Take ACT 75 40
% Change in Cumulative ACT Scores 1994-2004 1.89 0.48 18
SAT Scores Composite Score 1169 1026 8
% of Graduates Take SAT 9 48
% Change in Cumulative SAT Scores 1984-2004 1.92 2.70 28
Educational Inputs 2005 NATIONAL NATIONAL AVERAGES AVERAGE RANK
Expenditures per Pupil $8.028 $9,052 36
% Change in Expenditures per Pupil* 55.36 77.37 43
Pupil/Teacher Ratio 14.4 15.5 19
% Change in Pupil-Teacher Ratio* -6.49 -10.88 36
Average Salary of Instructional Staff $38,623 $44,133 40
*In the period between the 1983-84 school year and the 2003-2004 school year.
White 76.4%
Black 8.9%
Hispanic 11.0%
Asian/Pacifi c Islander 2.3%
American Indian/Alaskan 1.4%
Funding % from Federal Government 9.10
% from State and Local Sources 90.9
National Rank 23
Educational Outputs
22

A Report Card on American Education: A State-by-State Analysis | 25
Student Demographics
2004 NATIONAL NATIONAL AVERAGES AVERAGE RANK
KentuckyNational Rank of Academic Achievement
Charter Schools FALL 2005
Number of Charter Schools 0
Number of Charter School Students 0
2005 NATIONAL NATIONAL AVERAGES AVERAGE RANK
NAEP Scores Grade 8 Mathematics 274 278 36
% Above Profi ciency 22 29
Grade 4 Mathematics 231 237 41
% Above Profi ciency 27 35
Grade 8 Reading 264 260 25
% Above Profi ciency 31 29
Grade 4 Reading 220 217 27
% Above Profi ciency 30 30
ACT Scores Composite Score 20.3 20.9 40
% of Graduates Take ACT 75 40
% Change in Cumulative ACT Scores 1994-2004 1.00 0.48 30
SAT Scores Composite Score 1116 1026 16
% of Graduates Take SAT 12 48
% Change in Cumulative SAT Scores 1984-2004 3.05 2.70 17
Educational Inputs 2005 NATIONAL NATIONAL AVERAGES AVERAGE RANK
Expenditures per Pupil $6,913 $9,052 45
% Change in Expenditures per Pupil* 96.07 77.37 11
Pupil/Teacher Ratio 16.1 15.5 36
% Change in Pupil-Teacher Ratio* -13.44 -10.88 19
Average Salary of Instructional Staff $40,240 $44,133 34
*In the period between the 1983-84 school year and the 2003-2004 school year.
White 87.0%
Black 10.4%
Hispanic 1.5%
Asian/Pacifi c Islander 0.8%
American Indian/Alaskan 0.2%
Educational Outputs
34
Funding % from Federal Government 10.59
% from State and Local Sources 89.41
National Rank 14

26 | A Report Card on American Education: A State-by-State Analysis
Student Demographics
2004 NATIONAL NATIONAL AVERAGES AVERAGE RANK
LouisianaNational Rank of Academic Achievement
Charter Schools FALL 2005
Number of Charter Schools 21
Number of Charter School Students 6,685
2005 NATIONAL NATIONAL AVERAGES AVERAGE RANK
NAEP Scores Grade 8 Mathematics 268 278 45
% Above Profi ciency 16 29
Grade 4 Mathematics 230 237 47
% Above Profi ciency 24 35
Grade 8 Reading 253 260 45
% Above Profi ciency 20 29
Grade 4 Reading 209 217 44
% Above Profi ciency 20 30
ACT Scores Composite Score 19.8 20.9 48
% of Graduates Take ACT 87 40
% Change in Cumulative ACT Scores 1994-2004 2.06 0.48 12
SAT Scores Composite Score 1125 1026 12
% of Graduates Take SAT 8 48
% Change in Cumulative SAT Scores 1984-2004 5.53 2.70 11
Educational Inputs 2005 NATIONAL NATIONAL AVERAGES AVERAGE RANK
Expenditures per Pupil $7,583 $9,052 40
% Change in Expenditures per Pupil* 71.85 77.37 35
Pupil/Teacher Ratio 14.4 15.5 19
% Change in Pupil-Teacher Ratio* -22.16 -10.88 4
Average Salary of Instructional Staff $37,918 $44,133 46
*In the period between the 1983-84 school year and the 2003-2004 school year.
White 48.5%
Black 47.7%
Hispanic 1.8%
Asian/Pacifi c Islander 1.3%
American Indian/Alaskan 0.7%
Funding % from Federal Government 13.21
% from State and Local Sources 86.79
National Rank 8
Educational Outputs
47

A Report Card on American Education: A State-by-State Analysis | 27
Student Demographics
2004 NATIONAL NATIONAL AVERAGES AVERAGE RANK
MaineNational Rank of Academic Achievement
Charter Schools FALL 2005
Number of Charter Schools 0
Number of Charter School Students 0
2005 NATIONAL NATIONAL AVERAGES AVERAGE RANK
NAEP Scores Grade 8 Mathematics 281 278 24
% Above Profi ciency 30 29
Grade 4 Mathematics 241 237 18
% Above Profi ciency 39 35
Grade 8 Reading 270 260 2
% Above Profi ciency 38 29
Grade 4 Reading 225 217 8
% Above Profi ciency 36 30
ACT Scores Composite Score 22.6 20.9 2
% of Graduates Take ACT 9 40
% Change in Cumulative ACT Scores 1994-2004 4.63 0.48 4
SAT Scores Composite Score 1006 1026 41
% of Graduates Take SAT 76 48
% Change in Cumulative SAT Scores 1984-2004 0.10 2.70 38
Educational Inputs 2005 NATIONAL NATIONAL AVERAGES AVERAGE RANK
Expenditures per Pupil $10,294 $9,052 12
% Change in Expenditures per Pupil* 140.77 77.37 1
Pupil/Teacher Ratio 11.5 15.5 2
% Change in Pupil-Teacher Ratio* -25.81 -10.88 3
Average Salary of Instructional Staff $39,864 $44,133 35
*In the period between the 1983-84 school year and the 2003-2004 school year.
White 95.8%
Black 1.7%
Hispanic 0.8%
Asian/Pacifi c Islander 1.2%
American Indian/Alaskan 0.5%
Educational Outputs
18
Funding % from Federal Government 8.95
% from State and Local Sources 91.05
National Rank 26

28 | A Report Card on American Education: A State-by-State Analysis
27
Student Demographics
2004 NATIONAL NATIONAL AVERAGES AVERAGE RANK
Charter Schools FALL 2005
Number of Charter Schools 15
Number of Charter School Students 3,812
2005 NATIONAL NATIONAL AVERAGES AVERAGE RANK
NAEP Scores Grade 8 Mathematics 278 278 30
% Above Profi ciency 30 29
Grade 4 Mathematics 238 237 29
% Above Profi ciency 38 35
Grade 8 Reading 261 260 29
% Above Profi ciency 30 29
Grade 4 Reading 220 217 26
% Above Profi ciency 32 30
ACT Scores Composite Score 20.8 20.9 34
% of Graduates Take ACT 12 40
% Change in Cumulative ACT Scores 1994-2004 0.48 0.48 37
SAT Scores Composite Score 1026 1026 34
% of Graduates Take SAT 68 48
% Change in Cumulative SAT Scores 1984-2004 2.29 2.70 26
Educational Inputs 2005 NATIONAL NATIONAL AVERAGES AVERAGE RANK
Expenditures per Pupil $9,944 $9,052 15
% Change in Expenditures per Pupil* 73.39 77.37 34
Pupil/Teacher Ratio 15.8 15.5 34
% Change in Pupil-Teacher Ratio* -7.60 -10.88 31
Average Salary of Instructional Staff $50,261 $44,133 12
*In the period between the 1983-84 school year and the 2003-2004 school year.
White 50.4%
Black 37.9%
Hispanic 6.4%
Asian/Pacifi c Islander 4.9%
American Indian/Alaskan 0.4%
Funding % from Federal Government 6.72
% from State and Local Sources 93.28
National Rank 41
Educational Outputs
MarylandNational Rank of Academic Achievement

A Report Card on American Education: A State-by-State Analysis | 29
Student Demographics
2004 NATIONAL NATIONAL AVERAGES AVERAGE RANK
MassachusettsNational Rank of Academic Achievement
Charter Schools FALL 2005
Number of Charter Schools 57
Number of Charter School Students 20,555
2005 NATIONAL NATIONAL AVERAGES AVERAGE RANK
NAEP Scores Grade 8 Mathematics 292 278 1
% Above Profi ciency 43 29
Grade 4 Mathematics 247 237 1
% Above Profi ciency 49 35
Grade 8 Reading 274 260 1
% Above Profi ciency 44 29
Grade 4 Reading 231 217 1
% Above Profi ciency 44 30
ACT Scores Composite Score 22.4 20.9 7
% of Graduates Take ACT 12 40
% Change in Cumulative ACT Scores 1994-2004 4.19 0.48 5
SAT Scores Composite Score 1041 1026 29
% of Graduates Take SAT 85 48
% Change in Cumulative SAT Scores 1984-2004 3.89 2.70 13
Educational Inputs 2005 NATIONAL NATIONAL AVERAGES AVERAGE RANK
Expenditures per Pupil $10,926 $9,052 8
% Change in Expenditures per Pupil* 85.86 77.37 22
Pupil/Teacher Ratio 13.6 15.5 10
% Change in Pupil-Teacher Ratio* -5.56 -10.88 40
Average Salary of Instructional Staff $53,181 $44,133 8
*In the period between the 1983-84 school year and the 2003-2004 school year.
White 74.6%
Black 8.8%
Hispanic 11.5%
Asian/Pacifi c Islander 4.7%
American Indian/Alaskan 0.3%
Educational Outputs
1
Funding % from Federal Government 5.98
% from State and Local Sources 94.02
National Rank 47

30 | A Report Card on American Education: A State-by-State Analysis
Student Demographics
2004 NATIONAL NATIONAL AVERAGES AVERAGE RANK
MichiganNational Rank of Academic Achievement
Charter Schools FALL 2005
Number of Charter Schools 233
Number of Charter School Students 86,874
2005 NATIONAL NATIONAL AVERAGES AVERAGE RANK
NAEP Scores Grade 8 Mathematics 277 278 32
% Above Profi ciency 30 29
Grade 4 Mathematics 238 237 30
% Above Profi ciency 37 35
Grade 8 Reading 261 260 31
% Above Profi ciency 28 29
Grade 4 Reading 218 217 30
% Above Profi ciency 31 30
ACT Scores Composite Score 21.4 20.9 25
% of Graduates Take ACT 68 40
% Change in Cumulative ACT Scores 1994-2004 1.90 0.48 14
SAT Scores Composite Score 1136 1026 10
% of Graduates Take SAT 11 48
% Change in Cumulative SAT Scores 1984-2004 6.17 2.70 9
Educational Inputs 2005 NATIONAL NATIONAL AVERAGES AVERAGE RANK
Expenditures per Pupil $10,595 $9,052 10
% Change in Expenditures per Pupil* 75.07 77.37 29
Pupil/Teacher Ratio 18.1 15.5 45
% Change in Pupil-Teacher Ratio* -5.73 -10.88 39
Average Salary of Instructional Staff $54,412 $44,133 6
*In the period between the 1983-84 school year and the 2003-2004 school year.
White 72.7%
Black 20.1%
Hispanic 4.1%
Asian/Pacifi c Islander 2.2%
American Indian/Alaskan 1.0%
Funding % from Federal Government 7.84
% from State and Local Sources 92.16
National Rank 34
Educational Outputs
31
A Report Card on American Education: A State-by-State Analysis | 31
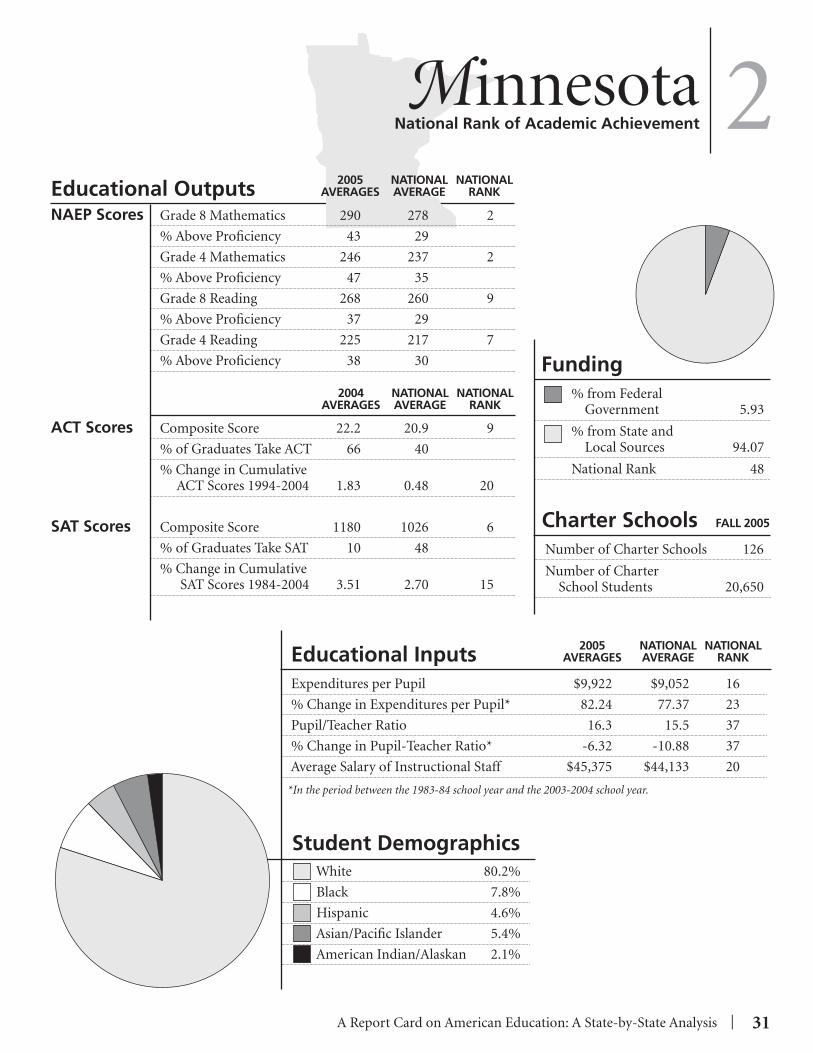
Student Demographics
2004 NATIONAL NATIONAL AVERAGES AVERAGE RANK
MinnesotaNational Rank of Academic Achievement
Charter Schools FALL 2005
Number of Charter Schools 126
Number of Charter School Students 20,650
2005 NATIONAL NATIONAL AVERAGES AVERAGE RANK
NAEP Scores Grade 8 Mathematics 290 278 2
% Above Profi ciency 43 29
Grade 4 Mathematics 246 237 2
% Above Profi ciency 47 35
Grade 8 Reading 268 260 9
% Above Profi ciency 37 29
Grade 4 Reading 225 217 7
% Above Profi ciency 38 30
ACT Scores Composite Score 22.2 20.9 9
% of Graduates Take ACT 66 40
% Change in Cumulative ACT Scores 1994-2004 1.83 0.48 20
SAT Scores Composite Score 1180 1026 6
% of Graduates Take SAT 10 48
% Change in Cumulative SAT Scores 1984-2004 3.51 2.70 15
Educational Inputs 2005 NATIONAL NATIONAL AVERAGES AVERAGE RANK
Expenditures per Pupil $9,922 $9,052 16
% Change in Expenditures per Pupil* 82.24 77.37 23
Pupil/Teacher Ratio 16.3 15.5 37
% Change in Pupil-Teacher Ratio* -6.32 -10.88 37
Average Salary of Instructional Staff $45,375 $44,133 20
*In the period between the 1983-84 school year and the 2003-2004 school year.
White 80.2%
Black 7.8%
Hispanic 4.6%
Asian/Pacifi c Islander 5.4%
American Indian/Alaskan 2.1%
Educational Outputs
2
Funding % from Federal Government 5.93
% from State and Local Sources 94.07
National Rank 48
32 | A Report Card on American Education: A State-by-State Analysis
Student Demographics
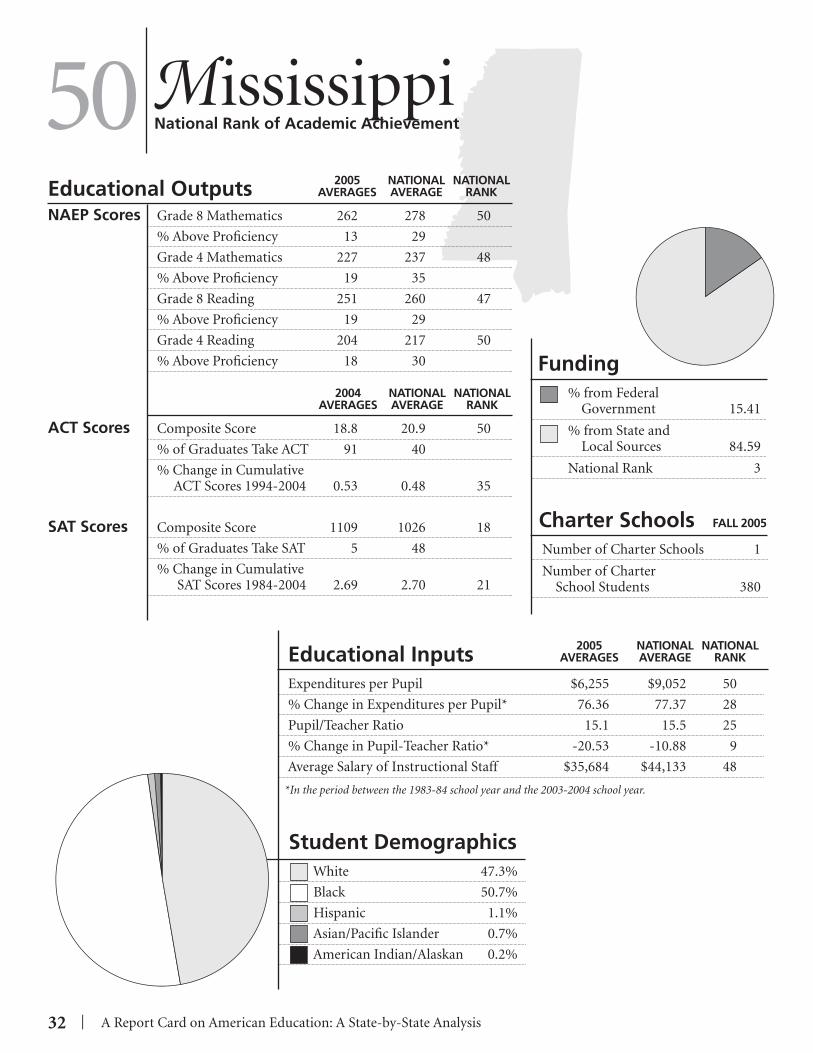
2004 NATIONAL NATIONAL AVERAGES AVERAGE RANK
MississippiNational Rank of Academic Achievement
Charter Schools FALL 2005
Number of Charter Schools 1
Number of Charter School Students 380
2005 NATIONAL NATIONAL AVERAGES AVERAGE RANK
NAEP Scores Grade 8 Mathematics 262 278 50
% Above Profi ciency 13 29
Grade 4 Mathematics 227 237 48
% Above Profi ciency 19 35
Grade 8 Reading 251 260 47
% Above Profi ciency 19 29
Grade 4 Reading 204 217 50
% Above Profi ciency 18 30
ACT Scores Composite Score 18.8 20.9 50
% of Graduates Take ACT 91 40
% Change in Cumulative ACT Scores 1994-2004 0.53 0.48 35
SAT Scores Composite Score 1109 1026 18
% of Graduates Take SAT 5 48
% Change in Cumulative SAT Scores 1984-2004 2.69 2.70 21
Educational Inputs 2005 NATIONAL NATIONAL AVERAGES AVERAGE RANK
Expenditures per Pupil $6,255 $9,052 50
% Change in Expenditures per Pupil* 76.36 77.37 28
Pupil/Teacher Ratio 15.1 15.5 25
% Change in Pupil-Teacher Ratio* -20.53 -10.88 9
Average Salary of Instructional Staff $35,684 $44,133 48
*In the period between the 1983-84 school year and the 2003-2004 school year.
White 47.3%
Black 50.7%
Hispanic 1.1%
Asian/Pacifi c Islander 0.7%
American Indian/Alaskan 0.2%
Funding % from Federal Government 15.41
% from State and Local Sources 84.59
National Rank 3
Educational Outputs
50

A Report Card on American Education: A State-by-State Analysis | 33
Student Demographics
2004 NATIONAL NATIONAL AVERAGES AVERAGE RANK
MissouriNational Rank of Academic Achievement
Charter Schools FALL 2005
Number of Charter Schools 26
Number of Charter School Students 10,780
2005 NATIONAL NATIONAL AVERAGES AVERAGE RANK
NAEP Scores Grade 8 Mathematics 276 278 33
% Above Profi ciency 26 29
Grade 4 Mathematics 235 237 35
% Above Profi ciency 31 35
Grade 8 Reading 265 260 21
% Above Profi ciency 31 29
Grade 4 Reading 221 217 24
% Above Profi ciency 32 30
ACT Scores Composite Score 21.5 20.9 20
% of Graduates Take ACT 70 40
% Change in Cumulative ACT Scores 1994-2004 1.42 0.48 27
SAT Scores Composite Score 1172 1026 7
% of Graduates Take SAT 8 48
% Change in Cumulative SAT Scores 1984-2004 9.33 2.70 4
Educational Inputs 2005 NATIONAL NATIONAL AVERAGES AVERAGE RANK
Expenditures per Pupil $8,521 $9,052 29
% Change in Expenditures per Pupil* 106.75 77.37 7
Pupil/Teacher Ratio 13.9 15.5 17
% Change in Pupil-Teacher Ratio* -15.24 -10.88 15
Average Salary of Instructional Staff $38,006 $44,133 45
*In the period between the 1983-84 school year and the 2003-2004 school year.
White 77.7%
Black 18.0%
Hispanic 2.6%
Asian/Pacifi c Islander 1.4%
American Indian/Alaskan 0.4%
Educational Outputs
19
Funding % from Federal Government 8.04
% from State and Local Sources 91.96
National Rank 33

34 | A Report Card on American Education: A State-by-State Analysis
Student Demographics
2004 NATIONAL NATIONAL AVERAGES AVERAGE RANK
MontanaNational Rank of Academic Achievement
Charter Schools FALL 2005
Number of Charter Schools 0
Number of Charter School Students 0
2005 NATIONAL NATIONAL AVERAGES AVERAGE RANK
NAEP Scores Grade 8 Mathematics 286 278 6
% Above Profi ciency 26 29
Grade 4 Mathematics 241 237 18
% Above Profi ciency 39 35
Grade 8 Reading 269 260 5
% Above Profi ciency 37 29
Grade 4 Reading 225 217 8
% Above Profi ciency 36 30
ACT Scores Composite Score 21.7 20.9 14
% of Graduates Take ACT 56 40
% Change in Cumulative ACT Scores 1994-2004 -0.46 0.48 44
SAT Scores Composite Score 1076 1026 24
% of Graduates Take SAT 29 48
% Change in Cumulative SAT Scores 1984-2004 -5.28 2.70 50
Educational Inputs 2005 NATIONAL NATIONAL AVERAGES AVERAGE RANK
Expenditures per Pupil $8,150 $9,052 35
% Change in Expenditures per Pupil* 48.27 77.37 47
Pupil/Teacher Ratio 14.4 15.5 19
% Change in Pupil-Teacher Ratio* -7.69 -10.88 29
Average Salary of Instructional Staff $37,184 $44,133 47
*In the period between the 1983-84 school year and the 2003-2004 school year.
White 85.1%
Black 0.7%
Hispanic 2.1%
Asian/Pacifi c Islander 1.0%
American Indian/Alaskan 11.0%
Funding % from Federal Government 14.50
% from State and Local Sources 85.50
National Rank 6
Educational Outputs
4

A Report Card on American Education: A State-by-State Analysis | 35
Student Demographics
2004 NATIONAL NATIONAL AVERAGES AVERAGE RANK
NebraskaNational Rank of Academic Achievement
Charter Schools FALL 2005
Number of Charter Schools 0
Number of Charter School Students 0
2005 NATIONAL NATIONAL AVERAGES AVERAGE RANK
NAEP Scores Grade 8 Mathematics 284 278 11
% Above Profi ciency 35 29
Grade 4 Mathematics 239 237 26
% Above Profi ciency 36 35
Grade 8 Reading 267 260 14
% Above Profi ciency 35 29
Grade 4 Reading 221 217 21
% Above Profi ciency 33 30
ACT Scores Composite Score 21.7 20.9 14
% of Graduates Take ACT 77 40
% Change in Cumulative ACT Scores 1994-2004 1.88 0.48 19
SAT Scores Composite Score 1145 1026 9
% of Graduates Take SAT 8 48
% Change in Cumulative SAT Scores 1984-2004 2.42 2.70 24
Educational Inputs 2005 NATIONAL NATIONAL AVERAGES AVERAGE RANK
Expenditures per Pupil $9,190 $9,052 20
% Change in Expenditures per Pupil* 74.71 77.37 31
Pupil/Teacher Ratio 13.6 15.5 10
% Change in Pupil-Teacher Ratio* -9.93 -10.88 26
Average Salary of Instructional Staff $38,352 $44,133 42
*In the period between the 1983-84 school year and the 2003-2004 school year.
White 79.5%
Black 7.1%
Hispanic 10.1%
Asian/Pacifi c Islander 1.7%
American Indian/Alaskan 1.6%
Educational Outputs
10
Funding % from Federal Government 8.85
% from State and Local Sources 91.15
National Rank 27

36 | A Report Card on American Education: A State-by-State Analysis
Student Demographics
2004 NATIONAL NATIONAL AVERAGES AVERAGE RANK
NevadaNational Rank of Academic Achievement
Charter Schools FALL 2005
Number of Charter Schools 20
Number of Charter School Students 6,672
2005 NATIONAL NATIONAL AVERAGES AVERAGE RANK
NAEP Scores Grade 8 Mathematics 270 278 42
% Above Profi ciency 21 29
Grade 4 Mathematics 230 237 46
% Above Profi ciency 26 35
Grade 8 Reading 253 260 44
% Above Profi ciency 22 29
Grade 4 Reading 207 217 48
% Above Profi ciency 21 30
ACT Scores Composite Score 21.2 20.9 30
% of Graduates Take ACT 33 40
% Change in Cumulative ACT Scores 1994-2004 0.00 0.48 40
SAT Scores Composite Score 1021 1026 36
% of Graduates Take SAT 40 48
% Change in Cumulative SAT Scores 1984-2004 -3.04 2.70 45
Educational Inputs 2005 NATIONAL NATIONAL AVERAGES AVERAGE RANK
Expenditures per Pupil $7,378 $9,052 41
% Change in Expenditures per Pupil* 64.49 77.37 38
Pupil/Teacher Ratio 19.0 15.5 46
% Change in Pupil-Teacher Ratio* -6.86 -10.88 34
Average Salary of Instructional Staff $42,254 $44,133 26
*In the period between the 1983-84 school year and the 2003-2004 school year.
White 50.8%
Black 10.7%
Hispanic 30.2%
Asian/Pacifi c Islander 6.7%
American Indian/Alaskan 1.7%
Funding % from Federal Government 7.05
% from State and Local Sources 92.95
National Rank 38
Educational Outputs
38

A Report Card on American Education: A State-by-State Analysis | 37
Student Demographics
2004 NATIONAL NATIONAL AVERAGES AVERAGE RANK
New HampshireNational Rank of Academic Achievement
Charter Schools FALL 2005
Number of Charter Schools 6
Number of Charter School Students 517
2005 NATIONAL NATIONAL AVERAGES AVERAGE RANK
NAEP Scores Grade 8 Mathematics 285 278 9
% Above Profi ciency 35 29
Grade 4 Mathematics 246 237 2
% Above Profi ciency 47 35
Grade 8 Reading 270 260 2
% Above Profi ciency 38 29
Grade 4 Reading 227 217 2
% Above Profi ciency 39 30
ACT Scores Composite Score 22.5 20.9 3
% of Graduates Take ACT 9 40
% Change in Cumulative ACT Scores 1994-2004 2.27 0.48 11
SAT Scores Composite Score 1043 1026 28
% of Graduates Take SAT 80 48
% Change in Cumulative SAT Scores 1984-2004 0.68 2.70 36
Educational Inputs 2005 NATIONAL NATIONAL AVERAGES AVERAGE RANK
Expenditures per Pupil $9,656 $9,052 18
% Change in Expenditures per Pupil* 106.31 77.37 8
Pupil/Teacher Ratio 13.7 15.5 14
% Change in Pupil-Teacher Ratio* -13.84 -10.88 16
Average Salary of Instructional Staff $42,689 $44,133 25
*In the period between the 1983-84 school year and the 2003-2004 school year.
White 94.2%
Black 1.4%
Hispanic 2.4%
Asian/Pacifi c Islander 1.7%
American Indian/Alaskan 0.3%
Educational Outputs
3
Funding % from Federal Government 5.21
% from State and Local Sources 94.79
National Rank 50

38 | A Report Card on American Education: A State-by-State Analysis
Student Demographics
2004 NATIONAL NATIONAL AVERAGES AVERAGE RANK
New JerseyNational Rank of Academic Achievement
Charter Schools FALL 2005
Number of Charter Schools 52
Number of Charter School Students 14,440
2005 NATIONAL NATIONAL AVERAGES AVERAGE RANK
NAEP Scores Grade 8 Mathematics 284 278 10
% Above Profi ciency 36 29
Grade 4 Mathematics 244 237 5
% Above Profi ciency 46 35
Grade 8 Reading 269 260 5
% Above Profi ciency 37 29
Grade 4 Reading 223 217 12
% Above Profi ciency 38 30
ACT Scores Composite Score 21.2 20.9 30
% of Graduates Take ACT 6 40
% Change in Cumulative ACT Scores 1994-2004 1.44 0.48 26
SAT Scores Composite Score 1015 1026 38
% of Graduates Take SAT 83 48
% Change in Cumulative SAT Scores 1984-2004 3.78 2.70 14
Educational Inputs 2005 NATIONAL NATIONAL AVERAGES AVERAGE RANK
Expenditures per Pupil $13,673 $9,052 2
% Change in Expenditures per Pupil* 95.44 77.37 12
Pupil/Teacher Ratio 12.7 15.5 4
% Change in Pupil-Teacher Ratio* -13.61 -10.88 18
Average Salary of Instructional Staff $55,592 $44,133 4
*In the period between the 1983-84 school year and the 2003-2004 school year.
White 57.9%
Black 17.7%
Hispanic 17.2%
Asian/Pacifi c Islander 7.0%
American Indian/Alaskan 0.2%
Funding % from Federal Government 4.26
% from State and Local Sources 95.74
National Rank 51
Educational Outputs
12

A Report Card on American Education: A State-by-State Analysis | 39
Student Demographics
2004 NATIONAL NATIONAL AVERAGES AVERAGE RANK
New MexicoNational Rank of Academic Achievement
Charter Schools FALL 2005
Number of Charter Schools 51
Number of Charter School Students 9,888
2005 NATIONAL NATIONAL AVERAGES AVERAGE RANK
NAEP Scores Grade 8 Mathematics 263 278 48
% Above Profi ciency 14 29
Grade 4 Mathematics 224 237 50
% Above Profi ciency 19 35
Grade 8 Reading 251 260 47
% Above Profi ciency 19 29
Grade 4 Reading 207 217 48
% Above Profi ciency 21 30
ACT Scores Composite Score 20.1 20.9 46
% of Graduates Take ACT 61 40
% Change in Cumulative ACT Scores 1994-2004 0.50 0.48 36
SAT Scores Composite Score 1097 1026 20
% of Graduates Take SAT 14 48
% Change in Cumulative SAT Scores 1984-2004 -0.90 2.70 42
Educational Inputs 2005 NATIONAL NATIONAL AVERAGES AVERAGE RANK
Expenditures per Pupil $8,351 $9,052 32
% Change in Expenditures per Pupil* 70.62 77.37 36
Pupil/Teacher Ratio 15.0 15.5 23
% Change in Pupil-Teacher Ratio* -21.05 -10.88 8
Average Salary of Instructional Staff $38,067 $44,133 44
*In the period between the 1983-84 school year and the 2003-2004 school year.
White 32.8%
Black 2.4%
Hispanic 52.5%
Asian/Pacifi c Islander 1.2%
American Indian/Alaskan 11.2%
Educational Outputs
49
Funding % from Federal Government 14.99
% from State and Local Sources 85.01
National Rank 5
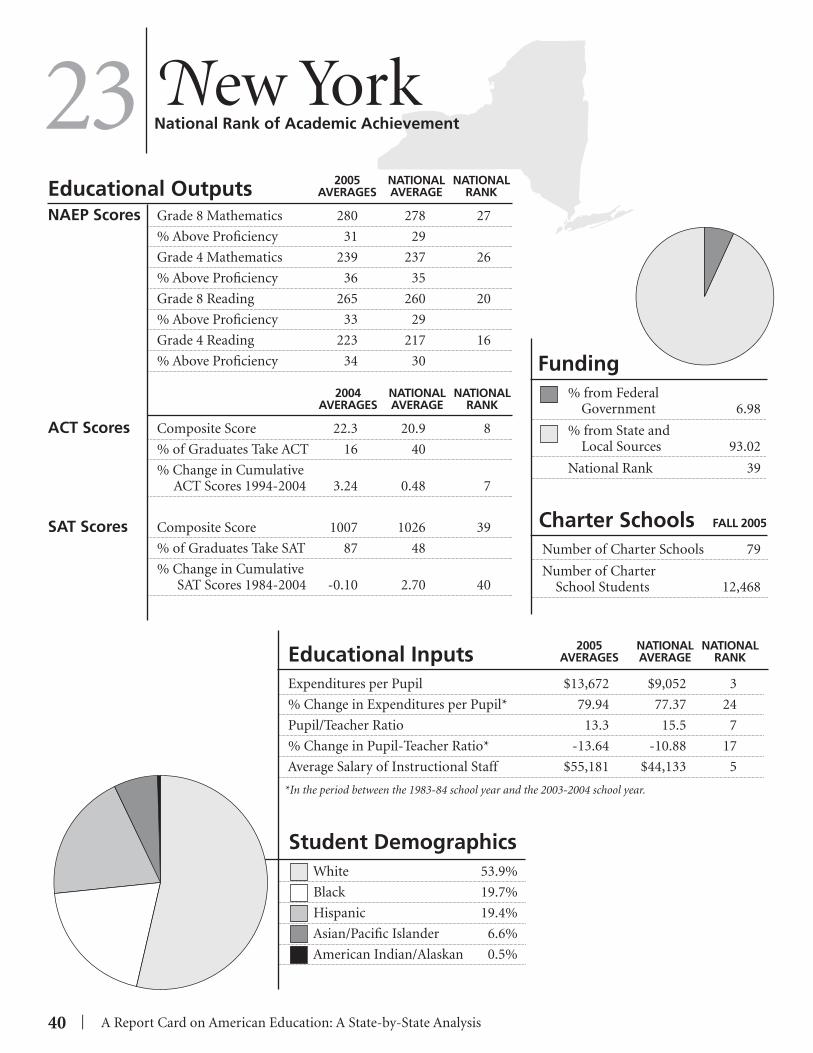
40 | A Report Card on American Education: A State-by-State Analysis
Student Demographics
2004 NATIONAL NATIONAL AVERAGES AVERAGE RANK
New YorkNational Rank of Academic Achievement
Charter Schools FALL 2005
Number of Charter Schools 79
Number of Charter School Students 12,468
2005 NATIONAL NATIONAL AVERAGES AVERAGE RANK
NAEP Scores Grade 8 Mathematics 280 278 27
% Above Profi ciency 31 29
Grade 4 Mathematics 239 237 26
% Above Profi ciency 36 35
Grade 8 Reading 265 260 20
% Above Profi ciency 33 29
Grade 4 Reading 223 217 16
% Above Profi ciency 34 30
ACT Scores Composite Score 22.3 20.9 8
% of Graduates Take ACT 16 40
% Change in Cumulative ACT Scores 1994-2004 3.24 0.48 7
SAT Scores Composite Score 1007 1026 39
% of Graduates Take SAT 87 48
% Change in Cumulative SAT Scores 1984-2004 -0.10 2.70 40
Educational Inputs 2005 NATIONAL NATIONAL AVERAGES AVERAGE RANK
Expenditures per Pupil $13,672 $9,052 3
% Change in Expenditures per Pupil* 79.94 77.37 24
Pupil/Teacher Ratio 13.3 15.5 7
% Change in Pupil-Teacher Ratio* -13.64 -10.88 17
Average Salary of Instructional Staff $55,181 $44,133 5
*In the period between the 1983-84 school year and the 2003-2004 school year.
White 53.9%
Black 19.7%
Hispanic 19.4%
Asian/Pacifi c Islander 6.6%
American Indian/Alaskan 0.5%
Funding % from Federal Government 6.98
% from State and Local Sources 93.02
National Rank 39
Educational Outputs
23

A Report Card on American Education: A State-by-State Analysis | 41
Student Demographics
2004 NATIONAL NATIONAL AVERAGES AVERAGE RANK
North CarolinaNational Rank of Academic Achievement
Charter Schools FALL 2005
Number of Charter Schools 100
Number of Charter School Students 28,159
2005 NATIONAL NATIONAL AVERAGES AVERAGE RANK
NAEP Scores Grade 8 Mathematics 282 278 16
% Above Profi ciency 32 29
Grade 4 Mathematics 241 237 16
% Above Profi ciency 40 35
Grade 8 Reading 258 260 36
% Above Profi ciency 27 29
Grade 4 Reading 217 217 32
% Above Profi ciency 30 30
ACT Scores Composite Score 20.3 20.9 40
% of Graduates Take ACT 15 40
% Change in Cumulative ACT Scores 1994-2004 4.64 0.48 3
SAT Scores Composite Score 1006 1026 41
% of Graduates Take SAT 70 48
% Change in Cumulative SAT Scores 1984-2004 8.76 2.70 6
Educational Inputs 2005 NATIONAL NATIONAL AVERAGES AVERAGE RANK
Expenditures per Pupil $7,222 $9,052 42
% Change in Expenditures per Pupil* 92.79 77.37 13
Pupil/Teacher Ratio 15.1 15.5 25
% Change in Pupil-Teacher Ratio* -19.25 -10.88 10
Average Salary of Instructional Staff $43,211 $44,133 23
*In the period between the 1983-84 school year and the 2003-2004 school year.
White 58.3%
Black 31.6%
Hispanic 6.7%
Asian/Pacifi c Islander 2.0%
American Indian/Alaskan 1.5%
Educational Outputs
30
Funding % from Federal Government 9.59
% from State and Local Sources 90.41
National Rank 21

42 | A Report Card on American Education: A State-by-State Analysis
Student Demographics
2004 NATIONAL NATIONAL AVERAGES AVERAGE RANK
North DakotaNational Rank of Academic Achievement
Charter Schools FALL 2005
Number of Charter Schools 0
Number of Charter School Students 0
2005 NATIONAL NATIONAL AVERAGES AVERAGE RANK
NAEP Scores Grade 8 Mathematics 287 278 5
% Above Profi ciency 35 29
Grade 4 Mathematics 243 237 8
% Above Profi ciency 41 35
Grade 8 Reading 270 260 4
% Above Profi ciency 37 29
Grade 4 Reading 225 217 10
% Above Profi ciency 35 30
ACT Scores Composite Score 21.2 20.9 30
% of Graduates Take ACT 81 40
% Change in Cumulative ACT Scores 1994-2004 0.00 0.48 41
SAT Scores Composite Score 1183 1026 3
% of Graduates Take SAT 5 48
% Change in Cumulative SAT Scores 1984-2004 2.34 2.70 25
Educational Inputs 2005 NATIONAL NATIONAL AVERAGES AVERAGE RANK
Expenditures per Pupil $7,846 $9,052 37
% Change in Expenditures per Pupil* 55.95 77.37 42
Pupil/Teacher Ratio 12.7 15.5 4
% Change in Pupil-Teacher Ratio* -16.99 -10.88 11
Average Salary of Instructional Staff $35,441 $44,133 49
*In the period between the 1983-84 school year and the 2003-2004 school year.
White 88.0%
Black 1.2%
Hispanic 1.4%
Asian/Pacifi c Islander 0.8%
American Indian/Alaskan 8.5%
Funding % from Federal Government 15.27
% from State and Local Sources 84.73
National Rank 4
Educational Outputs
11
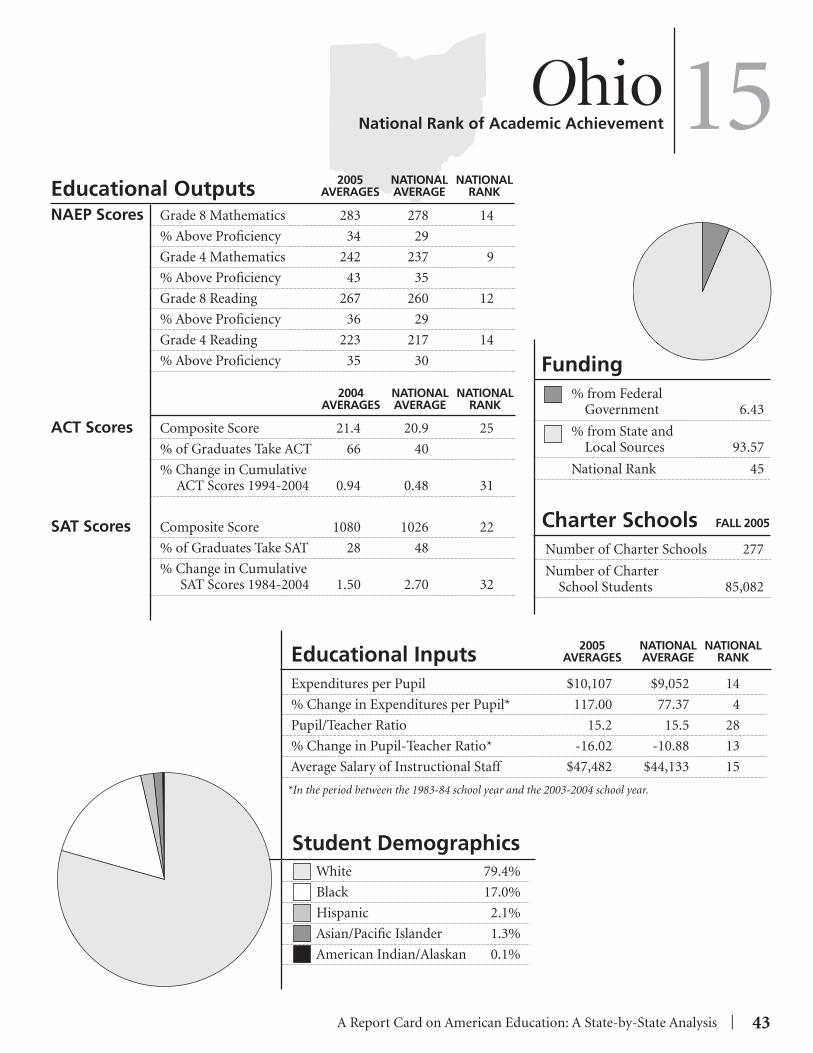
A Report Card on American Education: A State-by-State Analysis | 43
Student Demographics
2004 NATIONAL NATIONAL AVERAGES AVERAGE RANK
OhioNational Rank of Academic Achievement
Charter Schools FALL 2005
Number of Charter Schools 277
Number of Charter School Students 85,082
2005 NATIONAL NATIONAL AVERAGES AVERAGE RANK
NAEP Scores Grade 8 Mathematics 283 278 14
% Above Profi ciency 34 29
Grade 4 Mathematics 242 237 9
% Above Profi ciency 43 35
Grade 8 Reading 267 260 12
% Above Profi ciency 36 29
Grade 4 Reading 223 217 14
% Above Profi ciency 35 30
ACT Scores Composite Score 21.4 20.9 25
% of Graduates Take ACT 66 40
% Change in Cumulative ACT Scores 1994-2004 0.94 0.48 31
SAT Scores Composite Score 1080 1026 22
% of Graduates Take SAT 28 48
% Change in Cumulative SAT Scores 1984-2004 1.50 2.70 32
Educational Inputs 2005 NATIONAL NATIONAL AVERAGES AVERAGE RANK
Expenditures per Pupil $10,107 $9,052 14
% Change in Expenditures per Pupil* 117.00 77.37 4
Pupil/Teacher Ratio 15.2 15.5 28
% Change in Pupil-Teacher Ratio* -16.02 -10.88 13
Average Salary of Instructional Staff $47,482 $44,133 15
*In the period between the 1983-84 school year and the 2003-2004 school year.
White 79.4%
Black 17.0%
Hispanic 2.1%
Asian/Pacifi c Islander 1.3%
American Indian/Alaskan 0.1%
Educational Outputs
15
Funding % from Federal Government 6.43
% from State and Local Sources 93.57
National Rank 45

44 | A Report Card on American Education: A State-by-State Analysis
Student Demographics
2004 NATIONAL NATIONAL AVERAGES AVERAGE RANK
OklahomaNational Rank of Academic Achievement
Charter Schools FALL 2005
Number of Charter Schools 13
Number of Charter School Students 3,866
2005 NATIONAL NATIONAL AVERAGES AVERAGE RANK
NAEP Scores Grade 8 Mathematics 271 278 41
% Above Profi ciency 20 29
Grade 4 Mathematics 234 237 37
% Above Profi ciency 27 35
Grade 8 Reading 260 260 33
% Above Profi ciency 25 29
Grade 4 Reading 214 217 39
% Above Profi ciency 26 30
ACT Scores Composite Score 20.6 20.9 35
% of Graduates Take ACT 69 40
% Change in Cumulative ACT Scores 1994-2004 1.48 0.48 25
SAT Scores Composite Score 1135 1026 11
% of Graduates Take SAT 7 48
% Change in Cumulative SAT Scores 1984-2004 2.53 2.70 23
Educational Inputs 2005 NATIONAL NATIONAL AVERAGES AVERAGE RANK
Expenditures per Pupil $6,536 $9,052 49
% Change in Expenditures per Pupil* 33.92 77.37 50
Pupil/Teacher Ratio 16.0 15.5 35
% Change in Pupil-Teacher Ratio* -5.33 -10.88 41
Average Salary of Instructional Staff $35,061 $44,133 50
*In the period between the 1983-84 school year and the 2003-2004 school year.
White 61.5%
Black 10.9%
Hispanic 7.6%
Asian/Pacifi c Islander 1.5%
American Indian/Alaskan 18.5%
Funding % from Federal Government 12.70
% from State and Local Sources 87.30
National Rank 9
Educational Outputs
37

A Report Card on American Education: A State-by-State Analysis | 45
Student Demographics
2004 NATIONAL NATIONAL AVERAGES AVERAGE RANK
OregonNational Rank of Academic Achievement
Charter Schools FALL 2005
Number of Charter Schools 62
Number of Charter School Students 9,616
2005 NATIONAL NATIONAL AVERAGES AVERAGE RANK
NAEP Scores Grade 8 Mathematics 282 278 15
% Above Profi ciency 33 29
Grade 4 Mathematics 238 237 30
% Above Profi ciency 37 35
Grade 8 Reading 263 260 27
% Above Profi ciency 33 29
Grade 4 Reading 217 217 32
% Above Profi ciency 30 30
ACT Scores Composite Score 22.5 20.9 3
% of Graduates Take ACT 12 40
% Change in Cumulative ACT Scores 1994-2004 0.00 0.48 42
SAT Scores Composite Score 1055 1026 26
% of Graduates Take SAT 56 48
% Change in Cumulative SAT Scores 1984-2004 4.15 2.70 12
Educational Inputs 2005 NATIONAL NATIONAL AVERAGES AVERAGE RANK
Expenditures per Pupil $8,690 $9,052 26
% Change in Expenditures per Pupil* 48.17 77.37 48
Pupil/Teacher Ratio 20.6 15.5 48
% Change in Pupil-Teacher Ratio* 12.57 -10.88 50
Average Salary of Instructional Staff $49,169 $44,133 14
*In the period between the 1983-84 school year and the 2003-2004 school year.
White 76.6%
Black 3.1%
Hispanic 13.6%
Asian/Pacifi c Islander 4.4%
American Indian/Alaskan 2.3%
Educational Outputs
14
Funding % from Federal Government 9.05
% from State and Local Sources 90.95
National Rank 24
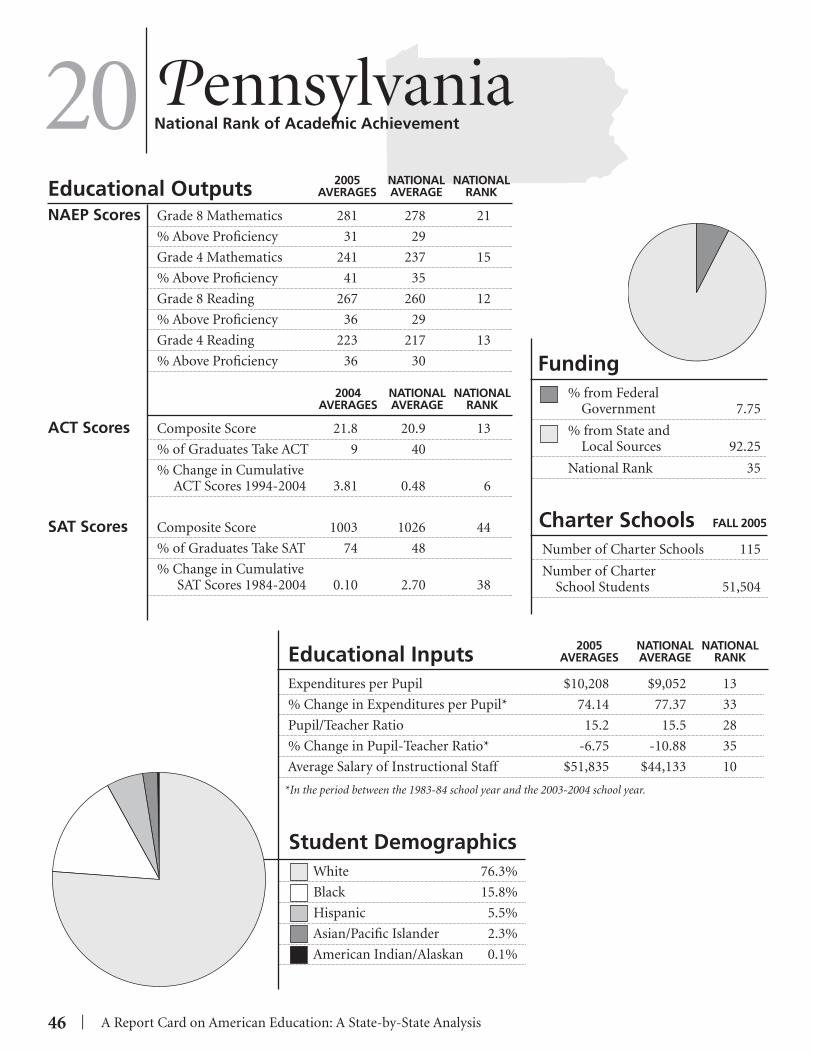
46 | A Report Card on American Education: A State-by-State Analysis
Student Demographics
2004 NATIONAL NATIONAL AVERAGES AVERAGE RANK
PennsylvaniaNational Rank of Academic Achievement
Charter Schools FALL 2005
Number of Charter Schools 115
Number of Charter School Students 51,504
2005 NATIONAL NATIONAL AVERAGES AVERAGE RANK
NAEP Scores Grade 8 Mathematics 281 278 21
% Above Profi ciency 31 29
Grade 4 Mathematics 241 237 15
% Above Profi ciency 41 35
Grade 8 Reading 267 260 12
% Above Profi ciency 36 29
Grade 4 Reading 223 217 13
% Above Profi ciency 36 30
ACT Scores Composite Score 21.8 20.9 13
% of Graduates Take ACT 9 40
% Change in Cumulative ACT Scores 1994-2004 3.81 0.48 6
SAT Scores Composite Score 1003 1026 44
% of Graduates Take SAT 74 48
% Change in Cumulative SAT Scores 1984-2004 0.10 2.70 38
Educational Inputs 2005 NATIONAL NATIONAL AVERAGES AVERAGE RANK
Expenditures per Pupil $10,208 $9,052 13
% Change in Expenditures per Pupil* 74.14 77.37 33
Pupil/Teacher Ratio 15.2 15.5 28
% Change in Pupil-Teacher Ratio* -6.75 -10.88 35
Average Salary of Instructional Staff $51,835 $44,133 10
*In the period between the 1983-84 school year and the 2003-2004 school year.
White 76.3%
Black 15.8%
Hispanic 5.5%
Asian/Pacifi c Islander 2.3%
American Indian/Alaskan 0.1%
Funding % from Federal Government 7.75
% from State and Local Sources 92.25
National Rank 35
Educational Outputs
20

A Report Card on American Education: A State-by-State Analysis | 47
Student Demographics
2004 NATIONAL NATIONAL AVERAGES AVERAGE RANK
Rhode IslandNational Rank of Academic Achievement
Charter Schools FALL 2005
Number of Charter Schools 11
Number of Charter School Students 2,398
2005 NATIONAL NATIONAL AVERAGES AVERAGE RANK
NAEP Scores Grade 8 Mathematics 272 278 37
% Above Profi ciency 23 29
Grade 4 Mathematics 233 237 39
% Above Profi ciency 31 35
Grade 8 Reading 261 260 30
% Above Profi ciency 29 29
Grade 4 Reading 216 217 35
% Above Profi ciency 30 30
ACT Scores Composite Score 21.9 20.9 12
% of Graduates Take ACT 7 40
% Change in Cumulative ACT Scores 1994-2004 5.80 0.48 1
SAT Scores Composite Score 1005 1026 43
% of Graduates Take SAT 72 48
% Change in Cumulative SAT Scores 1984-2004 0.90 2.70 35
Educational Inputs 2005 NATIONAL NATIONAL AVERAGES AVERAGE RANK
Expenditures per Pupil $10,772 $9,052 9
% Change in Expenditures per Pupil* 74.94 77.37 30
Pupil/Teacher Ratio 13.4 15.5 9
% Change in Pupil-Teacher Ratio* -11.26 -10.88 24
Average Salary of Instructional Staff $52,261 $44,133 9
*In the period between the 1983-84 school year and the 2003-2004 school year.
White 71.2%
Black 8.5%
Hispanic 16.4%
Asian/Pacifi c Islander 3.2%
American Indian/Alaskan 0.6%
Educational Outputs
35
Funding % from Federal Government 6.51
% from State and Local Sources 93.49
National Rank 43
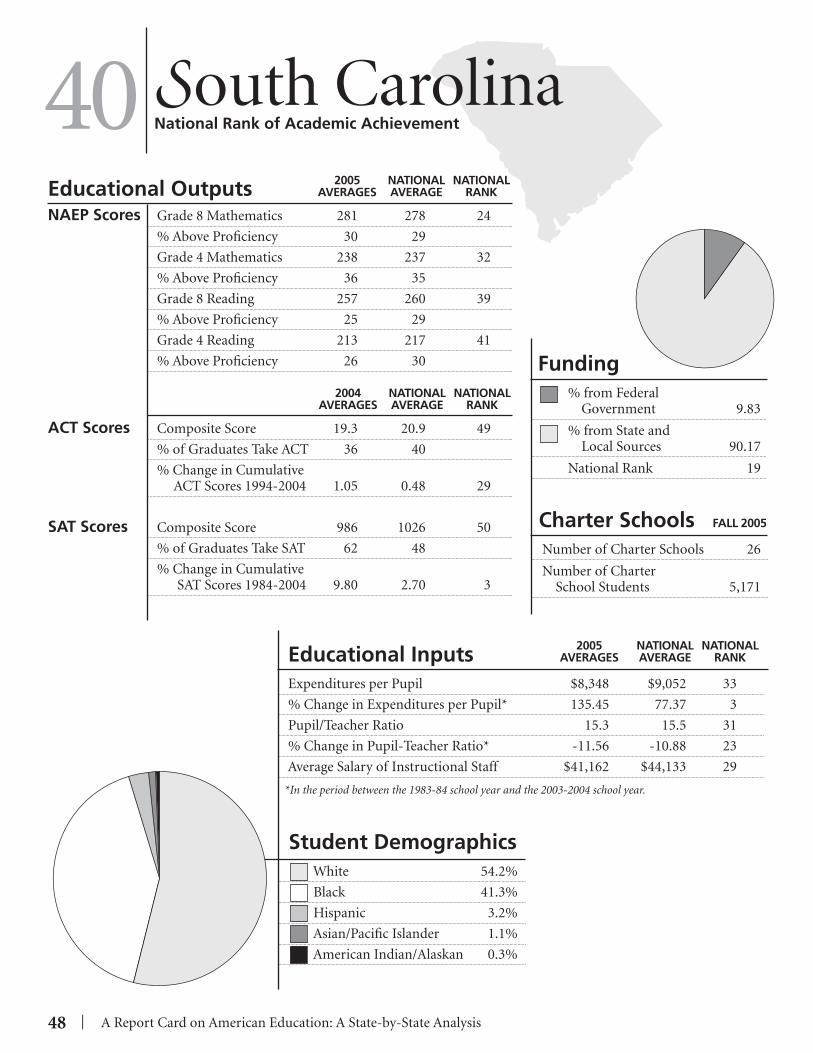
48 | A Report Card on American Education: A State-by-State Analysis
Student Demographics
2004 NATIONAL NATIONAL AVERAGES AVERAGE RANK
South CarolinaNational Rank of Academic Achievement
Charter Schools FALL 2005
Number of Charter Schools 26
Number of Charter School Students 5,171
2005 NATIONAL NATIONAL AVERAGES AVERAGE RANK
NAEP Scores Grade 8 Mathematics 281 278 24
% Above Profi ciency 30 29
Grade 4 Mathematics 238 237 32
% Above Profi ciency 36 35
Grade 8 Reading 257 260 39
% Above Profi ciency 25 29
Grade 4 Reading 213 217 41
% Above Profi ciency 26 30
ACT Scores Composite Score 19.3 20.9 49
% of Graduates Take ACT 36 40
% Change in Cumulative ACT Scores 1994-2004 1.05 0.48 29
SAT Scores Composite Score 986 1026 50
% of Graduates Take SAT 62 48
% Change in Cumulative SAT Scores 1984-2004 9.80 2.70 3
Educational Inputs 2005 NATIONAL NATIONAL AVERAGES AVERAGE RANK
Expenditures per Pupil $8,348 $9,052 33
% Change in Expenditures per Pupil* 135.45 77.37 3
Pupil/Teacher Ratio 15.3 15.5 31
% Change in Pupil-Teacher Ratio* -11.56 -10.88 23
Average Salary of Instructional Staff $41,162 $44,133 29
*In the period between the 1983-84 school year and the 2003-2004 school year.
White 54.2%
Black 41.3%
Hispanic 3.2%
Asian/Pacifi c Islander 1.1%
American Indian/Alaskan 0.3%
Funding % from Federal Government 9.83
% from State and Local Sources 90.17
National Rank 19
Educational Outputs
40

A Report Card on American Education: A State-by-State Analysis | 49
Student Demographics
2004 NATIONAL NATIONAL AVERAGES AVERAGE RANK
South DakotaNational Rank of Academic Achievement
Charter Schools FALL 2005
Number of Charter Schools 0
Number of Charter School Students 0
2005 NATIONAL NATIONAL AVERAGES AVERAGE RANK
NAEP Scores Grade 8 Mathematics 287 278 4
% Above Profi ciency 36 29
Grade 4 Mathematics 242 237 12
% Above Profi ciency 40 35
Grade 8 Reading 269 260 8
% Above Profi ciency 35 29
Grade 4 Reading 222 217 18
% Above Profi ciency 33 30
ACT Scores Composite Score 21.5 20.9 20
% of Graduates Take ACT 75 40
% Change in Cumulative ACT Scores 1994-2004 1.90 0.48 16
SAT Scores Composite Score 1191 1026 2
% of Graduates Take SAT 5 48
% Change in Cumulative SAT Scores 1984-2004 1.45 2.70 33
Educational Inputs 2005 NATIONAL NATIONAL AVERAGES AVERAGE RANK
Expenditures per Pupil $7,780 $9,052 38
% Change in Expenditures per Pupil* 77.17 77.37 27
Pupil/Teacher Ratio 13.6 15.5 10
% Change in Pupil-Teacher Ratio* -12.82 -10.88 20
Average Salary of Instructional Staff $33,236 $44,133 51
*In the period between the 1983-84 school year and the 2003-2004 school year.
White 84.9%
Black 1.5%
Hispanic 1.8%
Asian/Pacifi c Islander 1.0%
American Indian/Alaskan 10.7%
Educational Outputs
7
Funding % from Federal Government 15.69
% from State and Local Sources 84.31
National Rank 2

50 | A Report Card on American Education: A State-by-State Analysis
Student Demographics
2004 NATIONAL NATIONAL AVERAGES AVERAGE RANK
TennesseeNational Rank of Academic Achievement
Charter Schools FALL 2005
Number of Charter Schools 12
Number of Charter School Students 1,842
2005 NATIONAL NATIONAL AVERAGES AVERAGE RANK
NAEP Scores Grade 8 Mathematics 271 278 40
% Above Profi ciency 21 29
Grade 4 Mathematics 232 237 40
% Above Profi ciency 28 35
Grade 8 Reading 259 260 35
% Above Profi ciency 26 29
Grade 4 Reading 214 217 38
% Above Profi ciency 27 30
ACT Scores Composite Score 20.5 20.9 36
% of Graduates Take ACT 87 40
% Change in Cumulative ACT Scores 1994-2004 1.49 0.48 24
SAT Scores Composite Score 1124 1026 13
% of Graduates Take SAT 16 48
% Change in Cumulative SAT Scores 1984-2004 3.12 2.70 16
Educational Inputs 2005 NATIONAL NATIONAL AVERAGES AVERAGE RANK
Expenditures per Pupil $6,787 $9,052 46
% Change in Expenditures per Pupil* 91.14 77.37 14
Pupil/Teacher Ratio 15.7 15.5 32
% Change in Pupil-Teacher Ratio* -21.11 -10.88 7
Average Salary of Instructional Staff $40,318 $44,133 33
*In the period between the 1983-84 school year and the 2003-2004 school year.
White 70.7%
Black 25.0%
Hispanic 2.8%
Asian/Pacifi c Islander 1.3%
American Indian/Alaskan 0.2%
Funding % from Federal Government 10.03
% from State and Local Sources 89.97
National Rank 16
Educational Outputs
39
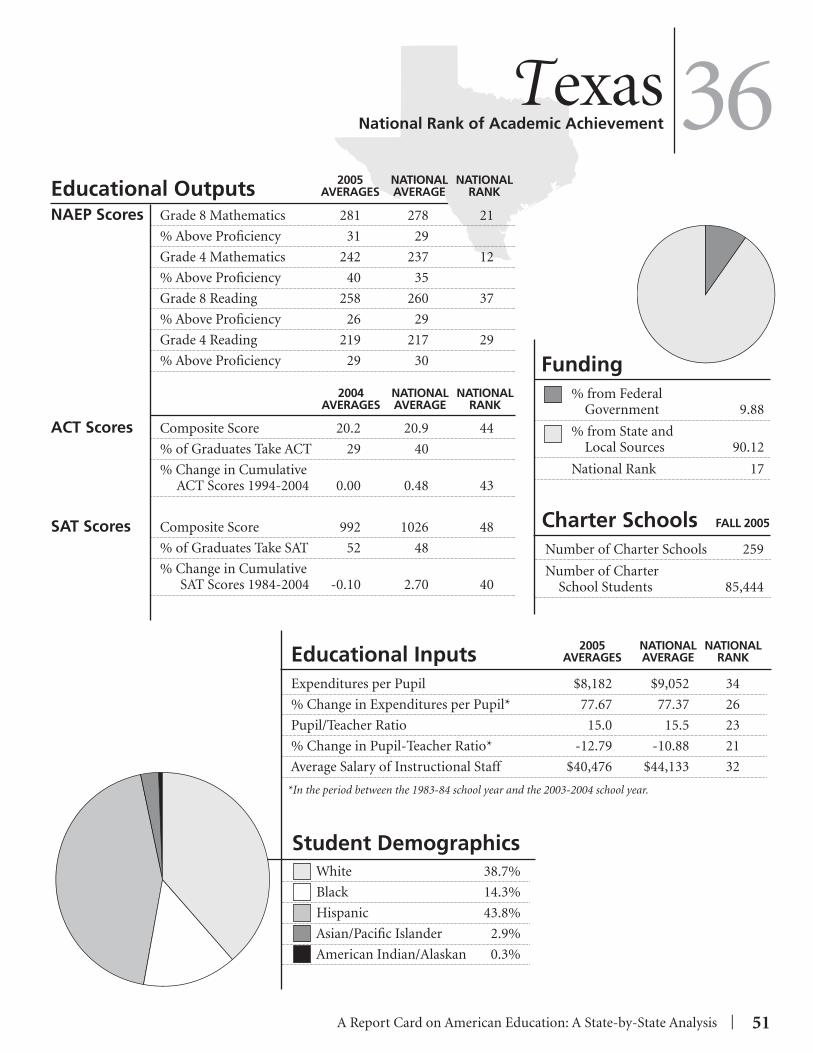
A Report Card on American Education: A State-by-State Analysis | 51
Student Demographics
2004 NATIONAL NATIONAL AVERAGES AVERAGE RANK
TexasNational Rank of Academic Achievement
Charter Schools FALL 2005
Number of Charter Schools 259
Number of Charter School Students 85,444
2005 NATIONAL NATIONAL AVERAGES AVERAGE RANK
NAEP Scores Grade 8 Mathematics 281 278 21
% Above Profi ciency 31 29
Grade 4 Mathematics 242 237 12
% Above Profi ciency 40 35
Grade 8 Reading 258 260 37
% Above Profi ciency 26 29
Grade 4 Reading 219 217 29
% Above Profi ciency 29 30
ACT Scores Composite Score 20.2 20.9 44
% of Graduates Take ACT 29 40
% Change in Cumulative ACT Scores 1994-2004 0.00 0.48 43
SAT Scores Composite Score 992 1026 48
% of Graduates Take SAT 52 48
% Change in Cumulative SAT Scores 1984-2004 -0.10 2.70 40
Educational Inputs 2005 NATIONAL NATIONAL AVERAGES AVERAGE RANK
Expenditures per Pupil $8,182 $9,052 34
% Change in Expenditures per Pupil* 77.67 77.37 26
Pupil/Teacher Ratio 15.0 15.5 23
% Change in Pupil-Teacher Ratio* -12.79 -10.88 21
Average Salary of Instructional Staff $40,476 $44,133 32
*In the period between the 1983-84 school year and the 2003-2004 school year.
White 38.7%
Black 14.3%
Hispanic 43.8%
Asian/Pacifi c Islander 2.9%
American Indian/Alaskan 0.3%
Educational Outputs
36
Funding % from Federal Government 9.88
% from State and Local Sources 90.12
National Rank 17

52 | A Report Card on American Education: A State-by-State Analysis
Student Demographics
2004 NATIONAL NATIONAL AVERAGES AVERAGE RANK
UtahNational Rank of Academic Achievement
Charter Schools FALL 2005
Number of Charter Schools 39
Number of Charter School Students 11,797
2005 NATIONAL NATIONAL AVERAGES AVERAGE RANK
NAEP Scores Grade 8 Mathematics 279 278 28
% Above Profi ciency 30 29
Grade 4 Mathematics 239 237 25
% Above Profi ciency 37 35
Grade 8 Reading 262 260 28
% Above Profi ciency 29 29
Grade 4 Reading 221 217 20
% Above Profi ciency 35 30
ACT Scores Composite Score 21.5 20.9 20
% of Graduates Take ACT 67 40
% Change in Cumulative ACT Scores 1994-2004 0.94 0.48 33
SAT Scores Composite Score 1121 1026 15
% of Graduates Take SAT 7 48
% Change in Cumulative SAT Scores 1984-2004 -4.43 2.70 49
Educational Inputs 2005 NATIONAL NATIONAL AVERAGES AVERAGE RANK
Expenditures per Pupil $5,853 $9,052 51
% Change in Expenditures per Pupil* 70.41 77.37 37
Pupil/Teacher Ratio 22.4 15.5 51
% Change in Pupil-Teacher Ratio* -4.27 -10.88 45
Average Salary of Instructional Staff $38,976 $44,133 39
*In the period between the 1983-84 school year and the 2003-2004 school year.
White 83.4%
Black 1.1%
Hispanic 11.0%
Asian/Pacifi c Islander 2.9%
American Indian/Alaskan 1.5%
Funding % from Federal Government 9.26
% from State and Local Sources 90.74
National Rank 22
Educational Outputs
21
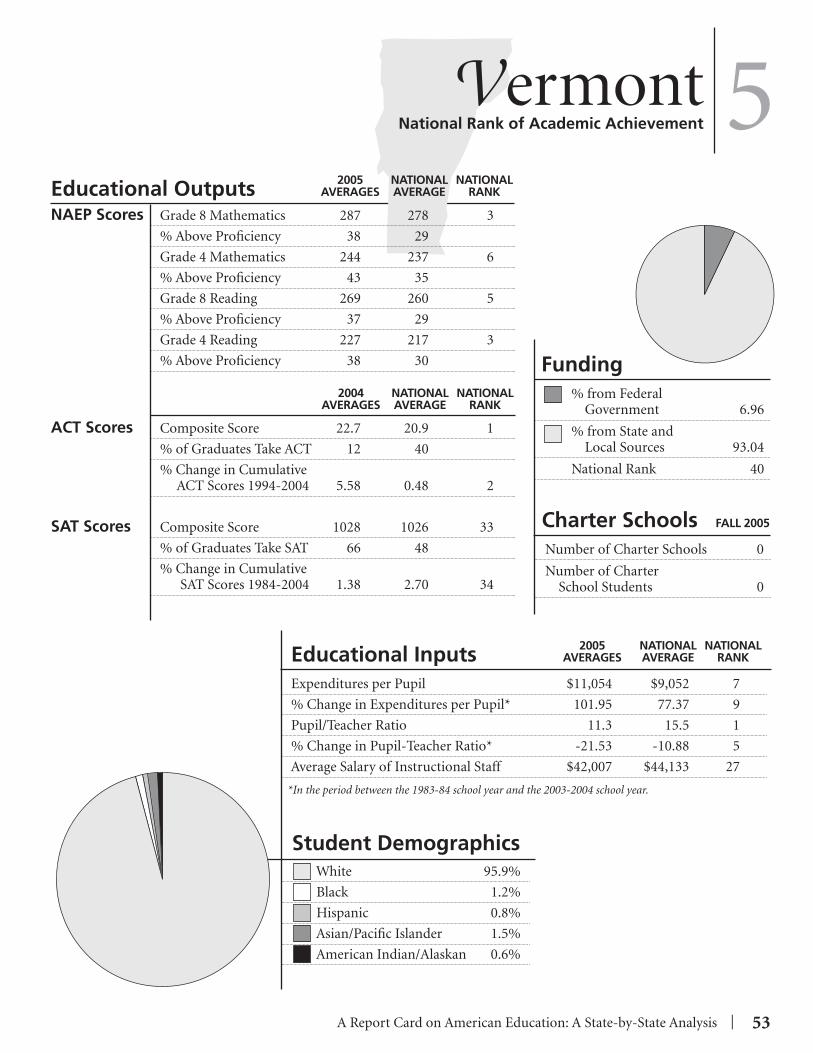
A Report Card on American Education: A State-by-State Analysis | 53
Student Demographics
2004 NATIONAL NATIONAL AVERAGES AVERAGE RANK
VermontNational Rank of Academic Achievement
Charter Schools FALL 2005
Number of Charter Schools 0
Number of Charter School Students 0
2005 NATIONAL NATIONAL AVERAGES AVERAGE RANK
NAEP Scores Grade 8 Mathematics 287 278 3
% Above Profi ciency 38 29
Grade 4 Mathematics 244 237 6
% Above Profi ciency 43 35
Grade 8 Reading 269 260 5
% Above Profi ciency 37 29
Grade 4 Reading 227 217 3
% Above Profi ciency 38 30
ACT Scores Composite Score 22.7 20.9 1
% of Graduates Take ACT 12 40
% Change in Cumulative ACT Scores 1994-2004 5.58 0.48 2
SAT Scores Composite Score 1028 1026 33
% of Graduates Take SAT 66 48
% Change in Cumulative SAT Scores 1984-2004 1.38 2.70 34
Educational Inputs 2005 NATIONAL NATIONAL AVERAGES AVERAGE RANK
Expenditures per Pupil $11,054 $9,052 7
% Change in Expenditures per Pupil* 101.95 77.37 9
Pupil/Teacher Ratio 11.3 15.5 1
% Change in Pupil-Teacher Ratio* -21.53 -10.88 5
Average Salary of Instructional Staff $42,007 $44,133 27
*In the period between the 1983-84 school year and the 2003-2004 school year.
White 95.9%
Black 1.2%
Hispanic 0.8%
Asian/Pacifi c Islander 1.5%
American Indian/Alaskan 0.6%
Educational Outputs
5
Funding % from Federal Government 6.96
% from State and Local Sources 93.04
National Rank 40

54 | A Report Card on American Education: A State-by-State Analysis
Student Demographics
2004 NATIONAL NATIONAL AVERAGES AVERAGE RANK
VirginiaNational Rank of Academic Achievement
Charter Schools FALL 2005
Number of Charter Schools 5
Number of Charter School Students 528
2005 NATIONAL NATIONAL AVERAGES AVERAGE RANK
NAEP Scores Grade 8 Mathematics 284 278 13
% Above Profi ciency 33 29
Grade 4 Mathematics 240 237 20
% Above Profi ciency 40 35
Grade 8 Reading 268 260 10
% Above Profi ciency 35 29
Grade 4 Reading 226 217 5
% Above Profi ciency 37 30
ACT Scores Composite Score 20.9 20.9 33
% of Graduates Take ACT 13 40
% Change in Cumulative ACT Scores 1994-2004 -1.88 0.48 49
SAT Scores Composite Score 1024 1026 35
% of Graduates Take SAT 71 48
% Change in Cumulative SAT Scores 1984-2004 2.71 2.70 20
Educational Inputs 2005 NATIONAL NATIONAL AVERAGES AVERAGE RANK
Expenditures per Pupil $8,675 $9,052 27
% Change in Expenditures per Pupil* 87.65 77.37 19
Pupil/Teacher Ratio 13.2 15.5 6
% Change in Pupil-Teacher Ratio* -21.43 -10.88 6
Average Salary of Instructional Staff $43,655 $44,133 21
*In the period between the 1983-84 school year and the 2003-2004 school year.
White 61.3%
Black 26.8%
Hispanic 6.6%
Asian/Pacifi c Islander 4.7%
American Indian/Alaskan 0.5%
Funding % from Federal Government 6.60
% from State and Local Sources 93.40
National Rank 42
Educational Outputs
13
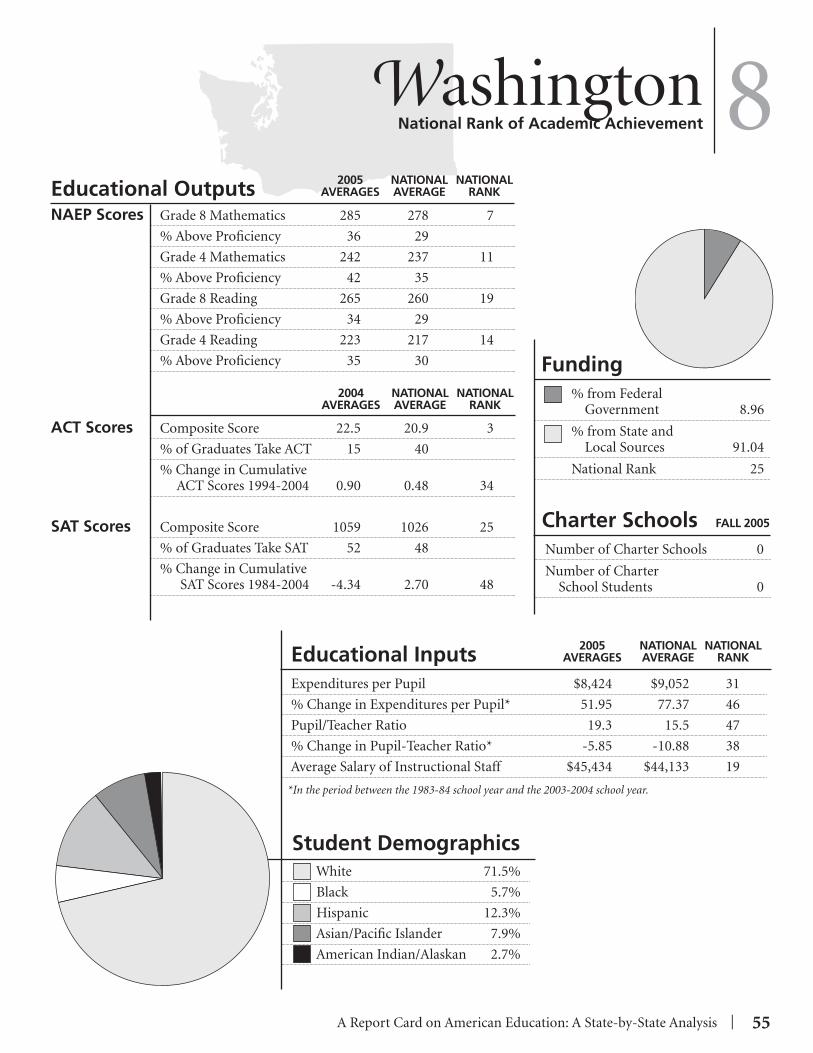
A Report Card on American Education: A State-by-State Analysis | 55
Student Demographics
2004 NATIONAL NATIONAL AVERAGES AVERAGE RANK
WashingtonNational Rank of Academic Achievement
Charter Schools FALL 2005
Number of Charter Schools 0
Number of Charter School Students 0
2005 NATIONAL NATIONAL AVERAGES AVERAGE RANK
NAEP Scores Grade 8 Mathematics 285 278 7
% Above Profi ciency 36 29
Grade 4 Mathematics 242 237 11
% Above Profi ciency 42 35
Grade 8 Reading 265 260 19
% Above Profi ciency 34 29
Grade 4 Reading 223 217 14
% Above Profi ciency 35 30
ACT Scores Composite Score 22.5 20.9 3
% of Graduates Take ACT 15 40
% Change in Cumulative ACT Scores 1994-2004 0.90 0.48 34
SAT Scores Composite Score 1059 1026 25
% of Graduates Take SAT 52 48
% Change in Cumulative SAT Scores 1984-2004 -4.34 2.70 48
Educational Inputs 2005 NATIONAL NATIONAL AVERAGES AVERAGE RANK
Expenditures per Pupil $8,424 $9,052 31
% Change in Expenditures per Pupil* 51.95 77.37 46
Pupil/Teacher Ratio 19.3 15.5 47
% Change in Pupil-Teacher Ratio* -5.85 -10.88 38
Average Salary of Instructional Staff $45,434 $44,133 19
*In the period between the 1983-84 school year and the 2003-2004 school year.
White 71.5%
Black 5.7%
Hispanic 12.3%
Asian/Pacifi c Islander 7.9%
American Indian/Alaskan 2.7%
Educational Outputs
8
Funding % from Federal Government 8.96
% from State and Local Sources 91.04
National Rank 25

56 | A Report Card on American Education: A State-by-State Analysis
Student Demographics
2004 NATIONAL NATIONAL AVERAGES AVERAGE RANK
West VirginiaNational Rank of Academic Achievement
Charter Schools FALL 2005
Number of Charter Schools 0
Number of Charter School Students 0
2005 NATIONAL NATIONAL AVERAGES AVERAGE RANK
NAEP Scores Grade 8 Mathematics 269 278 44
% Above Profi ciency 17 29
Grade 4 Mathematics 231 237 42
% Above Profi ciency 26 35
Grade 8 Reading 255 260 43
% Above Profi ciency 22 29
Grade 4 Reading 215 217 37
% Above Profi ciency 26 30
ACT Scores Composite Score 20.5 20.9 36
% of Graduates Take ACT 65 40
% Change in Cumulative ACT Scores 1994-2004 3.02 0.48 8
SAT Scores Composite Score 1038 1026 30
% of Graduates Take SAT 19 48
% Change in Cumulative SAT Scores 1984-2004 -3.17 2.70 46
Educational Inputs 2005 NATIONAL NATIONAL AVERAGES AVERAGE RANK
Expenditures per Pupil $9,056 $9,052 21
% Change in Expenditures per Pupil* 89.76 77.37 15
Pupil/Teacher Ratio 14.0 15.5 18
% Change in Pupil-Teacher Ratio* -8.50 -10.88 27
Average Salary of Instructional Staff $38,461 $44,133 41
*In the period between the 1983-84 school year and the 2003-2004 school year.
White 94.1%
Black 4.6%
Hispanic 0.5%
Asian/Pacifi c Islander 0.6%
American Indian/Alaskan 0.1%
Funding % from Federal Government 10.65
% from State and Local Sources 89.35
National Rank 13
Educational Outputs
44

A Report Card on American Education: A State-by-State Analysis | 57
Student Demographics
2004 NATIONAL NATIONAL AVERAGES AVERAGE RANK
WisconsinNational Rank of Academic Achievement
Charter Schools FALL 2005
Number of Charter Schools 188
Number of Charter School Students 35,406
2005 NATIONAL NATIONAL AVERAGES AVERAGE RANK
NAEP Scores Grade 8 Mathematics 285 278 7
% Above Profi ciency 36 29
Grade 4 Mathematics 241 237 16
% Above Profi ciency 40 35
Grade 8 Reading 266 260 17
% Above Profi ciency 34 29
Grade 4 Reading 221 217 21
% Above Profi ciency 33 30
ACT Scores Composite Score 22.2 20.9 9
% of Graduates Take ACT 68 40
% Change in Cumulative ACT Scores 1994-2004 1.37 0.48 28
SAT Scores Composite Score 1183 1026 3
% of Graduates Take SAT 7 48
% Change in Cumulative SAT Scores 1984-2004 6.10 2.70 10
Educational Inputs 2005 NATIONAL NATIONAL AVERAGES AVERAGE RANK
Expenditures per Pupil $9,899 $9,052 17
% Change in Expenditures per Pupil* 79.78 77.37 25
Pupil/Teacher Ratio 15.1 15.5 25
% Change in Pupil-Teacher Ratio* -7.36 -10.88 32
Average Salary of Instructional Staff $42,882 $44,133 24
*In the period between the 1983-84 school year and the 2003-2004 school year.
White 78.8%
Black 10.5%
Hispanic 5.8%
Asian/Pacifi c Islander 3.4%
American Indian/Alaskan 1.4%
Educational Outputs
6
Funding % from Federal Government 6.06
% from State and Local Sources 93.94
National Rank 46

58 | A Report Card on American Education: A State-by-State Analysis
Student Demographics
2004 NATIONAL NATIONAL AVERAGES AVERAGE RANK
WyomingNational Rank of Academic Achievement
Charter Schools FALL 2005
Number of Charter Schools 3
Number of Charter School Students 479
2005 NATIONAL NATIONAL AVERAGES AVERAGE RANK
NAEP Scores Grade 8 Mathematics 282 278 18
% Above Profi ciency 29 29
Grade 4 Mathematics 243 237 7
% Above Profi ciency 42 35
Grade 8 Reading 268 260 10
% Above Profi ciency 35 29
Grade 4 Reading 223 217 16
% Above Profi ciency 34 30
ACT Scores Composite Score 21.4 20.9 25
% of Graduates Take ACT 70 40
% Change in Cumulative ACT Scores 1994-2004 0.94 0.48 32
SAT Scores Composite Score 1097 1026 20
% of Graduates Take SAT 12 48
% Change in Cumulative SAT Scores 1984-2004 -3.26 2.70 47
Educational Inputs 2005 NATIONAL NATIONAL AVERAGES AVERAGE RANK
Expenditures per Pupil $10,340 $9,052 11
% Change in Expenditures per Pupil* 53.17 77.37 45
Pupil/Teacher Ratio 13.3 15.5 7
% Change in Pupil-Teacher Ratio* -5.00 -10.88 44
Average Salary of Instructional Staff $39,532 $44,133 36
*In the period between the 1983-84 school year and the 2003-2004 school year.
White 86.0%
Black 1.4%
Hispanic 8.2%
Asian/Pacifi c Islander 1.0%
American Indian/Alaskan 3.5%
Funding % from Federal Government 8.79
% from State and Local Sources 91.21
National Rank 28
Educational Outputs
16

A Report Card on American Education: A State-by-State Analysis | 59
CHAPTER ONE
Measures of Educational Inputs
ALECAmerican Legislative Exchange Council

60 |
Over the past twenty-fi ve years, the major push for improving student achievement has centered on supplementing the “input” side of the educational
equation. By focusing on such factors as dollars spent per student, teacher salaries, class size, and number of schools, policy makers hoped to increase test scores by increasing the resources being placed into the system. This was especially clear throughout the 1990’s, when booming state economies led to an educational spending frenzy in an attempt to raise stagnant student achievement.
This “spend more = get more” mentality has certainly been whole-heartedly adopted by teachers’ unions and those organizations which make up the educational establishment. However, as a nation we have been pouring ever increasing amounts of money into the input side of the equation and, as will be explored further in the next chapter, we have very little to show for it in regards to improved student performance. Interestingly, states have refused to rein in their educational spending in accord with the push for greater accountability, and in fact many have continued to increase spending.
This chapter presents these measures of educational inputs precisely because they are easy to collect and lawmakers are used to thinking of their commitment to education in these terms. Lawmakers, however, must recognize that there are other important factors that signifi cantly impact the ultimate success of students, including parental involvement in a student’s activities, the level of dedication of teachers, and school-by-school autonomy in setting curricula. These “institutional” factors may be diffi cult to measure, but are vitally important to the educational achievement of students.
Chapter “Fast Facts”
■ Nationwide, the pupil-to-teacher ratio has fallen 10.9 percent over the last 20 years. Specifi cally, the ratio has dropped from 17.4 pupils per teacher in 1983-84, to 15.5 in the 2003-04 school year (See Table 1.1).
■ Vermont had the smallest pupil-per-teacher ratio (11.3:1) just ahead of Main (11.5:1). The next closest state was Alabama (12.6:1).
■ Alabama experienced the largest decline, a 36.4 percent reduction in pupil-per-teacher ratio, from 1983-84 to 2003-04. The next closest state was Hawaii which experienced a 27 percent reduction in their pupil-per-teacher ratio.
■ Oregon (12.6 percent), Alaska (3 percent), and Florida (2.3 percent) were the only states to experience a growth in the pupil-per-teacher ratio from 1983-84 to 2003-04. Not surprisingly in the 2003-04 school year, Oregon (20.6:1), Alaska (17.2:1), and Florida (17.9:1) ranked 48th, 42nd, and 43rd respectively in pupil-per-teacher ratio nationally.
■ During the 2003-2004 school year there were 3,048,549 public elementary and secondary teachers. There were an additional 874,849 instructional staff members consisting of principals, supervisors and other non-supervisory instructional staff (See Table 1.2).
■ The amount of money spent on public primary and secondary education during the 2003-2004 school year was $443,198,760,000 (See Table 1.4). The federal government provided $37,515,909,000, or 8.5 percent of total revenues (See Table 1.3).
■ The amount spent per pupil has grown signifi cantly over the past twenty years, from $5,103 in 1983-84, to $7,593 in 1993-94, and to $9,052 in 2003-2004 (constant 2003-04 dollars, see Table 1.7). This is an increase of 77.4 percent per pupil (See Table 1.8).
■ The District of Columbia spent the most per student ($14,190) in the 2003-04 school year, followed by New Jersey ($13,673), New York ($13,672), and Connecticut ($12,426).
■ States spending the least per student were Utah ($5,853), Mississippi ($6,255) and Oklahoma ($6,536).
C H A P T E R O N E

A Report Card on American Education: A State-by-State Analysis | 61
TABLE 1.1
Pupil Teacher Ratio, Ranked by 2003-2004 Figures
SOURCE: U.S. Department of Education, National Cen-ter for Education Statistics; Statistics of Public Elemen-tary and Secondary Schools, various years, and Common Core of Data Surveys.
% change 2003- 1998- 1993- 1983- 1983-84 to 2004 Rank 1999 Rank 1994 Rank 1984 Rank 2003-04
United States 15.5 16.1 16.9 17.4 -10.88%Vermont 11.3 1 12.8 1 14.0 3 14.4 4 -21.53%Maine 11.5 2 13.3 2 14.1 4 15.5 13 -25.81%Alabama 12.6 3 15.7 25 17.1 28 19.8 44 -36.36%New Jersey 12.7 4 13.8 3 13.6 2 14.7 6 -13.61%North Dakota 12.7 4 14.4 13 15.4 14 15.3 9 -16.99%Virginia 13.2 6 14.2 8 14.8 7 16.8 23 -21.43%New York 13.3 7 14.6 15 15.2 13 15.4 11 -13.64%Wyoming 13.3 7 14.2 8 15.4 14 14.0 2 -5.00%Rhode Island 13.4 9 13.9 5 14.8 7 15.1 7 -11.26%Connecticut 13.6 10 14.0 7 14.4 5 13.7 1 -0.73%Massachusetts 13.6 10 13.8 3 14.9 9 14.4 4 -5.56%Nebraska 13.6 10 14.3 11 14.5 6 15.1 7 -9.93%South Dakota 13.6 10 14.3 11 14.9 9 15.6 15 -12.82%New Hampshire 13.7 14 15.4 22 15.5 16 15.9 17 -13.84%District of Columbia 13.8 15 13.9 5 13.3 1 14.3 3 -3.50%Iowa 13.8 15 15.2 18 15.8 18 15.5 13 -10.97%Missouri 13.9 17 14.6 15 15.8 18 16.4 21 -15.24%West Virginia 14.0 18 14.2 8 14.9 9 15.3 9 -8.50%Kansas 14.4 19 14.8 17 15.1 12 15.4 11 -6.49%Louisiana 14.4 19 15.6 24 17.1 28 18.5 37 -22.16%Montana 14.4 19 15.7 25 16.4 23 15.6 15 -7.69%Arkansas 14.7 22 16.2 33 17.1 28 17.5 30 -16.00%New Mexico 15.0 23 16.5 36 17.5 34 19.0 41 -21.05%Texas 15.0 23 15.2 18 16.0 20 17.2 26 -12.79%Mississippi 15.1 25 16.1 31 17.8 39 19.0 41 -20.53%North Carolina 15.1 25 15.8 28 16.3 22 18.7 39 -19.25%Wisconsin 15.1 25 14.4 13 16.0 20 16.3 19 -7.36%Delaware 15.2 28 16.0 30 16.5 24 16.0 18 -5.00%Ohio 15.2 28 16.2 33 16.8 27 18.1 32 -16.02%Pennsylvania 15.2 28 16.4 35 17.2 32 16.3 19 -6.75%South Carolina 15.3 31 15.2 18 16.7 25 17.3 27 -11.56%Georgia 15.7 32 15.8 28 16.7 25 18.9 40 -16.93%Tennessee 15.7 32 15.3 21 18.8 44 19.9 45 -21.11%Maryland 15.8 34 16.9 39 17.5 34 17.1 25 -7.60%Oklahoma 16.0 35 15.4 22 15.5 16 16.9 24 -5.33%Kentucky 16.1 36 16.1 31 17.6 38 18.6 38 -13.44%Minnesota 16.3 37 15.7 25 17.3 33 17.4 28 -6.32%Hawaii 16.5 38 17.7 41 17.8 39 22.6 49 -26.99%Illinois 16.5 39 16.5 36 17.1 28 17.4 28 -5.17%Colorado 16.9 40 17.7 41 18.6 42 18.2 33 -7.14%Indiana 16.9 40 17.0 40 17.5 34 18.3 34 -7.65%Alaska 17.2 42 16.7 38 17.5 34 16.7 22 2.99%Florida 17.9 43 18.4 44 18.4 41 17.5 30 2.29%Idaho 17.9 43 18.2 43 19.7 47 20.4 46 -12.25%Michigan 18.1 45 18.5 45 19.9 48 19.2 43 -5.73%Nevada 19.0 46 18.9 46 18.7 43 20.4 46 -6.86%Washington 19.3 47 20.1 49 20.1 49 20.5 48 -5.85%Oregon 20.6 48 20.0 47 19.5 46 18.3 34 12.57%California 21.1 49 21.0 50 24.0 50 23.0 50 -8.26%Arizona 21.3 50 20.0 47 18.9 45 18.4 36 15.76%Utah 22.4 51 22.4 51 24.7 51 23.4 51 -4.27%

62 |
2003-2004 Teachers Total as a % of Elementary Secondary Total Instructional Instructional Teachers Teachers Teachers Staff (1) Staff
United States 1,795,472 1,238,251 3,048,549 3,923,398 77.70% Alabama 37,553 19,918 57,471 68,460 83.95% Alaska 5,447 2,329 7,776 10,761 72.26% Arizona 33,838 13,459 47,297 63,368 74.64% Arkansas 12,973 15,499 28,472 39,672 71.77% California 209,794 78,462 288,256 393,441 73.27% Colorado 22,056 22,219 44,275 58,465 75.73% Connecticut 24,601 13,036 37,637 56,497 66.62% Delaware 3,813 3,902 7,715 9,668 79.80% DC 3,138 1,856 4,994 7,421 67.30% Florida 62,168 57,139 119,307 182,213 65.48% Georgia 54,096 40,793 94,889 127,700 74.31% Hawaii 5,596 5,281 10,877 14,784 73.57% Idaho 7,140 6,777 13,917 17,680 78.72% Illinois 73,702 32,641 106,343 168,226 63.21% Indiana 30,881 25,807 56,688 82,860 68.41% Iowa 18,757 11,353 30,110 46,469 64.80% Kansas 14,004 14,655 28,659 41,501 69.06% Kentucky 16,780 16,118 32,898 58,374 56.36% Louisiana 34,550 15,083 49,633 65,974 75.23% Maine 11,782 5,560 17,342 24,837 69.82% Maryland 32,167 22,447 54,614 69,362 78.74% Massachusetts 27,893 31,825 59,718 95,115 62.79% Michigan 66,774 22,915 89,689 130,578 68.69% Minnesota 25,152 25,563 50,715 68,904 73.60% Mississippi 14,595 13,385 27,980 43,622 64.14% Missouri 31,995 31,606 63,601 80,071 79.43% Montana 6,710 3,432 10,142 12,857 78.88% Nebraska 12,622 8,000 20,622 27,068 76.19% Nevada 9,718 7,777 17,495 24,275 72.07% New Hampshire 10,265 4,721 14,986 22,214 67.46% New Jersey 61,119 29,623 90,742 139,470 65.06% New Mexico 11,970 4,926 16,896 28,531 59.22% New York 87,440 90,061 177,501 279,445 63.52% North Carolina 52,536 30,946 83,482 123,469 67.61% North Dakota 4,664 3,249 7,913 10,377 76.26% Ohio 81,866 38,445 120,311 147,008 81.84% Oklahoma 17,404 16,717 34,121 47,482 71.86% Oregon 11,844 9,795 21,639 37,143 58.26% Pennsylvania 51,822 50,256 102,078 150,840 67.67% Rhode Island 8,219 2,821 11,040 15,191 72.67% South Carolina 31,286 13,041 44,327 52,043 85.17% South Dakota 5,505 2,605 8,110 13,364 60.69% Tennessee 42,012 16,168 58,180 80,224 72.52% Texas 137,058 112,426 249,484 379,081 65.81% Utah 10,502 8,867 19,369 29,781 65.04% Vermont 3,353 3,554 6,907 13,716 50.36% Virginia 39,076 50,724 89,800 111,309 80.68% Washington 26,256 21,569 47,825 66,168 72.28% West Virginia 9,709 6,729 16,438 24,512 67.06% Wisconsin 38,212 18,770 56,982 72,887 78.18% Wyoming 3,059 3,401 6,460 8,920 72.42%
TABLE 1.2 Instructional Staff in Public Elementary and Secondary Schools
(1) Includes principals, supervisors, and other nonsupervisory instructional staff. Note: Total teachers in each state may not add to detail due to rounding, missing detail, or duplicate reporting in the detail.
Source: U.S. Department of Education, National Center for Education Statistics; Common Core of Data Surveys.

| 63
1993-1994 1983-1984 Teachers Teachers Total as a % of Total as a % of
Total Instructional Instructional Total Instructional InstructionalTeachers Staff (1) Staff Teachers Staff (1) Staff
2,503,803 3,112,665 80.44% 2,230,088 2,635,251 84.63%42,905 49,067 87.44% 36,568 43,385 84.29%
7,095 9,349 75.89% 6,145 7,645 80.38%37,395 42,658 87.66% 28,801 31,986 90.04%25,916 32,710 79.23% 24,641 28,661 85.97%
221,689 286,455 77.39% 189,381 233,490 81.11%33,563 40,510 82.85% 30,401 35,089 86.64%34,428 43,030 80.01% 33,949 39,494 85.96%
6,282 7,321 85.81% 5,580 7,072 78.90%5,958 7,401 80.50% 5,681 6,873 82.66%
110,555 140,565 78.65% 91,466 101,865 89.79%74,074 85,173 86.97% 57,678 65,934 87.48%10,013 11,479 87.23% 7,088 9,879 71.75%11,909 13,801 86.29% 9,931 11,480 86.51%
110,776 132,620 83.53% 104,306 126,457 82.48%55,009 70,372 78.17% 52,566 61,450 85.54%31,518 39,272 80.26% 30,595 38,310 79.86%30,185 35,216 85.71% 26,892 31,350 85.78%37,226 48,119 77.36% 34,154 38,874 87.86%46,815 56,982 82.16% 42,826 49,747 86.09%15,246 20,176 75.57% 13,482 16,401 82.20%44,073 53,140 82.94% 39,156 48,595 80.58%58,668 67,760 86.58% 57,833 78,677 73.51%80,169 100,732 79.59% 82,922 101,301 81.86%46,858 55,218 84.86% 40,655 50,282 80.85%28,278 39,892 70.89% 26,008 29,877 87.05%54,762 61,488 89.06% 48,766 56,362 86.52%
9,852 12,116 81.31% 9,625 11,634 82.73%19,518 23,482 83.12% 17,545 20,673 84.87%12,481 14,185 87.99% 7,405 8,960 82.65%11,874 14,990 79.21% 9,952 11,803 84.32%84,466 95,981 88.00% 75,255 96,380 78.08%18,306 23,004 79.58% 14,573 16,692 87.31%
179,315 206,517 86.83% 167,837 187,554 89.49%69,323 89,525 77.43% 57,000 67,658 84.25%
7,657 9,561 80.09% 7,476 8,867 84.31%107,346 119,627 89.73% 98,691 124,662 79.17%
38,933 45,570 85.44% 34,908 39,171 89.12%26,390 33,562 78.63% 24,412 30,703 79.51%
101,203 119,713 84.54% 101,890 127,928 79.65%9,725 11,587 83.93% 8,713 11,075 78.67%
38,522 47,044 81.89% 34,746 39,503 87.96%9,459 10,714 88.29% 7,878 9,201 85.62%
45,968 53,508 85.91% 40,700 48,963 83.12%224,732 266,624 84.29% 185,279 205,535 90.14%
18,955 23,351 81.17% 17,249 19,481 88.54%7,232 9,896 73.08% 6,005 8,486 70.76%
70,761 79,769 88.71% 58,038 67,486 86.00%45,426 53,300 85.23% 36,862 42,858 86.00%20,931 24,835 84.28% 22,628 25,819 87.64%52,724 63,529 82.99% 46,736 56,892 82.15%
6,439 8,359 77.03% 6,064 7,581 79.99%

64 |
2003-2004 Revenues from Percent from Total Revenues Federal Federal Total Revenues and Receipts Rank Government Rank Government Rank and Receipts
United States $440,157,300 $37,515,909 8.52% $260,159,468 Alabama $5,153,795 26 $595,456 20 11.55% 11 $1,159,259 Alaska $1,468,276 44 $260,064 37 17.71% 1 $3,121,320 Arizona $7,351,310 20 $839,278 11 11.42% 12 $3,550,177 Arkansas $3,266,318 32 $382,871 31 11.72% 10 $2,014,900 California $57,021,364 1 $5,629,649 1 9.87% 18 $29,050,409 Colorado $6,299,536 22 $409,359 29 6.50% 44 $3,368,596 Connecticut $7,087,302 21 $369,444 33 5.21% 49 $4,103,215 Delaware $1,197,512 46 $102,929 48 8.60% 29 $684,411 DC $1,114,022 48 $153,246 44 13.76% 7 $735,722 Florida $18,984,106 5 $1,999,265 4 10.53% 15 $11,927,112 Georgia $13,448,966 10 $1,083,873 9 8.06% 32 $6,630,693 Hawaii $2,078,876 40 $170,377 42 8.20% 31 $1,140,173 Idaho $1,698,503 43 $166,626 43 9.81% 20 $955,081 Illinois $19,154,705 4 $1,618,737 5 8.45% 30 $11,322,719 Indiana $7,926,062 18 $605,523 19 7.64% 36 $5,918,601 Iowa $4,241,508 29 $315,454 34 7.44% 37 $2,782,621 Kansas $4,071,712 31 $370,506 32 9.10% 23 $2,695,033 Kentucky $4,764,253 27 $504,713 25 10.59% 14 $3,194,404 Louisiana $5,549,583 25 $732,835 14 13.21% 8 $3,608,433 Maine $2,161,238 39 $193,403 40 8.95% 26 $1,327,946 Maryland $8,668,097 16 $582,440 21 6.72% 41 $5,145,236 Massachusetts $11,801,318 11 $705,875 15 5.98% 47 $6,227,191 Michigan $17,954,395 9 $1,407,777 7 7.84% 34 $11,134,083 Minnesota $8,349,227 17 $494,757 27 5.93% 48 $5,160,259 Mississippi $3,263,897 33 $502,816 26 15.41% 3 $1,879,377 Missouri $7,662,199 19 $616,043 17 8.04% 33 $4,526,828 Montana $1,204,497 45 $174,685 41 14.50% 6 $877,807 Nebraska $2,550,525 38 $225,769 38 8.85% 27 $1,674,836 Nevada $2,784,681 35 $196,258 39 7.05% 38 $1,269,131 New Hampshire $1,957,267 41 $101,904 49 5.21% 50 $1,097,159 New Jersey $18,905,028 6 $805,498 12 4.26% 51 $11,301,907 New Mexico $2,685,725 36 $402,471 30 14.99% 5 $1,567,823 New York $37,894,517 2 $2,645,471 3 6.98% 39 $23,775,186 North Carolina $9,379,577 13 $899,045 10 9.59% 21 $5,560,310 North Dakota $825,135 51 $126,029 46 15.27% 4 $563,352 Ohio $18,143,062 8 $1,166,816 8 6.43% 45 $10,499,236 Oklahoma $4,161,621 30 $528,646 24 12.70% 9 $3,077,911 Oregon $4,599,717 28 $416,281 28 9.05% 24 $3,074,679 Pennsylvania $18,751,160 7 $1,453,198 6 7.75% 35 $12,601,361 Rhode Island $1,744,838 42 $113,611 47 6.51% 43 $1,022,861 South Carolina $5,732,697 24 $563,752 22 9.83% 19 $3,200,412 South Dakota $963,997 49 $151,235 45 15.69% 2 $647,026 Tennessee $6,114,870 23 $613,615 18 10.03% 16 $3,649,631 Texas $34,605,869 3 $3,417,588 2 9.88% 17 $18,744,302 Utah $2,912,991 34 $269,728 36 9.26% 22 $1,785,758 Vermont $1,149,920 47 $80,023 51 6.96% 40 $703,940 Virginia $10,283,182 12 $678,459 16 6.60% 42 $6,162,830 Washington $8,696,472 15 $779,564 13 8.96% 25 $5,723,616 West Virginia $2,552,446 37 $271,770 35 10.65% 13 $1,879,452 Wisconsin $8,858,181 14 $536,643 23 6.06% 46 $5,661,241 Wyoming $961,248 50 $84,536 50 8.79% 28 $673,906
TABLE 1.3
Revenues for Public Elementary and Secondary Schools, by Source and State, Current Dollars (in thousands)
Source: U.S. Department of Education, National Center for Education Statistics; Common Core of Data Surveys.
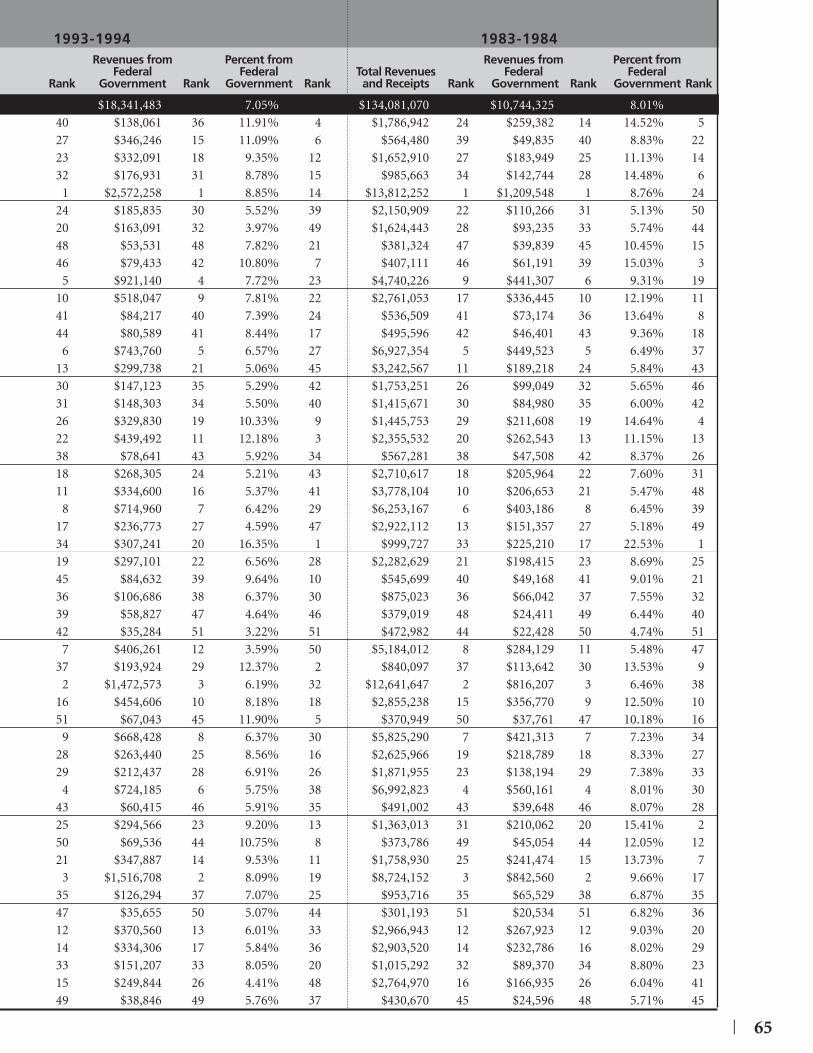
| 65
1993-1994 1983-1984 Revenues from Percent from Revenues from Percent from Federal Federal Total Revenues Federal Federal
Rank Government Rank Government Rank and Receipts Rank Government Rank Government Rank
$18,341,483 7.05% $134,081,070 $10,744,325 8.01% 40 $138,061 36 11.91% 4 $1,786,942 24 $259,382 14 14.52% 527 $346,246 15 11.09% 6 $564,480 39 $49,835 40 8.83% 2223 $332,091 18 9.35% 12 $1,652,910 27 $183,949 25 11.13% 1432 $176,931 31 8.78% 15 $985,663 34 $142,744 28 14.48% 6
1 $2,572,258 1 8.85% 14 $13,812,252 1 $1,209,548 1 8.76% 2424 $185,835 30 5.52% 39 $2,150,909 22 $110,266 31 5.13% 5020 $163,091 32 3.97% 49 $1,624,443 28 $93,235 33 5.74% 4448 $53,531 48 7.82% 21 $381,324 47 $39,839 45 10.45% 1546 $79,433 42 10.80% 7 $407,111 46 $61,191 39 15.03% 3
5 $921,140 4 7.72% 23 $4,740,226 9 $441,307 6 9.31% 1910 $518,047 9 7.81% 22 $2,761,053 17 $336,445 10 12.19% 1141 $84,217 40 7.39% 24 $536,509 41 $73,174 36 13.64% 844 $80,589 41 8.44% 17 $495,596 42 $46,401 43 9.36% 18
6 $743,760 5 6.57% 27 $6,927,354 5 $449,523 5 6.49% 3713 $299,738 21 5.06% 45 $3,242,567 11 $189,218 24 5.84% 4330 $147,123 35 5.29% 42 $1,753,251 26 $99,049 32 5.65% 4631 $148,303 34 5.50% 40 $1,415,671 30 $84,980 35 6.00% 4226 $329,830 19 10.33% 9 $1,445,753 29 $211,608 19 14.64% 422 $439,492 11 12.18% 3 $2,355,532 20 $262,543 13 11.15% 1338 $78,641 43 5.92% 34 $567,281 38 $47,508 42 8.37% 2618 $268,305 24 5.21% 43 $2,710,617 18 $205,964 22 7.60% 3111 $334,600 16 5.37% 41 $3,778,104 10 $206,653 21 5.47% 48
8 $714,960 7 6.42% 29 $6,253,167 6 $403,186 8 6.45% 3917 $236,773 27 4.59% 47 $2,922,112 13 $151,357 27 5.18% 4934 $307,241 20 16.35% 1 $999,727 33 $225,210 17 22.53% 119 $297,101 22 6.56% 28 $2,282,629 21 $198,415 23 8.69% 2545 $84,632 39 9.64% 10 $545,699 40 $49,168 41 9.01% 2136 $106,686 38 6.37% 30 $875,023 36 $66,042 37 7.55% 3239 $58,827 47 4.64% 46 $379,019 48 $24,411 49 6.44% 4042 $35,284 51 3.22% 51 $472,982 44 $22,428 50 4.74% 51
7 $406,261 12 3.59% 50 $5,184,012 8 $284,129 11 5.48% 4737 $193,924 29 12.37% 2 $840,097 37 $113,642 30 13.53% 9
2 $1,472,573 3 6.19% 32 $12,641,647 2 $816,207 3 6.46% 3816 $454,606 10 8.18% 18 $2,855,238 15 $356,770 9 12.50% 1051 $67,043 45 11.90% 5 $370,949 50 $37,761 47 10.18% 16
9 $668,428 8 6.37% 30 $5,825,290 7 $421,313 7 7.23% 3428 $263,440 25 8.56% 16 $2,625,966 19 $218,789 18 8.33% 2729 $212,437 28 6.91% 26 $1,871,955 23 $138,194 29 7.38% 33
4 $724,185 6 5.75% 38 $6,992,823 4 $560,161 4 8.01% 3043 $60,415 46 5.91% 35 $491,002 43 $39,648 46 8.07% 2825 $294,566 23 9.20% 13 $1,363,013 31 $210,062 20 15.41% 250 $69,536 44 10.75% 8 $373,786 49 $45,054 44 12.05% 1221 $347,887 14 9.53% 11 $1,758,930 25 $241,474 15 13.73% 7
3 $1,516,708 2 8.09% 19 $8,724,152 3 $842,560 2 9.66% 1735 $126,294 37 7.07% 25 $953,716 35 $65,529 38 6.87% 3547 $35,655 50 5.07% 44 $301,193 51 $20,534 51 6.82% 3612 $370,560 13 6.01% 33 $2,966,943 12 $267,923 12 9.03% 2014 $334,306 17 5.84% 36 $2,903,520 14 $232,786 16 8.02% 2933 $151,207 33 8.05% 20 $1,015,292 32 $89,370 34 8.80% 2315 $249,844 26 4.41% 48 $2,764,970 16 $166,935 26 6.04% 4149 $38,846 49 5.76% 37 $430,670 45 $24,596 48 5.71% 45
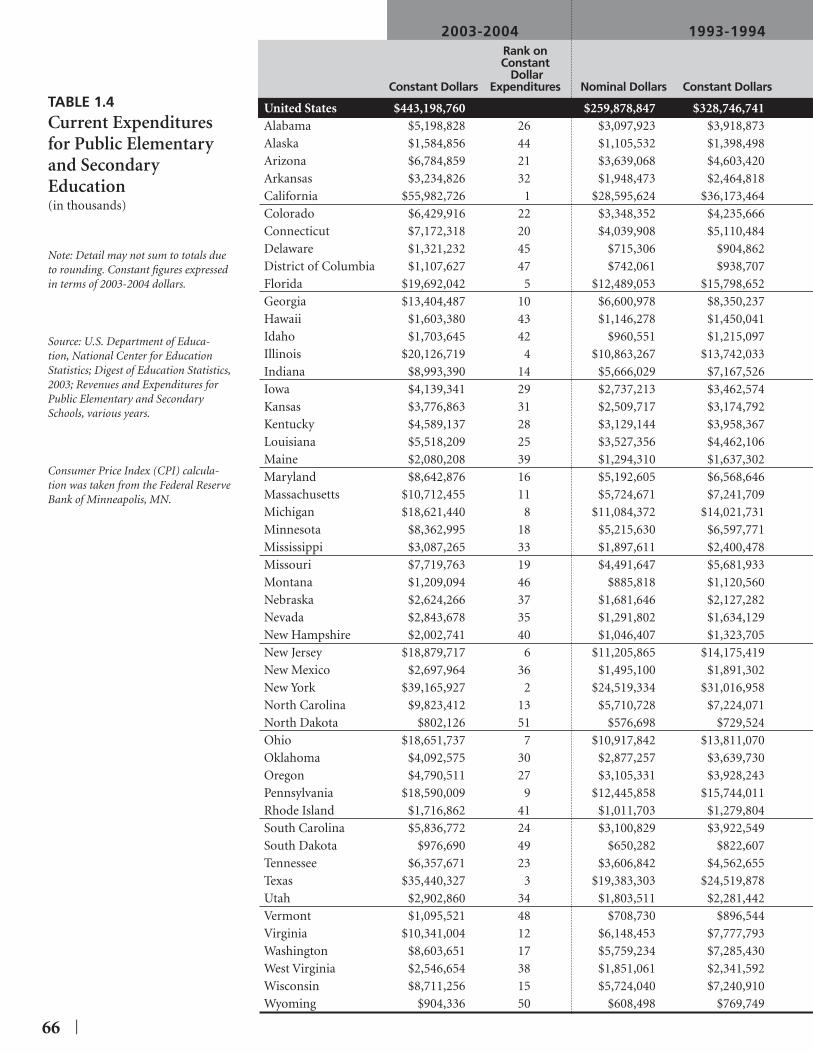
66 |
2003-2004 1993-1994 Rank on Constant Dollar Constant Dollars Expenditures Nominal Dollars Constant Dollars
United States $443,198,760 $259,878,847 $328,746,741 Alabama $5,198,828 26 $3,097,923 $3,918,873 Alaska $1,584,856 44 $1,105,532 $1,398,498 Arizona $6,784,859 21 $3,639,068 $4,603,420 Arkansas $3,234,826 32 $1,948,473 $2,464,818 California $55,982,726 1 $28,595,624 $36,173,464 Colorado $6,429,916 22 $3,348,352 $4,235,666 Connecticut $7,172,318 20 $4,039,908 $5,110,484 Delaware $1,321,232 45 $715,306 $904,862 District of Columbia $1,107,627 47 $742,061 $938,707 Florida $19,692,042 5 $12,489,053 $15,798,652 Georgia $13,404,487 10 $6,600,978 $8,350,237 Hawaii $1,603,380 43 $1,146,278 $1,450,041 Idaho $1,703,645 42 $960,551 $1,215,097 Illinois $20,126,719 4 $10,863,267 $13,742,033 Indiana $8,993,390 14 $5,666,029 $7,167,526 Iowa $4,139,341 29 $2,737,213 $3,462,574 Kansas $3,776,863 31 $2,509,717 $3,174,792 Kentucky $4,589,137 28 $3,129,144 $3,958,367 Louisiana $5,518,209 25 $3,527,356 $4,462,106 Maine $2,080,208 39 $1,294,310 $1,637,302 Maryland $8,642,876 16 $5,192,605 $6,568,646 Massachusetts $10,712,455 11 $5,724,671 $7,241,709 Michigan $18,621,440 8 $11,084,372 $14,021,731 Minnesota $8,362,995 18 $5,215,630 $6,597,771 Mississippi $3,087,265 33 $1,897,611 $2,400,478 Missouri $7,719,763 19 $4,491,647 $5,681,933 Montana $1,209,094 46 $885,818 $1,120,560 Nebraska $2,624,266 37 $1,681,646 $2,127,282 Nevada $2,843,678 35 $1,291,802 $1,634,129 New Hampshire $2,002,741 40 $1,046,407 $1,323,705 New Jersey $18,879,717 6 $11,205,865 $14,175,419 New Mexico $2,697,964 36 $1,495,100 $1,891,302 New York $39,165,927 2 $24,519,334 $31,016,958 North Carolina $9,823,412 13 $5,710,728 $7,224,071 North Dakota $802,126 51 $576,698 $729,524 Ohio $18,651,737 7 $10,917,842 $13,811,070 Oklahoma $4,092,575 30 $2,877,257 $3,639,730 Oregon $4,790,511 27 $3,105,331 $3,928,243 Pennsylvania $18,590,009 9 $12,445,858 $15,744,011 Rhode Island $1,716,862 41 $1,011,703 $1,279,804 South Carolina $5,836,772 24 $3,100,829 $3,922,549 South Dakota $976,690 49 $650,282 $822,607 Tennessee $6,357,671 23 $3,606,842 $4,562,655 Texas $35,440,327 3 $19,383,303 $24,519,878 Utah $2,902,860 34 $1,803,511 $2,281,442 Vermont $1,095,521 48 $708,730 $896,544 Virginia $10,341,004 12 $6,148,453 $7,777,793 Washington $8,603,651 17 $5,759,234 $7,285,430 West Virginia $2,546,654 38 $1,851,061 $2,341,592 Wisconsin $8,711,256 15 $5,724,040 $7,240,910 Wyoming $904,336 50 $608,498 $769,749
TABLE 1.4 Current Expenditures for Public Elementary and Secondary Education(in thousands)
Note: Detail may not sum to totals due to rounding. Constant fi gures expressed in terms of 2003-2004 dollars. Source: U.S. Department of Educa-tion, National Center for Education Statistics; Digest of Education Statistics, 2003; Revenues and Expenditures for Public Elementary and Secondary Schools, various years. Consumer Price Index (CPI) calcula-tion was taken from the Federal Reserve Bank of Minneapolis, MN.

| 67
1983-1984 Rank on Rank on Percent Change
Constant Constant in Constant Rank on Dollar Dollar Expenditures Percent
Expenditures Nominal Dollars Constant Dollars Expenditures 1983-84 — 2003-04 Change
$108,274,697 $199,225,443 122.46% 41 $1,486,521 $2,735,199 25 90.07% 3428 $625,818 $1,151,505 38 37.63% 4921 $1,242,928 $2,286,988 28 196.67% 332 $801,194 $1,474,197 34 119.43% 21
1 $11,050,354 $20,332,651 1 175.33% 524 $1,605,885 $2,954,828 22 117.61% 2520 $1,711,013 $3,148,264 21 127.82% 1647 $294,222 $541,369 49 144.05% 946 $340,027 $625,650 47 77.04% 43
4 $3,747,760 $6,895,878 9 185.56% 410 $2,123,586 $3,907,398 16 243.05% 240 $484,858 $892,139 39 79.72% 4244 $398,996 $734,153 44 132.06% 15
9 $5,108,290 $9,399,254 6 114.13% 2616 $2,239,069 $4,119,887 13 118.29% 2430 $1,474,443 $2,712,975 26 52.58% 4531 $1,131,758 $2,082,435 31 81.37% 4125 $1,233,797 $2,270,187 29 102.15% 3223 $1,908,595 $3,511,815 19 57.13% 4438 $484,744 $891,929 40 133.23% 1318 $2,118,972 $3,898,909 17 121.67% 1913 $2,792,653 $5,138,482 10 108.48% 28
7 $5,351,620 $9,846,981 5 89.11% 3517 $2,075,572 $3,819,053 18 118.98% 2233 $896,764 $1,650,046 33 87.10% 3719 $1,772,111 $3,260,684 20 136.75% 1145 $456,519 $839,995 41 43.94% 4736 $759,197 $1,396,923 35 87.86% 3639 $364,766 $671,169 45 323.69% 142 $402,307 $740,245 43 170.55% 7
6 $4,340,960 $7,987,366 8 136.37% 1237 $713,599 $1,313,022 36 105.48% 30
2 $10,985,481 $20,213,285 2 93.76% 3315 $2,206,325 $4,059,638 14 141.98% 1051 $318,764 $586,526 48 36.76% 50
8 $4,600,475 $8,464,874 7 120.34% 2029 $1,560,103 $2,870,590 24 42.57% 4826 $1,417,393 $2,608,003 27 83.69% 38
5 $5,506,931 $10,132,753 4 83.46% 3943 $454,062 $835,474 42 105.50% 2927 $1,158,595 $2,131,815 30 173.79% 649 $292,102 $537,468 50 81.72% 4022 $1,577,915 $2,903,364 23 118.98% 23
3 $7,442,159 $13,693,573 3 158.81% 835 $702,162 $1,291,978 37 124.68% 1748 $267,530 $492,255 51 122.55% 1811 $2,414,130 $4,441,999 11 132.80% 1412 $2,206,231 $4,059,465 15 111.94% 2734 $957,707 $1,762,181 32 44.52% 4614 $2,305,552 $4,242,216 12 105.35% 3150 $362,182 $666,415 46 35.70% 51

68 |
TABLE 1.5
Total Expenditures for Public Elementary and Secondary Education, by Function and State2003-2004
(1) Includes expendi-tures for property and for building and altera-tions completed by school district staff of contrac-tors. (2) Includes expenditures for health, attendance, and speech pathology services.
(3) Includes expenditures for curriculum devel-opment, staff training, libraries, and media and computer centers.
(4) Includes expenditures for operations funded by sales of products or servic-es (e.g., school bookstore or computer time). Note: Excludes expenditures for state education agencies. Detail may not sum due to rounding. Source: U.S. Department of Education, National Center for Education Statistics, Common Core of Data Survey (this table was prepared August 2005).
Current TOTAL Expenditures for Student Instructional EXPENDITURES Public Schools Instruction Total Support(2) Staff(3)
United States $454,905,783 $387,592,494 $237,731,734 $134,021,897 $19,992,229 $18,568,413 Alabama $5,305,144 $4,657,643 $2,818,526 $1,521,337 $222,291 $190,115 Alaska $1,609,420 $1,326,226 $771,237 $510,329 $65,340 $84,263 Arizona $7,050,421 $5,891,105 $3,530,858 $2,082,411 $307,957 $149,316 Arkansas $3,304,710 $2,923,402 $1,786,323 $990,294 $130,139 $150,834 California $56,542,273 $47,983,402 $29,170,269 $17,017,791 $2,156,449 $3,129,644 Colorado $6,704,415 $5,551,506 $3,180,392 $2,180,040 $243,697 $269,246 Connecticut $7,334,520 $6,302,988 $4,019,659 $2,058,828 $348,879 $217,895 Delaware $1,342,095 $1,127,746 $693,970 $381,184 $53,596 $15,143 DC $1,114,681 $902,318 $473,414 $406,079 $82,796 $91,583 Florida $20,161,939 $16,355,123 $9,616,720 $5,938,232 $830,144 $1,002,208 Georgia $13,586,716 $11,630,577 $7,367,694 $3,678,590 $527,125 $624,317 Hawaii $1,657,915 $1,489,092 $888,473 $521,929 $162,114 $88,294 Idaho $1,739,541 $1,511,862 $924,975 $521,688 $85,570 $70,355 Illinois $20,658,276 $17,271,301 $10,320,227 $6,393,248 $1,066,937 $694,007 Indiana $9,688,103 $8,088,684 $4,951,003 $2,807,529 $356,994 $264,105 Iowa $4,203,671 $3,652,022 $2,174,018 $1,210,994 $232,374 $164,490 Kansas $3,910,054 $3,510,675 $2,078,415 $1,269,958 $197,924 $159,818 Kentucky $4,687,217 $4,401,627 $2,686,505 $1,475,797 $177,949 $217,296 Louisiana $5,630,084 $5,056,583 $3,069,994 $1,673,753 $214,353 $234,756 Maine $2,124,554 $1,909,268 $1,281,073 $566,838 $64,323 $60,128 Maryland $8,734,564 $7,933,055 $4,934,017 $2,636,403 $308,603 $460,560 Massachusetts $11,084,082 $10,281,820 $6,542,762 $3,426,551 $615,326 $491,849 Michigan $19,291,044 $15,674,698 $8,929,871 $6,264,837 $1,070,029 $777,470 Minnesota $8,720,326 $6,867,403 $4,404,702 $2,147,923 $230,704 $374,613 Mississippi $3,156,153 $2,853,531 $1,707,392 $968,645 $123,997 $128,418 Missouri $7,953,797 $6,793,957 $4,142,285 $2,358,352 $333,196 $304,635 Montana $1,220,956 $1,124,291 $690,810 $387,437 $53,843 $43,311 Nebraska $2,678,767 $2,304,223 $1,470,002 $673,441 $96,433 $76,788 Nevada $3,012,227 $2,251,044 $1,408,570 $768,641 $83,396 $94,306 New Hampshire $2,041,865 $1,781,594 $1,156,573 $570,229 $117,778 $53,942 New Jersey $19,168,738 $17,185,967 $10,152,232 $6,504,334 $1,555,186 $583,395 New Mexico $2,734,668 $2,281,608 $1,266,008 $910,138 $231,168 $105,561 New York $39,903,445 $34,546,965 $23,721,563 $9,989,057 $1,112,897 $938,890 North Carolina $10,104,267 $8,766,968 $5,574,861 $2,703,000 $449,437 $307,743 North Dakota $810,960 $716,007 $427,511 $232,465 $28,697 $21,916 Ohio $19,000,331 $15,868,494 $9,110,815 $6,232,340 $944,733 $1,000,770 Oklahoma $4,144,803 $3,804,570 $2,203,126 $1,349,256 $246,657 $122,864 Oregon $4,976,856 $4,150,747 $2,458,746 $1,550,553 $277,037 $162,021 Pennsylvania $19,350,934 $16,344,439 $10,095,432 $5,609,933 $792,337 $608,640 Rhode Island $1,746,150 $1,647,587 $1,064,304 $540,735 $131,530 $68,751 South Carolina $6,028,152 $4,888,250 $2,915,987 $1,711,287 $330,343 $314,023 South Dakota $998,417 $851,429 $498,922 $307,100 $47,231 $43,115 Tennessee $6,499,907 $5,674,773 $3,647,986 $1,748,705 $200,291 $308,643 Texas $36,903,089 $30,399,603 $18,347,986 $10,516,120 $1,477,574 $1,722,541 Utah $2,991,571 $2,366,897 $1,518,242 $714,894 $88,038 $111,885 Vermont $1,110,930 $1,045,213 $671,163 $345,762 $74,200 $37,993 Virginia $10,487,025 $9,208,329 $5,661,333 $3,184,354 $442,175 $576,194 Washington $8,927,605 $7,359,566 $4,381,186 $2,620,468 $513,675 $332,723 West Virginia $2,557,190 $2,349,833 $1,444,689 $774,469 $81,166 $64,886 Wisconsin $9,300,201 $7,934,755 $4,904,809 $2,775,318 $361,288 $412,789 Wyoming $911,017 $791,732 $474,108 $292,306 $46,318 $39,369

| 69
Other InterestGeneral School Operations & Student Support Food Enterprise Capital on School
Administration Administration Maintenance Transportation Services Services Operations(4) Outlay(1) Debt
$7,960,378 $21,791,580 $36,830,517 $15,647,698 $13,231,082 $14,930,942 $907,921 $48,940,374 $11,499,160$126,954 $285,766 $407,103 $199,518 $89,592 $317,780 $0 $434,524 $106,315
$21,054 $75,782 $169,586 $52,234 $42,070 $38,347 $6,314 $247,579 $24,565$96,222 $293,770 $650,118 $200,114 $384,914 $277,836 $0 $851,646 $265,562$94,900 $164,478 $271,264 $103,594 $75,085 $146,727 $58 $287,627 $69,884
$433,897 $3,271,306 $4,573,190 $1,151,267 $2,302,037 $1,727,583 $67,759 $6,988,779 $559,547$79,469 $377,689 $514,055 $165,272 $530,612 $171,400 $19,674 $825,336 $274,499
$130,653 $347,333 $567,680 $295,902 $150,486 $169,241 $55,261 $768,133 $141,313$12,716 $62,829 $106,170 $62,821 $67,910 $52,592 $0 $178,934 $17,569$24,368 $36,059 $100,548 $47,649 $23,076 $22,825 $0 $195,941 $0
$184,552 $984,370 $1,745,187 $682,624 $509,148 $800,171 $0 $2,918,212 $469,897$155,117 $713,453 $852,759 $436,957 $368,861 $573,344 $10,949 $1,712,863 $182,229
$9,395 $96,267 $106,427 $25,319 $34,114 $78,689 $0 $64,161 $54,410$34,710 $86,824 $144,022 $69,454 $30,753 $65,199 $0 $186,889 $35,895
$609,402 $922,117 $1,733,174 $838,707 $528,905 $557,826 $0 $2,728,064 $531,557$146,868 $457,944 $874,645 $449,178 $257,796 $330,153 $0 $840,803 $694,712$102,444 $196,974 $306,030 $112,324 $96,358 $161,315 $105,695 $459,040 $64,330$124,905 $211,301 $349,014 $138,823 $88,173 $162,303 $0 $250,127 $133,191$126,747 $252,366 $370,485 $213,682 $117,272 $239,325 $0 $133,703 $98,079$119,820 $273,046 $464,025 $259,573 $108,181 $312,751 $86 $411,074 $111,876
$43,560 $102,157 $181,045 $82,231 $33,394 $61,358 $0 $148,847 $44,145$71,390 $519,264 $682,697 $390,991 $202,899 $233,590 $129,044 $686,977 $91,688
$188,785 $449,712 $940,246 $430,126 $310,508 $312,507 $0 $272,652 $302,243$353,302 $1,049,255 $1,642,459 $644,387 $727,935 $479,990 $0 $2,565,279 $669,604$178,970 $261,993 $520,771 $372,316 $208,556 $287,329 $27,450 $1,165,500 $357,332
$94,796 $159,968 $285,030 $122,650 $53,786 $177,084 $411 $210,367 $67,539$208,479 $401,895 $663,103 $321,703 $125,342 $293,320 $0 $767,547 $234,034
$35,445 $62,066 $113,591 $49,078 $30,104 $44,464 $1,579 $78,735 $11,863$81,112 $118,332 $194,619 $60,945 $45,212 $90,224 $70,556 $315,737 $54,501$41,179 $154,863 $224,695 $83,437 $86,765 $73,834 $0 $577,105 $168,549$60,911 $100,161 $146,442 $77,928 $13,068 $54,792 $0 $214,861 $39,124
$477,251 $891,817 $1,697,954 $950,926 $347,805 $399,469 $129,932 $1,510,643 $289,021$70,742 $140,369 $220,775 $102,564 $38,960 $104,143 $1,319 $393,838 $36,704
$726,976 $1,430,721 $2,972,871 $1,697,933 $1,108,769 $836,345 $0 $3,176,667 $737,518$170,143 $555,571 $684,718 $316,768 $218,620 $489,108 $0 $1,010,366 $280,854
$34,568 $35,681 $63,604 $32,817 $15,182 $34,039 $21,992 $79,894 $8,834$446,213 $965,122 $1,475,847 $705,157 $694,498 $523,749 $1,591 $2,342,881 $348,594$106,363 $204,830 $421,962 $122,324 $124,257 $208,897 $43,292 $272,056 $52,228
$60,788 $266,887 $342,176 $182,290 $259,355 $140,087 $1,362 $605,585 $186,345$492,695 $723,616 $1,672,166 $806,993 $513,486 $573,134 $65,940 $1,887,169 $743,981
$22,482 $84,760 $129,039 $65,001 $39,173 $42,548 $0 $31,616 $29,288$62,051 $287,430 $436,387 $151,811 $129,242 $243,952 $17,025 $876,292 $191,379$30,069 $43,979 $82,583 $27,710 $32,412 $43,225 $2,182 $122,499 $21,727
$114,908 $301,753 $539,552 $197,764 $85,795 $278,082 $0 $640,826 $142,237$495,247 $1,670,719 $3,223,281 $821,658 $1,105,100 $1,535,497 $0 $4,763,983 $1,462,762
$26,655 $144,324 $218,391 $73,833 $51,768 $126,070 $7,691 $464,864 $88,710$26,839 $71,929 $80,908 $32,980 $20,914 $27,531 $758 $46,598 $15,409
$138,834 $545,011 $907,832 $434,769 $139,539 $360,124 $2,519 $1,069,387 $146,022$168,301 $350,388 $729,430 $284,128 $241,823 $240,634 $117,277 $1,201,292 $323,954
$63,881 $131,937 $242,176 $157,193 $33,231 $130,662 $13 $163,741 $10,537$215,391 $410,334 $706,320 $308,661 $360,537 $254,517 $111 $682,823 $500,324
$17,860 $45,069 $82,368 $33,617 $27,705 $25,234 $83 $110,315 $6,681
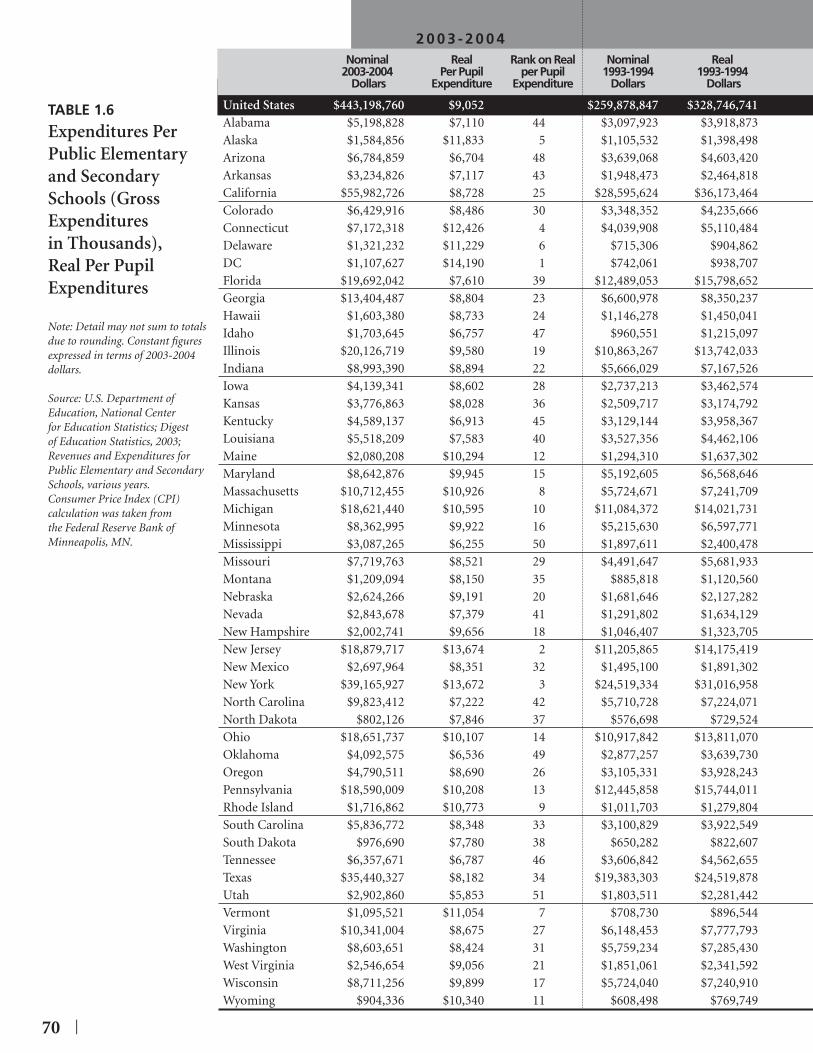
70 |
TABLE 1.6
Expenditures Per Public Elementary and Secondary Schools (Gross Expenditures in Thousands), Real Per Pupil Expenditures
Note: Detail may not sum to totals due to rounding. Constant fi gures expressed in terms of 2003-2004 dollars.
Source: U.S. Department of Education, National Center for Education Statistics; Digest of Education Statistics, 2003; Revenues and Expenditures for Public Elementary and Secondary Schools, various years. Consumer Price Index (CPI) calculation was taken from the Federal Reserve Bank of Minneapolis, MN.
2 0 0 3 - 2 0 0 4 Nominal Real Rank on Real Nominal Real 2003-2004 Per Pupil per Pupil 1993-1994 1993-1994 Dollars Expenditure Expenditure Dollars Dollars
United States $443,198,760 $9,052 $259,878,847 $328,746,741 Alabama $5,198,828 $7,110 44 $3,097,923 $3,918,873 Alaska $1,584,856 $11,833 5 $1,105,532 $1,398,498 Arizona $6,784,859 $6,704 48 $3,639,068 $4,603,420 Arkansas $3,234,826 $7,117 43 $1,948,473 $2,464,818 California $55,982,726 $8,728 25 $28,595,624 $36,173,464 Colorado $6,429,916 $8,486 30 $3,348,352 $4,235,666 Connecticut $7,172,318 $12,426 4 $4,039,908 $5,110,484 Delaware $1,321,232 $11,229 6 $715,306 $904,862 DC $1,107,627 $14,190 1 $742,061 $938,707 Florida $19,692,042 $7,610 39 $12,489,053 $15,798,652 Georgia $13,404,487 $8,804 23 $6,600,978 $8,350,237 Hawaii $1,603,380 $8,733 24 $1,146,278 $1,450,041 Idaho $1,703,645 $6,757 47 $960,551 $1,215,097 Illinois $20,126,719 $9,580 19 $10,863,267 $13,742,033 Indiana $8,993,390 $8,894 22 $5,666,029 $7,167,526 Iowa $4,139,341 $8,602 28 $2,737,213 $3,462,574 Kansas $3,776,863 $8,028 36 $2,509,717 $3,174,792 Kentucky $4,589,137 $6,913 45 $3,129,144 $3,958,367 Louisiana $5,518,209 $7,583 40 $3,527,356 $4,462,106 Maine $2,080,208 $10,294 12 $1,294,310 $1,637,302 Maryland $8,642,876 $9,945 15 $5,192,605 $6,568,646 Massachusetts $10,712,455 $10,926 8 $5,724,671 $7,241,709 Michigan $18,621,440 $10,595 10 $11,084,372 $14,021,731 Minnesota $8,362,995 $9,922 16 $5,215,630 $6,597,771 Mississippi $3,087,265 $6,255 50 $1,897,611 $2,400,478 Missouri $7,719,763 $8,521 29 $4,491,647 $5,681,933 Montana $1,209,094 $8,150 35 $885,818 $1,120,560 Nebraska $2,624,266 $9,191 20 $1,681,646 $2,127,282 Nevada $2,843,678 $7,379 41 $1,291,802 $1,634,129 New Hampshire $2,002,741 $9,656 18 $1,046,407 $1,323,705 New Jersey $18,879,717 $13,674 2 $11,205,865 $14,175,419 New Mexico $2,697,964 $8,351 32 $1,495,100 $1,891,302 New York $39,165,927 $13,672 3 $24,519,334 $31,016,958 North Carolina $9,823,412 $7,222 42 $5,710,728 $7,224,071 North Dakota $802,126 $7,846 37 $576,698 $729,524 Ohio $18,651,737 $10,107 14 $10,917,842 $13,811,070 Oklahoma $4,092,575 $6,536 49 $2,877,257 $3,639,730 Oregon $4,790,511 $8,690 26 $3,105,331 $3,928,243 Pennsylvania $18,590,009 $10,208 13 $12,445,858 $15,744,011 Rhode Island $1,716,862 $10,773 9 $1,011,703 $1,279,804 South Carolina $5,836,772 $8,348 33 $3,100,829 $3,922,549 South Dakota $976,690 $7,780 38 $650,282 $822,607 Tennessee $6,357,671 $6,787 46 $3,606,842 $4,562,655 Texas $35,440,327 $8,182 34 $19,383,303 $24,519,878 Utah $2,902,860 $5,853 51 $1,803,511 $2,281,442 Vermont $1,095,521 $11,054 7 $708,730 $896,544 Virginia $10,341,004 $8,675 27 $6,148,453 $7,777,793 Washington $8,603,651 $8,424 31 $5,759,234 $7,285,430 West Virginia $2,546,654 $9,056 21 $1,851,061 $2,341,592 Wisconsin $8,711,256 $9,899 17 $5,724,040 $7,240,910 Wyoming $904,336 $10,340 11 $608,498 $769,749

| 71
1 9 9 3 - 1 9 9 4 1 9 8 3 - 1 9 8 4Real Rank on Real Nominal Real Real Rank on Real
Per Pupil per Pupil 1983-1984 1983-1984 Per Pupil per PupilExpenditure Expenditure Dollars 1984 Dollars Expenditure Expenditure
$7,593 $108,274,697 $199,225,443 $5,103 $5,358 47 $1,486,521 $2,735,199 $3,810 42
$11,148 4 $625,818 $1,151,505 $11,789 1$6,514 37 $1,242,928 $2,286,988 $4,538 35$5,570 46 $801,194 $1,474,197 $3,430 51$6,817 33 $11,050,354 $20,332,651 $5,000 26$6,803 34 $1,605,885 $2,954,828 $5,479 19
$10,338 5 $1,711,013 $3,148,264 $6,628 6$8,607 11 $294,222 $541,369 $5,955 9
$11,681 2 $340,027 $625,650 $7,081 3$7,772 17 $3,747,760 $6,895,878 $4,636 32$6,786 35 $2,123,586 $3,907,398 $3,739 44$8,069 15 $484,858 $892,139 $5,529 15$5,152 49 $398,996 $734,153 $3,577 45$7,288 26 $5,108,290 $9,399,254 $5,099 24$7,452 25 $2,239,069 $4,119,887 $4,208 40$6,973 28 $1,474,443 $2,712,975 $5,485 18$6,965 29 $1,131,758 $2,082,435 $5,167 23$6,065 41 $1,233,797 $2,270,187 $3,526 49$5,596 45 $1,908,595 $3,511,815 $4,413 37$7,575 21 $484,744 $891,929 $4,275 39$8,535 12 $2,118,972 $3,898,909 $5,735 13$8,283 13 $2,792,653 $5,138,482 $5,879 10$8,802 8 $5,351,620 $9,846,981 $6,052 8$8,175 14 $2,075,572 $3,819,053 $5,445 21$4,764 51 $896,764 $1,650,046 $3,547 47$6,584 36 $1,772,111 $3,260,684 $4,121 41$6,901 31 $456,519 $839,995 $5,497 17$7,491 22 $759,197 $1,396,923 $5,260 22$6,958 30 $364,766 $671,169 $4,486 36$7,170 27 $402,307 $740,245 $4,680 30
$12,361 1 $4,340,960 $7,987,366 $6,996 4$5,892 43 $713,599 $1,313,022 $4,895 27
$11,391 3 $10,985,481 $20,213,285 $7,598 2$6,400 38 $2,206,325 $4,059,638 $3,746 43$6,148 39 $318,764 $586,526 $5,031 25$7,672 18 $4,600,475 $8,464,874 $4,658 31$6,049 42 $1,560,103 $2,870,590 $4,880 28$7,634 20 $1,417,393 $2,608,003 $5,865 11$9,063 6 $5,506,931 $10,132,753 $5,862 12$8,820 7 $454,062 $835,474 $6,158 7$6,118 40 $1,158,595 $2,131,815 $3,545 48$5,782 44 $292,102 $537,468 $4,391 38$5,286 48 $1,577,915 $2,903,364 $3,551 46$6,822 32 $7,442,159 $13,693,573 $4,605 34$4,859 50 $702,162 $1,291,978 $3,435 50$8,760 9 $267,530 $492,255 $5,474 20$7,469 24 $2,414,130 $4,441,999 $4,623 33$7,985 16 $2,206,231 $4,059,465 $5,544 14$7,478 23 $957,707 $1,762,181 $4,772 29$8,613 10 $2,305,552 $4,242,216 $5,506 16$7,659 19 $362,182 $666,415 $6,751 5

72 |
2003-2004 Rank 1993-1994 Rank 1983-1984 Rank United States $9,052 $7,593 $5,103 District of Columbia $14,190 1 $11,681 2 $7,081 3New Jersey $13,674 2 $12,361 1 $6,996 4New York $13,672 3 $11,391 3 $7,598 2Connecticut $12,426 4 $10,338 5 $6,628 6Alaska $11,833 5 $11,148 4 $11,789 1Delaware $11,229 6 $8,607 11 $5,955 9Vermont $11,054 7 $8,760 9 $5,474 20Massachusetts $10,926 8 $8,283 13 $5,879 10Rhode Island $10,773 9 $8,820 7 $6,158 7Michigan $10,595 10 $8,802 8 $6,052 8Wyoming $10,340 11 $7,659 19 $6,751 5Maine $10,294 12 $7,575 21 $4,275 39Pennsylvania $10,208 13 $9,063 6 $5,862 12Ohio $10,107 14 $7,672 18 $4,658 31Maryland $9,945 15 $8,535 12 $5,735 13Minnesota $9,922 16 $8,175 14 $5,445 21Wisconsin $9,899 17 $8,613 10 $5,506 16New Hampshire $9,656 18 $7,170 27 $4,680 30Illinois $9,580 19 $7,288 26 $5,099 24Nebraska $9,191 20 $7,491 22 $5,260 22West Virginia $9,056 21 $7,478 23 $4,772 29Indiana $8,894 22 $7,452 25 $4,208 40Georgia $8,804 23 $6,786 35 $3,739 44Hawaii $8,733 24 $8,069 15 $5,529 15California $8,728 25 $6,817 33 $5,000 26Oregon $8,690 26 $7,634 20 $5,865 11Virginia $8,675 27 $7,469 24 $4,623 33Iowa $8,602 28 $6,973 28 $5,485 18Missouri $8,521 29 $6,584 36 $4,121 41Colorado $8,486 30 $6,803 34 $5,479 19Washington $8,424 31 $7,985 16 $5,544 14New Mexico $8,351 32 $5,892 43 $4,895 27South Carolina $8,348 33 $6,118 40 $3,545 48Texas $8,182 34 $6,822 32 $4,605 34Montana $8,150 35 $6,901 31 $5,497 17Kansas $8,028 36 $6,965 29 $5,167 23North Dakota $7,846 37 $6,148 39 $5,031 25South Dakota $7,780 38 $5,782 44 $4,391 38Florida $7,610 39 $7,772 17 $4,636 32Louisiana $7,583 40 $5,596 45 $4,413 37Nevada $7,379 41 $6,958 30 $4,486 36North Carolina $7,222 42 $6,400 38 $3,746 43Arkansas $7,117 43 $5,570 46 $3,430 51Alabama $7,110 44 $5,358 47 $3,810 42Kentucky $6,913 45 $6,065 41 $3,526 49Tennessee $6,787 46 $5,286 48 $3,551 46Idaho $6,757 47 $5,152 49 $3,577 45Arizona $6,704 48 $6,514 37 $4,538 35Oklahoma $6,536 49 $6,049 42 $4,880 28Mississippi $6,255 50 $4,764 51 $3,547 47Utah $5,853 51 $4,859 50 $3,435 50
TABLE 1.7
Expenditures per Pupil Ranked by 2003-2004
Source: Author’s Tabulations based on Table 1.6

| 73
1983-1984 to 1993-1994 to 1983-1984 to 2003-2004 2003-2004 1993-1994 Percent Change Rank Percent Change Rank Percent Change Rank
United States 77.37% 19.20% 48.80% Maine 140.77% 1 35.89% 3 77.18% 2Georgia 135.49% 2 29.72% 15 81.53% 1South Carolina 135.45% 3 36.45% 2 72.56% 5Ohio 117.00% 4 31.74% 10 64.72% 10Indiana 111.37% 5 19.36% 34 77.09% 3Arkansas 107.49% 6 27.77% 19 62.38% 11Missouri 106.75% 7 29.42% 16 59.75% 14New Hampshire 106.31% 8 34.68% 6 53.19% 20Vermont 101.95% 9 26.20% 21 60.02% 13District of Columbia 100.41% 10 21.48% 26 64.98% 9Kentucky 96.07% 11 13.98% 40 72.02% 6New Jersey 95.44% 12 10.62% 44 76.68% 4North Carolina 92.79% 13 12.84% 42 70.85% 7Tennessee 91.14% 14 28.40% 17 48.86% 23West Virginia 89.76% 15 21.11% 28 56.69% 15Idaho 88.90% 16 31.15% 13 44.03% 30Delaware 88.56% 17 30.46% 14 44.54% 28Illinois 87.87% 18 31.45% 11 42.92% 33Virginia 87.65% 19 16.14% 37 61.57% 12Connecticut 87.48% 20 20.20% 31 55.98% 17Alabama 86.63% 21 32.70% 8 40.65% 37Massachusetts 85.86% 22 31.91% 9 40.90% 36Minnesota 82.24% 23 21.37% 27 50.15% 21New York 79.94% 24 20.03% 32 49.92% 22Wisconsin 79.78% 25 14.93% 39 56.43% 16Texas 77.67% 26 19.92% 33 48.15% 25South Dakota 77.17% 27 34.55% 7 31.68% 41Mississippi 76.36% 28 31.31% 12 34.31% 40Michigan 75.07% 29 20.37% 30 45.44% 27Rhode Island 74.94% 30 22.14% 25 43.23% 32Nebraska 74.71% 31 22.69% 24 42.41% 34California 74.58% 32 28.04% 18 36.36% 38Pennsylvania 74.14% 33 12.63% 43 54.60% 19Maryland 73.39% 34 16.51% 36 48.82% 24Louisiana 71.85% 35 35.51% 4 26.81% 44New Mexico 70.62% 36 41.75% 1 20.36% 49Utah 70.41% 37 20.45% 29 41.48% 35Nevada 64.49% 38 6.05% 48 55.11% 18Florida 64.15% 39 -2.09% 51 67.65% 8Hawaii 57.95% 40 8.22% 45 45.95% 26Iowa 56.82% 41 23.35% 23 27.13% 43North Dakota 55.95% 42 27.62% 20 22.20% 48Kansas 55.36% 43 15.25% 38 34.80% 39Colorado 54.88% 44 24.74% 22 24.16% 46Wyoming 53.17% 45 35.00% 5 13.46% 50Washington 51.95% 46 5.49% 49 44.04% 29Montana 48.27% 47 18.09% 35 25.55% 45Oregon 48.17% 48 13.83% 41 30.17% 42Arizona 47.72% 49 2.91% 50 43.54% 31Oklahoma 33.92% 50 8.05% 46 23.95% 47Alaska 0.37% 51 6.15% 47 -5.44% 51
TABLE 1.8
Percent Change in Constant Expenditures per Pupil, Ranked by Percent Change 1983-1984 to 2003-2004
Source: Author’s Tabulations based on Table 1.6
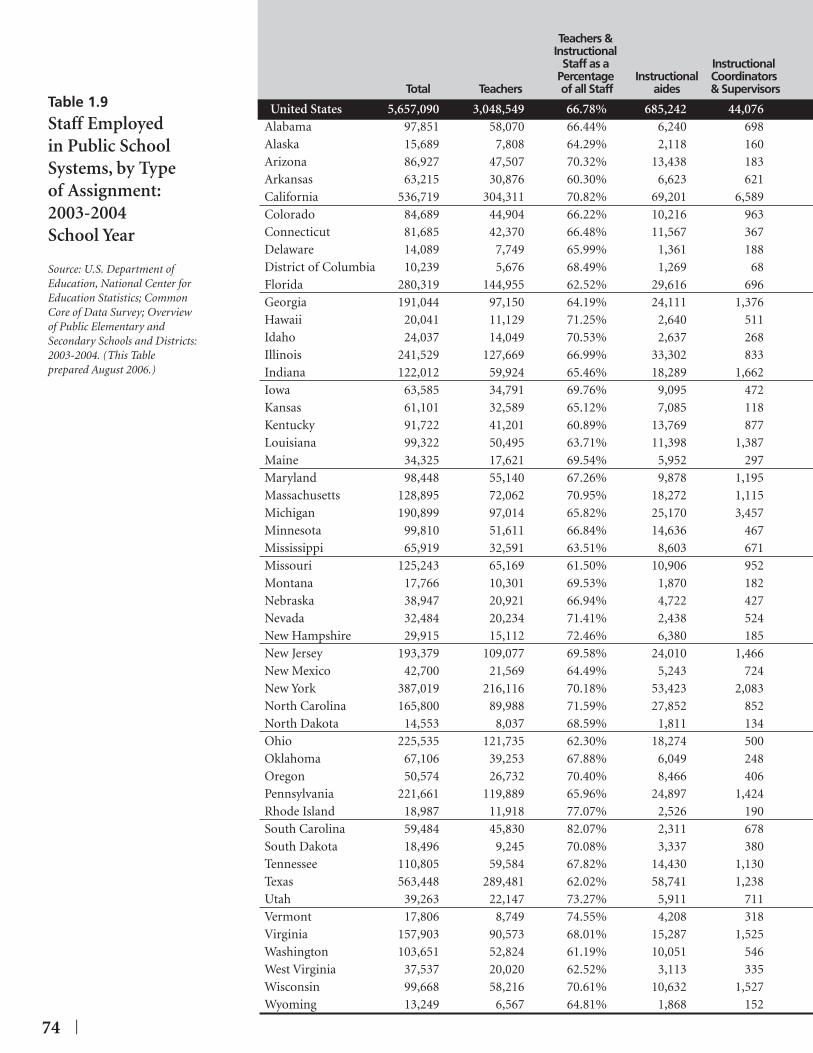
74 |
Teachers & Instructional Staff as a Instructional Percentage Instructional Coordinators Total Teachers of all Staff aides & Supervisors
United States 5,657,090 3,048,549 66.78% 685,242 44,076 Alabama 97,851 58,070 66.44% 6,240 698 Alaska 15,689 7,808 64.29% 2,118 160 Arizona 86,927 47,507 70.32% 13,438 183 Arkansas 63,215 30,876 60.30% 6,623 621 California 536,719 304,311 70.82% 69,201 6,589 Colorado 84,689 44,904 66.22% 10,216 963 Connecticut 81,685 42,370 66.48% 11,567 367 Delaware 14,089 7,749 65.99% 1,361 188 District of Columbia 10,239 5,676 68.49% 1,269 68 Florida 280,319 144,955 62.52% 29,616 696 Georgia 191,044 97,150 64.19% 24,111 1,376 Hawaii 20,041 11,129 71.25% 2,640 511 Idaho 24,037 14,049 70.53% 2,637 268 Illinois 241,529 127,669 66.99% 33,302 833 Indiana 122,012 59,924 65.46% 18,289 1,662 Iowa 63,585 34,791 69.76% 9,095 472 Kansas 61,101 32,589 65.12% 7,085 118 Kentucky 91,722 41,201 60.89% 13,769 877 Louisiana 99,322 50,495 63.71% 11,398 1,387 Maine 34,325 17,621 69.54% 5,952 297 Maryland 98,448 55,140 67.26% 9,878 1,195 Massachusetts 128,895 72,062 70.95% 18,272 1,115 Michigan 190,899 97,014 65.82% 25,170 3,457 Minnesota 99,810 51,611 66.84% 14,636 467 Mississippi 65,919 32,591 63.51% 8,603 671 Missouri 125,243 65,169 61.50% 10,906 952 Montana 17,766 10,301 69.53% 1,870 182 Nebraska 38,947 20,921 66.94% 4,722 427 Nevada 32,484 20,234 71.41% 2,438 524 New Hampshire 29,915 15,112 72.46% 6,380 185 New Jersey 193,379 109,077 69.58% 24,010 1,466 New Mexico 42,700 21,569 64.49% 5,243 724 New York 387,019 216,116 70.18% 53,423 2,083 North Carolina 165,800 89,988 71.59% 27,852 852 North Dakota 14,553 8,037 68.59% 1,811 134 Ohio 225,535 121,735 62.30% 18,274 500 Oklahoma 67,106 39,253 67.88% 6,049 248 Oregon 50,574 26,732 70.40% 8,466 406 Pennsylvania 221,661 119,889 65.96% 24,897 1,424 Rhode Island 18,987 11,918 77.07% 2,526 190 South Carolina 59,484 45,830 82.07% 2,311 678 South Dakota 18,496 9,245 70.08% 3,337 380 Tennessee 110,805 59,584 67.82% 14,430 1,130 Texas 563,448 289,481 62.02% 58,741 1,238 Utah 39,263 22,147 73.27% 5,911 711 Vermont 17,806 8,749 74.55% 4,208 318 Virginia 157,903 90,573 68.01% 15,287 1,525 Washington 103,651 52,824 61.19% 10,051 546 West Virginia 37,537 20,020 62.52% 3,113 335 Wisconsin 99,668 58,216 70.61% 10,632 1,527 Wyoming 13,249 6,567 64.81% 1,868 152
Table 1.9
Staff Employed in Public School Systems, by Type of Assignment: 2003-2004 School Year
Source: U.S. Department of Education, National Center for Education Statistics; Common Core of Data Survey; Overview of Public Elementary and Secondary Schools and Districts: 2003-2004. (This Table prepared August 2006.)

| 75
Guidance Student School School District Administrative OtherCounselors Librarians Support Staff Administrators Administrators Support staff Support Staff
99,395 54,351 188,938 165,531 63,561 178,737 1,128,710 1,682 1,388 1,479 3,452 1,345 1,276 22,221
274 152 459 675 413 669 2,961 1,292 802 7,610 2,240 424 520 12,911 1,218 934 3,284 1,552 682 1,797 15,628 6,640 1,218 15,076 13,340 2,766 23,273 94,305 1,371 845 3,399 2,382 974 2,505 17,130 1,327 789 4,422 2,193 1,333 1,771 15,546
262 129 605 370 288 327 2,810 60 40 1,950 408 96 76 596
5,772 2,710 11,410 6,946 1,819 15,035 61,360 3,338 2,170 5,888 5,063 1,913 2,483 47,552
648 290 1,296 504 188 306 2,529 575 170 531 726 116 541 4,424
3,049 2,200 8,631 6,422 4,061 7,286 48,076 1,804 1,004 2,050 2,985 1,080 623 32,591 1,180 589 2,500 2,111 928 723 11,196 1,118 923 2,879 1,709 1,239 916 12,525 1,471 1,147 1,583 2,527 1,011 5,349 22,787 3,155 1,233 3,324 2,694 330 2,728 22,578
627 251 1,423 967 625 843 5,719 2,241 1,118 3,060 3,149 836 1,102 20,729 2,118 946 7,019 3,666 1,751 4,435 17,511 2,708 1,405 8,325 4,937 3,304 1,241 43,338 1,064 942 6,274 2,190 1,030 6,744 14,852 1,009 969 2,863 1,757 986 1,882 14,588 2,608 1,621 4,493 3,044 1,308 8,626 26,516
431 357 67 504 145 514 3,395 757 557 1,122 998 574 845 8,024 719 324 842 1,079 263 970 5,091 772 296 621 537 538 643 4,831
3,673 1,871 11,472 4,917 1,832 7,434 27,627 769 298 2,012 995 858 1,733 8,499
6,440 3,318 10,222 7,823 2,844 26,934 57,816 3,444 2,335 5,197 4,777 1,609 3,359 26,387
278 198 469 395 436 160 2,635 3,694 1,669 3,722 6,499 6,214 11,970 51,258 1,495 996 2,293 1,932 710 1,664 12,466 1,114 461 1,621 1,539 613 1,704 7,918 4,344 2,217 11,071 4,630 1,667 6,270 45,252
380 215 543 557 164 461 2,033 1,699 1,135 1,520 3,224 299 2,425 363
328 146 1,146 402 445 331 2,736 1,918 1,545 4,154 5,080 1,239 2,756 18,969 9,937 4,864 5,312 29,621 7,833 3,446 152,975
683 279 289 1,012 156 974 7,101 426 226 756 441 147 385 2,150
2,564 1,986 3,054 3,924 1,556 3,964 33,470 1,955 1,309 2,828 2,747 915 1,791 28,685
660 386 1,645 1,044 421 1,735 8,178 1,910 1,247 4,655 2,512 932 2,827 15,210
394 131 472 333 305 365 2,662

76 |
2003-2004 1998-1999 Constant Current Constant Dollars Rank Dollars Dollars Rank
United States $44,133 $40,354 45,599 Alabama $38,325 43 $36,740 41,516 34 Alaska $51,736 11 $48,085 54,336 8 Arizona $41,843 28 $45,785 51,737 11 Arkansas $39,314 38 $32,879 37,153 46 California $56,444 3 $46,593 52,650 10 Colorado $43,319 22 $39,421 44,546 26 Connecticut $57,337 1 $53,429 60,375 3 Delaware $49,366 13 $44,916 50,755 13 District of Columbia $57,009 2 $42,974 48,561 17 Florida $40,604 31 $37,048 41,864 32 Georgia $45,988 16 $41,591 46,998 20 Hawaii $45,479 18 $41,547 46,948 21 Idaho $41,080 30 $35,643 40,277 40 Illinois $54,230 7 $47,312 53,463 9 Indiana $45,791 17 $42,501 48,026 18 Iowa $39,432 37 $36,209 40,916 38 Kansas $38,623 40 $39,690 44,850 25 Kentucky $40,240 34 $37,251 42,094 30 Louisiana $37,918 46 $33,943 38,356 44 Maine $39,864 35 $36,125 40,821 39 Maryland $50,261 12 $44,873 50,707 14 Massachusetts $53,181 8 $56,829 64,217 1 Michigan $54,412 6 $48,207 54,474 7 Minnesota $45,375 20 $40,707 45,999 23 Mississippi $35,684 48 $30,743 34,740 48 Missouri $38,006 45 $36,512 41,259 36 Montana $37,184 47 $30,034 33,938 49 Nebraska $38,352 42 $36,571 41,325 35 Nevada $42,254 26 $41,007 46,338 22 New Hampshire $42,689 25 $45,187 51,061 12 New Jersey $55,592 4 $54,342 61,407 2 New Mexico $38,067 44 $33,714 38,097 45 New York $55,181 5 $50,300 56,839 5 North Carolina $43,211 23 $37,279 42,125 29 North Dakota $35,441 49 $29,215 33,013 51 Ohio $47,482 15 $41,986 47,444 19 Oklahoma $35,061 50 $32,783 37,045 47 Oregon $49,169 14 $43,142 48,751 16 Pennsylvania $51,835 10 $49,566 56,010 6 Rhode Island $52,261 9 $51,689 58,409 4 South Carolina $41,162 29 $36,217 40,925 37 South Dakota $33,236 51 $29,387 33,207 50 Tennessee $40,318 33 $37,491 42,365 28 Texas $40,476 32 $36,999 41,809 33 Utah $38,976 39 $33,982 38,400 43 Vermont $42,007 27 $37,081 41,902 31 Virginia $43,655 21 $38,265 43,239 27 Washington $45,434 19 $40,596 45,874 24 West Virginia $38,461 41 $35,451 40,060 41 Wisconsin $42,882 24 $43,507 49,163 15 Wyoming $39,532 36 $34,683 39,192 42
TABLE 1.10A
Average Annual Salary of Teachers in Public Elementary and Secondary Schools
Note: Constant fi gures expressed in terms of 2003-2004 dollars. Consumer Price Index (CPI) calculation was taken from the Federal Reserve Bank of Minneapolis, MN.
Source: U.S. Department of Education, National Center for Education Statistics; Digest of Education Statistics; Common Core of Data various years.

| 77
1993-1994 1983-1984 Current Constant Current Constant Dollars Dollars Rank Dollars Dollars Rank
$34,145 43,194 $24,244 $44,608 $28,659 36,254 41 $22,742 $41,845 27$47,902 60,596 2 $38,815 $71,419 1$31,825 40,259 27 $24,280 $44,675 25$28,312 35,815 42 $19,519 $35,914 48$40,636 51,405 8 $29,130 $53,599 6$33,826 42,790 24 $25,892 $47,641 16$50,389 63,742 1 $26,610 $48,962 13$37,469 47,398 14 $24,624 $45,308 21$43,014 54,413 6 $33,211 $61,108 2$31,944 40,409 26 $22,250 $40,940 32$29,214 36,956 40 $23,460 $43,166 51$36,569 46,260 17 $25,845 $47,554 18$27,756 35,111 46 $20,969 $38,582 39$39,416 49,861 10 $26,897 $49,490 10$35,741 45,212 21 $24,325 $44,758 24$30,760 38,911 32 $21,690 $39,909 35$31,700 40,101 28 $22,644 $41,664 28$31,639 40,023 29 $20,948 $38,544 40$26,243 33,197 48 $20,303 $37,357 45$30,996 39,210 30 $19,583 $36,032 47$39,475 49,936 9 $26,800 $49,312 11$38,960 49,284 12 $26,758 $49,234 12$45,218 57,201 5 $30,607 $56,316 3$36,146 45,725 18 $27,360 $50,342 7$25,153 31,819 51 $18,472 $33,988 49$30,324 38,360 36 $21,945 $40,378 33$28,200 35,673 43 $22,482 $41,366 30$29,564 37,399 38 $20,393 $37,523 44$37,181 47,034 15 $25,610 $47,122 20$34,121 43,163 23 $20,263 $37,283 46$45,582 57,661 4 $27,170 $49,992 9$27,922 35,321 45 $21,817 $40,143 34$45,772 57,902 3 $30,490 $56,101 4$29,727 37,605 37 $22,340 $41,105 31$25,506 32,265 49 $20,816 $38,301 41$35,912 45,429 19 $24,518 $45,113 22$27,612 34,929 47 $21,419 $39,410 37$37,589 47,550 13 $25,660 $47,214 19$42,411 53,650 7 $25,853 $47,569 17$39,261 49,665 11 $29,470 $54,224 5$29,414 37,209 39 $21,595 $39,734 36$25,259 31,953 50 $18,095 $33,294 50$30,514 38,600 35 $21,384 $39,346 38$30,519 38,607 34 $24,463 $45,011 23$28,056 35,491 44 $22,603 $41,589 29$34,517 43,664 22 $20,796 $38,264 42$33,472 42,342 25 $23,095 $42,494 26$35,860 45,363 20 $26,209 $48,224 15$30,549 38,645 33 $20,627 $37,953 43$36,644 46,355 16 $26,347 $48,478 14$30,954 39,157 31 $27,224 $50,092 8
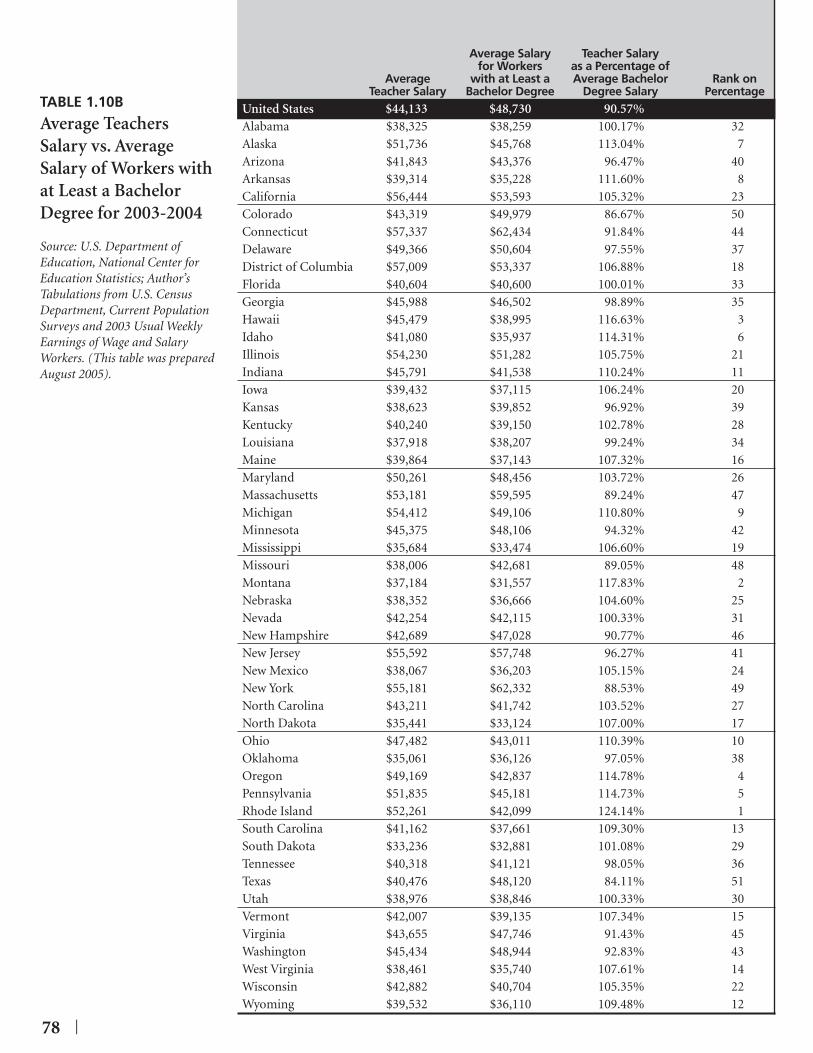
78 |
Average Salary Teacher Salary for Workers as a Percentage of Average with at Least a Average Bachelor Rank on Teacher Salary Bachelor Degree Degree Salary PercentageUnited States $44,133 $48,730 90.57% Alabama $38,325 $38,259 100.17% 32Alaska $51,736 $45,768 113.04% 7Arizona $41,843 $43,376 96.47% 40Arkansas $39,314 $35,228 111.60% 8California $56,444 $53,593 105.32% 23Colorado $43,319 $49,979 86.67% 50Connecticut $57,337 $62,434 91.84% 44Delaware $49,366 $50,604 97.55% 37District of Columbia $57,009 $53,337 106.88% 18Florida $40,604 $40,600 100.01% 33Georgia $45,988 $46,502 98.89% 35Hawaii $45,479 $38,995 116.63% 3Idaho $41,080 $35,937 114.31% 6Illinois $54,230 $51,282 105.75% 21Indiana $45,791 $41,538 110.24% 11Iowa $39,432 $37,115 106.24% 20Kansas $38,623 $39,852 96.92% 39Kentucky $40,240 $39,150 102.78% 28Louisiana $37,918 $38,207 99.24% 34Maine $39,864 $37,143 107.32% 16Maryland $50,261 $48,456 103.72% 26Massachusetts $53,181 $59,595 89.24% 47Michigan $54,412 $49,106 110.80% 9Minnesota $45,375 $48,106 94.32% 42Mississippi $35,684 $33,474 106.60% 19Missouri $38,006 $42,681 89.05% 48Montana $37,184 $31,557 117.83% 2Nebraska $38,352 $36,666 104.60% 25Nevada $42,254 $42,115 100.33% 31New Hampshire $42,689 $47,028 90.77% 46New Jersey $55,592 $57,748 96.27% 41New Mexico $38,067 $36,203 105.15% 24New York $55,181 $62,332 88.53% 49North Carolina $43,211 $41,742 103.52% 27North Dakota $35,441 $33,124 107.00% 17Ohio $47,482 $43,011 110.39% 10Oklahoma $35,061 $36,126 97.05% 38Oregon $49,169 $42,837 114.78% 4Pennsylvania $51,835 $45,181 114.73% 5Rhode Island $52,261 $42,099 124.14% 1South Carolina $41,162 $37,661 109.30% 13South Dakota $33,236 $32,881 101.08% 29Tennessee $40,318 $41,121 98.05% 36Texas $40,476 $48,120 84.11% 51Utah $38,976 $38,846 100.33% 30Vermont $42,007 $39,135 107.34% 15Virginia $43,655 $47,746 91.43% 45Washington $45,434 $48,944 92.83% 43West Virginia $38,461 $35,740 107.61% 14Wisconsin $42,882 $40,704 105.35% 22Wyoming $39,532 $36,110 109.48% 12
TABLE 1.10B
Average Teachers Salary vs. Average Salary of Workers with at Least a Bachelor Degree for 2003-2004
Source: U.S. Department of Education, National Center for Education Statistics; Author’s Tabulations from U.S. Census Department, Current Population Surveys and 2003 Usual Weekly Earnings of Wage and Salary Workers. (This table was prepared August 2005).

| 79

80 |
TABLE 1.11
Breakdown of Key Federal Funding Programs 2004
Source: 2003 Department of Education Budget and Author’s Tabulations
Safe & Drug-Free Leveraging ESEA Title 1 Schools and Educational Grants Local Special Communities Assistance Educational Education: State Grants Partnership(LEAP) Agencies Grants to States
Unites States $419,211,482 $65,835,120 $11,766,459,129 $9,838,792,665 Alabama 6,520,024 0 187,083,115 160,385,829 Alaska 2,152,629 0 32,502,130 30,463,423 Arizona 7,087,180 550,800 229,883,044 152,382,476 Arkansas 4,075,458 518,132 118,717,368 98,750,311 California 53,257,421 12,582,059 1,765,537,626 1,072,636,899 Colorado 4,833,545 1,118,276 114,690,988 129,058,489 Connecticut 4,370,215 421,324 109,085,188 117,261,220 Delaware 2,152,629 218,484 32,224,550 27,919,643 District of Columbia 2,152,629 596,506 49,372,197 14,038,079 Florida 21,001,765 2,563,089 574,724,044 551,219,391 Georgia 12,078,813 561,842 381,940,842 267,886,185 Hawaii 2,152,629 132,942 43,294,081 35,212,155 Idaho 2,152,629 186,938 41,592,528 47,389,266 Illinois 17,592,102 0 523,252,496 446,657,600 Indiana 7,493,100 1,637,759 167,431,217 225,536,784 Iowa 3,419,873 347,840 64,684,556 107,669,127 Kansas 3,540,027 907,468 81,995,496 94,250,141 Kentucky 6,189,604 1,000,191 171,223,958 137,696,944 Louisiana 8,418,619 460,654 267,600,823 163,814,859 Maine 2,152,629 293,527 45,160,071 48,258,251 Maryland 6,640,134 590,093 163,738,534 176,589,690 Massachusetts 8,150,261 1,040,274 234,039,373 250,351,438 Michigan 16,256,834 1,337,330 416,586,723 353,312,585 Minnesota 5,924,916 1,583,740 105,427,756 167,415,417 Mississippi 5,309,785 273,855 160,730,204 104,964,427 Missouri 7,782,325 1,353,822 185,416,533 200,334,359 Montana 2,152,629 225,774 40,527,097 32,188,959 Nebraska 2,152,629 587,152 48,241,936 65,853,607 Nevada 2,512,050 223,367 64,007,130 57,306,394 New Hampshire 2,152,629 285,474 29,264,249 41,853,659 New Jersey 10,449,627 2,147,776 266,434,149 318,780,009 New Mexico 3,458,251 415,726 114,717,327 80,379,393 New York 33,579,917 6,922,300 1,241,954,420 669,505,756 North Carolina 10,236,286 1,778,478 271,256,637 271,197,443 North Dakota 2,152,629 86,672 30,256,568 22,670,415 Ohio 15,812,603 3,246,812 400,077,727 386,053,232 Oklahoma 5,265,968 1,102,786 141,060,011 130,455,767 Oregon 4,205,117 1,051,930 131,497,799 113,747,843 Pennsylvania 17,257,582 3,599,095 432,704,365 376,739,214 Rhode Island 2,152,629 432,189 45,773,293 38,566,846 South Carolina 5,664,453 885,940 165,456,776 154,478,352 South Dakota 2,152,629 0 34,602,344 27,006,362 Tennessee 7,312,194 1,326,028 199,726,870 205,685,894 Texas 34,997,101 4,467,229 1,110,705,516 834,469,609 Utah 2,734,152 608,449 50,780,122 93,688,425 Vermont 2,152,629 205,680 27,919,244 21,858,608 Virginia 8,174,905 1,744,181 195,588,567 246,108,749 Washington 7,126,377 1,858,195 170,679,720 195,225,582 West Virginia 3,130,775 594,778 94,828,058 66,977,974 Wisconsin 7,215,317 1,707,898 160,675,762 183,607,739 Wyoming 2,152,629 54,266 29,788,001 22,931,846

| 81
Percent of As a Percent Revenues from of Federally these four Sourced
Totals Federal Programs Revenues
$22,090,298,396 5.02% 58.88%$353,988,968 6.87% 59.45%
$65,118,182 4.44% 25.04%$389,903,500 5.30% 46.46%$222,061,269 6.80% 58.00%
$2,904,014,005 5.09% 51.58%$249,701,298 3.96% 61.00%$231,137,947 3.26% 62.56%
$62,515,306 5.22% 60.74%$66,159,411 5.94% 43.17%
$1,149,508,289 6.06% 57.50%$662,467,682 4.93% 61.12%
$80,791,807 3.89% 47.42%$91,321,361 5.38% 54.81%
$987,502,198 5.16% 61.00%$402,098,860 5.07% 66.41%$176,121,396 4.15% 55.83%$180,693,132 4.44% 48.77%$316,110,697 6.64% 62.63%$440,294,955 7.93% 60.08%
$95,864,478 4.44% 49.57%$347,558,451 4.00% 59.67%$493,581,346 4.18% 69.92%$787,493,472 4.39% 55.94%$280,351,829 3.36% 56.66%$271,278,271 8.31% 53.95%$394,887,039 5.15% 64.10%
$75,094,459 6.23% 42.99%$116,835,324 4.58% 51.75%$124,048,941 4.45% 63.21%
$73,556,011 3.76% 72.18%$597,811,561 3.16% 74.22%$198,970,697 7.41% 49.44%
$1,951,962,393 5.15% 73.79%$554,468,844 5.91% 61.67%
$55,166,284 6.69% 43.77%$805,190,374 4.44% 69.01%$277,884,532 6.68% 52.57%$250,502,689 5.45% 60.18%$830,300,256 4.43% 57.14%
$86,924,957 4.98% 76.51%$326,485,521 5.70% 57.91%
$63,761,335 6.61% 42.16%$414,050,986 6.77% 67.48%
$1,984,639,455 5.73% 58.07%$147,811,148 5.07% 54.80%
$52,136,161 4.53% 65.15%$451,616,402 4.39% 66.57%$374,889,874 4.31% 48.09%$165,531,585 6.49% 60.91%$353,206,716 3.99% 65.82%
$54,926,742 5.71% 64.97%

82 |
| 83
Measures of Educational Outputs
CHAPTER TWO
ALECAmerican Legislative Exchange Council
84 |
Over the past decade, many states have been placing greater emphasis on testing as a means of measuring student achievement. This slow shift in focus from
the “input” side of the educational equation to the “output” has been instrumental in spurring many of the reforms to our public school system. Policy makers, responding to parents’ demands to improve our nation’s beleaguered educational system, are stressing that measurable achievement results must accompany additional education spending. The passage and implementation of the No Child Left Behind Act has made student testing, and achievement, even more integral in our public school system.
Attempting to identify and compare student achievement across state lines is diffi cult due to the myriad number differences in which states collect and report their information. When ALEC fi rst began its Report Card series over a decade ago, it explored several standardized tests in order to identify which held most consistent from state to state. It was ultimately decided to utilize three nationally recognized tests—the National Assessment of Education Progress (NAEP), the Scholastic Aptitude Test (SAT), and the ACT Assessment—as the means to collect and compare student academic achievement on a state-by-state basis and thereby determine the relative effectiveness of America’s public school systems.
Standardized tests, like any other indicator of educational achievement, have their critics. Some argue that these tests are ethnically and demographically biased. However, those who fault these tests as being demographically or ethnically
skewed may be unaware that they were implemented ab initio to achieve a fairer and more egalitarian assessment of student learning.
This chapter reviews the results of these three standardized tests, as they offer the most consistent method of measuring educational achievement across state lines.
NAEP Test Results
Since 1969, the National Assessment of Educational Progress (NAEP) has been mandated by Congress to monitor the knowledge, skills, and performance of the nation’s school children. One form of recent monitoring has been national, standardized tests in mathematics, science, reading, geography and other subjects. 2003 marked the fi rst year all fi fty states and the District of Columbia participated in the mathematics and reading exams.
Tables 2.1A and 2.1B list the results of several recent mathematics and reading tests given at the fourth and eighth grade levels. The same table also records the percent of students per state scoring at or above the profi ciency level. NAEP uses a 0-500 scale on each of the tests. NAEP defi nes profi ciency as, “solid academic performance.” Students reaching this level “have demonstrated competency over challenging subject matter, including subject-matter knowledge, application of such knowledge to real world situations, and analytical skills appropriate to the subject matter.” Students performing at the basic level are defi ned by the NAEP as exhibiting “partial mastery of prerequisite knowledge and skills that are fundamental for profi cient work at each grade.”
C H A P T E R T W O

| 85
NAEP 4th and 8th Grade Scale Scores and Achievement Levels
4th Grade 4th Grade 8th Grade 8th Grade Math Reading Math Reading
Basic 214 208 262 243
Profi cient 249 238 299 281
Advanced 282 268 333 323
■ In 2005, 71 percent of public school eighth graders taking the NAEP mathematics test performed below the profi ciency level. These fi gures represent only slight improvements over 2000, when 74 percent of eighth graders scored below the profi ciency level.
■ Fourth grade students recorded slightly higher results. In 2005, 65 percent of public school fourth graders performed at or below the profi ciency level in mathematics. This is a ten percentage point increase from 2000 when 75 percent of students scored below the profi ciency level.
ACT test results
ACT, Inc. (the company changed its name in 1996 from the American Collegiate Testing Company) is an independent nonprofi t organization founded in 1959. Although ACT, Inc. offers many services to students, secondary schools, and post-secondary institutions of education, the company is best known for creation and administration of the ACT Assessment, a standardized test designed to measure the potential success of college-bound students.
In 1990, the company changed the format and scoring system of its landmark test, administered since 1959. Thus, test scores from before 1990 and after 1990 are not comparable.
■ Of the 25 states in which most students took the ACT Assessment, only Iowa (22), and Minnesota and Wisconsin (22.2) had an average score of 22 or greater in 2004. (See Table 2.3)
■ In two of the 26 states in which the ACT Assessment is dominant, the average score was below 20: Mississippi (18.8) and Louisiana (19.8).
■ More than 75 percent of high school graduates in six states took the ACT Assessment in 2000: Colorado (100 percent), Illinois (99 percent), Mississippi (91 percent), Tennessee and Louisiana (87 percent), and North Dakota (81 percent).
■ The national ACT Assessment composite score has remained relatively stable over the past 10 years. Since 1994, when the average composite score was 20.8, the average rose to 21.0 from 1997 to 2001 and then fell to 20.8 in 2002 and 2003. In 2004 the average composite score increased to 20.9.
SAT test results
The Scholastic Aptitude Test (SAT) is developed and administered by The College Board, a nonprofi t, national association of schools, colleges, and other educational organizations. The test is meant to be a standardized measure of a student’s ability to do college-level work.
The structure of the SAT has changed slightly over time. Most recently, The College Board began including essay questions in addition to the multiple-choice questions that previously constituted the entire exam. The College Board, however, has maintained a standard scoring system over time so that comparisons over the past two and one-half decades are possible (See Table 2.7).
■ Of the 25 states and the District of Columbia in which the SAT was taken by more students than the ACT Assessment, eight had an average score at or above the national average of 1026 in 2004: Washington (1059), Oregon (1055), Arizona (1047), New Hampshire (1043), Massachusetts (1041), Alaska (1032), Connecticut (1030) and Vermont (1028). (See Table 2.5)
■ Since 1984, seven states, out of the 25 states and the District of Columbia in which the SAT was dominant, experienced a decline in average composite scores. Arizona experienced the largest decline, dropping 6.35 percent from 1984 to 2004. The other states in which average SAT scores dropped over the past two decades were Washington (-4.34 percent), Nevada (-3.04 percent), Delaware (-1.87 percent), Alaska (-1.43 percent), and New York and Texas (-0.10 percent). (See Table 2.6)
■ Of the 25 states and the District of Columbia where the SAT was dominant, two states experienced double digit improvement in their average SAT performance over the past two decades. Alabama’s average score increased 10.31 percent from 1009 in 1984 to 1113 in 2004. Illinois was a close second with an increase of 10.06 percent.
■ Average SAT scores for all test-takers have declined since 1972 by about 2.3 percent. However, over this period, scores have followed a cyclical pattern, falling from their high in 1972 (1039) to a low in 1980 and 1981 (994 both of those years). Average composite SAT scores then climbed during the 1980s, only to fall again to another low in 1991 (average score of 999). Since 1991, average SAT scores have risen almost constantly. (See Table 2.7)
■ Female test-takers have lagged behind male test-takers in every year since 1972. Throughout the period males have typically scored about four to six percent higher than females. Again, the variation between average females and

86 |
average male scores followed a cyclical pattern over the past two and one-half decades, increasing between 1972 and 1981 and then narrowing between 1981 and 1995. The gap has increased since 1995.
■ Average student performance on the verbal and math sections of the SAT has varied since 1972. Specifi cally, average verbal scores have fallen by 5 percent since 1972 while average math scores have risen slightly (by less than one half of one percent) over the same period. In fact, between 1972 and 1989, the average verbal score was higher than the average math score. Since 1990, the average math score in every year has been higher than the average verbal score.
A Warning about State-by-State SAT and ACT Test Score Comparisons
Forty-eight percent of 2004 high school graduates nationwide took the Scholastic Aptitude Test (SAT) and 40 percent took the ACT Assessment. There is a tremendous difference, however, in the percentage of high school graduates in each individual state who took the ACT Assessment test and those that took the SAT. Specifi cally, the ACT Assessment is taken by most high school graduates in 25 states. Most students in 25 states and the District of Columbia take the SAT. In no state did more than 50 percent of graduates take both tests. In two states, Arizona and Nevada, neither test was taken by 50 percent of graduates.
States primarily administer only one of these two college entrance exams depending on the emphasis that educators and colleges and universities in each state place on student performance on these exams. In some states, the SAT is given more weight in college admission decisions, in other states the ACT is highlighted. These differences lead different subgroups of students in each state to take the SAT, the ACT, or both. One theory is that students most likely to apply to selective colleges and universities will take both tests, and students applying to less selective colleges and universities, or not going to college at all, will take one or neither of the tests.
This theory is supported by the general fact that in states in which less than a majority (i.e., a select group) of students took a specifi c test, the average scores of those students taking the test were slightly higher than both the national average and the average in those states in which more than 50 percent of students took the test in question (See Tables 2.4 and 2.6). For example, in Illinois, only 10 percent of graduating high school students took the SAT in 2004. The average score for these test-takers was 1182, signifi cantly higher than the national average of 1026, and higher than the average of states with a majority of graduates taking the SAT.
Such self-selection makes state-by-state comparisons of educational achievement, based on either test alone, somewhat misleading. One may be able to look, however, at the results of both tests and other achievement measures across state lines (keeping in mind self-selection biases) to gain an understanding of educational performance.

| 87

88 |
2005 MATHEMATICS 2003 MATHEMATICS GRADE 8 PUBLIC SCHOOLS GRADE 8 PUBLIC SCHOOLS
Average Percent at Average Percent at Average Mathematics or Above Mathematics or Above Mathematics Scale Score Profi ciency Rank Scale Score Profi ciency Rank Scale Score
United States 278 29 276 27 274 Alabama 262 15 49 262 16 49 262 Alaska 279 29 29 279 30 26 * Arizona 274 26 34 271 21 38 271 Arkansas 272 22 39 266 19 45 261 California 269 22 43 267 22 44 262 Colorado 281 32 20 283 34 13 * Connecticut 281 35 19 284 35 8 282 Delaware 281 31 21 277 26 30 * DC 245 7 51 243 6 51 Florida 274 26 34 271 23 38 * Georgia 272 23 37 270 22 41 266 Hawaii 266 18 46 266 17 45 263 Idaho 281 30 24 280 28 24 278 Illinois 278 28 31 277 29 30 277 Indiana 282 30 17 281 31 18 283 Iowa 284 34 12 284 33 8 * Kansas 264 34 47 284 34 8 284 Kentucky 274 22 36 274 24 35 272 Louisiana 268 16 45 266 17 45 259 Maine 281 30 24 282 29 14 284 Maryland 278 30 30 278 30 29 276 Massachusetts 292 43 1 287 38 2 283 Michigan 277 30 32 276 28 34 278 Minnesota 290 43 2 291 44 1 288 Mississippi 262 13 50 261 12 50 254 Missouri 276 26 33 279 28 26 274 Montana 286 26 6 286 35 4 287 Nebraska 284 35 11 282 32 14 281 Nevada 270 21 42 268 20 42 268 New Hampshire 285 35 9 286 35 4 * New Jersey 284 36 10 281 33 18 * New Mexico 263 14 48 263 15 48 260 New York 280 31 27 280 32 24 276 North Carolina 282 32 16 281 32 18 280 North Dakota 287 35 5 287 36 2 283 Ohio 283 34 14 282 30 14 283 Oklahoma 271 20 41 272 20 36 272 Oregon 282 33 15 281 32 18 281 Pennsylvania 281 31 21 279 30 26 * Rhode Island 272 23 37 272 24 36 273 South Carolina 281 30 24 277 26 30 266 South Dakota 287 36 4 285 35 7 * Tennessee 271 21 40 268 21 42 263 Texas 281 31 21 277 25 30 275 Utah 279 30 28 281 31 18 275 Vermont 287 38 3 286 35 4 283 Virginia 284 33 13 282 31 14 277 Washington 285 36 7 281 32 18 * West Virginia 269 17 44 271 20 38 271 Wisconsin 285 36 7 284 35 8 * Wyoming 282 29 18 284 32 8 277
TABLE 2.1A
Grades 4 and 8 Mathematics Average NAEP Scores and Profi ciency Levels
* Did not participate in testing.
Note: In addition to allowing for accommodations, the accommodations-permitted results for national public schools (2000 and 2003) differ slightly from previous years’ results and from previously reported results for 2000, due to changes in sample weighting procedures.
SOURCE: National Center for Education Statistics, National Assessment of Educational Progress (NAEP), 2000, 2003, and 2005 Mathematics Assessments.
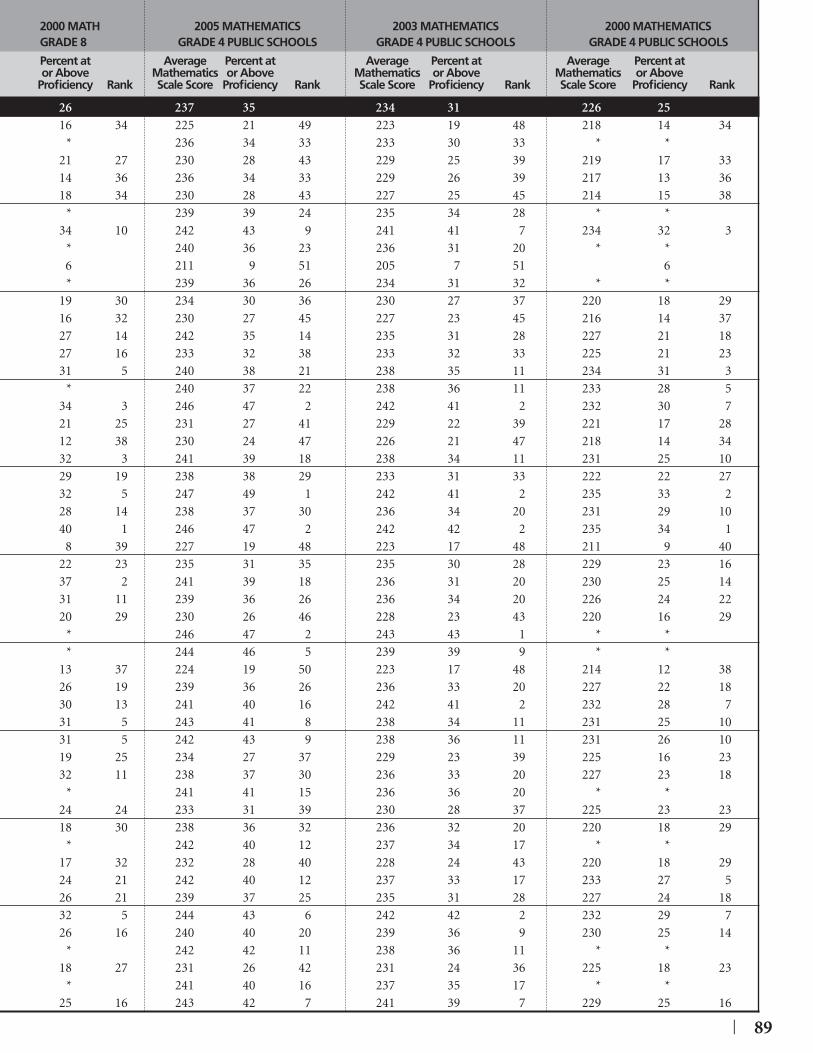
| 89
2000 MATH 2005 MATHEMATICS 2003 MATHEMATICS 2000 MATHEMATICSGRADE 8 GRADE 4 PUBLIC SCHOOLS GRADE 4 PUBLIC SCHOOLS GRADE 4 PUBLIC SCHOOLS
Percent at Average Percent at Average Percent at Average Percent ator Above Mathematics or Above Mathematics or Above Mathematics or Above
Profi ciency Rank Scale Score Profi ciency Rank Scale Score Profi ciency Rank Scale Score Profi ciency Rank
26 237 35 234 31 226 25 16 34 225 21 49 223 19 48 218 14 34
* 236 34 33 233 30 33 * * 21 27 230 28 43 229 25 39 219 17 33 14 36 236 34 33 229 26 39 217 13 36 18 34 230 28 43 227 25 45 214 15 38
* 239 39 24 235 34 28 * * 34 10 242 43 9 241 41 7 234 32 3
* 240 36 23 236 31 20 * * 6 211 9 51 205 7 51 6 * 239 36 26 234 31 32 * *
19 30 234 30 36 230 27 37 220 18 29 16 32 230 27 45 227 23 45 216 14 37 27 14 242 35 14 235 31 28 227 21 18 27 16 233 32 38 233 32 33 225 21 23 31 5 240 38 21 238 35 11 234 31 3
* 240 37 22 238 36 11 233 28 5 34 3 246 47 2 242 41 2 232 30 7 21 25 231 27 41 229 22 39 221 17 28 12 38 230 24 47 226 21 47 218 14 34 32 3 241 39 18 238 34 11 231 25 10 29 19 238 38 29 233 31 33 222 22 27 32 5 247 49 1 242 41 2 235 33 2 28 14 238 37 30 236 34 20 231 29 10 40 1 246 47 2 242 42 2 235 34 1
8 39 227 19 48 223 17 48 211 9 40 22 23 235 31 35 235 30 28 229 23 16 37 2 241 39 18 236 31 20 230 25 14 31 11 239 36 26 236 34 20 226 24 22 20 29 230 26 46 228 23 43 220 16 29
* 246 47 2 243 43 1 * * * 244 46 5 239 39 9 * *
13 37 224 19 50 223 17 48 214 12 38 26 19 239 36 26 236 33 20 227 22 18 30 13 241 40 16 242 41 2 232 28 7 31 5 243 41 8 238 34 11 231 25 10 31 5 242 43 9 238 36 11 231 26 10 19 25 234 27 37 229 23 39 225 16 23 32 11 238 37 30 236 33 20 227 23 18
* 241 41 15 236 36 20 * * 24 24 233 31 39 230 28 37 225 23 23 18 30 238 36 32 236 32 20 220 18 29
* 242 40 12 237 34 17 * * 17 32 232 28 40 228 24 43 220 18 29 24 21 242 40 12 237 33 17 233 27 5 26 21 239 37 25 235 31 28 227 24 18 32 5 244 43 6 242 42 2 232 29 7 26 16 240 40 20 239 36 9 230 25 14
* 242 42 11 238 36 11 * * 18 27 231 26 42 231 24 36 225 18 23
* 241 40 16 237 35 17 * * 25 16 243 42 7 241 39 7 229 25 16
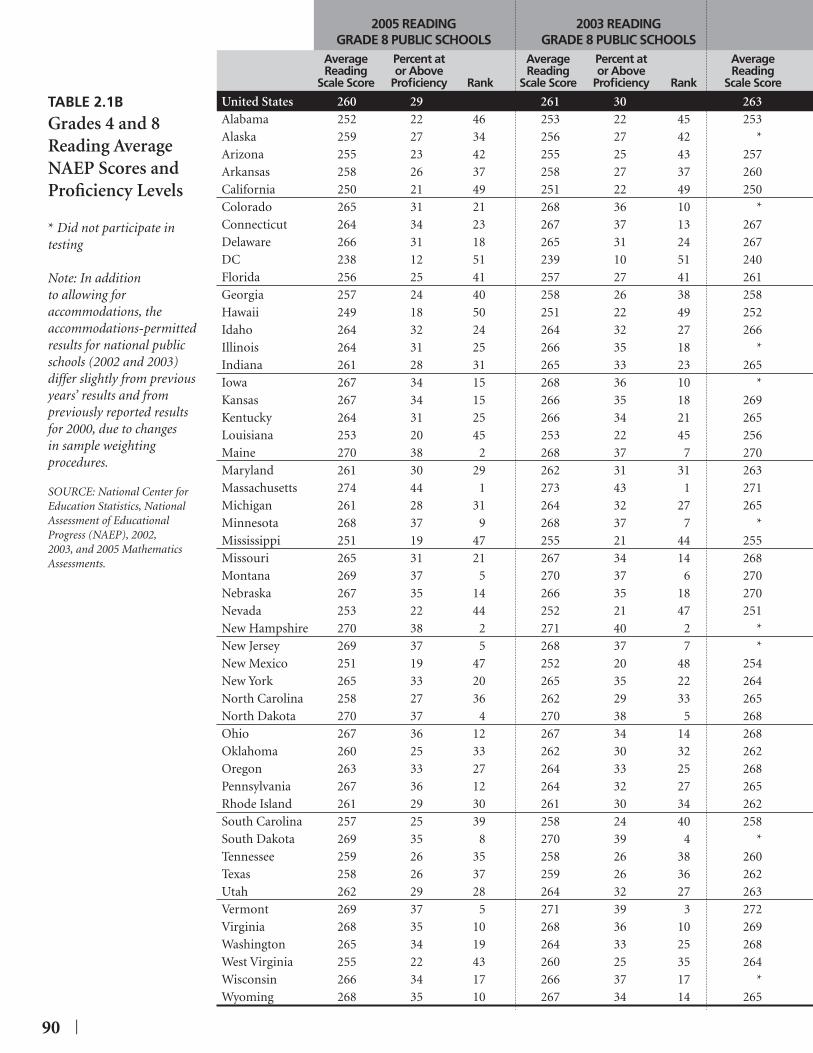
90 |
2005 READING 2003 READING GRADE 8 PUBLIC SCHOOLS GRADE 8 PUBLIC SCHOOLS Average Percent at Average Percent at Average Reading or Above Reading or Above Reading Scale Score Profi ciency Rank Scale Score Profi ciency Rank Scale Score
United States 260 29 261 30 263 Alabama 252 22 46 253 22 45 253 Alaska 259 27 34 256 27 42 * Arizona 255 23 42 255 25 43 257 Arkansas 258 26 37 258 27 37 260 California 250 21 49 251 22 49 250 Colorado 265 31 21 268 36 10 * Connecticut 264 34 23 267 37 13 267 Delaware 266 31 18 265 31 24 267 DC 238 12 51 239 10 51 240 Florida 256 25 41 257 27 41 261 Georgia 257 24 40 258 26 38 258 Hawaii 249 18 50 251 22 49 252 Idaho 264 32 24 264 32 27 266 Illinois 264 31 25 266 35 18 * Indiana 261 28 31 265 33 23 265 Iowa 267 34 15 268 36 10 * Kansas 267 34 15 266 35 18 269 Kentucky 264 31 25 266 34 21 265 Louisiana 253 20 45 253 22 45 256 Maine 270 38 2 268 37 7 270 Maryland 261 30 29 262 31 31 263 Massachusetts 274 44 1 273 43 1 271 Michigan 261 28 31 264 32 27 265 Minnesota 268 37 9 268 37 7 * Mississippi 251 19 47 255 21 44 255 Missouri 265 31 21 267 34 14 268 Montana 269 37 5 270 37 6 270 Nebraska 267 35 14 266 35 18 270 Nevada 253 22 44 252 21 47 251 New Hampshire 270 38 2 271 40 2 * New Jersey 269 37 5 268 37 7 * New Mexico 251 19 47 252 20 48 254 New York 265 33 20 265 35 22 264 North Carolina 258 27 36 262 29 33 265 North Dakota 270 37 4 270 38 5 268 Ohio 267 36 12 267 34 14 268 Oklahoma 260 25 33 262 30 32 262 Oregon 263 33 27 264 33 25 268 Pennsylvania 267 36 12 264 32 27 265 Rhode Island 261 29 30 261 30 34 262 South Carolina 257 25 39 258 24 40 258 South Dakota 269 35 8 270 39 4 * Tennessee 259 26 35 258 26 38 260 Texas 258 26 37 259 26 36 262 Utah 262 29 28 264 32 27 263 Vermont 269 37 5 271 39 3 272 Virginia 268 35 10 268 36 10 269 Washington 265 34 19 264 33 25 268 West Virginia 255 22 43 260 25 35 264 Wisconsin 266 34 17 266 37 17 * Wyoming 268 35 10 267 34 14 265
TABLE 2.1B
Grades 4 and 8 Reading Average NAEP Scores and Profi ciency Levels
* Did not participate in testing
Note: In addition to allowing for accommodations, the accommodations-permitted results for national public schools (2002 and 2003) differ slightly from previous years’ results and from previously reported results for 2000, due to changes in sample weighting procedures.
SOURCE: National Center for Education Statistics, National Assessment of Educational Progress (NAEP), 2002, 2003, and 2005 Mathematics Assessments.
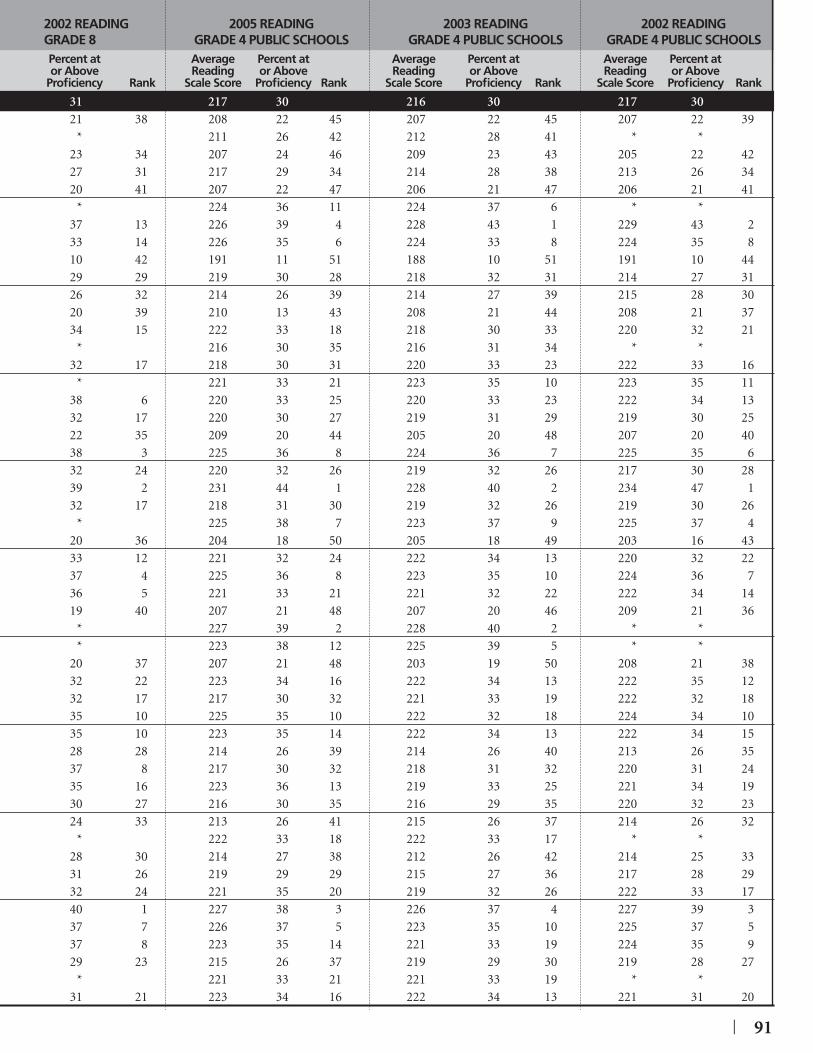
| 91
2002 READING 2005 READING 2003 READING 2002 READINGGRADE 8 GRADE 4 PUBLIC SCHOOLS GRADE 4 PUBLIC SCHOOLS GRADE 4 PUBLIC SCHOOLS Percent at Average Percent at Average Percent at Average Percent ator Above Reading or Above Reading or Above Reading or Above
Profi ciency Rank Scale Score Profi ciency Rank Scale Score Profi ciency Rank Scale Score Profi ciency Rank
31 217 30 216 30 217 30 21 38 208 22 45 207 22 45 207 22 39
* 211 26 42 212 28 41 * * 23 34 207 24 46 209 23 43 205 22 4227 31 217 29 34 214 28 38 213 26 3420 41 207 22 47 206 21 47 206 21 41
* 224 36 11 224 37 6 * * 37 13 226 39 4 228 43 1 229 43 233 14 226 35 6 224 33 8 224 35 810 42 191 11 51 188 10 51 191 10 4429 29 219 30 28 218 32 31 214 27 3126 32 214 26 39 214 27 39 215 28 3020 39 210 13 43 208 21 44 208 21 3734 15 222 33 18 218 30 33 220 32 21
* 216 30 35 216 31 34 * * 32 17 218 30 31 220 33 23 222 33 16
* 221 33 21 223 35 10 223 35 1138 6 220 33 25 220 33 23 222 34 1332 17 220 30 27 219 31 29 219 30 2522 35 209 20 44 205 20 48 207 20 4038 3 225 36 8 224 36 7 225 35 632 24 220 32 26 219 32 26 217 30 2839 2 231 44 1 228 40 2 234 47 132 17 218 31 30 219 32 26 219 30 26
* 225 38 7 223 37 9 225 37 420 36 204 18 50 205 18 49 203 16 4333 12 221 32 24 222 34 13 220 32 2237 4 225 36 8 223 35 10 224 36 736 5 221 33 21 221 32 22 222 34 1419 40 207 21 48 207 20 46 209 21 36
* 227 39 2 228 40 2 * * * 223 38 12 225 39 5 * *
20 37 207 21 48 203 19 50 208 21 3832 22 223 34 16 222 34 13 222 35 1232 17 217 30 32 221 33 19 222 32 1835 10 225 35 10 222 32 18 224 34 1035 10 223 35 14 222 34 13 222 34 1528 28 214 26 39 214 26 40 213 26 3537 8 217 30 32 218 31 32 220 31 2435 16 223 36 13 219 33 25 221 34 1930 27 216 30 35 216 29 35 220 32 2324 33 213 26 41 215 26 37 214 26 32
* 222 33 18 222 33 17 * * 28 30 214 27 38 212 26 42 214 25 3331 26 219 29 29 215 27 36 217 28 2932 24 221 35 20 219 32 26 222 33 1740 1 227 38 3 226 37 4 227 39 337 7 226 37 5 223 35 10 225 37 537 8 223 35 14 221 33 19 224 35 929 23 215 26 37 219 29 30 219 28 27
* 221 33 21 221 33 19 * * 31 21 223 34 16 222 34 13 221 31 20

92 |
Average Percent at Mathematics or Above Scale Score Rank Profi ciency Rank
United States 278 29 Massachusetts 292 1 43 1Minnesota 290 2 43 1Vermont 287 3 38 3South Dakota 287 3 36 4Washington 285 7 36 4Wisconsin 285 7 36 4New Jersey 284 10 36 4North Dakota 287 3 35 8New Hampshire 285 7 35 8Nebraska 284 10 35 8Connecticut 281 19 35 8Iowa 284 10 34 12Ohio 283 14 34 12Kansas 264 47 34 12Virginia 284 10 33 15Oregon 282 15 33 15North Carolina 282 15 32 17Colorado 281 19 32 17Delaware 281 19 31 19Pennsylvania 281 19 31 19Texas 281 19 31 19New York 280 27 31 19Indiana 282 15 30 23Idaho 281 19 30 23Maine 281 19 30 23South Carolina 281 19 30 23Utah 279 28 30 23Maryland 278 28 30 23Michigan 277 32 30 23Wyoming 282 15 29 30Alaska 279 28 29 30Illinois 278 28 28 32Montana 286 6 26 33Missouri 276 33 26 33Arizona 274 34 26 33Florida 274 34 26 33Georgia 272 37 23 37Rhode Island 272 37 23 37Kentucky 274 34 22 39Arkansas 272 37 22 39California 269 43 22 39Tennessee 271 40 21 42Nevada 270 42 21 42Oklahoma 271 40 20 44Hawaii 266 46 18 45West Virginia 269 43 17 46Louisiana 268 45 16 47Alabama 262 49 15 48New Mexico 263 48 14 49Mississippi 262 49 13 50District of Columbia 245 51 7 51
TABLE 2.2A
Average 2005 NAEP Grade 8 Mathematics Scores and Profi ciency, Ranked by Percent at or Above Profi cient Level
Source: Author’s Tabulations Based on Table 2.1A
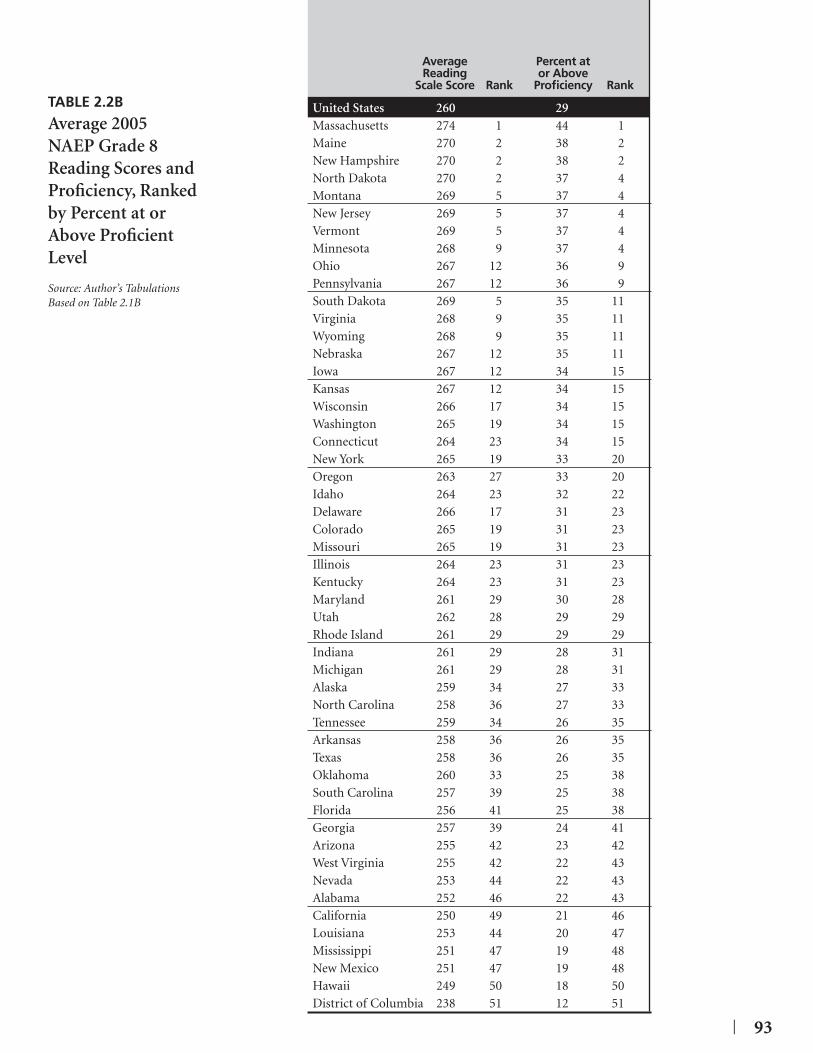
| 93
Average Percent at Reading or Above Scale Score Rank Profi ciency Rank
United States 260 29 Massachusetts 274 1 44 1Maine 270 2 38 2New Hampshire 270 2 38 2North Dakota 270 2 37 4Montana 269 5 37 4New Jersey 269 5 37 4Vermont 269 5 37 4Minnesota 268 9 37 4Ohio 267 12 36 9Pennsylvania 267 12 36 9South Dakota 269 5 35 11Virginia 268 9 35 11Wyoming 268 9 35 11Nebraska 267 12 35 11Iowa 267 12 34 15Kansas 267 12 34 15Wisconsin 266 17 34 15Washington 265 19 34 15Connecticut 264 23 34 15New York 265 19 33 20Oregon 263 27 33 20Idaho 264 23 32 22Delaware 266 17 31 23Colorado 265 19 31 23Missouri 265 19 31 23Illinois 264 23 31 23Kentucky 264 23 31 23Maryland 261 29 30 28Utah 262 28 29 29Rhode Island 261 29 29 29Indiana 261 29 28 31Michigan 261 29 28 31Alaska 259 34 27 33North Carolina 258 36 27 33Tennessee 259 34 26 35Arkansas 258 36 26 35Texas 258 36 26 35Oklahoma 260 33 25 38South Carolina 257 39 25 38Florida 256 41 25 38Georgia 257 39 24 41Arizona 255 42 23 42West Virginia 255 42 22 43Nevada 253 44 22 43Alabama 252 46 22 43California 250 49 21 46Louisiana 253 44 20 47Mississippi 251 47 19 48New Mexico 251 47 19 48Hawaii 249 50 18 50District of Columbia 238 51 12 51
TABLE 2.2B
Average 2005 NAEP Grade 8 Reading Scores and Profi ciency, Ranked by Percent at or Above Profi cient Level
Source: Author’s Tabulations Based on Table 2.1B

94 |
Percent of Percent of High School Average ACT High School Average SAT Grads taking Composite Weighted Grads taking Composite Weighted the ACT ACT(1) Score Ranking the SAT SAT(2) Score Ranking
Alabama 76 20.2 22 Alaska 53 1032 6Arizona 32 1047 3Arkansas 73 20.4 18 California 49 1020 12Colorado 100 20.3 19 Connecticut 85 1030 7Delaware 73 999 21District of Columbia 77 965 26Florida 67 998 22Georgia 73 987 24Hawaii 60 1001 20Idaho 59 21.3 13 Illinois 99 20.3 19 Indiana 64 1007 14Iowa 67 22.0 3 Kansas 75 21.6 6 Kentucky 75 20.3 19 Louisiana 87 19.8 24 Maine 76 1006 16Maryland 68 1026 9Massachusetts 85 1041 5Michigan 68 21.4 10 Minnesota 66 22.2 1 Mississippi 91 18.8 25 Missouri 70 21.5 7 Montana 56 21.7 4 Nebraska 77 21.7 4 Nevada 40 1021 11New Hampshire 80 1043 4New Jersey 83 1015 13New Mexico 61 20.1 23 New York 87 1007 14North Carolina 70 1006 16North Dakota 81 21.2 14 Ohio 66 21.4 10 Oklahoma 69 20.6 15 Oregon 56 1055 2Pennsylvania 74 1003 19Rhode Island 72 1005 18South Carolina 62 986 25South Dakota 75 21.5 7 Tennessee 87 20.5 16 Texas 52 52 992 23Utah 67 21.5 7 Vermont 66 1028 8Virginia 71 1024 10Washington 52 1059 1West Virginia 65 20.5 16 Wisconsin 68 22.2 1 Wyoming 70 21.4 10
TABLE 2.3
SAT and ACT Test Results Depending on State Usage, 2004
Note: Weighted ranking determined by ranking those states where either the ACT or SAT was taken by the greatest number of students.(1) ACT Exams are scored on a scale of 1 through 36. (2) SAT Exams are scored on a scale of 200 through 1600.
Source: ACT, Inc., The College Board, and Author’s Tabulations.

| 95
2004 TOTALS 2004 AVERAGE COMPONENT SCORES % of Average Rank by Average Average Average Average Graduates Composite Composite English Mathematics Reading Science Tested Score Score Score Score Score ScoreUnited States 40 20.9 20.4 20.7 21.3 20.9Alabama 76 20.2 44 20.3 19.5 20.5 20.1Alaska 29 21.3 28 20.4 21.4 22.1 21.1Arizona 20 21.5 20 20.9 21.6 22 21.2Arkansas 73 20.4 39 20.6 19.5 20.8 20.1California 14 21.6 17 21.1 22.1 21.7 20.9Colorado 100 20.3 40 19.5 20 20.6 20.4Connecticut 9 22.5 3 22.3 22.4 23 21.9Delaware 5 21.5 20 20.7 21.4 22 21.3District of Columbia 29 17.8 51 17.1 17.5 18.2 17.8Florida 44 20.5 36 19.9 20.4 21 20.2Georgia 26 20.0 47 19.5 19.9 20.3 19.9Hawaii 18 21.7 14 20.8 22.5 21.7 21.4Idaho 59 21.3 28 20.4 20.9 22 21.2Illinois 99 20.3 40 19.7 20.2 20.5 20.2Indiana 20 21.6 17 21 21.5 22.2 21.4Iowa 67 22.0 11 21.4 21.8 22.4 22.1Kansas 75 21.6 17 21.1 21.4 22 21.5Kentucky 75 20.3 40 19.8 19.7 20.9 20.4Louisiana 87 19.8 48 19.9 19.2 19.9 19.7Maine 9 22.6 2 22.3 22.1 23.4 22Maryland 12 20.8 34 20.3 20.6 21.3 20.6Massachusetts 12 22.4 7 22.1 22.3 22.9 21.7Michigan 68 21.4 25 20.5 21.1 21.8 21.5Minnesota 66 22.2 9 21.4 22 22.6 22.3Mississippi 91 18.8 50 18.9 17.9 19 18.8Missouri 70 21.5 20 21.4 20.9 22 21.4Montana 56 21.7 14 20.8 21.4 22.4 21.7Nebraska 77 21.7 14 21.2 21.5 22 21.6Nevada 33 21.2 30 20.4 21.1 21.8 21.1New Hampshire 9 22.5 3 22.1 22.1 23.3 21.9New Jersey 6 21.2 30 20.7 21.4 21.5 20.8New Mexico 61 20.1 46 19.4 19.4 20.8 20.2New York 16 22.3 8 21.3 22.4 22.8 22.3North Carolina 15 20.3 40 19.4 20.4 20.6 20.1North Dakota 81 21.2 30 20.2 21.3 21.5 21.4Ohio 66 21.4 25 20.7 21.1 21.9 21.5Oklahoma 69 20.6 35 20.4 19.8 21.2 20.6Oregon 12 22.5 3 21.8 22.4 23.3 22.1Pennsylvania 9 21.8 13 21.2 21.5 22.3 21.5Rhode Island 7 21.9 12 21.7 21.6 22.6 21.4South Carolina 36 19.3 49 18.8 19.1 19.4 19.3South Dakota 75 21.5 20 20.7 21.4 21.8 21.6Tennessee 87 20.5 36 20.6 19.7 21 20.3Texas 29 20.2 44 19.4 20.3 20.5 20.2Utah 67 21.5 20 20.9 20.9 22.2 21.4Vermont 12 22.7 1 22.4 22.2 23.5 22.2Virginia 13 20.9 33 20.4 20.7 21.2 20.7Washington 15 22.5 3 21.9 22.1 23.2 22West Virginia 65 20.5 36 20.6 19.4 21.1 20.3Wisconsin 68 22.2 9 21.5 22.1 22.5 22.2Wyoming 70 21.4 25 20.6 21 22.2 21.4
TABLE 2.4
ACT Scores, Ranked by Composite Score, 2004
* Core Courses = at least four years of English and three years each of mathematics (algebra and above), social sciences, and natural sciences.
Source: ACT, Inc.; 2004 ACT Composite Averages by State

96 |
TABLE 2.5
SAT Scores, Ranked by 2004 Total Score
Source: The College Board and Author’s Tabulations.
2004 Average Rank on 1994 Average Rank on 1984 Average Rank on Composite Composite Composite Composite Composite Composite
United States 1026 1003 999 Iowa 1195 1 1166 1 1175 1South Dakota 1191 2 1121 7 1174 2North Dakota 1183 3 1143 4 1156 4Wisconsin 1183 3 1134 5 1115 11Illinois 1182 5 1115 9 1074 20Minnesota 1180 6 1145 3 1140 6Missouri 1172 7 1114 11 1072 21Kansas 1169 8 1133 6 1147 5Nebraska 1145 9 1116 8 1118 9Michigan 1136 10 1101 16 1070 23Oklahoma 1135 11 1111 12 1107 12Louisiana 1125 12 1105 13 1066 24Arkansas 1124 13 1089 19 1096 15Tennessee 1124 13 1115 9 1090 16Utah 1121 15 1155 2 1173 3Kentucky 1116 16 1092 18 1083 18Alabama 1113 17 1103 15 1009 33Mississippi 1109 18 1105 13 1080 19Colorado 1107 19 1066 22 1089 17New Mexico 1097 20 1096 17 1107 12Wyoming 1097 20 1076 21 1134 8Ohio 1080 22 1064 24 1064 25Idaho 1079 23 1066 22 1007 35Montana 1076 24 1082 20 1136 7Washington 1059 25 1023 28 1107 12Oregon 1055 26 1028 26 1013 32Arizona 1047 27 1038 25 1118 9New Hampshire 1043 28 1025 27 1036 28Massachusetts 1041 29 1002 33 1002 38West Virginia 1038 30 1023 28 1072 21Alaska 1032 31 1012 31 1047 27Connecticut 1030 32 999 35 1014 30Vermont 1028 33 1002 33 1014 30Maryland 1026 34 1008 32 1003 37Virginia 1024 35 996 36 997 41Nevada 1021 36 1014 30 1053 26California 1020 37 995 38 999 40New Jersey 1015 38 994 39 978 46Indiana 1007 39 981 46 979 45New York 1007 39 989 40 1008 34Maine 1006 41 987 42 1005 36North Carolina 1006 41 964 48 925 49Rhode Island 1005 43 984 43 996 42Pennsylvania 1003 44 983 44 1002 38Hawaii 1001 45 981 46 972 47Delaware 999 46 996 36 1018 29Florida 998 47 982 45 996 42Texas 992 48 989 40 993 44Georgia 987 49 948 49 928 48South Carolina 986 50 946 51 898 50District of Columbia 965 51 947 50 887 51

| 97

98 |
Percent of Graduates Rank of Taking SAT 2 0 0 4 Cumulative 1 9 9 4 in 2004 verbal math total 2004 Scores verbal math total
United States 48 508 518 1026 499 504 1003 Alabama 10 560 553 1113 17 556 547 1103 Alaska 53 518 514 1032 31 510 502 1012 Arizona 32 523 524 1047 27 519 519 1038 Arkansas 6 569 555 1124 13 552 537 1089 California 49 501 519 1020 37 489 506 995 Colorado 27 554 553 1107 19 532 534 1066 Connecticut 85 515 515 1030 32 502 497 999 Delaware 73 500 499 999 46 505 491 996 District of Columbia 77 489 476 965 51 479 468 947 Florida 67 499 499 998 47 490 492 982 Georgia 73 494 493 987 49 474 474 948 Hawaii 60 487 514 1001 45 477 504 981 Idaho 20 540 539 1079 23 537 529 1066 Illinois 10 585 597 1182 5 553 562 1115 Indiana 64 501 506 1007 39 488 493 981 Iowa 5 593 602 1195 1 580 586 1166 Kansas 9 584 585 1169 8 568 565 1133 Kentucky 12 559 557 1116 16 549 543 1092 Louisiana 8 564 561 1125 12 556 549 1105 Maine 76 505 501 1006 41 497 490 987 Maryland 68 511 515 1026 34 505 503 1008 Massachusetts 85 518 523 1041 29 502 500 1002 Michigan 11 563 573 1136 10 547 554 1101 Minnesota 10 587 593 1180 6 569 576 1145 Mississippi 5 562 547 1109 18 559 546 1105 Missouri 8 587 585 1172 7 560 554 1114 Montana 29 537 539 1076 24 540 542 1082 Nebraska 8 569 576 1145 9 557 559 1116 Nevada 40 507 514 1021 36 506 508 1014 New Hampshire 80 522 521 1043 28 515 510 1025 New Jersey 83 501 514 1015 38 494 500 994 New Mexico 14 554 543 1097 20 550 546 1096 New York 87 497 510 1007 39 492 497 989 North Carolina 70 499 507 1006 41 482 482 964 North Dakota 5 582 601 1183 3 570 573 1143 Ohio 28 538 542 1080 22 533 531 1064 Oklahoma 7 569 566 1135 11 557 554 1111 Oregon 56 527 528 1055 26 513 515 1028 Pennsylvania 74 501 502 1003 44 494 489 983 Rhode Island 72 503 502 1005 43 496 488 984 South Carolina 62 491 495 986 50 473 473 946 South Dakota 5 594 597 1191 2 558 563 1121 Tennessee 16 567 557 1124 13 562 553 1115 Texas 52 493 499 992 48 489 500 989 Utah 7 565 556 1121 15 582 573 1155 Vermont 66 516 512 1028 33 504 498 1002 Virginia 71 515 509 1024 35 501 495 996 Washington 52 528 531 1059 25 511 512 1023 West Virginia 19 524 514 1038 30 516 507 1023 Wisconsin 7 587 596 1183 3 562 572 1134 Wyoming 12 551 546 1097 20 535 541 1076
TABLE 2.6
SAT Scores
Source: The College Board, Author’s Tabulations

| 99
Change in % Percent Percent Percent Change Cumulative Rank by Change in Change in in Cumulative 1 9 8 4 Score Percent Verbal Score Math Score SAT Scores
verbal math total 1994-2004 Change 1984-2004 1984-2004 1984-2004 Rank
504 495 999 2.29% 0.79% 4.65% 2.70% 515 494 1009 0.91% 42 8.74% 11.94% 10.31% 1536 511 1047 1.98% 30 -3.36% 0.59% -1.43% 43569 549 1118 0.87% 43 -8.08% -4.55% -6.35% 51560 536 1096 3.21% 12 1.61% 3.54% 2.55% 22506 493 999 2.51% 22 -0.99% 5.27% 2.10% 27551 538 1089 3.85% 9 0.54% 2.79% 1.65% 30517 497 1014 3.10% 15 -0.39% 3.62% 1.58% 31515 503 1018 0.30% 47 -2.91% -0.80% -1.87% 44461 426 887 1.90% 33 6.07% 11.74% 8.79% 5507 489 996 1.63% 38 -1.58% 2.04% 0.20% 37473 455 928 4.11% 7 4.44% 8.35% 6.36% 8477 495 972 2.04% 28 2.01% 3.84% 2.98% 18465 542 1007 1.22% 41 16.13% -0.55% 7.15% 7541 533 1074 6.01% 2 8.13% 12.01% 10.06% 2493 486 979 2.65% 18 1.62% 4.12% 2.86% 19591 584 1175 2.49% 23 0.34% 3.08% 1.70% 29579 568 1147 3.18% 13 0.86% 2.99% 1.92% 28550 533 1083 2.20% 24 1.64% 4.50% 3.05% 17541 525 1066 1.81% 35 4.25% 6.86% 5.53% 11509 496 1005 1.93% 32 -0.79% 1.01% 0.10% 38510 493 1003 1.79% 36 0.20% 4.46% 2.29% 26509 493 1002 3.89% 8 1.77% 6.09% 3.89% 13537 533 1070 3.18% 13 4.84% 7.50% 6.17% 9573 567 1140 3.06% 16 2.44% 4.59% 3.51% 15552 528 1080 0.36% 46 1.81% 3.60% 2.69% 21543 529 1072 5.21% 3 8.10% 10.59% 9.33% 4570 566 1136 -0.55% 50 -5.79% -4.77% -5.28% 50561 557 1118 2.60% 20 1.43% 3.41% 2.42% 24535 518 1053 0.69% 45 -5.23% -0.77% -3.04% 45525 511 1036 1.76% 37 -0.57% 1.96% 0.68% 36498 480 978 2.11% 27 0.60% 7.08% 3.78% 14562 545 1107 0.09% 49 -1.42% -0.37% -0.90% 42510 498 1008 1.82% 34 -2.55% 2.41% -0.01% 40469 456 925 4.36% 4 6.40% 11.18% 8.76% 6586 570 1156 3.50% 11 -0.68% 5.44% 2.34% 25537 527 1064 1.50% 39 0.19% 2.85% 1.50% 32560 547 1107 2.16% 25 1.61% 3.47% 2.53% 23516 497 1013 2.63% 19 2.13% 6.24% 4.15% 12507 495 1002 2.03% 29 -1.18% 1.41% 0.10% 38504 492 996 2.13% 26 -0.20% 2.03% 0.90% 35457 441 898 4.23% 6 7.44% 12.24% 9.80% 3594 580 1174 6.24% 1 0.00% 2.93% 1.45% 33554 536 1090 0.81% 44 2.35% 3.92% 3.12% 16504 489 993 0.30% 47 -2.18% 2.04% -0.10% 40591 582 1173 -2.94% 51 -4.40% -4.47% -4.43% 49513 501 1014 2.59% 21 0.58% 2.20% 1.38% 34507 490 997 2.81% 17 1.58% 3.88% 2.71% 20561 546 1107 3.52% 10 -5.88% -2.75% -4.34% 48543 529 1072 1.47% 40 -3.50% -2.84% -3.17% 46556 559 1115 4.32% 5 5.58% 6.62% 6.01% 10574 560 1134 1.95% 31 -4.01% -2.50% -3.26% 47
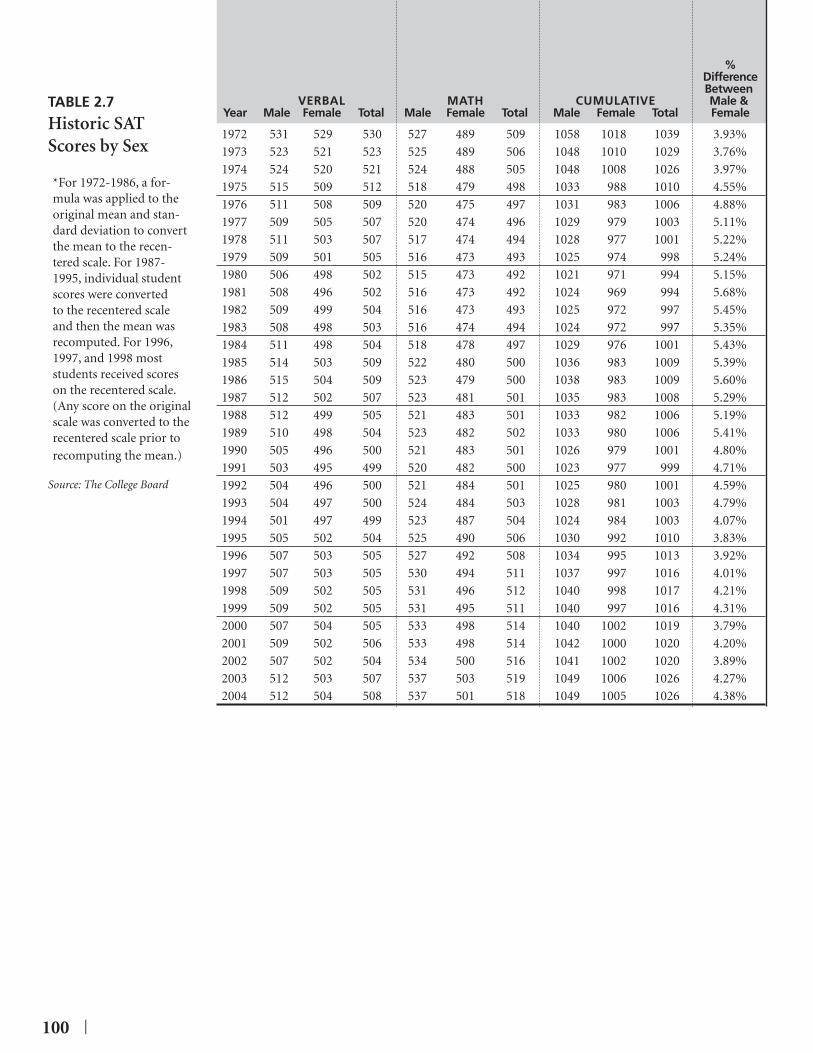
100 |
% Difference Between VERBAL MATH CUMULATIVE Male & Year Male Female Total Male Female Total Male Female Total Female
1972 531 529 530 527 489 509 1058 1018 1039 3.93%1973 523 521 523 525 489 506 1048 1010 1029 3.76%1974 524 520 521 524 488 505 1048 1008 1026 3.97%1975 515 509 512 518 479 498 1033 988 1010 4.55%1976 511 508 509 520 475 497 1031 983 1006 4.88%1977 509 505 507 520 474 496 1029 979 1003 5.11%1978 511 503 507 517 474 494 1028 977 1001 5.22%1979 509 501 505 516 473 493 1025 974 998 5.24%1980 506 498 502 515 473 492 1021 971 994 5.15%1981 508 496 502 516 473 492 1024 969 994 5.68%1982 509 499 504 516 473 493 1025 972 997 5.45%1983 508 498 503 516 474 494 1024 972 997 5.35%1984 511 498 504 518 478 497 1029 976 1001 5.43%1985 514 503 509 522 480 500 1036 983 1009 5.39%1986 515 504 509 523 479 500 1038 983 1009 5.60%1987 512 502 507 523 481 501 1035 983 1008 5.29%1988 512 499 505 521 483 501 1033 982 1006 5.19%1989 510 498 504 523 482 502 1033 980 1006 5.41%1990 505 496 500 521 483 501 1026 979 1001 4.80%1991 503 495 499 520 482 500 1023 977 999 4.71%1992 504 496 500 521 484 501 1025 980 1001 4.59%1993 504 497 500 524 484 503 1028 981 1003 4.79%1994 501 497 499 523 487 504 1024 984 1003 4.07%1995 505 502 504 525 490 506 1030 992 1010 3.83%1996 507 503 505 527 492 508 1034 995 1013 3.92%1997 507 503 505 530 494 511 1037 997 1016 4.01%1998 509 502 505 531 496 512 1040 998 1017 4.21%1999 509 502 505 531 495 511 1040 997 1016 4.31%2000 507 504 505 533 498 514 1040 1002 1019 3.79%2001 509 502 506 533 498 514 1042 1000 1020 4.20%2002 507 502 504 534 500 516 1041 1002 1020 3.89%2003 512 503 507 537 503 519 1049 1006 1026 4.27%2004 512 504 508 537 501 518 1049 1005 1026 4.38%
TABLE 2.7
Historic SAT Scores by Sex
*For 1972-1986, a for-mula was applied to the original mean and stan-dard deviation to convert the mean to the recen-tered scale. For 1987-1995, individual student scores were converted to the recentered scale and then the mean was recomputed. For 1996, 1997, and 1998 most students received scores on the recentered scale. (Any score on the original scale was converted to the recentered scale prior to recomputing the mean.)
Source: The College Board

| 101
Measures of Correlation between Inputs &
Outputs
CHAPTER THREE
ALECAmerican Legislative Exchange Council
102 |
While the information in the previous chapters is insightful and interesting, simply examining educational “inputs” and “outputs” does not
provide an adequate answer to the most pressing question that policy makers are faced with today – namely what has or has not worked. In order to answer this question, one must take an in depth look at the link between specifi c indicators of educational achievement, as measured by such indicators as average SAT scores, average ACT scores, and average NAEP test scores and specifi c indicators of educational investments, such as expenditures per pupil, average teacher salaries, and average class sizes. More important, yet, is to understand if any specifi c educational inputs or combination of inputs lead to greater overall student achievement.
This chapter attempts to answer this vital question by investigating the connection between educational inputs and outputs using two different tools of statistical analysis. First, measures of inputs and outputs are placed side-by-side on four different tables. Looking at these tables gives an idea of possible correlations between educational inputs and outputs. For example, if a state spends a relatively large amount of money per pupil and has a relatively high average SAT score, then it may be the case that spending large amounts of money leads to higher SAT scores. Tables, however, are not very specifi c, as it is diffi cult to look at possible relationships between states. And even if a relationship between spending per pupil and SAT scores exists in one state, for example, it may not exist in another. Furthermore, the current relationship between these factors may be merely coincidental. Tables are helpful, however, in understanding very basic relationships.
Finally, this chapter explains how the author used the two standard regression tests found in the Appendices to account for the possibility that several educational inputs are
important to student achievement. Specifi cally, these tests are able to combine the effect of several inputs and determine whether, collectively, they lead to greater levels of educational output. These statistical tests have the additional benefi t of predicting whether individual inputs have an effect on student achievement, even if all other factors are the same.
While no statistical analysis is ever 100 percent accurate, using these statistical tools together gives legislators the best foundation for making decisions about education policy.
Tables
Table 3.1 contains average test results for each state on the most recent SAT, ACT and NAEP 8th grade reading and mathematics exams, and three measures of public education infrastructure and staffi ng: schools per district, students per school, and pupils per teacher. In addition, each state is ranked for each category. There is no immediately evident correlation between staffi ng and infrastructure inputs and educational outputs. Specifi cally, states performing exceptionally well on standardized tests such as Massachusetts, Minnesota, and Oregon (all of which were in the top ten as measured by all three standardized tests) do not have an extraordinarily high number of teachers per pupil or infrastructure per pupil (none of these states ranked higher than tenth as measured by schools per district, students per school or pupils per teacher).
Table 3.2 contains average test results for each state on the most recent SAT, ACT, and NAEP 8th grade reading and mathematics exams, and three measures of public education fi nances: percent of total funds received from the federal government, per pupil expenditures, and average teacher salaries. Each state is ranked for each category. Again, there does not appear to be any immediate correlation between
C H A P T E R T H R E E

| 103
a state’s expenditures per pupil, funds from the federal government, or teacher salaries and educational performance. Washington, Iowa, and Wisconsin rank below the top ten in each of these measures, and yet have achieved the highest average test scores in the nation. Meanwhile, several states including the District of Columbia spend a relatively high amount of resources as measured per pupil and receive signifi cant support from the federal government yet do not demonstrate high levels of student achievement.
Table 3.3 contains the same information as provided in Tables 3.1 and 3.2 but lists only the rankings for each state in those categories. The information is formatted in this way to provide an easy way to compare measures of educational inputs vs. outputs.
Table 3.4 contains information on the changing education performance in each state over the past two decades. Specifi cally, the table lists the percentage change in average SAT scores between 1984 and 2004. Changes in several educational inputs are also included: per pupil expenditures, average instructional staff salaries, schools per district, students per school, and pupils per teacher. This table contains the same information as in Tables 3.1 and 3.2, but presented as changes over time.
Illinois and Alabama have experienced signifi cant increases in average SAT scores since 1984. Yet, in only one category (Illinois increase in average teacher salary) did either of these three make an “improvement” in measured educational inputs signifi cant enough to place it in the top ten nationwide.
Thus, there appears to be no connection between changes in SAT scores over the past two decades and increases or decreases in educational inputs such as expenditures per pupil.
Statistical Tests1
The statistical tests used in this study are able to account for the possible fact that several educational inputs together are important to student achievement. These tests have the additional benefi t of predicting whether individual inputs have an effect on student achievement, even if all other factors are the same. For example, these tests can predict whether the combination of large expenditures per pupil, high teacher salaries, and small class size leads to higher SAT scores. The same test can determine whether any one of these inputs (holding the others constant) leads to greater achievement on the SAT test.
The fi rst conclusion of these tests is that differences in educational inputs measured in this study (students per school, schools per district, student to teacher ratios, per
pupil expenditures, teacher salaries, and funds received from the federal government) taken together do not explain differences in student achievement. In other words, more schools, more school districts, a low pupil-to-teacher ratio, high expenditures per students, high teacher salaries, federal involvement in primary and secondary education together do not improve student performance as measured by average standardized test scores.
The second general conclusion of these tests is that very few of the educational inputs measured in this study, taken individually and holding all the others constant, have an impact on student performance levels. Specifi cally, the number of schools per district, the level of per pupil expenditures, and teacher salaries have no impact on student achievement. The tests do demonstrate a weak relationship between student performance and students per school, federal funding as a percentage of overall funding, and pupil to teacher ratios. The results of the tests, however, in regard to federal funding and pupil to teacher ratios, are counter-intuitive. Specifi cally, the tests indicate that higher student achievement is weakly associated with more pupils per teacher and less federal involvement in primary and secondary education. Only the positive relationship between fewer students per school and greater academic achievement follows the conventional wisdom.
Moreover, all of these already weak fi ndings are diminished further because the statistical tests used in this study show that there is no relationship between changes in SAT scores over the past two decades and changes in students per school, changes in pupil-to-teacher ratios, or changes in federal involvement, after taking into account the large variations between states.
Clearly, these tests demonstrate that the conventional wisdom that primary and secondary education in the United States can be improved by spending more money, creating more school districts, increasing teacher salaries, and spending more resources per pupil is misguided.
Moreover, it is clear that states cannot improve student performance over time simply by tweaking pupil-to-teacher ratios, building more schools, or adjusting the level of federal assistance they receive. The natural conclusion of these statistical tests (indeed of the complete analysis of this chapter) is that factors other than those measured in this study are the key determinants to high levels of academic achievement.
———1 See Appendix A.

104 |
Table 3.1
Educational Achievement and Enrollment/Staffi ng Inputs
Source: Author’s Tabulations
2005 NAEP 8TH GRADE 2004 SAT MATHEMATICS READING Average Average Average Average Composite Composite Score Rank Score Rank Score Rank Score United States 278 260 1026 20.9 Alabama 262 49 252 46 1113 17 20.2 Alaska 279 29 259 34 1032 31 21.3 Arizona 274 34 255 42 1047 27 21.5 Arkansas 272 39 258 37 1124 13 20.4 California 269 43 250 49 1020 37 21.6 Colorado 281 20 265 21 1107 19 20.3 Connecticut 281 19 264 23 1030 32 22.5 Delaware 281 21 266 18 999 46 21.5 DC 245 51 238 51 965 51 17.8 Florida 274 34 256 41 998 47 20.5 Georgia 272 37 257 40 987 49 20.0 Hawaii 266 46 249 50 1001 45 21.7 Idaho 281 24 264 24 1079 23 21.3 Illinois 278 31 264 25 1182 5 20.3 Indiana 282 17 261 31 1007 39 21.6 Iowa 284 12 267 15 1195 1 22.0 Kansas 264 47 267 15 1169 8 21.6 Kentucky 274 36 264 25 1116 16 20.3 Louisiana 268 45 253 45 1125 12 19.8 Maine 281 24 270 2 1006 41 22.6 Maryland 278 30 261 29 1026 34 20.8 Massachusetts 292 1 274 1 1041 29 22.4 Michigan 277 32 261 31 1136 10 21.4 Minnesota 290 2 268 9 1180 6 22.2 Mississippi 262 50 251 47 1109 18 18.8 Missouri 276 33 265 21 1172 7 21.5 Montana 286 6 269 5 1076 24 21.7 Nebraska 284 11 267 14 1145 9 21.7 Nevada 270 42 253 44 1021 36 21.2 New Hampshire 285 9 270 2 1043 28 22.5 New Jersey 284 10 269 5 1015 38 21.2 New Mexico 263 48 251 47 1097 20 20.1 New York 280 27 265 20 1007 39 22.3 North Carolina 282 16 258 36 1006 41 20.3 North Dakota 287 5 270 4 1183 3 21.2 Ohio 283 14 267 12 1080 22 21.4 Oklahoma 271 41 260 33 1135 11 20.6 Oregon 282 15 263 27 1055 26 22.5 Pennsylvania 281 21 267 12 1003 44 21.8 Rhode Island 272 37 261 30 1005 43 21.9 South Carolina 281 24 257 39 986 50 19.3 South Dakota 287 4 269 8 1191 2 21.5 Tennessee 271 40 259 35 1124 13 20.5 Texas 281 21 258 37 992 48 20.2 Utah 279 28 262 28 1121 15 21.5 Vermont 287 3 269 5 1028 33 22.7 Virginia 284 13 268 10 1024 35 20.9 Washington 285 7 265 19 1059 25 22.5 West Virginia 269 44 255 43 1038 30 20.5 Wisconsin 285 7 266 17 1183 3 22.2 Wyoming 282 18 268 10 1097 20 21.4
2004 ACT

| 105
2003-2004 2003-2004 2003-2004 Pupil Per Schools per Students Teacher
Rank District Rank per School Rank Ratio Rank 6.4 510 15.5
44 12.0 12 482 22 12.6 328 9.8 16 259 45 17.2 4220 3.7 42 497 20 21.3 5039 3.7 42 392 36 14.7 2217 9.2 19 699 3 21.1 4940 9.5 17 445 29 16.9 40
3 6.5 29 531 17 13.6 1020 10.6 15 579 11 15.2 2851 204.0 2 373 38 13.8 1536 49.5 4 766 1 17.9 4347 11.1 14 747 2 15.7 3214 283.0 1 650 5 16.5 3828 6.0 33 362 39 17.9 4340 4.8 37 486 21 16.5 3917 6.8 27 505 19 16.9 4011 4.1 41 321 43 13.8 1517 4.7 38 329 42 14.4 1940 8.3 21 454 28 16.1 3648 23.5 6 472 25 14.4 19
2 2.5 47 292 44 11.5 234 58.5 3 617 6 15.8 34
7 5.8 34 516 18 13.6 1025 7.3 25 443 30 18.1 45
9 5.1 36 400 33 16.3 3750 6.8 27 474 24 15.1 2520 4.5 39 388 37 13.9 1714 2.0 50 173 50 14.4 1914 2.4 48 223 48 13.6 1030 31.9 5 682 4 19.0 46
3 2.7 46 439 31 13.7 1430 3.7 42 558 15 12.7 446 9.1 20 396 34 15.0 23
8 7.0 26 589 10 13.3 740 19.3 8 592 9 15.1 2530 2.4 48 197 49 12.7 425 6.5 29 463 26 15.2 2835 3.4 45 344 41 16.0 35
3 6.4 32 439 32 20.6 4813 6.5 29 559 14 15.2 2812 9.3 18 475 23 13.4 949 12.9 11 604 8 15.3 3120 4.3 40 171 51 13.6 1036 12.0 12 559 13 15.7 3244 7.6 23 540 16 15.0 2320 20.1 7 609 7 22.4 51
1 1.3 51 255 46 11.3 133 15.2 9 573 12 13.2 6
3 7.5 24 459 27 19.3 4736 14.6 10 351 40 14.0 18
9 5.2 35 395 35 15.1 2525 8.1 22 227 47 13.3 7
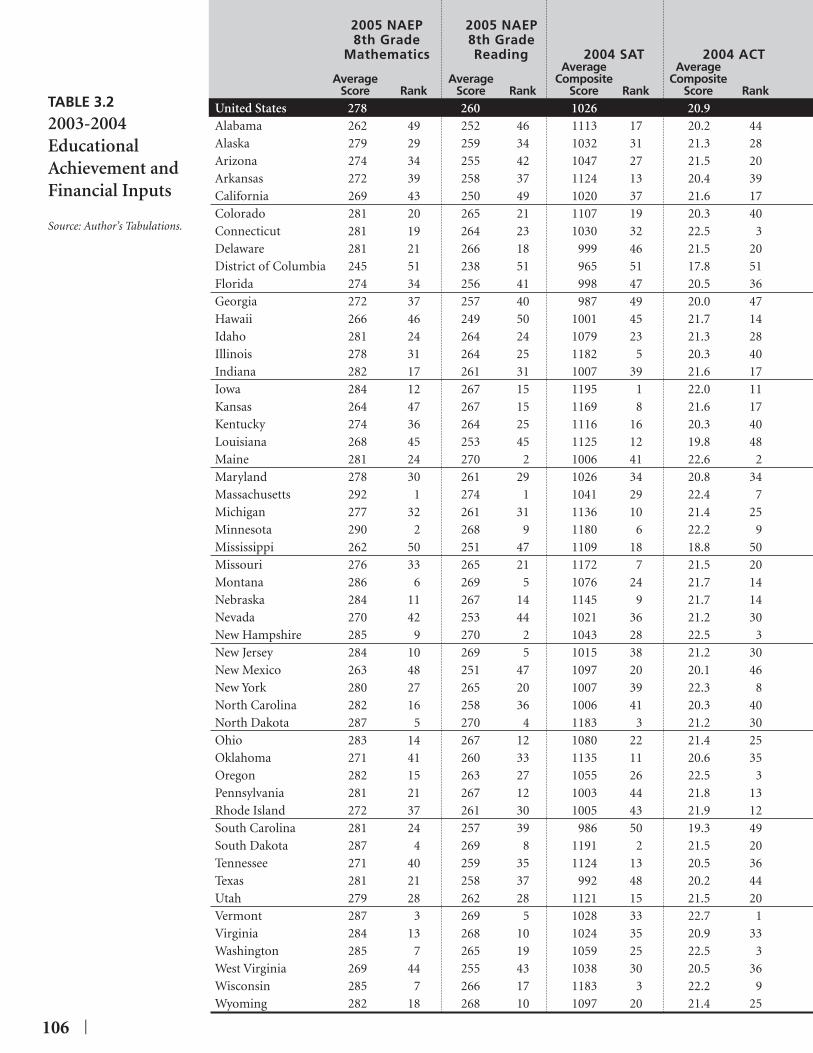
106 |
2005 NAEP 2005 NAEP 8th Grade 8th Grade Mathematics Reading 2004 SAT 2004 ACT Average Average Average Average Composite Composite Score Rank Score Rank Score Rank Score Rank United States 278 260 1026 20.9 Alabama 262 49 252 46 1113 17 20.2 44 Alaska 279 29 259 34 1032 31 21.3 28 Arizona 274 34 255 42 1047 27 21.5 20 Arkansas 272 39 258 37 1124 13 20.4 39 California 269 43 250 49 1020 37 21.6 17 Colorado 281 20 265 21 1107 19 20.3 40 Connecticut 281 19 264 23 1030 32 22.5 3 Delaware 281 21 266 18 999 46 21.5 20 District of Columbia 245 51 238 51 965 51 17.8 51 Florida 274 34 256 41 998 47 20.5 36 Georgia 272 37 257 40 987 49 20.0 47 Hawaii 266 46 249 50 1001 45 21.7 14 Idaho 281 24 264 24 1079 23 21.3 28 Illinois 278 31 264 25 1182 5 20.3 40 Indiana 282 17 261 31 1007 39 21.6 17 Iowa 284 12 267 15 1195 1 22.0 11 Kansas 264 47 267 15 1169 8 21.6 17 Kentucky 274 36 264 25 1116 16 20.3 40 Louisiana 268 45 253 45 1125 12 19.8 48 Maine 281 24 270 2 1006 41 22.6 2 Maryland 278 30 261 29 1026 34 20.8 34 Massachusetts 292 1 274 1 1041 29 22.4 7 Michigan 277 32 261 31 1136 10 21.4 25 Minnesota 290 2 268 9 1180 6 22.2 9 Mississippi 262 50 251 47 1109 18 18.8 50 Missouri 276 33 265 21 1172 7 21.5 20 Montana 286 6 269 5 1076 24 21.7 14 Nebraska 284 11 267 14 1145 9 21.7 14 Nevada 270 42 253 44 1021 36 21.2 30 New Hampshire 285 9 270 2 1043 28 22.5 3 New Jersey 284 10 269 5 1015 38 21.2 30 New Mexico 263 48 251 47 1097 20 20.1 46 New York 280 27 265 20 1007 39 22.3 8 North Carolina 282 16 258 36 1006 41 20.3 40 North Dakota 287 5 270 4 1183 3 21.2 30 Ohio 283 14 267 12 1080 22 21.4 25 Oklahoma 271 41 260 33 1135 11 20.6 35 Oregon 282 15 263 27 1055 26 22.5 3 Pennsylvania 281 21 267 12 1003 44 21.8 13 Rhode Island 272 37 261 30 1005 43 21.9 12 South Carolina 281 24 257 39 986 50 19.3 49 South Dakota 287 4 269 8 1191 2 21.5 20 Tennessee 271 40 259 35 1124 13 20.5 36 Texas 281 21 258 37 992 48 20.2 44 Utah 279 28 262 28 1121 15 21.5 20 Vermont 287 3 269 5 1028 33 22.7 1 Virginia 284 13 268 10 1024 35 20.9 33 Washington 285 7 265 19 1059 25 22.5 3 West Virginia 269 44 255 43 1038 30 20.5 36 Wisconsin 285 7 266 17 1183 3 22.2 9 Wyoming 282 18 268 10 1097 20 21.4 25
TABLE 3.2
2003-2004 Educational Achievement and Financial Inputs
Source: Author’s Tabulations.

| 107
2003-2004 2003-2004Percent of 2003-2004 Average
Funds From Per Pupil Instructional Federal Sources Rank Expenditures Rank Staff Salary Rank
8.52% $9,052 $44,133 11.55% 11 $7,110 44 $38,325 43 17.71% 1 $11,833 5 $51,736 11 11.42% 12 $6,704 48 $41,843 28 11.72% 10 $7,117 43 $39,314 38 9.87% 18 $8,728 25 $56,444 3 6.50% 44 $8,486 30 $43,319 22 5.21% 49 $12,426 4 $57,337 1 8.60% 29 $11,229 6 $49,366 13 13.76% 7 $14,190 1 $57,009 2 10.53% 15 $7,610 39 $40,604 31 8.06% 32 $8,804 23 $45,988 16 8.20% 31 $8,733 24 $45,479 18 9.81% 20 $6,757 47 $41,080 30 8.45% 30 $9,580 19 $54,230 7 7.64% 36 $8,894 22 $45,791 17 7.44% 37 $8,602 28 $39,432 37 9.10% 23 $8,028 36 $38,623 40 10.59% 14 $6,913 45 $40,240 34 13.21% 8 $7,583 40 $37,918 46 8.95% 26 $10,294 12 $39,864 35 6.72% 41 $9,945 15 $50,261 12 5.98% 47 $10,926 8 $53,181 8 7.84% 34 $10,595 10 $54,412 6 5.93% 48 $9,922 16 $45,375 20 15.41% 3 $6,255 50 $35,684 48 8.04% 33 $8,521 29 $38,006 45 14.50% 6 $8,150 35 $37,184 47 8.85% 27 $9,191 20 $38,352 42 7.05% 38 $7,379 41 $42,254 26 5.21% 50 $9,656 18 $42,689 25 4.26% 51 $13,674 2 $55,592 4 14.99% 5 $8,351 32 $38,067 44 6.98% 39 $13,672 3 $55,181 5 9.59% 21 $7,222 42 $43,211 23 15.27% 4 $7,846 37 $35,441 49 6.43% 45 $10,107 14 $47,482 15 12.70% 9 $6,536 49 $35,061 50 9.05% 24 $8,690 26 $49,169 14 7.75% 35 $10,208 13 $51,835 10 6.51% 43 $10,773 9 $52,261 9 9.83% 19 $8,348 33 $41,162 29 15.69% 2 $7,780 38 $33,236 51 10.03% 16 $6,787 46 $40,318 33 9.88% 17 $8,182 34 $40,476 32 9.26% 22 $5,853 51 $38,976 39 6.96% 40 $11,054 7 $42,007 27 6.60% 42 $8,675 27 $43,655 21 8.96% 25 $8,424 31 $45,434 19 10.65% 13 $9,056 21 $38,461 41 6.06% 46 $9,899 17 $42,882 24 8.79% 28 $10,340 11 $39,532 36

108 |
2005 NAEP 2005 NAEP 2003-2004 2003-2004 8th Grade 8th Grade Pupil Per Schools Mathematics Reading 2004 SAT 2004 ACT Teacher Ratio Per District Rank Rank Rank Rank Rank Rank
Alabama 49 46 17 44 3 12 Alaska 29 34 31 28 42 16 Arizona 34 42 27 20 50 42 Arkansas 39 37 13 39 22 42 California 43 49 37 17 49 19 Colorado 20 21 19 40 40 17 Connecticut 19 23 32 3 10 29 Delaware 21 18 46 20 28 15 District of Columbia 51 51 51 51 15 2 Florida 34 41 47 36 43 4 Georgia 37 40 49 47 32 14 Hawaii 46 50 45 14 38 1 Idaho 24 24 23 28 43 33 Illinois 31 25 5 40 39 37 Indiana 17 31 39 17 40 27 Iowa 12 15 1 11 15 41 Kansas 47 15 8 17 19 38 Kentucky 36 25 16 40 36 21 Louisiana 45 45 12 48 19 6 Maine 24 2 41 2 2 47 Maryland 30 29 34 34 34 3 Massachusetts 1 1 29 7 10 34 Michigan 32 31 10 25 45 25 Minnesota 2 9 6 9 37 36 Mississippi 50 47 18 50 25 27 Missouri 33 21 7 20 17 39 Montana 6 5 24 14 19 50 Nebraska 11 14 9 14 10 48 Nevada 42 44 36 30 46 5 New Hampshire 9 2 28 3 14 46 New Jersey 10 5 38 30 4 42 New Mexico 48 47 20 46 23 20 New York 27 20 39 8 7 26 North Carolina 16 36 41 40 25 8 North Dakota 5 4 3 30 4 48 Ohio 14 12 22 25 28 29 Oklahoma 41 33 11 35 35 45 Oregon 15 27 26 3 48 32 Pennsylvania 21 12 44 13 28 29 Rhode Island 37 30 43 12 9 18 South Carolina 24 39 50 49 31 11 South Dakota 4 8 2 20 10 40 Tennessee 40 35 13 36 32 12 Texas 21 37 48 44 23 23 Utah 28 28 15 20 51 7 Vermont 3 5 33 1 1 51 Virginia 13 10 35 33 6 9 Washington 7 19 25 3 47 24 West Virginia 44 43 30 36 18 10 Wisconsin 7 17 3 9 25 35 Wyoming 18 10 20 25 7 22
TABLE 3.3
State-by-State Ranking on Educational Inputs and Outputs
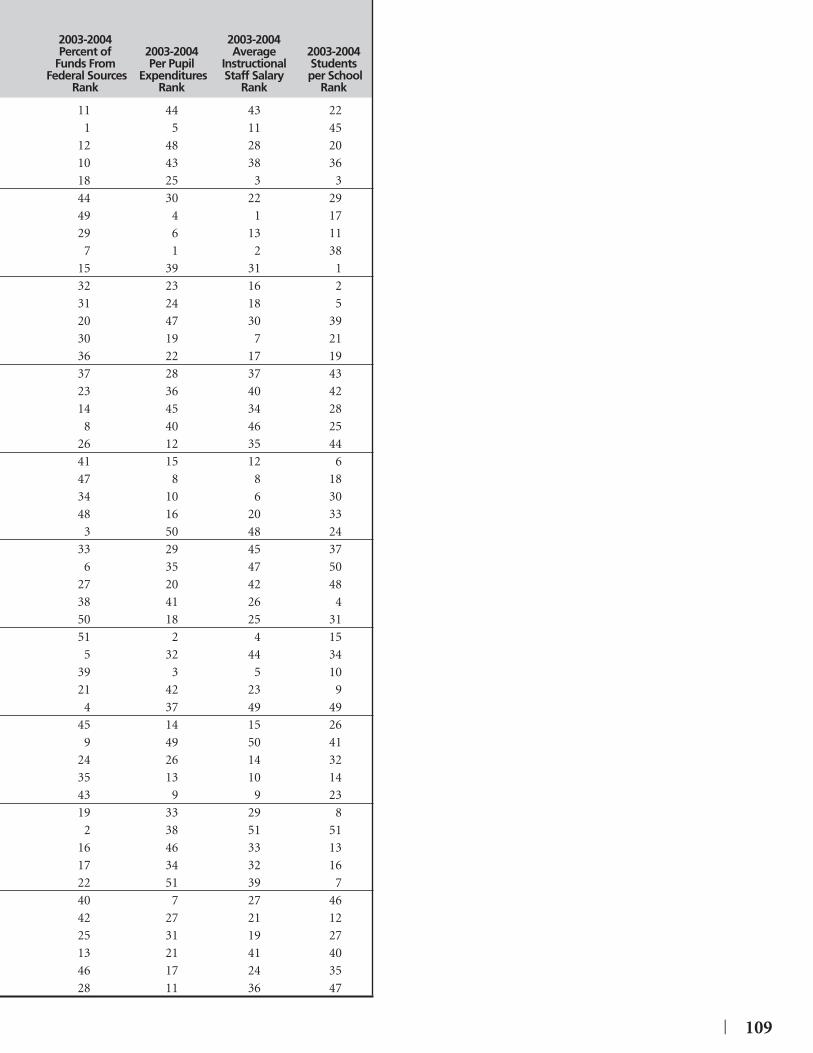
| 109
2003-2004 2003-2004Percent of 2003-2004 Average 2003-2004
Funds From Per Pupil Instructional Students Federal Sources Expenditures Staff Salary per School
Rank Rank Rank Rank
11 44 43 221 5 11 45
12 48 28 2010 43 38 3618 25 3 344 30 22 2949 4 1 1729 6 13 11
7 1 2 3815 39 31 132 23 16 231 24 18 520 47 30 3930 19 7 2136 22 17 1937 28 37 4323 36 40 4214 45 34 28
8 40 46 2526 12 35 4441 15 12 647 8 8 1834 10 6 3048 16 20 33
3 50 48 2433 29 45 37
6 35 47 5027 20 42 4838 41 26 450 18 25 3151 2 4 15
5 32 44 3439 3 5 1021 42 23 9
4 37 49 4945 14 15 26
9 49 50 4124 26 14 3235 13 10 1443 9 9 2319 33 29 8
2 38 51 5116 46 33 1317 34 32 1622 51 39 740 7 27 4642 27 21 1225 31 19 2713 21 41 4046 17 24 3528 11 36 47

110 |
Percent Change 1984-2004 Percent in Average Percent Change Instructional Change in Pupil per Staff Salary SAT Scores Rank Teacher Ratio Rank (in Constant Dollars) Rank
United States 2.70% -10.88% -1.07% Alabama 10.31% 1 -6.86% 34 -8.41% 42 Alaska -1.43% 43 -22.16% 4 -27.56% 51 Arizona -6.35% 51 -21.53% 5 -6.34% 38 Arkansas 2.55% 22 -11.56% 23 9.46% 7 California 2.10% 27 -5.33% 41 5.31% 13 Colorado 1.65% 30 -5.85% 38 -9.07% 43 Connecticut 1.58% 31 -21.11% 7 17.10% 1 Delaware -1.87% 44 -4.27% 45 8.96% 9 District of Columbia 8.79% 5 -7.14% 33 -6.71% 39 Florida 0.20% 37 -13.64% 17 -0.82% 28 Georgia 6.36% 8 -16.00% 14 6.54% 11 Hawaii 2.98% 18 -5.00% 43 -4.37% 33 Idaho 7.15% 7 2.99% 49 6.47% 12 Illinois 10.06% 2 -6.75% 35 9.58% 6 Indiana 2.86% 19 -11.26% 24 2.31% 22 Iowa 1.70% 29 -10.97% 25 -1.20% 29 Kansas 1.92% 28 -19.25% 10 -7.30% 40 Kentucky 3.05% 17 -8.26% 28 4.40% 17 Louisiana 5.53% 11 -15.24% 15 1.50% 25 Maine 0.10% 38 -6.49% 36 10.63% 4 Maryland 2.29% 26 -7.36% 32 1.92% 24 Massachusetts 3.89% 13 -13.61% 18 8.02% 10 Michigan 6.17% 9 -16.93% 12 -3.38% 31 Minnesota 3.51% 15 -12.25% 22 -9.87% 44 Mississippi 2.69% 21 -20.53% 9 4.99% 16 Missouri 9.33% 4 -7.60% 31 -5.88% 36 Montana -5.28% 50 15.76% 51 -10.11% 46 Nebraska 2.42% 24 -5.00% 44 2.21% 23 Nevada -3.04% 45 -13.44% 19 -10.33% 47 New Hampshire 0.68% 36 -5.17% 42 14.50% 2 New Jersey 3.78% 14 -7.65% 30 11.20% 3 New Mexico -0.90% 42 -5.56% 40 -5.17% 34 New York -0.01% 40 2.29% 48 -1.64% 30 North Carolina 8.76% 6 -7.69% 29 5.12% 15 North Dakota 2.34% 25 -6.32% 37 -7.47% 41 Ohio 1.50% 32 -8.50% 27 5.25% 14 Oklahoma 2.53% 23 -12.79% 21 -11.04% 48 Oregon 4.15% 12 -9.93% 26 4.14% 18 Pennsylvania 0.10% 38 -13.84% 16 8.97% 8 Rhode Island 0.90% 35 -21.43% 6 -3.62% 32 South Carolina 9.80% 3 -3.50% 46 3.59% 19 South Dakota 1.45% 33 -25.81% 3 -0.18% 27 Tennessee 3.12% 16 -0.73% 47 2.47% 21 Texas -0.10% 40 -12.82% 20 -10.08% 45 Utah -4.43% 49 -21.05% 8 -6.28% 37 Vermont 1.38% 34 -16.02% 13 9.78% 5 Virginia 2.71% 20 12.57% 50 2.73% 20 Washington -4.34% 48 -26.99% 2 -5.79% 35 West Virginia -3.17% 46 -16.99% 11 1.34% 26 Wisconsin 6.01% 10 -36.36% 1 -11.54% 49 Wyoming -3.26% 47 -5.73% 39 -21.08% 50
TABLE 3.4
Trend Relationships 1983-1984 to 2003-2004
Source: Author’s Tabulations

| 111
PercentChange in Percent PercentPer Pupil Change in Change in
Expenditures Schools Students(in Constant Dollars) Rank per District Rank per School Rank
77.37% 18.43% 3.54% 86.63% 21 9.46% 13 -0.62% 21
0.37% 51 17.04% 29 12.70% 4147.72% 49 38.88% 47 19.48% 48
107.49% 6 37.14% 44 2.61% 2874.58% 32 15.71% 24 18.42% 4654.88% 44 17.20% 30 1.33% 2587.48% 20 16.14% 25 -12.17% 488.56% 17 16.38% 26 -2.30% 17
100.41% 10 0.47% 1 -31.34% 164.15% 39 4.68% 6 4.97% 31
135.49% 2 11.05% 16 21.12% 5057.95% 40 0.49% 2 -1.17% 1988.90% 16 23.27% 37 11.01% 3987.87% 18 22.22% 33 -2.24% 18
111.37% 5 13.09% 19 -5.75% 1456.82% 41 22.86% 35 1.90% 2655.36% 43 16.49% 27 14.41% 4296.07% 11 13.15% 20 -8.89% 771.85% 35 4.47% 5 -6.37% 12
140.77% 1 28.54% 41 0.34% 2473.39% 34 1.69% 3 0.30% 2385.86% 22 11.81% 17 10.91% 3875.07% 29 11.89% 18 -13.58% 382.24% 23 38.15% 46 -19.63% 276.36% 28 13.36% 21 4.44% 30
106.75% 7 25.93% 38 -5.71% 1548.27% 47 67.92% 51 -11.91% 574.71% 31 60.01% 50 19.19% 4764.49% 38 10.40% 14 23.71% 51
106.31% 8 32.69% 42 16.55% 4595.44% 12 22.33% 34 -7.11% 1070.62% 36 15.56% 23 -4.47% 1679.94% 24 16.57% 28 -8.15% 992.79% 13 8.75% 10 2.27% 2755.95% 42 52.52% 49 14.48% 43
117.00% 4 13.70% 22 -11.12% 633.92% 50 34.50% 43 7.25% 3248.17% 48 37.34% 45 19.54% 4974.14% 33 9.30% 11 8.07% 3574.94% 30 10.93% 15 -0.65% 20
135.45% 3 7.34% 7 7.93% 3477.17% 27 26.15% 39 -8.47% 891.14% 14 8.25% 8 10.55% 3777.67% 26 28.33% 40 7.60% 3370.41% 37 9.44% 12 15.40% 44
101.95% 9 52.16% 48 8.26% 3687.65% 19 8.66% 9 -5.85% 1351.95% 46 23.09% 36 -0.53% 2289.76% 15 2.85% 4 11.21% 4079.78% 25 17.75% 32 4.18% 2953.17% 45 17.56% 31 -6.38% 11

112 |

| 113
CHAPTER FOUR
Demographics, Charter Schools and
School Choice
ALECAmerican Legislative Exchange Council

114 |
Numerous factors that directly affect the basic structure of this country’s primary and secondary education system, and indirectly impact student
achievement are the result of general demographic changes. Increases in population in general, and students in particular, can place great stress on a state’s or local school district’s existing educational infrastructure. Other factors such as rising unemployment, deepening poverty, or a shrinking tax base can all factor into a states educational equation.
Note: Many of the basic educational demographic factors can be found in the “State Snapshot” section of this report.
Public School Enrollment
Many states, particularly in the south and west, have experienced dramatic growth in their public school enrollment over the past two decades, while many northeastern states have experienced signifi cant losses in student population. This can be explained by looking at the general shift in U.S. population over the past twenty years from the north and east to the southern and western states. Nevada has seen its public school enrollment increase an astonishing 156.2 percent since the 1983-1984 school year. The next closest state, Arizona, saw its student enrollment grow by a robust 99.7 percent. Over the same twenty-year period, eight states saw declines in their student population, with West Virginia having the largest decline of –24.3 percent (See table 4.3). Dramatic increases or
decreases in student enrollment can pose unique challenges to school districts and states as they either rush to fi ll open teacher slots or construct new buildings, or fi nd themselves with unused buildings and an excess of teachers.
Nationally, during the 2003-2004 school year, there were approximately 48.5 million children enrolled in public schools. This represents a 23.4 percent increase since the 1983-1984 school year when approximately 39.3 million children were enrolled in public schools (See table 4.2 and 4.3).
States experiencing the greatest increases in student enrollment between the 1983-1984 and 2003-2004 school years: Nevada (156.2 percent), Arizona (99.7 percent), Florida (73.0 percent), California (56.9 percent), Texas and Georgia (44.9 percent), Colorado (39.8 percent), Washington (38.7 percent), Alaska (36.4 percent), and Utah (31.1 percent).
The eight states experiencing a decline in student enrollment between the 1983-1984 and 2003-2004 school years: West Virginia (-24.3 percent), North Dakota (-12.8 percent), the District of Columbia (-12.1 percent), Wyoming (-11.9 percent), Louisiana (-9.1 percent), Maine (-3.7 percent), Montana (-3.4 percent), and Iowa (-3.2 percent).
The National Center for Education Statistics (NCES) – the research branch of the Department of Education – estimates that between 2001 and 2011, public elementary and secondary school enrollment will increase by approximately 2.9
C H A P T E R F O U R

| 115
percent nationwide. In addition, NCES’s forecast predicts a continuation of the current demographic shift in student enrollment from the north and east regions of the country to the west and southwest. 1
Charter Schools
Since 1991, 41 states and the District of Columbia have passed charter school laws that grant individual public schools greater autonomy in establishing curricula, recruiting students, and setting achievement standards. The dramatic growth of charter schools over the past decade can be directly attributed to the growing demand by parents for greater educational alternatives for their children.
As of Fall 2005 there were 3,617 charter schools in operation in the chartering states (including the District of Columbia), enrolling approximately 1,074,809 students (See Table 4.6). This represents a 67 percent increase in the number of charter schools over the past fi ve academic years—showing that the charter school movement is gaining in momentum and acceptance throughout America. Charter school students made up slightly over one percent of the entire public school enrollment in the United States during the 2003-04 school year, doubling their numbers from 0.5 percent during the 1996-97 school year.
The effectiveness and growth of charter schools within a state depends on the strength of that specifi c state’s charter law. The Center for Education Reform ranks the 40 states and the District of Columbia on a yearly basis to determine the relative strength or weakness of each state’s charter school law (See Table 4.6). Measures of a charter law’s strength are:
■ Number of charter schools permitted;
■ Creation of multiple chartering authorities and a binding appeals process;
■ Wide variety of acceptable applicants to run charter schools allowed;
■ New start-ups permitted;
■ Formal evidence of local support is not required of new charter schools;
■ Automatic waiver from laws and regulations extended to charter schools;
■ Charter schools enjoy relative legal and operational autonomy;
■ New charter schools guaranteed full funding;
■ Charter schools given full autonomy over fi scal matters; and
■ Exemption from collective bargaining and district work rules extended to charters.
The results of ranking the 41 chartering states by these ten criteria are displayed in Table 4.7. According to the Center for Education Reform’s latest ranking the District of Columbia, Minnesota, Delaware, Arizona, Michigan, Indiana, and California have the strongest charter school laws—all receiving an “A” grade. Mississippi and Iowa have the weakest charter school laws—both receiving an “F” grade.
Minority enrollment in charter schools varies widely from state to state. In the District of Columbia, 100 percent of charter school students are black. In Texas, a majority of students in charter schools are Hispanic. And in Colorado, 77.9 percent of charter school students are white. Nationwide however, the percentage of enrollment by race in charter schools does not differ substantially from the percent enrollment by race in all public schools (See Figure 4.2).
———1. U.S. Department of Education, National Center for Education Statistics,
The NCES Common Core of Data surveys, Various Years; National Elementary and Secondary Enrollment Model. Prepared July 2003.

116 |
KINDERGARTEN THROUGH GRADE 8 AND ELEMENTARY UNGRADED
Total All Total Grades Grades K-8 Kindergarten Grade 1 Grade 2 Grade 3
United States 48,540,725 34,202,239 3,503,280 3,612,509 3,543,781 3,611,041 Alabama 731,220 525,313 56,541 58,064 54,935 56,429 Alaska 133,933 93,695 9,475 9,675 9,501 9,735 Arizona 1,012,068 704,327 76,365 77,612 76,617 75,422 Arkansas 454,523 321,509 36,391 35,615 34,242 33,642 California 6,413,862 4,540,362 456,941 481,035 482,626 489,642 Colorado 757,693 536,325 55,913 57,030 56,188 55,840 Connecticut 577,203 407,794 42,310 43,250 43,102 43,124 Delaware 117,668 82,898 7,904 9,051 8,712 8,898 DC 78,057 59,482 5,659 5,804 5,723 5,611 Florida 2,587,628 1,832,376 191,986 194,449 188,585 210,301 Georgia 1,522,611 1,103,181 118,849 117,282 113,706 115,849 Hawaii 183,609 130,054 13,779 13,852 14,305 14,291 Idaho 252,120 175,424 18,590 18,805 18,924 18,531 Illinois 2,100,961 1,492,730 146,803 155,142 154,191 161,329 Indiana 1,011,130 716,825 72,315 79,406 78,267 77,281 Iowa 481,226 326,846 35,295 33,296 33,330 33,326 Kansas 470,490 322,575 33,677 33,314 32,964 33,436 Kentucky 663,885 478,258 48,182 51,999 46,957 46,957 Louisiana 727,709 536,390 56,629 57,028 53,021 55,554 Maine 202,084 139,420 14,021 14,117 14,073 14,350 Maryland 869,113 605,905 55,485 62,341 61,767 63,195 Massachusetts 980,459 692,130 69,704 72,667 71,840 73,614 Michigan 1,757,604 1,229,121 130,527 124,238 122,469 125,417 Minnesota 842,854 564,049 59,330 58,055 57,610 58,720 Mississippi 493,540 360,913 38,340 39,300 37,396 38,053 Missouri 905,941 632,230 66,509 65,711 65,061 65,507 Montana 148,356 100,160 10,147 10,295 10,319 10,416 Nebraska 285,542 195,417 20,719 20,249 20,145 20,279 Nevada 385,401 280,735 28,596 30,595 30,518 31,175 New Hampshire 207,417 142,033 9,989 15,364 14,951 15,403 New Jersey 1,380,753 978,589 93,201 99,969 98,078 100,088 New Mexico 323,066 226,032 23,636 24,165 23,518 23,769 New York 2,864,775 1,978,673 188,638 201,645 201,482 205,635 North Carolina 1,360,209 974,019 109,336 107,376 103,063 103,725 North Dakota 102,233 67,870 6,891 7,139 7,053 7,041 Ohio 1,845,428 1,278,202 134,036 134,611 131,269 134,403 Oklahoma 626,160 450,319 46,542 49,434 44,076 44,272 Oregon 551,273 378,072 38,785 40,400 40,749 40,864 Pennsylvania 1,821,146 1,235,624 118,647 127,988 128,030 131,904 Rhode Island 159,375 111,209 10,702 11,891 11,745 11,770 South Carolina 699,198 500,743 50,985 52,555 50,539 51,634 South Dakota 125,537 86,015 9,201 8,869 8,818 8,762 Tennessee 936,681 675,276 73,202 71,581 68,746 69,911 Texas 4,331,751 3,132,584 323,502 338,727 325,943 323,373 Utah 495,981 348,890 39,348 38,485 37,380 36,935 Vermont 99,103 66,732 6,078 6,517 6,558 6,767 Virginia 1,192,092 837,258 86,374 87,674 87,430 88,870 Washington 1,021,349 699,248 70,663 73,989 72,558 74,394 West Virginia 281,215 198,836 20,946 20,446 19,846 20,559 Wisconsin 880,031 589,812 59,372 58,368 58,877 59,196 Wyoming 87,462 59,759 6,224 6,039 5,978 5,842
Table 4.1
Enrollment in Public Elementary and Secondary Schools, by Level and Grade: Fall 2004
SOURCE: U.S. Department of Education, National Center for Education Statistics, The NCES Common Core of Data (CCD), “State Nonfi scal Survey of Public Elementary/Secondary Education,” 2004-05. (This table was prepared July 2005.)
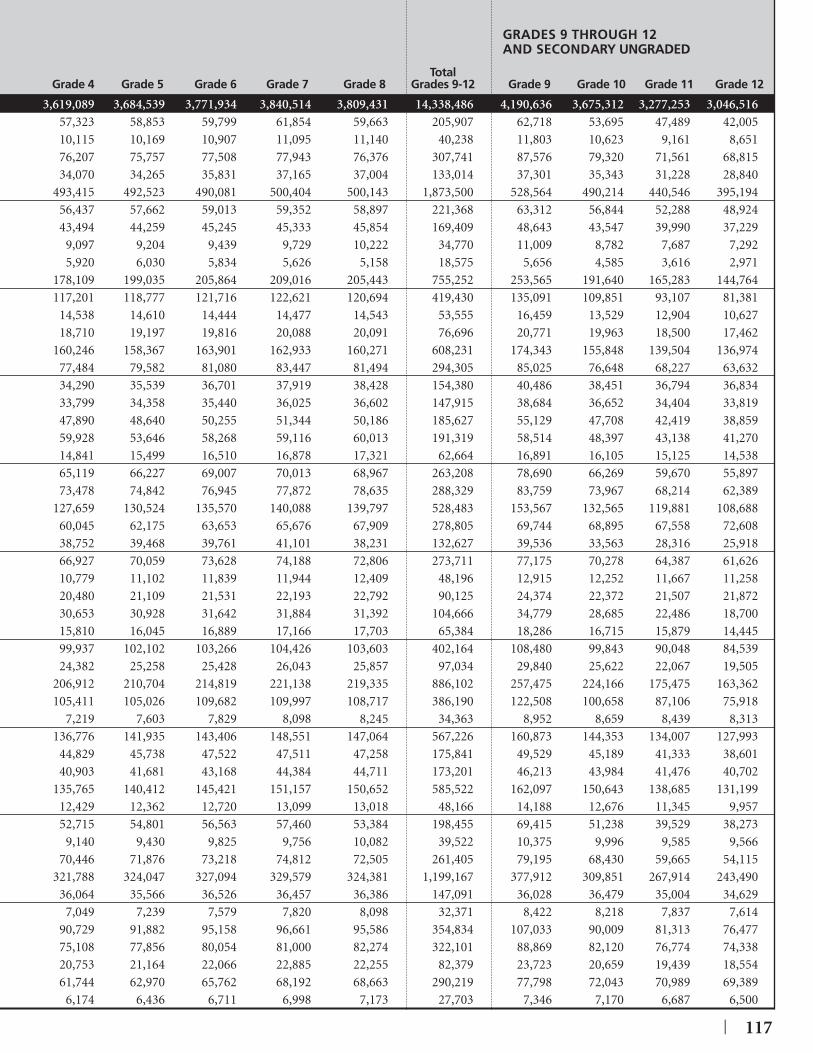
| 117
GRADES 9 THROUGH 12 AND SECONDARY UNGRADED
Total Grade 4 Grade 5 Grade 6 Grade 7 Grade 8 Grades 9-12 Grade 9 Grade 10 Grade 11 Grade 12
3,619,089 3,684,539 3,771,934 3,840,514 3,809,431 14,338,486 4,190,636 3,675,312 3,277,253 3,046,51657,323 58,853 59,799 61,854 59,663 205,907 62,718 53,695 47,489 42,00510,115 10,169 10,907 11,095 11,140 40,238 11,803 10,623 9,161 8,65176,207 75,757 77,508 77,943 76,376 307,741 87,576 79,320 71,561 68,81534,070 34,265 35,831 37,165 37,004 133,014 37,301 35,343 31,228 28,840
493,415 492,523 490,081 500,404 500,143 1,873,500 528,564 490,214 440,546 395,19456,437 57,662 59,013 59,352 58,897 221,368 63,312 56,844 52,288 48,92443,494 44,259 45,245 45,333 45,854 169,409 48,643 43,547 39,990 37,229
9,097 9,204 9,439 9,729 10,222 34,770 11,009 8,782 7,687 7,2925,920 6,030 5,834 5,626 5,158 18,575 5,656 4,585 3,616 2,971
178,109 199,035 205,864 209,016 205,443 755,252 253,565 191,640 165,283 144,764117,201 118,777 121,716 122,621 120,694 419,430 135,091 109,851 93,107 81,381
14,538 14,610 14,444 14,477 14,543 53,555 16,459 13,529 12,904 10,62718,710 19,197 19,816 20,088 20,091 76,696 20,771 19,963 18,500 17,462
160,246 158,367 163,901 162,933 160,271 608,231 174,343 155,848 139,504 136,97477,484 79,582 81,080 83,447 81,494 294,305 85,025 76,648 68,227 63,63234,290 35,539 36,701 37,919 38,428 154,380 40,486 38,451 36,794 36,83433,799 34,358 35,440 36,025 36,602 147,915 38,684 36,652 34,404 33,81947,890 48,640 50,255 51,344 50,186 185,627 55,129 47,708 42,419 38,85959,928 53,646 58,268 59,116 60,013 191,319 58,514 48,397 43,138 41,27014,841 15,499 16,510 16,878 17,321 62,664 16,891 16,105 15,125 14,53865,119 66,227 69,007 70,013 68,967 263,208 78,690 66,269 59,670 55,89773,478 74,842 76,945 77,872 78,635 288,329 83,759 73,967 68,214 62,389
127,659 130,524 135,570 140,088 139,797 528,483 153,567 132,565 119,881 108,68860,045 62,175 63,653 65,676 67,909 278,805 69,744 68,895 67,558 72,60838,752 39,468 39,761 41,101 38,231 132,627 39,536 33,563 28,316 25,91866,927 70,059 73,628 74,188 72,806 273,711 77,175 70,278 64,387 61,62610,779 11,102 11,839 11,944 12,409 48,196 12,915 12,252 11,667 11,25820,480 21,109 21,531 22,193 22,792 90,125 24,374 22,372 21,507 21,87230,653 30,928 31,642 31,884 31,392 104,666 34,779 28,685 22,486 18,70015,810 16,045 16,889 17,166 17,703 65,384 18,286 16,715 15,879 14,44599,937 102,102 103,266 104,426 103,603 402,164 108,480 99,843 90,048 84,53924,382 25,258 25,428 26,043 25,857 97,034 29,840 25,622 22,067 19,505
206,912 210,704 214,819 221,138 219,335 886,102 257,475 224,166 175,475 163,362105,411 105,026 109,682 109,997 108,717 386,190 122,508 100,658 87,106 75,918
7,219 7,603 7,829 8,098 8,245 34,363 8,952 8,659 8,439 8,313136,776 141,935 143,406 148,551 147,064 567,226 160,873 144,353 134,007 127,993
44,829 45,738 47,522 47,511 47,258 175,841 49,529 45,189 41,333 38,60140,903 41,681 43,168 44,384 44,711 173,201 46,213 43,984 41,476 40,702
135,765 140,412 145,421 151,157 150,652 585,522 162,097 150,643 138,685 131,19912,429 12,362 12,720 13,099 13,018 48,166 14,188 12,676 11,345 9,95752,715 54,801 56,563 57,460 53,384 198,455 69,415 51,238 39,529 38,273
9,140 9,430 9,825 9,756 10,082 39,522 10,375 9,996 9,585 9,56670,446 71,876 73,218 74,812 72,505 261,405 79,195 68,430 59,665 54,115
321,788 324,047 327,094 329,579 324,381 1,199,167 377,912 309,851 267,914 243,49036,064 35,566 36,526 36,457 36,386 147,091 36,028 36,479 35,004 34,629
7,049 7,239 7,579 7,820 8,098 32,371 8,422 8,218 7,837 7,61490,729 91,882 95,158 96,661 95,586 354,834 107,033 90,009 81,313 76,47775,108 77,856 80,054 81,000 82,274 322,101 88,869 82,120 76,774 74,33820,753 21,164 22,066 22,885 22,255 82,379 23,723 20,659 19,439 18,55461,744 62,970 65,762 68,192 68,663 290,219 77,798 72,043 70,989 69,389
6,174 6,436 6,711 6,998 7,173 27,703 7,346 7,170 6,687 6,500

118 |
Fall 2003 Rank Fall 1993 Rank Fall 1983 Rank
United States 48,540,725 43,464,916 39,252,308 Alabama 731,220 23 734,288 22 721,901 20 Alaska 133,933 45 125,948 46 98,206 48 Arizona 1,012,068 14 709,453 23 506,682 27 Arkansas 454,523 34 444,271 34 432,120 32 California 6,413,862 1 5,327,231 1 4,089,017 1 Colorado 757,693 22 625,062 26 542,196 26 Connecticut 577,203 28 496,298 31 477,585 29 Delaware 117,668 47 105,547 48 91,406 49 District of Columbia 78,057 51 80,678 51 88,843 51 Florida 2,587,628 4 2,040,763 4 1,495,543 8 Georgia 1,522,611 9 1,235,304 9 1,050,859 11 Hawaii 183,609 42 180,410 42 162,241 40 Idaho 252,120 39 236,774 38 206,352 39 Illinois 2,100,961 5 1,893,078 5 1,853,316 4 Indiana 1,011,130 15 965,633 13 984,384 12 Iowa 481,226 32 498,519 30 497,287 28 Kansas 470,490 33 457,614 33 405,222 33 Kentucky 663,885 26 655,265 24 647,414 23 Louisiana 727,709 24 800,560 20 800,193 16 Maine 202,084 41 216,995 40 209,753 38 Maryland 869,113 20 772,638 21 683,491 22 Massachusetts 980,459 16 877,726 15 878,844 14 Michigan 1,757,604 8 1,599,377 8 1,635,963 7 Minnesota 842,854 21 810,233 19 705,236 21 Mississippi 493,540 31 505,907 29 467,744 30 Missouri 905,941 18 866,378 17 795,453 17 Montana 148,356 44 163,009 43 153,646 42 Nebraska 285,542 37 285,097 37 266,998 37 Nevada 385,401 35 235,800 39 150,442 43 New Hampshire 207,417 40 185,360 41 159,030 41 New Jersey 1,380,753 10 1,151,307 10 1,147,841 9 New Mexico 323,066 36 322,292 35 269,711 36 New York 2,864,775 3 2,733,813 3 2,674,818 3 North Carolina 1,360,209 11 1,133,231 11 1,089,606 10 North Dakota 102,233 48 119,127 47 117,213 46 Ohio 1,845,428 6 1,807,319 6 1,827,300 5 Oklahoma 626,160 27 604,076 27 591,389 25 Oregon 551,273 29 516,611 28 447,109 31 Pennsylvania 1,821,146 7 1,744,082 7 1,737,952 6 Rhode Island 159,375 43 145,676 44 136,412 44 South Carolina 699,198 25 643,696 25 604,553 24 South Dakota 125,537 46 142,825 45 123,060 45 Tennessee 936,681 17 866,557 16 822,057 15 Texas 4,331,751 2 3,608,262 2 2,989,796 2 Utah 495,981 30 471,365 32 378,208 34 Vermont 99,103 49 102,755 49 90,416 50 Virginia 1,192,092 12 1,045,471 12 966,110 13 Washington 1,021,349 13 915,952 14 736,239 19 West Virginia 281,215 38 314,383 36 371,251 35 Wisconsin 880,031 19 844,001 18 774,646 18 Wyoming 87,462 50 100,899 50 99,254 47
TABLE 4.2
Enrollment in Public Elementary and Secondary Schools, by State: Fall 2003, 1993, and 1983
Sources: U.S. Department of Education, National Center for Education Statistics; Digest of Educational Statistics, 1983, 1993; Common Core of DATA.

| 119
Percent Percent Percent Change Change Change 1983-84 to 1993-94 to 1983-84 to 2003-04 Rank 2003-04 Rank 1993-94 Rank
United States 23.66% 11.68% 10.73% Nevada 156.18% 1 63.44% 1 56.74% 1Arizona 99.74% 2 42.65% 2 40.02% 2Florida 73.02% 3 26.80% 3 36.46% 3California 56.86% 4 20.40% 6 30.28% 4Georgia 44.89% 5 23.26% 4 17.55% 10Texas 44.88% 6 20.05% 7 20.69% 8Colorado 39.75% 7 21.22% 5 15.28% 15Washington 38.73% 8 11.51% 15 24.41% 7Alaska 36.38% 9 6.34% 24 28.25% 5Utah 31.14% 10 5.22% 25 24.63% 6New Hampshire 30.43% 11 11.90% 13 16.56% 11Delaware 28.73% 12 11.48% 16 15.47% 14Maryland 27.16% 13 12.49% 12 13.04% 19North Carolina 24.83% 14 20.03% 8 4.00% 31Virginia 23.39% 15 14.02% 11 8.21% 24Oregon 23.30% 16 6.71% 22 15.54% 13Idaho 22.18% 17 6.48% 23 14.74% 17Connecticut 20.86% 18 16.30% 10 3.92% 32New Jersey 20.29% 19 19.93% 9 0.30% 43New Mexico 19.78% 20 0.24% 38 19.50% 9Minnesota 19.51% 21 4.03% 31 14.89% 16Rhode Island 16.83% 22 9.40% 19 6.79% 26Kansas 16.11% 23 2.81% 33 12.93% 20South Carolina 15.66% 24 8.62% 20 6.47% 28Tennessee 13.94% 25 8.09% 21 5.41% 30Missouri 13.89% 26 4.57% 28 8.92% 23Wisconsin 13.60% 27 4.27% 30 8.95% 22Illinois 13.36% 28 10.98% 17 2.15% 36Hawaii 13.17% 29 1.77% 36 11.20% 21Massachusetts 11.56% 30 11.70% 14 -0.13% 46Vermont 9.61% 31 -3.55% 44 13.65% 18Michigan 7.44% 32 9.89% 18 -2.24% 49New York 7.10% 33 4.79% 26 2.21% 35Nebraska 6.95% 34 0.16% 39 6.78% 27Oklahoma 5.88% 35 3.66% 32 2.15% 36Mississippi 5.51% 36 -2.44% 41 8.16% 25Arkansas 5.18% 37 2.31% 34 2.81% 34Pennsylvania 4.79% 38 4.42% 29 0.35% 42Indiana 2.72% 39 4.71% 27 -1.90% 48Kentucky 2.54% 40 1.32% 37 1.21% 41South Dakota 2.01% 41 -12.10% 49 16.06% 12Alabama 1.29% 42 -0.42% 40 1.72% 38Ohio 0.99% 43 2.11% 35 -1.09% 47Iowa -3.23% 44 -3.47% 43 0.25% 44Montana -3.44% 45 -8.99% 46 6.09% 29Maine -3.66% 46 -6.87% 45 3.45% 33Louisiana -9.06% 47 -9.10% 47 0.05% 45Wyoming -11.88% 48 -13.32% 50 1.66% 39District of Columbia -12.14% 49 -3.25% 42 -9.19% 50North Dakota -12.78% 50 -14.18% 51 1.63% 40West Virginia -24.25% 51 -10.55% 48 -15.32% 51
TABLE 4.3
Percent Changes in Student Enrollment in Public Elementary and Secondary Schools, Ranked by Change from 1983-84 to 2003-04
Source: Author’s Tabulations

120 |
1993-1994 1994-1995 1995-1996 1996-1997 1997-1998 TOTAL TOTAL TOTAL TOTAL TOTAL STUDENTS STUDENTS STUDENTS STUDENTS STUDENTS United States 43,464,916 44,111,482 44,840,481 45,611,046 46,126,897 Alabama 734,288 736,531 746,149 747,932 749,207 Alaska 125,948 127,057 127,618 129,919 132,123 Arizona 709,453 737,424 743,566 799,250 814,113 Arkansas 444,271 447,565 453,257 457,349 456,497 California 5,327,231 5,407,475 5,536,406 5,686,198 5,803,887 Colorado 625,062 640,521 656,279 673,438 687,167 Connecticut 496,298 506,824 517,935 527,129 535,164 Delaware 105,547 106,813 108,461 110,549 111,960 District of Columbia 80,678 80,450 79,802 78,648 77,111 Florida 2,040,763 2,111,188 2,176,222 2,242,212 2,294,077 Georgia 1,235,304 1,270,948 1,311,126 1,346,761 1,375,980 Hawaii 180,410 183,795 187,180 187,653 189,887 Idaho 236,774 240,448 243,097 245,252 244,403 Illinois 1,893,078 1,916,172 1,943,623 1,973,040 1,998,289 Indiana 965,633 969,022 977,263 982,876 986,836 Iowa 498,519 500,440 502,343 502,941 501,054 Kansas 457,614 460,838 463,008 466,293 468,687 Kentucky 655,265 657,642 659,821 656,089 669,322 Louisiana 800,560 797,933 797,366 793,296 776,813 Maine 216,995 212,601 213,569 213,593 212,579 Maryland 772,638 790,938 805,544 818,583 830,744 Massachusetts 877,726 893,727 915,007 933,898 949,006 Michigan 1,599,377 1,614,784 1,641,456 1,685,714 1,702,717 Minnesota 810,233 821,693 835,166 847,204 853,621 Mississippi 505,907 505,962 506,272 503,967 504,792 Missouri 866,378 878,541 889,881 900,517 910,613 Montana 163,009 164,341 165,547 164,627 162,335 Nebraska 285,097 287,100 289,744 291,967 292,681 Nevada 235,800 250,747 265,041 282,131 296,621 New Hampshire 185,360 189,319 194,171 198,308 201,629 New Jersey 1,151,307 1,174,206 1,197,381 1,227,832 1,250,276 New Mexico 322,292 327,248 329,640 332,632 331,673 New York 2,733,813 2,766,208 2,813,230 2,843,131 2,861,823 North Carolina 1,133,231 1,156,767 1,183,090 1,210,108 1,236,083 North Dakota 119,127 119,288 119,100 120,123 118,572 Ohio 1,807,319 1,814,290 1,836,015 1,844,698 1,847,114 Oklahoma 604,076 609,718 616,393 620,695 623,681 Oregon 516,611 521,945 527,914 537,854 541,346 Pennsylvania 1,744,082 1,764,946 1,787,533 1,804,256 1,815,151 Rhode Island 145,676 147,487 149,799 151,324 153,321 South Carolina 643,696 648,725 645,586 652,816 659,273 South Dakota 142,825 143,482 144,685 143,331 142,443 Tennessee 866,557 881,425 893,770 904,818 893,044 Texas 3,608,262 3,677,171 3,748,167 3,828,975 3,891,877 Utah 471,365 474,675 477,121 481,812 482,957 Vermont 102,755 104,533 105,565 106,341 105,984 Virginia 1,045,471 1,060,809 1,079,854 1,096,093 1,110,815 Washington 915,952 938,314 956,572 974,504 991,235 West Virginia 314,383 310,511 307,112 304,052 301,419 Wisconsin 844,001 860,581 870,175 879,259 881,780 Wyoming 100,899 100,314 99,859 99,058 97,115
TABLE 4.4
Total Student Enrollment by Year 1993-1994 to 2003-2004

| 121
1998-1999 1999-2000 2000-2001 2001-2002 2002-2003 2003-2004TOTAL TOTAL TOTAL TOTAL TOTAL TOTAL
STUDENTS STUDENTS STUDENTS STUDENTS STUDENTS STUDENTS
46,538,585 46,857,149 47,203,539 47,671,877 48,183,086 48,540,725747,980 740,732 739,992 737,190 739,366 731,220135,373 134,391 133,356 134,358 134,364 133,933848,262 852,612 877,696 922,180 937,755 1,012,068452,256 451,034 449,959 449,805 450,985 454,523
5,926,037 6,038,590 6,140,814 6,247,726 6,353,667 6,413,862699,135 708,109 724,508 742,145 751,862 757,693544,698 553,993 562,179 570,228 570,023 577,203113,262 112,836 114,676 115,560 116,342 117,668
71,889 77,194 68,925 75,392 76,166 78,0572,337,633 2,381,396 2,434,821 2,500,478 2,539,929 2,587,6281,401,291 1,422,762 1,444,937 1,470,634 1,496,012 1,522,611
188,069 185,860 184,360 184,546 183,829 183,609244,722 245,136 245,117 246,521 248,604 252,120
2,011,530 2,027,600 2,048,792 2,071,391 2,084,187 2,100,961989,001 988,702 989,267 996,133 1,003,875 1,011,130498,214 497,301 495,080 485,932 482,210 481,226472,353 472,188 470,610 470,205 470,957 470,490655,687 648,180 665,850 654,363 660,782 663,885768,734 756,579 743,089 731,328 730,464 727,709211,051 209,253 207,037 205,586 204,337 202,084841,671 846,582 852,920 860,640 866,743 869,113962,317 971,425 975,150 973,140 982,989 980,459
1,720,287 1,725,639 1,720,626 1,730,668 1,785,160 1,757,604856,455 854,034 854,340 851,384 846,891 842,854502,379 500,716 497,871 493,507 492,645 493,540913,494 914,110 912,744 909,792 906,499 905,941159,988 157,556 154,875 151,947 149,995 148,356291,140 288,261 286,199 285,095 285,402 285,542311,061 325,610 340,706 356,814 369,498 385,401204,713 206,783 208,461 206,847 207,671 207,417
1,268,996 1,289,256 1,313,405 1,341,656 1,367,438 1,380,753328,753 324,495 320,306 320,260 320,234 323,066
2,877,143 2,887,776 2,882,188 2,872,132 2,888,233 2,864,7751,254,821 1,275,925 1,293,638 1,315,363 1,335,954 1,360,209
114,927 112,751 109,201 106,047 104,225 102,2331,842,163 1,836,554 1,835,049 1,830,985 1,838,285 1,845,428
628,492 627,032 623,110 622,139 624,548 626,160542,809 545,033 546,231 551,480 554,071 551,273
1,816,414 1,816,716 1,814,311 1,821,627 1,816,747 1,821,146154,785 156,454 157,347 158,046 159,205 159,375664,600 666,780 677,411 676,198 694,389 699,198132,495 131,037 128,603 127,542 130,048 125,537905,454 916,202 909,161 924,899 927,608 936,681
3,945,367 3,991,783 4,059,619 4,163,447 4,259,823 4,331,751481,176 480,255 481,485 484,677 489,262 495,981105,120 104,559 102,049 101,179 99,978 99,103
1,124,022 1,133,994 1,144,915 1,163,091 1,177,229 1,192,092998,053 1,003,714 1,004,770 1,009,200 1,014,798 1,021,349297,530 291,811 286,367 282,885 282,455 281,215879,542 877,753 879,476 879,361 881,231 880,031
95,241 92,105 89,940 88,128 88,116 87,462

122 |
Asian/ Am. Indian/ Number Pacifi c Alaskan of Schools White Black Hispanic Islander Native Other
Alaska charter 20 70.7 2.6 2.6 1.6 22.4 0.1 all public 506 60.4 4.7 3.6 5.9 25.5 Arizona charter 491 55.1 7.8 23.4 1.3 12.1 0.1 all public 1742 51.7 4.8 35.6 0.9 0.5 California charter 500 54.5 10.8 26.6 4.4 2.5 1.1 all public 8914 34.8 8.4 44.3 11.2 0.9 Colorado charter 97 76.6 6 14 2 0.9 0.4 all public 1630 66.8 5.7 23.3 3 1.2 Connecticut charter 16 32.5 45 21 1 0.5 0 all public 1073 69.3 13.8 13.7 3 0.3 District of Columbia charter 42 1 74.3 19.9 3.6 0 1.3 all public 193 4.6 84.4 9.4 1.6 0 Delaware charter 13 56.2 39 2.6 2.2 0 0 all public 197 59.7 31.3 6.6 2.4 0.3 Florida charter 258 48.8 40.3 9.6 0.5 0.2 0.6 all public 3314 52.6 24.9 20.5 1.9 0.3 Georgia charter 36 69.6 23.4 3.4 2.1 0.2 1.3 all public 19 69 53.8 38.2 5.5 2.4 0.2 Illinois charter 30 8.6 67 23.2 1 0.1 0.1 all public 4292 59.1 21.3 16.2 3.5 0.2 Kansas charter 31 90.2 1.2 6.4 0.5 1.4 0.4 all public 1423 77.8 8.9 9.8 2.2 1.3 Louisiana charter 16 25 72.4 0.4 0.7 1.2 0.3 all public 1509 48.8 47.9 1.6 1.3 0.7 Massachusetts charter 58 20.1 13.8 2 1.1 4.2 all public 1889 75.7 8.6 10.8 4.5 0.3 Michigan charter 210 50 41.4 4.6 0.8 2.1 1.1 all public 3782 73.8 20.1 3.6 2 1 Minnesota charter 97 51.9 26.7 3.4 10.3 7 0.7 all public 2119 82 7 3.8 5.2 2 New Jersey charter 52 20.6 62.1 13.5 3.3 0.1 0.4 all public 2410 59.4 17.9 16 6.6 0.2 New Mexico charter 37 35.3 2.1 56.8 1.3 4.5 0 all public 792 34.3 2.4 51 1.1 11.3 North Carolina charter 94 48.4 47.3 1.6 0.6 1.3 0.8 all public 2223 59.7 31.2 5.2 1.9 1.5 Ohio charter 139 44.1 49.8 1 0 0 5.2 all public 3826 80.1 16.7 1.9 1.2 0.1 Pennsylvania charter 103 25.1 59.1 13.8 1.8 0 0.1 all public 3185 77.7 15.3 4.8 2.1 0.1 South Carolina charter 19 23.1 72.3 0 0 4.6 0.6 all public 1053 56.2 42.8 2.4 1 0.2 Texas charter 241 23.1 33.9 39.5 2.5 0.4 0.6 all public 7646 41 14.4 41.8 2.8 0.3 Wisconsin charter 146 72.6 16 2.7 2.8 0.3 0.7 all public 2208 80.1 10.2 5 3.4 1.4
TABLE 4.5
Minority Enrollment in Charter Schools Compared to Public Schools
Source: U. S. Department of Education; State of Charter Schools 2000, Fourth Year Report; January 2000

| 123
TABLE 4.6
Basic Information on Charter Schools by State (through Fall 2005)
Source: Center for Education Reform; Nation Charter School Data At-A-Glance, October 2005. Center for Education Reform, Charter Schools: Today, Changing the Face of American Education, February 2006
Number of Year Rank of Charter Number Students Legislation Charter School of Charter Attending Passed School Law Law Grade Schools Charter School Alaska 1995 33 D 24 4,773 Arizona 1994 4 A 449 96,934 Arkansas 1995 35 D 17 3,477 California 1992 7 A 592 219,480 Colorado 1993 8 B 116 38,032 Connecticut 1996 28 C 15 2,676 Delaware 1995 1 A 15 6,791 District of Columbia 1996 3 A 65 20,116 Florida 1996 9 B 326 96,676 Georgia 1993 26 C 49 21,116 Hawaii 1994 34 D 27 5,405 Idaho 1998 27 C 23 7,795 Illinois 1996 24 C 41 17,235 Indiana 2001 6 A 29 7,013 Iowa 2002 40 F 7 1332 Kansas 1994 38 D 25 1,950 Louisiana 1995 25 C 21 6,685 Maryland 2003 37 D 15 3812 Massachusetts 1993 10 B 57 20,555 Michigan 1993 5 A 233 86,874 Minnesota 1991 2 A 126 20,650 Mississippi 1997 41 F 1 380 Missouri 1998 13 B 26 10,780 Nevada 1997 28 C 20 6,672 New Hampshire 1995 23 C 6 517 New Jersey 1996 17 B 52 14,440 New Mexico 1993 20 B 51 9,888 New York 1998 13 B 79 12,468 North Carolina 1996 15 B 100 28,159 Ohio 1997 12 B 277 85,082 Oklahoma 1999 21 C 13 3,866 Oregon 1999 16 B 62 9,616 Pennsylvania 1997 11 B 115 51,504 Rhode Island 1995 36 D 11 2,398 South Carolina 1996 22 C 26 5,171 Tennessee 2002 31 C 12 1842 Texas 1995 19 B 259 85,444 Utah 1998 28 C 39 11,797 Virginia 1998 38 D 5 528 Wisconsin 1993 18 B 188 35,406 Wyoming 1995 32 D 3 479 TOTAL 3,617 1,074,809
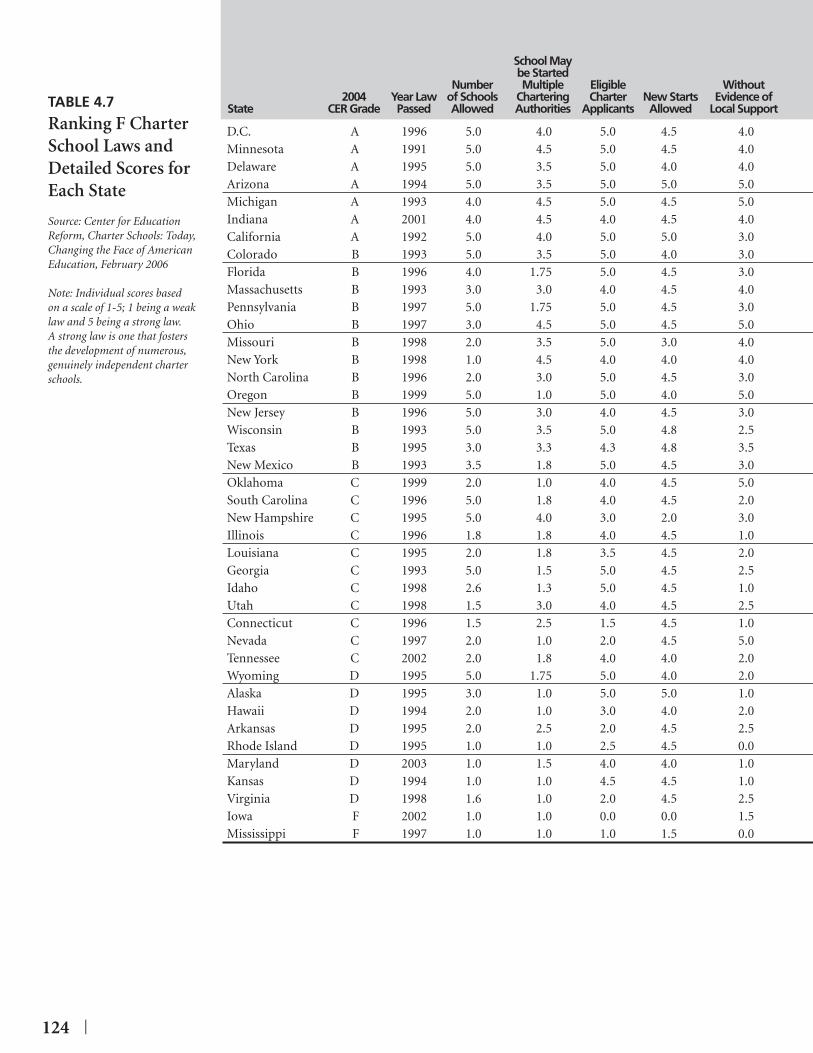
124 |
School May be Started Number Multiple Eligible Without 2004 Year Law of Schools Chartering Charter New Starts Evidence of State CER Grade Passed Allowed Authorities Applicants Allowed Local Support
D.C. A 1996 5.0 4.0 5.0 4.5 4.0 Minnesota A 1991 5.0 4.5 5.0 4.5 4.0 Delaware A 1995 5.0 3.5 5.0 4.0 4.0 Arizona A 1994 5.0 3.5 5.0 5.0 5.0 Michigan A 1993 4.0 4.5 5.0 4.5 5.0 Indiana A 2001 4.0 4.5 4.0 4.5 4.0 California A 1992 5.0 4.0 5.0 5.0 3.0 Colorado B 1993 5.0 3.5 5.0 4.0 3.0 Florida B 1996 4.0 1.75 5.0 4.5 3.0 Massachusetts B 1993 3.0 3.0 4.0 4.5 4.0 Pennsylvania B 1997 5.0 1.75 5.0 4.5 3.0 Ohio B 1997 3.0 4.5 5.0 4.5 5.0 Missouri B 1998 2.0 3.5 5.0 3.0 4.0 New York B 1998 1.0 4.5 4.0 4.0 4.0 North Carolina B 1996 2.0 3.0 5.0 4.5 3.0 Oregon B 1999 5.0 1.0 5.0 4.0 5.0 New Jersey B 1996 5.0 3.0 4.0 4.5 3.0 Wisconsin B 1993 5.0 3.5 5.0 4.8 2.5 Texas B 1995 3.0 3.3 4.3 4.8 3.5 New Mexico B 1993 3.5 1.8 5.0 4.5 3.0 Oklahoma C 1999 2.0 1.0 4.0 4.5 5.0 South Carolina C 1996 5.0 1.8 4.0 4.5 2.0 New Hampshire C 1995 5.0 4.0 3.0 2.0 3.0 Illinois C 1996 1.8 1.8 4.0 4.5 1.0 Louisiana C 1995 2.0 1.8 3.5 4.5 2.0 Georgia C 1993 5.0 1.5 5.0 4.5 2.5 Idaho C 1998 2.6 1.3 5.0 4.5 1.0 Utah C 1998 1.5 3.0 4.0 4.5 2.5 Connecticut C 1996 1.5 2.5 1.5 4.5 1.0 Nevada C 1997 2.0 1.0 2.0 4.5 5.0 Tennessee C 2002 2.0 1.8 4.0 4.0 2.0 Wyoming D 1995 5.0 1.75 5.0 4.0 2.0 Alaska D 1995 3.0 1.0 5.0 5.0 1.0 Hawaii D 1994 2.0 1.0 3.0 4.0 2.0 Arkansas D 1995 2.0 2.5 2.0 4.5 2.5 Rhode Island D 1995 1.0 1.0 2.5 4.5 0.0 Maryland D 2003 1.0 1.5 4.0 4.0 1.0 Kansas D 1994 1.0 1.0 4.5 4.5 1.0 Virginia D 1998 1.6 1.0 2.0 4.5 2.5 Iowa F 2002 1.0 1.0 0.0 0.0 1.5 Mississippi F 1997 1.0 1.0 1.0 1.5 0.0
TABLE 4.7
Ranking F Charter School Laws and Detailed Scores for Each State
Source: Center for Education Reform, Charter Schools: Today, Changing the Face of American Education, February 2006
Note: Individual scores based on a scale of 1-5; 1 being a weak law and 5 being a strong law. A strong law is one that fosters the development of numerous, genuinely independent charter schools.

| 125
Exempt fromAutomatic Collective
Waiver from Legal/ Guaranteed BargainingState and Operational Full Per-Pupil Fiscal Agreement/
District Laws Autonomy Funding Autonomy District Work Rules Total Rank 2006 Rank 2004
5.0 4.5 4.5 5.0 5.0 46.50 1 35.0 4.0 3.5 5.0 5.0 45.50 2 25.0 3.0 5.0 5.0 5.0 44.50 3 44.0 4.0 3.5 5.0 5.0 44.00 4 13.0 3.0 5.0 5.0 3.0 42.00 5 55.0 5.0 3.0 5.0 3.0 41.50 6 63.0 3.5 4.0 3.0 5.0 40.50 7 153.0 3.0 4.0 4.0 5.0 39.50 8 93.0 3.5 4.0 5.0 5.0 38.75 9 83.0 4.0 4.0 5.0 3.0 37.50 10 74.0 3.0 3.0 3.0 5.0 37.25 11 132.0 3.0 2.0 5.0 3.0 37.00 12 114.0 4.0 2.0 4.0 5.0 36.50 13 143.0 5.0 3.0 5.0 3.0 36.50 13 104.0 3.0 4.0 4.0 3.0 35.50 15 122.0 3.0 2.0 2.0 5.0 34.00 16 161.0 2.0 2.0 5.0 3.0 32.50 17 172.5 2.5 2.0 1.8 2.5 32.05 18 180.0 2.0 3.0 3.0 4.0 30.75 19 192.0 2.8 3.0 2.0 2.5 30.00 20 202.5 1.0 2.0 3.0 4.0 29.00 21 222.5 2.0 2.0 2.0 3.0 28.75 22 234.0 2.0 0.0 0.0 5.0 28.00 23 313.0 2.0 3.0 3.5 2.5 27.00 24 212.5 1.0 3.0 4.5 1.5 26.25 25 240.0 1.0 2.0 2.0 1.5 25.00 26 254.3 0.0 3.0 1.0 1.0 23.70 27 270.6 1.6 0.3 1.0 4.0 23.00 28 262.5 0.5 3.5 3.0 2.5 23.00 28 282.5 1.5 3.5 1.0 0.0 23.00 28 290.0 0.0 3.0 1.0 3.0 20.75 31 320.0 0.0 1.0 1.0 0.0 19.75 32 301.0 0.0 3.0 1.0 0.0 19.00 33 344.0 0.0 1.0 1.0 0.0 18.00 34 330.0 2.0 1.5 0.0 0.0 17.00 35 350.5 0.5 3.5 1.5 0.0 15.00 36 360.0 0.0 2.0 1.0 0.0 14.50 37 n/a0.5 0.0 0.5 0.0 0.0 13.00 38 380.5 0.5 0.5 0.0 0.0 13.00 38 373.0 0.0 0.0 0.0 0.0 6.00 40 391.0 0.0 0.0 0.0 0.0 5.50 41 40

126 |
Academic/ Program Student General Income Scope Eligibility Purchasing School Restrictions Restrictions Overall Power Restrictions Program Rank Rating/Grade Rating/Grade Rating/Grade Rating/Grade
FL “McKay” Vouchers 1 4/A 3/B 3.5/A- 4/A AZ Tax Credit Vouchers 2 4/A 1/D 2.5/B- 4/A PA Tax Credit Vouchers 3 3/B 1/D 2/C 4/A VT Tuitioning 4 4/A 1/D 3/B 4/A ME Tuitioning 5 4/A 1/D 3/B 4/A FL “Opportunity” Vouchers 6 1/D 4/A 3/B 3/B CO Vouchers 7 1/D 2/C 2/C 3/B FL Tax Credit Scholarships 8 2/C 3/B 2.5/B- 1/D IL Personal Tax Credit 9 1/D 3/B 2/C 0/F MN Personal Tax Deduction 10 1/D 3/B 2/C 0/F WI Vouchers (Milwaukee) 11 2/C 1/D 2/C 1/D OH Vouchers (Cleveland) 12 3/B 1/D 2.5/B- 0/F IA Personal Tax Credit 13 1/D 3/B 2/C 0/F
TABLE 4.8A
Ranking of State School Choice Programs
Source: The Milton & Rose D. Friedman Foundation; Grading Vouchers: Ranking America’s School Choice Programs; March 2004
Note: This report was written before the recent passage of a school voucher program for the District of Columbia and before a Denver district judge struck down Colorado’s voucher legislation.
TABLE 4.8B
Ranking of State School Choice Programs By Usability
Source: The Milton & Rose D. Friedman Foundation; Using School Choice: Analyzing How Parents Access Educational Freedom; October 2005.
Note: This report grades each of the 14 K-12 school choice programs operating in the U.S. at the time of the analysis on the processes and procedures that parents must go through in order to participate in the program.
School Voucher Programs
PROGRAM EVALUATION
Milwaukee vouchers Excellent
Maine and Vermont town tuitioning Excellent
Florida McKay vouchers Good
Cleveland vouchers Fair
Ohio autism vouchers Fair
Florida A+ vouchers Poor
Washington D.C. vouchers Poor
Tax-Funded Scholarships
PROGRAM EVALUATION
Arizona tax-funded scholarships Excellent
Florida tax-funded scholarships Good
Pennsylvania tax-funded scholarships Good
Tax Credits and Deductions
PROGRAM EVALUATION
Illinois personal tax credit Excellent
Iowa personal tax credit Excellent
Minnesota personal tax deduction and credit Good
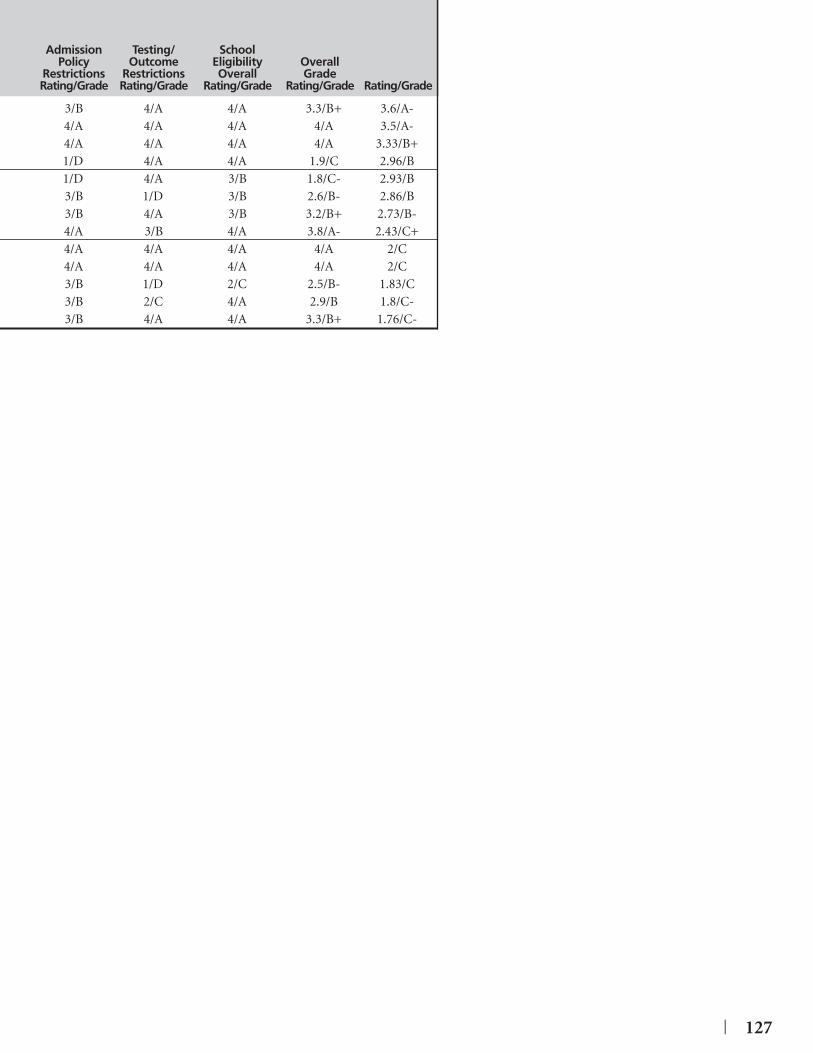
| 127
Admission Testing/ SchoolPolicy Outcome Eligibility Overall
Restrictions Restrictions Overall Grade Rating/Grade Rating/Grade Rating/Grade Rating/Grade Rating/Grade
3/B 4/A 4/A 3.3/B+ 3.6/A- 4/A 4/A 4/A 4/A 3.5/A- 4/A 4/A 4/A 4/A 3.33/B+ 1/D 4/A 4/A 1.9/C 2.96/B 1/D 4/A 3/B 1.8/C- 2.93/B 3/B 1/D 3/B 2.6/B- 2.86/B 3/B 4/A 3/B 3.2/B+ 2.73/B- 4/A 3/B 4/A 3.8/A- 2.43/C+ 4/A 4/A 4/A 4/A 2/C 4/A 4/A 4/A 4/A 2/C 3/B 1/D 2/C 2.5/B- 1.83/C 3/B 2/C 4/A 2.9/B 1.8/C- 3/B 4/A 4/A 3.3/B+ 1.76/C-
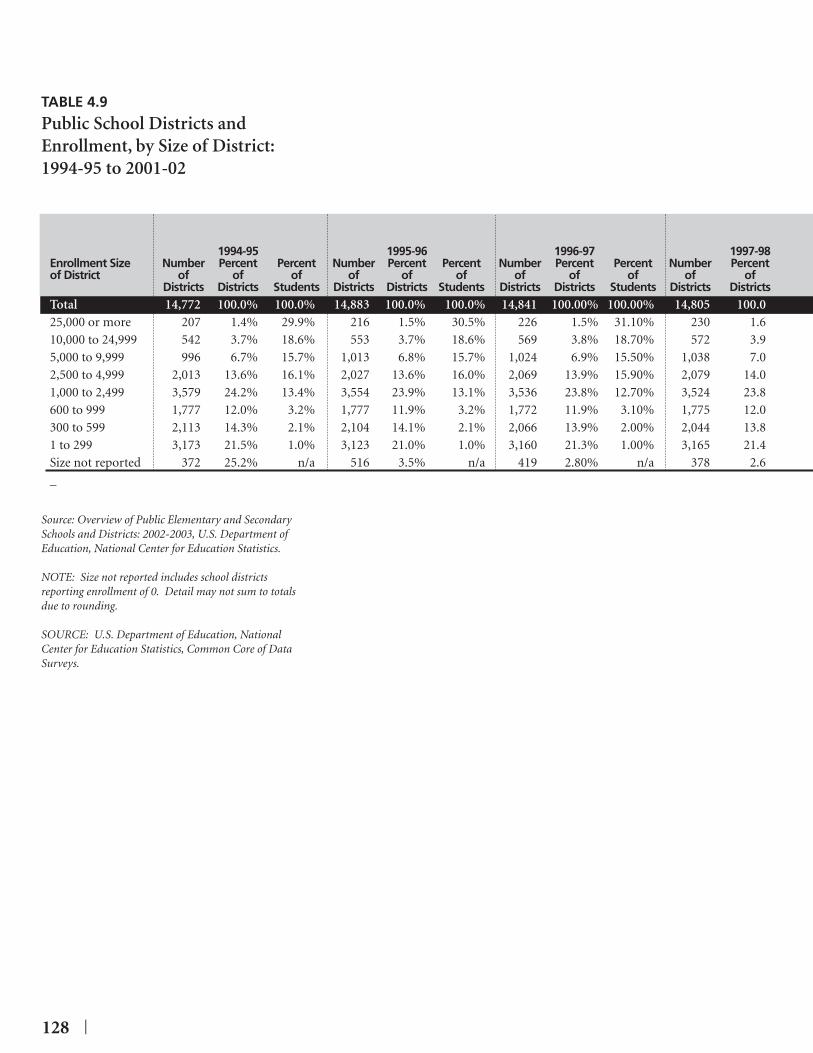
128 |
TABLE 4.9
Public School Districts and Enrollment, by Size of District: 1994-95 to 2001-02
Source: Overview of Public Elementary and Secondary Schools and Districts: 2002-2003, U.S. Department of Education, National Center for Education Statistics.
NOTE: Size not reported includes school districts reporting enrollment of 0. Detail may not sum to totals due to rounding.
SOURCE: U.S. Department of Education, National Center for Education Statistics, Common Core of Data Surveys.
1994-95 1995-96 1996-97 1997-98 Enrollment Size Number Percent Percent Number Percent Percent Number Percent Percent Number Percent of District of of of of of of of of of of of Districts Districts Students Districts Districts Students Districts Districts Students Districts Districts Total 14,772 100.0% 100.0% 14,883 100.0% 100.0% 14,841 100.00% 100.00% 14,805 100.0 25,000 or more 207 1.4% 29.9% 216 1.5% 30.5% 226 1.5% 31.10% 230 1.6 10,000 to 24,999 542 3.7% 18.6% 553 3.7% 18.6% 569 3.8% 18.70% 572 3.9 5,000 to 9,999 996 6.7% 15.7% 1,013 6.8% 15.7% 1,024 6.9% 15.50% 1,038 7.0 2,500 to 4,999 2,013 13.6% 16.1% 2,027 13.6% 16.0% 2,069 13.9% 15.90% 2,079 14.0 1,000 to 2,499 3,579 24.2% 13.4% 3,554 23.9% 13.1% 3,536 23.8% 12.70% 3,524 23.8 600 to 999 1,777 12.0% 3.2% 1,777 11.9% 3.2% 1,772 11.9% 3.10% 1,775 12.0 300 to 599 2,113 14.3% 2.1% 2,104 14.1% 2.1% 2,066 13.9% 2.00% 2,044 13.8 1 to 299 3,173 21.5% 1.0% 3,123 21.0% 1.0% 3,160 21.3% 1.00% 3,165 21.4 Size not reported 372 25.2% n/a 516 3.5% n/a 419 2.80% n/a 378 2.6 _

| 129
1998-99 1999-00 2000-01 2001-02 Percent Number Percent Percent Number Percent Percent Number Percent Percent Number Percent Percent
of of of of of of of of of of of of ofStudents Districts Districts Students Districts Districts Students Districts Districts Students Districts Districts Students100.0 14,891 100.0 100.0 14,928 100.0 100.0 14,514 100.0 100.0 14,229 100.0 100.0
31.5 236 1.6 31.9 238 1.6 3 2.1 240 1.7 32.3 243 1.7 32.718.6 574 3.9 18.6 579 3.9 18.7 581 4.0 18.1 573 4.0 18.715.5 1,026 6.9 15.3 1,036 6.9 15.4 1,036 7.1 15.3 1,067 7.5 15.715.9 2,062 13.8 15.7 2,068 13.9 15.6 2,061 14.2 15.5 2,031 14.3 15.212.5 3,496 23.5 12.4 3,457 23.2 12.1 3,448 23.8 12.1 3,429 24.1 11.9
3.1 1,790 12.0 3.1 1,814 12.2 3.1 1,776 12.2 3.1 1,744 12.3 2.92.0 2,066 13.9 2.0 2,081 13.9 2.0 2,107 14.5 2.0 2,015 14.2 1.90.9 3,245 21.8 1.0 3,298 22.1 1.0 3,265 22.5 1.0 3,127 22.0 0.9n/a 396 2.7 n/a 357 2.4 n/a 345 2.4 n/a 330 2.3 n/a

130 |

| 131
According to the Rev. Martin Luther King, Jr., “Change does not roll in on the wheels of inevitability, but comes through continuous struggle.” But how much longer
will it take our nation before we come to our senses and realize that we are on the verge of losing a generation of children trapped in poor performing “government run” schools because we are not willing to stand up to the education establishment and hold them accountable.
One has only to read through the results of this year’s Report Card on American Education to see that while we have talked a good game since the “Goals 2000” report was released we have made very little real progress in improving our children’s academic performance. Despite increasing per-pupil spending by over 77 percent (after adjusting for infl ation) over the past 20 years, nearly three-quarters of our public school 8th graders still perform below the profi ciency level in mathematics—a continuing trend that does not bode well for America’s future place in the world’s increasingly connected global economy.
Parents have taken up their proverbial pitchforks in ever increasing numbers over the past fi ve years and have demanded solutions to these challenges from their elected offi cials. The result has been a slowly expanding school choice movement that is seeing new programs pop up and existing programs expanded in state after state.
As more and more parents see that they can—and should—have a choice in their child’s education, it causes more and more leaks in the dam that has been holding back real educational reform. And soon, the educational establishment will run out of fi ngers to plug those leaks and then the fl ood of educational reform and school choice will fi nally be free to fl ow all across this great nation—bringing liberation to many that have struggled far too long to escape from an educational system that has failed them all too often.
Conclusion
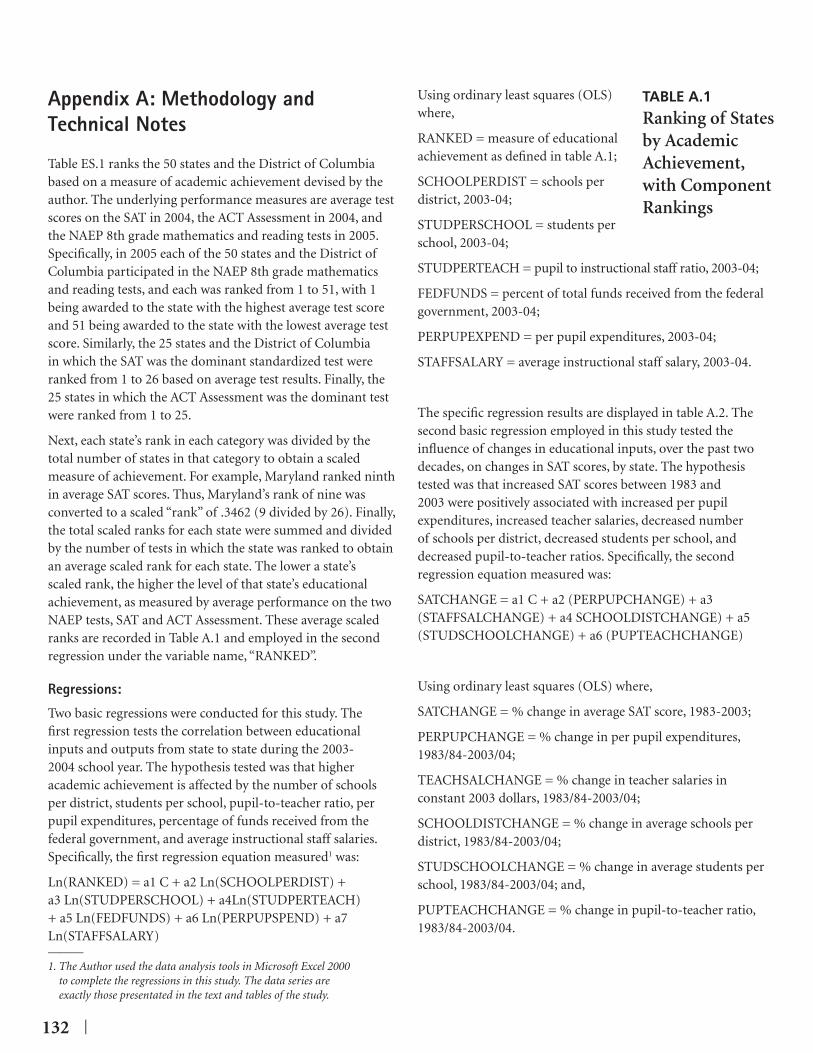
132 |
Appendix A: Methodology and Technical Notes
Table ES.1 ranks the 50 states and the District of Columbia based on a measure of academic achievement devised by the author. The underlying performance measures are average test scores on the SAT in 2004, the ACT Assessment in 2004, and the NAEP 8th grade mathematics and reading tests in 2005. Specifi cally, in 2005 each of the 50 states and the District of Columbia participated in the NAEP 8th grade mathematics and reading tests, and each was ranked from 1 to 51, with 1 being awarded to the state with the highest average test score and 51 being awarded to the state with the lowest average test score. Similarly, the 25 states and the District of Columbia in which the SAT was the dominant standardized test were ranked from 1 to 26 based on average test results. Finally, the 25 states in which the ACT Assessment was the dominant test were ranked from 1 to 25.
Next, each state’s rank in each category was divided by the total number of states in that category to obtain a scaled measure of achievement. For example, Maryland ranked ninth in average SAT scores. Thus, Maryland’s rank of nine was converted to a scaled “rank” of .3462 (9 divided by 26). Finally, the total scaled ranks for each state were summed and divided by the number of tests in which the state was ranked to obtain an average scaled rank for each state. The lower a state’s scaled rank, the higher the level of that state’s educational achievement, as measured by average performance on the two NAEP tests, SAT and ACT Assessment. These average scaled ranks are recorded in Table A.1 and employed in the second regression under the variable name, “RANKED”.
Regressions:
Two basic regressions were conducted for this study. The fi rst regression tests the correlation between educational inputs and outputs from state to state during the 2003-2004 school year. The hypothesis tested was that higher academic achievement is affected by the number of schools per district, students per school, pupil-to-teacher ratio, per pupil expenditures, percentage of funds received from the federal government, and average instructional staff salaries. Specifi cally, the fi rst regression equation measured1 was:
Ln(RANKED) = a1 C + a2 Ln(SCHOOLPERDIST) + a3 Ln(STUDPERSCHOOL) + a4Ln(STUDPERTEACH) + a5 Ln(FEDFUNDS) + a6 Ln(PERPUPSPEND) + a7 Ln(STAFFSALARY)
Using ordinary least squares (OLS) where,
RANKED = measure of educational achievement as defi ned in table A.1;
SCHOOLPERDIST = schools per district, 2003-04;
STUDPERSCHOOL = students per school, 2003-04;
STUDPERTEACH = pupil to instructional staff ratio, 2003-04;
FEDFUNDS = percent of total funds received from the federal government, 2003-04;
PERPUPEXPEND = per pupil expenditures, 2003-04;
STAFFSALARY = average instructional staff salary, 2003-04.
The specifi c regression results are displayed in table A.2. The second basic regression employed in this study tested the infl uence of changes in educational inputs, over the past two decades, on changes in SAT scores, by state. The hypothesis tested was that increased SAT scores between 1983 and 2003 were positively associated with increased per pupil expenditures, increased teacher salaries, decreased number of schools per district, decreased students per school, and decreased pupil-to-teacher ratios. Specifi cally, the second regression equation measured was:
SATCHANGE = a1 C + a2 (PERPUPCHANGE) + a3 (STAFFSALCHANGE) + a4 SCHOOLDISTCHANGE) + a5 (STUDSCHOOLCHANGE) + a6 (PUPTEACHCHANGE)
Using ordinary least squares (OLS) where,
SATCHANGE = % change in average SAT score, 1983-2003;
PERPUPCHANGE = % change in per pupil expenditures, 1983/84-2003/04;
TEACHSALCHANGE = % change in teacher salaries in constant 2003 dollars, 1983/84-2003/04;
SCHOOLDISTCHANGE = % change in average schools per district, 1983/84-2003/04;
STUDSCHOOLCHANGE = % change in average students per school, 1983/84-2003/04; and,
PUPTEACHCHANGE = % change in pupil-to-teacher ratio, 1983/84-2003/04.
TABLE A.1
Ranking of States by Academic Achievement, with Component Rankings
———1. The Author used the data analysis tools in Microsoft Excel 2000
to complete the regressions in this study. The data series are exactly those presentated in the text and tables of the study.

| 133
2005 NAEP NAEP 2005 NAEP NAEP Average 8th Grade Mathematics 8th Grade Reading 2004 SAT 2004 ACT Total Mathematics Scaled Reading Scaled SAT Scaled ACT Scaled Scaled Total STATE Rank Rank Rank Rank Rank Rank Rank Rank Rank Rank
Alabama 49 0.9608 46 0.9020 22 0.8800 0.9142 48Alaska 29 0.5686 34 0.6667 6 0.2308 0.4887 25Arizona 34 0.6667 42 0.8235 3 0.4615 0.6506 33Arkansas 39 0.7647 37 0.7255 18 0.7200 0.7367 41California 43 0.8431 49 0.9608 12 0.4615 0.7552 42Colorado 20 0.3922 21 0.4118 19 0.7600 0.5213 28Connecticut 19 0.3725 23 0.4510 7 0.2692 0.3643 17Delaware 21 0.4118 18 0.3529 21 0.8077 0.5241 29DC 51 1.0000 51 1.0000 26 1.0000 1.0000 51Florida 34 0.6667 41 0.8039 22 0.8462 0.7722 43Georgia 37 0.7255 40 0.7843 24 0.9231 0.8110 45Hawaii 46 0.9020 50 0.9804 20 0.7692 0.8839 46Idaho 24 0.4706 24 0.4706 13 0.5200 0.4871 24Illinois 31 0.6078 25 0.4902 19 0.7600 0.6193 32Indiana 17 0.3333 31 0.6078 14 0.5385 0.4932 26Iowa 12 0.2353 15 0.2941 3 0.1200 0.2165 9Kansas 47 0.9216 15 0.2941 6 0.2400 0.4852 22Kentucky 36 0.7059 25 0.4902 19 0.7600 0.6520 34Louisiana 45 0.8824 45 0.8824 24 0.9600 0.9082 47Maine 24 0.4706 2 0.0392 16 0.6154 0.3751 18Maryland 30 0.5882 29 0.5686 9 0.3462 0.5010 27Massachusetts 1 0.0196 1 0.0196 5 0.1923 0.0772 1Michigan 32 0.6275 31 0.6078 10 0.4000 0.5451 31Minnesota 2 0.0392 9 0.1765 1 0.0400 0.0852 2Mississippi 50 0.9804 47 0.9216 25 1.0000 0.9673 50Missouri 33 0.6471 21 0.4118 7 0.2800 0.4463 19Montana 6 0.1176 5 0.0980 4 0.1600 0.1252 4Nebraska 11 0.2157 14 0.2745 4 0.1600 0.2167 10Nevada 42 0.8235 44 0.8627 11 0.4231 0.7031 38New Hampshire 9 0.1765 2 0.0392 4 0.1538 0.1232 3New Jersey 10 0.1961 5 0.0980 13 0.5000 0.2647 12New Mexico 48 0.9412 47 0.9216 23 0.9200 0.9276 49New York 27 0.5294 20 0.3922 14 0.5385 0.4867 23North Carolina 16 0.3137 36 0.7059 16 0.6154 0.5450 30North Dakota 5 0.0980 4 0.0784 14 0.5600 0.2455 11Ohio 14 0.2745 12 0.2353 10 0.4000 0.3033 15Oklahoma 41 0.8039 33 0.6471 15 0.6000 0.6837 37Oregon 15 0.2941 27 0.5294 2 0.0769 0.3002 14Pennsylvania 21 0.4118 12 0.2353 19 0.7308 0.4593 20Rhode Island 37 0.7255 30 0.5882 18 0.6923 0.6687 35South Carolina 24 0.4706 39 0.7647 25 0.9615 0.7323 40South Dakota 4 0.0784 8 0.1569 7 0.2800 0.1718 7Tennessee 40 0.7843 35 0.6863 16 0.6400 0.7035 39Texas 21 0.4118 37 0.7255 23 0.8846 0.6740 36Utah 28 0.5490 28 0.5490 7 0.2800 0.4593 21Vermont 3 0.0588 5 0.0980 8 0.3077 0.1549 5Virginia 13 0.2549 10 0.1961 10 0.3846 0.2785 13Washington 7 0.1373 19 0.3725 1 0.0385 0.1828 8West Virginia 44 0.8627 43 0.8431 16 0.6400 0.7820 44Wisconsin 7 0.1373 17 0.3333 1 0.0400 0.1702 6Wyoming 18 0.3529 10 0.1961 10 0.4000 0.3163 16
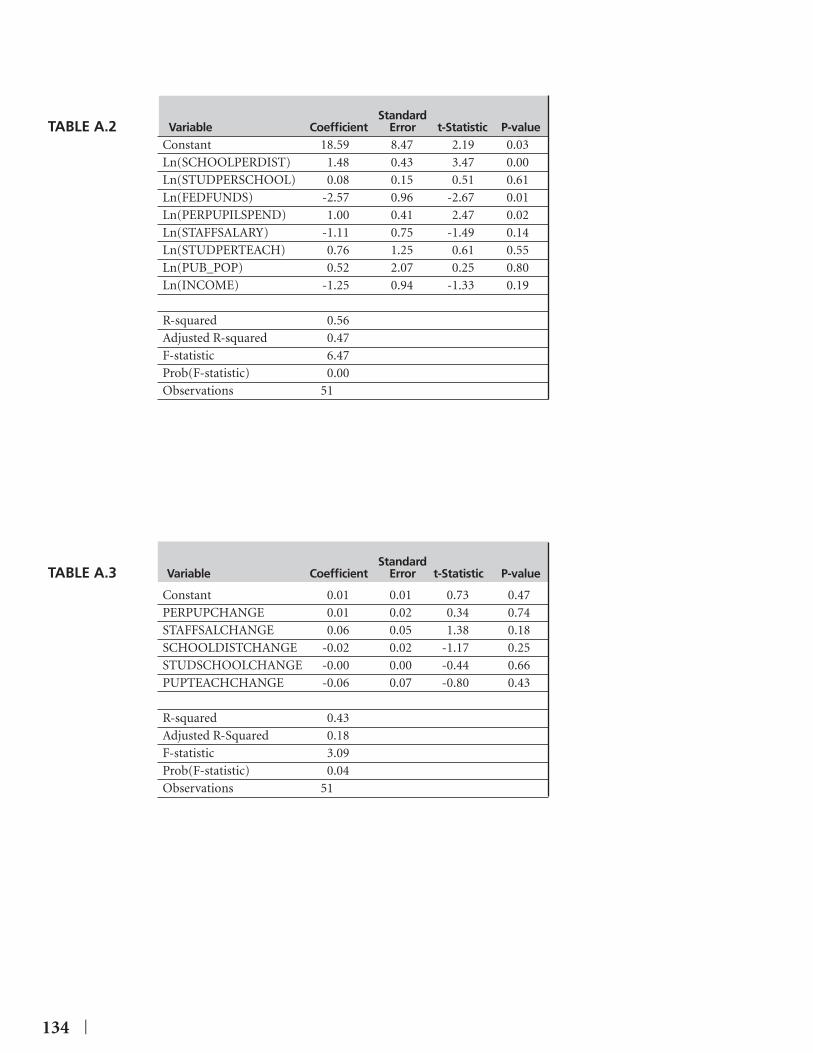
134 |
Standard Variable Coeffi cient Error t-Statistic P-value Constant 0.01 0.01 0.73 0.47PERPUPCHANGE 0.01 0.02 0.34 0.74STAFFSALCHANGE 0.06 0.05 1.38 0.18SCHOOLDISTCHANGE -0.02 0.02 -1.17 0.25STUDSCHOOLCHANGE -0.00 0.00 -0.44 0.66PUPTEACHCHANGE -0.06 0.07 -0.80 0.43
R-squared 0.43 Adjusted R-Squared 0.18 F-statistic 3.09 Prob(F-statistic) 0.04 Observations 51
Standard Variable Coeffi cient Error t-Statistic P-valueConstant 18.59 8.47 2.19 0.03 Ln(SCHOOLPERDIST) 1.48 0.43 3.47 0.00 Ln(STUDPERSCHOOL) 0.08 0.15 0.51 0.61 Ln(FEDFUNDS) -2.57 0.96 -2.67 0.01 Ln(PERPUPILSPEND) 1.00 0.41 2.47 0.02 Ln(STAFFSALARY) -1.11 0.75 -1.49 0.14 Ln(STUDPERTEACH) 0.76 1.25 0.61 0.55 Ln(PUB_POP) 0.52 2.07 0.25 0.80 Ln(INCOME) -1.25 0.94 -1.33 0.19 R-squared 0.56 Adjusted R-squared 0.47 F-statistic 6.47 Prob(F-statistic) 0.00 Observations 51
TABLE A.2
TABLE A.3
| 135
Appendix B: Bibliography
Common Core of Data Survey, various years, U.S. Department of Education, National Center for Education Statistics.
Revenues and Expenditures for Public Elementary and Secondary Schools, various years, U.S. Department of Education, National Center for Education Statistics.
Statistics of Public Elementary and Secondary Schools, 2003, U.S. Department of Education, National Center for Education Statistics.
Overview of Public Elementary and Secondary Schools and Districts: 2002-2003, U.S. Department of Education, National Center for Education Statistics.
Digest of Educational Statistics, 1985, U.S. Department of Education, National Center for Education Statistics.
Digest of Educational Statistics, 1995, U.S. Department of Education, National Center for Education Statistics.
Digest of Education Statistics, 2005, U.S. Department of Education, National Center for Education Statistics.
National Center for Education Statistics, National Assessment of Educational Progress (NAEP), 2000, 2003, and 2005 Mathematics and Reading Assessments;
2004 ACT Composite Averages by State, ACT, Inc.
College Bound Seniors, 2004, The College Board.
U. S. Department of Education Budget, 2004.
Consumer Price Index (CPI) calculator, Federal Reserve Bank of Minneapolis, MN.
Center for Education Reform; Nation Charter School Data At-A-Glance, October 2005.
Center for Education Reform, Charter Schools: Today, Changing the Face of American Education, February 2006
Grading Vouchers: Ranking America's School Choice Programs; March 2004, The Milton & Rose D. Friedman Foundation.

136 |

ALECAmerican Legislative Exchange Council
1129 20th Street, NW • Suite 500 • Washington, DC 20036
202-466-3800 • www.alec.orgALECAmerican Legislative Exchange Council
Report Card on American EducationA State-by-State AnalysisA State-by-State Analysis
1983-1984 to 2004-2005
Report Card on American Education: A State-by-State Analysis 1983-1984 to 2004-2005