report by the government actuary on the financial … and...1.6 we were asked by the social security...
TRANSCRIPT

Report by the Government Actuary on the financial condition of the Health Insurance Fund as at 31 December 2012
Date: 26 August 2014
Author: Trevor Llanwarne

Financial condition of the HIF as at 31 December 2012
Report by the Government Actuary
HEALTH INSURANCE (JERSEY) LAW 1967
Report by the Government Actuary on the financial condition of the Health Insurance Fund
as at 31 December 2012 To the Minister for Social Security of the States of Jersey Article 22(1) of the Health Insurance (Jersey) Law 1967 requires the actuary appointed by the Minister to review the operation of the Law at intervals not exceeding five years and to report to the Minister on the financial condition of the Health Insurance Fund and on the adequacy or otherwise of the contributions payable under the Law to support the prescribed benefits. I have been appointed by the Minister to carry out the review as at 31 December 2012 and I submit the following report setting out my findings.
Trevor Llanwarne
Government Actuary
26 August 2014

Financial condition of the HIF as at 31 December 2012
Report by the Government Actuary
Contents
1 Executive summary 1
2 Introduction and scope of the review 7
Reliances and limitations 8
3 How the Fund works 9
4 Results based on the central assumptions 11
5 Illustrative effects on the central results of variations in the assumptions 16
6 Comparison of results in this report with those from the report on the previous actuarial review 20
Summary of contributions and benefits 22
Benefits 22
Contributions 24
Fund accounts since 1 January 2008 25
Summary of data 27
Summary of methods and assumptions adopted 28
Summary of projections 42
GAD seeks to achieve a high standard in all our work. Please go to our website for details of the standards we apply.

Financial condition of the HIF as at 31 December 2012
Report by the Government Actuary
1
1 Executive summary
1.1 The Health Insurance Fund (“the Fund”) is designed to provide financial assistance to Jersey residents who need access to general practitioner services and/or prescription drugs. The Fund is financed by social security contributions.
1.2 The financial position of the Fund is, like any social security scheme, affected by a wide range of factors, including the structure of the population and economic conditions. For this reason, Article 22 of the Health Insurance (Jersey) Law 1967 (“the Law”) makes provision for an actuary to carry out reviews of the operation of the Law. In particular, paragraph (1) of that Article provides that:
“An actuary, appointed for the purpose by the Minister, shall review the operation of this Law during the period ending with 31st December 1972 and thereafter during the period ending with 31st December in every fifth year and, on each such review, make a report to the Minister on the financial condition of the Health Insurance Fund and the adequacy or otherwise of the contributions payable under this Law to support the benefits thereunder having regard to its liabilities under this Law”.
1.3 In order to meet this legislative requirement, this review:
> Considers the financial position of the Health Insurance Fund (“the Fund”) taking into account changes in legislation and Fund experience since the previous review
> Projects possible future levels of expenditure from the Fund and the contribution rates required to finance this expenditure
> Projects the balance in the Fund, assuming no change in health insurance contribution rates1.
1.4 This is my report on the latest review of the Fund, which has been carried out as at 31 December 2012, and it includes projections over the period up to 2032.
1.5 The calculations for this review involve projecting contribution income, benefit expenditure and administration expenses over the 20 years from 2012 to 2032. Two main sets of results are presented in this report:
> The projected “break-even” contribution rate; this is the rate that would be required in order for contribution income to equal expenditure on benefits and administration costs
> The balance in the Fund, expressed as a number of months’ expenditure, assuming that the current rates of contribution remain unchanged.
1 These are the part of social security contributions that are allocated to the Health Insurance Fund. Currently the health insurance contribution rates are 1.2% from employers and 0.8% from employees (or 2.0% where there is no employer).

Financial condition of the HIF as at 31 December 2012
Report by the Government Actuary
2
1.6 We were asked by the Social Security Department to carry out the review on the basis that pension age increases from 65 to 67 over the period from 2020 to 2031. The legislation to bring these changes into effect was approved by the States on 17 June 2014.
1.7 We have been asked to use three central assumptions for migration underlying the projections of the population for Jersey obtained from the States’ Statistics Unit:
> Net nil inward migration
> Net inward migration of 325 people each year
> Net inward migration of 700 people each year
1.8 Other central assumptions include:
> earnings growth of 4.25% per annum and price inflation of 1.25% per annum less than this, i.e. price inflation of 3.0% per annum
> the future rate of return on investments, net of associated expenses, will be 0.75% a year in excess of earnings increases, or 5.0% per annum nominal
> the average number of consultations per head for a given age and sex is stable and therefore changes in total numbers of consultations are driven entirely by changes in the age and sex distribution of the membership
> the number of prescription items per consultation is assumed to increase by 4.0% each year
> the rate of Medical Benefit, including payments towards the cost of GP consultation charges, GP letters of referral and pathology benefit, will increase in line with prices
> the rate of remuneration to pharmacists for dispensing costs will increase in line with price inflation, aside from tier 2 dispensing fees in the period to 2015, which will remain fixed
> the average cost of drugs (excluding dispensing costs) will increase in future in line with earnings
> expenditure on gluten-free vouchers will increase in line with prices and growth in the total membership of the Fund
> administration costs will be projected as 6.9% of benefit expenditure
> earnings limits for contributions are assumed to increase in line with general earnings growth.
1.9 The main changes in results from the 2007 review are (on the basis of comparing the 2007 review’s 150 HoH population projection variant with the 2012 review’s net inward migration of 325 people each year):
> For the period in common between the two reviews (2012 to 2027) the break-even contribution rates are initially unchanged at 2.0%, but by 2027 they are 0.7% larger in the 2012 review (excluding the effect of transfers out of the Fund).

Financial condition of the HIF as at 31 December 2012
Report by the Government Actuary
3
> Under the 2007 review, the Fund was not projected to fall below a working balance of at least 12 months’ expenditure by the end of the 20-year projection period. However, the 2012 review projects that the Fund will decline below this level halfway through the projection period, i.e. by 2022.
> At the time of the 2007 review, the date of Fund exhaustion was projected to occur after the end of the 20-year projection period, whereas under the 2012 review Fund exhaustion is projected to occur in 2025.
1.10 The main reason for the change in results since the 2007 review is the update to the assumption for future increases in numbers of prescription items per consultation (from 1.5% per annum to 4.0% per annum), which by the end of the 2007 review’s projection period in 2027 would have increased the break-even contribution rate by an additional 1.0% and would also have brought forward the projected Fund exhaustion date by 10 years. It should be noted that whilst recent data indicates a steady 4.0% per annum growth at present, this rate of increase may be affected by changes in prescribing habits over the next 20 years. There are also two other principal causes of albeit lesser impact, which – while cancelling out each other in 2012 – are projected to have different impacts on the projected break-even contribution rate in future years. These two lesser causes are:
> Recent net ingredient cost being less than expected
> Recent average number of prescription items per consultation being larger than expected.
1.11 A summary of the results of the review is shown in the following table and charts. Results are shown in constant 2012 earnings terms.
Table 1.1: Summary of projections of the break-even contribution rate (as a % of earnings up to the Standard Earnings Limit), income (based on the current contribution rate), outgo and Fund balance based on the central assumptions (£million in 2012 earnings terms)
2012 2013 2014 2015 2016 2017 2018 2019 2022 2027 2032
Net nil migration
Break-even rate2 2.0% 2.0% 2.1% 2.1% 2.2% 2.2% 2.3% 2.4% 2.6% 3.2% 3.9%
Income 37.3 29.8 29.7 29.6 29.5 29.4 29.3 29.2 28.7 27.7 26.8
Expenditure 28.4 29.4 30.0 30.6 31.5 32.4 33.3 34.3 37.5 43.9 51.8
Transfers from the Fund 6.1 1.9 5.5 5.3 0.0 0.0 0.0 0.0 0.0 0.0 0.0
Fund balance at end of year 80.5 79.0 73.2 66.9 64.9 61.9 57.9 52.7 30.0 0.0 0.0
Mean fund expressed as months of expenditure3 33 33 30 27 25 24 22 19 11 0 0
2 The break-even contribution rate represents the rate that would be required in order for contribution income to equal expenditure on benefits and administration costs, ignoring the effect of any transfers from the Fund. 3 The mean fund is expressed as months of expenditure, where expenditure excludes transfers from the Fund.

Financial condition of the HIF as at 31 December 2012
Report by the Government Actuary
4
2012 2013 2014 2015 2016 2017 2018 2019 2022 2027 2032
+325 net inward migration
Break-even rate 2.0% 2.0% 2.1% 2.1% 2.2% 2.2% 2.3% 2.4% 2.6% 3.1% 3.7%
Income 37.3 29.8 29.9 29.9 30.0 30.0 30.0 30.0 29.9 29.6 29.5
Expenditure 28.4 29.4 30.1 30.8 31.8 32.8 33.8 34.9 38.5 45.7 54.7
Transfers from the Fund 6.1 1.9 5.5 5.3 0.0 0.0 0.0 0.0 0.0 0.0 0.0
Fund balance at end of year 80.5 79.0 73.3 67.1 65.3 62.5 58.7 53.8 31.9 0.0 0.0
Mean fund expressed as months of expenditure 33 33 30 27 25 23 22 19 11 0 0
+700 net inward migration
Break-even rate 2.0% 2.0% 2.0% 2.1% 2.1% 2.2% 2.3% 2.3% 2.5% 3.0% 3.6%
Income 37.3 29.9 30.1 30.3 30.5 30.7 30.9 31.0 31.4 31.8 32.6
Expenditure 28.4 29.5 30.3 31.0 32.1 33.2 34.4 35.6 39.6 47.7 58.0
Transfers from the Fund 6.1 1.9 5.5 5.3 0.0 0.0 0.0 0.0 0.0 0.0 0.0
Fund balance at end of year 80.5 79.1 73.4 67.4 65.7 63.2 59.7 55.1 34.2 0.0 0.0
Mean fund expressed as months of expenditure 33 32 30 27 25 23 21 19 12 0 0
Figure 1.1: Projected break-even contribution rates (ignoring the cost of any transfers from the Fund4) based on the central assumptions
4 The 2007 review took transfers out of the Fund into account in the break-even contribution rate projections. However, as break-even contribution rates are intended to represent the level of contributions needed to cover expenditure in connection with the operation of the Fund and the transfers out of the Fund are for the purposes of funding primary care outside of the Fund, transfers have been excluded from the break-even contribution rates in the 2012 review.
0.0%
0.5%
1.0%
1.5%
2.0%
2.5%
3.0%
3.5%
4.0%
4.5%
2012
2013
2014
2015
2016
2017
2018
2019
2020
2021
2022
2023
2024
2025
2026
2027
2028
2029
2030
2031
2032
% of earnings
Year
Net nil migration Net 325 inward migration Net 700 inward migration

Financial condition of the HIF as at 31 December 2012
Report by the Government Actuary
5
Figure 1.2: Projected Fund balance (average for the year5 and after allowing for any transfers) expressed as months of expenditure (excluding any transfers) based on the central assumptions
1.12 In summary, the above results show that:
Break-even contribution rate
> Assuming net nil future migration, and ignoring the short-term effect of the transfers from the Fund before 2016, the break-even contribution rate is projected to increase steadily from 2.0% of earnings to 3.9% in 2032
> The break-even contribution rate is also projected to rise under the assumption of inward migration of 325 and 700 people each year, but the increase is slightly less steep, with the rate projected to increase from 2.0% to 3.7% and 3.6% in 2032, respectively. The slower rate of increase in the break-even contribution rate reflects the fact that population ageing is slower where there is assumed to be migration to the Island. However, there is very little variation by migration variant in the results by the end of the 20-year period of the projections
> The break-even contribution rates ignore the effect of any transfers from the Fund to the Department of Health and Social Services. Should it be envisaged that contribution rates be increased to mitigate the effect of such Fund transfers, the break-even contribution rates would be substantially larger in the years in which transfers are projected to occur.
5 Figure 1.2 reflects the average Fund for each year and so is consequently non-zero in 2025, the year in which the Fund is projected to be exhausted (paragraph 1.9 refers), because the Fund exists at the start of that year.
0
5
10
15
20
25
30
35
402012
2013
2014
2015
2016
2017
2018
2019
2020
2021
2022
2023
2024
2025
2026
2027
2028
2029
2030
2031
2032
Months of expenditure
Year
Net nil inward migration Net 325 inward migration Net 700 inward migration

Financial condition of the HIF as at 31 December 2012
Report by the Government Actuary
6
Fund balance
> Under all three migration scenarios, the current rate of contributions (2% of earnings) is sufficient to maintain the Fund balance of at least 12 months’ expenditure for half of the 20-year projection period, i.e. until 2022
> The Fund balance was equivalent to just under three years’ annual expenditure in 2012 and this is projected to fall to zero during 2025 under all three migration scenarios.
1.13 In addition to calculating results using the central assumptions, projections have also been made on “variant assumptions” to show how varying the assumptions can significantly affect the projected financial development of the Fund. These variant assumptions consider, for example, the number of prescription items per consultation and the increase in drug costs being financed by the Fund, two of the more important influences on the Fund’s future financial position. Assuming future increases in numbers of prescription items per consultation of 4.0% per annum reducing to 0.0% per annum after 5 years would extend the projected Fund exhaustion date from 2025 to a date beyond the end of the 20-year projection period and reduce the +325 net inward migration break-even contribution rate in 2032 from 3.7% to 2.3%, while assuming that in future drug costs increased by 1.25% above earnings, as opposed to the central assumption that they increase in line with earnings, would bring forward the projected Fund exhaustion date from 2025 to 2024 and increase the +325 net inward migration break-even contribution rate in 2032 from 3.7% to 4.3%.
1.14 There is considerable uncertainty about the future financial progress of the Fund and therefore care is needed in interpreting the projections shown in this report. It is important that the main body of this report be read in order to gain an understanding of the uncertainty and limitations surrounding the projections.
1.15 Conclusion: The financial outlook for the Fund remains healthy in the short term. However, action will need to be taken in order to ensure that the Fund can continue to meet its commitments in the longer term. For example, this might include arranging for an injection of funds to meet any shortfall between income and expenditure in the Fund or potentially not proceeding with already-planned transfers out of the Fund. The earlier such actions are taken before the Fund is exhausted, the more effective they will be. As described above, this report shows that in the absence of changes to contributions or benefits and using the central assumptions in 1.7 and 1.8 above, by 2022 the Fund is expected to fall below the policy aim of maintaining a small working balance in the Fund of at least 12 months’ expenditure and to then be extinguished during 2025. After this time, the contribution rate would need to be raised to at least the break-even rates described above. Changes to benefits such as limiting eligibility or future benefit increases could help delay the point at which contributions need to be increased as well as limiting the size of the required increase. The option exists to take action earlier and the situation should be reviewed in 2017 (if not earlier).

Financial condition of the HIF as at 31 December 2012
Report by the Government Actuary
7
2 Introduction and scope of the review
2.1 Article 22 of the Health Insurance (Jersey) Law 1967 (“the Law”) makes provision for an actuary to carry out reviews of the operation of the Law. In particular, paragraph (1) of that Article provides that:
“An actuary, appointed for the purpose by the Minister, shall review the operation of this Law during the period ending with 31st December 1972 and thereafter during the period ending with 31st December in every fifth year and, on each such review, make a report to the Minister on the financial condition of the Health Insurance Fund and the adequacy or otherwise of the contributions payable under this Law to support the benefits thereunder having regard to its liabilities under this Law”.
2.2 This is my report on the latest review of the Fund, which has been carried out as at 31 December 2012, following my appointment under 2.1 above by the Minister, and it includes projections over the period from 2012 to 2032. In order to meet the legislative requirement, this review:
> Considers the financial position of the Health Insurance Fund (“the Fund”) taking into account changes in legislation and Fund experience since the previous review
> Projects possible future levels of expenditure from the Fund and the contribution rates required to finance this expenditure
> Projects the balance in the Fund, assuming no change in health insurance contribution rates6.
2.3 The projections in this report are dependent on the data, methodology and assumptions used for the review, which are described later in this report.
2.4 This report has been prepared for the Minister for Social Security and it is anticipated that the results in the report will be used by the Social Security Department for information purposes and for planning possible changes to the contribution rate and benefits. This report only covers an actuarial assessment of the Fund’s financial condition. In making decisions about the Fund, it will also be appropriate to take into account non-actuarial matters such as legal, administrative and policy issues.
2.5 My previous report dated 8 November 2011 was based on the period to 31 December 2007 and showed that, as that date, a Fund balance had been built up which was equivalent to over three times annual expenditure. This was in compliance with the stated policy aim of maintaining a small working balance in the Fund of at least 12 months’ expenditure. It should be recognised, however, that not all of the Fund assets would be available to help meet expenditure because they are not very liquid (for example, debtors).
6 These are the part of social security contributions that are allocated to the Health Insurance Fund. Currently the health insurance contribution rates are 1.2% from employers and 0.8% from employees (or 2.0% where there is no employer).
Financial condition of the HIF as at 31 December 2012
Report by the Government Actuary
8
2.6 The structure of the rest of this report is as follows:
Section 3 A discussion of how the Fund works and the main changes that have occurred since the previous review
Section 4 The results of the projections of the income, expenditure and Fund balance up to 2032, based on the central assumptions for the review
Section 5 The results of the projections based on alternative assumptions
Section 6 A comparison of the results at this review with those at the previous review
2.7 The appendices provide further background details on the review.
2.8 Under legislation, the next review of the Fund is due to be carried out as at 31 December 2017, or earlier as the Minister may direct.
Reliances and limitations
2.9 This report has been prepared for the Minister for Social Security and the Social Security Department, although it is understood that the report will be made publicly available. However, GAD does not accept any liability to third parties in relation to this report.
2.10 GAD has relied on the accuracy of data and information provided by the Minister and the Social Security Department (“the Client”). We do not accept responsibility for advice based on wrong or incomplete data or information provided by the Client. We have reproduced in the Appendices to this report our understanding of the legislative environment, benefit and contribution rates and the financial data provided to us.
2.11 Clarification should be sought if the Client has any doubt about the intention or scope of advice provided in this report. GAD is not responsible for any decision taken by the Client, except to the extent that the decision has been made in accordance with specific advice I have provided.
2.12 The advice provided must be taken in context. Advice is intended to be read and used as a whole and not in parts. GAD does not accept responsibility for advice that is altered or used selectively.
2.13 It is anticipated that the results in this report will be used by the Client for information purposes and for considering possible changes to contributions or benefits payable. However, before deciding on any potential changes, further actuarial advice should be sought in order to confirm the potential impact on the finances of the Fund. Furthermore, in making decisions about the Fund, it will also be appropriate to take into account non-actuarial matters, such as legal, administrative and policy issues.

Financial condition of the HIF as at 31 December 2012
Report by the Government Actuary
9
3 How the Fund works
3.1 The Fund is designed to provide financial assistance to Jersey residents who need access to general practitioner (GP) services. In particular, where someone covered by the Fund needs to visit their GP, the Fund makes a payment (“the Medical Benefit”) that is used to partially offset the doctor’s consultation charge (the patient meets the balance of the cost). Furthermore, the full cost of any drugs prescribed by the GP is borne by the Fund, provided those drugs are included on a “prescribed list” drawn up by the Minister.
3.2 The Fund is financed by social security contributions. Employees and their employer pay a total of 2% of earnings up to the Standard Earnings Limit (SEL). Similar contributions are paid by self-employed and non-employed persons unless they are exempt. There are no contributions payable to the Fund by the States, and in particular the supplementation rules7 that apply in the Social Security Fund do not apply to the Health Insurance Fund.
3.3 A summary of the benefits provided and the contributions payable to the Fund is given in Appendix A. A summary of the Fund accounts for the years 2008 to 2012 is set out in Appendix B. Appendix C provides a summary of the data used for the review.
3.4 There have been a number of changes affecting the operation of the Fund since the previous actuarial review, in particular:
> Health Insurance Exception (HIE) status was abolished at the same time as the introduction of the Income Support system with effect from 28 January 2008. Prior to this date, those classified as HIEs received a more generous package of benefits from the Fund and the States made a contribution to the Fund in respect of these additional benefits. Following the abolition of the HIE status, all members of the Fund now receive the same scale of benefits and no contribution is received from the States
> The prescription charge payable by patients was reduced to zero with effect from 1 February 2008 and therefore from this date the Fund has to meet the full dispensing cost of prescription drugs
> An enhanced rate of Medical Benefit payable in certain circumstances where the patient may be suffering from a strain of pandemic influenza was temporarily introduced during 2009
> A new benefit (“Pathology Benefit”) from the Fund to meet the cost of certain pathology tests was introduced with effect from 1 January 2010.
7 Broadly, under the Social Security Fund, if a member’s earnings are below the Standard Earnings Limit (SEL), they are credited with the difference between contributions based on actual earnings and contributions based on the SEL; this is known as supplementation.

Financial condition of the HIF as at 31 December 2012
Report by the Government Actuary
10
3.5 The impact of these changes was already taken into account in the 2007 review, as it was published in 2011, after these changes were introduced, and where appropriate we have continued to allow for these in this 2012 report. For simplicity, we have assumed in the 2012 review that the changes taking place from early 2008 occurred on 31 December 2007.
3.6 In addition, P125/2010 from the Minister for Social Security brought into effect the funding arrangements providing for a transfer of £6.131 million from the Fund to the Department of Health and Social Services in each of 2011 and 2012. The purpose of these transfers was to help finance primary care services. Further, the current Medium Term Financial Plan (MTFP) includes agreed transfers of £2 million for 2013 and £6 million for each of 2014 and 2015; these have been included in this report.
3.7 We were asked by the Social Security Department to carry out the review on the basis that pension age increases from 65 to 67 over the period from 2020 to 2031. The legislation to bring these changes into effect was approved by the States on 17 June 2014.
3.8 The assumption was made in the report on the 2007 review that the Fund assets were invested in cash deposits, which was the situation as at the review date of 31 December 2007. However, we understand that there is now a strategic aim to invest 40% of the Fund in equities, 45% in corporate bonds and the remaining 15% in cash; the Fund projections in this report on the 2012 review have taken this into account. As the investment strategy should lead to an increase in investment returns in comparison with cash returns, this will act to lengthen the period until the Fund is extinguished (other things being equal), although the impact might not be great.
3.9 The Fund has been financed in such a way that the bulk of contribution income in a year should be used to meet expenditure in that year (ignoring transfers from the Fund to the Department of Health and Social Services). Therefore no substantial fund is built up out of which to meet future expenditure. However, it is the aim that there should be a small balance in the Fund in order to protect against unexpected fluctuations in income or expenditure and to give appropriate notice to employers and employees of any required changes to the contribution rate. The policy is currently that the Fund should hold a balance equal to at least 12 months’ expenditure.
3.10 The average Fund balance over 2012 stood at a little under three times the annual Fund expenditure in that year. However, it should be recognised that not all of the Fund assets would be available to help meet expenditure because they are not very liquid, such as debtors.

Financial condition of the HIF as at 31 December 2012
Report by the Government Actuary
11
4 Results based on the central assumptions
4.1 The calculations for this review involve projecting contribution income, benefit expenditure and administration expenses over the 20 years from 2012 to 2032. Two main sets of results are presented in this report:
> The projected “break-even” contribution rate (see 4.2)
> The balance in the Health Insurance Fund, expressed as a number of months’ expenditure, assuming that the current rates of contribution remain unchanged; for this purpose expenditure excludes any transfers from the Fund.
4.2 The break-even contribution rate is the rate that would be required in order for contribution income to equal expenditure on benefits and administration costs, ignoring any transfers from the Fund to the Department of Health and Social Services. This is the contribution rate that would be required if the Fund were following the pay-as-you-go approach to financing benefits and administration costs.
4.3 While projections of Fund balances are subject to a great deal of uncertainty, these results give an indication as to the extent to which the build-up of funds can be used as a buffer against poor experience and to delay increases to contribution rates which would otherwise be required. If no fund of assets had been built up, the contribution rate would need to follow the break-even rates (assuming that other potential options, such as reducing benefits or securing funding from alternative sources were not pursued).
4.4 Where results are given as monetary values, they are shown in constant 2012 earnings terms.
4.5 The projections in this section are based on the following central assumptions, discussed in more detail in Appendix D:
> We have been asked to use three central assumptions for migration underlying the projections of the population for Jersey obtained from the States’ Statistics Unit:
> Net nil inward migration > Net inward migration of 325 people each year > Net inward migration of 700 people each year
> earnings growth of 4.25% per annum and price inflation of 1.25% per annum less than this, i.e. price inflation of 3.0% per annum
> the future rate of return on investments, net of associated expenses, will be 0.75% a year in excess of earnings increases, or 5.0% per annum nominal
> the average number of consultations per head for a given age and sex is stable and therefore changes in total numbers of consultations are driven entirely by changes in the age and sex distribution of the membership
> the number of prescription items per consultation are assumed to increase by 4.0% each year
> the rate of Medical Benefit, including payments towards the cost of GP consultation charges, GP letters of referral and pathology benefit, will increase in line with prices

Financial condition of the HIF as at 31 December 2012
Report by the Government Actuary
12
> the rate of remuneration to pharmacists for dispensing costs will increase in line with price inflation, aside from tier 2 dispensing fees in the period to 2015, which will remain fixed
> the average cost of drugs (excluding dispensing costs) will increase in future in line with earnings
> expenditure on gluten-free vouchers will increase in line with prices and growth in the total membership of the Fund
> administration costs will be projected as 6.9% of benefit expenditure
> earnings limits for contributions are assumed to increase in line with general earnings growth.
4.6 More details of the central assumptions can be found in Appendix D. The following table shows the estimates of the income and outgo from the Fund, the build up of the Fund balance and the break-even contribution rate over the period to 2032. More detailed results are given in Appendix E.
Table 4.1: Summary of projections of the break-even contribution rate (as a % of earnings up to the Standard Earnings Limit), income (based on the current contribution rate), expenditure and Fund balance based on the central assumptions (£million in 2012 earnings terms)
2012 2013 2014 2015 2016 2017 2018 2019 2022 2027 2032
Net nil migration
Break-even rate8 2.0% 2.0% 2.1% 2.1% 2.2% 2.2% 2.3% 2.4% 2.6% 3.2% 3.9%
Income 37.3 29.8 29.7 29.6 29.5 29.4 29.3 29.2 28.7 27.7 26.8
Expenditure 28.4 29.4 30.0 30.6 31.5 32.4 33.3 34.3 37.5 43.9 51.8
Transfers from the Fund 6.1 1.9 5.5 5.3 0.0 0.0 0.0 0.0 0.0 0.0 0.0
Fund balance at end of year 80.5 79.0 73.2 66.9 64.9 61.9 57.9 52.7 30.0 0.0 0.0
Mean fund expressed as months of expenditure9 33 33 30 27 25 24 22 19 11 0 0
+325 net inward migration
Break-even rate 2.0% 2.0% 2.1% 2.1% 2.2% 2.2% 2.3% 2.4% 2.6% 3.1% 3.7%
Income 37.3 29.8 29.9 29.9 30.0 30.0 30.0 30.0 29.9 29.6 29.5
Expenditure 28.4 29.4 30.1 30.8 31.8 32.8 33.8 34.9 38.5 45.7 54.7
Transfers from the Fund 6.1 1.9 5.5 5.3 0.0 0.0 0.0 0.0 0.0 0.0 0.0
Fund balance at end of year 80.5 79.0 73.3 67.1 65.3 62.5 58.7 53.8 31.9 0.0 0.0
Mean fund expressed as months of expenditure 33 33 30 27 25 23 22 19 11 0 0
8 The break-even contribution rate represents the rate that would be required in order for contribution income to equal expenditure on benefits and administration costs, ignoring the effect of any transfers from the Fund. 9 The mean fund is expressed as months of expenditure, where expenditure excludes transfers from the Fund.

Financial condition of the HIF as at 31 December 2012
Report by the Government Actuary
13
2012 2013 2014 2015 2016 2017 2018 2019 2022 2027 2032
+700 net inward migration
Break-even rate 2.0% 2.0% 2.0% 2.1% 2.1% 2.2% 2.3% 2.3% 2.5% 3.0% 3.6%
Income 37.3 29.9 30.1 30.3 30.5 30.7 30.9 31.0 31.4 31.8 32.6
Expenditure 28.4 29.5 30.3 31.0 32.1 33.2 34.4 35.6 39.6 47.7 58.0
Transfers from the Fund 6.1 1.9 5.5 5.3 0.0 0.0 0.0 0.0 0.0 0.0 0.0
Fund balance at end of year 80.5 79.1 73.4 67.4 65.7 63.2 59.7 55.1 34.2 0.0 0.0
Mean fund expressed as months of expenditure 33 32 30 27 25 23 21 19 12 0 0
4.7 The break-even rate and Fund balance expressed as months of outgo are illustrated in the following charts for each migration assumption.
Figure 4.1: Projected break-even contribution rates (ignoring the cost of any transfers from the Fund10) based on the central assumptions
10 The 2007 review took transfers out of the Fund into account in the break-even contribution rate projections. However, as break-even contribution rates are intended to represent the level of contributions needed to cover expenditure in connection with the operation of the Fund and the transfers out of the Fund are for the purposes of funding primary care outside of the Fund, transfers have been excluded from the break-even contribution rates in the 2012 review.
0.0%
0.5%
1.0%
1.5%
2.0%
2.5%
3.0%
3.5%
4.0%
4.5%
2012
2013
2014
2015
2016
2017
2018
2019
2020
2021
2022
2023
2024
2025
2026
2027
2028
2029
2030
2031
2032
% of earnings
Year
Net nil migration Net 325 inward migration Net 700 inward migration

Financial condition of the HIF as at 31 December 2012
Report by the Government Actuary
14
Figure 4.2: Projected Fund balance (average for the year11 and after allowing for any transfers) expressed as months of expenditure (excluding any transfers) based on the central assumptions
4.8 In summary, the results show that based on the central assumptions:
Break-even contribution rate
> Assuming net nil future migration, and ignoring the short-term effect of the transfers from the Fund before 2016, the break-even contribution rate is projected to increase steadily from 2.0% of earnings to 3.9% in 2032
> The break-even contribution rate is also projected to rise under the assumption of inward migration of 325 and 700 people each year, but the increase is slightly less steep, with the rate projected to increase from 2.0% to 3.7% and 3.6% in 2032, respectively. The slower rate of increase in the break-even contribution rate reflects the fact that population ageing is slower where there is assumed to be migration to the Island. However, there is very little variation by migration variant in the results by the end of the 20-year period of the projections
> The break-even contribution rates ignore the effect of any transfers from the Fund to the Department of Health and Social Services. Should it be envisaged that contribution rates be increased to mitigate the effect of such Fund transfers, the break-even contribution rates would be substantially larger in the years in which transfers are projected to occur.
11 Figure 1.2 reflects the average Fund for each year and so is consequently non-zero in 2025, the year in which the Fund is projected to be exhausted (paragraph 1.9 refers), because the Fund exists at the start of that year.
0
5
10
15
20
25
30
35
40
2012
2013
2014
2015
2016
2017
2018
2019
2020
2021
2022
2023
2024
2025
2026
2027
2028
2029
2030
2031
2032
Months of expenditure
Year
Net nil inward migration Net 325 inward migration Net 700 inward migration

Financial condition of the HIF as at 31 December 2012
Report by the Government Actuary
15
Fund balance
> Under all three migration scenarios, the current rate of contributions (2% of earnings) is sufficient to maintain the Fund balance of at least 12 months’ expenditure for half of the 20-year projection period, i.e. until 2022
> The Fund balance was equivalent to just under three years’ expenditure in 2012 and this is projected to fall to zero during 2025 under all three migration scenarios.
4.9 The main reason for the above change in break-even contribution rates since the 2007 review is the update to the assumption for future increases in numbers of prescription items per consultation (from 1.5% per annum to 4.0% per annum). There are two other causes of lesser impact, which – while cancelling out each other in 2012 – are projected to have different impacts on the projected break-even contribution rate in future years. These two lesser causes are:
> Recent net ingredient cost being less than expected
> Recent average number of prescription items per consultation being larger than expected.
In addition, the further transfers out of the Fund scheduled under the terms of the 2013 to 2015 Medium Term Financial Plan (MTFP) bring forward the projected Fund exhaustion date by one year.
Section 6 discusses these effects in more detail.
4.10 We were asked by the Social Security Department to carry out the review on the basis that pension age increases from 65 to 67 over the period from 2020 to 2031. The legislation to bring these changes into effect was approved by the States on 17 June 2014.

Financial condition of the HIF as at 31 December 2012
Report by the Government Actuary
16
5 Illustrative effects on the central results of variations in the assumptions
5.1 The projections of this review are sensitive to the assumptions made:
> benefit assumptions (for example, the number of prescription items per consultation, the cost of drugs, the number of consultations and the rate of Medical Benefit)
> membership assumptions, in particular the migration assumption and the proportion of the population that is contributing
> economic assumptions (for example, the investment return on the Fund and the relationship between earnings growth and price inflation).
5.2 The projections are also sensitive to other possible future events which are not the subject of explicit assumptions, for example climate change, pandemic disease or a change to the benefit or contribution structure.
5.3 For these reasons, there is considerable uncertainty about the future progress of the Fund. While the assumptions adopted form a reasonable basis for the review, in practice the Fund’s experience, and hence its financial progress, will be different. These differences will be analysed and taken into account in subsequent reports. It is important for readers of this report not to place undue emphasis on a single set of projection results. Instead, it is appropriate to consider the effect on the Fund if actual experience differs from the central assumptions.
5.4 I have therefore also prepared results on the basis of variant, but still plausible, assumptions. The variant assumptions that have been considered are in Table 5.1.
5.5 In addition to the variants in Table 5.1, the central assumptions already incorporate three assumptions about future migration to Jersey.
5.6 The variant assumptions are intended to provide a reasonable indication of the uncertainty in the Fund’s future finances. However, they do not represent the limits of the range of possible future experience, which could be more or less favourable than shown by these assumptions.
5.7 The assumptions made in this review are interdependent. Therefore, when considering the effect of varying more than one assumption, it may not be appropriate simply to combine the different variant projection results shown in this report.
5.8 Tables 5.2 and 5.3 show the estimates of the break-even contribution rate, the Fund balance expressed as months of outgo and the projected Fund exhaustion date, based on the variant assumptions. For simplicity, these results have all been shown only on the +325 net inward migration population projection variant and they exclude the effect of transfers from the Fund to the Department of Health and Social Services.
5.9 These results illustrate that changes to the assumptions can have a significant effect on the Fund’s projected financial progress. It is therefore important that the sensitivity of the results to the assumptions is taken into account when considering the findings of this report.

Financial condition of the HIF as at 31 December 2012
Report by the Government Actuary
17
Table 5.1: Variant assumptions considered
Central assumption Variant assumption
a. Reduction in contribution income
Based on projections underlying the actuarial review of the Social Security Fund as at 31 December 2012
A 5% reduction in contribution income
b. Relationship between earnings growth and price inflation
1.25% per annum (difference between nominal earnings growth of 4.25% per annum and Jersey RPI of 3.0% per annum)
Central assumption plus 0.5% per annum
Central assumption minus 0.5% per annum (equivalent to a Jersey RPI assumption of 3.5% per annum)
c. Rate of increase in Medical Benefit (payments toward GP consultation charges, GP letters of referral and pathology benefit)
In line with prices Central assumption plus 2.5% per annum, i.e. earnings plus 1.25% per annum
Central assumption plus 1.25% per annum, i.e. in line with earnings
Central assumption minus 1.25% per annum
d. Rate of increase in net ingredient cost of drugs
In line with earnings Central assumption plus 1.25% per annum
Central assumption minus 1.25% per annum, i.e. in line with prices
Central assumption minus 4.25% per annum, i.e. no increases
Central assumption minus 7.25% per annum, i.e. a 3% per annum decline
e. Increase in number of prescription items per consultation
4.0% per annum 4.0% per annum for 5 years, then 0.0% per annum
4.0% per annum for 5 years then 2.0% per annum
f. Number of consultations per head
Average number of consultations per head by age and sex is a fixed scale, so consultation numbers driven by the population projections
Beyond the combined effect of the fixed scale and the population projection:
A 1% per annum increase in consultation numbers
A 1% per annum decline in consultation numbers
A one-off temporary 200,000 increase in consultations12 in 2014 only13
g. Rate of investment return
0.75% per annum in excess of earnings (5.0% per annum nominal)increases
Central assumption plus 1.25% per annum
Central assumption minus 1.25% per annum
h. Combination of b. and e.
Central assumption for the relationship between earnings growth and price inflation minus 0.5% per annum,
together with increase in number of prescription items per consultation of 4.0% per annum for 5 years then 2.0% per annum
12 This is accompanied by a corresponding increase in the number of letters of referral and prescription items. 13 This is intended to illustrate the potential effect of a one-off short-term health crisis, such as an epidemic.
Financial condition of the HIF as at 31 December 2012
Report by the Government Actuary
18
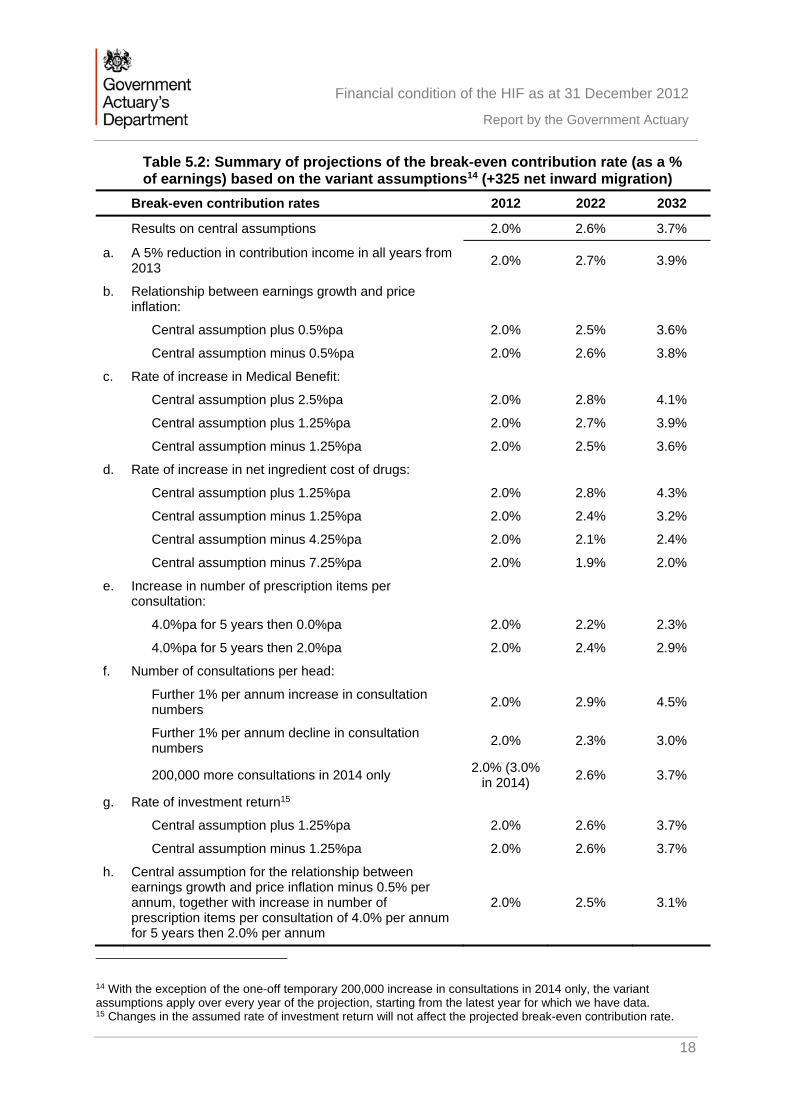
Table 5.2: Summary of projections of the break-even contribution rate (as a % of earnings) based on the variant assumptions14 (+325 net inward migration)
Break-even contribution rates 2012 2022 2032
Results on central assumptions 2.0% 2.6% 3.7%
a. A 5% reduction in contribution income in all years from 2013
2.0% 2.7% 3.9%
b. Relationship between earnings growth and price inflation:
Central assumption plus 0.5%pa 2.0% 2.5% 3.6%
Central assumption minus 0.5%pa 2.0% 2.6% 3.8%
c. Rate of increase in Medical Benefit:
Central assumption plus 2.5%pa 2.0% 2.8% 4.1%
Central assumption plus 1.25%pa 2.0% 2.7% 3.9%
Central assumption minus 1.25%pa 2.0% 2.5% 3.6%
d. Rate of increase in net ingredient cost of drugs:
Central assumption plus 1.25%pa 2.0% 2.8% 4.3%
Central assumption minus 1.25%pa 2.0% 2.4% 3.2%
Central assumption minus 4.25%pa 2.0% 2.1% 2.4%
Central assumption minus 7.25%pa 2.0% 1.9% 2.0%
e. Increase in number of prescription items per consultation:
4.0%pa for 5 years then 0.0%pa 2.0% 2.2% 2.3%
4.0%pa for 5 years then 2.0%pa 2.0% 2.4% 2.9%
f. Number of consultations per head:
Further 1% per annum increase in consultation numbers
2.0% 2.9% 4.5%
Further 1% per annum decline in consultation numbers
2.0% 2.3% 3.0%
200,000 more consultations in 2014 only 2.0% (3.0%
in 2014) 2.6% 3.7%
g. Rate of investment return15
Central assumption plus 1.25%pa 2.0% 2.6% 3.7%
Central assumption minus 1.25%pa 2.0% 2.6% 3.7%
h. Central assumption for the relationship between earnings growth and price inflation minus 0.5% per annum, together with increase in number of prescription items per consultation of 4.0% per annum for 5 years then 2.0% per annum
2.0% 2.5% 3.1%
14 With the exception of the one-off temporary 200,000 increase in consultations in 2014 only, the variant assumptions apply over every year of the projection, starting from the latest year for which we have data. 15 Changes in the assumed rate of investment return will not affect the projected break-even contribution rate.

Financial condition of the HIF as at 31 December 2012
Report by the Government Actuary
19
Table 5.3: Summary of projections of the Fund balance expressed as months of expenditure and projected Fund exhaustion date, based on the variant assumptions16 (+325 net inward migration)
Projected Fund, expressed in terms of number of months of benefit expenditure
2012 2022 2032
Projected Fund exhaustion date
Results on central assumptions 33 11 0 2025
a. A 5% reduction in contribution income in all years from 2013 33 7 0 2024
b. Relationship between earnings growth and price inflation:
Central assumption plus 0.5%pa 33 13 0 2026
Central assumption minus 0.5%pa 33 10 0 2025
c. Rate of increase in Medical Benefit:
Central assumption plus 2.5%pa 33 7 0 2024
Central assumption plus 1.25%pa 33 9 0 2024
Central assumption minus 1.25%pa 33 13 0 2026
d. Rate of increase in net ingredient cost of drugs:
Central assumption plus 1.25%pa 33 7 0 2024
Central assumption minus 1.25%pa 33 15 0 2027
Central assumption minus 4.25%pa 33 26 11 Beyond 2032
Central assumption minus 7.25%pa 33 37 43 Beyond 2032
e. Increase in number of prescription items per consultation:
4.0%pa for 5 years then 0.0%pa 33 17 2 Beyond 2032
4.0%pa for 5 years then 2.0%pa 33 14 0 2027
f. Number of consultations per head:
Further 1% per annum increase in consultation numbers 33 5 0 2023
Further 1% per annum decline in consultation numbers 33 18 0 2029
200,000 more consultations in 2014 only 33 7 0 2024
g. Rate of investment return
Central assumption plus 1.25%pa 33 14 0 2026
Central assumption minus 1.25%pa 33 10 0 2025
h. Central assumption for the relationship between earnings growth and price inflation minus 0.5% per annum, together with increase in number of prescription items per consultation of 4.0% per annum for 5 years then 2.0% per annum
33 13 0 2026
16 With the exception of the one-off temporary 200,000 increase in consultations in 2014 only, the variant assumptions apply over every year of the projection, starting from the latest year for which we have data.

Financial condition of the HIF as at 31 December 2012
Report by the Government Actuary
20
6 Comparison of results in this report with those from the report on the previous actuarial review
6.1 In order to understand more fully the factors affecting the Fund’s financial position, it is useful to compare the results obtained at this review with those from the previous review as at 31 December 2007. In this section we have compared the 150 HoH population projection-based results from the 2007 review with the 325 net inward migration population projection-based results from the 2012 review, this 2012 population projection variant being broadly equivalent to the 150 HoH population projection, which corresponded to 324 individual migrants each year. We compare break-even contribution rates and then go on to consider the change in projected date of Fund exhaustion.
Break-even contribution rates
Table 6.1: Comparison of results in this report with those from the report on the previous actuarial review – break-even contribution rates (%), ignoring the effect of any transfers from the Fund
Year of projection 2012 2017 2022 2027
2007 review (150 HoH) 1.9 2.0 2.2 2.4
2012 review (+325 migration) 2.0 2.2 2.6 3.1
6.2 The main reason for the above change in break-even contribution rates since the 2007 review is the update to the assumption for future increases in numbers of prescription items per consultation (from 1.5% per annum to 4.0% per annum) , which by the end of the 2007 review’s projection period in 2027 would have increased the break-even contribution rate by an additional 1.0% and would also have brought forward the projected Fund exhaustion date by 10 years. It should be noted that whilst recent data indicates a steady 4.0% per annum growth at present, this rate of increase may be affected by changes in prescribing habits over the next 20 years. There are also two other causes of lesser impact, which – while cancelling out each other in 2012 – are projected to have different impacts on the projected break-even contribution rate in future years. These two lesser causes are:
> Recent average number of prescription items per consultation larger than expected: the increase between the 2007 review and the 2012 review was double that projected for 2012
> Recent net ingredient cost being less than expected: a decrease between the 2007 review and the 2012 review of 25%, compared with that projected for 2012.
Further information relating to these items is included in Appendix D.
6.3 Table 6.2 summarises the effect of these changes on break-even contribution rates.

Financial condition of the HIF as at 31 December 2012
Report by the Government Actuary
21
Table 6.2: Analysis of changes in break-even contribution rates (%) between the 2007 and 2012 reviews, ignoring the effect of any transfers from the Fund
2012 2017 2022 2027
2007 review (150 HoH) break-even contribution rate 1.9 2.0 2.2 2.4
Updated assumption regarding future increases in the number of prescription items per consultation 0.1 0.3 0.6 1.0
Recent prescription item numbers per consultation larger than expected 0.2 0.2 0.2 0.2
Recent net ingredient cost less than expected -0.2 -0.3 -0.3 -0.4
Other 0.0 0.0 -0.1 -0.1
2012 review (+325 migration) break-even contribution rate
2.0 2.2 2.6 3.1
Projected date of Fund exhaustion
6.4 The projected Fund exhaustion date under the 150 HoH population projection-based results from the 2007 review fell after the end of the 20-year projection period at the time, i.e. Fund exhaustion was projected to occur in 2033. Under the 325 net inward migration population projection-based results in the 2012 review the projected Fund exhaustion date is 2025. The main reasons for this change since the 2007 review are the same as in 6.2 above. In addition, the further transfers out of the Fund scheduled under the terms of the 2013 to 2015 Medium Term Financial Plan (MTFP) bring forward the projected Fund exhaustion date by one year but the change in investment strategy in paragraph 3.8 and the resultant increase in assumed investment return described in paragraph D.13 (which also allows for the change in outlook for investment returns between the 2007 and 2012 reviews) extend the projected Fund exhaustion date by a year.
Table 6.3: Analysis of changes in projected Fund exhaustion date between the 2007 and 2012 reviews
Item Effect (years) Projected Fund exhaustion date
2007 review (150 HoH) 2033
Updated assumption regarding future increases in the number of prescription items per consultation
-10 2023
Recent prescription item numbers per consultation larger than expected
-3 2020
Recent net ingredient cost less than expected 5 2025
Allowance for additional transfers out of the Fund, per the 2013 to 2015 MTFP
-1 2024
Change in investment strategy and assumed future returns
1 2025
Other 0 2025
2012 review (+325 migration) 2025

Financial condition of the HIF as at 31 December 2012
Report by the Government Actuary
22
Summary of contributions and benefits
This appendix summarises the principal provisions regarding the contributions and benefits set out in the Health Insurance (Jersey) Law 1967 as at 1 May 2014 on which the estimates in this review have been based. This summary concentrates on those aspects of the benefit entitlement and contributions payable that are significant in financial terms. The 2012 review has also allowed for the increases in pension age legislated on 17 June 2014.
Benefits
Eligibility To be eligible for the benefits, the individual must have been resident in Jersey and paid the appropriate social security contributions (unless exempt) for at least six months.
Medical Benefit (refunds in respect of GP consultation charges, GP letters of referral and pathology benefit)
The scheme provides a payment towards the cost of consultations with a general practitioner. This benefit was £15 at 31 December 2007 (the date of the last review), increasing to £19 from 17 May 2010, £19.59 from July 2011 and £20.28 from 27 June 2012. The patient is required to meet the difference between the doctor’s actual charge and the rate of Medical Benefit.
The Medical Benefit is also payable for an “item of service”, which is a letter of referral from the GP to a consultant.
During 2009, a higher rate of Medical Benefit was introduced in certain circumstances where a patient was suffering symptoms consistent with pandemic influenza. This benefit was only paid during 2009 and was formally withdrawn on 8 September 2010. This was taken into account in the 2007 review.
With effect from 1 January 2010, a pathology benefit was introduced at the rate of £10 in respect of the charges made for tests relating to haematology and clinical chemistry. This increased to £10.35 in June 2012.
Pharmaceutical benefit
The Social Security Department provides a benefit from the Health Insurance Fund in respect of approved drugs prescribed by GPs or dentists and dispensed by community pharmacists. In addition to meeting the cost of the drug itself, the Department pays a dispensing fee for each prescription dispensed, and a formula is applied to the value of discount achieved by the pharmacist, to create the total remuneration package. The scheme pays the full dispensing cost of drugs prescribed by the patient’s GP or dentist. The prescription charge (the part of the drug cost met by the patient) was set to zero in February 2008. Drugs must be on the “prescribed list” designated by the Minister for Social Security in order to qualify for support from the Fund. Dispensing fees were increased in 2010 and were uprated again in May 2013. A two-tier rate was also introduced in respect of the basic dispensing fee paid to an approved pharmacist for each

Financial condition of the HIF as at 31 December 2012
Report by the Government Actuary
23
item of pharmaceutical benefit supplies. For the period from 1 May to 30 September 2013 inclusive, a pharmacist will receive a basic dispensing fee of £3.40 for the first 20,833 items supplied (the first tier) and a basic dispensing fee of £3.13 for each further item dispensed in the period (the second tier).
After that, for each year commencing on 1st October 2013 or its anniversary, a pharmacist will receive a basic dispensing fee of £3.45 for the first 50,000 items he or she supplies, and a basic dispensing fee of £3.13 for each further item dispensed in the period. The first tier basic dispensing fee is due to increase in line with the annual increase in 30 June Jersey RPI(Y) for years up to and including 2015.
There is provision for the aggregate amount payable to an approved supplier in respect of the supply of pharmaceutical benefit in any month to be reduced by a percentage determined according to the aggregate value of the basic ingredient price of the items supplied. At the time of the 2007 review, the reductions were designed to recoup 40% of the discounts received by pharmacists across all pharmacies and items dispensed. From May 2013 the rates were halved and the discount formula revised to claw-back 20%, enabling pharmacies to retain a larger proportion of any discount they achieved. As of October 2013 this reduced to 15%.
Gluten-free vouchers
Vouchers are provided for individuals who cannot take gluten in their diet. The value of the vouchers increased from £13.50 per beneficiary per week to £14 per beneficiary per week in 2009.
Low income benefits Prior to 28 January 2008, certain individuals on a low income were designated health insurance exceptions (HIEs). HIE members qualified for a more generous scale of benefits, in particular, the whole of the cost of a consultation with a general practitioner was met by the Fund and they also did not have to pay the prescription charge. 40% of the cost of benefits for HIEs was met by a special payment to the Fund from the States.
HIE status was abolished with effect from 28 January 2008. Alternative measures have been put in place to help protect poorer individuals but from the perspective of the Fund all members are now treated identically. For simplicity, it has been assumed that this change took place on 31 December 2007.

Financial condition of the HIF as at 31 December 2012
Report by the Government Actuary
24
Contributions
Standard Earnings Limit (SEL)
£3,778 per month in 2012
Class 1 contributions Class 1 contributions are required from everyone on the Island between school leaving age and pension age who works for an employer for more than eight hours a week, with some exceptions. Employees and employers both pay Class 1 contributions, based on the employee’s earnings.
The contribution to the Jersey Health Insurance Fund is 2% of earnings up to the SEL, split 1.2% from the employer and 0.8% from the employee. There is no State contribution.
The employee does not need to pay contributions if they are over pension age, or meet certain other conditions.
Class 2 contributions Those who do not pay Class1 contributions pay Class 2 contributions, unless they are exempt.
The contribution to the Jersey Health Insurance Fund is 2% of the SEL, or 2% of actual earnings up to the SEL where the individual is eligible to pay earnings-related contributions. There is no States contribution.
A self-employed person does not pay contributions if they are over pension age, or meet certain other criteria.
States of Jersey vote
Following the abolition of Health Insurance Exception status, the States no longer make a payment to the Fund.

Financial condition of the HIF as at 31 December 2012
Report by the Government Actuary
25
Fund accounts since 1 January 2008
B.1 A summary of the transactions of the Health Insurance Fund in the period since 31 December 2007 appears in Table B.1. These figures are taken from the Fund’s audited accounts.
Table B.1: Income and outgo of the Health Insurance Fund in the period from 1 January 2008 to 31 December 2012 (£ thousands)
2008 2009 2010 2011 2012
Fund at year start 63,435 72,098 77,476 83,053 77,696
Contributions 27,549 28,912 28,660 28,519 28,915
States of Jersey Vote 125 - - - -
Net gains and income on investments 3138 341 2,574 1,396 8,406
Pharmaceutical Discounts 158 38 - - -
Total Income 30,970 29,291 31,234 29,915 37,321
Medical Benefit 5,404 5,785 7,102 10,366 9,092
Pharmaceutical benefit (net of prescription charges) 15,608 16,485 16,703 17,002 17,398
Gluten-free food vouchers 142 154 180 185 222
Transfer for primary care funding - - - 6,131 6,131
Administration costs 1,153 1,489 1,672 1,588 1,638
Total outgo 22,307 23,913 25,657 35,272 34,481
Excess of income over outgo 8,663 5,378 5,577 (5,357) 2,840
Fund at year end 72,098 77,476 83,053 77,696 80,536
Ratio of mean fund/outgo in terms of months (ignoring transfers for primary care funding) 37 38 38 34 33
B.2 Before allowing for transfers for primary care funding, contribution income exceeded expenditure in each of the years from 2008 to 2012, apart from 2011, while the average Fund was around 3 times annual expenditure in all years.
B.3 We have also had sight of the signed (unaudited) accounts for the year to 31 December 2013. These indicated that as at 31 December 2013 the net asset value of the Fund was £86.1 million, representing an increase of around £5.5 million since the end of 2012. Had the 2012 review of the Health Insurance Fund been based on this later net asset value, the projected Fund exhaustion date on the central assumptions would have remained unchanged (the projected break-even contribution rate is independent of Fund value and so is not affected).

Financial condition of the HIF as at 31 December 2012
Report by the Government Actuary
26
B.4 A summary of the assets held of the Health Insurance Fund as at 31 December 2012 is given in Table B.2.
Table B.2: Summary of the market value of the assets of the Health Insurance Fund as at 31 December 2012
£million %
UK equities 13.6 17
Global equities 13.3 17
Global passive equity 1.9 2
Long term corporate bonds 26.4 33
Short term corporate bonds 6.5 8
Long term cash 8.3 10
Net debtors 10.2 13
Fixed assets 0.3 0
Total 80.5 100
B.5 As mentioned in paragraph 3.8, the assumption was made in the report on the 2007 review that the Fund assets were invested in cash deposits, which was the situation as at the review date of 31 December 2007, and so there is no equivalent table for the 2007 review.

Financial condition of the HIF as at 31 December 2012
Report by the Government Actuary
27
Summary of data
C.1 The accuracy of the numerical results of the review is dependent on the data on which they are based. If the data contain material inaccuracies or omissions, this could have a significant effect on the results of the review. Data are used in three main areas:
> as the starting point of the projections
> to help select appropriate assumptions about the future, although it will also be necessary to take account of expected future trends
> as a validation of the projection methodology; in particular the results for 2012 are compared with the out-turn figures in the accounts for that year.
C.2 The main sources of data were as follows:
> Data on the benefits were provided by the Social Security Department
> The audited Fund accounts for the years from 2008 to 2012
> Projections of the population for Jersey were obtained from the States’ Statistics Unit; these were the same projections used for the actuarial review of the Social Security Fund as at 31 December 2012
> The States of Jersey Medium Term Financial Plan (2013-2015), which sets out details of arrangements for transfers out of the Fund up to and including 2015.
C.3 I have not verified the data, but I have made some simple checks for reasonableness. The data appear to be adequate for the purposes of the review.
C.4 The projections of the balance in the Funds have been based on the market value of the assets as at 31 December 2012 shown in the 2012 report and accounts.
C.5 A summary of the data provided for the review is shown in the following table.
Table C.1: Summary of the benefit data for the years 2008 to 2012 that were used in the review
2008 2009 2010 2011 2012
Number of consultations
356,316 379,713 355,196 363,227 363,869
Number of letters of referral 41,501 44,199 44,287 48,914 51,351
Number of pathology items - - 73,881 80,080 84,563
Number of prescription items 1,491,567 1,590,227 1,651,355 1,707,644 1,784,798
Number of gluten-free claimants 235 266 281 311 373

Financial condition of the HIF as at 31 December 2012
Report by the Government Actuary
28
Summary of methods and assumptions adopted
D.1 This appendix summarises the central assumptions used in deriving the estimates of income and expenditure shown in Section 4 of this report. There are three main categories of assumptions:
> Membership assumptions used for projecting the members who are eligible to receive benefits from the Fund and those who pay contributions to the Fund
> Economic assumptions, covering matters such as the rate of earnings growth and the investment return on the Fund assets
> Benefit assumptions covering the projection of the individual benefits payable from the Fund.
D.2 The central assumptions have been chosen so that they represent a reasonable estimate of the likely future experience of the Fund. A summary of the central assumptions is set out in the table below, with the corresponding assumptions made at the previous review as at 31 December 2007.
Table D.1: Summary of the central assumptions
Membership 2012 review 2007 review
Membership numbers Equal to projected population, based on the projections prepared by the States’ Statistics Unit for the 2012 Social Security Fund review, assuming:
annual net nil migration, +325 annual net inward
migration and +700 annual net inward
migration
Equal to projected population, based on the projections prepared by the States’ Statistics Unit for the 2006 Social Security Fund review (the most recent at the time), assuming:
annual net nil migration, annual net inward migration
of +150 heads of household
Contributor numbers Based on the actuarial review of the Social Security Fund as at 31 December 2012
Based on the actuarial review of the Social Security Fund as at 31 December 2006
Economic 2012 review 2007 review
Earnings growth 4.25% per annum Earnings 1.5% per annum in excess of prices Price inflation 3.0% per annum
Increase in earnings limits for contributions
In line with earnings In line with earnings
Investment return on Fund assets
0.75% per annum above earnings (5.0% per annum nominal)
0.75% per annum above prices (i.e. 0.75% per annum less than earnings)

Financial condition of the HIF as at 31 December 2012
Report by the Government Actuary
29
Benefits and administration
2012 review 2007 review
Increase in rate of Medical Benefit (payments toward GP consultation charges, GP letters of referral and pathology benefit)
In line with prices In line with prices
Number of consultations per head
In line with scale based on age and sex; this scale is assumed to remain constant over time and therefore changes in the number of consultations are entirely driven by changes in the age and sex distribution of the population
In line with scale based on age and sex; this scale is assumed to remain constant over time and therefore changes in the number of consultations are entirely driven by changes in the age and sex distribution of the population
Increase in number of prescription items per consultation
4.0% per annum 1.5% per annum
Increase in average net ingredient costs of drugs
In line with earnings increases In line with earnings increases
Increase in average dispensing cost of drugs (that is, the remuneration of the pharmacist)
In line with prices (second tier fixed until 2015), with 25% of items assumed to qualify for the first tier dispensing fee
In line with prices
Increase in expenditure on gluten-free vouchers
In line with prices and growth in the total membership of the Fund
In line with prices and growth in the total membership of the Fund
Administration Projected as a 6.9% of benefit expenditure
In line with earnings increases
D.3 The remainder of this appendix explains how the assumptions were derived and also
notes where these assumptions differ from those used for the previous actuarial review of the Fund as at 31 December 2007.
Membership assumptions
D.4 The Fund covers all those who have been resident in Jersey for at least six months. It has therefore been assumed that the entire population is eligible for benefits, except very short-term migrants.
D.5 The projection of the population has been taken from the demographic projections prepared by the States’ Statistics Unit. These are the same population projections as were used for the actuarial review of the Social Security Fund as at 31 December 2012, the results of which were set out in my report of March 2014. In particular, the projections were based on three assumptions about future migration to Jersey:

Financial condition of the HIF as at 31 December 2012
Report by the Government Actuary
30
> Nil net migration
> +325 annual net inward migration
> +700 annual net inward migration.
D.6 A summary of the projected population over the period to 2032 is shown in the following three tables. Further details of the projections are given in my March 2014 report on the 2012 review of the Social Security Fund.
Table D.2: Summary of the population projection based on nil net migration
2012 2017 2022 2027 2032
Children (0-15) 16,830 16,765 16,468 15,865 15,355
Working age (16-pension age) 66,744 65,888 65,334 64,790 63,286
Pension age and over 15,424 17,621 19,371 21,041 23,194
Total 98,998 100,274 101,173 101,695 101,835
Working age as % of total population 67% 66% 65% 64% 62%
Table D.3: Summary of the population projection based on +325 annual net inward migration
2012 2017 2022 2027 2032
Children (0-15) 16,830 17,046 17,158 16,996 16,931
Working age (16-pension age) 66,744 67,271 68,117 69,069 69,146
Pension age and over 15,424 17,647 19,433 21,152 23,380
Total 98,998 101,965 104,709 107,217 109,457
Working age as % of total population 67% 66% 65% 64% 63%
Table D.4: Summary of the population projection based on +700 annual net inward migration
2012 2017 2022 2027 2032
Children (0-15) 16,830 17,369 17,955 18,298 18,744
Working age (16-pension age) 66,744 68,868 71,329 74,010 75,912
Pension age and over 15,424 17,678 19,505 21,280 23,596
Total 98,998 103,915 108,789 113,588 118,252
Working age as % of total population 67% 66% 66% 65% 64%

Financial condition of the HIF as at 31 December 2012
Report by the Government Actuary
31
D.7 These tables also show the number at working ages expressed as a percentage of the whole population. Over the period from 2012 to 2032, this percentage is projected to decline from 67% to 62% assuming net nil migration, from 67% to 63% assuming net immigration of 325 a year or from 67% to 64% assuming net immigration of 700 a year. This decline is largely as a result of the increased numbers of the elderly for all three population projection variants and, in the case of the nil net migration population projection variant, a decline in the working population. This is an important measure for the Fund since benefits are provided to nearly all residents but contributions are only received from those of working age. Therefore, the decline in the percentage will, other things being equal, lead to an increase in expenditure relative to contribution income and this effect will be accentuated by the higher demand for healthcare from the elderly. The equivalent 2007 to 2027 decline in the 2007 review was more significant, from 67% to around 60%. The 2012 review percentages are reflecting broadly the same starting percentage and a smaller decline than the 2007 review equivalents due to a revision in the population projections between the two reviews that has resulted in a younger average age profile. This revision reflects more recently available census information and birth, death and migration data, together with updated demographic assumptions, as described in the actuarial review of the Social Security Fund as at 31 December 2012, the results of which were set out in my report of March 2014.
D.8 The assumptions about contributors and their earnings distribution have been based on those underlying the actuarial review of the Social Security Fund as at 31 December 2012. Further details of these assumptions are given in my report on that review of March 2014.
D.9 At the previous review as at 31 December 2007, the calculations were based on the latest population projections available at that time, from the 31 December 2006 review of the Social Security Fund, updated to take into account the actual estimated population in 2008. Results were reported on both the net nil migration and 150 Heads of Household population projection variants. The contribution projections were based on the projections made for the review of the Social Security Fund as at 31 December 2006.
Economic assumptions
D.10 These assumptions comprise the earnings growth, price inflation, the rate of investment return earned by the Fund and the increase in the Standard Earnings Limit (SEL) for contribution purposes. Results are presented in constant 2012 earnings terms. This means that – had all contributions and benefits increased in line with earnings – no explicit assumption would have been required for earnings increases (or price inflation). However, while all contributions are assumed to rise in line with earnings, this is not the case with all benefits, as certain benefits are assumed to increase in line with prices and tier 2 dispensing costs remain fixed until 2015 and are assumed to increase in line with prices thereafter (see D.40). Consequently, explicit assumptions have been used for earnings growth and price increases, including consideration of the relationship between them. In contrast, because in the 2007 review all benefits were assumed to increase in some manner, either in line with earnings or price inflation, the 2007 review concentrated on the relationship between earnings growth and price inflation, rather than separate assumptions for prices and earnings.

Financial condition of the HIF as at 31 December 2012
Report by the Government Actuary
32
D.11 The results in this report are based on an assumption for future nominal earnings growth of 4.25% per annum. Data published by Jersey’s Statistics Unit suggest that earnings growth has averaged about 4.5% a year in nominal terms over the period from 1990 to 201317. However, recent average earnings increases in Jersey have fallen below this average. Consequently, an assumption for future nominal earnings growth of 4.25% per annum has been used in this report, slightly lower than the historical average. This assumption of 4.25% per annum is consistent with GAD’s outlook for future nominal UK increases, although recognising that there is considerable uncertainty over expected future levels of earnings increases for Jersey and the UK and also the relationship between them over time.
D.12 As regards price inflation, more than one form of Jersey RPI is involved in benefit uprating under the Health Insurance Fund, but it seems overly complex to do anything other than set a generalised assumption for prices. We established that Jersey RPI is closer in nature to UK RPIJ (RPI Jevons) than UK RPI and then considered UK comparatives. Since Feb 1997, the difference between UK RPIJ and UK RPI averaged 0.44% a year. However, it’s arguably the period since 2010 which is more relevant as this is when the ONS changed the clothing collection methodology (which resulted in the review of UK RPI methodology). Since February 2010 the difference between UK RPIJ and UK RPI has been 0.67% a year on average. As GAD’s outlook for future UK RPI is currently 3.4% per annum, a Jersey RPI assumption based on expectations for UK RPIJ of around 2.5% to 3.0% a year is indicated. Recent Jersey RPI increases would suggest an assumption at the upper end of this range and so for the purposes of this report an assumption for Jersey RPI of 3.0% per annum has been used. This implies a margin between price inflation and earnings increases of 1.25% per annum, which represents a 0.25% per annum reduction in comparison with the 2007 review.
D.13 As mentioned in paragraph 3.8, the assumption was made in the report on the 2007 review that the Fund assets were invested in cash deposits, which was the situation as at the review date of 31 December 2007. However, we understand that there is now a strategic aim to invest 40% of the Fund in equities, 45% in bonds and 15% in cash. The Fund projections in this report on the 2012 review have taken this into account, using an assumption for investment returns of 0.75% per annum in excess of earnings increases (or 5.0% per annum nominal), as opposed to the 2007 review’s assumption of 0.75% per annum in excess of prices. As the investment strategy leads to an increase in investment returns in comparison with cash returns, this lengthens the period until the Fund is extinguished.
D.14 The projected Investment return for years after 2012 in Appendix E is significantly lower than the actual investment return in 2012 because:
> Actual investment returns in 2012 were high compared to previous years, as can be seen from Table B.1, and therefore much higher than our assumption for future investment returns; and
17 1990 was the first year for which the Jersey earnings index was calculated. See Jersey Index of Average Earnings 2013 report, at http://www.gov.je/SiteCollectionDocuments/Government%20and%20administration/R%20AverageEarnings2013%2020130821%20SU.pdf.

Financial condition of the HIF as at 31 December 2012
Report by the Government Actuary
33
> Projected cashflows and Fund values are shown in constant 2012 earnings terms. It is therefore necessarily to deflate the value of the Fund at each year end and we have included the effect of this within the investment return.
D.15 The investment return in D.13 above assumes that the Fund is invested in line with its long term investment strategy. However, at the time of the 2012 review there were around four months’ contributions receivable as a debtor item. Should it be the case that this feature persists in the long term (which we understand from the Social Security Department is likely to be the case, based on the situation over many years) then investment returns for the Fund would be slightly lower than expected, reflecting the fact that debtor items would not be invested and would therefore themselves result in a negative return in relation to earnings increases, but this would have no material effect on the projected Fund.
D.16 Having regard to the provisions of Schedule 1A, 2(2)18 of the Social Security (Jersey) Law 1974, it has been assumed that the Standard Earnings Limit applied in calculating social security contributions will in future increase in line with average earnings increases.
Benefit assumptions: Medical Benefit – future increases
D.17 The Medical Benefit comprises a payment that the Health Insurance Fund makes towards the cost of GP consultations (including items of service); it is not intended to match the cost of the consultation itself (the patient is required to meet the difference). A summary of the average rate of Medical Benefit and average actual consultation charge for ordinary members over the period from 2007 to 2012 is given in the following table.
Table D.5: Medical Benefit and doctors’ actual consultation charges for ordinary members in the period from 2007 to 2012 (£)
Consultation charge (£ average
over calendar year) Medical Benefit (£ average over calendar
year)
2007 36.46 15
2008 39.72 15
2009 38.98 15
2010 43.44 17.6 (increase to £19.00 on 17 May 2010)
2011 45.25 19.3 (increase to £19.59 on 8 July 2011)
2012 46.18 19.9 (increase to £20.28 on 27 June 2012)
Average annual increase 2007 to 2012
4.8% 5.8%
18 This states that on every 1 January the Standard Earnings Limit shall “… be increased or decreased, as the case requires, by the percentage figure equal to the percentage rise or fall in the Jersey Index of Earnings during the 12 months ending on 30th June in the preceding year.”

Financial condition of the HIF as at 31 December 2012
Report by the Government Actuary
34
D.18 For comparison, the rate of price inflation over the period from June 2007 to June 2012 averaged 3.1% to 3.7% a year, depending on the measure of inflation adopted, and the rate of earnings increases averaged 2.5% a year. Over the five years to 2012, the average annual rate of increase in Medical Benefit therefore exceeded the average annual increase in both price inflation and earnings growth, as did average consultation charges made by doctors. The average consultation charges made by doctors increased by around 1% a year less than the rate of Medical Benefit. As a result, the Medical Benefit represented 41% of the average charge for a consultation in 2007, but this had increased slightly, to 43% of the average consultation charge in 2012.
D.19 The main contributor to the increase in rate of Medical Benefit was the increase from £15 to £19 from 17 May 2010. This increase was considerably in excess of price inflation, but it was largely intended to help finance improvements in the standard of primary care, including allowing doctors to satisfy new General Medical Council requirements and introducing performance-monitoring and quality information.
D.20 We understand from the Social Security Department that, although the Medical Benefit is intended to be a payment towards the cost of GP consultations, there is no direct relationship between the charges made by doctors and the Medical Benefit. We also understand that the Medical Benefit is expected to reflect general ongoing surgery costs rather than the cost of consultations themselves and that general ongoing surgery costs are expected to follow price inflation rather than earnings increases. Further, the two increases that occurred after the 2010 increase do not look out of place in comparison with price inflation over the period. In light of this, for the purposes of the 2012 review it has been assumed that increases in Medical Benefit are in line with price inflation. This is the same assumption as was adopted for the 2007 review. As medical consultations are labour intensive, the consultation charges made by doctors themselves may, though, tend to rise in line with earnings levels in the future. On the basis of the assumptions in table D.1, this would mean that the projected Medical Benefit would tend to fall as a proportion of the doctors’ actual charges. For example, if the cost of a consultation were to rise by 1.25% a year more than prices, the value of the Medical Benefit would fall by a quarter over 25 years relative to the actual consultation charge.
D.21 Table 5.1 sets out a number of variant assumptions for future increases in Medical Benefit, to illustrate the sensitivity of the results to this assumption.
Benefit assumptions: Medical Benefit – number of consultations per head
D.22 In terms of overall trends in the number of consultations per head (including items of service), Figure D.1 below shows the number of consultations per head going back to 1987. Over the past 15 years the total number of consultations per head has declined on average by around 1% per annum; however, the decline has appeared to stabilise over the past few years. In light of this, the 2012 review projects consultation numbers based on a central assumption of a fixed consultation scale per head by age and sex, meaning that changes in the projected number of consultations are entirely driven by changes in the age and sex distribution of the projected population. This is the same approach as was adopted for the 2007 review. For the 2012 review, the fixed scale has been updated and is based on an average of the data for years 2010 to 2012, as described in D.22 to D.25 below. However, Table 5.1 also describes two variant sets of results, firstly applying a 1% per annum reduction

Financial condition of the HIF as at 31 December 2012
Report by the Government Actuary
35
in consultation numbers relative to the number of consultations based on the population projection and fixed scale, reflecting the abovementioned historical 15-year average decline, and secondly with a complementary variant of a 1% per annum increase in consultation numbers relative to the number of consultations based on the population projection and fixed scale.
Figure D.1: Number of consultations per head (including items of service), 1987 to 2012
D.23 Concentrating on the period since the 2007 review of the Fund, the following table
shows the number of GP consultations plus items of service (the number of referral letters prepared) resulting in a claim on the Fund, together with the corresponding averages per person covered by the Fund. The figures cover the period from 2008 to 2012. HIE status was abolished on 28 January 2008 and consequently the table below does not differentiate between ordinary members and HIE status members.
D.24 The table shows that apart from a temporary peak in 2009 due to swine flu the number of consultations per member has been fairly stable from year to year in recent years. However, as shown in Figure D.1 above, the number of consultations per member appear slightly lower from 2010 compared with earlier years. Further analysis of the data indicated that visits have fallen among people aged 16-50 and increased among children and older people. It is not clear why this would have occurred, but the Social Security Department note there could be some volatility in the data.
Table D.6: Number of consultations and items of service, 2008 to 2012
Number of consultations and items of service Number per member
2008 397,817 4.35 2009 423,912 4.60 2010 399,483 4.12 2011 412,141 4.22 2012 415,220 4.21
0.0
1.0
2.0
3.0
4.0
5.0
6.0
1987
1988
1989
1990
1991
1992
1993
1994
1995
1996
1997
1998
1999
2000
2001
2002
2003
2004
2005
2006
2007
2008
2009
2010
2011
2012
Number of consultations per head

Financial condition of the HIF as at 31 December 2012
Report by the Government Actuary
36
D.25 Based on analysis of the above data, I have adopted the following 2010 to 2012 average-based scale of consultations per head in future years (the equivalent scale from the 2007 review is also shown, after adjusting for the fact that HIE status was abolished on 28 January 2008 and all members combined under the same status). This scale has been applied in each future year which means I am assuming that the average number of consultations per head is stable (by age and sex).
Table D.7: Scale of annual number of consultations (including items of service) per head by age and sex
2012 review 2007 review Age group Men Women Men Women
0-4 4.75 4.50 3.00 2.505-9 2.00 2.25 1.50 1.25
10-19 1.50 2.00 1.25 2.0020-29 2.00 4.00 2.50 5.0030-39 2.50 4.75 3.00 5.2540-49 3.00 4.50 3.50 4.7550-59 4.00 5.00 4.25 5.0060-69 5.25 5.75 5.50 5.7570-79 7.00 7.75 8.00 7.5080-89 9.50 9.50 11.00 9.7590 + 12.50 13.00 12.75 13.50
D.26 Between the 2007 review and the 2012 review there has been a reduction in the above scale for many of the adult age groups, as discussed in paragraph D.23 above. The children’s scale entries have increased between the 2007 review and the 2012 review as, in contrast with the 2007 review, allowance has been made in the 2012 review for children who are not registered for social security. The total counts of such unidentifiable children provided by the Social Security Department have been distributed within the 2012 scale in proportion to the identifiable children.
D.27 On the basis that the swine flu epidemic resulted in additional costs in 2009 only, no further allowance has been made for this in future years’ projections. There is, however, an illustration of the impact on the results of a similar one-off temporary increase in consultations in Section 5 of this report.
Benefit assumptions: Medical Benefit – pathology benefit
D.28 The “pathology benefit” was introduced from 1 January 2010. Projections of its cost made by the Department of Social Security at the time of the 2007 review indicated that it would involve a cost of about £750,000 in 2010 and consequently for the 2007 review it was assumed that the additional cost would be £750,000 in 2010. It was then assumed that in future years the cost would increase in line with spending on Medical Benefit, which implicitly meant that the rate of pathology benefit was assumed to rise in line with general prices and that the number of recipients would follow the number receiving a consultation. The HIF accounts since that time show that 2010 costs were slightly lower, at £720,000 but that they increased more rapidly than projected, to £866,000 for 2012. As this is a relatively new benefit and there is not yet sufficient data to form pathology benefit-specific assumptions for the projections, and given that this benefit forms only a small part of Fund expenditure, the 2012 review follows the same approach as the 2007 review.

Financial condition of the HIF as at 31 December 2012
Report by the Government Actuary
37
Benefit assumptions: pharmaceutical benefit – number of prescription items per consultation (including items of service): assumed 4.0% per annum growth
D.29 The starting point for the projection of prescription item numbers is the observed number of prescription items per consultation from the latest available year of past data: for the 2012 review this is 4.30 prescription items per consultation in 2012 and for the 2007 review it was 3.85 prescription items per consultation from 2008.
D.30 The 2007 review had retained the 2002 review’s assumption of an increase in prescription items per consultation of 1.5% a year. This assumption was originally determined for the purposes of the 2002 review by inspection of the increase in numbers of prescription items per member, averaging around 2.0% per annum from 1997 to 2002. For the 2012 review, numbers of prescription items per consultation (including items of service) since 1987 have been examined, as shown in Figure D.2 below. Figure D.2 does not differentiate between ordinary members and HIE status members (who existed as a separate category prior to 2008), but combines them.
D.31 The data in Figure D.2 exhibits different behaviour before and after around 1999 and so for the purposes of the 2012 review the focus has been on the post-1999 data. This shows that that the average annual increase over the period from 2000 to 2012 in prescription item numbers per consultation was 4.0% per annum. This is based on the light green lines and is after adjustment for the 12.5% increase in prescription item numbers that the Social Security Department advised were observed in 2008 when prescription charges were abolished. Had no such adjustment been made then the average annual increase over the period from 2000 to 2012 in prescription item numbers per consultation would have been 5.0% per annum, per the light and dark green lines together.
Figure D.2: Number of prescription items per consultation (including items of service), 1987 to 2012
0.00
0.50
1.00
1.50
2.00
2.50
3.00
3.50
4.00
4.50
1987
1988
1989
1990
1991
1992
1993
1994
1995
1996
1997
1998
1999
2000
2001
2002
2003
2004
2005
2006
2007
2008
2009
2010
2011
2012

Financial condition of the HIF as at 31 December 2012
Report by the Government Actuary
38
D.32 Part of the increases observed above may be due to changing demographics, but without more detailed data on the age and sex of prescription recipients it is not possible to examine the causes further. We also understand from the Social Security Department that other recent developments affecting prescription items numbers include:
> Changes in evidence-based guidelines altering prescribing practice
> Preventatives such as for heart disease increasingly being prescribed
> Shared care and hospital prescribing moving into the community
> Growth in repeat prescribing
> Increases in the incidence of polypharmacy, i.e. people being prescribed multiple medicines for multiple conditions.
D.33 Similarly to the 2007 review, there has been no specific adjustment made for shared prescribing (whereby certain drugs initially prescribed by hospital consultants can continue to be prescribed by GPs under the supervision of the consultant), on the basis that this forms part of the underlying data and there is no reason of which we are aware as to why patterns of shared prescribing would alter in the future.
Benefit assumptions: pharmaceutical benefit – number of prescription items per consultation (including items of service): variant assumptions
D.34 Obtaining more detailed information on prescription recipients and the other influences on recent prescription item numbers may be something that the Social Security Department wish to pursue ahead of a future review of the Health Insurance Fund. However, given the substantial uncertainty surrounding potential future development in prescription item numbers, the 2012 review has proceeded with the increases as suggested by the available data and, consequently, an assumption for future increases in numbers of prescription items per consultation of 4.0% per annum. This means that by the end of the 20-year projection period the number of prescription items per consultation for 2012 of 4.30 in D.28 above will have increased to an average of around 9.4 prescription items per consultation. This may not be unreasonable, in light of features in the data such as repeat prescriptions stemming from an earlier consultation. However, the Social Security Department’s pharmaceutical advisor and Jersey GPs have advised that 4.0% per annum growth per consultation would not be maintained over the entire period, although there is no data to suggest when the rate of growth might alter and to what extent it might alter. As this is one of the most important assumptions in the review, variant results have consequently also been prepared in Section 5 to illustrate the sensitivity of the results to this assumption. It will be noted that these are illustrations and not predictions. The variant results assume, firstly 4.0% per annum increases in prescription items per consultation reducing to 0.0% per annum after 5 years and secondly a reduction to 2.0% per annum after 5 years. The first of these implies that by the end of the 20-year projection period there are an average of around 5.2 prescription items per consultation and the second of these implies that by the end of the 20-year projection period there are an average of around 7.0 prescription items per consultation. The longer we delay the date at which the 4.0% per annum increases step down to a lower level of increase the more closely the outcome represents the central
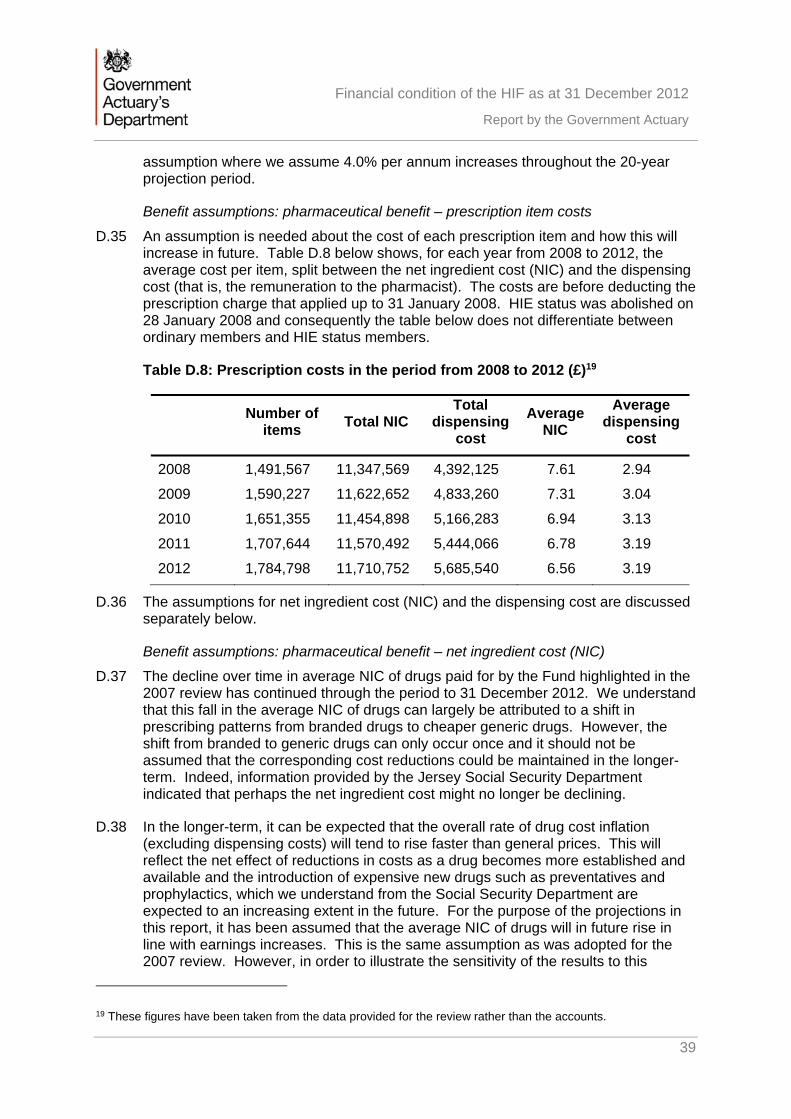
Financial condition of the HIF as at 31 December 2012
Report by the Government Actuary
39
assumption where we assume 4.0% per annum increases throughout the 20-year projection period.
Benefit assumptions: pharmaceutical benefit – prescription item costs
D.35 An assumption is needed about the cost of each prescription item and how this will increase in future. Table D.8 below shows, for each year from 2008 to 2012, the average cost per item, split between the net ingredient cost (NIC) and the dispensing cost (that is, the remuneration to the pharmacist). The costs are before deducting the prescription charge that applied up to 31 January 2008. HIE status was abolished on 28 January 2008 and consequently the table below does not differentiate between ordinary members and HIE status members.
Table D.8: Prescription costs in the period from 2008 to 2012 (£)19
Number of
items Total NIC
Total dispensing
cost
Average NIC
Average dispensing
cost
2008 1,491,567 11,347,569 4,392,125 7.61 2.94
2009 1,590,227 11,622,652 4,833,260 7.31 3.04
2010 1,651,355 11,454,898 5,166,283 6.94 3.13
2011 1,707,644 11,570,492 5,444,066 6.78 3.19
2012 1,784,798 11,710,752 5,685,540 6.56 3.19
D.36 The assumptions for net ingredient cost (NIC) and the dispensing cost are discussed separately below.
Benefit assumptions: pharmaceutical benefit – net ingredient cost (NIC)
D.37 The decline over time in average NIC of drugs paid for by the Fund highlighted in the 2007 review has continued through the period to 31 December 2012. We understand that this fall in the average NIC of drugs can largely be attributed to a shift in prescribing patterns from branded drugs to cheaper generic drugs. However, the shift from branded to generic drugs can only occur once and it should not be assumed that the corresponding cost reductions could be maintained in the longer-term. Indeed, information provided by the Jersey Social Security Department indicated that perhaps the net ingredient cost might no longer be declining.
D.38 In the longer-term, it can be expected that the overall rate of drug cost inflation (excluding dispensing costs) will tend to rise faster than general prices. This will reflect the net effect of reductions in costs as a drug becomes more established and available and the introduction of expensive new drugs such as preventatives and prophylactics, which we understand from the Social Security Department are expected to an increasing extent in the future. For the purpose of the projections in this report, it has been assumed that the average NIC of drugs will in future rise in line with earnings increases. This is the same assumption as was adopted for the 2007 review. However, in order to illustrate the sensitivity of the results to this
19 These figures have been taken from the data provided for the review rather than the accounts.
Financial condition of the HIF as at 31 December 2012
Report by the Government Actuary
40
assumption, additional variant sets of results have been prepared: the first of these assumes that future increases exceed earnings increases by 1.25% per annum, the second assumes that future increases are in line with price inflation and the third assumes that there are no future increases. A fourth variant assumes that the rate of decline since the 2007 review of around 3% per annum continues throughout the projection period. This variant is included to show what the effect would be if such a decline continued for the next 20 years; it is not intended to reflect any specific views regarding future sustainability of the recent decline.
Benefit assumptions: pharmaceutical benefit – dispensing fees
D.39 In addition to the NIC, the Fund has to pay the dispensing cost – that is, the amount received by pharmacists for dispensing the drug. These have increased by 2.1% a year from 2008 to 2012, which compares with the increase in average earnings and prices over the same period of 2.0% a year and 2.5% a year, respectively.
D.40 Actual increases in dispensing charges are set on a short-term basis and updated regularly. The current fee introduces a two-tier system for 2013 to 2015 that means that around the first 25% of items dispensed attract a fee that increases in line with prices (tier 1) and the remainder attracts a fee that is fixed (tier 2). As the situation for 2016 onwards will not be known for some time, the assumption for the 2007 review that dispensing costs increase in line with prices has been retained for the purposes of the 2012 review, although taking into account the fixed nature of the tier 2 costs until 2015. For this purpose, it has been assumed that 25% of items dispensed in every year are attributable to tier 1, with the remainder tier 2. Aside from the introduction of the two-tier system, this is the same assumption as was adopted for the 2007 review.
Benefit assumptions: gluten-free vouchers
D.41 The Fund also provides vouchers to those who require a gluten-free diet. Given that the vouchers form only a small part of Fund expenditure, the 2007 review was based on the simple assumption that spending on the vouchers would increase in line with the growth in the total membership of the Fund and price inflation. However, expenditure has increased by substantially more than this over the period 2008 to 2012. In terms of the reasons for this, the value of each book of 10 vouchers increased from £13.50 per beneficiary per week to £14 per beneficiary per week in 2009 and the Social Security Department have informed us that there have been no subsequent increases as it has been found that the difference in price between gluten-free products and standard products is not as great as it once was. At the same time, it has been observed that the numbers of people claiming have increased because a wider range of medical conditions have been used to gain eligibility. In light of this and given that the vouchers continue to form only a small part of Fund expenditure, the simple assumption from the 2007 review that spending on the vouchers will increase in line with the growth in the total membership of the Fund and price inflation has been retained.

Financial condition of the HIF as at 31 December 2012
Report by the Government Actuary
41
Administration costs
D.42 Finally, it is necessary to make an assumption about the future costs of administration. Previous reviews had modelled future administration costs by projecting the latest available figure from the accounts in line with earnings increases. However, it has been clarified by the Jersey Social Security Department that not all of the administration costs at the time of the 2012 review are of a nature that would increase in line with earnings. As the nature of the administration costs concerned is not dissimilar to that of the administration costs of the Social Security Fund, the treatment of administration costs in the 2012 review of the Health Insurance Fund has been aligned with that of the 2012 review of the Social Security Fund. As a result, future administration costs have been modelled as 6.9% of projected future benefit expenditure, the 6.9% being based on the relationship between administration costs and benefit expenditure for the period 2012 to 2014, which includes a combination of accounts data and budgeted costs, adjusted for the effect of single instance items that are not expected to form part of ongoing costs (these single instance items are, however, taken into account in the results for the years concerned).

Financial condition of the HIF as at 31 December 2012
Report by the Government Actuary
42
Summary of projections
Table E.1: Summary of income, outgo and the projected Fund balance in the Health Insurance Fund in 2012 earnings terms based on the central assumptions and assuming net nil future migration20
201221 2017 2022 2027 2032
Fund at start of year 77.7 64.9 38.9 0.0 0.0
Contributions 28.9 28.9 28.4 27.7 26.8
Investment return22 8.4 0.5 0.3 0.0 0.0
Total income 37.3 29.4 28.7 27.7 26.8
Outgo:
Medical Benefit 8.2 8.1 7.9 7.7 7.4
Pathology benefit 0.9 0.8 0.8 0.8 0.8
Pharmaceutical benefit 17.4 21.2 26.2 32.4 40.1
Gluten-free vouchers 0.2 0.2 0.2 0.2 0.2
Administration costs 1.6 2.1 2.4 2.8 3.3
Transfers from the Fund 6.1 0.0 0.0 0.0 0.0
Total outgo 34.5 32.4 37.5 43.9 51.8
Excess of income over outgo 2.8 -3.0 -8.8 -16.3 -25.0
Fund at end of year 80.5 61.9 30.0 0.0 0.0
Mean fund expressed as months of outgo excluding transfers from Fund
33 24 11 0 0
Break-even contribution rate 2.0% 2.2% 2.6% 3.2% 3.9%
20 Figures may not sum to totals shown due to rounding. 21 The figures for 2012 are the actual figures taken from the accounts. 22 See paragraph D.14.

Financial condition of the HIF as at 31 December 2012
Report by the Government Actuary
43
Table E.2: Summary of income, outgo and the projected Fund balance in the Health Insurance Fund in 2012 earnings terms based on the central assumptions and assuming net inward future immigration of 325 people each year23
201224 2017 2022 2027 2032
Fund at start of year 77.7 65.3 40.5 0.0 0.0
Contributions 28.9 29.5 29.7 29.6 29.5
Investment return25 8.4 0.5 0.3 0.0 0.0
Total income 37.3 30.0 29.9 29.6 29.5
Outgo:
Medical Benefit 8.2 8.1 8.1 8.0 7.8
Pathology benefit 0.9 0.9 0.8 0.8 0.8
Pharmaceutical benefit 17.4 21.4 26.9 33.8 42.3
Gluten-free vouchers 0.2 0.2 0.2 0.2 0.2
Administration costs 1.6 2.1 2.5 2.9 3.5
Transfers from the Fund 6.1 0.0 0.0 0.0 0.0
Total outgo 34.5 32.8 38.5 45.7 54.7
Excess of income over outgo 2.8 -2.8 -8.6 -16.1 -25.2
Fund at end of year 80.5 62.5 31.9 0.0 0.0
Mean fund expressed as months of outgo excluding transfers from Fund
33 23 11 0 0
Break-even contribution rate 2.0% 2.2% 2.6% 3.1% 3.7%
23 Figures may not sum to totals shown due to rounding. 24 The figures for 2012 are the actual figures taken from the accounts. 25 See paragraph D.14.

Financial condition of the HIF as at 31 December 2012
Report by the Government Actuary
44
Table E.3: Summary of income, outgo and the projected Fund balance in the Health Insurance Fund in 2012 earnings terms based on the central assumptions and assuming net inward future immigration of 700 people each year26
201227 2017 2022 2027 2032
Fund at start of year 77.7 65.7 42.4 0.0 0.0
Contributions 28.9 30.2 31.1 31.8 32.6
Investment return28 8.4 0.5 0.3 0.0 0.0
Total income 37.3 30.7 31.4 31.8 32.6
Outgo:
Medical Benefit 8.2 8.3 8.3 8.3 8.3
Pathology benefit 0.9 0.9 0.9 0.9 0.9
Pharmaceutical benefit 17.4 21.7 27.7 35.3 44.8
Gluten-free vouchers 0.2 0.2 0.2 0.2 0.2
Administration costs 1.6 2.1 2.5 3.1 3.7
Transfers from the Fund 6.1 0.0 0.0 0.0 0.0
Total outgo 34.5 33.2 39.6 47.7 58.0
Excess of income over outgo 2.8 -2.5 -8.2 -15.9 -25.4
Fund at end of year 80.5 63.2 34.2 0.0 0.0
Mean fund expressed as months of outgo excluding transfers from Fund
33 23 12 0 0
Break-even contribution rate 2.0% 2.2% 2.5% 3.0% 3.6%
26 Figures may not sum to totals shown due to rounding. 27 The figures for 2012 are the actual figures taken from the accounts. 28 See paragraph D.14.