report: benefits of natural gas production & exports for us small businesses
TRANSCRIPT

The Benefits of Natural GasProduction and Exports for U.S. Small Businesses
Raymond J. KeatingChief EconomistSmall Business & Entrepreneurship Council
May 2013
www.sbecouncil.org

Contents
Executive Summary . . . . . . . . . . . . . . . . . . . . . . . . . . . . . . . . . . . . . . . . . . . 3
Introduction . . . . . . . . . . . . . . . . . . . . . . . . . . . . . . . . . . . . . . . . . . . . . . . . . 5
I. United States . . . . . . . . . . . . . . . . . . . . . . . . . . . . . . . . . . . . . . . . . . . . . . . . 6
II. Arkansas . . . . . . . . . . . . . . . . . . . . . . . . . . . . . . . . . . . . . . . . . . . . . . . . . . . 11
III. Colorado . . . . . . . . . . . . . . . . . . . . . . . . . . . . . . . . . . . . . . . . . . . . . . . . . . 14
IV. Louisiana . . . . . . . . . . . . . . . . . . . . . . . . . . . . . . . . . . . . . . . . . . . . . . . . . . 17
V. North Dakota . . . . . . . . . . . . . . . . . . . . . . . . . . . . . . . . . . . . . . . . . . . . . . . 20
VI. Ohio . . . . . . . . . . . . . . . . . . . . . . . . . . . . . . . . . . . . . . . . . . . . . . . . . . . . . . 23
VII. Oklahoma . . . . . . . . . . . . . . . . . . . . . . . . . . . . . . . . . . . . . . . . . . . . . . . . . 26
VIII. Pennsylvania . . . . . . . . . . . . . . . . . . . . . . . . . . . . . . . . . . . . . . . . . . . . . . . 29
IX. Texas . . . . . . . . . . . . . . . . . . . . . . . . . . . . . . . . . . . . . . . . . . . . . . . . . . . . . 32
X. Utah . . . . . . . . . . . . . . . . . . . . . . . . . . . . . . . . . . . . . . . . . . . . . . . . . . . . . . 35
XI. West Virginia . . . . . . . . . . . . . . . . . . . . . . . . . . . . . . . . . . . . . . . . . . . . . . . 38
XII. Wyoming . . . . . . . . . . . . . . . . . . . . . . . . . . . . . . . . . . . . . . . . . . . . . . . . . . 41
XIII. LNG Exports: Expand or Limit Opportunities? . . . . . . . . . . . . . . . . . . . . . 44
About the Author . . . . . . . . . . . . . . . . . . . . . . . . . . . . . . . . . . . . . . . . . . . 47
Endnotes . . . . . . . . . . . . . . . . . . . . . . . . . . . . . . . . . . . . . . . . . . . . . . . . . . 48
www.sbecouncil.org

The Benefits of Natural Gas Production and Exports for U.S. Small Businesses | 3
Executive Summary
The U.S. natural gas market has changed dramatically in recent years, as evidenced by a 55 percent declinein the annual average price of natural gas occurring between 2005 and 2011. While assorted market factorscome into play, this reduction in natural gas prices has been a direct result of expanded natural gas pro-duction in the U.S. Increased production has been a boon for the energy sector, including for employmentand business growth, especially in those states where natural gas production has expanded, with indirectbenefits across the nation.
increased by 947 percent, due to a combination of hori-zontal drilling and hydraulic fracturing.
Jobs Growth. For the U.S. overall, while total employmentdeclined by 3.7 percent from 2005 to 2010, jobs grew by27.6 percent in the oil and gas extraction sector; by 15.1percent in the drilling oil and gas wells sector; by 38.5 per-cent in the support sector for oil and gas operations; by 47percent in the oil and gas pipeline and related structuresconstruction sector; and by 62 percent in the oil and gasfield machinery and equipment manufacturing sector.
Small Business Growth. Meanwhile, the same contrastheld in terms of changes in the number of businesses,including small business. For all of the U.S., total employerfirms declined by 4.2 percent from 2005 to 2010, includinga 3.7 percent decline in firms with less than 20 workers, anda 4.2 percent fall in firms with less than 500 workers. Butwithin the energy sector, business growth in key industrieshas been striking:
• The number of oil and gas extraction employer firmsgrew by 3.1 percent, including growth of 2.5 percentamong firms with less than 20 workers and 3 percentamong firms with less than 500 workers.
Export Opportunities. Looking ahead, the opportunityexists for exporting liquefied natural gas (LNG), given thelarge differential in natural gas prices in the U.S. versus else-where in the world, and rising global demand. Unfortu-nately, though, there is a movement afoot to havegovernment limit LNG exports, based on the unfoundedfear that LNG exports will dramatically drive up domesticnatural gas prices. But the economy is not a zero-sumgame. Expanded demand for U.S. natural gas internation-ally will be a net positive, resulting in greater U.S. naturalgas production, increased investment, enhanced GDPgrowth, rising incomes, and more jobs.
Several studies have validated the abundance of domesticnatural gas for international export. The InternationalEnergy Administration recently projected that “the UnitedStates becomes a net exporter of natural gas by 2020 andis almost self-sufficient in energy, in net terms, by 2035.” Inaddition, a recent study for the Brookings Institution noted,“In their analyses, both Deloitte and EIA found that themajority – 63 percent, according to both studies – of theexported natural gas will come from new production asopposed to displaced consumption from other sectors.”
This report looks at some of the tremendous benefits thathave emerged for the U.S. economy due to a vast expan-sion in natural gas production in less than a decade. In par-ticular, this report focuses on the growth in jobs and thenumber of small and midsize businesses in key energy sec-tors, including in states where natural gas production hasincreased and where such production is expected toexpand. It follows that the U.S. becoming a leader in meet-ing global natural gas demand would be a clear benefit tothe overall U.S. economy, and again, particularly in thosestates leading the way in natural gas production.
Rising Production. Natural gas production increased by 27percent from 2005 to 2011. This increase in natural gas hascome from high production levels from shale gas, which
Expanded demand for U.S. natural
gas internationally will be a net
positive, resulting in greater U.S.
natural gas production, increased
investment, enhanced GDP growth,
rising incomes, and more jobs.

4 | The Benefits of Natural Gas Production and Exports for U.S. Small Businesses
• The number of drilling oil and gas wells employer firmsgrew by 7.2 percent, including 4.7 percent among firmswith less than 20 workers and 7.3 percent among firmswith less than 500.
• The number of oil and gas operations employer firmsgrew by 24.5 percent, including 24.5 percent amongfirms with less than 20 workers and 24.6 percent amongfirms with less than 500.
• The number of oil and gas pipeline and related structuresconstruction employer firms grew by 5.1 percent, includ-ing growth of 3.5 percent among firms with less than 500workers.
• The number of oil and gas field machinery and equip-ment manufacturing employer firms grew by 61.0 per-cent, including growth of 59.0 percent among firms withless than 20 workers and 62.7 percent among firms withless than 500 workers.
Small Business Population. At the same time, small andmidsize firms overwhelmingly populate each of the energysectors considered. Businesses with less than 20 workerscame in at
• 91.3 percent of oil and gas extraction employer firms;
• 80.4 percent of drilling oil and gas wells employer firms;
• 84.7 percent of oil and gas operations employer firms;
• 63 percent of oil and gas pipeline and related structuresconstruction employer firms; and
• 60.3 percent of oil and gas field machinery and equip-ment manufacturing employer firms.
It follows that the U.S. becoming a
leader in meeting global natural gas
demand would be a clear benefit to
the overall U.S. economy, and again,
particularly in those states leading
the way in natural gas production.
In the 11 states examined in this report, the dominance ofsmall and midsize firms populating energy industries heldas well. Interestingly, the contrast between a nationaldecline in overall jobs and businesses, and growth in keyenergy sectors often was even far more striking than thenational differences. The general case of energy industriesadding jobs and small businesses, as opposed to nationaldeclines, held in the 10 states – that is, in Arkansas, Col-orado, Louisiana, North Dakota, Oklahoma, Pennsylvania,Texas, Utah, West Virginia, and Wyoming – where naturalgas production was up markedly. (A Summary Sheet foreach state is available.)
Opportunities Ahead. The expectation that nearly two-thirds of LNG exports would be met via new productionspeaks to further strong growth for small and midsize busi-nesses, and for employment. At the same time, the minimalprice impact that expanded exports might have on domes-tic prices would have small effects on domestic consumersof natural gas, especially given the enormous declineswe’ve already experienced in natural gas prices. And eventhose small, potential price increases must be further offsetagainst the effect of the overall positive for economicgrowth coming via expanded natural gas production.Clearly, LNG exports guided by market forces mean further expanding opportunity for small and midsizebusinesses to be created, to grow, and to create jobs.

The Benefits of Natural Gas Production and Exports for U.S. Small Businesses | 5
While assorted market factors come into play, lower natu-ral gas prices have resulted directly from expanded U.S.natural gas production. That increased production has beengood news for the energy sector, including for employmentand business growth, especially in those states where nat-ural gas production has expanded, with indirect benefitsspreading across the nation.
Looking ahead, the opportunity exists for exporting lique-fied natural gas (LNG)1, given the large differential in nat-ural gas prices in the U.S. versus elsewhere in the world,and rising global demand. For example, in November2012, the International Energy Administration reported:“The WEO finds that the extraordinary growth in oil andnatural gas output in the United States will mean a sea-change in global energy flows. In the New Policies Sce-nario, the WEO’s central scenario, the United Statesbecomes a net exporter of natural gas by 2020 and isalmost self-sufficient in energy, in net terms, by 2035…While the regional picture for natural gas varies, the globaloutlook over the coming decades looks to be bright, asdemand increases by 50% to 5 trillion cubic metres in2035. Nearly half of the increase in production to 2035 isfrom unconventional gas, with most of this coming fromthe United States, Australia and China.”2
The U.S. becoming a leader in meeting global natural gasdemand would be a clear benefit to the overall U.S. econ-omy, and particularly in states leading the way in naturalgas production.
It’s important to consider the benefits that accrue to work-ers, small businesses, individual states, and the U.S. econ-omy when domestic energy production, such as in naturalgas, expands. Let’s review key points.
Introduction
The U.S. natural gas market has changed dramatically in recent years. Consider the drop in natural gasprices. For example, the annual average price of natural gas (dollars/mil. BTUs) went from $9.014 in 2005 to$4.026 in 2011. That 55 percent decline generated considerable savings for U.S. households and businesses viaelectricity prices – given that 25 percent of electric power is generated via natural gas – as well as for a widearray of industries that use natural gas in their production processes.
Looking ahead, the opportunity
exists for exporting liquefied
natural gas (LNG), given the large
differential in natural gas prices in
the U.S. versus elsewhere in the
world, and rising global demand.

6 | The Benefits of Natural Gas Production and Exports for U.S. Small Businesses
I. United StatesAfter small increases throughout the 1990s, for example,natural gas production in the U.S. hit a high of 19.62 tril-lion cubic feet in 2001, and then declined for the followingfour years. In 2005, U.S. natural gas marketed productionregistered 18.05 trillion cubic feet, which was roughly thesame level as in 1993. However, growth resumed, and nat-ural gas production in the U.S. hit 23 trillion cubic feet in2011, which was a 27 percent increase over 2005. All of theincrease in natural gas production basically has come fromshale gas, which increased by 947 percent from 2005 to2011. What’s behind this vast expansion in recent produc-tion, not to mention an expanded view of resources intothe future?
The EIA explained, “Over the past decade, the combina-tion of horizontal drilling and hydraulic fracturing hasallowed access to large volumes of shale gas that were pre-viously uneconomical to produce. The production of natu-ral gas from shale formations has rejuvenated the naturalgas industry in the United States.”3
Looking into the future, the EIA “projects U.S. natural gasproduction to increase from 23.0 trillion cubic feet in 2011to 33.1 trillion cubic feet in 2040, a 44% increase. Almost allof this increase in domestic natural gas production is due toprojected growth in shale gas production, which grows from7.8 trillion cubic feet in 2011 to 16.7 trillion cubic feet in2040. Although the prospects for shale gas production arepromising, there remains considerable uncertainty regarding
2011 Projections
Shale Gas
Nonassociated Offshore
Nonassociated Onshore
Coalbed Methane
TightGas
Associated with Oil
Alaska
History35
30
25
20
15
10
5
01990 2000 2010 2020 2030 2040
Figure 3: U.S. Dry Natural Gas Production by Source, 1990-2040
Source: This figure is from the AEO2013 Early Release Overview, U.S. Energy Information Administration, December 5, 2012

The Benefits of Natural Gas Production and Exports for U.S. Small Businesses | 7
That expansion in production
has led to growth in employment
in the energy sector, while the
overall economy experienced a
decline in jobs.
the size and economics of this resource… An analysis in theAnnual Energy Outlook 2012 (released June 2012) indicatesthat the uncertainty in the size and economics of the domes-tic shale gas resources could have a considerable impact onfuture domestic natural gas production and that 2035 shalegas production could be between 9.7 trillion cubic feet and20.5 trillion cubic feet. U.S. total natural gas production isprojected to range between 26.1 trillion cubic feet and 34.1trillion cubic feet.”4
For good measure, proved reserves of U.S. dry natural gaswent from 192.5 trillion cubic feet in 2004 to 304.6 trillioncubic feet in 2010 – a 58 percent expansion.
This revolution in natural gas production – coupled with anincrease in U.S. oil production (also due to the extraction tech-nologies of hydraulic fracturing and horizontal drilling beingapplied, especially in Texas and North Dakota) – has providedconsiderable growth in the energy sector of our economy inrecent years, while the overall economy has badly faltered.
It is important to keep in mind when looking ahead thatprojected resources and production in the areas of oil andnatural gas usually turn out to be grossly under-estimatedgiven innovations and improvements that occur in explo-ration and production technologies – as has been so glar-ingly the case with increases in both oil and natural gasproduction in recent years that were not expected a rela-tively short time ago.
As already noted (and see Table 1), U.S. natural gas marketedproduction grew by 27 percent between 2005 and 2011.
Table 1: U.S. Natural Gas Marketed Production
2005: 18,927.1 billion cubic feet
2011: 24,036.4 billion cubic feet
Impact on Jobs
That expansion in production has led to growth in employ-ment in the energy sector, while the overall economy expe-rienced a decline in jobs.
Table 2 compares employment growth (all employment andbusiness data from Census Bureau “County Business Pat-terns” unless otherwise noted) among employer firms inthe overall economy, and in various energy industry sectors.
The difference in the employment story between the energysector and the overall economy could not be starker. Whileoverall employment fell between 2005 and 2010, jobs grewmarkedly in the energy sector given the striking expansionin domestic natural gas and oil production.
While U.S. total employment declined by 3.7 percent from2005 to 2010, jobs grew by the following:
• 27.6 percent in the oil and gas extraction sector;5
• 15.1 percent in the drilling oil and gas wells sector;6
• 38.5 percent in the support sector for oil and gas opera-tions;7
• 47 percent in the oil and gas pipeline and related struc-tures construction sector;8 and
• 62 percent in the oil and gas field machinery and equip-ment manufacturing sector.9
While U.S. employers overall shed 4.3 million jobs over thisperiod, employers in the five energy industries includedhere directly added 146,000 jobs.

8 | The Benefits of Natural Gas Production and Exports for U.S. Small Businesses
Impact on Small Business
At the same time, and not surprisingly, while the number ofbusinesses (in this case, employer firms) in the nationdeclined, business growth was strong among the energysector. And it is critical to note the role and growth ofsmaller businesses.
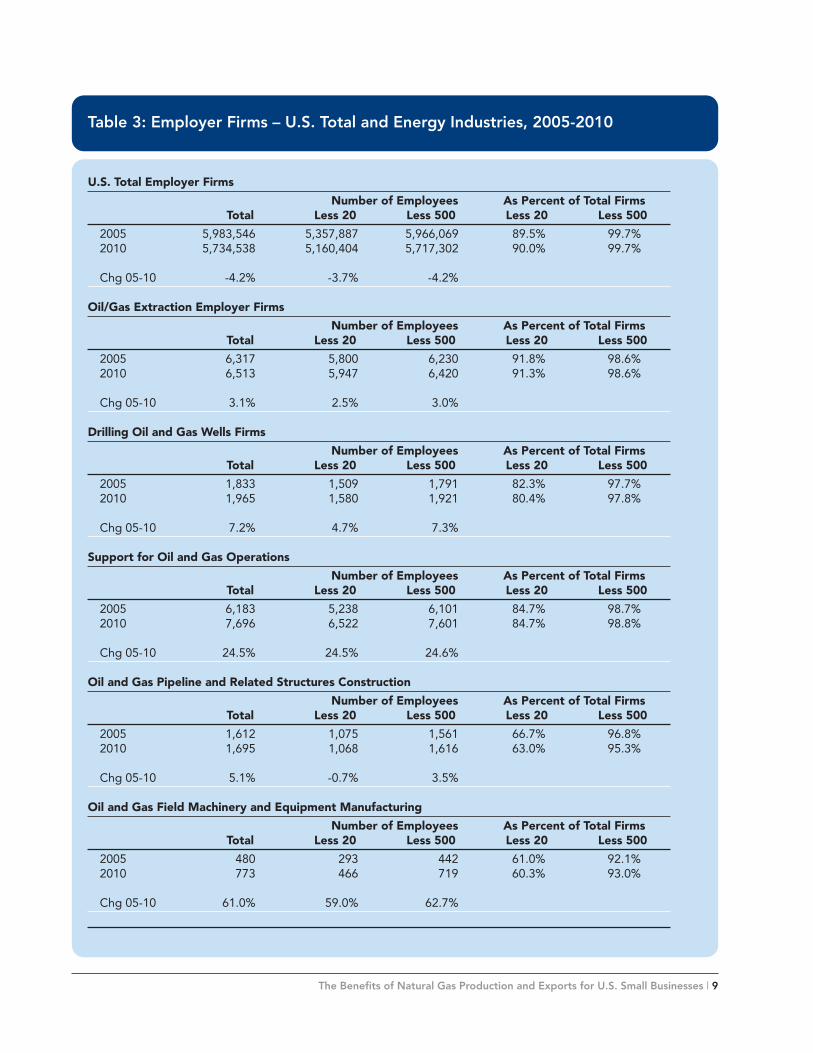
Table 3 makes clear that expanded production in theenergy sector has been a boon for small and midsize enter-prises. Or, to look at it from a different angle, expandedenergy production has been driven by small and midsizebusinesses.
For all of the U.S., total employer firms declined by 4.2 per-cent from 2005 to 2010, including a 3.7 percent decline infirms with less than 20 workers, and a 4.2 percent fall infirms with less than 500 workers. Again, compare thosedeclines to the growth in energy industries over the sameperiod:
• Among oil and gas extraction businesses, the number ofemployer firms grew by 3.1 percent, including growth of2.5 percent among firms with less than 20 workers and3.0 percent among firms with less than 500 workers.
• Among drilling oil and gas wells businesses, the numberof employer firms grew by 7.2 percent, including growthof 4.7 percent among firms with less than 20 workers and7.3 percent among firms with less than 500 workers.
• Among oil and gas operations businesses, the numberof employer firms grew by 24.5 percent, including growth
PercentSector 2005 2010 ChangeTotal 116,317,003 111,970,095 -3.7%
Oil/Gas Extraction 85,562 109,199 27.6%Drilling Oil and Gas Wells 66,084 76,072 15.1%Support for Oil and Gas Operations 136,038 188,468 38.5%Oil and Gas Pipeline and
Related Structures Construction 86,321 126,856 47.0%Oil and Gas Field Machinery
and Equipment Manufacturing 30,580 49,542 62.0%
Table 2: Employment Growth Among Employer Firms, 2005-2010
of 24.5 percent among firms with less than 20 workersand 24.6 percent among firms with less than 500 workers.
• Among oil and gas pipeline and related structures con-struction businesses, the number of employer firms grewby 5.1 percent, including growth of 3.5 percent amongfirms with less than 500 workers.
• Among oil and gas field machinery and equipment man-ufacturing businesses, the number of employer firmsgrew by 61.0 percent, including growth of 59.0 percentamong firms with less than 20 workers and 62.7 percentamong firms with less than 500 workers.
The growth in both jobs and small-midsize employer firmsin the energy sector has been striking in recent years, onceagain especially given the abysmal performance of theoverall economy.
Finally, it must be noted that the energy sector in fact is notall about huge enterprises. As noted in Table 3, each energysector looked at here is overwhelmingly populated by smalland midsize firms.
• Among oil and gas extraction businesses, 91.3 percentof employer firms in 2010 had less than 20 workers, and98.6 percent had fewer than 500 employees.
• Among drilling oil and gas wells businesses, 80.4 percentof employer firms in 2010 had less than 20 workers, and97.8 percent had fewer than 500 employees.
• Among oil and gas operations businesses, 84.7 percent
The Benefits of Natural Gas Production and Exports for U.S. Small Businesses | 9
U.S. Total Employer FirmsNumber of Employees As Percent of Total Firms
Total Less 20 Less 500 Less 20 Less 5002005 5,983,546 5,357,887 5,966,069 89.5% 99.7%2010 5,734,538 5,160,404 5,717,302 90.0% 99.7%
Chg 05-10 -4.2% -3.7% -4.2%
Oil/Gas Extraction Employer FirmsNumber of Employees As Percent of Total Firms
Total Less 20 Less 500 Less 20 Less 5002005 6,317 5,800 6,230 91.8% 98.6%2010 6,513 5,947 6,420 91.3% 98.6%
Chg 05-10 3.1% 2.5% 3.0%
Drilling Oil and Gas Wells FirmsNumber of Employees As Percent of Total Firms
Total Less 20 Less 500 Less 20 Less 5002005 1,833 1,509 1,791 82.3% 97.7%2010 1,965 1,580 1,921 80.4% 97.8%
Chg 05-10 7.2% 4.7% 7.3%
Support for Oil and Gas OperationsNumber of Employees As Percent of Total Firms
Total Less 20 Less 500 Less 20 Less 5002005 6,183 5,238 6,101 84.7% 98.7%2010 7,696 6,522 7,601 84.7% 98.8%
Chg 05-10 24.5% 24.5% 24.6%
Oil and Gas Pipeline and Related Structures ConstructionNumber of Employees As Percent of Total Firms
Total Less 20 Less 500 Less 20 Less 5002005 1,612 1,075 1,561 66.7% 96.8%2010 1,695 1,068 1,616 63.0% 95.3%
Chg 05-10 5.1% -0.7% 3.5%
Oil and Gas Field Machinery and Equipment Manufacturing Number of Employees As Percent of Total Firms
Total Less 20 Less 500 Less 20 Less 5002005 480 293 442 61.0% 92.1%2010 773 466 719 60.3% 93.0%
Chg 05-10 61.0% 59.0% 62.7%
Table 3: Employer Firms – U.S. Total and Energy Industries, 2005-2010

10 | The Benefits of Natural Gas Production and Exports for U.S. Small Businesses
of employer firms in 2010 had less than 20 workers, and98.8 percent had fewer than 500 employees.
• Among oil and gas pipeline and related structures con-struction businesses, 63.0 percent of employer firms in2010 had less than 20 workers, and 95.3 percent hadfewer than 500 employees.
• Among oil and gas field machinery and equipment man-ufacturing businesses, 60.3 percent of employer firms in2010 had less than 20 workers, and 93.0 percent hadfewer than 500 employees.
Finally, in looking at the full picture of the impact uncon-ventional oil and natural gas production – that is, “uncon-ventional natural gas extracted from shale formations andfrom tight sands and unconventional oil extracted fromshale and other dense rocks” – on the U.S. economy, IHSfound:10
• “In 2012, capital expenditures will surpass $87 billion.These expenditures supporting the growth of unconven-tional oil and gas activity will reach $172.5 billion in 2020and more than $353 billion in 2035.”
• “Over 1.7 million jobs are attributable to unconventionaloil and gas development today. These employment con-tributions are expected to rise to 3 million by the end ofthe decade and to 3.5 million jobs by 2035.”
• “In 2012, unconventional oil and gas will contributealmost $238 billion in value added to the US economy.This contribution to gross domestic product (GDP) willincrease more than 75% by 2020 to over $416 billion. Bythe final year of the forecast period, 2035, this willincrease to nearly $475 billion.”
Now let’s consider the developments in key states experiencingexpanded opportunities on the natural gas production front.

The Benefits of Natural Gas Production and Exports for U.S. Small Businesses | 11
II. Arkansas
The increase in natural gas production has been dramatic in Arkansas via the Fayetteville Shale area. Thestate’s natural gas production, as highlighted in Table 4, expanded by 462.7 percent from 2005 to 2011.
Impact on Jobs
Table 5 compares employment growth (again, all employ-ment and business data from Census Bureau “County Busi-ness Patterns” unless otherwise noted) among employerestablishments in the overall state, and in various energyindustry sectors. The difference in the employment storybetween the energy sector and the overall economy isstriking.
While overall employment fell between 2005 and 2010,jobs grew markedly in the energy sector given the expan-sion in energy production.
Arkansas total employment declined by 5.1 percent from2005 to 2010, but jobs grew by the following:
Table 4: Arkansas Natural Gas Marketed Production
2005: 190.5 billion cubic feet
2011: 1,072.2 billion cubic feet
• 161.5 percent in the oil and gas extraction sector;
• 254.9 percent in the drilling oil and gas wells sector;
• 259.4 percent in the support sector for oil and gas oper-ations; and
• 126.9 percent in the oil and gas pipeline and relatedstructures construction sector.
While Arkansas employers overall shed 51,950 jobs over thisperiod, employers in the four energy industries (where datawas available) included here added more than 5,600 jobs.
PercentSector 2005 2010 ChangeTotal 1,017,424 965,474 -5.1%
Oil/Gas Extraction 637 1,666 161.5%Drilling Oil and Gas Wells 692 2,456 254.9%Support for Oil and Gas Operations 817 2,936 259.4%Oil and Gas Pipeline and
Related Structures Construction 588 1,334 126.9%Oil and Gas Field Machinery
and Equipment Manufacturing NA NA NA
Table 5: Arkansas Employment Growth Among Employer Establishments, 2005-2010

Impact on Small Business
At the same time, while the number of businesses (in thiscase, establishments) declined in the nation and in Arkansas(though at a slower pace of decline in Arkansas comparedto the U.S.), the number of establishments grew stronglyamong Arkansas’ energy sector. And it is critical to note therole and growth of smaller businesses.
Table 6 makes clear that expanded production in theenergy sector has been a boon for small and midsize enter-prises in the state. Or, to look at it from a different angle,expanded energy production has been driven by small andmidsize businesses.
For all of the U.S., total employer establishments declinedby 1.4 percent from 2005 to 2010, including a 3.5 percentdecline in establishments with less than 20 workers, and a3.1 percent fall in establishments with less than 500 workers.
In Arkansas, total establishments declined by 1.3 percent,including a 1.5 percent fall among establishments with lessthan 20 workers, and a 1.3 percent decline among thosewith less than 500 workers.
But compare those declines to the growth in these energyindustries in Arkansas:
• Among oil and gas extraction businesses, the number ofemployer establishments grew by 14.6 percent, includ-ing growth of 13.1 percent among those with less than 20workers and 14.6 percent among establishments withless than 500 workers.
• Among drilling oil and gas wells businesses, the numberof employer establishments grew by 56.3 percent, includ-ing growth of 40.0 percent among establishments withless than 20 workers and 56.3 percent among establish-ments with less than 500 workers.
• Among oil and gas operations businesses, the numberof employer establishments grew by 77 percent, includ-ing growth of 51.8 percent among establishments withless than 20 workers and 77 percent among establish-ments with less than 500 workers.
12 | The Benefits of Natural Gas Production and Exports for U.S. Small Businesses
The growth in both jobs and small-midsize employer estab-lishments in the energy sector has been striking in recentyears, especially given the abysmal performance of theoverall economy.
Finally, it must be noted that the Arkansas energy sector isnot all about big energy businesses. As noted in Table 6,each energy sector looked at is overwhelmingly populatedby small and midsize establishments.
• Among oil and gas extraction businesses, 93.1 percent ofemployer establishments in 2010 had less than 20 workers,and 100 percent had fewer than 500 employees.
• Among drilling oil and gas wells businesses, 70 percent ofemployer establishments in 2010 had less than 20 workers,and 100 percent had fewer than 500 employees.
• Among oil and gas operations businesses, 81.8 percent ofemployer establishments in 2010 had less than 20 workers,and 98.8 percent had fewer than 500 employees.
• Among oil and gas pipeline and related structures con-struction businesses, 48.3 percent of employer estab-lishments in 2010 had less than 20 workers, and 95.3percent had fewer than 500 employees.

The Benefits of Natural Gas Production and Exports for U.S. Small Businesses | 13
Arkansas Total EstablishmentsNumber of Employees As Percent of Total Firms
Total Less 20 Less 500 Less 20 Less 5002005 66,039 57,236 65,844 86.7% 99.7%2010 65,158 56,394 65,018 86.5% 99.8%
AR 05-10 -1.3% -1.5% -1.3%US 05-10 -1.4% -3.5% -3.1%
Arkansas Oil/Gas Extraction Employer EstablishmentsNumber of Employees As Percent of Total Firms
Total Less 20 Less 500 Less 20 Less 5002005 89 84 89 94.4% 100%2010 102 95 102 93.1% 100%
Chg 05-10 14.6% 13.1% 14.6%
Arkansas Drilling Oil and Gas Wells EstablishmentsNumber of Employees As Percent of Total Firms
Total Less 20 Less 500 Less 20 Less 5002005 32 25 32 78.1% 100%2010 50 35 50 70.0% 100%
Chg 05-10 56.3% 40.0% 56.3%
Arkansas Support for Oil and Gas Operations EstablishmentsNumber of Employees As Percent of Total Firms
Total Less 20 Less 500 Less 20 Less 5002005 87 83 87 95.4% 100%2010 154 126 154 81.8% 100%
Chg 05-10 77.0% 51.8% 77.0%
Arkansas Oil and Gas Pipeline and Related Structures Construction EstablishmentsNumber of Employees As Percent of Total Firms
Total Less 20 Less 500 Less 20 Less 5002005 30 20 30 66.7% 100%2010 29 14 29 48.3% 100%
Chg 05-10 -3.3% -30.0% -3.3%
Arkansas Oil and Gas Field Machinery and Equipment Manufacturing Establishments Number of Employees As Percent of Total Firms
Total Less 20 Less 500 Less 20 Less 5002005 1 0 1 0% 100%2010 2 1 2 50% 100%
Chg 05-10 100% - 100%
Table 6: Establishments – Arkansas Total and Energy Industries, 2005-2010
14 | The Benefits of Natural Gas Production and Exports for U.S. Small Businesses
III. Colorado
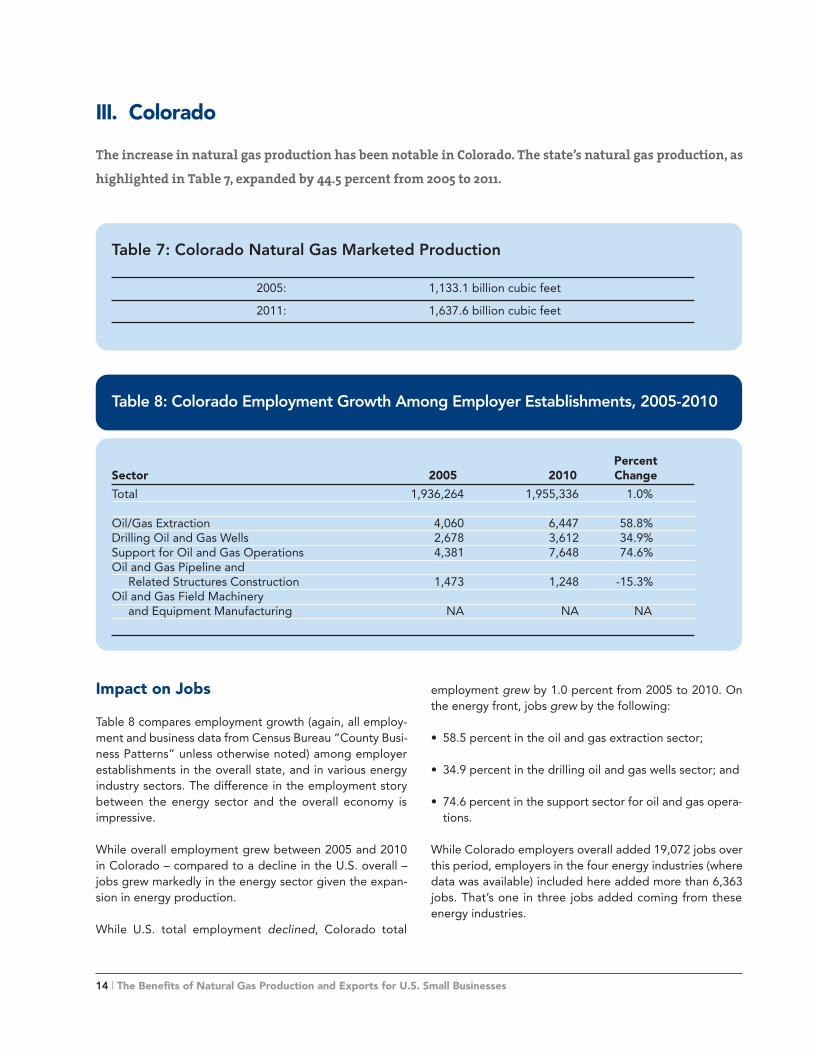
The increase in natural gas production has been notable in Colorado. The state’s natural gas production, ashighlighted in Table 7, expanded by 44.5 percent from 2005 to 2011.
Impact on Jobs
Table 8 compares employment growth (again, all employ-ment and business data from Census Bureau “County Busi-ness Patterns” unless otherwise noted) among employerestablishments in the overall state, and in various energyindustry sectors. The difference in the employment storybetween the energy sector and the overall economy isimpressive.
While overall employment grew between 2005 and 2010in Colorado – compared to a decline in the U.S. overall –jobs grew markedly in the energy sector given the expan-sion in energy production.
While U.S. total employment declined, Colorado total
Table 7: Colorado Natural Gas Marketed Production
2005: 1,133.1 billion cubic feet
2011: 1,637.6 billion cubic feet
employment grew by 1.0 percent from 2005 to 2010. Onthe energy front, jobs grew by the following:
• 58.5 percent in the oil and gas extraction sector;
• 34.9 percent in the drilling oil and gas wells sector; and
• 74.6 percent in the support sector for oil and gas opera-tions.
While Colorado employers overall added 19,072 jobs overthis period, employers in the four energy industries (wheredata was available) included here added more than 6,363jobs. That’s one in three jobs added coming from theseenergy industries.
PercentSector 2005 2010 ChangeTotal 1,936,264 1,955,336 1.0%
Oil/Gas Extraction 4,060 6,447 58.8%Drilling Oil and Gas Wells 2,678 3,612 34.9%Support for Oil and Gas Operations 4,381 7,648 74.6%Oil and Gas Pipeline and
Related Structures Construction 1,473 1,248 -15.3%Oil and Gas Field Machinery
and Equipment Manufacturing NA NA NA
Table 8: Colorado Employment Growth Among Employer Establishments, 2005-2010

The Benefits of Natural Gas Production and Exports for U.S. Small Businesses | 15
Impact on Small Business
At the same time, while the number of businesses (in thiscase, establishments) in the nation declined, in Colorado,the number of establishments grew, and they expandedrobustly in the state’s energy sector. And it is critical to notethe role and growth of smaller businesses.
Table 9 makes clear that expanded production in theenergy sector has been a boon for small and midsize enter-prises in the state. Or, to look at it from a different angle,expanded energy production has been driven by small andmidsize businesses.
For all of the U.S., total employer establishments declinedby 1.4 percent from 2005 to 2010, including a 3.5 percentdecline in establishments with less than 20 workers, and a3.1 percent fall in establishments with less than 500 work-ers.
In Colorado, total establishments increased by 0.6 percent,including a 1.2 percent increase among establishments withless than 20 workers, and a 0.6 percent rise among thosewith less than 500 workers.
Again, compare the U.S. decline to the growth in theseenergy industries in Colorado:
• Among oil and gas extraction businesses, the number ofemployer establishments grew by 7.6 percent, includinggrowth of 6.8 percent among establishments with lessthan 20 workers and 7.0 percent among establishmentswith less than 500 workers.
• Among drilling oil and gas wells businesses, the numberof employer establishments grew by 12.8 percent, includ-ing growth of 12.7 percent among establishments withless than 20 workers and 14.1 percent among establish-ments with less than 500 workers.
• Among oil and gas operations businesses, the numberof employer establishments grew by 61.4 percent, includ-ing growth of 58 percent among establishments with lessthan 20 workers and 61 percent among establishmentswith less than 500 workers.
• Among oil and gas pipeline and related structures con-struction businesses, the number of employer establish-ments grew by 2 percent, including growth of 14.3percent among establishments with less than 20 workersand 2 percent among those with less than 500 workers.
The growth in both jobs and small-midsize employer estab-lishments in the energy sector has been noteworthy, againespecially given the abysmal performance of the overalleconomy.
Finally, it must be noted that the Colorado energy sector infact is not all about huge enterprises. As noted in Table 9,each energy sector looked at is overwhelmingly populatedby small and midsize establishments.
• Among oil and gas extraction businesses, 87.4 percent ofemployer establishments in 2010 had less than 20 workers,and 99.5 percent had fewer than 500 employees.
• Among drilling oil and gas wells businesses, 73.2 percentof employer establishments in 2010 had less than 20workers, and 100 percent had fewer than 500 employees.
• Among oil and gas operations businesses, 87.4 percent ofemployer establishments in 2010 had less than 20 workers,and 99.5 percent had fewer than 500 employees.
• Among oil and gas pipeline and related structures con-struction businesses, 78.4 percent of employer estab-lishments in 2010 had less than 20 workers, and 100percent had fewer than 500 employees.
• Among oil and gas field machinery and equipment man-ufacturing businesses, 75 percent of employer establish-ments in 2010 had less than 20 workers, and 100 percenthad fewer than 500 employees.

16 | The Benefits of Natural Gas Production and Exports for U.S. Small Businesses
Colorado Total EstablishmentsNumber of Employees As Percent of Total Firms
Total Less 20 Less 500 Less 20 Less 5002005 151,070 133,125 150,799 88.1% 99.8%2010 151,973 134,726 151,695 88.7% 99.8%
CO 05-10 0.6% 1.2% 0.6%US 05-10 -1.4% -3.5% -3.1%
Oil/Gas Extraction Employer EstablishmentsNumber of Employees As Percent of Total Firms
Total Less 20 Less 500 Less 20 Less 5002005 369 325 369 88.1% 100%2010 397 347 395 87.4% 99.5%
Chg 05-10 7.6% 6.8% 7.0%
Drilling Oil and Gas Wells EstablishmentsNumber of Employees As Percent of Total Firms
Total Less 20 Less 500 Less 20 Less 5002005 86 63 85 73.3% 98.8%2010 97 71 97 73.2% 100%
Chg 05-10 12.8% 12.7% 14.1%
Support for Oil and Gas Operations EstablishmentsNumber of Employees As Percent of Total Firms
Total Less 20 Less 500 Less 20 Less 5002005 355 317 354 89.3% 99.7%2010 573 501 570 87.4% 99.5%
Chg 05-10 61.4% 58.0% 61.0%
Oil and Gas Pipeline and Related Structures Construction EstablishmentsNumber of Employees As Percent of Total Firms
Total Less 20 Less 500 Less 20 Less 5002005 50 35 50 70.0% 100%2010 51 40 51 78.4% 100%
Chg 05-10 2.0% 14.3% 2.0%
Oil and Gas Field Machinery and Equipment Manufacturing EstablishmentsNumber of Employees As Percent of Total Firms
Total Less 20 Less 500 Less 20 Less 5002005 5 3 5 60% 100%2010 4 3 4 75% 100%
Chg 05-10 -20% 0% -20%
Table 9: Establishments – Colorado Total and Energy Industries, 2005-2010

The Benefits of Natural Gas Production and Exports for U.S. Small Businesses | 17
IV. Louisiana
The increase in natural gas production has been sizeable in Louisiana, to say the least. The state’s naturalgas production, as highlighted in Table 10, expanded by 133.7 percent from 2005 to 2011.
Impact on Jobs
Table 11 compares employment growth (again, all employ-ment and business data from Census Bureau “County Busi-ness Patterns” unless otherwise noted) among employerestablishments in the overall state, and in various energyindustry sectors. The difference in the employment storybetween the energy sector and the overall economy isnotable, even with the decline in the oil and gas extractionsector.
While overall employment declined between 2005 and2010 in Louisiana – though at a much slower rate than thedecline in the U.S. overall – jobs grew markedly in theenergy sector given the expansion in energy production.
Table 10: Louisiana Natural Gas Marketed Production
2005: 1,296.0 billion cubic feet
2011: 3,029.2 billion cubic feet
PercentSector 2005 2010 ChangeTotal 1,617,507 1,599,551 -1.1%
Oil/Gas Extraction 10,280 8,565 -16.7%Drilling Oil and Gas Wells 6,524 6,765 3.7%Support for Oil and Gas Operations 26,069 32,247 23.7%Oil and Gas Pipeline and
Related Structures Construction 14,452 28,897 100%Oil and Gas Field Machinery
and Equipment Manufacturing NA 3,575 NA
Table 11: Louisiana Employment Growth Among Employer Establishments, 2005-2010
While Louisiana and U.S. total employment declined, Louisianaemployment grew in three of the four energy sectors for whichdata was available, expanding by the following:
• 3.7 percent in the drilling oil and gas wells sector;
• 23.7 percent in the support sector for oil and gas opera-tions; and
• 100 percent in the oil and gas pipeline and related struc-tures construction industry.
While Louisiana employers overall shed 17,956 jobs overthis period, employers in the four energy industries (wheredata was available) included here added 19,149 jobs. That’san incredible contrast.

18 | The Benefits of Natural Gas Production and Exports for U.S. Small Businesses
Impact on Small Businesses
At the same time, while the number of businesses (in thiscase, establishments) in the nation declined, in Louisiana,the number of establishments grew, and they expandedstrongly in the state’s energy sector. It is critical to note therole and growth of smaller businesses as well.
Table 12 makes clear that expanded production in theenergy sector has been a boon for small and midsize enter-prises in the state. Or, to look at it from a different angle,expanded energy production has been driven by small andmidsize businesses.
For all of the U.S., total employer establishments declinedby 1.4 percent from 2005 to 2010, including a 3.5 percentdecline in firms with less than 20 workers, and a 3.1 per-cent fall in firms with less than 500 workers.
In Louisiana, total establishments increased by 0.6 percent,including a 0.5 percent increase among establishments withless than 20 workers, and a 0.6 percent rise among thosewith less than 500 workers.
Again, compare the U.S. decline to the growth in theseenergy industries in Louisiana:
• Among oil and gas extraction businesses, the number ofemployer establishments grew by 6.0 percent, includinggrowth of 8.8 percent among establishments with lessthan 20 workers and 6.6 percent among establishmentswith less than 500 workers.
• Among oil and gas operations businesses, the numberof employer establishments grew by 24.1 percent, includ-ing growth of 27.7 percent among establishments withless than 20 workers and 24.6 percent among establish-ments with less than 500 workers.
• Among oil and gas pipeline and related structures con-struction businesses, the number of employer establish-ments grew by 25.7 percent, including growth of 24.3percent among establishments with less than 500 workers.
• Among field machinery and equipment manufacturingbusinesses, the number of employer establishments grewby 35.6 percent, including growth of 63 percent amongestablishments with less than 20 workers and 35.6 per-cent among establishments with less than 500 workers.
The growth in both jobs and small-midsize employer estab-lishments in the energy sector has been noteworthy inrecent years, again especially given the abysmal perform-ance of the overall economy.
Finally, it must be noted that the Louisiana energy sectorin fact is not all about huge enterprises. As noted in Table12, each energy sector looked at is overwhelmingly popu-lated by small and midsize establishments.
• Among oil and gas extraction businesses, 79.6 percent ofemployer establishments in 2010 had less than 20 workers,and 99.5 percent had fewer than 500 employees.
• Among drilling oil and gas wells businesses, 69.5 percentof employer establishments in 2010 had less than 20 workers,and 99.4 percent had fewer than 500 employees.
• Among oil and gas operations businesses, 74 percent ofemployer establishments in 2010 had less than 20 work-ers, and 98.9 percent had fewer than 500 employees.
• Among oil and gas pipeline and related structures con-struction businesses, 43.9 percent of employer estab-lishments in 2010 had less than 20 workers, and 97percent had fewer than 500 employees.
• Among oil and gas field machinery and equipment man-ufacturing businesses, 55 percent of employer establish-ments in 2010 had less than 20 workers, and 100 percenthad fewer than 500 employees.

The Benefits of Natural Gas Production and Exports for U.S. Small Businesses | 19
Louisiana Total EstablishmentsNumber of Employees As Percent of Total Firms
Total Less 20 Less 500 Less 20 Less 5002005 102,790 87,638 102,526 85.3% 99.7%2010 103,365 88,081 103,130 85.2% 99.8%
LA 05-10 0.6% 0.5% 0.6%US 05-10 -1.4% -3.5% -3.1%
Oil/Gas Extraction Employer EstablishmentsNumber of Employees As Percent of Total Firms
Total Less 20 Less 500 Less 20 Less 5002005 397 308 393 77.6% 99.0%2010 421 335 419 79.6% 99.5%
Chg 05-10 6.0% 8.8% 6.6%
Drilling Oil and Gas Wells EstablishmentsNumber of Employees As Percent of Total Firms
Total Less 20 Less 500 Less 20 Less 5002005 179 127 177 70.9% 98.9%2010 177 123 176 69.5% 99.4%
Chg 05-10 -1.1% -3.1% -0.6%
Support for Oil and Gas Operations EstablishmentsNumber of Employees As Percent of Total Firms
Total Less 20 Less 500 Less 20 Less 5002005 738 531 727 72.0% 98.5%2010 916 678 906 74.0% 98.9%
Chg 05-10 24.1% 27.7% 24.6%
Oil and Gas Pipeline and Related Structures Construction EstablishmentsNumber of Employees As Percent of Total Firms
Total Less 20 Less 500 Less 20 Less 5002005 105 58 103 55.2% 98.1%2010 132 58 128 43.9% 97.0%
Chg 05-10 25.7% 0% 24.3%
Oil and Gas Field Machinery and Equipment Manufacturing EstablishmentsNumber of Employees As Percent of Total Firms
Total Less 20 Less 500 Less 20 Less 5002005 59 27 59 45.8% 100%2010 80 44 80 55.0% 100%
Chg 05-10 35.6% 63.0% 35.6%
Table 12: Establishments – Louisiana Total and Energy Industries, 2005-2010

20 | The Benefits of Natural Gas Production and Exports for U.S. Small Businesses
V. North Dakota
The big energy story in North Dakota in recent years has been the increase in oil production, pushing thestate to ranking second among the states in oil output. At the same time, though, the increase in natural gasproduction has been sizeable as well. The state’s natural gas production, as highlighted in Table 13, expandedby 84.8 percent from 2005 to 2011.
Table 13: North Dakota Natural Gas Marketed Production
2005: 52.557 billion cubic feet
2011: 97.102 billion cubic feet
PercentSector 2005 2010 ChangeTotal 270,479 294,907 9.0%
Oil/Gas Extraction 1,130 1,607 42.2%Drilling Oil and Gas Wells 554 1,442 160.3%Support for Oil and Gas Operations 1,036 3,604 247.9%Oil and Gas Pipeline and
Related Structures Construction NA 75 NAOil and Gas Field Machinery
and Equipment Manufacturing NA NA NA
Table 14: North Dakota Employment Growth Among Employer Establishments, 2005-2010
Impact on Jobs
Table 14 compares employment growth (again, all employ-ment and business data from Census Bureau “County Busi-ness Patterns” unless otherwise noted) among employerestablishments in the overall state, and in various energyindustry sectors. The difference in the employment storybetween North Dakota, including its energy sector, and theoverall U.S. economy is striking.
While overall employment increased between 2005 and2010 in North Dakota, jobs grew even faster in the energysector given the expansion in energy production.
While U.S. total employment declined, North Dakotaemployment grew overall, including in each energy sectorfor which data was available, expanding by the following:
• 42.2 percent in the oil and gas extraction sector;
• 160.3 percent in the drilling oil and gas wells sector; and
• 247.9 percent in the support sector for oil and gas oper-ations.
North Dakota employers overall added 24,428 jobs overthis period, with employers in the three energy industries(where data was available) included here adding 3,933.

The Benefits of Natural Gas Production and Exports for U.S. Small Businesses | 21
Impact on Small Businesses
At the same time, while the number of businesses (in thiscase, establishments) in the nation declined, in NorthDakota, the number of establishments grew, and theyexpanded strongly in the state’s energy sector. It is criticalto note the role and growth of smaller businesses as well.
Table 15 makes clear that expanded production in theenergy sector has been a boon for small and midsize enter-prises in the state. Or, to look at it from a different angle,expanded energy production has been driven by small andmidsize businesses.
For all of the U.S., total employer establishments declinedby 1.4 percent from 2005 to 2010, including a 3.5 percentdecline in establishments with less than 20 workers, and a3.1 percent fall in establishments with less than 500 workers.
In North Dakota, total establishments increased by 3.7 per-cent, including a 1.0 percent increase among establish-ments with less than 20 workers, and a 2.5 percent riseamong those with less than 500 workers.
Again, compare the U.S. decline to the growth in theseenergy industries in North Dakota:
• Among oil and gas extraction businesses, the number ofemployer establishments grew by 28.1 percent, includ-ing growth of 44 percent among establishments with lessthan 20 workers and 32.3 percent among establishmentswith less than 500 workers.
• Among drilling oil and gas wells businesses, the numberof employer establishments grew by 20 percent, includ-ing growth of 18.2 percent among establishments withless than 20 workers and 20 percent among establish-ments with less than 500 workers.
• Among oil and gas operations businesses, the numberof employer establishments grew by 74.5 percent, includ-ing growth of 46.1 percent among establishments withless than 20 workers and 74.5 percent among establish-ments with less than 500 workers.
The growth in both jobs and small-midsize employer estab-lishments in the energy sector has been noteworthy inrecent years, especially given the abysmal performance ofthe overall economy.
Finally, it must be noted that the North Dakota energy sec-tor in fact is not all about huge enterprises. As noted inTable 15, each energy sector looked at is overwhelminglypopulated by small and midsize establishments.
• Among oil and gas extraction businesses, 87.8 percent ofemployer establishments in 2010 had less than 20 workers,and 100 percent had fewer than 500 employees.
• Among drilling oil and gas wells businesses, 54.2 percentof employer establishments in 2010 had less than 20workers, and 100 percent had fewer than 500 employees.
• Among oil and gas operations businesses, 73 percent ofemployer establishments in 2010 had less than 20 workers,and 100 percent had fewer than 500 employees.
• Among oil and gas pipeline and related structures con-struction businesses, 85.7 percent of employer estab-lishments in 2010 had less than 20 workers, and 100percent had fewer than 500 employees.
• Among oil and gas field machinery and equipment man-ufacturing businesses, 33 percent of employer establish-ments in 2010 had less than 20 workers, and 100 percenthad fewer than 500 employees.

22 | The Benefits of Natural Gas Production and Exports for U.S. Small Businesses
North Dakota Total EstablishmentsNumber of Employees As Percent of Total Firms
Total Less 20 Less 500 Less 20 Less 5002005 21,061 15,268 18,768 72.5% 89.1%2010 21,832 15,427 19,236 70.7% 88.1%
ND 05-10 3.7% 1.0% 2.5%US 05-10 -1.4% -3.5% -3.1%
Oil/Gas Extraction Employer EstablishmentsNumber of Employees As Percent of Total Firms
Total Less 20 Less 500 Less 20 Less 5002005 32 25 31 78.1% 96.9%2010 41 36 41 87.8% 100%
Chg 05-10 28.1% 44.0% 32.3%
Drilling Oil and Gas Wells EstablishmentsNumber of Employees As Percent of Total Firms
Total Less 20 Less 500 Less 20 Less 5002005 20 11 20 55.0% 100%2010 24 13 24 54.2% 100%
Chg 05-10 20.0% 18.2% 20.0%
Support for Oil and Gas Operations EstablishmentsNumber of Employees As Percent of Total Firms
Total Less 20 Less 500 Less 20 Less 5002005 102 89 102 87.3% 100%2010 178 130 178 73.0% 100%
Chg 05-10 74.5% 46.1% 74.5%
Oil and Gas Pipeline and Related Structures Construction EstablishmentsNumber of Employees As Percent of Total Firms
Total Less 20 Less 500 Less 20 Less 5002005 7 6 7 85.7% 100%2010 7 6 7 85.7% 100%
Chg 05-10 0% 0% 0%
Oil and Gas Field Machinery and Equipment Manufacturing EstablishmentsNumber of Employees As Percent of Total Firms
Total Less 20 Less 500 Less 20 Less 5002005 2 2 2 100% 100%2010 3 1 3 33.0% 100%
Chg 05-10 50.0% -50.0% 50.0%
Table 15: Establishments – North Dakota Total and Energy Industries, 2005-2010

The Benefits of Natural Gas Production and Exports for U.S. Small Businesses | 23
VI. Ohio
The opportunity for increased shale natural gas production exists in Ohio, but is only beginning to moveforward. The state’s natural gas production, as noted in Table 16, actually contracted between 2005 and2011, falling by 7.8 percent.
Again, though, the opportunities for expanded production certainly exist with both the Utica and Marcellus Shaleplays reaching into the state. In fact, it is worth noting that a December 2012 IHS study projected that jobs tied tounconventional oil and gas production in Ohio could rise from 38,830 in 2012 to 143,595 in 2020 and 266,624 in 2035.11
Table 16: Ohio Natural Gas Marketed Production
2005: 85.523 billion cubic feet
2011: 78.858 billion cubic feet
PercentSector 2005 2010 ChangeTotal 4,762,618 4,352,481 -8.6%
Oil/Gas Extraction 1,355 1,340 -1.1%Drilling Oil and Gas Wells 515 542 5.7%Support for Oil and Gas Operations 1,206 1,023 -15.2%Oil and Gas Pipeline and
Related Structures Construction 2,281 2,411 5.7%Oil and Gas Field Machinery
and Equipment Manufacturing NA NA NA
Table 17: Ohio Employment Growth Among Employer Establishments, 2005-2010
For good measure, a recent New York Times story notedhow investment in the state is stepping up.12 It was noted inthe report that “natural gas buried in shale thousands of feetbelow the surface is attracting more than $1 billion in privateinvestment and rapidly reviving the area as an energy pro-ducer. To prepare, market and transport the natural gas,companies are building an expansive network of regionalfield offices, processing plants and other infrastructure… Inpublic statements, though, energy industry executives havesaid drilling and production are being impeded by a short-age of processing plants and pipelines. Chesapeake and
other leading production and processing companies areattacking that problem with an infrastructure developmentprogram never seen here, said Thomas E. Stewart, executivevice president of the Ohio Oil and Gas Association… Withall this energy-related construction, industry executivesbelieve that Ohio will produce two billion to three billioncubic feet of processed gas daily within the decade.”
Impact on Jobs
Table 17 compares employment growth (again, all employ-

24 | The Benefits of Natural Gas Production and Exports for U.S. Small Businesses
ment and business data from Census Bureau “County Busi-ness Patterns” unless otherwise noted) among employerestablishments in the overall state, and in various energyindustry sectors. Unfortunately, given the limited activity onthe energy front, Ohio has suffered along with the rest ofthe nation during these tough economic times.
While U.S. total employment declined from 2005 to 2010,it fell even more in Ohio. And the jobs story in the energysector was mixed, with employment:
• declining by 1.1 percent in the oil and gas extraction sector;
• increasing by 5.7 percent in the drilling oil and gas wellssector;
• declining by 15.2 percent in the support sector for oil andgas operations; and
• increasing by 5.7 percent in the oil and gas pipeline andrelated structures construction.
Impact on Small Businesses
And while the number of businesses (in this case, estab-lishments) in the nation declined, in Ohio, the decline waseven larger.
As noted in Table 18, for all of the U.S., total employer estab-lishments declined by 1.4 percent from 2005 to 2010, includ-ing a 3.5 percent decline in firms with less than 20 workers,and a 3.1 percent fall in firms with less than 500 workers.
In Ohio, total establishments decreased by 6.4 percent,including a 9.5 percent drop among establishments withless than 20 workers, and a 8.6 percent fall off among thosewith less than 500 workers.
Again, compared with the U.S. in general and other statesthat have moved ahead aggressively on energy production,Ohio’s numbers in the energy sector regarding establish-ment growth have been very mixed:
• Among oil and gas extraction businesses, the number ofemployer establishments fell by 5.7 percent, including afall of 6.2 percent among establishments with less than20 workers and 5.7 percent among establishments withless than 500 workers.
• Among drilling oil and gas wells businesses, the numberof employer establishments declined by 1.4 percent,including growth of 5 percent among establishments with
less than 20 workers and a decline of 1.4 percent amongestablishments with less than 500 workers.
• Among oil and gas operations businesses, the numberof employer establishments actually grew by 9.4 percent,including growth of 9.4 percent among establishmentswith less than 20 workers and 9.4 percent among estab-lishments with less than 500 workers.
• Among oil and gas pipeline and related structures con-struction businesses, the number of employer establish-ments grew by 16.9 percent, including growth of 13.2percent among establishments with less than 20 workersand 19 percent among those with less than 500.
• Among oil and gas field machinery and equipment manu-facturing businesses, the number of employer establish-ments fell by 33.3 percent, including a decline of 50 percentamong establishments with less than 20 workers and 33.3percent among establishments with less than 500 workers.
Nonetheless, it must be noted that the Ohio energy sectorstill in fact is not about huge enterprises. As noted in Table18, each energy sector looked at is overwhelmingly popu-lated by small and midsize establishments.
• Among oil and gas extraction businesses, 92.9 percent ofemployer establishments in 2010 had less than 20 work-ers, and 100 percent had fewer than 500 employees.
• Among drilling oil and gas wells businesses, 91.3 percentof employer establishments in 2010 had less than 20workers, and 100 percent had fewer than 500 employees.
• Among oil and gas operations businesses, 92.1 percentof employer establishments in 2010 had less than 20workers, and 100 percent had fewer than 500 employees.
• Among oil and gas pipeline and related structures con-struction businesses, 62.3 percent of employer estab-lishments in 2010 had less than 20 workers, and 100percent had fewer than 500 employees.
• Among oil and gas field machinery and equipment man-ufacturing businesses, 66.7 percent of employer estab-lishments in 2010 had less than 20 workers, and 100percent had fewer than 500 employees.
In the end, the change in Ohio employment and small busi-ness growth will increase like other states with significantshale-based energy resources once the state starts movingahead aggressively with production. And that will only befed further via LNG exports.

The Benefits of Natural Gas Production and Exports for U.S. Small Businesses | 25
Ohio Total EstablishmentsNumber of Employees As Percent of Total Firms
Total Less 20 Less 500 Less 20 Less 5002005 270,968 181,984 223,825 67.2% 82.6%2010 253,491 164,646 204,503 65.0% 80.7%
OH 05-10 -6.4% -9.5% -8.6%US 05-10 -1.4% -3.5% -3.1%
Oil/Gas Extraction Employer EstablishmentsNumber of Employees As Percent of Total Firms
Total Less 20 Less 500 Less 20 Less 5002005 209 195 209 93.3% 100%2010 197 183 197 92.9% 100%
Chg 05-10 -5.7% -6.2% -5.7%
Drilling Oil and Gas Wells EstablishmentsNumber of Employees As Percent of Total Firms
Total Less 20 Less 500 Less 20 Less 5002005 70 60 70 85.7% 100%2010 69 63 69 91.3% 100%
Chg 05-10 -1.4% 5.0% -1.4%
Support for Oil and Gas Operations EstablishmentsNumber of Employees As Percent of Total Firms
Total Less 20 Less 500 Less 20 Less 5002005 138 127 138 92.0% 100%2010 151 139 151 92.1% 100%
Chg 05-10 9.4% 9.4% 9.4%
Oil and Gas Pipeline and Related Structures Construction EstablishmentsNumber of Employees As Percent of Total Firms
Total Less 20 Less 500 Less 20 Less 5002005 59 38 58 64.4% 98.3%2010 69 43 69 62.3% 100%
Chg 05-10 16.9% 13.2% 19.0%
Oil and Gas Field Machinery and Equipment Manufacturing EstablishmentsNumber of Employees As Percent of Total Firms
Total Less 20 Less 500 Less 20 Less 5002005 9 8 9 88.9% 100%2010 6 4 6 66.7% 100%
Chg 05-10 -33.3% -50.0% -33.3%
Table 18: Establishments – Ohio Total and Energy Industries, 2005-2010

26 | The Benefits of Natural Gas Production and Exports for U.S. Small Businesses
Impact on Jobs
Table 20 compares employment growth (again, all employ-ment and business data from Census Bureau “County Busi-ness Patterns” unless otherwise noted) among employerestablishments in the overall state, and in various energyindustry sectors. The difference in the employment storybetween Oklahoma, including its energy sector, and theoverall U.S. economy is striking.
While overall employment increased between 2005 and2010 in Oklahoma, jobs grew robustly in the energy sectorgiven the expansion in energy production.
While U.S. total employment declined, Oklahoma employ-ment grew overall, including in the energy sector, expand-ing by the following:
VII. Oklahoma
Natural gas production in Oklahoma, as highlighted in Table 19, expanded by 15.2 percent from 2005 to 2011.
Table 19: Oklahoma Natural Gas Marketed Production
2005: 1,639.3 billion cubic feet
2011: 1,888.9 billion cubic feet
PercentSector 2005 2010 ChangeTotal 1,220,285 1,241,168 1.7%
Oil/Gas Extraction 9,878 14,685 48.7%Drilling Oil and Gas Wells 6,460 7,317 13.3%Support for Oil and Gas Operations 12,705 16,520 30.0%Oil and Gas Pipeline and
Related Structures Construction 2,956 3,825 29.4%Oil and Gas Field Machinery
and Equipment Manufacturing 3,746 3,744 -0.05%
Table 20: Oklahoma Employment Growth Among Employer Establishments, 2005-2010
• 48.7 percent in the oil and gas extraction sector;
• 13.3 percent in the drilling oil and gas wells sector;
• 30 percent in the support sector for oil and gas opera-tions; and
• 29.4 percent in the oil and gas pipeline and related struc-tures construction sector.
Oklahoma employers overall added 20,833 jobs over thisperiod, with employers in the energy industries includedhere adding 10,346, or half the jobs added.

The Benefits of Natural Gas Production and Exports for U.S. Small Businesses | 27
Impact on Small Businesses
At the same time, while the number of businesses (in thiscase, establishments) in the nation declined, in Oklahoma,the number of establishments grew, and they expandedstrongly in the state’s energy sector. It is critical to note therole and growth of smaller businesses as well.
Table 21 makes clear that expanded production in theenergy sector has been a boon for small and midsize enter-prises in the state. Or, to look at it from a different angle,expanded energy production has been driven by small andmidsize businesses.
For all of the U.S., total employer establishments declinedby 1.4 percent from 2005 to 2010, including a 3.5 percentdecline in firms with less than 20 workers, and a 3.1 per-cent fall in firms with less than 500 workers.
In Oklahoma, total establishments increased by 1.7 percent,including a 1.4 percent increase among establishments withless than 20 workers, and a 1.7 percent rise among thosewith less than 500 workers.
Again, compare the U.S. decline to the growth in theseenergy industries in Oklahoma:
• Among oil and gas extraction businesses, the number ofemployer establishments grew by 11.8 percent, includ-ing growth of 10.2 percent among establishments withless than 20 workers and 11.8 percent among establish-ments with less than 500 workers.
• Among oil and gas operations businesses, the numberof employer establishments grew by 37.3 percent, includ-ing growth of 35.7 percent among establishments withless than 20 workers and 37.3 percent among establish-ments with less than 500 workers.
• Among oil and gas pipeline and related structures con-struction businesses, the number of employer establish-ments grew by 14.3 percent, including growth of 9.0percent among those with less than 20 workers and 13.3percent among establishments with less than 500 work-ers.
• Among oil and gas field machinery and equipment man-ufacturing businesses, the number of employer estab-lishments grew by 28.4 percent, including growth of 36.1percent among those with less than 20 workers and 28.8percent among those with less than 500 workers.
The growth in both jobs and small-midsize employer estab-lishments in Oklahoma’s energy sector has been strong inrecent years, again especially given the abysmal perform-ance of the overall U.S. economy.
Finally, it must be noted that the Oklahoma energy sectorin fact is not the domain of huge enterprises. As noted inTable 21, each energy sector looked at is overwhelminglypopulated by small and midsize establishments.
• Among oil and gas extraction businesses, 90.6 percent ofemployer establishments in 2010 had less than 20 workers,and 99.9 percent had fewer than 500 employees.
• Among drilling oil and gas wells businesses, 79.7 percentof employer establishments in 2010 had less than 20 workers,and 98.3 percent had fewer than 500 employees.
• Among oil and gas operations businesses, 86.9 percent ofemployer establishments in 2010 had less than 20 workers,and 99.8 percent had fewer than 500 employees.
• Among oil and gas pipeline and related structures con-struction businesses, 64.3 percent of employer estab-lishments in 2010 had less than 20 workers, and 99.1percent had fewer than 500 employees.
• Among oil and gas field machinery and equipment man-ufacturing businesses, 57 percent of employer establish-ments in 2010 had less than 20 workers, and 98.8 percenthad fewer than 500 employees.

28 | The Benefits of Natural Gas Production and Exports for U.S. Small Businesses
Oklahoma Total EstablishmentsNumber of Employees As Percent of Total Firms
Total Less 20 Less 500 Less 20 Less 5002005 88,548 76,986 88,369 86.9% 99.8%2010 90,050 78,044 89,885 86.7% 99.8%
OK 05-10 1.7% 1.4% 1.7%US 05-10 -1.4% -3.5% -3.1%
Oil/Gas Extraction Employer EstablishmentsNumber of Employees As Percent of Total Firms
Total Less 20 Less 500 Less 20 Less 5002005 1,076 989 1,075 91.9% 99.9%2010 1,203 1,090 1,202 90.6% 99.9%
Chg 05-10 11.8% 10.2% 11.8%
Drilling Oil and Gas Wells EstablishmentsNumber of Employees As Percent of Total Firms
Total Less 20 Less 500 Less 20 Less 5002005 235 195 233 83.0% 99.1%2010 237 189 233 79.7% 98.3%
Chg 05-10 0.9% -3.0% 0%
Support for Oil and Gas Operations EstablishmentsNumber of Employees As Percent of Total Firms
Total Less 20 Less 500 Less 20 Less 5002005 914 804 912 88.0% 99.8%2010 1,255 1,091 1,252 86.9% 99.8%
Chg 05-10 37.3% 35.7% 37.3%
Oil and Gas Pipeline and Related Structures Construction EstablishmentsNumber of Employees As Percent of Total Firms
Total Less 20 Less 500 Less 20 Less 5002005 98 66 98 67.3% 100%2010 112 72 111 64.3% 99.1%
Chg 05-10 14.3% 9.0% 13.3%
Oil and Gas Field Machinery and Equipment Manufacturing EstablishmentsNumber of Employees As Percent of Total Firms
Total Less 20 Less 500 Less 20 Less 5002005 67 36 66 53.7% 98.5%2010 86 49 85 57.0% 98.8%
Chg 05-10 28.4% 36.1% 28.8%
Table 21: Establishments – Oklahoma Total and Energy Industries, 2005-2010

The Benefits of Natural Gas Production and Exports for U.S. Small Businesses | 29
Impact on Jobs
Table 23 compares employment growth (again, all employ-ment and business data from Census Bureau “County Busi-ness Patterns” unless otherwise noted) among employerestablishments in the overall state, and in various energy indus-try sectors. The difference in the employment story betweenthe energy sector and the overall economy is striking.
While overall employment fell between 2005 and 2010,jobs grew markedly in the energy sector given the expan-sion in energy production.
While both U.S. and Pennsylvania total employmentdeclined from 2005 to 2010, Pennsylvania jobs grew by thefollowing:
• 80.8 percent in the oil and gas extraction sector;
• 218.7 percent in the drilling oil and gas wells sector;
• 120.7 percent in the support sector for oil and gas oper-ations; and
• 150.3 percent in the oil and gas pipeline and relatedstructures construction sector.
While Pennsylvania employers overall shed 106,437 jobsover this period, employers in the four energy industries(where data was available) included here added more than5,823 jobs.
VIII. Pennsylvania
The increase in natural gas production has been dramatic in Pennsylvania via the Marcellus Shale area.The state’s natural gas production, as highlighted in Table 22, expanded by 677.8 percent from 2005 to 2011.
Table 22: Pennsylvania Natural Gas Marketed Production
2005: 168.5 billion cubic feet
2011: 1,310.6 billion cubic feet
PercentSector 2005 2010 ChangeTotal 5,082,630 4,976,193 -2.1%
Oil/Gas Extraction 1,809 3,270 80.8%Drilling Oil and Gas Wells 846 2,696 218.7%Support for Oil and Gas Operations 1,640 3,620 120.7%Oil and Gas Pipeline and
Related Structures Construction 1,025 2,566 150.3%Oil and Gas Field Machinery
and Equipment Manufacturing 347 301 -13.3%
Table 23: Pennsylvania Employment Growth Among Employer Establishments, 2005-2010

30 | The Benefits of Natural Gas Production and Exports for U.S. Small Businesses
Impact on Small Businesses
At the same time, while the number of businesses (in thiscase, establishments) declined in the nation and in Penn-sylvania, the number of establishments grew stronglyamong Pennsylvania’s energy sector. And it is critical tonote the role and growth of smaller businesses.
Table 24 makes clear that expanded production in theenergy sector has been a boon for small and midsize enter-prises in the state. Or, to look at it from a different angle,expanded energy production has been driven by small andmidsize businesses.
For all of the U.S., total employer establishments declinedby 1.4 percent from 2005 to 2010, including a 3.5 percentdecline in firms with less than 20 workers, and a 3.1 per-cent fall in firms with less than 500 workers.
In Pennsylvania, total establishments declined by 2.1 per-cent, including a 2.2 percent fall among establishments withless than 20 workers, and a 2.1 percent decline amongthose with less than 500 workers.
Compare those declines to the growth in these energyindustries in Pennsylvania:
• Among oil and gas extraction businesses, the number ofemployer establishments grew by 40.7 percent, includ-ing growth of 36.3 percent among establishments withless than 20 workers and 40.7 percent among establish-ments with less than 500 workers.
• Among drilling oil and gas wells businesses, the numberof employer establishments grew by 104.2 percent,including growth of 121.6 percent among establishmentswith less than 20 workers and 102.1 percent amongestablishments with less than 500 workers.
• Among supporting oil and gas operations businesses, thenumber of employer establishments grew by 119.5 per-cent, including growth of 111.7 percent among thosewith less than 20 workers and 119.5 percent amongestablishments with less than 500 workers.
• Among oil and gas pipeline and related structures con-struction businesses, the number of employer establish-ments grew by 14.8 percent, including growth of 13percent among establishments with less than 500 workers.
The growth in both jobs and small-midsize employer estab-lishments in the energy sector has been striking in recentyears, especially given the abysmal performance of theoverall economy.
Finally, it must be noted that the Pennsylvania energy sec-tor is not all about huge enterprises. As noted in Table 24,each energy sector looked at is overwhelmingly populatedby small and midsize establishments.
• Among oil and gas extraction businesses, 80.1 percent ofemployer establishments in 2010 had less than 20 workers,and 100 percent had fewer than 500 employees.
• Among drilling oil and gas wells businesses, 83.7 percentof employer establishments in 2010 had less than 20workers, and 99 percent had fewer than 500 employees.
• Among oil and gas operations businesses, 75.1 percentof employer establishments in 2010 had less than 20workers, and 100 percent had fewer than 500 employees.
• Among oil and gas pipeline and related structures con-struction businesses, 74.2 percent of employer estab-lishments in 2010 had less than 20 workers, and 98.4percent had fewer than 500 employees.
• Among oil and gas field machinery and equipment man-ufacturing establishments, 50 percent of employer estab-lishments in 2010 had less than 20 workers, and 100percent had fewer than 500 employees.

The Benefits of Natural Gas Production and Exports for U.S. Small Businesses | 31
Pennsylvania Total EstablishmentsNumber of Employees As Percent of Total Firms
Total Less 20 Less 500 Less 20 Less 5002005 303,333 258,823 302,449 85.3% 99.7%2010 297,023 253,251 296,208 85.3% 99.7%
PA 05-10 -2.1% -2.2% -2.1%US 05-10 -1.4% -3.5% -3.1%
Oil/Gas Extraction Employer EstablishmentsNumber of Employees As Percent of Total Firms
Total Less 20 Less 500 Less 20 Less 5002005 150 124 150 82.7% 100%2010 211 169 211 80.1% 100%
Chg 05-10 40.7% 36.3% 40.7%
Drilling Oil and Gas Wells EstablishmentsNumber of Employees As Percent of Total Firms
Total Less 20 Less 500 Less 20 Less 5002005 48 37 48 77.1% 100%2010 98 82 97 83.7% 99.0%
Chg 05-10 104.2% 121.6% 102.1%
Support for Oil and Gas Operations EstablishmentsNumber of Employees As Percent of Total Firms
Total Less 20 Less 500 Less 20 Less 5002005 77 60 77 77.9% 100%2010 169 127 169 75.1% 100%
Chg 05-10 119.5% 111.7% 119.5%
Oil and Gas Pipeline and Related Structures Construction EstablishmentsNumber of Employees As Percent of Total Firms
Total Less 20 Less 500 Less 20 Less 5002005 54 46 54 85.2% 100%2010 62 46 61 74.2% 98.4%
Chg 05-10 14.8% 0% 13.0%
Oil and Gas Field Machinery and Equipment Manufacturing EstablishmentsNumber of Employees As Percent of Total Firms
Total Less 20 Less 500 Less 20 Less 5002005 11 5 11 45.5% 100%2010 10 5 10 50.0% 100%
Chg 05-10 -9.1% 0% -9.1%
Table 24: Establishments – Pennsylvania Total and Energy Industries, 2005-2010

32 | The Benefits of Natural Gas Production and Exports for U.S. Small Businesses
Impact on Jobs
Table 26 compares employment growth (all employmentand business data from Census Bureau “County BusinessPatterns” unless otherwise noted) among employer estab-lishments in the overall state, and in various energy indus-try sectors.
The difference in the employment story in Texas versus theU.S. at large is breathtaking, including the growth in theTexas energy sector.
While Texas total employment increased by 5.8% percentfrom 2005 to 2010, jobs grew by the following:
• 25.7 percent in the oil and gas extraction sector;
• 3.8 percent in the drilling oil and gas wells sector;
• 47.9 percent in the support sector for oil and gas opera-tions;
• 42.3 percent in the oil and gas pipeline and related struc-tures construction sector; and
• 28.8 percent in the oil and gas field machinery and equip-ment manufacturing sector.
Texas employers overall added 480,136 jobs over thisperiod, including employers in the energy industriesincluded here adding 53,692 jobs.
IX. Texas
The increase in natural gas production has been considerable in Texas. The state’s natural gas production,as highlighted in Table 25, expanded by 34.8 percent from 2005 to 2011.
Table 25: Texas Natural Gas Marketed Production
2005: 5,276.4 billion cubic feet
2011: 7,112.9 billion cubic feet
PercentSector 2005 2010 ChangeTotal 8,305,102 8,785,238 5.8%
Oil/Gas Extraction 34,124 42,889 25.7%Drilling Oil and Gas Wells 31,310 32,485 3.8%Support for Oil and Gas Operations 53,064 78,505 47.9%Oil and Gas Pipeline and
Related Structures Construction 29,299 41,699 42.3%Oil and Gas Field Machinery
and Equipment Manufacturing 20,544 26,455 28.8%
Table 26: Texas Employment Growth Among Employer Establishments, 2005-2010

The Benefits of Natural Gas Production and Exports for U.S. Small Businesses | 33
Impact on Small Businesses
At the same time, while the number of businesses (in thiscase, establishments) declined in the nation, the number ofestablishments grew strongly in Texas, including in theenergy sector. And it is critical to note the role and growthof smaller businesses.
Table 27 makes clear that expanded production in theenergy sector has been a boon for small and midsize enter-prises in the state. Or, to look at it from a different angle,expanded energy production has been driven by small andmidsize businesses.
For all of the U.S., total employer establishments declinedby 1.4 percent from 2005 to 2010, including a 3.5 percentdecline in firms with less than 20 workers, and a 3.1 per-cent fall in firms with less than 500 workers.
In Texas, total establishments increased by 4.9 percent,including a 4.7 percent increase among establishments withless than 20 workers, and a 4.9 percent increase amongthose with less than 500 workers. The growth in energyindustries in Texas were:
• Among oil and gas extraction businesses, the number ofemployer establishments grew by 9 percent, includinggrowth of 6.7 percent among establishments with lessthan 20 workers and 9.1 percent among establishmentswith less than 500 workers.
• Among drilling oil and gas wells businesses, the numberof employer establishments grew by 19.1 percent, includ-ing growth of 12 percent among establishments with lessthan 20 workers and 20.7 percent among establishmentswith less than 500 workers.
• Among supporting oil and gas operations businesses, thenumber of employer establishments grew by 34.2 per-cent, including growth of 29.4 percent among establish-ments with less than 20 workers and 34.4 percent amongestablishments with less than 500 workers.
• Among oil and gas pipeline and related structures con-struction businesses, the number of employer establish-ments grew by 37.8 percent, including growth of 36percent among establishments with less than 20 workersand 38.2 percent among establishments with less than500 workers.
• Among oil and gas field machinery and equipment man-ufacturing businesses, the number of employer estab-
lishments grew by 11.4 percent, including growth of 14.8percent among establishments with less than 20 workersand 11.4 percent among those with less than 500.
The growth in both jobs and small-midsize employer estab-lishments in the energy sector has been striking in recentyears, especially given the abysmal performance of theoverall economy.
Finally, it must be noted that the Texas energy sector in factis not all about so-called “Big Oil.” As noted in Table 27,each energy sector looked at is overwhelmingly populatedby small and midsize establishments.
• Among oil and gas extraction businesses, 88.7 percent ofemployer establishments in 2010 had less than 20 workers,and 99.9 percent had fewer than 500 employees.
• Among drilling oil and gas wells businesses, 72 percent ofemployer establishments in 2010 had less than 20 workers,and 98.6 percent had fewer than 500 employees.
• Among oil and gas operations businesses, 78.3 percent ofemployer establishments in 2010 had less than 20 workers,and 99.6 percent had fewer than 500 employees.
• Among oil and gas pipeline and related structures con-struction businesses, 53.3 percent of employer estab-lishments in 2010 had less than 20 workers, and 97percent had fewer than 500 employees.
• Among oil and gas field machinery and equipment man-ufacturing establishments, 54.4 percent of employerestablishments in 2010 had less than 20 workers, and96.8 percent had fewer than 500 employees.

34 | The Benefits of Natural Gas Production and Exports for U.S. Small Businesses
Texas Total EstablishmentsNumber of Employees As Percent of Total Firms
Total Less 20 Less 500 Less 20 Less 5002005 497,758 423,838 496,364 85.1% 99.7%2010 522,146 443,599 520,718 85.0% 99.7%
TX 05-10 4.9% 4.7% 4.9%US 05-10 -1.4% -3.5% -3.1%
Oil/Gas Extraction Employer EstablishmentsNumber of Employees As Percent of Total Firms
Total Less 20 Less 500 Less 20 Less 5002005 2,958 2,681 2,952 90.6% 99.8%2010 3,225 2,860 3,222 88.7% 99.9%
Chg 05-10 9.0% 6.7% 9.1%
Drilling Oil and Gas Wells EstablishmentsNumber of Employees As Percent of Total Firms
Total Less 20 Less 500 Less 20 Less 5002005 587 449 571 76.5% 97.3%2010 699 503 689 72.0% 98.6%
Chg 05-10 19.1% 12.0% 20.7%
Support for Oil and Gas Operations EstablishmentsNumber of Employees As Percent of Total Firms
Total Less 20 Less 500 Less 20 Less 5002005 2,377 1,930 2,365 81.2% 99.5%2010 3,191 2,497 3,179 78.3% 99.6%
Chg 05-10 34.2% 29.4% 34.4%
Oil and Gas Pipeline and Related Structures Construction EstablishmentsNumber of Employees As Percent of Total Firms
Total Less 20 Less 500 Less 20 Less 5002005 365 197 353 54.0% 96.7%2010 503 268 488 53.3% 97.0%
Chg 05-10 37.8% 36.0% 38.2%
Oil and Gas Field Machinery and Equipment Manufacturing EstablishmentsNumber of Employees As Percent of Total Firms
Total Less 20 Less 500 Less 20 Less 5002005 307 162 297 52.8% 96.7%2010 342 186 331 54.4% 96.8%
Chg 05-10 11.4% 14.8% 11.4%
Table 27: Establishments – Texas Total and Energy Industries, 2005-2010

The Benefits of Natural Gas Production and Exports for U.S. Small Businesses | 35
Impact on Jobs
Table 29 compares employment growth (again, all employ-ment and business data from Census Bureau “County Busi-ness Patterns” unless otherwise noted) among employerestablishments in the overall state, and in various energyindustry sectors.
The difference in the employment story in Utah versus theU.S. at large is striking, including the growth in the Utahenergy sector.
While Utah total employment increased by 4.8% percentfrom 2005 to 2010, jobs grew by the following:
• 22.9 percent in the oil and gas extraction sector;
• 17.4 percent in the drilling oil and gas wells sector; and
• 50.1 percent in the support sector for oil and gas opera-tions.
Utah employers overall added 46,457 jobs over this period,including employers in the energy industries included hereadding 1,038 jobs.
X. Utah
The increase in natural gas production has been sizeable in Utah. The state’s natural gas production, ashighlighted in Table 28, expanded by 51.9 percent from 2005 to 2011.
Table 28: Utah Natural Gas Marketed Production
2005: 301.2 billion cubic feet
2011: 457.5 billion cubic feet
PercentSector 2005 2010 ChangeTotal 974,686 1,021,143 4.8%
Oil/Gas Extraction 1,027 1,262 22.9%Drilling Oil and Gas Wells 610 716 17.4%Support for Oil and Gas Operations 1,582 2,374 50.1%Oil and Gas Pipeline and
Related Structures Construction 547 452 -17.4%Oil and Gas Field Machinery
and Equipment Manufacturing NA NA NA
Table 29: Utah Employment Growth Among Employer Establishments, 2005-2010

36 | The Benefits of Natural Gas Production and Exports for U.S. Small Businesses
Impact on Small Businesses
At the same time, while the number of businesses (in thiscase, establishments) declined in the nation, the number ofestablishments grew strongly in Utah, including in theenergy sector. And it is critical to note the role and growthof smaller businesses.
Table 30 makes clear that expanded production in theenergy sector has been a boon for small and midsize enter-prises in the state. Or, to look at it from a different angle,expanded energy production has been driven by small andmidsize businesses.
For all of the U.S., total employer establishments declinedby 1.4 percent from 2005 to 2010, including a 3.5 percentdecline in firms with less than 20 workers, and a 3.1 per-cent fall in firms with less than 500 workers.
In Utah, though, total establishments increased by 5.0 per-cent, including a 5.3 percent rise among establishmentswith less than 20 workers, and a 5.0 percent increaseamong those with less than 500 workers. The growth inenergy industries in Utah were:
• Among oil and gas extraction businesses, the number ofemployer establishments grew by 3.6 percent, includinggrowth of 10 percent among establishments with lessthan 20 workers and 3.6 percent among establishmentswith less than 500 workers.
• Among drilling oil and gas wells businesses, the numberof employer establishments grew by 56.8 percent, includ-ing growth of 33.3 percent among establishments withless than 20 workers and 56.8 percent among establish-ments with less than 500 workers.
• Among supporting oil and gas operations businesses, thenumber of employer establishments grew by 41.2 per-cent, including growth of 39.9 percent among establish-ments with less than 20 workers and 41.2 percent amongestablishments with less than 500 workers.
• Among oil and gas pipeline and related structures con-struction businesses, the number of employer establish-ments grew by 4.2 percent, including growth of 4.2 percentamong establishments with less than 500 workers.
• Among oil and gas field machinery and equipment manu-facturing businesses, the number of employer establish-ments grew by 33.3 percent, including growth of 33.3percent among establishments with less than 500 workers.
The growth in both jobs and small-midsize employer estab-lishments in the energy sector has been striking in recentyears, especially given the abysmal performance of theoverall economy.
Finally, it must be noted that the Utah energy sector in factis not all about large companies. As noted in Table 30, eachenergy sector looked at is overwhelmingly populated bysmall and midsize establishments.
• Among oil and gas extraction businesses, 75.9 percent ofemployer establishments in 2010 had less than 20 workers,and 100 percent had fewer than 500 employees.
• Among drilling oil and gas wells businesses, 75.9 percentof employer establishments in 2010 had less than 20workers, and 100 percent had fewer than 500 employees.
• Among oil and gas operations businesses, 89.2 percentof employer establishments in 2010 had less than 20workers, and 100 percent had fewer than 500 employees.
• Among oil and gas pipeline and related structures con-struction businesses, 64 percent of employer establish-ments in 2010 had less than 20 workers, and 100 percenthad fewer than 500 employees.
• Among oil and gas field machinery and equipment man-ufacturing establishments, 75 percent of employer estab-lishments in 2010 had less than 20 workers, and 100percent had fewer than 500 employees.

The Benefits of Natural Gas Production and Exports for U.S. Small Businesses | 37
Utah Total EstablishmentsNumber of Employees As Percent of Total Firms
Total Less 20 Less 500 Less 20 Less 5002005 65,549 57,040 65,399 87.0% 99.8%2010 68,820 60,074 68,656 87.3% 99.8%
UT 05-10 5.0% 5.3% 5.0%US 05-10 -1.4% -3.5% -3.1%
Oil/Gas Extraction Employer EstablishmentsNumber of Employees As Percent of Total Firms
Total Less 20 Less 500 Less 20 Less 5002005 56 40 56 71.4% 100%2010 58 44 58 75.9% 100%
Chg 05-10 3.6% 10.0% 3.6%
Drilling Oil and Gas Wells EstablishmentsNumber of Employees As Percent of Total Firms
Total Less 20 Less 500 Less 20 Less 5002005 37 33 37 89.2% 100%2010 58 44 58 75.9% 100%
Chg 05-10 56.8% 33.3% 56.8%
Support for Oil and Gas Operations EstablishmentsNumber of Employees As Percent of Total Firms
Total Less 20 Less 500 Less 20 Less 5002005 170 153 170 90.0% 100%2010 240 214 240 89.2% 100%
Chg 05-10 41.2% 39.9% 41.2%
Oil and Gas Pipeline and Related Structures Construction EstablishmentsNumber of Employees As Percent of Total Firms
Total Less 20 Less 500 Less 20 Less 5002005 24 18 24 75.0% 100%2010 25 16 25 64.0% 100%
Chg 05-10 4.2% -11.1% 4.2%
Oil and Gas Field Machinery and Equipment Manufacturing EstablishmentsNumber of Employees As Percent of Total Firms
Total Less 20 Less 500 Less 20 Less 5002005 3 3 3 100% 100%2010 4 3 4 75% 100%
Chg 05-10 33.3% 0% 33.3%
Table 30: Establishments – Utah Total and Energy Industries, 2005-2010

38 | The Benefits of Natural Gas Production and Exports for U.S. Small Businesses
Impact on Jobs
Table 32 compares employment growth (all employmentand business data from Census Bureau “County BusinessPatterns” unless otherwise noted) among employer estab-lishments in the overall state, and in various energy indus-try sectors. The key point in the employment story in WestVirginia has to do with the energy sector.
While West Virginia total employment decreased by 0.9%percent from 2005 to 2010, jobs grew by the following:
• 44.2 percent in the oil and gas extraction sector;
• 9.4 percent in the drilling oil and gas wells sector; and
• 99 percent in the support sector for oil and gas opera-tions.
West Virginia employers overall shed 5,049 jobs over thisperiod, yet employers in the energy industries includedhere (three for which there are data) added 2,028 jobs.
XI. West Virginia
The increase in natural gas production has been sizeable in West Virginia. The state’s natural gas production,as highlighted in Table 31, expanded by 78.2 percent from 2005 to 2011.
Table 31: West Virginia Natural Gas Marketed Production
2005: 221.1 billion cubic feet
2011: 394.1 billion cubic feet
PercentSector 2005 2010 ChangeTotal 565,499 560,450 -0.9%
Oil/Gas Extraction 1,806 2,605 44.2%Drilling Oil and Gas Wells 929 1,016 9.4%Support for Oil and Gas Operations 1,154 2,296 99.0%Oil and Gas Pipeline and
Related Structures Construction 868 1,000-2,499 NAOil and Gas Field Machinery
and Equipment Manufacturing NA NA NA
Table 32: West Virginia Employment Growth Among Employer Establishments, 2005-2010

The Benefits of Natural Gas Production and Exports for U.S. Small Businesses | 39
Impact on Small Businesses
At the same time, while the number of businesses (in thiscase, establishments) declined in the nation and in WestVirginia overall, the number of establishments grew stronglyin West Virginia’s energy sector. And it is critical to note therole and growth of smaller businesses.
Table 33 makes clear that expanded production in theenergy sector has been a boon for small and midsize enter-prises in the state. Or, to look at it from a different angle,expanded energy production has been driven by small andmidsize businesses.
For all of the U.S., total employer establishments declinedby 1.4 percent from 2005 to 2010, including a 3.5 percentdecline in firms with less than 20 workers, and a 3.1 per-cent fall in firms with less than 500 workers.
In West Virginia, total establishments declined by 5.0 per-cent, including a 5.5 percent fall among establishments withless than 20 workers, and a 5.0 percent decline amongthose with less than 500 workers. However, the growth inenergy industries in West Virginia were:
• Among oil and gas extraction businesses, the number ofemployer establishments grew by 9.6 percent, includinggrowth of 5.3 percent among establishments with lessthan 20 workers and 9.6 percent among establishmentswith less than 500 workers.
• Among drilling oil and gas wells businesses, the numberof employer establishments grew by 12.5 percent, includ-ing growth of 36.6 percent among establishments withless than 20 workers and 12.5 percent among establish-ments with less than 500 workers.
• Among supporting oil and gas operations businesses, thenumber of employer establishments grew by 48.3 per-cent, including growth of 45.2 percent among establish-ments with less than 20 workers and 48.3 percent amongestablishments with less than 500 workers.
• Among oil and gas pipeline and related structures con-struction businesses, the number of employer establish-ments grew by 14.3 percent, including growth of 30.2percent among establishments with less than 20 workers,and 14.3 percent among establishments with less than500 workers.
The growth in both jobs and small-midsize employer estab-lishments in the energy sector has been striking in recentyears, especially given the abysmal performance of theoverall economy.
Finally, it must be noted that the West Virginia energy sec-tor in fact is not all about huge enterprises. As noted inTable 33, each energy sector looked at is overwhelminglypopulated by small and midsize establishments.
• Among oil and gas extraction businesses, 86.9 percent ofemployer establishments in 2010 had less than 20 workers,and 100 percent had fewer than 500 employees.
• Among drilling oil and gas wells businesses, 77.8 percentof employer establishments in 2010 had less than 20workers, and 100 percent had fewer than 500 employees.
• Among oil and gas operations businesses, 82.2 percentof employer establishments in 2010 had less than 20workers, and 100 percent had fewer than 500 employees.
• Among oil and gas pipeline and related structures con-struction businesses, 75 percent of employer establish-ments in 2010 had less than 20 workers, and 100 percenthad fewer than 500 employees.
• Among oil and gas field machinery and equipment man-ufacturing establishments, 50 percent of employer estab-lishments in 2010 had less than 20 workers, and 100percent had fewer than 500 employees.

40 | The Benefits of Natural Gas Production and Exports for U.S. Small Businesses
West Virginia Total EstablishmentsNumber of Employees As Percent of Total Firms
Total Less 20 Less 500 Less 20 Less 5002005 40,735 35,419 40,656 86.9% 99.8%2010 38,676 33,463 38,604 86.5% 99.8%
WV 05-10 -5.0% -5.5% -5.0%US 05-10 -1.4% -3.5% -3.1%
Oil/Gas Extraction Employer EstablishmentsNumber of Employees As Percent of Total Firms
Total Less 20 Less 500 Less 20 Less 5002005 188 170 188 90.4% 100%2010 206 179 206 86.9% 100%
Chg 05-10 9.6% 5.3% 9.6%
Drilling Oil and Gas Wells EstablishmentsNumber of Employees As Percent of Total Firms
Total Less 20 Less 500 Less 20 Less 5002005 40 26 40 65.0% 100%2010 45 35 45 77.8% 100%
Chg 05-10 12.5% 36.6% 12.5%
Support for Oil and Gas Operations EstablishmentsNumber of Employees As Percent of Total Firms
Total Less 20 Less 500 Less 20 Less 5002005 87 73 87 83.9% 100%2010 129 106 129 82.2% 100%
Chg 05-10 48.3% 45.2% 48.3%
Oil and Gas Pipeline and Related Structures Construction EstablishmentsNumber of Employees As Percent of Total Firms
Total Less 20 Less 500 Less 20 Less 5002005 35 23 35 65.7% 100%2010 40 30 40 75.0% 100%
Chg 05-10 14.3% 30.4% 14.3%
Oil and Gas Field Machinery and Equipment Manufacturing EstablishmentsNumber of Employees As Percent of Total Firms
Total Less 20 Less 500 Less 20 Less 5002005 4 2 4 50.0% 100%2010 2 1 2 50.0% 100%
Chg 05-10 -50.0% -50.0% -50.0%
Table 33: Establishments – West Virginia Total and Energy Industries, 2005-2010

The Benefits of Natural Gas Production and Exports for U.S. Small Businesses | 41
Impact on Jobs
Table 35 compares employment growth (again, all employ-ment and business data from Census Bureau “County Busi-ness Patterns” unless otherwise noted) among employerestablishments in the overall state, and in various energyindustry sectors.
Employment growth in Wyoming was positive over theperiod of 2005 to 2010, compared to a decline nationally,with Wyoming’s energy sector showing particularly solidexpansion.
While Wyoming total employment increased by 6.8% percentfrom 2005 to 2010, jobs grew by the following:
• 34.9 percent in the oil and gas extraction sector;
• 35.3 percent in the drilling oil and gas wells sector;
• 2.2 percent in the support sector for oil and gas opera-tions; and
• 234.9 percent in the oil and gas pipeline and relatedstructures construction sector.
Wyoming employers overall added 13,112 jobs over thisperiod, yet employers in the energy industries includedhere (four for which there are data) added 3,751 jobs.
XII. Wyoming
The increase in natural gas production has been notable in Wyoming. The state’s natural gas production, ashighlighted in Table 34, expanded by 31.7 percent from 2005 to 2011.
Table 34: Wyoming Natural Gas Marketed Production
2005: 1,639.3 billion cubic feet
2011: 2,159.4 billion cubic feet
PercentSector 2005 2010 ChangeTotal 191,934 205,046 6.8%
Oil/Gas Extraction 2,663 3,592 34.9%Drilling Oil and Gas Wells 3,041 3,604 35.3%Support for Oil and Gas Operations 7,342 7,506 2.2%Oil and Gas Pipeline and
Related Structures Construction 892 2,987 234.9%Oil and Gas Field Machinery
and Equipment Manufacturing NA 364 NA
Table 35: Wyoming Employment Growth Among Employer Establishments, 2005-2010

42 | The Benefits of Natural Gas Production and Exports for U.S. Small Businesses
Impact on Small Businesses
At the same time, while the number of businesses (in thiscase, establishments) declined in the nation, the number ofestablishments grew in Wyoming, including in the energysector. And it is critical to note the role and growth ofsmaller businesses.
Table 36 makes clear that expanded production in theenergy sector has been a boon for small and midsize enter-prises in the state. Or, to look at it from a different angle,expanded energy production has been driven by small andmidsize businesses.
For all of the U.S., total employer establishments declinedby 1.4 percent from 2005 to 2010, including a 3.5 percentdecline in firms with less than 20 workers, and a 3.1 per-cent fall in firms with less than 500 workers.
In Wyoming, total establishments increased by 2.5 percent,including a 2.6 percent rose among establishments with lessthan 20 workers, and a 2.5 percent increased among thosewith less than 500 workers.
The growth in energy industries in Wyoming was:
• Among drilling oil and gas wells businesses, the numberof employer establishments grew by 20.6 percent, includ-ing growth of 19.6 percent among establishments withless than 20 workers and 20.6 percent among establish-ments with less than 500 workers.
• Among supporting oil and gas operations businesses, thenumber of employer establishments grew by 13.6 per-cent, including growth of 13.3 percent among establish-ments with less than 20 workers and 13.9 percent amongestablishments with less than 500 workers.
• Among oil and gas pipeline and related structures con-struction businesses, the number of employer establish-ments grew by 40.7 percent, including growth of 51.3percent among establishments with less than 20 workers,and 38.9 percent among establishments with less than500 workers.
The growth in both jobs and small-midsize employer estab-lishments in the energy sector has been striking in recentyears, especially given the abysmal performance of theoverall economy.
Finally, it must be noted that the Wyoming energy sector infact is not all about big businesses. As noted in Table 36,each energy sector looked at is overwhelmingly populatedby small and midsize firms.
• Among oil and gas extraction businesses, 75.6 percent ofemployer establishments in 2010 had less than 20 workers,and 100 percent had fewer than 500 employees.
• Among drilling oil and gas wells businesses, 75.8 percentof employer establishments in 2010 had less than 20workers, and 100 percent had fewer than 500 employees.
• Among oil and gas operations businesses, 83.5 percent ofemployer establishments in 2010 had less than 20 workers,and 99.6 percent had fewer than 500 employees.
• Among oil and gas pipeline and related structures con-struction businesses, 73.7 percent of employer estab-lishments in 2010 had less than 20 workers, and 98.7percent had fewer than 500 employees.
• Among oil and gas field machinery and equipment man-ufacturing establishments, 45.5 percent of employerestablishments in 2010 had less than 20 workers, and 100percent had fewer than 500 employees.

The Benefits of Natural Gas Production and Exports for U.S. Small Businesses | 43
Wyoming Virginia Total EstablishmentsNumber of Employees As Percent of Total Firms
Total Less 20 Less 500 Less 20 Less 5002005 19,736 17,804 19,715 90.2% 99.9%2010 20,231 18,270 20,213 90.3% 99.9%
WY 05-10 2.5% 2.6% 2.5%US 05-10 -1.4% -3.5% -3.1%
Oil/Gas Extraction Employer EstablishmentsNumber of Employees As Percent of Total Firms
Total Less 20 Less 500 Less 20 Less 5002005 205 159 205 77.6% 100%2010 180 136 180 75.6% 100%
Chg 05-10 -12.2% -14.5% -12.2%
Drilling Oil and Gas Wells EstablishmentsNumber of Employees As Percent of Total Firms
Total Less 20 Less 500 Less 20 Less 5002005 98 81 98 82.7% 100%2010 128 97 128 75.8% 100%
Chg 05-10 20.6% 19.6% 20.6%
Support for Oil and Gas Operations EstablishmentsNumber of Employees As Percent of Total Firms
Total Less 20 Less 500 Less 20 Less 5002005 412 345 409 83.7% 99.3%2010 468 391 466 83.5% 99.6%
Chg 05-10 13.6% 13.3% 13.9%
Oil and Gas Pipeline and Related Structures Construction EstablishmentsNumber of Employees As Percent of Total Firms
Total Less 20 Less 500 Less 20 Less 5002005 54 37 54 68.5% 100%2010 76 56 75 73.7% 98.7%
Chg 05-10 40.7% 51.3% 38.9%
Oil and Gas Field Machinery and Equipment Manufacturing EstablishmentsNumber of Employees As Percent of Total Firms
Total Less 20 Less 500 Less 20 Less 5002005 11 8 11 72.7 100%2010 11 5 11 45.5% 100%
Chg 05-10 0% -37.5% 0%
Table 36: Establishments – Wyoming Total and Energy Industries, 2005-2010

in the international marketplace, these firms effectively arearguing that exports are fine for us, but not for others, inparticular, the firms that produce our inputs. Consider theincreases in U.S. chemical exports (in millions of dollars)from 2000 to 2011 in Table 37.
Based on their own arguments, might it follow then thatthese chemical firms should have their own exports limited,so as to keep their own products’ prices in check for U.S.consumers of such chemicals? Of course not.
As noted in the Peterson Institute for International Econom-ics analysis: “Fears of a significant increase in average domes-tic natural gas prices over a 20-year horizon are no morejustified as a reason for limiting US exports of LNG than theywould be as a reason for limiting exports of soybeans, corn,coal, or other natural resources. Historically, domestic pricestabilization has not been an objective of US export policy.Rather, the overarching philosophy of a market economy isthat prices for individual commodities should be allowed tofluctuate and thereby guide rational production and con-sumption decisions, both at home and abroad.”14
44 | The Benefits of Natural Gas Production and Exports for U.S. Small Businesses
XIII. LNG Exports: Expand or Limit Opportunities?
As is clear from the trends noted throughout this analysis, advancements in technology have opened up vastresources of natural gas (as well as oil) in shale rock that were previously not accessible. As a result, naturalgas prices have plummeted in the U.S. However, prices remain high in other parts of the world, and therefore,the potential exists for economic benefits to be derived from exporting LNG.
That is, the trends in terms of expanded investment, entre-preneurship, economic growth and employment that havebeen highlighted given the expansion of domestic energyproduction – with our emphasis primarily on natural gas viahydraulic fracturing and horizontal drilling – can beexpanded further through global markets for LNG.
Of course, this is how markets work. Prices send signals toproducers to expand investment and production.Expanded foreign demand can boost the incomes of U.S.energy entrepreneurs, businesses and workers, with addedbenefits rippling out through the larger economy. Naturally,businesses must consider costs relative to the potential rev-enues, and assess the state of current and future competi-tors to get a full picture of the opportunity. The opportunityand evaluation process that businesses undertake wasnoted in a recent analysis of the LNG export issue pub-lished by the Peterson Institute for International Economics:
“US natural gas producers are eager to take advan-tage of tremendous price differentials between theUnited States and foreign markets. US prices arearound $3 per million metric British thermal units(mmBtu), while prices in Europe are $11 to $13 permmBtu and as high as $18 per mmBtu in SoutheastAsia. Even considering the cost of liquefaction andocean transportation at $3.50 to $9.00 per mmBtu,producers can export LNG and earn a significantprofit over domestic sales.”13
Unfortunately, though, there is a movement afoot to actu-ally have government limit LNG exports. Various chemicalfirms are seeking such limits. As the Houston Chroniclereported on January 10, 2013: “Some of the nation’s largestchemical makers and manufacturers on Thursday united asa new coalition to lobby against a wholesale rush to exportAmerica’s new natural gas bounty, which they say threat-ens some $80 billion in planned investments in new U.S.plants and assembly lines.” They are concerned abouthigher natural gas prices due to increased exports.
Given the benefits that the chemicals industry has reaped
Therefore, expanded demand for
U.S. natural gas in international
markets will result in greater
U.S. natural gas production,
increased investment, enhanced
GDP growth, rising incomes,
and more jobs – just as is the
case with increasing exports in
chemical industries.

The Benefits of Natural Gas Production and Exports for U.S. Small Businesses | 45
Economics 101 reminds us that the economy is not a zero-sum game. Therefore, expanded demand for U.S. naturalgas in international markets will result in greater U.S. natu-ral gas production, increased investment, enhanced GDPgrowth, rising incomes, and more jobs – just as is the casewith increasing exports in chemical industries.
If one understands that international trade is mutually ben-eficial (otherwise, why would the parties participate in thetransaction?), and that trade expands opportunity,enhances incentives for investment and expanded produc-tion, boosts competition, and increases income andemployment, then the idea that government should placebarriers on either exports or imports is glaringly absurd.Again, Economics 101 offers the lesson of comparativeadvantage, taught by the 19th-century economist DavidRicardo, showing how trade is an economic positive as busi-nesses, entrepreneurs and workers focus on the endeavorsat which they rank as most efficient, and then trade withothers for other goods and services. That’s how the domes-tic and global economies work.
Unsurprisingly, study after study shows how these basiceconomic principles apply to energy markets. Consider thefollowing examples.
• In “Macroeconomic Impacts of LNG Exports from theUnited States,” researched and written by NERA Eco-nomic Consulting for the Energy Information Adminis-tration (December 2012), it was found: “Across all thesescenarios, the U.S. was projected to gain net economicbenefits from allowing LNG exports. Moreover, for everyone of the market scenarios examined, net economicbenefits increased as the level of LNG exports increased.In particular, scenarios with unlimited exports always hadhigher net economic benefits than corresponding cases
Category 2000 Exports 2011 Exports Percent ChangeChemicals – Cosmetics 5,292 13,244 150%Chemicals – Dyeing 4,089 8,542 109%Chemicals – Fertilizers 2,249 5,133 128%Chemicals – Inorganic 5,359 13,345 149%Chemicals – Medicinal 12,893 40,011 210%Chemicals – n.e.s 12,264 27,127 121%Chemicals – Organic 17,990 43,571 142%Chemicals – Plastics 19,519 46,195 137%
Table 37: Chemical Industry: Export Growth, 2000-2011
with limited exports. In all of these cases, benefits thatcome from export expansion more than outweigh thelosses from reduced capital and wage income to U.S.consumers, and hence LNG exports have net economicbenefits in spite of higher domestic natural gas prices.This is exactly the outcome that economic theorydescribes when barriers to trade are removed. Net ben-efits to the U.S. would be highest if the U.S. becomesable to produce large quantities of gas from shale at lowcost, if world demand for natural gas increases rapidly,and if LNG supplies from other regions are limited.”
• In “Made in America: The economic impact of LNGexports from the United States,” from Deloitte Centerfor Energy Solutions and Deloitte MarketPoint LLC(2011), it was reported: “Given the model’s assumptions,the WGM projects a weighted-average price impact of$0.12 per million British thermal units (MMBtu) on U.S.prices from 2016 to 2035 as a result of the 6 Bcfd of LNGexports. The $0.12/MMBtu increase represents a 1.7%increase in the projected average U.S. citygate gas priceof $7.09/MMBtu over this time period.”
Given this small projected price rise, a follow-up capturedthe nature of how the market works: “The results show thatthe North American gas market is dynamic. If exports canbe anticipated, and clearly they can with the public appli-cation process and long lead time required to construct aLNG liquefaction plant, then producers, midstream players,and consumers can act to mitigate the price impact. Pro-ducers will bring more supplies online, flows will beadjusted, and consumers will react to price change result-ing from LNG exports.”
• That point about the dynamism of the market wasemphasized in a study titled “Liquid Markets: Assessing

ment. In reality, the American economy has not been oper-ating at full employment for four years and this condition isexpected to last at least through 2015. For this reason, thepotential employment benefits from larger natural gas pro-duction may be understated in the NERA report. By thesame token, if lower gas prices spurred new investment inchemical or power plants, that too would reduce the unem-ployment rolls.”
In the end, the expectation that nearly two-thirds of LNGexports would be met via new production – and within thecontext of recent and expected growth in natural gas pro-duction – speaks to further strong growth for small andmidsize businesses, and for employment. At the same time,the minimal price impact that expanded exports might haveon domestic prices would have small effects on domesticconsumers of natural gas – especially given the enormousdeclines we’ve already experienced in natural gas prices.And even those small, potential price increases must be fur-ther offset against the effect of the overall positive for eco-nomic growth coming via generally lower natural gas pricesand expanded natural gas production.
Recall the tremendous growth in energy sector employmentdue to expanded domestic natural gas and oil production,as cited earlier in this report, versus the decline in overallU.S. jobs. Also, consider that growth state by state in energysectors, again versus the dismal overall job market.
Recall the growth in the number of small and midsize busi-nesses experienced nationally and in key states due toexpanded energy production, and compare those to theoverall decline in the U.S. economy. And again, keep inmind that these energy sectors are overwhelmingly popu-lated by those small and midsize firms.
Given these economic realities, allowing for LNG exportsto be guided by market forces – as opposed to politicalpreferences and lobbying – means expanding the poten-tial opportunity for small and midsize businesses to be cre-ated, to grow, and to create jobs. Any politically drivenefforts to limit exports, therefore, would limit the creation,growth and job-creating abilities of those small and mid-size businesses that populate the energy industry.
46 | The Benefits of Natural Gas Production and Exports for U.S. Small Businesses
the Case for U.S. Exports of Liquefied Natural Gas,” writ-ten by Charles Ebinger, Kevin Massy, and GovindaAvasarala, for the Brookings Institution in May 2012. Theauthors observed: “Shale gas technologies and produc-tion processes have been developing rapidly in recentyears, improving the economics of extraction. Compa-nies now are drilling longer laterals and are increasingthe number of frack stages—the number of differentfracking sections in each lateral section—per well, lead-ing to an increase in available reserves and well produc-tivity. An analysis of well-specific-data illustrates that bothinitial production rates and ultimate well recovery havebeen growing across all production regions (or ‘plays’),thereby driving down per unit costs of production.”
Ebinger, Massy and Avasarala summed up a critical pointwhen it comes to how increased demand via new exportsmarkets would be met: “In their analyses, both Deloitte andEIA found that the majority—63 percent, according to bothstudies—of the exported natural gas will come from newproduction as opposed to displaced consumption fromother sectors.”
For good measure, the study from the Peterson Institutemade an important counterpoint to one pessimistic pointput forth by the NERA study.
It was stated in the NERA study, “LNG exports are not likelyto affect the overall level of employment in the U.S. Therewill be some shifts in the number of workers across indus-tries, with those industries associated with natural gas pro-duction and exports attracting workers away from otherindustries. In no scenario is the shift in employment out ofany industry projected to be larger than normal rates ofturnover of employees in those industries.” However, it iscountered in the Peterson Institute study: “The NERAmodel assumes that the economy operates at full employ-
Any politically driven efforts to
limit exports, therefore, would
limit the creation, growth and
job-creating abilities of those
small and midsize businesses that
populate the energy industry.

The Benefits of Natural Gas Production and Exports for U.S. Small Businesses | 47
About the Author
Raymond J. Keating is the chief economist for the Small Business & Entrepreneurship Council. Keating also servesas an adjunct professor at the Townsend School of Business at Dowling College in New York where he teaches graduate courses on innovation and entrepreneurship, international business, and public sector economics.
In addition, Keating writes a weekly column for Dolan Media Company publications, including Long Island BusinessNews. Keating’s analysis and commentary pieces also have appeared in such publications as The New York Times,The Wall Street Journal, The Washington Post, The Washington Times, Boston Globe, Newsday, Los Angeles DailyNews, and many others.
Keating has testified before congressional and state legislative bodies, and has spoken to groups across the nationon a wide range of economic, policy and small business topics. The media taps him regularly for his views, includingprint, radio and television (for example, NBC, CNBC, Fox News, Fox Business Network, CNN, PBS, etc.) interviews.

48 | The Benefits of Natural Gas Production and Exports for U.S. Small Businesses
Endnotes
1 Liquefied natural gas, as explained here for example from ShellGlobal’s website (http://www.shell.com/global/future-energy/meet-ing-demand/natural-gas/liquefied-natural-gas/what-is-lng.html), is:“Transporting gas by pipeline can be costly and impractical. We cre-ate LNG by cooling the gas to a liquid to -160ºC, which we can thenship out, safely and efficiently.
LNG is a clear, colourless, non-toxic liquid that can be transportedand stored more easily than natural gas because it occupies up to600 times less space. When LNG reaches its destination, it is re-turned to a gas at regasification facilities. It is then piped to homes,businesses and industries.”
2 International Energy Administration, “North America leads shift inglobal energy balance, IEA says in latest World Energy Outlook,”November 12, 2012, accessed at http://www.iea.org/newsrooman-devents/pressreleases/2012/november/name,33015,en.html.
3 Energy Information Administration, “What is shale gas and why is itimportant?” Energy in Brief, December 5, 2012, accessed athttp://www.eia.gov/energy_in_brief/article/about_shale_gas.cfm.
4 Energy Information Administration, “What is shale gas and why is itimportant?” Energy in Brief, December 5, 2012, accessed athttp://www.eia.gov/energy_in_brief/article/about_shale_gas.cfm.
5 Census Bureau industry definition: “This industry comprises estab-lishments primarily engaged in operating and/or developing oil andgas field properties and establishments primarily engaged in re-covering liquid hydrocarbons from oil and gas field gases. Such ac-tivities may include exploration for crude petroleum and naturalgas; drilling, completing, and equipping wells; operation of sepa-rators, emulsion breakers, desilting equipment, and field gatheringlines for crude petroleum; and all other activities in the preparationof oil and gas up to the point of shipment from the producing prop-erty. This industry includes the production of crude petroleum, themining and extraction of oil from oil shale and oil sands, the pro-duction of natural gas and the recovery of hydrocarbon liquids fromoil and gas field gases. Establishments in this industry operate oiland gas wells on their own account or for others on a contract or feebasis.”
6 Census Bureau industry definition: “This U.S. industry comprises es-tablishments primarily engaged in drilling oil and gas wells for oth-ers on a contract or fee basis. This industry includes contractors thatspecialize in spudding in, drilling in, redrilling, and directionaldrilling.”
7 Census Bureau industry definition: “This U.S. industry comprises es-tablishments primarily engaged in performing support activities ona contract or fee basis for oil and gas operations (except site prepa-ration and related construction activities). Services included are ex-ploration (except geophysical surveying and mapping); excavatingslush pits and cellars, well surveying; running, cutting, and pullingcasings, tubes, and rods; cementing wells, shooting wells; perfo-rating well casings; acidizing and chemically treating wells; andcleaning out, bailing, and swabbing wells.”
8 Census Bureau industry definition: “This U.S. industry comprises es-tablishments primarily engaged in the construction of oil and gaslines, mains, refineries, and storage tanks. The work performed mayinclude new work, reconstruction, rehabilitation, and repairs.Specialty trade contractors are included in this group if they are en-gaged in activities primarily related to oil and gas pipeline and re-lated structures construction. All structures (including buildings) thatare integral parts of oil and gas networks (e.g., storage tanks, pump-ing stations, and refineries) are included in this industry.”
9 Census Bureau industry definition: “This U.S. industry comprises es-tablishments primarily engaged in (1) manufacturing oil and gasfield machinery and equipment, such as oil and gas field drilling ma-chinery and equipment; oil and gas field production machinery andequipment; and oil and gas field derricks and (2) manufacturingwater well drilling machinery.”
10 IHS, America’s New Energy Future: The Unconventional Oil andGas Revolution and the US Economy: Volume 2: State EconomicContributions, December 2012.
11 IHS, America’s New Energy Future: The Unconventional Oil andGas Revolution and the US Economy: Volume 2: State EconomicContributions, December 2012.
12 Keith Schneider, “Ohio’s Resurgent Natural Gas Industry SpendsMillions to Set Up Shop,” The New York Times, March 12, 2013, ac-cessed at http://www.nytimes.com/2013/03/13/realestate/com-mercial/natural-gas-industry-drives-construction-surge-in-ohio.html?pagewanted=all&_r=0.
13 Gary Clyde Hufbauer, Allie E. Bagnall, and Julia Muir, “LiquefiedNatural Gas Exports: An Opportunity for America,” PetersonInstitute for International Economics, February 2013.
14 Gary Clyde Hufbauer, Allie E. Bagnall, and Julia Muir, “LiquefiedNatural Gas Exports: An Opportunity for America,” PetersonInstitute for International Economics, February 2013.

www.sbecouncil.org
Small Business & Entrepreneurship Council301 Maple Ave. West, Suite 690, Vienna, VA 22180
Phone: 703-242-5840 • Fax: 703-242-5841