report & financial statements
TRANSCRIPT

Company Number: 2402219
Year ended 31 December 2012
Report & Financial Statements
Registered Office: Steel House, Barnsley Road, Wombwell, Barnsley, South Yorkshire, S73 8DSt 01226 340666 f 01226 755947 e [email protected] w www.billington-holdings.plc.uk

Year ended 31 December 2012
Report & Financial Statements
Chairman’s Statement 2
Operational Review
Financial Review
5
8

32
Market sectors related to commercial, industrial
and retail schemes remain extremely competitive
through a significant number of structural steelwork
providers being able to deliver such projects. The
Group continues to target value added work in
energy, rail and other transport projects along with
tubular and complex steelwork schemes where
competition remains less fierce and margins appear
to be higher. The Group continues to further promote
to customers the areas in which it considers it can
differentiate itself from the competition and where
value can be added to a project as opposed to solely
focusing on price.
The results of the Peter Marshall Stairs subsidiary
were disappointing. The decision was taken to
strengthen the management team and in January
2013 a new MD designate was appointed with
significant managerial experience within the structural
steelwork sector. He is in the process of carrying
out a full review of the company’s operations and
processes with the objective of achieving a positive
contribution for 2013.
The easi-edge safety barrier division noted a reduced
level of contribution to that which it had achieved
in previous years due to a reduction in the level of
demand for its barriers. There were changes to the
management team during the year and I am pleased
to report that we are seeing a gradual increase in
demand for barriers such that we are anticipating an
improved contribution from this division for 2013.
The hoard-it division continued to make steady
progress with increasing demand for its products. The
decision was taken to strengthen the management of
this division to work with the existing small team to take
the business forward. A new commercial director joined
the business in January 2013.
IntroductionI am pleased to report that the full year
results for Billington Holdings Plc (‘Billington’
/‘Group’/‘Company’) for 2012 were in line with
market expectations, after adjusting for redundancy
costs.
Market conditions remained extremely challenging
throughout the course of the year and the proactive
restructuring action that the Group commenced
in 2011, which was completed in 2012, resulted
in an appropriate right-sizing of the business to
market conditions, delivered annualised cost
savings of nearly £3 million and led to a final result
that was much improved on the Group’s prior year
performance.
Results
The loss before tax for the year, excluding
redundancy costs, improved by £1.6 million to £0.1
million on revenue of £38.2 million, compared with a
loss of £1.7 million on revenue of £53.9 million in the
previous year. The reduction in revenue was primarily
due to the decision to revert to a single shift working
pattern in our core structural steel business, which
was taken in order to adjust production levels to
market demand.
The overall loss per share for the year amounted to
3.6p, compared with 14.9p in 2011, reflecting the
difficult trading conditions during the year.
Liquidity and capital resourcesThere has been an outflow of cash during the year of
£0.8 million, which can be attributed to a combination
of additional working capital requirements and capital
equipment replacement. The Group maintained a
robust balance sheet, with cash balances of £1.0
million at 31 December 2012, which together with the
bank overdraft facilities available will provide adequate
funds to cover the projected working capital
requirements of the business.
DividendThe Board remains committed to supporting the
shareholders with the payment of a dividend when
it is prudent to do so. Although the results show a
considerable improvement over the previous year the
net result is still a loss and it is in the best interests
of the Group to continue to preserve cash for its
working capital requirements. Therefore the Board
has decided not to declare a final dividend.
Divisional performanceThe review of operations which commenced in 2011
was concluded in the early part of 2012, resulting in
further redundancy and reorganisation costs in 2012
totalling £0.3 million. This review also resulted in the
decision to revert to a single shift working pattern with
effect from the early part of the year.
The Group also introduced a number of operating
efficiencies in order to ensure that the current
capacity on a single shift work pattern is capable
of meeting anticipated demand in current market
conditions. The Group has sought to improve its
operating margins through cost reductions and
operating efficiencies as well as being selective about
work undertaken.
Chairman’s Statement

5
Peter Hems
Non Executive Chairman
18 March 2013
ProspectsThe reorganisation and operational efficiencies
introduced in 2011 and 2012 leave the core structural
steel business well placed to respond to the demands
of its traditional markets, as well as being capable of
responding to new opportunities in different sectors
when opportunities arise. Further resource has been
committed to targeting sectors Billington Structures
has not previously been actively involved in; these
include rail, energy from waste and further emphasis
on complex structural steel projects. Although it is
anticipated that the market will remain challenging
in 2013 the Group as a whole is committed to and
confident of improving its operating margins. The
strengthening of the management teams in all Group
subsidiaries should enable those businesses to
achieve improved results for 2013 and also provide
a platform for greater stability, growth and improved
contributions in future years.
Billington Structures has progressed well in
establishing itself in the rail sector following its
successful Linkup approval in 2011 and has
completed a number of projects in this sector in
the year. Further planned expansion of the UK rail
infrastructure combined with the Company’s ability to
tackle complex and challenging contracts will place
it in a strong position as this work is completed over
the coming years.
It is difficult to forecast when there will be a sustained
recovery in the structural steelwork market, there
have been a number of false dawns to date and
the only way to move forward is to assume that the
current market conditions are the new norm in the
short term. We anticipate that there will be some
marginal improvement in trading conditions during
2013 and to that end we are looking to enhance and
improve our sales and marketing activities to ensure
that we are well placed to seek out opportunities
and take advantage of any increased demand for the
Group’s services as and when that demand arises.
The Group commenced the year with an improved
order book over that of the previous year with a
portfolio of work across a number of markets.
Management and workforceI should like to express my thanks to all the directors
and employees for their efforts and assistance over
the last twelve months which has continued to be a
particularly challenging time.
I am also pleased to welcome Dr Alexander Ospelt to
the Board as a non executive director with effect from
1 January 2013. Dr Ospelt is a lawyer by profession
and sits on a number of Boards, has a wide range of
commercial experience and will also strengthen the
relationship between the Board and the Company’s
major shareholders.
Chairman’s Statement
4
Operational Review
2012 remained difficult for the sector with the UK
structural steelwork industry continuing to flat line
at circa 800,000 tonnes per annum, almost half of
the peak of five years ago.
The year has seen further small reductions in
capacity as competitors fail and consolidate, a trend
that we foresee continuing in 2013 as the industry
continues to rebalance the supply/demand equation.
Confidence in the sector has been adversely affected
by a series of negative trading statements from
the market leader, which is the only other London
listed competitor. Against this trading backdrop,
our planned reductions in production and manning
levels, coupled with a complete review of our
business processes, has enabled the Group to make
significant progress towards its mission of ‘Stability
and a return to profitability‘.
Health, Safety, Sustainability, Quality and the EnvironmentHealth, safety, sustainability, quality and environmental remains the cornerstone of our businesses. The Group actively seeks continual improvement across all these areas and, as such, has recently appointed a new Group SHEQ manager who has significant industry experience and a proven track record of delivering improved results.
Many new initiatives to improve our performance commenced in 2012 including site based training and stand down days for our sub-contractors.
Billington Structures LimitedOver 15,000 tonnes of structural steel was efficiently fabricated on a single shift basis from our factories in Barnsley and Bristol during 2012.
Key projects included:• The completion of St George’s Park, the new
training centre near Burton on Trent for the Football Association.
• The new stand for Saracens RFC.• Educational facilities in Sheffield, Rochdale, Kings
Lynn, Blackpool and Stoke.• A major facility for West Yorkshire Police.• Bicester town centre retail development.
Billington Structures starts 2013 with a strong portfolio of work including footbridges and a new station in the rail sector, a major plant in Plymouth in the waste to energy sector and in the sport sector the first Olympic legacy project at Derby Arena. We were pleased to be awarded a Structural Steel Design award for our work at the Royal Shakespeare Theatre. The Company continues to target and address sectors where we believe the margins remain stronger. Sales and marketing has been strengthened with a focus on these sectors which to date have yielded good results and it is anticipated this will continue.
Our JV with the Bourne Group, BS2, remains robust and we have several major opportunities presenting themselves in 2013.
TubeconTubecon continues to grow its market share and expand its client base.
Major projects include:• The Coca Cola pavilion and Wayfinder Gantries at
the Olympic Park.• A major sports facility for The University of
Cambridge.• Various canopies and atriums in Manchester,
Glasgow, Bristol and West Bromwich.
Tubecon started 2013 with several major projects in The City of London and Glasgow.

Operational Review
4
easi-edge Limited2012 was a year of consolidation as the slowdown in the construction sector impacted the business. During the period the long serving senior management team of Managing Director and Commercial Director both sought early retirement on health grounds. We were fortunate in being able to promote and transfer a member of the Billington Structures’ management into the position of Operations Director.
Major projects where safety edge protection was supplied included:• The Ageas Bowl, Southampton.• Wigmore Street, London.• School projects in Felixstowe, Huddersfield,
Peterborough and Cumbria.• Lancashire Cricket Club, Manchester.
Enquiries in the closing months of 2012 were 40 per cent up on the previous year and good conversion rates have increased the stock utilisation by five per cent over the same period.
hoard-it divisionOur unique sustainable site security hoarding system continues to grow, develop new products and increase its market share.
Major projects included:• Guy’s Hospital, London.• Major installations for the Ministry of Defence.• School projects in Littlehampton, Barnsley,
Rotherham, Bournemouth and Kings Lynn.
• University projects in Northampton, Sheffield, Exeter and Bristol.
• Green living hoardings in Enfield.• House building sites in Cambridge, Oxford and
Rotherham.
The start of 2013 has seen a surge in orders and our new internal hoarding system, known as screen-it, has been installed at Heathrow Airport Terminal 2. On 1 January 2013 a Commercial Director was appointed to provide further knowledge and expertise of the sector to assist in taking the company forward to the next level.
Peter Marshall Steel Stairs LimitedMirroring the difficulties in the structural steelwork sector, 2012 proved problematic for Peter Marshall Stairs as a result of competitive pressure in the marketplace.
Some notable projects have included:• Staircases for the iconic Bevis Marks building in
London.• Complex steelwork for the British Museum.• Stairs and metalwork to several waste to energy
projects.
To further strengthen and develop the management team on 1 January 2013 a Managing Director designate was appointed. Work has commenced on achieving the required CE marking standards by the end of 2013.
76
PeopleAs always I would like to take the opportunity of thanking all of our employees, my fellow board members and wider stakeholders for your continuing support in what continues to be the most extraordinary of times.
There have been a significant number of changes at senior management level during the period and I would like to wish the directors who have sought to leave early a long and healthy retirement. May I also offer a warm welcome to the newly appointed directors in our various subsidiaries.
ConclusionWe continue to make inroads into alternative sectors to our traditional commercial and industrial steelwork market. Having commissioned an external report into how we can offer our customers a broader portfolio of products and services, we intend to implement the report’s recommendations to further strengthen the Group’s marketing and sales resource to assist in promoting a more connected and expansive offering to customers in 2013. As such we have appointed a Group marketing manager, together with a number of business development managers, and look forward to an improvement in our presence in the market place as Billington Holdings.
Towards the end of 2012 there appeared to be a growing sense of order and stability entering the structural steelwork sector as cutthroat pricing below cost was finally recognised as an unsustainable approach. If this sense of order in the sector can continue, then I remain cautiously optimistic that although 2013 will continue to be challenging, further improvements and a return to modest profitability is possible.
Steve Fareham
Chief Executive
18 March 2013

98
Financial Review
Consolidated Income Statement 2012 2011
£’000 £’000
Revenue 38,171 53,878
Operating loss (438) (2,240)
Loss before tax (455) (2,159)
Loss after tax (415) (1,729)
Loss before tax excluding redundancy costs (133) (1,687)
Loss for shareholders (415) (1,729)
Loss per share (3.6)p (14.9)p
Consolidated Balance Sheet 2012 2011
£’000 £’000
Non current assets 9,331 9,994
Current assets 11,127 15,588
Current liabilities 7,791 12,372
Non current liabilities 368 413
Total equity 12,299 12,797
Consolidated Cash Flow 2012 2011
£’000 £’000
Result for shareholders (415) (1,729)
Depreciation 1,080 1,265
Capital expenditure (347) (1,969)
Tax (10) 150
Increase in working capital (934) (1,226)
Dividends - -
Net property loan movement (49) 462
Others (152) 32
Net cash outflow (827) (3,015)
Cash at beginning of year 1,839 4,854
Cash at end of year 1,012 1,839
The results for the year indicate a much improved
performance by the Group and are indicative
of the progress made to date following the
restructuring of the businesses in late 2011 and
early 2012.
Revenue decreased by 29 per cent primarily as
a result of the Billington Structures’ business
reverting back to a single shift operation at its plants
in Barnsley and Bristol as a conscious effort to
target value added work as opposed to production
volumes. Demand for structural steel in 2012
still remains at depressed levels, approximately
half of the pre-recession levels, and although the
industry as a whole has seen a significant amount
of supply removed from the market there remains
an imbalance of supply and demand, albeit at a
reduced level.
Operating margins (after redundancy costs) improved
to (1.1) per cent, which was 74 per cent higher than
in 2011.
Loss per share improved from 14.9p in 2011 to 3.6p
in 2012.
Redundancy costs of £322,000 were expended in
the year further to £472,000 in 2011; the annualised
cost saving of these redundancies is £2,846,000.
The Group continues to monitor its resources on an
on-going basis with a view to aligning the cost base
with that of anticipated demand and the related price
the Group feels it is able to achieve for its products.
Capital expenditure has been kept to a minimum
where possible; the total amount expended in the
year was £347,000 against £1,969,000 in 2011.
Within non current assets property, plant and
equipment decreased by £788,000, and deferred tax
assets increased by £68,000. Capital expenditure of
£347,000 was incurred in the year with net disposals
being £55,000 and depreciation was charged in the
year of £1,080,000. The balance of the movement
is as a result of a surplus on the defined benefit
pension scheme.
The reduction of £4,461,000 in current assets
included decreases of £1,897,000 in inventories,
£1,737,000 in trade and other receivables and
£827,000 in cash.
The total reduction of £4,581,000 in current liabilities
principally comprised a reduction in trade and other
payables.
A property loan of £469,000 was taken in 2011 to
purchase the trading premises of Peter Marshall
Steel Stairs. £368,000 of this is reflected within non-
current liabilities with repayments made against the
balance in the year of £49,000.
Total equity reduced by £498,000 in the year to
£12,299,000 and while this is disappointing the
financial position of the Group at the end of the year
remains robust and provides a platform from which
to continue to move forward through these difficult
economic times.
The primary factors underlying the net cash outflow
in the year were capital expenditure and a larger
proportionate decrease in trade and other payables
as compared to inventories and work in progress
and trade and other receivables. The Group
remains committed to treating its suppliers and
subcontractors fairly and to paying them in line with
their agreed payment terms.

10 11
Trevor Taylor
Financial Director
18 March 2013
Financial Review
2012 2011
£’000 £’000
Inventories 5,897 7,794
Accounts receivable 4,218 5,955
Accounts payable (7,746) (12,314)
Working capital at end of year 2,369 1,435
Pension Scheme 2011 2010
£’000 £’000
Scheme assets 6,025 5,854
Scheme liabilities (5,641) (5,527)
Surplus 384 327
Other finance income - 88
Contributions to defined benefit scheme 167 109
Cash balances at the year-end totalled £1,012,000
and there were property loans outstanding of
£413,000. While the cash position has decreased
by £827,000 from 2011 the Group continues with
significant headroom over its agreed facilities with its
bankers.
To limit the Group’s exposure to future potential
pension liabilities the decision was taken to close the
remaining Billington defined benefit pension scheme
to future accrual from 1 July 2011.
A recovery plan for the Billington scheme was agreed
with the trustees following an actuarial valuation of
the scheme liabilities as at 31 March 2011 (approved
18 June 2012), in accordance with the requirements
of the Pensions Act. Additional contributions are
being made in accordance with this agreement.
Working capital in the continuing operations was as shown below:

12
21
13
22
50
23
51
32
17 18 19
20
Directors, Secretary and registered office
Consolidated statement of changes in equity
Report of the directors
Statement of accounting policies - parent company
Statement of accounting policies
Notes forming part of the parent company financial statements
Notes forming part of the Group financial statements
Independent auditor’s report
Consolidated income statement
Consolidated statement of comprehensive income
FinancialStatements 2012
Year ended 31 December 2012
Report & Financial Statements
Consolidated balance sheet
Consolidated cash flow statement
48 49Parent company balance sheet
Independent auditor’s report (parent company)

12
DirectorsP.K. Hems
Non Executive Chairman
S.G.T. Fareham
Chief Executive
T.M. Taylor
Financial Director
J.S. Gordon
Non Executive Director
Dr. A. Ospelt
Non Executive Director
Secretary L.S. Holloway
Registered OfficeSteel House
Barnsley Road
Wombwell
Barnsley
South Yorkshire
S73 8DS
Registered in England:
Company Number - 02402219
Registrar and Main Transfer OfficeCapita Registrars
Northern House
Woodsome Park
Fenay Bridge
Huddersfield
HD8 0LA
E-mail:
Web Site:
www.billington-holdings.plc.uk
Nominated Advisor and BrokerW H Ireland
Royal House
28 Sovereign Street
Leeds
LS1 4BJ
AuditorsGrant Thornton UK LLP
Registered Auditor
Chartered Accountants
Regent House
80 Regent Road
Leicester
LE1 7NH
BankersHSBC Bank plc
4th Floor
City Point
29 King Street
Leeds
LS1 2HL
SolicitorsShoosmiths
Waterfront House
Waterfront Plaza
35 Station Street
Nottingham
NG2 2DQ
1313
The directors present their report together with the audited
financial statements for the year ended 31 December 2012.
1. Principal activities and business review
The company is principally engaged in the activity of a holding
company and the provision of management services to its
subsidiaries.
The Group operates as a designer, manufacturer amd installer
of structural steelwork through its subsidiaries Billington
Structures Limited and Peter Marshall Steel Stairs Limited,
and as a supplier of safety solutions and barrier systems to the
construction industry, through its subsidiary easi-edge Limited.
Peter Marshall Steel Stairs Limited commenced trading on 22
March 2011 following the acquisition of the trade and assets of
a company in administration.
On a Group basis the business review and future prospects for
the business are contained within the Chairman’s Statement,
Operational Review and Financial Review, including an analysis
using financial key performance indicators.
Principal Risks and Uncertainties
Contract risk
The principal risk for each of the subsidiaries is contract risk,
either agreeing inappropriate contract terms at the beginning of
the contract process or failing to deliver contractual obligations.
In order to mitigate these risks, significant senior management
effort is invested in the agreement of contractual terms and the
monitoring of performance against budget.
Health and safety
Health and safety within the Billington Group is of paramount
importance. The protection of both our employees and those
who may be affected by our business remains a key concern
and priority. The ethos throughout the Group is to ensure the
welfare of all employees is at the forefront of every decision and
not only to meet legal requirements but to go far beyond.
Economic environment
The economic environment in which the Group trades continues
to be challenging with both macro and micro economic
pressures. These risks are largely outside of the control of
the Group, however the directors monitor the economic
environment closely and this informs decision making within the
Group.
Credit risk
Current economic conditions have impacted on the Group’s
ability to maintain full credit protection on all customers. This
will remain an important issue for the foreseeable future that will
be constantly monitored to ensure the Group is not exposed to
an unacceptable level of risk.
Non financial key performance indicators
2012 2011
Tonnes of steel fabricated (000’s) 15 23
Production efficiency 101% 98%
Hire stock utilisation 65% 87%
Accidents (own employees)
- reportable - 3
- minor 16 40
Employee numbers 289 365
Directors, Secretary and Registered Office
Financial Statements
Report of the directors for the year ended 31 December 2012
14
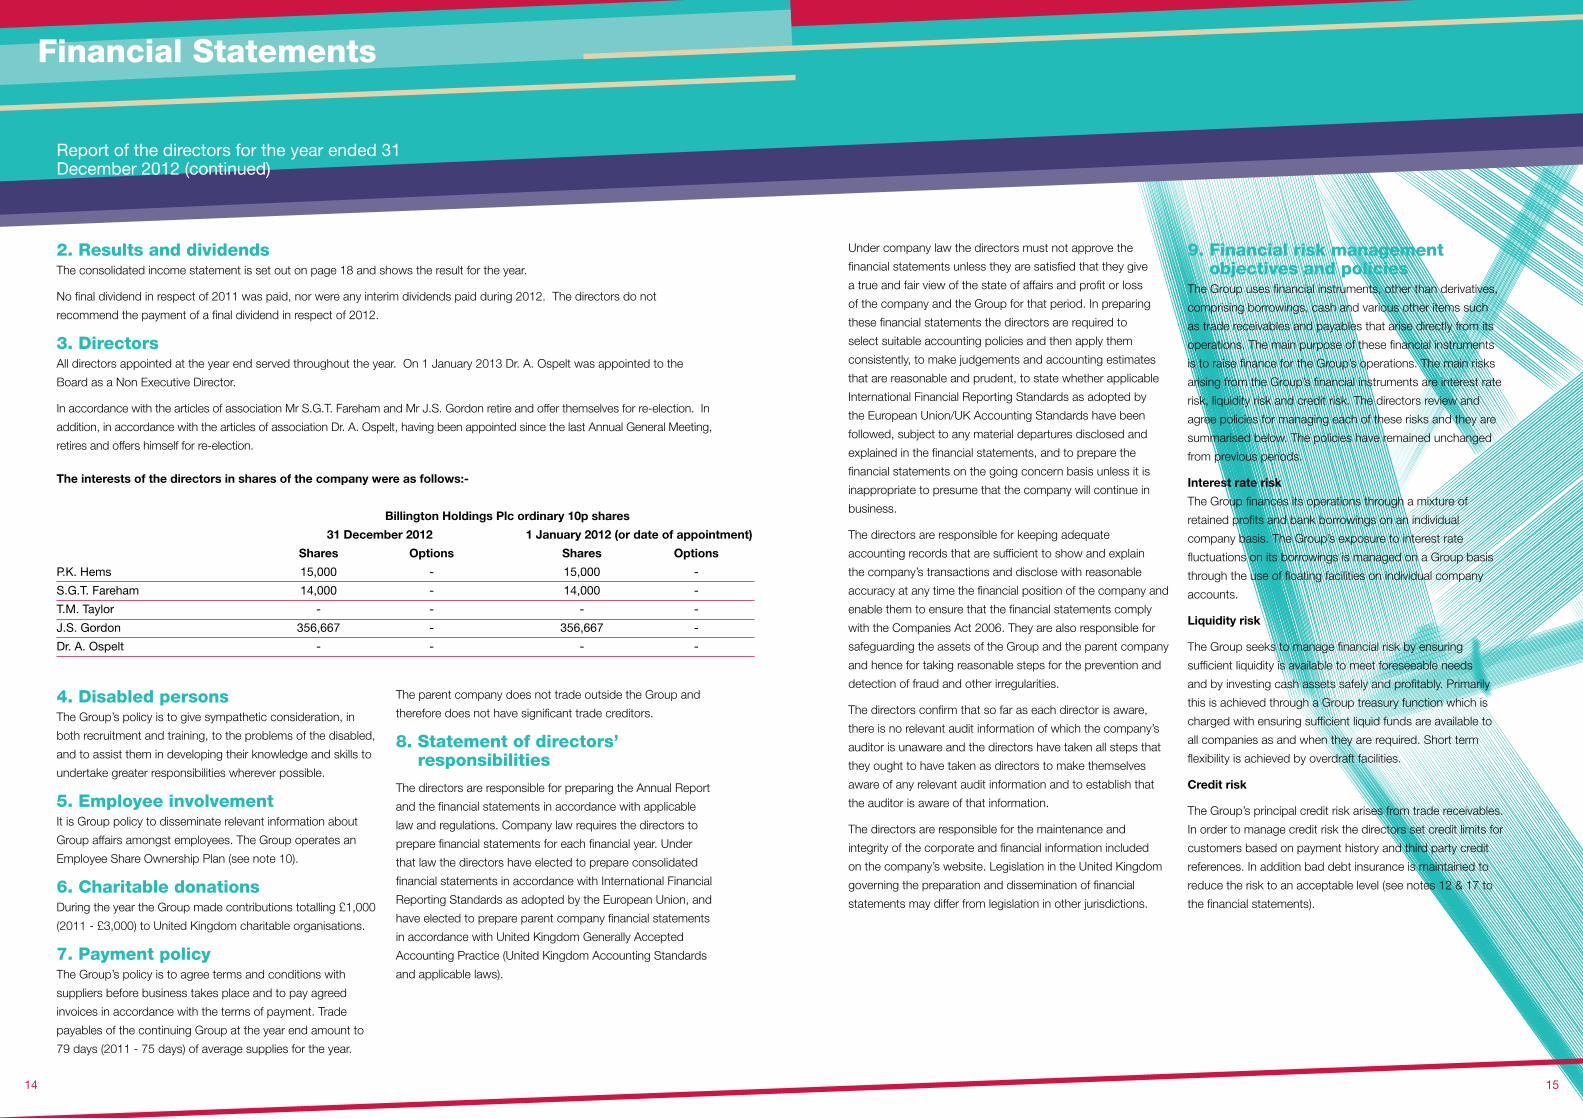
The interests of the directors in shares of the company were as follows:-
Billington Holdings Plc ordinary 10p shares
31 December 2012 1 January 2012 (or date of appointment)
Shares Options Shares Options
P.K. Hems 15,000 - 15,000 -
S.G.T. Fareham 14,000 - 14,000 -
T.M. Taylor - - - -
J.S. Gordon 356,667 - 356,667 -
Dr. A. Ospelt - - - -
13
Report of the directors for the year ended 31 December 2012 (continued)
15
4. Disabled persons The Group’s policy is to give sympathetic consideration, in
both recruitment and training, to the problems of the disabled,
and to assist them in developing their knowledge and skills to
undertake greater responsibilities wherever possible.
5. Employee involvementIt is Group policy to disseminate relevant information about
Group affairs amongst employees. The Group operates an
Employee Share Ownership Plan (see note 10).
6. Charitable donationsDuring the year the Group made contributions totalling £1,000
(2011 - £3,000) to United Kingdom charitable organisations.
7. Payment policyThe Group’s policy is to agree terms and conditions with
suppliers before business takes place and to pay agreed
invoices in accordance with the terms of payment. Trade
payables of the continuing Group at the year end amount to
79 days (2011 - 75 days) of average supplies for the year.
The parent company does not trade outside the Group and
therefore does not have significant trade creditors.
8. Statement of directors’ responsibilities
The directors are responsible for preparing the Annual Report
and the financial statements in accordance with applicable
law and regulations. Company law requires the directors to
prepare financial statements for each financial year. Under
that law the directors have elected to prepare consolidated
financial statements in accordance with International Financial
Reporting Standards as adopted by the European Union, and
have elected to prepare parent company financial statements
in accordance with United Kingdom Generally Accepted
Accounting Practice (United Kingdom Accounting Standards
and applicable laws).
2. Results and dividends The consolidated income statement is set out on page 18 and shows the result for the year.
No final dividend in respect of 2011 was paid, nor were any interim dividends paid during 2012. The directors do not
recommend the payment of a final dividend in respect of 2012.
3. DirectorsAll directors appointed at the year end served throughout the year. On 1 January 2013 Dr. A. Ospelt was appointed to the
Board as a Non Executive Director.
In accordance with the articles of association Mr S.G.T. Fareham and Mr J.S. Gordon retire and offer themselves for re-election. In
addition, in accordance with the articles of association Dr. A. Ospelt, having been appointed since the last Annual General Meeting,
retires and offers himself for re-election.
Under company law the directors must not approve the
financial statements unless they are satisfied that they give
a true and fair view of the state of affairs and profit or loss
of the company and the Group for that period. In preparing
these financial statements the directors are required to
select suitable accounting policies and then apply them
consistently, to make judgements and accounting estimates
that are reasonable and prudent, to state whether applicable
International Financial Reporting Standards as adopted by
the European Union/UK Accounting Standards have been
followed, subject to any material departures disclosed and
explained in the financial statements, and to prepare the
financial statements on the going concern basis unless it is
inappropriate to presume that the company will continue in
business.
The directors are responsible for keeping adequate
accounting records that are sufficient to show and explain
the company’s transactions and disclose with reasonable
accuracy at any time the financial position of the company and
enable them to ensure that the financial statements comply
with the Companies Act 2006. They are also responsible for
safeguarding the assets of the Group and the parent company
and hence for taking reasonable steps for the prevention and
detection of fraud and other irregularities.
The directors confirm that so far as each director is aware,
there is no relevant audit information of which the company’s
auditor is unaware and the directors have taken all steps that
they ought to have taken as directors to make themselves
aware of any relevant audit information and to establish that
the auditor is aware of that information.
The directors are responsible for the maintenance and
integrity of the corporate and financial information included
on the company’s website. Legislation in the United Kingdom
governing the preparation and dissemination of financial
statements may differ from legislation in other jurisdictions.
9. Financial risk management objectives and policies
The Group uses financial instruments, other than derivatives,
comprising borrowings, cash and various other items such
as trade receivables and payables that arise directly from its
operations. The main purpose of these financial instruments
is to raise finance for the Group’s operations. The main risks
arising from the Group’s financial instruments are interest rate
risk, liquidity risk and credit risk. The directors review and
agree policies for managing each of these risks and they are
summarised below. The policies have remained unchanged
from previous periods.
Interest rate risk
The Group finances its operations through a mixture of
retained profits and bank borrowings on an individual
company basis. The Group’s exposure to interest rate
fluctuations on its borrowings is managed on a Group basis
through the use of floating facilities on individual company
accounts.
Liquidity risk
The Group seeks to manage financial risk by ensuring
sufficient liquidity is available to meet foreseeable needs
and by investing cash assets safely and profitably. Primarily
this is achieved through a Group treasury function which is
charged with ensuring sufficient liquid funds are available to
all companies as and when they are required. Short term
flexibility is achieved by overdraft facilities.
Credit risk
The Group’s principal credit risk arises from trade receivables.
In order to manage credit risk the directors set credit limits for
customers based on payment history and third party credit
references. In addition bad debt insurance is maintained to
reduce the risk to an acceptable level (see notes 12 & 17 to
the financial statements).
Financial Statements

13
Report of the directors for the year ended 31 December 2012 (continued)
Independent Auditor’s Report to the members of Billington Holdings plc
17
10. Going concernThe consolidated financial statements have been prepared
on a going concern basis. The directors have taken note of
the guidance issued by the Financial Reporting Council on
Going Concern Assessments in determining that this is the
appropriate basis of preparation of the financial statements
and have considered a number of factors.
The financial position of the Group, its trading performance
and cash flows are detailed in the Financial Review and they
demonstrate the overall adequate net cash position of the
Group.
In addition section 9 (above) sets out our financial risk
management objectives and policies and how short term
liquidity is maintained within the Group. The directors are
confident that further funding facilities would be available
should they be required in the future. As a consequence the
directors believe that the parent company and Group are well
placed to manage their business risks successfully despite
the uncertainties surrounding the current general economic
outlook.
The directors have a reasonable expectation that the parent
company and the Group have adequate resources to
continue in operational existence for the foreseeable future.
Accordingly, they continue to adopt the going concern basis
in preparing the annual report and accounts.
11. Auditor Grant Thornton UK LLP have expressed their willingness to
continue in office. In accordance with Section 489 (4) of the
Companies Act 2006 a resolution to reappoint Grant Thornton
UK LLP will be proposed at the Annual General Meeting.
12. ApprovalThe board of directors of Billington Holdings Plc has approved
the contents of this report and financial statements for the
year ended 31 December 2012.
BY ORDER OF THE BOARD
L.S. Holloway
Secretary
Billington Holdings plc
Company Number - 02402219
18 March 2013
We have audited the Group financial statements of Billington
Holdings plc for the year ended 31 December 2012 which
comprise the consolidated income statement, the consolidated
statement of comprehensive income, the consolidated balance
sheet, the consolidated statement of changes in equity, the
consolidated cash flow statement, the statement of accounting
policies and notes 1 to 24. The financial reporting framework
that has been applied in their preparation is applicable law and
International Financial Reporting Standards (IFRSs) as adopted
by the European Union.
This report is made solely to the company’s members, as
a body, in accordance with Chapter 3 of Part 16 of the
Companies Act 2006. Our audit work has been undertaken so
that we might state to the company’s members those matters
we are required to state to them in an auditor’s report and for
no other purpose. To the fullest extent permitted by law, we
do not accept or assume responsibility to anyone other than
the company and the company’s members as a body, for our
audit work, for this report, or for the opinions we have formed.
Respective responsibilities of directors and auditor
As explained more fully in the statement of directors’
responsibilities set out on page 14, the directors are
responsible for the preparation of the Group financial
statements and for being satisfied that they give a true and fair
view. Our responsibility is to audit and express an opinion on
the Group financial statements in accordance with applicable
law and International Standards on Auditing (UK and Ireland).
Those standards require us to comply with the Auditing
Practices Board’s (APB’s) Ethical Standards for Auditors.
Scope of the audit of the financial statements
A description of the scope of an audit of financial statements
is provided on the APB’s website at www.frc.org.uk/apb/
scope/private.cfm
Opinion on financial statements
In our opinion the Group financial statements:
- give a true and fair view of the state of the Group’s affairs
as at 31 December 2012 and of its loss for the year then
ended;
- have been properly prepared in accordance with IFRSs as
adopted by the European Union; and
- have been prepared in accordance with the requirements of
the Companies Act 2006.
Opinion on other matter prescribed by the Companies
Act 2006
In our opinion the information given in the report of the directors
for the financial year for which the financial statements are
prepared is consistent with the Group financial statements.
Matters on which we are required to report by exception
We have nothing to report in respect of the following:
Under the Companies Act 2006 we are required to report to
you if, in our opinion:
- certain disclosures of directors’ remuneration specified by
law are not made; or
- we have not received all the information and explanations we
require for our audit.
Other matter
We have reported separately on the parent company financial
statements of Billington Holdings plc for the year ended 31
December 2012.
John Bowler
Senior Statutory Auditor
for and on behalf of Grant Thornton UK LLP
Statutory Auditor, Chartered Accountants
East Midlands
18 March 2013
16
Financial Statements

13
Consolidated income statement for the year ended 31 December 2012
Consolidated statement of comprehensive income for the year ended 31 December 2012
1918
Note 2012 2011
£’000 £’000 £’000 £’000
Revenue 2 38,171 53,878
(Decrease)/increase in work in progress (1,824) 1,179
36,347 55,057
Raw materials and consumables 21,402 38,296
Other external charges 2,946 3,408
Staff costs 3 10,027 12,948
Redundancy 3 322 472
Depreciation 2 1,080 1,265
Other operating charges 1,008 908
(36,785) (57,297)
Group operating loss (438) (2,240)
Share of post tax profit in joint ventures 23 - -
Total operating loss (438) (2,240)
Net finance cost 4 (17) (7)
Other finance income - pension scheme 21 - 88
Loss before tax 2 (455) (2,159)
Tax 5 40 430
Loss for the year (415) (1,729)
Loss for the year attributable to equity holders
of the parent company (415) (1,729)
Loss per share (basic and diluted) 7 (3.6) p (14.9) p
All results arose from continuing operations.
The statement of accounting policies and notes 1 to 24 form part of these Group financial statements.
2012 2011
Note £’000 £’000
Loss for the year (415) (1,729)
Other comprehensive income
Actuarial loss recognised in the pension scheme 21 (110) (134)
Movement on deferred tax relating to pension liability 21 (14) 26
Current tax relating to pension liability 5 41 24
Other comprehensive income, net of tax (83) (84)
Total comprehensive income for the year attributable to
equity holders of the parent company (498) (1,813)
The statement of accounting policies and notes 1 to 24 form part of these Group financial statements.
Financial Statements
13
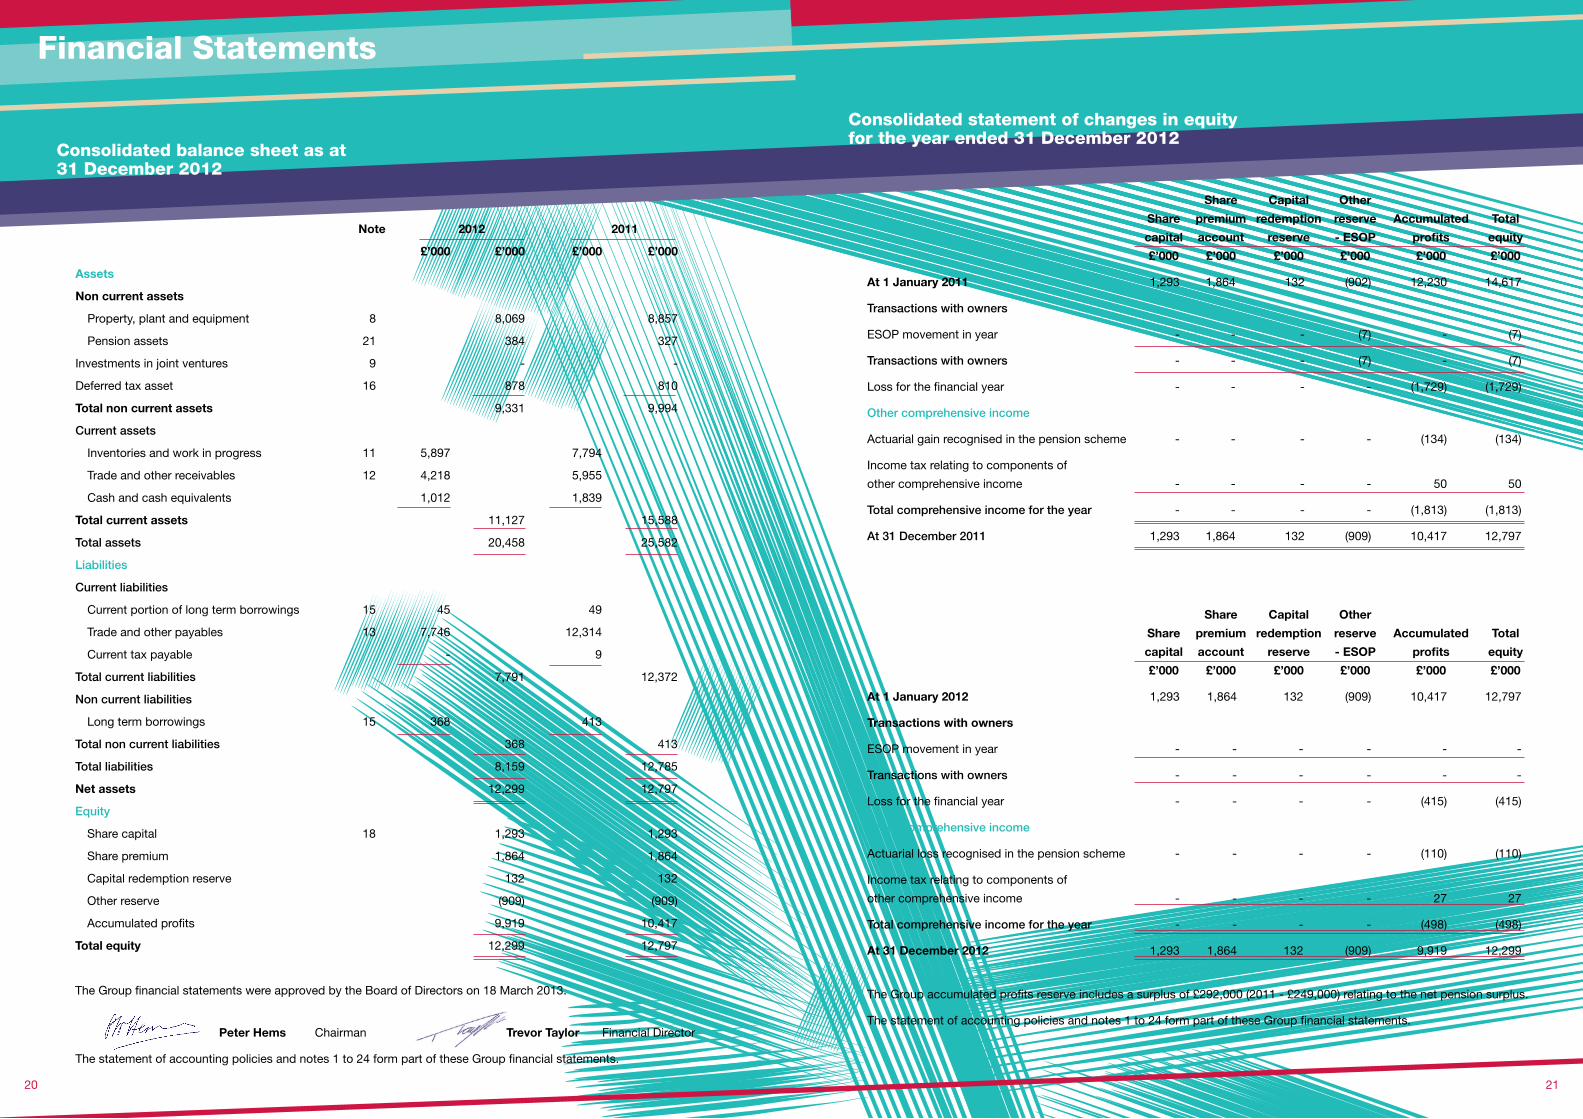
Consolidated balance sheet as at 31 December 2012
Consolidated statement of changes in equity for the year ended 31 December 2012
21
The Group accumulated profits reserve includes a surplus of £292,000 (2011 - £249,000) relating to the net pension surplus.
The statement of accounting policies and notes 1 to 24 form part of these Group financial statements.
20
Note 2012 2011
£’000 £’000 £’000 £’000
Assets
Non current assets
Property, plant and equipment 8 8,069 8,857
Pension assets 21 384 327
Investments in joint ventures 9 - -
Deferred tax asset 16 878 810
Total non current assets 9,331 9,994
Current assets
Inventories and work in progress 11 5,897 7,794
Trade and other receivables 12 4,218 5,955
Cash and cash equivalents 1,012 1,839
Total current assets 11,127 15,588
Total assets 20,458 25,582
Liabilities
Current liabilities
Current portion of long term borrowings 15 45 49
Trade and other payables 13 7,746 12,314
Current tax payable - 9
Total current liabilities 7,791 12,372
Non current liabilities
Long term borrowings 15 368 413
Total non current liabilities 368 413
Total liabilities 8,159 12,785
Net assets 12,299 12,797
Equity
Share capital 18 1,293 1,293
Share premium 1,864 1,864
Capital redemption reserve 132 132
Other reserve (909) (909)
Accumulated profits 9,919 10,417
Total equity 12,299 12,797
The Group financial statements were approved by the Board of Directors on 18 March 2013.
Share Capital Other
Share premium redemption reserve Accumulated Total
capital account reserve - ESOP profits equity
£’000 £’000 £’000 £’000 £’000 £’000
At 1 January 2011 1,293 1,864 132 (902) 12,230 14,617
Transactions with owners
ESOP movement in year - - - (7) - (7)
Transactions with owners - - - (7) - (7)
Loss for the financial year - - - - (1,729) (1,729)
Other comprehensive income
Actuarial gain recognised in the pension scheme - - - - (134) (134)
Income tax relating to components of
other comprehensive income - - - - 50 50
Total comprehensive income for the year - - - - (1,813) (1,813)
At 31 December 2011 1,293 1,864 132 (909) 10,417 12,797
Share Capital Other
Share premium redemption reserve Accumulated Total
capital account reserve - ESOP profits equity
£’000 £’000 £’000 £’000 £’000 £’000
At 1 January 2012 1,293 1,864 132 (909) 10,417 12,797
Transactions with owners
ESOP movement in year - - - - - -
Transactions with owners - - - - - -
Loss for the financial year - - - - (415) (415)
Other comprehensive income
Actuarial loss recognised in the pension scheme - - - - (110) (110)
Income tax relating to components of
other comprehensive income - - - - 27 27
Total comprehensive income for the year - - - - (498) (498)
At 31 December 2012 1,293 1,864 132 (909) 9,919 12,299
Financial Statements
Peter Hems Chairman Trevor Taylor Financial Director
The statement of accounting policies and notes 1 to 24 form part of these Group financial statements.

Statement of accounting policiesThese consolidated financial statements have been prepared
under the historical cost convention and in accordance with
the accounting policies set out below which comply with IFRS
in issue as adopted by the European Union and are effective
at 31 December 2012.
The accounting policies have been applied consistently
throughout the Group for the purposes of preparation of these
consolidated financial statements.
(a) Basis of consolidation
The Group financial statements consolidate those of the
Company and all of its subsidiary undertakings. Subsidiaries
are entities over which the Group has the power to control the
financial and operating policies so as to obtain benefits from
its activities. The Group obtains and exercises control through
voting rights.
Income, expenditure, unrealised gains and intra-group balances
arising from transactions within the Group are eliminated.
Unrealised losses are also eliminated unless the transaction
provides evidence of an impairment of the assets transferred.
Amounts in the financial statements of subsidiaries have been
adjusted where necessary to ensure consistency with the
accounting policies adopted by the Group.
Acquisitions of subsidiaries are dealt with by the acquisition
method. The acquisition method involves the recognition at fair
value of all identifiable assets and liabilities, including contingent
liabilities of the subsidiary, at the acquisition date, regardless of
whether or not they were recorded in the financial statements
of the subsidiary prior to acquisition. On initial recognition,
the assets and liabilities of the subsidiary are included in the
consolidated balance sheet at their fair values, which are also
used as the bases for subsequent measurement in accordance
with the Group accounting policies. Goodwill is stated after
separating out identifiable intangible assets. Goodwill represents
the excess of the fair value of the consideration transferred to the
vendor over the fair value of the Group’s share of the identifiable
net assets of the acquired subsidiary at the date of acquisition.
(b) Revenue
In the case of contracts with customers for services where the
contract is essentially for the provision of labour, materials and
plant, revenue represents the value of labour, material and plant
supplied in the period based on rates agreed with customers.
In the case of contracts with customers which have the
characteristics of construction contracts, revenue is the total
amount receivable in respect of work done, including certified
amounts recoverable on contracts, and is treated as follows:
- the amount by which recorded revenue is in excess of
payments on account is classified as amounts recoverable on
contracts and separately disclosed within current assets.
13
Consolidated cash flow statement for the year ended 31 December 2012
2012 2011
Note £’000 £’000
Cash flows from operating activities
Group loss after tax (415) (1,729)
Taxation (paid)/received (10) 150
Interest received - 12
Depreciation on property, plant and equipment 1,080 1,265
Difference between pension charge and cash contributions (167) (2)
Profit on sale of property, plant and equipment (28) (68)
Taxation credit recognised in income statement (40) (430)
Net finance expense/(income) 17 (81)
Decrease/(increase) in inventories and work in progress 1,897 (1,261)
Decrease/(increase) in trade and other receivables 1,737 (2,709)
(Decrease)/increase in trade and other payables (4,568) 2,744
Net cash flow from operating activities (497) (2,109)
Cash flows from investing activities
Purchase of property, plant and equipment (347) (1,969)
Proceeds from sale of property, plant and equipment 83 627
Net cash flow from investing activities (264) (1,342)
Cash flows from financing activities
Interest paid (17) (19)
Proceeds of bank and other loans - 469
Repayment of bank and other loans (49) (7)
Employee Share Ownership Plan share purchases 10 - (7)
Net cash flow from financing activities (66) 436
Net decrease in cash and cash equivalents (827) (3,015)
Cash and cash equivalents at beginning of period 1,839 4,854
Cash and cash equivalents at end of period 1,012 1,839
The statement of accounting policies and notes 1 to 24 form part of these Group financial statements.
22 23
Financial Statements
24 25
(d) Inventories and work in progress
Inventories and work in progress are valued at the lower
of cost, including applicable overheads, and net realisable
value. Costs of ordinarily interchangeable items are assigned
using the first in, first out cost formula.
Contract work in progress is included in revenue on the
basis of independent certification of value of work done.
Unpaid certified work is classified as amounts recoverable
on contracts.
Provision is made for probable losses on all contracts based
on the loss which is currently estimated to arise over the
duration of any contract, irrespective of the amount of work
carried out at the balance sheet date.
(e) Taxation
Current tax is the tax currently payable based on taxable
profit for the year.
Deferred income taxes are calculated using the liability
method on temporary differences. Deferred tax is generally
provided on the difference between the carrying amounts of
assets and liabilities and their tax bases. However, deferred
tax is not provided on the initial recognition of goodwill, nor
on the initial recognition of an asset or liability unless the
related transaction is a business combination or affects tax
or accounting profit. Deferred tax on temporary differences
associated with shares in subsidiaries is not provided if
reversal of these temporary differences can be controlled
by the Group and it is probable that reversal will not occur
in the foreseeable future. In addition, tax losses available to
be carried forward as well as other income tax credits to the
Group are assessed for recognition as deferred tax assets.
Deferred tax liabilities are provided in full, with no discounting.
Deferred tax assets are recognised to the extent that it is
probable that the underlying deductible temporary differences
will be able to be offset against future taxable income. Current
and deferred tax assets and liabilities are calculated at tax
rates that are expected to apply to their respective period
of realisation, provided they are enacted or substantively
enacted at the balance sheet date.
Changes in deferred tax assets or liabilities are recognised
as a component of tax expense in profit or loss, except
where they relate to items that are recognised in other
comprehensive income (ie actuarial gains and losses) in
which case the related deferred tax is also recognised in
other comprehensive income.
Statement of accounting policies (continued)
- the balance of payments on account in excess of amounts
(a) matched with revenue and (b) offset against contract
balances are classified as payments on account and
separately disclosed within trade and other payables.
- revenue and costs are recognised by reference to stage of
completion at the balance sheet date once the outcome of
the contract can be measured reliably.
- the level of completion is determined by reference to the
work certified against the overall anticipated contract value
at a given point in time.
- revenue is recognised when the company is notified of
certified works by the contractor. When the outcome
of a contract cannot be estimated reliably, revenue is
recognised to the extent that it is probable that the costs
are recoverable.
- when it is probable that total contract costs will exceed
total contract revenue, the expected loss is immediately
recognised as an expense.
In the case of revenue from asset rentals relating to the use
of the Group’s safety solutions products this is charged to
customers on a time accrual basis.
In all other cases, revenue represents the fair value of
consideration received or receivable for goods supplied in
the period, excluding VAT and other discounts. Revenue is
recognised when the goods are despatched or the goods
are complete and are available for collection by the customer
whichever is the earlier, which is when the significant risks
and rewards of ownership are considered to be transferred.
In accordance with IAS 11 the Group does not recognise
the revenue and profit attributable to claims and disputed
amounts on contracts until the recovery of these amounts
is considered probable and when the outcome can be
estimated reliably.
(c) Property, plant and equipment
Property, plant and equipment is stated at cost, net of
depreciation and any provision for impairment.
The gain or loss arising on the disposal of an asset is
determined as the difference between the disposal proceeds
and the carrying amount of the asset and is recognised in
the income statement.
Depreciation is calculated to write off the cost of property,
plant and equipment (other than freehold land) less
estimated residual value by equal annual instalments over
their expected useful lives. The expected useful lives and
material residual value estimates are updated as required,
but at least annually.
The rates applicable are:
Freehold and long leasehold property 2% to 4%
Plant and equipment 5% to 33.3%
Motor vehicles 10% to 40%
Impairment testing of property, plant and equipment
For the purposes of assessing impairment, assets are
grouped at the lowest levels for which there are separately
identifiable cash flows (cash-generating units). As a result,
some assets are tested individually for impairment and some
are tested at a cash-generating unit level.
Individual assets or cash-generating units are tested for
impairment whenever events or changes in circumstances
indicate that the carrying amount may not be recoverable.
An impairment loss is recognised for the amount by which
the asset’s or cash-generating unit’s carrying amount
exceeds its recoverable amount. The recoverable amount
is the higher of fair value, reflecting market conditions
less costs to sell, and value in use based on an internal
discounted cash flow evaluation. All assets are subsequently
reassessed for indications that an impairment loss previously
recognised may no longer exist.
Financial Statements

13
Statement of accounting policies (continued)
26 27
(h) Employee Share Ownership Plan
The Group’s Employee Share Ownership Plan (“ESOP”) is
a separately administered trust. The assets of the ESOP
comprise shares in the company and cash. The assets,
liabilities, income and costs of the ESOP have been included
in the consolidated financial statements as the Group
exercises control over the ESOP in accordance with the
terms of the trust deed. The shares in the Company are
included at cost to the ESOP and deducted from equity
and dividend income is excluded in arriving at profit before
tax and deducted from the aggregate of dividends paid
and proposed. When calculating earnings per share these
shares are treated as if they were cancelled. No share option
charge arises as all share options within the ESOP vested
prior to 1 January 2005.
(i) Foreign currencies
Transactions in foreign currencies are translated at the
exchange rate ruling at the date of the transaction. Monetary
assets and liabilities in foreign currencies are translated at
the rates of exchange ruling at the balance sheet date. All
foreign exchange differences are dealt with through the
income statement.
(j) Joint ventures
Joint ventures are entities over which the Group holds
a contractual share of joint control. The Group financial
statements incorporate joint ventures under the equity
method of accounting, supplemented by additional
disclosures.
The Group’s share of the profits, losses, finance income,
finance cost and taxation of joint ventures are included in
the Group income statement. The Group balance sheet
includes the investment in joint ventures at the Group’s
share of net assets.
(k) Financial assets
Financial assets are divided into the following categories:
loans and receivables; financial assets at fair value through
profit or loss; available-for-sale financial assets; and held-to-
maturity investments. Financial assets are assigned to the
different categories by management on initial recognition,
depending on the purpose for which they were acquired.
The designation of financial assets is re-evaluated at
every reporting date at which a choice of classification or
accounting treatment is available.
All financial assets are recognised when the Group becomes
a party to the contractual provisions of the instrument. The
Group only has loans and receivables, which are recognised
at fair value plus transaction costs.
Loans and receivables are non-derivative financial assets
with fixed or determinable payments that are not quoted in
an active market. Trade receivables and other receivables
are classified as loans and receivables. Loans and
receivables are measured subsequent to initial recognition
at amortised cost using the effective interest method, less
provision for impairment. Any change in their value through
impairment or reversal of impairment is recognised in the
income statement.
Provision against trade receivables is made when there is
objective evidence that the Group may not be able to collect
all amounts due to it in accordance with the original terms
of those receivables. The amount of the write-down is
determined as the difference between the asset’s carrying
amount and the present value of estimated future cash flows
discounted using the original effective interest rate.
A financial asset is derecognised only where the contractual
rights to the cash flows from the asset expire or the
financial asset is transferred and that transfer qualifies
for derecognition. A financial asset is transferred if the
contractual rights to receive the cash flows of the asset
have been transferred or the Group retains the contractual
rights to receive the cash flows of the asset but assumes a
contractual obligation to pay the cash flows to one or more
recipients. A financial asset that is transferred qualifies for
derecognition if the Group transfers substantially all the
risks and rewards of ownership of the asset, or if the Group
neither retains nor transfers substantially all the risks and
rewards of ownership but does transfer control of that asset.
(f) Retirement benefits
Defined Contribution pension schemes
The pension costs charged against operating profits
represent the amount of the contributions payable to the
schemes in respect of the accounting period.
Defined Benefit pension schemes
Scheme assets are measured at fair values. Scheme
liabilities are measured on an actuarial basis using the
projected unit method and are discounted at appropriate
high quality corporate bond rates that have terms to
maturity approximating to the terms of the related liability.
Past service cost is recognised as an expense on a straight-
line basis over the average period until the benefits become
vested. To the extent that benefits are already vested the
Group recognises past service cost immediately.
Actuarial gains and losses are recognised immediately in
other comprehensive income. The gross surplus or deficit
is presented on the face of the balance sheet. The related
deferred tax is shown with other deferred tax balances. A
surplus is recognised only to the extent that it is recoverable
by the Group.
The current service cost, past service cost and costs from
settlements and curtailments are charged against other
operating charges. Interest on the scheme liabilities and the
expected return on scheme assets are included in other
finance income/costs.
Short-term employee benefits, including holiday entitlement,
are included in current pension and other employee
obligations at the undiscounted amount that the Group
expects to pay as a result of the unused entitlement.
(g) Leased assets
In accordance with IAS 17, the economic ownership of
a leased asset is transferred to the lessee if the lessee
bears substantially all the risks and rewards related to
the ownership of the leased asset. The related asset is
recognised at the time of inception of the lease at the fair
value of the leased asset or, if lower, the present value of
the minimum lease payments plus incidental payments, if
any, to be borne by the lessee. A corresponding amount is
recognised as a finance leasing liability.
All other leases are regarded as operating leases and the
payments made under them are charged to profit or loss on
a straight line basis over the period of the lease term. Lease
incentives are spread over the term of the lease.
Financial Statements

Statement of accounting policies (continued)
(q) Standards and interpretations in issue
not yet effective
The following standards and interpretations of relevance to
the Group have been issued, but are not effective and have
not been adopted by the Group:
IFRS 10 Consolidated Financial Statements (effective 1
January 2014)
IFRS 11 Joint Arrangements (effective 1 January 2014)
IFRS 13 Fair Value Measurement (effective 1 January 2013)
IAS 19 Employee Benefits (Revised June 2011) (effective 1
January 2013)
IAS 28 (Revised), Investments in Associates and Joint
Ventures (effective 1 January 2014)
Presentation of Items of Other Comprehensive Income -
Amendments to IAS 1 (effective 1 July 2012)
Deferred Tax: Recovery of Underlying Assets - Amendments
to IAS 12 Income Taxes (effective date 1 January 2013)
These standards and interpretations are not expected
to have any significant impact on the Group’s financial
statements.
Other standards and interpretations in issue but not yet
effective are not considered to have any relevance to the
Group.
(r) Significant management judgements and estimates
in applying accounting policies
The following are significant management judgements in
applying the accounting policies of the Group that have the
most significant effect on the financial statements. Critical
estimation uncertainties are described below.
Construction contract revenue
The stage of completion of any construction contract is
assessed by management by taking into consideration all
information available at the reporting date. In this process
management makes significant judgements about milestones,
actual work performed, costs to complete and the overall
contract value. Further information on the Group’s accounting
policy for construction contracts is provided in note b.
Recognition of pension scheme surplus
Management consider that where the pension scheme is in
surplus it is appropriate to recognise this as an asset in the
Group balance sheet. The scheme rules indicate that any
surplus will be returned to the sponsoring company upon
cessation.
Deferred tax assets
The assessment of the probability of future taxable income
against which deferred tax assets can be utilised is based
on the Group’s latest approved budget forecast, which is
adjusted for significant non-taxable income and expenses
and specific limits to the use of any unused tax loss or
credit. If a positive forecast of taxable income indicates the
probable use of a deferred tax asset, especially when it
can be utilised without a time limit, that deferred tax asset
is recognised in full to the extent that it is probable taxable
profits will be available. The recognition of deferred tax
assets that are subject to certain legal or economic limits or
uncertainties is assessed individually by management based
on the specific facts and circumstances.
28 29
(l) Financial liabilities
Financial liabilities are obligations to pay cash or other
financial assets and are recognised when the Group
becomes a party to the contractual provisions of the
instrument. The Group only has financial liabilities at
amortised cost, which are recorded initially at fair value, net
of direct issue costs.
Other financial liabilities are recorded at amortised cost
using the effective interest method, with interest-related
charges recognised as an expense in finance cost in the
income statement. Finance charges, including premiums
payable on settlement or redemption and direct issue costs,
are charged to the income statement on an accruals basis
using the effective interest method and are added to the
carrying amount of the instrument to the extent that they are
not settled in the period in which they arise.
A financial liability is derecognised only when the obligation
is extinguished, that is, when the obligation is discharged or
cancelled or expires.
(m) Cash and cash equivalents
Cash and cash equivalents comprise cash on hand and
demand deposits.
(n) Dividends
Dividend distributions payable to equity shareholders are
included in “trade and other payables” when the dividends are
approved in general meeting prior to the balance sheet date,
and are debited direct to equity within accumulated profits.
(o) Equity
Equity comprises the following:
“Called up share capital” represents the nominal value of
equity shares.
“Share premium” represents the excess over nominal value
of the fair value of consideration received for equity shares,
net of expenses of the share issue.
“Capital redemption reserve” represents the purchase cost
of shares repurchased by the Group in 1998.
“Other reserves” represents the purchase cost of the shares
held within the Employee Share Ownership Plan (ESOP).
“Accumulated profits” represents retained profit and gains
and losses due to the revaluation of certain property, plant
and equipment prior to the implementation of IFRS.
(p) Segmental reporting
In identifying its operating segments, management follows the
Group’s service lines, which represent the main products and
services provided by the Group. The measurement policies
the Group uses for segment reporting under IFRS 8 are the
same as those used in its previous financial statements. The
disclosure is based on the information that is presented to the
chief operating decision maker, which is considered to be the
board of Billington Holdings plc. There have been no changes
from prior periods in the measurement methods used to
determine segment profit or loss.
Financial Statements

(r) Significant management judgements in applying
accounting policies (continued)
Estimation uncertainty
When preparing the financial statements management
undertakes a number of judgements, estimates and
assumptions about recognition and measurement of assets,
liabilities, income and expenses. The actual results may
differ from the judgements, estimates and assumptions
made by management, and will seldom equal the estimated
results. Information about significant judgements, estimates
and assumptions that have the most significant effect on
recognition and measurement of assets, liabilities, income
and expenses are discussed below.
Useful lives of depreciable assets
Management reviews the useful lives of depreciable assets
at each reporting date. At 31 December 2012 management
assesses that the useful lives represent the expected utility
of the assets to the Group. The carrying amounts are
analysed in note 8.
Construction contract revenue
The carrying amount of construction contracts and
revenue recognised from construction contracts reflects
management’s best estimate about each contract’s outcome
and stage of completion. The Group’s management assesses
the profitability of ongoing construction contracts and the
order backlog at least monthly, using extensive project
management procedures. For more complex contracts in
particular, costs to complete and contract profitability are
subject to significant estimation uncertainty.
Inventories
Inventories are measured at the lower of cost and net
realisable value. In estimating net realisable values,
management takes into account the most reliable evidence of
market value available at the times the estimates are made.
Defined benefit obligation
Management estimates the defined benefit obligation
annually with the assistance of independent actuaries;
however, the actual outcome may vary due to estimation
uncertainties. The estimate of its defined benefit obligation of
£5,641,000 (2011: £5,527,000) is based on standard rates
of inflation and appropriate mortality tables. It also takes into
account the Group’s specific anticipation of future salary
increases. Discount factors are determined close to each
year-end by reference to high quality corporate bonds that
are denominated in the currency in which the benefits will be
paid and that have terms to maturity approximating to the
terms of the related pension obligation.
The defined benefit pension scheme was closed to future
accrual during the prior year.
13
Statement of accounting policies (continued)
(s) Capital management policies and procedures
Billington Holdings’ capital management objectives are to
ensure the Group’s ability to continue as a going concern
and provide an adequate return to shareholders.
The Group and subsidiary companies’ Boards meet
regularly to review performance and discuss future
opportunities and threats with an aim to maximising return
and minimising risk.
The Group monitors capital as the carrying amount of equity
less cash and cash equivalents on the face of the balance
sheet. There are no covenants in place over the capital ratio
to be maintained.
30 31
Financial Statements

13
Notes forming part of the Group financial statements for the year ended 31 December 2012
32 33
3. Directors and employees
Staff costs during the year including directors:
2012 2011
£’000 £’000
Wages and salaries 8,822 11,300
Social security 943 1,205
Pension costs 262 443
10,027 12,948
Redundancy 322 472
10,349 13,420
The average number of employees of the continuing Group during the year was 289 (2011 - 365).
Key management is considered to be the directors of Billington Holdings plc. Remuneration in respect of
key management was as follows:
Salary and Other 2011
Fees Emoluments Pension Total Total
£’000 £’000 £’000 £’000 £’000
Executive
S.G.T. Fareham 181 15 8 204 207
P.J. Hart - - - - 120
S.M.C. Fewster - - - - 47
T.M. Taylor 63 10 10 83 14
Non-executive
P.K. Hems 80 - - 80 80
J.S. Gordon 33 - - 33 33
357 25 18 400 501
Employer’s NI 48 56
Key management personnel compensation 448 557
Other emoluments received consist of the provision for private medical care, bonuses and motor car allowances.
During the year no directors (2011 - no directors) participated in defined benefit pension schemes and two directors
(2011 - four directors) participated in a defined contribution pension scheme.
During the year no directors (2011 - no directors) exercised share options.
1. Segmental information
The Group trading operations of Billington Holdings plc are only in Structural Steel, and all are continuing. This includes
the activities of Billington Structures Limited, easi-edge Limited and Peter Marshall Steel Stairs Limited. The Group
activities, comprising services and assets provided to Group companies and a small element of external property rentals
and management charges, are considered incidental to the activities of Billington Structures Limited and have therefore
not been shown as a separate operating segment but have been subsumed with Structural Steel. All assets of the Group
reside in the UK.
2. Revenue and loss before tax
Revenue and loss before tax are attributable to the Group’s operations of structural steel. All revenue originated from the UK
with 90% (2011: 93%) being derived from construction contracts. During 2012 two customers included within the structural
steel sector accounted for greater than 10% of the Group’s revenue. These Contractors accounted for 12% and 23% (2011:
one contractor for 18%) of Group revenue.
Revenue from structural steel
2012 2011
£’000 £’000
United Kingdom 35,927 51,482
Sales of services
2012 2011
£’000 £’000
United Kingdom 2,244 2,396
Loss before tax is stated after:
2012 2011
£’000 £’000
An analysis of fees paid to the company’s auditor
Fees payable to the company’s auditor for the
audit of the company’s annual accounts 28 26
Fees payable to the company’s auditor and
its associates for other services:
the audit of the company’s subsidiaries 22 23
corporate finance - 5
tax services 5 13
other services 2 12
Depreciation 1,080 1,265
Profit on disposal of property, plant and equipment (28) (68)
Operating lease charges:
short term hire of plant and machinery 7 5
operating leases - other 250 170
operating leases - property 103 105
Financial Statements

13
Notes forming part of the Group financial statements for the year ended 31 December 2012 (continued)
3534
6. Dividends
No final dividend has been proposed in respect of 2012 or 2011.
7. Loss per share
Loss per share is calculated by dividing the loss for the year of £415,000 (2011 - loss - £1,729,000) by 11,581,358 (2011
- 11,586,616) fully paid ordinary shares, being the weighted average number of ordinary shares in issue during the year,
excluding those held in the ESOP Trust.
There is no impact on a full dilution of the loss per share calculation as there are no potential dilutive ordinary shares.
8. Property, plant and equipment
Freehold Long leasehold Plant, equipment
property property and vehicles Total
£’000 £’000 £’000 £’000
Cost
At 1st January 2011 5,053 1,000 10,619 16,672
Additions 703 - 1,266 1,969
Disposals - - (971) (971)
At 1st January 2012 5,756 1,000 10,914 17,670
Additions - - 347 347
Disposals - - (710) (710)
At 31st December 2012 5,756 1,000 10,551 17,307
Freehold Long leasehold Plant, equipment
property property and vehicles Total
£’000 £’000 £’000 £’000
Depreciation
At 1st January 2011 260 - 7,700 7,960
Charge for year 50 - 1,215 1,265
Disposals - - (412) (412)
At 1st January 2012 310 - 8,503 8,813
Charge for year 54 - 1,026 1,080
Disposals - - (655) (655)
At 31st December 2012 364 - 8,874 9,238
Net book value at 31st December 2012 5,392 1,000 1,677 8,069
Net book value at 31st December 2011 5,446 1,000 2,411 8,857
Freehold property includes £2,994,000 in respect of land which is not subject to depreciation. Long leasehold property
represents land which is not subject to depreciation.
All the Group’s freehold properties have been charged to the bank to secure bank facilities.
4. Net finance (expense)/income
2012 2011
£’000 £’000
Payable on bank loans and overdrafts (16) (5)
Receivable on bank balances - 12
Other interest receivable - 1
Other interest payable (1) (15)
Net finance cost (17) (7)
Other finance income - pension scheme (see note 21) - 88
(17) 81
5. Tax on loss on ordinary activities
The tax credit represents:
2012 2011
£’000 £’000
Corporation tax at 24.5% (2011 - 26.5%) 42 35
Adjustment in respect of prior years - (1)
Total current tax 42 34
Deferred tax credit - (note 16) (82) (464)
Total tax credit for the year (40) (430)
Tax relating to other comprehensive income:
2012 2011
£’000 £’000
Corporation tax at 24.5% (2011 - 26.5%)
Current tax credit relating to pension liability (41) (24)
This reflects the tax relief available on additional contributions made to finance the net pension deficit.
The tax assessed for the year differs from the standard rate of corporation tax in the United Kingdom of 24.5% (2011 -
26.5%). The differences are explained as follows:
2012 2011
£’000 £’000
Loss on ordinary activities before tax (455) (2,159)
Loss on ordinary activities multiplied by the standard rate
of corporation tax in the United Kingdom of 24.5% (2011 - 26.5%) (111) (572)
Effects of:
expenses not deductible for tax purposes 3 10
adjustments to tax charge in respect of prior years - (1)
other adjustments 67 121
ESOP tax charge 1 12
Total tax credit for year (40) (430)
The ESOP tax charge in the year represents tax due on the receipt of dividends in the ESOP from the parent company.
Financial Statements

13
Notes forming part of the Group financial statements for the year ended 31 December 2012 (continued)
3736
12. Trade and other receivables
Staff costs during the year including directors:
2012 2011
£’000 £’000
Amounts due from structural steel customers:
- Trade receivables 2,198 3,806
- Retentions due within one year 1,170 1,230
- Retentions due after one year 364 434
Total 3,732 5,470
Other receivables 32 5
Prepayments and accrued income 454 480
4,218 5,955
All of the Group’s trade and other receivables have been reviewed for indicators of impairment. Certain trade receivables
were found to be impaired and a provision of £99,000 (2011: £25,000) has been recorded accordingly.
The movement in the provision for trade receivables can be reconciled as follows:
2012 2011
£’000 £’000
Balance at 1 January 25 89
Impairment loss 74 3
Impairment loss reversed - (67)
Balance at 31 December 99 25
In addition, some of the unimpaired trade receivables are past due as at the reporting date. The age of financial assets
past due but not impaired is as follows:
2012 2011
£’000 £’000
Not more than three months 261 491
More than three months but not more than six months 236 136
More than six months but not more than one year 87 52
584 679
13. Trade and other payables
2012 2011
£’000 £’000
Trade payables 6,474 10,214
Social security and other taxes 687 1,553
Other payables 203 230
Accruals 382 317
7,746 12,314
14. Long term borrowings
2012 2011
£’000 £’000
Property loans (note 15) 413 462
413 462
Activity Proportion of shares held by
Group Company
% %
Continuing
Billington Structures Limited Structural steel 100 100
easi-edge Limited Safety solutions 100 100
Peter Marshall Steel Stairs Limited Structural engineering 100 100
Billington Fleet Management Limited Dormant 100 100
Joint ventures
BS2 (2011) Limited Structural steel 50 -
10. Employee Share Ownership Plan
The Employee Share Ownership Plan (“the Trust”) was established by Deed dated 25 September 1991 between Billington
Holdings plc (“the Company”) and Bedell Cristin Trustees Limited (“the Trustee”). It is an employee benefit trust established
for the benefit of the bona fide employees of the Company and other Group companies (“the Beneficiaries”). The Trust is
a discretionary trust whose assets at present are shares in the Company and cash, although there are wide investment
powers in the hands of the Trustee, who has full power to distribute the assets as it deems fit to the Beneficiaries.
The Trust was established in contemplation of the operation of any Inland Revenue approved or unapproved share scheme
and in this regard an unapproved share option scheme over shares in the Company was set up on 21 February 1992 and
other approved or unapproved share schemes may be set up in the future.
Administration costs amount to £2,500 per annum.
As of 31 December 2012 the Trust held 1,353,519 (2011 - 1,352,919) ordinary shares of 10p each in the capital of the
company (10.46% of the allotted share capital (2011 - 10.46%)). The market value of the shares in the ESOP at 31
December 2012 was £663,244 (2011 - £980,866). Dividends on these shares have not been waived.
On exercise of the share option the employee receives ordinary shares in Billington Holdings Plc. The options are
exercisable for nil consideration. There were no options outstanding at 31 December 2012 or 31 December 2011.
11. Inventories and work in progress
2012 2011
£’000 £’000
Raw materials 373 447
Work in progress 5,524 7,347
5,897 7,794
Raw materials and consumables recognised as an expense in the Income Statement for the year ended 31 December 2012
totalled £21,402,000 (2011 - £38,296,000).
There are no provisions against the value of inventories at the balance sheet date (2011: nil).
No reversal of previous write-downs was recognised as a reduction of expense in 2011 or 2012. None of the inventories are
pledged as securities for liabilities.
9. Investments
All Group companies have only ordinary shares in issue and are registered in England and Wales unless otherwise
stated.
The subsidiary undertakings and joint ventures are as follows:
Financial Statements

17. Financial instruments
The Group uses financial instruments, other than derivatives, comprising borrowings, cash and various items such
as trade receivables and trade payables that arise directly from its operations. The main purpose of these financial
instruments is to raise finance for the Group’s operations. The financial risk management objectives and policies are set
out in the report of the directors.
Financial assets
The Group’s financial assets comprise cash and cash equivalents and trade and other receivables. Cash earns interest
at floating rates and the other financial assets do not attract interest.
Financial liabilities
The types of financial liabilities used by the Group comprise trade payables, other payables, other accruals and a
property loan.
Fair value of financial instruments
There is no material difference between the book and fair value of financial instruments.
Monetary assets and liabilities denominated in a foreign currency
Monetary assets and liabilities denominated in a foreign currency
All monetary assets and liabilities are denominated in Sterling.
Liquidity risk
As at 31 December 2012 the Group’s financial liabilities have contractual maturities which are summarised below:
31 December 2012 Between one Current within Current six to and three six months twelve months years £’000 £’000 £’000
Trade payables 6,474 - -
Other payables 203 - -
Accruals 382 - -
Property loans 23 22 368
7,082 22 368
This compares to the maturity of financial liabilities for the Group in the previous reporting period which was as follows:
31 December 2011 Between one Current within Current six to and three six months twelve months years £’000 £’000 £’000
Trade payables 10,214 - -
Other payables 230 - -
Accruals 317 - -
Property loans 24 25 413
13
Notes forming part of the Group financial statements for the year ended 31 December 2012 (continued)
3938
15. Property loans
2012 2011
£’000 £’000
Loans at commercial rates -
due within one year 45 49
repayable within ten years 368 413
413 462
Aggregate amounts repayable -
within one year 45 49
between one and two years 368 45
between two and five years - 368
over five years - -
413 462
The bank loan is secured by way of first legal mortgage over certain freehold properties of the group. The loan is for a
three year term and interest is payable at 3.25% over bank base rate.
16. Deferred tax asset
Deferred tax provided in the financial statements is set out below and is calculated using a tax rate of 23% (2011-24%).
2012 2011
£’000 £’000
Deferred tax asset recognised in income statement
At 1st January 888 424
Credited in the year 82 464
At 31st December 970 888
Accelerated capital allowances 343 304
Other temporary differences 57 72
Tax losses carried forward 570 512
970 888
Deferred tax asset recognised in other comprehensive income
Pension surplus (92) (78)
Total deferred tax asset 878 810
The recoverability of the deferred tax asset is dependent on future taxable profits. Group companies are budgeted to
make profits in the next few years which supports the recognition of these assets. There are no unrecognised deferred
tax assets.
Movements on the deferred tax asset relating to the pension deficit (see note 21) are recognised directly in equity. All
other deferred tax movements are recognised in the income statement.
The Government announced in March 2012 a reduction in the rate of corporation tax to 24% with effect from 1 April
2012, with further reductions of 1% each year to 22% by 1 April 2014. Accordingly, deferred tax balances have been
calculated at the rate substantially enacted at the balance sheet date.
Financial Statements
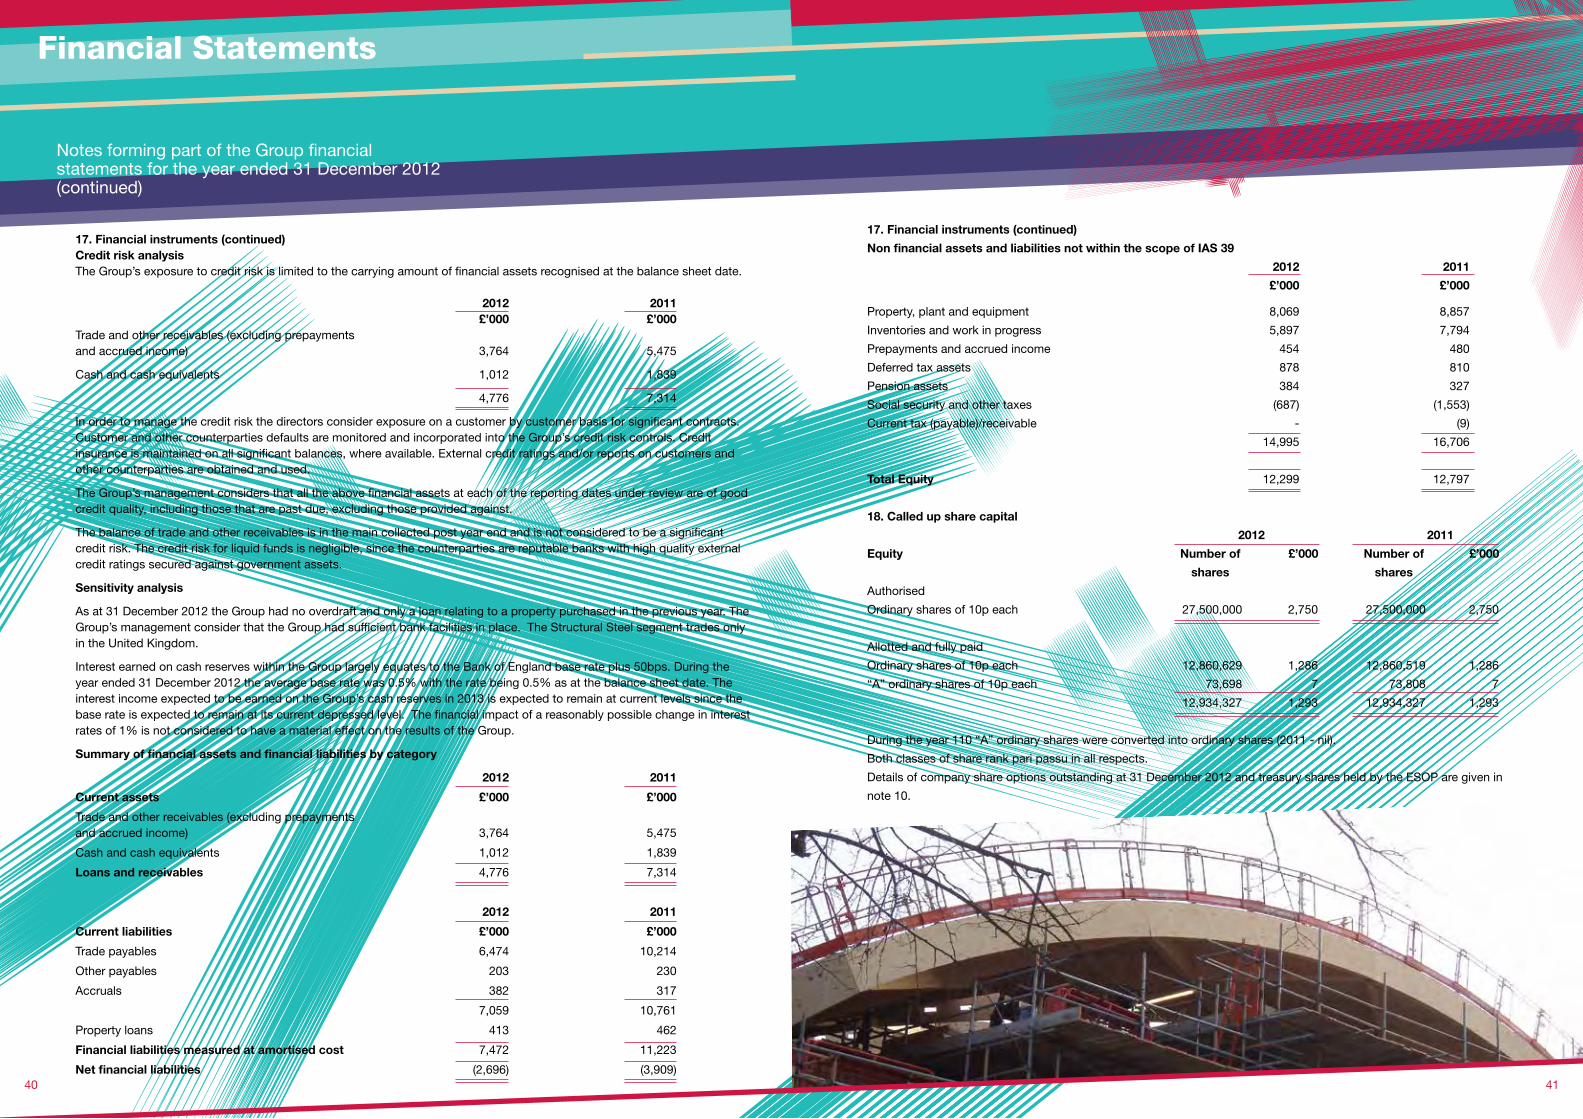
13
Notes forming part of the Group financial statements for the year ended 31 December 2012 (continued)
4140
17. Financial instruments (continued)
Non financial assets and liabilities not within the scope of IAS 39
2012 2011
£’000 £’000
Property, plant and equipment 8,069 8,857
Inventories and work in progress 5,897 7,794
Prepayments and accrued income 454 480
Deferred tax assets 878 810
Pension assets 384 327
Social security and other taxes (687) (1,553)
Current tax (payable)/receivable - (9)
14,995 16,706
Total Equity 12,299 12,797
18. Called up share capital
2012 2011
Equity Number of £’000 Number of £’000
shares shares
Authorised
Ordinary shares of 10p each 27,500,000 2,750 27,500,000 2,750
Allotted and fully paid
Ordinary shares of 10p each 12,860,629 1,286 12,860,519 1,286
“A” ordinary shares of 10p each 73,698 7 73,808 7
12,934,327 1,293 12,934,327 1,293
During the year 110 “A” ordinary shares were converted into ordinary shares (2011 - nil).
Both classes of share rank pari passu in all respects.
Details of company share options outstanding at 31 December 2012 and treasury shares held by the ESOP are given in
note 10.
17. Financial instruments (continued)Credit risk analysisThe Group’s exposure to credit risk is limited to the carrying amount of financial assets recognised at the balance sheet date.
2012 2011 £’000 £’000Trade and other receivables (excluding prepayments and accrued income) 3,764 5,475
Cash and cash equivalents 1,012 1,839
4,776 7,314
In order to manage the credit risk the directors consider exposure on a customer by customer basis for significant contracts. Customer and other counterparties defaults are monitored and incorporated into the Group’s credit risk controls. Credit insurance is maintained on all significant balances, where available. External credit ratings and/or reports on customers and other counterparties are obtained and used.
The Group’s management considers that all the above financial assets at each of the reporting dates under review are of good credit quality, including those that are past due, excluding those provided against.
The balance of trade and other receivables is in the main collected post year end and is not considered to be a significant credit risk. The credit risk for liquid funds is negligible, since the counterparties are reputable banks with high quality external credit ratings secured against government assets.
Sensitivity analysis
As at 31 December 2012 the Group had no overdraft and only a loan relating to a property purchased in the previous year. The Group’s management consider that the Group had sufficient bank facilities in place. The Structural Steel segment trades only in the United Kingdom.
Interest earned on cash reserves within the Group largely equates to the Bank of England base rate plus 50bps. During the year ended 31 December 2012 the average base rate was 0.5% with the rate being 0.5% as at the balance sheet date. The interest income expected to be earned on the Group’s cash reserves in 2013 is expected to remain at current levels since the base rate is expected to remain at its current depressed level. The financial impact of a reasonably possible change in interest rates of 1% is not considered to have a material effect on the results of the Group.
Summary of financial assets and financial liabilities by category
2012 2011
Current assets £’000 £’000
Trade and other receivables (excluding prepayments and accrued income) 3,764 5,475
Cash and cash equivalents 1,012 1,839
Loans and receivables 4,776 7,314
2012 2011
Current liabilities £’000 £’000
Trade payables 6,474 10,214
Other payables 203 230
Accruals 382 317
7,059 10,761
Property loans 413 462
Financial liabilities measured at amortised cost 7,472 11,223
Net financial liabilities (2,696) (3,909)
Financial Statements
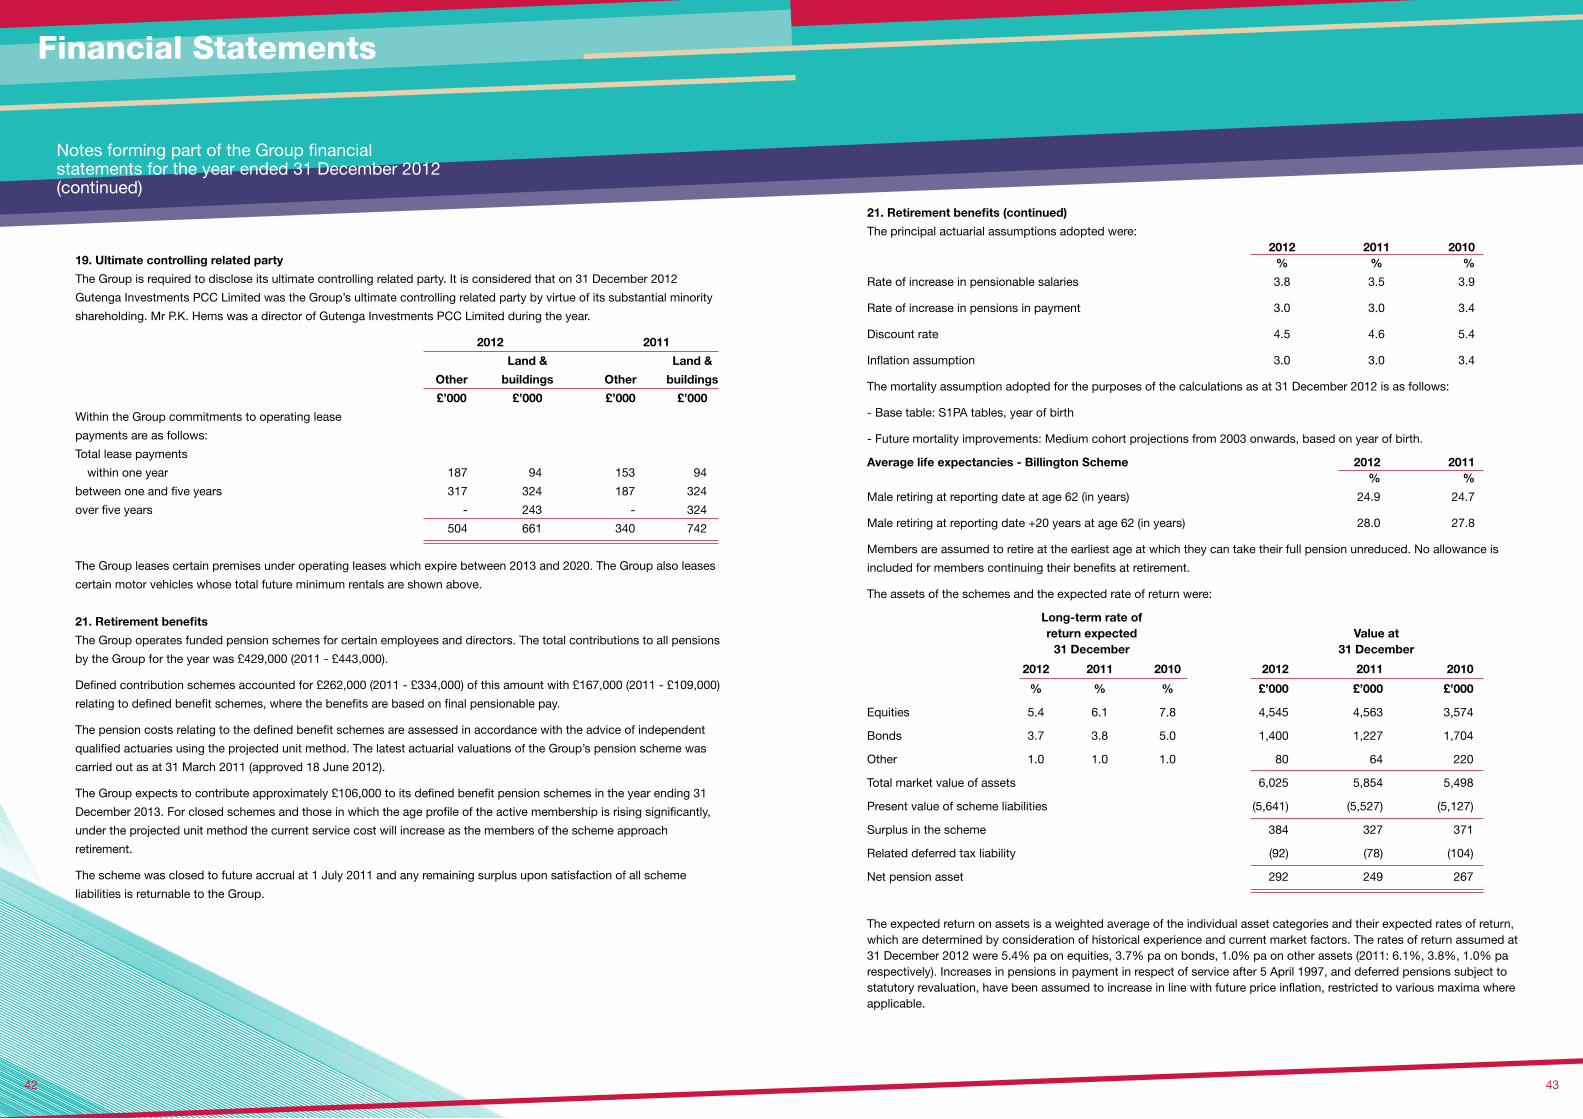
13
Notes forming part of the Group financial statements for the year ended 31 December 2012 (continued)
4342
21. Retirement benefits (continued)
The principal actuarial assumptions adopted were: 2012 2011 2010 % % %
Rate of increase in pensionable salaries 3.8 3.5 3.9
Rate of increase in pensions in payment 3.0 3.0 3.4
Discount rate 4.5 4.6 5.4
Inflation assumption 3.0 3.0 3.4
The mortality assumption adopted for the purposes of the calculations as at 31 December 2012 is as follows:
- Base table: S1PA tables, year of birth
- Future mortality improvements: Medium cohort projections from 2003 onwards, based on year of birth.
Average life expectancies - Billington Scheme 2012 2011 % %
Male retiring at reporting date at age 62 (in years) 24.9 24.7
Male retiring at reporting date +20 years at age 62 (in years) 28.0 27.8
Members are assumed to retire at the earliest age at which they can take their full pension unreduced. No allowance is
included for members continuing their benefits at retirement.
The assets of the schemes and the expected rate of return were:
Long-term rate of return expected Value at 31 December 31 December
2012 2011 2010 2012 2011 2010
% % % £’000 £’000 £’000
Equities 5.4 6.1 7.8 4,545 4,563 3,574
Bonds 3.7 3.8 5.0 1,400 1,227 1,704
Other 1.0 1.0 1.0 80 64 220
Total market value of assets 6,025 5,854 5,498
Present value of scheme liabilities (5,641) (5,527) (5,127)
Surplus in the scheme 384 327 371
Related deferred tax liability (92) (78) (104)
Net pension asset 292 249 267
The expected return on assets is a weighted average of the individual asset categories and their expected rates of return, which are determined by consideration of historical experience and current market factors. The rates of return assumed at 31 December 2012 were 5.4% pa on equities, 3.7% pa on bonds, 1.0% pa on other assets (2011: 6.1%, 3.8%, 1.0% pa respectively). Increases in pensions in payment in respect of service after 5 April 1997, and deferred pensions subject to statutory revaluation, have been assumed to increase in line with future price inflation, restricted to various maxima where applicable.
19. Ultimate controlling related party
The Group is required to disclose its ultimate controlling related party. It is considered that on 31 December 2012
Gutenga Investments PCC Limited was the Group’s ultimate controlling related party by virtue of its substantial minority
shareholding. Mr P.K. Hems was a director of Gutenga Investments PCC Limited during the year.
2012 2011
Land & Land &
Other buildings Other buildings
£’000 £’000 £’000 £’000
Within the Group commitments to operating lease
payments are as follows:
Total lease payments
within one year 187 94 153 94
between one and five years 317 324 187 324
over five years - 243 - 324
504 661 340 742
The Group leases certain premises under operating leases which expire between 2013 and 2020. The Group also leases
certain motor vehicles whose total future minimum rentals are shown above.
21. Retirement benefits
The Group operates funded pension schemes for certain employees and directors. The total contributions to all pensions
by the Group for the year was £429,000 (2011 - £443,000).
Defined contribution schemes accounted for £262,000 (2011 - £334,000) of this amount with £167,000 (2011 - £109,000)
relating to defined benefit schemes, where the benefits are based on final pensionable pay.
The pension costs relating to the defined benefit schemes are assessed in accordance with the advice of independent
qualified actuaries using the projected unit method. The latest actuarial valuations of the Group’s pension scheme was
carried out as at 31 March 2011 (approved 18 June 2012).
The Group expects to contribute approximately £106,000 to its defined benefit pension schemes in the year ending 31
December 2013. For closed schemes and those in which the age profile of the active membership is rising significantly,
under the projected unit method the current service cost will increase as the members of the scheme approach
retirement.
The scheme was closed to future accrual at 1 July 2011 and any remaining surplus upon satisfaction of all scheme
liabilities is returnable to the Group.
Financial Statements

13
Notes forming part of the Group financial statements for the year ended 31 December 2012(continued)
44
21. Retirement benefits (continued)
Movement in the fair value of plan assets during the year were as follows:
2012 2011
£’000 £’000
At 1 January 5,854 5,498
Expected return on assets 248 365
Actuarial gain/(loss) 108 (29)
Contributions 167 109
Benefits paid (352) (89)
At 31 December 6,025 5,854
Movement in the defined benefit obligation during the year was as follows:
2012 2011
£’000 £’000
At 1 January (5,527) (5,127)
Current service cost - (23)
Interest cost (248) (277)
Actuarial loss (218) (105)
Benefits paid 352 89
Loss on curtailments - (84)
At 31 December (5,641) (5,527)
Financial Statements
45
21. Retirement benefits (continued)
Analysis of amount charged to operating profit in respect of defined benefit schemes:
2012 2011
£’000 £’000
Current service cost - 23
Loss on curtailments - 84
Total operating charge - 107
Movement in surplus during the year:
2012 2011
£’000 £’000
Surplus in scheme at the beginning of the year 327 371
Movement
Current service cost - (23)
Contributions 167 109
Other finance income - 88
Actuarial loss (110) (134)
Loss on curtailments - (84)
Surplus in scheme at the end of the year 384 327
Analysis of the amount charged to other finance income:
2012 2011
£’000 £’000
Expected return on pension scheme assets 248 365
Interest on pension scheme liabilities (248) (277)
Net income - 88
Analysis of amount recognised in statement of comprehensive income:
2012 2011
£’000 £’000
Actual return less expected return on pension scheme assets 108 (29)
Experience gains and losses arising on the scheme liabilities 2 205
Changes in assumptions underlying the present value of the scheme liabilities (220) (310)
Actuarial loss recognised in statement of comprehensive income (110) (134)

13
Notes forming part of the Group financial statements for the year ended 31 December 2012 (continued)
4746
23. Joint ventures
The Group’s investment in joint ventures relates to an equal shareholding of £1 held in BS2 (2011) Limited which was
incorporated on 23 February 2011. The principal activity of BS2 (2011) Limited is that of design engineering, fabrication and
construction of structural steelwork and commenced trading on 1st November 2011.
The joint venture has been accounted for in the Group accounts using the equity accounting method.
The Group’s share of transactions and balances with BS2 (2011) Limited as at 31 December 2012 were as follows:
£’000
Share of revenue 65
Share of profit before taxation -
Share of profit after taxation -
Share of current assets 3
Share of liabilities due within one year (3)
24. Reconciliation of net cash flow to movement in net cash Cash and cash Property equivalents loans Net cash
£’000 £’000 £’000
At 1 January 2011 4,854 - 4,854
Cash flow (3,015) (462) (3,477)
At 31 December 2011 1,839 (462) 1,377
Cash flow (827) 49 (778)
At 31 December 2012 1,012 (413) 599
21. Retirement benefits (continued)
History of experience gains and losses has been:
2012 2011 2010 2009 2008
£’000 £’000 £’000 £’000 £’000
Total scheme assets 6,025 5,854 5,498 4,619 36,005
Total scheme liabilities 5,641 5,527 5,127 4,778 43,088
Net surplus/(deficit) 384 327 371 (159) (7,083)
Difference between the actual and expected return on scheme assets:
Amount (£’000) 108 (29) 388 3,546 (8,734)
Percentage of scheme assets 2% 0% 7% 8% 26%
Experience gains and losses arising on the scheme liabilities:
Amount (£’000) 2 205 7 49 (18)
Percentage of the present value of
the scheme liabilities 0% 4% 0% 0% 1%
Total actuarial (loss)/gain recognised in the consolidated statement of comprehensive income:
Amount (£’000) (110) (134) 172 (1,470) (1,994)
Percentage of present value of scheme liabilities 2% 2% 3% 3% 4%
The actual return on the scheme assets for the year ended 31 December 2012 was £356,000 (2011: £336,000). The cumulative
actuarial loss recognised in the consolidated statement of comprehensive income from 1 January 2006 (being the transition
date to the adoption of IFRS) is £613,000 (2011 - £503,000). The difference between the expected and actual return on the
schemes’ assets is due to recent market performance. The positive effect of changes in demographic and financial assumptions
underlying the present value of the schemes’ liabilities is due largely to the change in the discount rate assumption.
22. Related party transactions
During the year the Group had one common director with Tolent PLC, Mr P.K. Hems. The Group has in the past undertaken
normal arms length trading activities with related undertakings of Tolent PLC. Revenue amounting to £1,230,106 (2011 -
£967,365) at normal market rates is in respect of Tolent PLC related undertakings. A balance of £20,904 (2011 - £183,799) was
outstanding at the year end.
Financial Statements

Financial Statements
1349
Note 2012 2011
£’000 £’000 £’000 £’000
Fixed assets
Tangible assets 5 6,412 6,497
Investments 6 1,300 1,050
7,712 7,547
Current assets
Debtors falling due within one year 8 239 365
Cash at bank and in hand 824 745
1,063 1,110
Creditors: amounts falling due within one year 9 (719) (845)
Net current assets 765 838
Total assets less current liabilities 8,056 7,812
Creditors: amounts falling due after more
than one year 10 (368) (413)
7,688 7,399
Capital and reserves
Called up share capital 12 1,293 1,293
Share premium 13 1,864 1,864
Capital redemption reserve 13 132 132
Other reserve 13 (909) (909)
Profit and loss account 13 5,308 5,019
Shareholders’ funds 14 7,688 7,399
The parent company financial statements were approved by the Board of Directors on 18 March 2013.
P.K. HEMS Chairman
T.M. TAYLOR Financial Director
The statement of accounting policies and notes 1 to 19 form part of these parent company financial statements.
48
Independent auditor’s report to the members of Billington Holdings plc
We have audited the parent company financial statements
of Billington Holdings plc for the year ended 31 December
2012 which comprise the parent company balance sheet,
the statement of accounting policies and notes 1 to 19.
The financial reporting framework that has been applied
in their preparation is applicable law and United Kingdom
Accounting Standards (United Kingdom Generally Accepted
Accounting Practice).
This report is made solely to the company’s members, as
a body, in accordance with Chapter 3 of Part 16 of the
Companies Act 2006. Our audit work has been undertaken
so that we might state to the company’s members those
matters we are required to state to them in an auditor’s
report and for no other purpose. To the fullest extent
permitted by law, we do not accept or assume responsibility
to anyone other than the company and the company’s
members as a body, for our audit work, for this report, or for
the opinions we have formed.
Respective responsibilities of directors and auditor
As explained more fully in the statement of directors’
responsibilities set out on page 14, the directors are
responsible for the preparation of the parent company
financial statements and for being satisfied that they give a
true and fair view. Our responsibility is to audit and express
an opinion on the parent company financial statements in
accordance with applicable law and International Standards
on Auditing (UK and Ireland). Those standards require us to
comply with the Auditing Practices Board’s (APB’s) Ethical
Standards for Auditors.
Scope of the audit of the financial statements
A description of the scope of an audit of financial statements
is provided on the APB’s website at www.frc.org.uk/apb/
scope/private.cfm.
Opinion on financial statements
In our opinion the parent company financial statements:
- give a true and fair view of the state of the company’s
affairs as at 31 December 2012;
- have been properly prepared in accordance with United
Kingdom Generally Accepted Accounting Practice; and
- have been prepared in accordance with the requirements of
the Companies Act 2006.
Opinion on other matter prescribed by the Companies
Act 2006
In our opinion the information given in the report of the
directors for the financial year for which the financial
statements are prepared is consistent with the parent
company financial statements.
Matters on which we are required to report by exception
We have nothing to report in respect of the following matters
where the Companies Act 2006 requires us to report to you
if, in our opinion:
- adequate accounting records have not been kept by the
parent company, or returns adequate for our audit have not
been received from branches not visited by us; or
- the parent company financial statements are not in
agreement with the accounting records and returns; or
- certain disclosures of directors’ remuneration specified by
law are not made; or
- we have not received all the information and explanations
we require for our audit.
Other matter
We have reported separately on the Group financial
statements of Billington Holdings plc for the year ended 31
December 2012.
John Bowler
Senior Statutory Auditor
for and on behalf of Grant Thornton UK LLP
Statutory Auditor, Chartered Accountants
East Midlands
18 March 2013
Parent company balance sheet as at 31 December 2012

Financial Statements
135150
Notes forming part of the parent company financial statements for the year ended 31 December 2012
1. Profit on ordinary activities is stated after:
2012 2011
£’000 £’000
Depreciation 85 81
Fees payable to the company’s auditor for the audit
of the company’s annual accounts 28 24
Fees payable to the company’s auditor and its
associates for other services:
corporate finance - 5
tax services 10 10
other services 2 4
Operating lease charges 18 11
2. Directors and employees
Staff costs during the year including directors: 2012 2011
£’000 £’000
Wages and salaries 460 395
Social security 61 55
Pension costs 22 43
543 493
The average number of employees of the company during the year was 5 (2011 - 5).
Remuneration in respect of directors was as follows:
2012 2011
£’000 £’000
Aggregate emoluments 383 400
Company pension contributions to a defined contribution scheme 18 53
During the year no directors (2011 - no directors) participated in defined benefit pension schemes and two directors (2011 -
three directors) participated in a defined contribution pension scheme.
During the year no directors (2011 - no directors) exercised share options.
The amounts set out above include remuneration in respect of the highest paid director as follows:
2012 2011
£’000 £’000
Aggregate emoluments 196 173
Company pension contributions to a defined contribution scheme 8 34
Statement of accounting policies - parent company
These parent company financial statements have been prepared in accordance with applicable United Kingdom Accounting Standards (United Kingdom Generally Accepted Accounting Practice) and under the historical cost convention.
On the basis of budgets and cash flow forecasts for at least 12 months from the date of signing these financial statements, the directors have a reasonable expectation that the company has adequate resources to continue in operational existence for the foreseeable future and as such they continue to adopt the going concern basis of accounting in preparing the financial statements.
The principal accounting policies represent the most appropriate policies in accordance with FRS 18 and have remained unchanged from the previous year.
(a) Tangible fixed assets and depreciation
Tangible fixed assets are stated at cost, net of depreciation and any provision for impairment.
Depreciation is calculated to write off the cost of fixed assets less estimated residual value by equal annual instalments over their expected useful lives. Land is not depreciated. The rates applicable are:
Buildings 2%
Plant and equipment 5% to 33.3%
(b) Deferred tax
Deferred tax is recognised on all timing differences where the transactions or events that give the company an obligation to pay more tax in the future, or a right to pay less tax in the future, have occurred by the balance sheet date. Deferred tax assets are recognised when it is more likely than not that they will be recovered. Deferred tax is measured, on an undiscounted basis, using rates of tax that have been enacted or substantively enacted by the balance sheet date.
(c) Retirement benefits
Defined Contribution Pension Schemes
The pension costs charged against operating profits represent the amount of the contributions payable to the schemes in respect of the accounting period.
Defined Benefit Pension Schemes
The company participates in a defined benefit pension scheme but is unable to identify its share of the underlying assets and liabilities. Contributions and pension costs are based on pension costs across the Group as a whole. The pension costs charged against operating profit by the company are the contributions payable to the scheme in respect of the accounting year.
(d) Investments
Within the parent company, investments in subsidiary undertakings are stated at cost less provision for permanent diminution in value.
(e) Financial instruments
The company uses financial instruments, other than derivatives, comprising borrowings, cash resources and various items such as trade debtors, trade creditors etc. that arise from its operations. The main purpose of these financial instruments is to raise finance for the company’s operations. FRS 26 has not been adopted.
Income and expenditure arising on financial instruments is recognised on the accruals basis, and credited or charged to the profit and loss account in the financial period to which it relates.
(f) Leased assets
All leases are operating leases and the annual rentals are charged wholly to the profit and loss account.

Financial Statements
Notes forming part of the parent company financial statements for the year ended 31 December 2012 (continued)
52
6. Investments
Shares in Loans to
subsidiary subsidiary
undertakings undertakings Total
£’000 £’000 £’000
Cost
At 1 January 2012 550 500 1,050
Movement in year - 250 250
At 31st December 2012 550 750 1,300
All companies have only ordinary shares in issue and are registered in England and Wales unless otherwise stated.
The principal trading subsidiary undertakings are disclosed in note 9 of the Group consolidated financial statements.
7. Employee Share Ownership Plan
The details of the Employee Share Ownership Plan are disclosed in note 10 of the Group financial statements.
8. Debtors
2012 2011
£’000 £’000
Amounts falling due within one year
Amounts owed by group undertakings 168 314
Other debtors 32 1
Prepayments and accrued income 27 38
Deferred tax asset 12 12
239 365
53
3. Dividends
No final dividend has been proposed in respect of 2012 or 2011.
4. Profit for the financial year
The parent company has taken advantage of Section 408 of the Companies Act 2006 and has not included its own profit
and loss account in these financial statements.
The profit on ordinary activities after taxation of the company for the year was £289,000 (2011: profit of £145,000).
5. Tangible fixed assets
Land & Plant &
buildings equipment Total
£’000 £’000 £’000
Cost
At 1 January 2012 and 31 December 2012 6,541 422 6,963
Depreciation
At 1 January 2012 172 294 466
Charge for year 54 31 85
At 31 December 2012 226 325 551
Net book value at 31 December 2012 6,315 97 6,412
Net book value at 31 December 2011 6,369 128 6,497
Included within land and buildings above is land with a value of £2,994,000 inclusive of leasehold land of £1,000,000.
The company has charged the freehold properties to secure bank facilities across the Group.

Financial Statements
13
Notes forming part of the parent company financial statements for the year ended 31 December 2012 (continued)
5554
9. Creditors: amounts falling due within one year
2012 2011
£’000 £’000
Bank loans and overdrafts 45 49
Trade creditors 358 437
Amounts owing to group undertakings 101 81
Social security and other taxes 23 56
Accruals and deferred income 192 213
Current taxation - 9
719 845
10. Creditors: amounts falling due after more than one year
2012 2011
£’000 £’000
Bank loans 368 413
Analysis of loans
Included in current liabilities (45) (49)
Wholly repayable within five years 413 462
368 413
Loan maturity analysis
In more than two years but not more than five years 368 413
The bank loan is secured by way of first legal mortgage over certain freehold properties of the Group.
11. Deferred tax asset
Deferred tax provided in the financial statements is set out below and is calculated using a tax rate of 24% (2011 - 25%).
2012 2011
£’000 £’000
Accelerated capital allowances 12 12
The recoverability of the deferred tax asset is dependent on future Group taxable profits.
12. Called up share capitalEquity 2012 2011 Number of Number of
shares £’000 shares £’000
Authorised
Ordinary shares of 10p each 27,500,000 2,750 27,500,000 2,750
Allotted and fully paid
Ordinary shares of 10p each 12,860,629 1,286 12,860,519 1,286
“A” ordinary shares of 10p each 73,698 7 73,808 7
12,934,327 1,293 12,934,327 1,293
During the year 110 “A” ordinary shares were converted into ordinary shares (2011 - nil).
Both classes of share rank pari passu in all respects.
Details of company share options outstanding at 31 December 2012 and treasury shares held by the ESOP are given in
note 11 of the Group financial statements.
13. Reserves Share Capital Other
premium redemption reserve - Profit and
account reserve ESOP loss account
£’000 £’000 £’000 £’000
At 1 January 2012 1,864 132 (909) 5,019
Profit for the year - - - 289
At 31 December 2012 1,864 132 (909) 5,308
The profit and loss account includes non-distributable reserves of £1,371,000 (2011 - £1,381,000) relating to the
consolidated reserves of the ESOP.
14. Reconciliation of movements in shareholders’ funds
2012 2011
£’000 £’000
Profit for financial year 289 145
ESOP movement in year - (7)
Net increase in shareholders’ funds 289 138
Shareholders’ funds at 1 January 2012 7,399 7,261
Shareholders’ funds at 31 December 2012 7,688 7,399

Financial Statements
Notes forming part of the parent company financial statements for the year ended 31 December 2012 (continued)
56
15. Ultimate controlling related party
In accordance with FRS 8 the company is required to disclose its ultimate controlling related party. It is considered that on
31 December 2012 Gutenga Investments PCC Limited was the Group’s ultimate controlling related party by virtue of its
substantial minority shareholding. P K Hems was a director of Gutenga Investments PCC Limited during the year.
16. Operating lease obligations
2012 2011 Land & Land &
buildings Other buildings Other
£’000 £’000 £’000 £’000
Commitments to operating lease payments within
one year are as follows:
In respect of leases expiring
between one and five years - 16 - 11
- 16 - 11
17. Retirement benefits
The company operates funded pension schemes for certain employees and directors. The total contributions to all pensions
by the company for the year was £22,000 (2011 - £43,000).
Defined contribution schemes accounted for £22,000 (2011 - £43,000) of this amount with £nil (2011 - £nil) relating to
defined benefit schemes, where the benefits are based on final pensionable pay.
The pension costs relating to the defined benefit schemes are assessed in accordance with the advice of independent
qualified actuaries using the projected unit method. The latest actuarial valuations of the pension schemes were carried out
as at 27 November 2008. Further details of the actuarial valuation of the group scheme may be found in the consolidated
financial statements of Billington Holdings plc.
18. Related party transactions
During the year the company had one common director with Tolent PLC, Mr P.K. Hems. There have been no transactions
between the two entities in the current period (2011: £nil).
In accordance with FRS 8 Billington Holdings plc is exempt from disclosing related party transactions with its wholly owned
subsidiaries.
19. Contingent liabilities
The company is part of the group cross guarantee to the principal bankers. At the year end there were no outstanding liabilities.

Company Number: 2402219
Year ended 31 December 2012
Report & Financial Statements
Registered Office: Steel House, Barnsley Road, Wombwell, Barnsley, South Yorkshire, S73 8DSt 01226 340666 f 01226 755947 e [email protected] w www.billington-holdings.plc.uk