report 59 - sgi
TRANSCRIPT

LINKÖPING 2001
STATENS GEOTEKNISKA INSTITUTSWEDISH GEOTECHNICAL INSTITUTE
Repo
rt 59
Investigations and Load Testsin Clay Till
ROLF LARSSON

Rapport/Report
Order
ISSNISRN
Project number SGIDnr SGI
©
Swedish Geotechnical InstituteSE-581 93 Linköping
SGILiterature serviceTel: +46 13 20 18 04Fax: +46 13 20 19 09E-mail: [email protected]: http://www.swedgeo.se
0348-0755SGI-R--01/59--SE
103251-9905-310Swedish Geotechnical Institute

STATENS GEOTEKNISKA INSTITUT
SWEDISH GEOTECHNICAL INSTITUTE
Report No 59
LINKÖPING 2001
Investigations and Load Tests in Clay TillResults from a series of investigations and load testsin the test field at Tornhill outside Lund in southern Sweden
Rolf Larsson

SGI Report No 594
This report deals with the results of a research project concerning investigations and evalua-tion of properties in clay till. The investigations in this part of the project have been precededby a comprehensive literature survey reported in SGI Varia 480 �Lermorän - en litteratur-studie. Förekomst och geotekniska egenskaper�. Thereafter, a series of investigations havebeen performed at the research field at Tornhill outside the city of Lund in southwesternSweden. Different types of soundings and in situ tests have been tried out for this type ofsoil. The results have been compared to each other and to results from laboratory tests con-cerning properties and classification of the soils. A number of in situ and laboratory testshave also been performed and compared to the results from large-scale field loading tests.
The research project has been financed jointly by the Swedish Council for Building Research(BFR), Grant No. 1997 0396, and the Swedish Geotechnical Institute.
The author wishes to express his thanks to all those who have participated and co-operated inthe project. Special thanks go to Ann Dueck for her invaluable help in making available boththe test field and results from previous investigations, to Mats Svensson, Magnus Palm andFredrik Leveen at Lund University for their co-operation in the tests concerning the use ofsurface wave and resistivity measurements, to Ulf Ekdahl at PEAB Grundteknik AB formaking available the results from previous pressuremeter tests and the calculation procedure,to Lennart Eriksson at Skanska Teknik AB for providing results from previous pressuremetertests, to the staff at the PEAB supply depot at Stångby outside Lund for their most valuablehelp with all the practical arrangements in connection with the load tests, and to GunnarTornhill at Tornhill Farm for his kind support and co-operation. Many other colleagues, bothat the Swedish Geotechnical Institute and other institutions, have also been involved andcontributed to the project to various extents. Finally, the successful execution of the projectis largely a result of the skill and dedication of the staff at the Institute�s division for Fieldand Measuring Techniques.
Linköping, December 2000
Rolf Larsson
Preface

Investigations and Load Tests in Clay Till 5
Contents
Preface
Reader�s guide to this report ............................................................................................8
Summary .........................................................................................................9
Chapter 1: Introduction ....................................................................................................13Purpose and background of the investigation .............................................................. 13Scope of the investigation ............................................................................................ 13
Chapter 2: The test field ...................................................................................................162.1 Location ....................................................................................................... 162.2 Soil conditions ...................................................................................................16
2.21 Geology ...................................................................................................162.22 Hydrogeology .......................................................................................... 172.23 Initial tests to determine geotechnical conditions .................................... 17
Field tests ................................................................................................. 17CPT-tests ................................................................................................. 19Dynamic probing tests .............................................................................20Field vane tests ........................................................................................20Ground water observations ...................................................................... 20
2.24 Laboratory tests .......................................................................................23Classification ........................................................................................... 23Determination of mineral composition ....................................................24Water content ........................................................................................... 26Soil plasticity ........................................................................................... 26Density .....................................................................................................27Particle density ........................................................................................25Void ratio ................................................................................................. 28Degree of saturation ................................................................................. 28Oedometer tests and triaxial tests ............................................................ 28
2.3 Other previous investigations in the test field ....................................................29
Chapter 3: Field investigations ...................................................................................... 303.1 General ....................................................................................................... 303.2 Groundwater observations ................................................................................. 313.3 Soundings ....................................................................................................... 31
3.31 CPT-tests ................................................................................................. 313.32 Seismic CPT-tests .................................................................................... 323.33 Dynamic probing tests .............................................................................363.34 Soil-rock drilling ...................................................................................... 38

SGI Report No 596
3.4 In situ tests ....................................................................................................... 403.41 SASW measurements .............................................................................. 403.42 Resistivity measurements ........................................................................ 413.43 Field vane tests ........................................................................................ 423.44 Dilatometer tests ...................................................................................... 423.45 Pressuremeter tests .................................................................................. 45
Preparation of test cavities ....................................................................... 45Menard pressuremeter .............................................................................46New pressuremeter .................................................................................. 46Results .....................................................................................................48
Menard parameters ........................................................................ 48Evaluation od creep effets ............................................................. 52Evaluation of shear strength .......................................................... 53Evaluation of moduli at small strains ............................................ 55
3.5 Sampling ....................................................................................................... 653.51 Tube sampling .........................................................................................653.52 Core drilling ............................................................................................. 66
Chapter 4: Experience from the field tests .................................................................694.1 Ground water observations ................................................................................ 694.2 Soundings ....................................................................................................... 69
CPT-tests ....................................................................................................... 69Dynamic probing tests ....................................................................................... 69Soil-rock drilling ................................................................................................ 69Seismic CPT-tests .............................................................................................. 69
4.3 In situ tests ....................................................................................................... 70Resistivity measurements ................................................................................... 70Field vane tests ................................................................................................... 70Dilatometer tests ................................................................................................ 70Pressuremeter tests ............................................................................................. 70
4.4 Sampling ....................................................................................................... 71Open tube sampling ........................................................................................... 71Core drilling ....................................................................................................... 71
Chapter 5: Laboratory tests ............................................................................................ 735.1 Routine tests ....................................................................................................... 73
General ....................................................................................................... 73Classification ...................................................................................................... 73Grain size distribution ........................................................................................ 76Density ....................................................................................................... 76Dry density ....................................................................................................... 76Particle density ................................................................................................... 78Natural water content .........................................................................................78Liquid limit ....................................................................................................... 78Clay content ....................................................................................................... 78Void ratio ....................................................................................................... 79Degree of saturation ........................................................................................... 79
5.2 Oedometer tests .................................................................................................. 81

Investigations and Load Tests in Clay Till 7
5.3 Triaxial tests ....................................................................................................... 90Moduli from triaxial tests ................................................................................. 100
Chapter 6: Experiences from the laboratory tests ..................................................1036.1 Handling of soil samples .................................................................................. 1036.2 Routine tests .....................................................................................................1036.3 Oedometer tests ................................................................................................ 1036.4 Triaxial tests .....................................................................................................104
Chapter 7: Plate loading tests ......................................................................................1057.1 Principle of the plate loading tests ................................................................... 1057.2 Installation of plates and instrumentation ........................................................ 1067.3 Installation of the reaction system ................................................................... 1087.4 Installation of the loading system .................................................................... 109
Measuring system ............................................................................................ 109Loading procedure ........................................................................................... 110
Chapter 8: Results of the plate load tests .................................................................1118.1 General .....................................................................................................1118.2 0.5 x 0.5 metre plate .........................................................................................1118.3 1 x 1 metre plate ............................................................................................... 1168.4 2 x 2 metre plate ............................................................................................... 1208.5 Settlement distribution in the load tests ........................................................... 1248.6 Comments on the plate load tests ..................................................................... 125
Chapter 9: Comparison between predicted and measured settlementsand bearing capacity .................................................................................. 127
9.1 Settlements .....................................................................................................127Oedometer tests ................................................................................................ 127Dilatometer tests .............................................................................................. 127Pressuremeter tests ........................................................................................... 129
Menard procedure .................................................................................. 129Briaud procedure ................................................................................... 129Ekdahl and Bengtsson procedure .......................................................... 135Calculations using the alternative interpretation of thenew pressuremeter tests .........................................................................138Calculations based on the results of triaxial tests .................................. 138Calculation with moduli from seismic cone tests .................................. 138
Comments on the settlement calculations ........................................................ 1429.2 Bearing capacity............................................................................................... 145
Comments on the calculations of bearing capacity .......................................... 148
References .....................................................................................................149
Appendix: Calculation methods for prediction of settlementsand bearing capacity .................................................................................. 155

SGI Report No 598
Why this report is specialThis book contains a review of the usefulness ofdifferent investigation and calculation methodswhen applied to clay tills. It focuses on the prac-tical application and use of the most rationalways of solving the engineering problems en-countered. It describes the possible sources oferror when using different methods, and limita-tions in the ability to penetrate stiffer and coarserclay tills. The report also describes various prob-lems encountered during the execution of the testprogramme.
The goal of this reportThe goal of this report is to recommend suitablemethods for investigating clay tills, the specialprecautions that should be observed when usingthe methods, and the way in which the resultsshould be interpreted. The report also containsrecommendations for the way in which bearingcapacity and settlements for shallow foundationsshould be calculated in this type of soil.
Who should read this report and whyThis report will provide the reader with an in-sight into the advantages and shortcomings of theinvestigation and calculation methods normallyemployed in clay tills.
The report will be useful for geotechnical engi-neers planning investigations for selecting themost appropriate methods, giving instructions onhow they should be carried out, specifying whatsupplementary investigations and observationsshould be made, and stating how the resultsshould be interpreted. It is useful in helping fieldengineers understand how the methods work inthis type of soil, what precautions need to betaken and why it is important to follow certainspecial procedures. It also provides guidance todesigners when selecting calculation methods
and parameters that are relevant for the designlife of the construction.
Finally, the report offers clients for geotechnicalinvestigations and design an insight into the rele-vance of different methods and procedures,thereby enabling a better understanding of thequality of various procedures.
How this report is organisedThe report opens with a summary setting out themain results and recommendations. It continueswith a detailed description of the investigationsand tests performed, and the results of these. Theresults of the investigations and the practicalexperiences and observations gathered in con-nection with these are summarised in specialchapters, which also contain more detailed rec-ommendations on how the investigations shouldbe performed.
Finally, the results obtained with various meth-ods of calculation of settlements and bearingcapacity of shallow foundations are compared tothe results obtained in the large-scale loadingtests in the field. A description of these calcula-tion methods is given in an appendix
Reader�s guide to this report

Investigations and Load Tests in Clay Till 9
Site investigationsClay till can be very heterogeneous and varyingin composition and stiffness. At the same profile,there can be several layers of different origin andcomposition deposited on top of each other. Inthe test field at Tornhill, there are three layerswith different types of clay till on top of bedrockof clay shale. These are from top to bottom; Bal-tic clay till, Mixed clay till and North-east claytill. Only a few types of drilling and soundingmethods can be used to penetrate every type ofclay till. Soil-rock drilling with multi-channelregistration of drilling parameters can be used todetermine the main stratigraphy both in differenttypes of clay till and the underlying bedrock. Acoarse relative measure of certain properties inthe main layers can also be obtained. Of the nor-mal sounding methods, only the super-heavydynamic penetration methods can be used to pen-etrated every clay till, and then only with specialequipment for reduction of the rod friction.
In the softer and more fine-grained Baltic andMixed clay tills, CPT-tests can be used to deter-mine the stratigraphy and shear strength proper-ties. The classification obtained by using theCONRAD presentation and interpretation pro-gramme has been improved with regard to claytills, but it is still somewhat uncertain in this verymixed-grained material. CPT-tests in clay tillsshould be performed with robust cones andshould include measurement of inclination. Thepenetration pore pressures should also be meas-ured, preferably with grease-filled slot filters.
Dilatometers can be pushed into the same type ofclay tills and many of the results appear to berelevant, provided that the proper interpretationmethods are used. However, the experience gath-ered from dilatometer tests in this type of soil isvery limited.
The pressuremeter test is well proven also forclay till, the main problem being to create a goodtest cavity with a minimum of disturbance in thistype of soil. This can be achieved with ordinarymethods in the softer and more fine-grained claytills, but in coarser soils, such as the underlyingNorth-east till, special methods have to be ap-plied.
Some geophysical methods have been tried out.In particular, measurement of the variation in soilresistivity by geo-electrical surface measure-ments was found to be a good supplement to theordinary soundings and drillings for mapping ofthe soil conditions.
Monitoring of the groundwater conditionsshowed that problems often occur with slow re-sponses in open systems and formation of gas inclosed systems. No significant negative porepressures were found, except in the slopes of theexcavation.
Sampling and laboratory testsContinuous sampling can be performed in alltypes of clay till and the underlying bedrock bymeans of core drilling. A 100% recovery ratiowas obtained with the Geobor-S equipment, al-though great skill was required on the part of theoperator to achieve this. The core samples pro-vide a very good basis for a detailed mapping ofthe profile. However, the combined effects ofwater flushing during drilling, bending actionsduring handling and transport in slender plasticcontainers, and the actions necessary for extru-sion and trimming of the samples in the laborato-ry often create excessive disturbance affectingthe strength and stiffness properties of the soil.Disturbed/remoulded samples can be taken byscrew auger, but they may not be fully represent-ative of the soil mass.
Summary

SGI Report No 5910
More undisturbed samples can be taken withthin-walled tube samplers. These samples be-come limited lengths and are not continuous, butthe stiffer tubes and a better handling procedureminimize their further disturbance.
Classification tests in the laboratory are cumber-some since sieving and sedimentation analysesare often required for a proper classification.Determination of relevant bulk densities and wa-ter contents requires fairly large specimens. De-termination of the degree of saturation can oftenbe complex since measuring errors in the deter-mination of specimen volume and wet and drymasses have a considerable influence in verydense soils. The particle densities measured inthe fine-grained material used in the sedimenta-tion analyses may also be non-representative ofthe larger soil mass.
Oedometer tests require large oedometers be-cause of the heterogeneous soil. It is preferableto use oedometers with the same inner diameterof the oedometer ring as the sampling tube, intowhich the specimen can be pushed directly. Thisminimises the trimming and disturbance effects.Because of the large diameters of the specimensand the high stresses required in these tests, highcapacity loading arrangements are required.
Triaxial tests also require large specimens be-cause of the heterogeneous soil. When the soilcontains a large proportion of coarse particles,even the 102 mm diameter core sample may betoo small. However, because of the heterogeneityof the soil, a specimen may also contain separatelayers of different materials, which complicatesthe tests and their interpretation. Trimming isdifficult and should be limited in order to avoidunnecessary further disturbance and drying of thespecimen. Trimming of the end surfaces must beperformed very carefully and often results in thelength of the specimen becoming shorter thanintended. Friction free end caps should be used.The often recommended arrangement with pinsprotruding from the end caps into the specimento prevent it from sliding on the cap cannot beused. It is therefore very important for the end
surfaces to be parallel. The specimen should nor-mally be reconsolidated to its preconsolidationstresses and then brought to its in situ stress con-dition. Care should then be taken in order toavoid overconsolidating the specimen and there-by giving it properties that it does not exhibit inthe field. The often used method of estimatingthe preconsolidation stresses from informationsuch as the results from field vane tests is there-fore questionable, and requires great caution to-gether with close observations of the deforma-tions during the consolidation stages.
Determination of shear strengthDetermination of undrained shear strength inclay till is often performed with Danish fieldvane tests. The spread in the test results is nor-mally large, as was found in this test field. Theundrained shear strength can also be estimatedfrom the net cone resistance in CPT-tests. Anempirical cone factor of about 11 has been re-ported for clay tills from calibrations against theresults from field vane tests. This was found alsoin this investigation. A rough estimate may beobtained also from dynamic probing tests. Theinterpretation of undrained shear strength fromsuch tests proposed by Butcher et al. (1995) onthe basis of results from tests in stiff clays in theU.K. appears to be useful also in the investigatedclay tills.
A number of methods have been proposed forevaluation of shear strength from pressuremetertests. Of these methods, those proposed by Me-nard (1975) and Mair and Wood (1987) yieldedvalues very similar to the field vane tests. TheGibson and Anderson (1961) method yieldedsignificantly higher values and the method pro-posed by Briaud (1992) yielded much lower val-ues. The results from pressuremeter tests aretime-dependent and the above findings were ob-tained for the traditional Menard procedure forpressuremeter tests.
Triaxial tests on specimens reconsolidated for thepreconsolidation pressures determined in oedom-eter tests and then unloaded to in situ stressesyielded undrained shear strengths that were about
Summary

Investigations and Load Tests in Clay Till 11
60 % of those measured by the vane. Strengthssimilar to those measured by the vane wouldhave been obtained if the procedure of estimatingthe preconsolidation pressure empirically fromthe results of the vane tests and consolidating thesamples for these stresses had been employed.However, this would have led to arguing in cir-cles in order to match the two types of determi-nations, which in this context were intended tobe independent.
The plate load tests in the investigation proved tobe drained and no results from an undrained full-scale failure exist to evaluate the relevance of thedetermined undrained strengths.
The drained and effective shear strength parame-ters were determined by triaxial tests. The resultscorrespond well to what is estimated by empiri-cal relations elaborated for other types of clay inSweden, (Larsson et al. 1985). They also appearto be fairly relevant when comparing them withthe results of the large-scale load tests.
Determination ofdeformation characteristicsDetermination of the preconsolidation pressureand oedometer modulus has been performed inoedometer tests in the laboratory. Determinationof the preconsolidation pressure required a largenumber of tests and application of several evalu-ation methods in order to find probable valuesand their variation with depth. The evaluatedpreconsolidation pressures deviated stronglyfrom values evaluated empirically on the basis offield vane tests.
The oedometer moduli evaluated both in the nor-mally consolidated range and in unloading re-loading loops were in good agreement with whatwould empirically be estimated on the basis ofsoil type and grain size distribution. The evaluat-ed parameters enabled a modification of the re-loading moduli with respect, for example, to un-loading of the soil caused by the excavation be-fore installation of the test plates.
The dilatometer tests yielded similar moduli,
even if the relatively low values in the Mixed tillindicated a certain excessive disturbance in thistype of soil. These moduli could not be modifiedin the same way as the oedometer moduli.
Pressuremeter moduli have been evaluated fromMenard type pressuremeter tests and the valuesappear to be appropriate. However, these modulican only be used in the related semi-empiricalcalculation methods.
New pressuremeter equipment and test proce-dures as proposed by Briaud (1992) and Ekdahland Bengtsson (1996) have been tried. Theywere found to yield consistent results and to bewell suited to supplying moduli and other param-eters for calculation of strains in the soil mass.
Tests were also performed with seismic conetests and surface shear wave tests (SASW) inorder to determine the initial shear modulus. Thiswas found to be rather difficult in this heteroge-neous type of soil mass. A relatively consistentpicture could be obtained by compilation of theresults from several seismic cone tests, but thescatter in the results in and between the individu-al tests was unusually large.
Load testsThree large-scale plate load tests were per-formed. The load was applied in steps with dura-tions of mainly 2�6 hours and the results in termsof pore pressure dissipation and time-settlementcurves indicated that the tests could be consid-ered as drained. The load-settlement curves indi-cated yield stresses that corresponded fairly wellto the preconsolidation pressures evaluated in theoedometer tests. However, at this stage also thebearing capacity calculated from the drainedshear strength parameters was approached, and itis difficult to estimate the degree to which thesetwo aspects interact.
The failure loads and the relative settlements fora given ground pressure differed between theplates. Investigations after the tests also showedthat the soil conditions below the plates differedsignificantly in spite of the fact that they were

SGI Report No 5912
relatively closely spaced in a row. In 1974,Hartlén recommended that footings on clay tillshould be designed as stiff continuous slabs orrafts in order to even out the different propertiesin the ground. This recommendation was thusfound to be prudent.
Comparison between calculatedand measured settlementsand bearing capacity
SettlementsThe method yielding the best correspondencebetween measured and calculated settlementswas the traditional method using theory of elas-ticity, moduli from oedometer tests and the em-pirical correction proposed by Jacobsen (1967).However, the cost of obtaining the relevant mod-uli is fairly high.
Relatively good results were also obtained usingthe same method but replacing the oedometer testresults by results from dilatometer tests in thefield, which is considerably less costly.
Traditional pressuremeter tests according to Me-nard (1975) and the related calculation methodyielded settlements that were fairly relevant fornormal ground pressures. However, the curvatureof the load-settlement curve cannot be estimatedby this method. The newer Briaud (1995) methodof evaluating the same type of test and calcula-tion of settlements yielded better correlation withthe measured values throughout the test. Thisassumes that the transformation factors proposedby Larsson (1997) and the time exponent asmeasured in the pressuremeter tests are applied.However, the very large settlements and almostbrittle failure after yield in the tests could not beestimated in this way.
The new calculation method proposed by Ekdahland Bengtsson (1996) using theory of elasticityand moduli varying with strain and time pro-duced relatively good results. However, the re-sults are dependent not only on moduli but alsoon assumptions about stress transfer between theplate and the surrounding soil and the shear
strength in the soil. The original method is basedon new pressuremeter tests according to Briaud(1992) and Ekdahl and Bengtsson (1996). In thiscase, it has also been used together with anothertype of modulus reduction and an alternativeinterpretation of the modulus and its variationwith stress in unloading and reloading. The cor-relation with the measured values deterioratedand improved respectively to some extent. Thecorrelations depend very much on the assump-tions about strength and stress transfer.
The same calculation method has been applied tothe results from the triaxial tests. The calculatedload-settlement relations took the same shape asthe measured relations, but the calculated settle-ments were generally too large.
Finally, the same type of calculations have beenmade with moduli determined in seismic CPT-tests together with empirical relations for theirdecrease with increasing strains and an estimateof probable time effects. Similar load-settlementcurves were obtained compared with the othercalculations, even if the calculated response inthis case generally became stiffer. However, theinfluence from the crude assumptions regardingstrain and time dependency is so great that therelevance of these calculations must be ques-tioned.
Bearing capacityThe ultimate bearing capacity was predicted fair-ly well using the general bearing capacity equa-tion and drained shear strength parameters. Thecorresponding calculations using undrained shearstrength yielded values that were too high. Alsocalculations using the Menard procedure for re-sults from pressuremeter tests yielded exaggerat-ed bearing capacities.
The bearing capacity in terms of allowable settle-ments was predicted fairly well with settlementcalculation methods, which take the curved load-settlement relation into account. The accuracy ofthe predictions follows the ability of the methodsto correctly predict the settlements at fairly largeloads and settlements.
Summary

Investigations and Load Tests in Clay Till 13
Purpose and background of theinvestigationClay tills occur in many places in Sweden al-though the extent and thickness of the depositsare often limited. Since clay till is a fertile soil,most of these areas are used for agriculture. Themost extensive deposits are located in the prov-ince of Skåne in the southernmost part of thecountry.
Construction on and in clay tills using increas-ingly advanced designs has expanded greatly inconnection with the new Öresund Link to Den-mark; both in the development of the infrastruc-ture associated with this project and general de-velopment in the area. This has led to a need forbetter knowledge of the local clay tills and theirproperties, together with efficient methods ofinvestigating them. This investigation addressessome of these questions.
A major part of the research forming the basisfor current practice in the investigation of claytills and calculation of settlements and bearingcapacity was carried out in the 1960�s and early1970�s, primarily by Moust Jacobsen in Den-mark and Jan Hartlén in Sweden. Progress ininvestigation methods and design methods hascontinued since then. The results have partlybeen utilised in large infrastructure projects inDenmark, while research and development withrespect to Swedish conditions has been morelimited. In Sweden, practice when investigatingclay tills has largely relied upon the methods andempirical relations proposed by Hartlén (1974).More traditional investigation methods such asthe Danish field vane test and Menard-type pres-suremeter tests, have also been used to someextent. However, projects concerning the devel-opment of new techniques have recently beeninitiated and carried out by local contractors,primarily PEAB AB and Skanska Teknik AB,
and a test field for investigations in clay till hasbeen established by Lund University. Laboratoryinvestigations performed as part of the lastproject have recently led to a licentiate thesis(Dueck 1998).
The current investigation was carried out in orderto obtain a more comprehensive picture of theusefulness and potential for different investiga-tion methods, both more traditional methods andnewer equipment developed since the 1960�s.The aim was also to make an evaluation of cer-tain newly proposed design methods. Funds forthis purpose were allocated by the SwedishCouncil for Building Research and the SwedishGeotechnical Institute in 1997.
Scope of the investigationThe project began with a thorough survey of theexisting literature on clay tills. The study wassupplemented with international experiencesfrom other stiff clays, which to some extent maybe relevant also for clay tills. On the basis of thisstudy, a mapping of the occurrence, origin andcomposition of clay tills in Sweden was per-formed. The reported experience regarding prop-erties and investigation methods was synthesisedand both parts were reported in SGI Varia No.480 � Lermorän -en litteraturstudie. Förekomstoch geotekniska egenskaper.� (Clay till � a litera-ture survey. Occurrence and geotechnical proper-ties.).
The following part of the project reported herecomprised extensive investigations using everyavailable and possibly relevant method, in addi-tion to large-scale plate loading tests in the testfield for clay till at Tornhill. The test field wasmade available by the Department of Soil Me-chanics and Foundation Engineering at LundUniversity, which is responsible for its adminis-tration.
1. Introduction

SGI Report No 5914
The present investigation has thus been aimed atinvestigating the usefulness of the different in-vestigation methods in clay till and determiningnecessary modifications, if any, to the existinginterpretation methods The aim has also been toinvestigate the present methods of calculating thebearing capacity of shallow foundations and set-tlements in this type of soil. The final goal hasbeen to find a recommendation as to which in-vestigation method or combination of methodsshould be used in different types of clay tills, thespecial precautions that should be observed inconnection with investigations in this type ofsoil, methods/procedures for evaluating differentsoil properties and methods/procedures for calcu-lating bearing capacity and settlements for shal-low foundations.
The test field was well suited for the intendedpurpose since the soil profile is varied and con-tains three of the major types of clay till in thearea: Baltic clay till, Mixed clay till and North-east clay till. This layering sequence is also typi-cal for the area and a large part of the region.However, the variation in properties between thetills is too great to permit the use of most of thetest methods in all three types of till. The North-east till is so coarse and stiff that only a fewmethods can be used to penetrate it. The focus ofthe investigations therefore lies on the upper twotypes of clay till. After the investigations, a seriesof three large-scale plate load tests was per-formed in the test field. The plates were excavat-ed to the normal foundation level. Nevertheless,the zone of influence from these tests was alsoconfined to the upper two types of clay till. Al-though the results were unanimous in certainrespects, the variation both vertically and lateral-ly in the upper soil layers was so great that a de-tailed evaluation of the different design methodscannot be made from this limited number of loadtests.
All references to evaluated properties, soil classi-fications etc. from field and laboratory tests inthis report refer to established methods used inSwedish practice unless otherwise stated.
The test and interpretation methods commonlyused in Sweden are described in the followingpublications:
Introduction

Investigations and Load Tests in Clay Till 15
Test method Test Inter- Publicationprocedure pretation
Dynamic probing test X X Bergdahl (1984). Geotekniska undersökningar i fält. SGI Information No. 2type HfA X Bergdahl et al. (1993). Plattgrundläggning. Svensk Byggtjänst.
CPT-test X Swedish Geotechnical Society SGF (1993). Recommended standard for CPT-tests. X X Larsson (1992 ). The CPT-test. SGI Information No. 15.
Field vane shear test X X Danish Geotechnical Society, DGF Feltekomité (1993). Referenceblad forvingeforsog. Referenceblad 1.
Seismic cone test X Campanella et al (1986). Seismic cone penetration test. Proc. In Situ 86. ASCE.X X Larsson and Mulabdic (1991). Shear moduli in Scandinavian Clays.
SGI Report No. 40.
Dilatometer test X Swedish Geotechnical Society SGF (1993). Recommended standard fordilatometer tests.
X X Larsson (1990). Dilatometerförsök. SGI Information No. 10.Powell and Uglow (1988). The interpretation of dilatometer tests in U.K. clays.Penetration testing in the U.K. Thomas Telford, London.
Pressuremeter test X X Baguelin et al. (1978). The Pressuremeter and Foundation Engineering. Trans.Tech. Publications.
X X Mair and Wood (1987). Pressuremeter testing - methods and interpretation. Ciria.Briaud (1995). Pressuremeter Method for Spread Footings on Sand.
X The Pressuremeter and its New Avenues. Balkema.X Larsson (1997). Investigations and load tests in silty soil. SGI Report No. 54.
New pressuremeter X X Briaud (1992) The Pressuremeter. Balkema.tests X X Ekdahl and Bengtsson (1996) Ny metod att beräkna sättningar vid
plattgrundläggning. Väg- och Vattenbyggaren.Pore pressure X Tremblay (1990). Mätning av grundvattennivå och portryck. SGI Information No. 11measurements
Plate load tests X X Bergdahl (1984). Geotekniska undersökningar i fält. SGI Information No. 2X X Bergdahl et al. (1993). Plattgrundläggning. Svensk Byggtjänst.
Classification X X Karlsson and Hansbo (1984). Soil Classification. Swedish Council of BuildingResearch, T21:1982.
Bulk density X X Swedish standard SS 02 71 14
Water content X X Swedish standard SS 02 71 16
Liquid limit X X Swedish standard SS 02 71 18
Plastic limit X X Swedish standard SS 02 71 18
Sedimentation test X X Swedish standard SS 02 71 24
Oedometer test with X X Swedish standard SS 02 71 29incremental loading
Test and interpretation methods commonly used in Sweden.
SGI Report No 5916
2.1 LOCATIONThe test field is located in southern Sweden northof the city of Lund, about 1 km outside the limitsof the built-up areas of the city. The land belongsto the municipality of Lund and since 1993 hasbeen let to the Department of Soil Mechanics andFoundation Engineering at Lund University as atest field for geotechnical investigations and ex-perimental installations. In the same year, thedepartment thoroughly investigated the field in aproject sponsored by the Swedish Council forBuilding Research (Dueck 1994). Since then, ithas been open for research projects aimed at im-proving knowledge of clay tills, in addition todeveloping design and investigation methodssuch as the current project. The test field is underthe administration of the above department.
The test field is named Tornhill after the neigh-bouring farm. It is a former market garden sur-rounded by cultivated farmland. Most of the fieldis open grass-covered land, but its former use canbe seen from the remaining apple, cherry andpear trees surrounding the open spaces. There isa thin cover of topsoil on top of the clay till andremains of shallow drainage installations canalso be found in the ground. The area is very flat.
2.2 SOIL CONDITIONS
2.21 GeologyThe test site is located in the south-western partof the province of Skåne, where several differenttypes of clay till have been deposited on top ofeach other during different periods of the lastglaciation. This ended approximately 13,000years ago.
The bedrock at the site consists of clay shale.Further away, to the north-east of the site, thebedrock consists mainly of primary crystallinerocks, while to the south-west, it contains mostly
sedimentary rocks such as limestone, chalk andsandstone. The bottom layers of the clay till weredeposited during a period when the ice covermoved in from the north-east and consequentlythey principally contain material originating fromthe types of rock found in this area. The ice cov-er then retreated and readvanced several times,and the direction of the ice movement alsochanged. During the last stage of the glaciation,the ice approached from the south-west directionand consequently the top layers contain a largeproportion of material originating from sedimen-tary rocks. This material was more easily crushedand ground down by the ice and the layers aretherefore also more fine-grained. In the lime-stone and chalk, flint had been created and thetill contains various amounts of this material. InSweden, this clay till is called Baltic clay till,since the ice approached from areas that are nowcovered by the Baltic Sea. The layering of thesoil is complicated by the fact that during certainperiods of the glaciation the area was free fromice and sediments were then deposited. In suc-ceeding stages of the ice movement, these sedi-ments and the upper layers of underlying previ-ously deposited till were partly mixed into thenew deposits of till.
The geological soil profile at the test site can thusroughly be divided into bedrock of clay shale, aNorth-east clay till dominated by material origi-nating from crystalline rock, an intermediatelayer of a mixture of North-east clay till, sedi-mentary deposits of sand and silt and Baltic claytill, and on top, a layer of Baltic clay till. Thecomposition within these main layers varies con-siderably both with depth and laterally owing tothe formation process. In particular, the interme-diate layer may contain layers or pockets classi-fied as clay till, silt till or even sand till, depend-ing on the amount of sediment they contain. Alsopockets of cleaner sand or silt are found. This is
2. The test field
The Test Field

Investigations and Load Tests in Clay Till 17
also valid for the upper layer of Baltic clay tillbut to a lesser extent. The sand and silt pocketsappear to be isolated and unconnected, judgingfrom the results of nearby soundings and fromground water observations during pumping tests.
In the test field, the thickness of the Baltic claytill is about 3 metres and the intermediate layer isalso about 3 metres thick. The thickness of theNorth-east till and the depth to the bedrock var-ies. In the part of the test field where the currentinvestigation was carried out, the North-east tillwas about 8 metres thick and the depth to bed-rock was thus about 14 metres. In a borehole atthe neighbouring farm, the depth to bedrock hadbeen found to be 16 m and on the opposite sideof the test field it had been found to be 24 me-tres.
This type of profile is common for a larger areaencompassing the cities of Malmö, Lund andEslöv. However, the thickness of the differentlayers varies. The combined thickness of theupper two layers varies between about 3 and 15metres, and the thickness of the underlyingNorth-east till varies even more. The composi-tion of the bedrock also varies and over most ofthis larger area it consists of sedimentary rockand mainly limestone. Bearing these variations inmind, the results from the test field may be use-ful in the larger region.
2.22 HydrogeologyThe clay till is very low-permeable. Rain andmeltwater therefore penetrate the ground veryslowly. On the other hand, the underlying bed-rock is normally much more pervious and theground water pressure is here highly affected bythe level of depressions in the ground in the sur-roundings and by the sea level in Öresund bor-dering south-west Skåne. In the test field, thisresults in a free ground water level in the uppersoil layers which varies seasonally betweenground level and a depth of approximately 2 me-tres. In the upper two main layers and the upperparts of the North-east till, the pore water pres-sure increases more or less hydrostatically fromthis free ground water level. At greater depths,
the pressure level drops towards a new and con-siderably lower hydrostatic ground water head inthe bedrock.
Due to the very low porosity of the soil and ahigh degree of saturation, the amount of waterrequired for changing the ground water level isvery limited and thereby also, for example, theamount required for changing the bearing capaci-ty in the upper layers. Since the former shallowdrainage system has ceased to function, the partsthat are slightly shallower than the surroundingarea often become flooded during snow meltingand periods of heavy rain.
2.23 Initial tests to determine thegeotechnical conditions
Field testsThe geotechnical conditions in the test field wereinvestigated in 1993 (Dueck 1994). CPT-testscovering the main open area were performed in agrid pattern with 12 metres between the testpoints, Fig. 1. Supplementary tests were alsoperformed in other parts of the field. Dynamicprobing tests were performed at three points andthe level of the bedrock was determined on oneside of the field with rock drilling equipment.The undrained shear strength of the clay till wasmeasured at two points in the field using a Dan-ish field vane.
The ground water conditions were observed witha number of piezometers and in open holes atvarious locations in the field.
Disturbed samples were taken by continuousflight auger down to 10 metres depth at fourpoints. This sampling has been supplemented by�undisturbed� sampling in a later investigationby Dueck (1997). The latter samples were takenwith both a Danish type of piston sampler(American tube) and by core drilling using atriple tube core sampler of the Geobor-S type.

SGI Report No 5918
Fig
. 1.
Layo
ut o
f the
test
fiel
d an
d th
e in
vest
igat
ion
poin
ts.
The Test Field

Investigations and Load Tests in Clay Till 19
CPT-testsAltogether, 25 CPT-tests were performed in theinitial investigations. The tests were performedusing a standard 5-ton CPT-probe with 1000mm2 cross sectional area. The pore pressure wasmeasured at the standard position behind theshoulder of the tip using a slot filter filled withgrease, which has become common practice inCPT-tests in this type of soil.
The test results generally confirmed the pictureof the layering in the profile with a thin layer oftop soil on top of about 3 metres of a relatively
stiff soil, followed by about 3 metres of a some-what less stiff layer. Thereafter, the stiffness ofthe soil rapidly increased and all tests stopped atabout 7 metres depth, below which penetrationwas impossible with the equipment used, Fig. 2.Apart from this unanimous general picture, theresults were heavily scattered with large dips andpeaks in an inconsistent pattern. Part of theseanomalies can be expected to be related to coarseparticles of gravel and stone sizes, and part maybe assumed to originate from embedded pocketsof sand and silt. However, it is very difficult todistinguish between these possibilities.
Fig. 2. Compilation of the results from the CPT-tests in the test field.

SGI Report No 5920
Existing charts for classification of soils on thebasis of results from CPT-tests indicated soilsranging between silty clay and sand, with a con-centration on silt. Since these charts classify �soiltype behaviour� rather than grain size distribu-tion and since clay tills in many respects behavein a similar manner to silt, this may be seen as arelatively fair classification. Since then, the re-sults from these tests together with other tests inclay till and the results from numerous investiga-tions in silts have enabled an improved classifi-cation to be made. This has been incorporated inthe CPT programme CONRAD, used mainly inSweden, Fig. 3. However, the possibilities ofseparating various types of clay till from eachother and from silt on the basis of CPT-testsalone are still limited.
Dynamic probing testsThe dynamic probing tests were performed witha rather crude method and did not yield any de-tailed information, except that the penetrationresistance increased rapidly from about 7 metresdepth. With this method, the tests penetrated toabout 8 metres depth, i.e. slightly more than theCPT-tests.
Field vane testsThe field vane tests showed a profile with anundrained shear strength of generally 300 to 400kPa between 1.5 and 3 metres depth, dropping toabout 200 kPa between 3 and 5 metres depth andthen increasing again. The scatter in the meas-ured strength values was considerable. A com-parison between these results and the resultsfrom the CPT-tests indicates that a cone factorNKT of between 10 and 12 would be appropriate,Fig. 4. Cone factors of this size have been sug-gested from various Danish investigations inclay till, (Kammer Mortensen et al 1991, Jör-gensen and Denver 1992, Luke 1996).
Ground water observationsThe pore pressures and groundwater levels werestudied in six closed piezometers of the BATtype and in three open standpipes installed atdifferent locations in the test field and at depthsbetween 3 and 5 m. The results were not quiteconsistent. This was probably due to problemswith a considerable time lag in the open stand-pipes and with formation of gas at two of theclosed piezometers. However, after an observa-tion period of one year, it was concluded that theground water table in this part of the profile ap-peared to vary between ground level in earlyspring and a depth of about 2 m during summerand early autumn.
The Test Field

Investigations and Load Tests in Clay Till 21
Fig. 3. Examples of CPT-test results presented and evaluated using the CONRAD programme.a) Test point 412.

SGI Report No 5922
Fig. 3. Examples of CPT-test results presented and evaluated using the CONRAD programme.b) Test point 413.
The Test Field

Investigations and Load Tests in Clay Till 23
2.24 Laboratory tests
ClassificationThe soil samples taken with the continuous flightauger were carefully divided into different layerswith different compositions and the thickness ofthe individual layers was measured. Each layerwas then classified with respect to colour andsoil type. The profiles were found to consist of0.3 � 0.4 metre of black topsoil on top of 2.5metres of brown clay till. Further down, the claytill becomes grey and below about 7 metres it isdark grey, with the colour strongly affected bythe underlying clay shale. Embedded in the claytill are layers or lenses of silt, sand or gravel. Atsome levels, the material has been lost and maybe assumed to have been friction soil. The thick-ness of these layers range from a few millimetresto a few decimetres. The amounts and levels varyfrom point to point. No exact measure of theamount of such coarser layers can be given, but
from the reported classification it may be esti-mated that layers of silt and coarser soil consti-tute about 5 � 20 % of the profiles down to 7metres depth.
Only the layers of clay till have been examinedfurther. They contain varying amounts of sandand silt, as well as some gravel. Cobbles andstones, if present, are not taken by the auger butremain in the ground. In general, the grain sizesin the till increase with depth, but in the upper 6metres there is a large variation. Variousamounts of chalk were also observed in this ma-terial. Below about 6 metres depth, the materialbecomes significantly coarser, at the same timeas it changes colour and reveals a significantamount of gravel size particles of mainly clayshale. The grain size distribution for 32 differentlayers was determined by sieving and sedimenta-tion analyses. Fig. 5.
Fig. 4. Results from the field vane tests compared to an average curve for the CPT tests.The shear strength from the CPT-tests has been evaluated from cu=(qT- s´v0)/NKT.
0
1
2
3
4
5
6
7
8
9
0 200 400 600 800 1000
6KHDU�VWUHQJWK��N3D
'HSWK�P
Filtered mean value CPT,cone factor NKT=12
Filtered mean value CPT,cone factor NKT =10
Vane test point 478
Vane test point 414

SGI Report No 5924
Determination of mineral compositionThe mineral composition was determined forboth the coarser grains in the gravel fraction andthe finer clay particles. For the gravel fraction,100 grains with sizes between 2 and 6 mm wererandomly selected from each tested layer. A pet-rographic analysis was then made of each grainto determine its mineral content. The grains weredivided into granite, dolorite, flint, clay shale,limestone, sandstone, quartz and calcite, and therelative percentages were determined in 26 dif-ferent layers. From these determinations, it wasobserved that there is a significant change in thecomposition of the grains at a depth of 6 � 7 me-tres. Above this level, there is a large content oflimestone and flint, which is not found below thisdepth. Instead, the grains originating from clayshale and crystalline rock are totally dominant atgreater depths, Fig. 6.
The mineral composition of the particles in theclay fraction was analysed by X-ray diffraction.Such determinations were made on material fromsix selected layers. These analyses are qualita-tive rather than quantitative and no exactamounts or percentages can be determined. Itwas found that significant amounts of illite andkaolinite were present in all the samples. Similaramounts of chlorite were found in all samples,except in the shallowest sample from about 1.5metre depth. Varying amounts of smectite werealso found in most samples and small amounts ofquarts and feldspar were found in all samples. Avery schematic picture of the variation is shownin Fig. 7.
Fig. 5. Measured grain size distributions in the clay till (Dueck 1994).
The Test Field

Investigations and Load Tests in Clay Till 25
Fig. 6. Schematic variation in the mineral composition of the gravel size particles.
Fig. 7. Schematic variation of the mineral content in the clay size particles.The relative amounts are not to scale.
0
1
2
3
4
5
6
7
8
0 10 20 30 40 50 60 70 80 90 100
5HODWLYH�DPRXQW���
'HS
WK��P
Clay shale
Sandstone
Limestone
Quartz
Granite
Flint and others
0
1
2
3
4
5
6
7
8
0 1&RQWHQWV
'HS
WK��P
Smectite Chlorite Illite/Mica KaoliniteQuartz
andfeldspar

SGI Report No 5926
Water contentThe natural water content was determined in thelayers of clay till. Although there is a large scat-ter in these determinations, the water contentgenerally decreases with depth from between 13and 23 % in the upper 3 metres to about 10 % at8 metres depth. Below this level, it appears to befairly constant, but the determinations are fewand the scatter is still considerable. At some lev-els, the initial determinations have later beensupplemented by determinations from samplestaken with piston sampler and by core drilling.The values from the latter determinations gener-ally agree with the results from the first tests, butdo not reduce the scatter, Fig. 8.
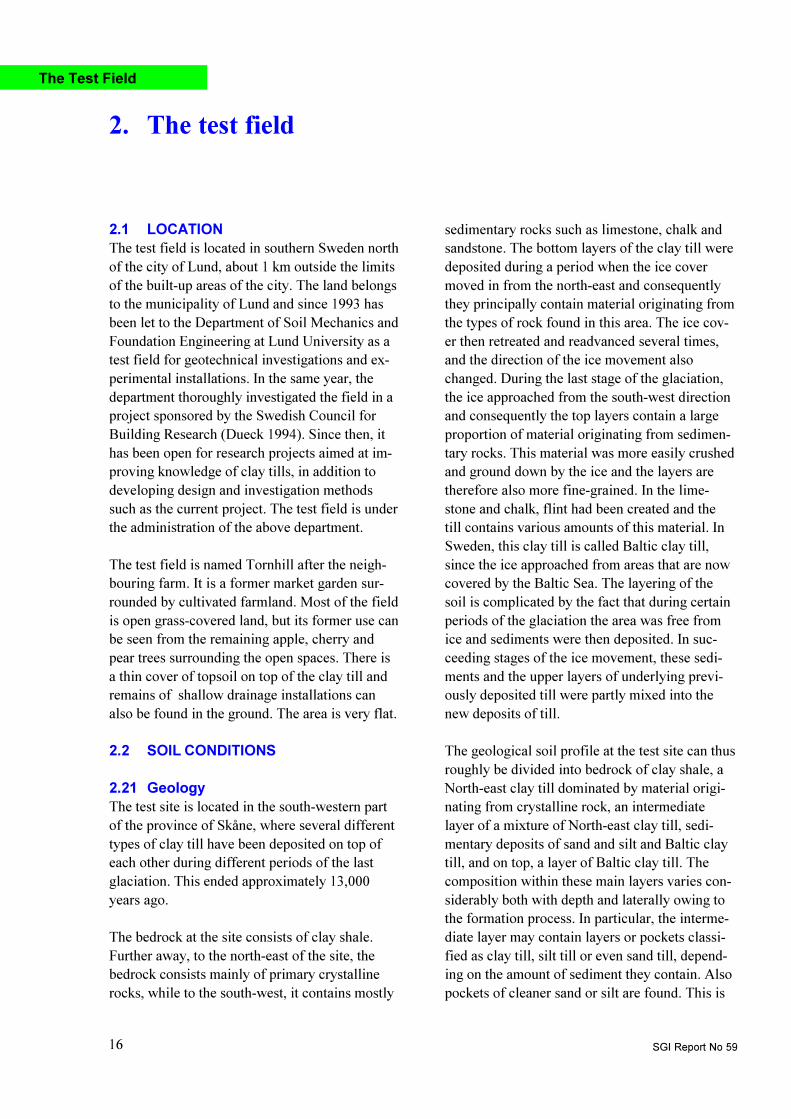
Soil plasticityThe liquid limit was measured for most of thedifferent clay till layers and the plastic limit wasmeasured for a few of them. Similar to the watercontent, there is a large scatter in the determina-tions of the liquid limit, which varies between 20and 45 % in the upper layers and decreases toabout 20 % at 8 metres depth, Fig. 9a. The plas-ticity index was found to vary between 5 and25 %. Dueck (1994) found a good correlation
between the clay content and the liquid limit,Fig. 9b. The plasticity index is normally not de-termined or used in Swedish practice, but accord-ing to the determinations made, the plasticityindex in the clay till at Tornhill can be estimatedfrom the liquid limit using the formula I
P =
0.79 (wL-0.12), Fig. 9c.
Fig. 8. Water contents measured in thesamples from the clay till.
0
2
4
6
8
10
12
0 10 20 30 40 50
'HSWK��P
WL IP
0
2
4
6
8
10
12
0 5 10 15 20 25
:DWHU�FRQWHQW���
'HSWK��P
WN
WP
WN, American tubes
WN, Geobor-S
The Test Field
Fig. 9. Consistency limits for the soil profileat Tornhill.a) Measured liquid limits and plasticityindex.
Fig. 9. Consistency limits for the soil profileat Tornhill.b) Relation between liquid limit andclay content.
Investigations and Load Tests in Clay Till 27
0
5
10
15
20
25
30
0 10 20 30 40 50
Z/���
,3���
y=0.79(x-12)
Fig. 9. Consistency limits for the soil profileat Tornhill.c) Relation between liquid limit andplasticity index.
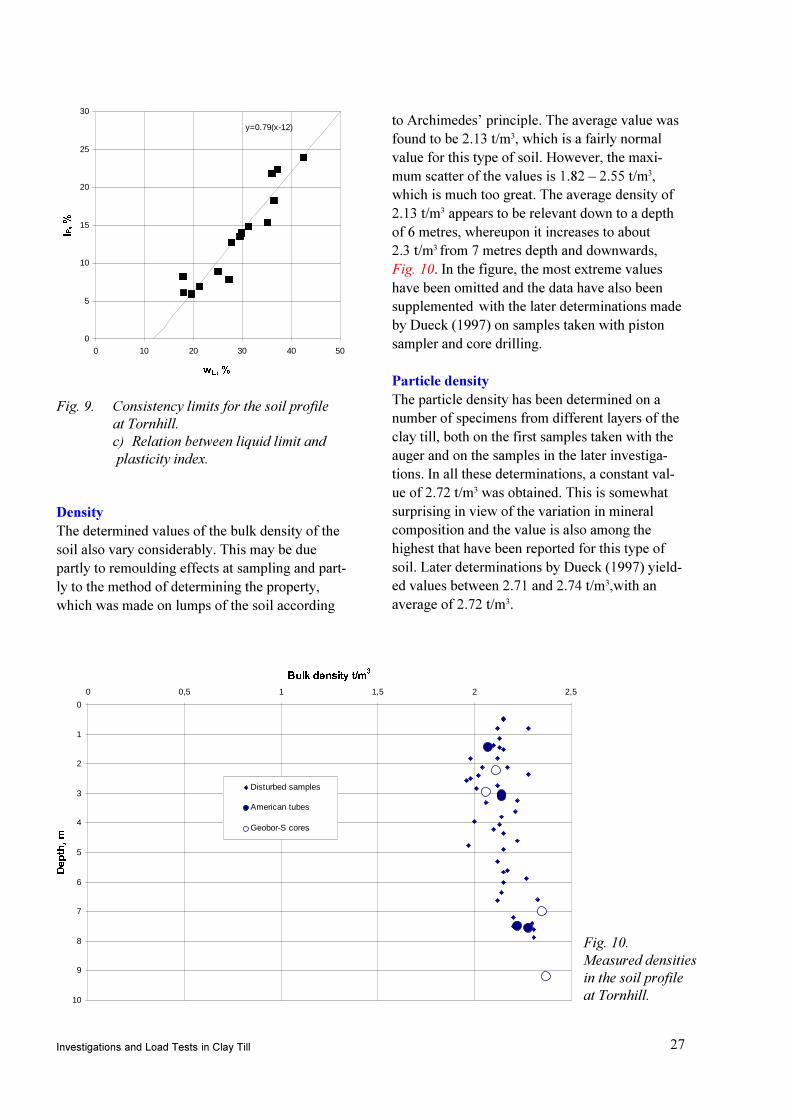
Fig. 10.Measured densitiesin the soil profileat Tornhill.
DensityThe determined values of the bulk density of thesoil also vary considerably. This may be duepartly to remoulding effects at sampling and part-ly to the method of determining the property,which was made on lumps of the soil according
to Archimedes� principle. The average value wasfound to be 2.13 t/m3, which is a fairly normalvalue for this type of soil. However, the maxi-mum scatter of the values is 1.82 � 2.55 t/m3,which is much too great. The average density of2.13 t/m3 appears to be relevant down to a depthof 6 metres, whereupon it increases to about2.3 t/m3 from 7 metres depth and downwards,Fig. 10. In the figure, the most extreme valueshave been omitted and the data have also beensupplemented with the later determinations madeby Dueck (1997) on samples taken with pistonsampler and core drilling.
Particle densityThe particle density has been determined on anumber of specimens from different layers of theclay till, both on the first samples taken with theauger and on the samples in the later investiga-tions. In all these determinations, a constant val-ue of 2.72 t/m3 was obtained. This is somewhatsurprising in view of the variation in mineralcomposition and the value is also among thehighest that have been reported for this type ofsoil. Later determinations by Dueck (1997) yield-ed values between 2.71 and 2.74 t/m3,with anaverage of 2.72 t/m3.
0
1
2
3
4
5
6
7
8
9
10
0 0,5 1 1,5 2 2,5
%XON�GHQVLW\�W�P�
'HSWK��P
Disturbed samples
American tubes
Geobor-S cores

SGI Report No 5928
Void ratioThe calculated void ratio in the clay till variesbetween 0.4 and 0.6 in the upper part of the pro-file and decreases to about 0.3 from 7 metresdepth and downwards. Both the dry density andthe particle density affect the calculated voidratio. An excessively high particle density resultsin an exaggerated calculated value of the voidratio. In Fig. 11, the most extreme values, whichare also related to extreme values of bulk density,have been omitted .
Degree of saturationThe degree of saturation has been calculatedfrom the determinations mentioned above. It issensitive to a number of parameters and valuesbetween 55 and 190 % have been calculated inthis way. The extreme values relate to extremevalues of bulk density. After a separation of theobviously erroneous values, the remaining datayield saturation ratios between 80 and 100 %.Also the calculated values from the latter sam-ples taken with piston sampler and core drillingare in the same range, Fig. 12. In this case, themaximum possible error resulting from an exces-sive particle density is about 10 %. The resultsthus indicate that the clay till has a high degree of
saturation, but that it is not necessarily fully satu-rated, even below the free ground water level.Hartlén (1974) has previously reported similarobservations. However, these findings for theclay till in the test field were not supported in thepresent investigation.
Oedometer tests and triaxial testsOedometer tests and triaxial tests, mainly on twolevels in the test field, have been performed byDueck in the latter investigation reported in1997. The tests were performed at Aalborg Uni-versity using the techniques and equipment de-veloped at this institution. The results showed alarge difference in the preconsolidation and theshear strength between the upper Baltic till andthe underlying North-east till. The soil in theprofile is overconsolidated or heavily overcon-solidated. The results will be discussed furthertogether with those from the present investiga-tion.
Fig. 11. Calculated values of the void ratio in the soil profile at Tornhill.
0
1
2
3
4
5
6
7
8
9
10
0 0,1 0,2 0,3 0,4 0,5 0,6 0,7 0,8 0,9 1
9RLG�UDWLR
'HSWK��P
Disturbed samples
American tubes
Geobor-S cores
The Test Field

Investigations and Load Tests in Clay Till 29
0
1
2
3
4
5
6
7
8
9
10
0 20 40 60 80 100 120
6U���
'HSWK��P
Disturbed samples
American tubes
Geobor-S cores
2.3 OTHER PREVIOUSINVESTIGATIONSIN THE TEST FIELD
Apart from the two investigations by Dueck(1994 and 1997), the test field has been used fora number of investigations before the presentproject. In 1995, Jonsson et al used the field fortesting the Geobor-S coring system and develop-ing the technique for taking continuous samplesin clay till. The results from that investigationform a basis for the technique used for samplingwith the Geobor-S system in later investigationsand among them also the present project.
The field has since then been used in two investi-gations aimed at developing the technique forpressuremeter testing in clay till. In the firstproject, (Ekdahl and Bengtsson 1996), a compre-hensive test series was performed in the Balticclay till at about 2 metres depth, together with aseries of small-scale plate load tests. These testsused a TEXAM pressuremeter and mainly fol-lowed the guidelines given by Briaud (1992).The results led to a proposal for a new testing
Fig. 12. Calculated values of degree of saturation in the soil profile at Tornhill.
technique, a model for the variation in elasticmodulus at unloading and reloading of the Balticclay till and a proposal for a new method of cal-culating settlements of shallow foundations inclay till. The proposed testing technique hasmainly been followed in one of the pressuremetertest programmes in the present project.
The second project in the test field concerningpressuremeter testing was carried out by SkanskaTeknik (1998). In this project, a self-boringCambridge pressuremeter was used and the aimwas to investigate the effectiveness of the self-boring technique and the stress-strain propertiesof the soil. The results showed that in this type ofmaterial, which is relatively rich in flint andgravel size particles, the self-boring techniquewas successful at only half of the test points, inspite of the fact that drilling was only performeddown to about 2 metres depth. At the pointswhere it was possible to install the probe, thetests showed that the stress strain curve could berepresented by a hyperbolic function such asthose proposed by Duncan and Chang (1970) andHardin and Drnevich (1972).

SGI Report No 5930
3.1 GENERALThe field investigations in the present projectcomprised ground water observations, soundings,in situ tests and sampling. The purpose of theseinvestigations was to determine:
� the applicability of different methods andequipment to these particular types of soil
� the relevance and repeatability of the results
� the quality of the soil samples obtained withdifferent methods
The results of the field investigations and thelaboratory tests on the samples were then to becompared to each other and to the results of thelarge-scale load tests. In order to obtain as rele-vant data as possible, most of the test points werelocated along the perimeter of the test area withan even spacing, Fig. 13. However, certain oper-ations had to be moved some distance away. Forexample, sampling with the Geobor-S core drill-ing equipment, which uses large amounts of wa-ter for flushing while drilling, was performedsome 15 metres away. Some of the pressuremetertests also had to be moved to a safe distance fromthe machinery installing the tie rods for the sub-sequent load tests.
3. Field investigations
Field Investigations
Fig. 13. Layout of the field tests.

Investigations and Load Tests in Clay Till 31
3.2 GROUNDWATER OBSERVATIONSThe ground water level had previously been ob-served to vary between ground level and a depthof 2 metres, being highest from late autumn toearly spring and lowest during summer and earlyautumn. After the first year with frequent obser-vations, the readings had become more sporadic.In early spring 1999, the ground water observa-tions were renewed before the field investiga-tions started. These were scheduled to take placelater in the spring and the plate load tests were tobe performed during the summer. Before per-forming the actual groundwater observations, thefunction of the various observation points waschecked. The pipes for the piezometers wererinsed and flushed to remove accumulated dirt,and attempts were also made to remove any en-trapped gas. The water levels in the open stand-pipes were altered and the process of re-estab-lishing natural conditions was studied. It wasobserved that the function of the piezometers inmany cases was uncertain and that it took a con-siderable time for the water levels in the openstandpipes to return to their original positions.
The spring of 1999 was wet in this part of thecountry. When the actual observations started inMarch, the lower parts of the area were floodedand most of the piezometers and open standpipesshowed groundwater levels close to the groundsurface. These conditions prevailed throughoutthe period of investigation and sampling activi-ties. The ground surface dried out during drierspells, but was repeatedly soaked by heavy rain-storms. At the end of May, when the preparationsfor the load tests approached, an attempt wasmade to lower the ground water table locally inthe area chosen for the present investigation.This was made by excavating two pumping holesdown to about 2 metres depth on each side of thetest area. The effect of continuously pumping outthe water in these holes was very limited. In spiteof the fact that a large pocket of sand was foundin one of the holes, these efforts had practicallyno effect on the water levels at the surroundingobservation points, i.e. the piezometers and openstandpipes and all the open holes from the vari-ous investigations. This was also the case when
the distance between the pumping hole and theobservation point was only a few metres.
The load tests were to be performed during thesummer, which was the period when the groundwater level had been expected to be below theexcavation depth. However, these more favoura-ble conditions did not occur, neither could theybe achieved by artificial means within the availa-ble time. The excavation for the load tests there-fore had to be carried out under more normal wetconditions and the groundwater had to be dealtwith in a conventional way.
3.3 SOUNDINGS
3.31 CPT-testsAn extensive programme of CPT-tests had al-ready been performed. These tests had been per-formed with an ordinary 5-ton probe and Swed-ish lightweight crawler drill rig. The pore pres-sure measurements during the tests had beencarried out using a slot filter and grease as pres-sure transmitting medium. All these tests stoppedat about 7 metres depth owing to insufficientpenetration force.
The new CPT-tests were performed in the areachosen for the present investigation to ensure thatthe conditions here were the same as in the restof the field. Four tests were performed, one ineach corner of the test area. At the same time, theinvestigations were also aimed at determiningthe possibility of penetrating further using heavi-er machinery and a more robust probe. For thispurpose, a 10-ton probe and a heavy crawler rigwere used. Investigations were also made to findwhether it would be possible to register the cor-responding pore pressure response using ordi-nary filters and glycerine in the probe.
The CPT-tests penetrated to about the samedepth as before. A check of the results showedthat the reason for the stop was not that the tipresistance was too great, but that the side frictionwas very high. In fact, the side friction was sohigh that it would not be worthwhile trying toinject drilling mud above the probe because the

SGI Report No 5932
friction against the probe itself would still be toohigh for the maximum capacity of the probe andthe pushing equipment. The maximum capacityof the friction sleeve had already been reached. Itwas thus concluded that CPT-tests penetrate theBaltic clay till and the intermediate mixed claytill, but not the North-east till. The use of strong-er cones, heavier pushing equipment and lubrica-tion of the drill rods is unlikely to change thissituation as long as the standard requirements forthe CPT-tests have to be fulfilled.
The results from the new CPT-tests were alsofully compatible with the previous tests with re-spect to the variation in tip resistance and sleevefriction. The same average pattern was obtainedand the same irregularities in terms of occasionalpeaks in the tip resistance were found, Fig. 14.The evaluation of undrained shear strength usinga cone factor N
KT of 11 yielded the same stiffer
zone between 1.5 and 2.5 metres depth, with astrength of about 300 kPa. The evaluatedstrength then became constant around 180 kPa
between 3 and 6 metres depth, whereupon it rap-idly increased.
The new CPT-tests also confirmed previous find-ings that the ordinary pore pressure measuringsystem with a porous filter and a liquid as pres-sure transmitting medium performs very poorlyin this type of soil. This result was obtained inspite of great efforts to saturate the fluid, filterand system within the practical limits that usuallyapply to ordinary investigations on land.
3.32 Seismic CPT-testsIn the new series of CPT-tests, measurement ofthe shear wave velocity was performed with aseismic CPT probe and related equipment fromGeotech AB. The tests were performed in theusual way as described by Campanella et al(1986). This means that the penetration wasstopped at regular intervals and the travel timefor the shear wave from the ground surface to thecurrent depth of the probe was measured. Thewaves were generated by horizontal blows froma sledgehammer on a beam pressed against theground surface. The measurements at each levelwere duplicated with blows on the beam-endsfrom opposite directions. Because of the shallowdepth of penetration and the heterogeneous soilmass, a distance of 0.5 metre between the meas-uring depths was chosen. This was intended togive a more detailed picture of the variation inthe soil layers, but tended instead to make theinterpretation more problematic.
The signals in this material contained a largeamount of noise, which made a filtering processnecessary. A filtering and evaluation programmewritten by Eric Baziw for Geotech AB was usedfor this purpose. After filtering, the signals be-came clear, although some problems still re-mained when examining the results in detail,Fig. 15. Considering the whole soil volume, theresults were uniform, with almost exactly thesame travel time for the shear wave from theground surface down to 7 m depth. However,when studying the travel times between the dif-ferent test levels within the soil mass, certainanomalies were observed. It thus happened that
Field Investigations
Fig. 14. Results from the four CPT-tests in thecorners of the test area.
Tip resistance qT (MPa) Undrained shear strength tgu (kPa)

Investigations and Load Tests in Clay Till 33
the travel time down to one level could be shorterthan the travel time to the level just above. Fur-thermore, this could be true for waves createdwith blows from one direction, but not from theopposite direction. It is not possible to judgewhether this is a result of all the embedded ob-jects in the soil mass, such as silt and sand pock-ets, stones and possibly slices of rock material,which can be the same size as the distance be-tween the test depths. The problem was largelyovercome by increasing the distance between thecompared depths to 1 metre, but a fully uniformpicture required averaging over the whole soillayer from 0 to 7 metres depth. A considerableamount of averaging was thus required to obtaina clear picture.
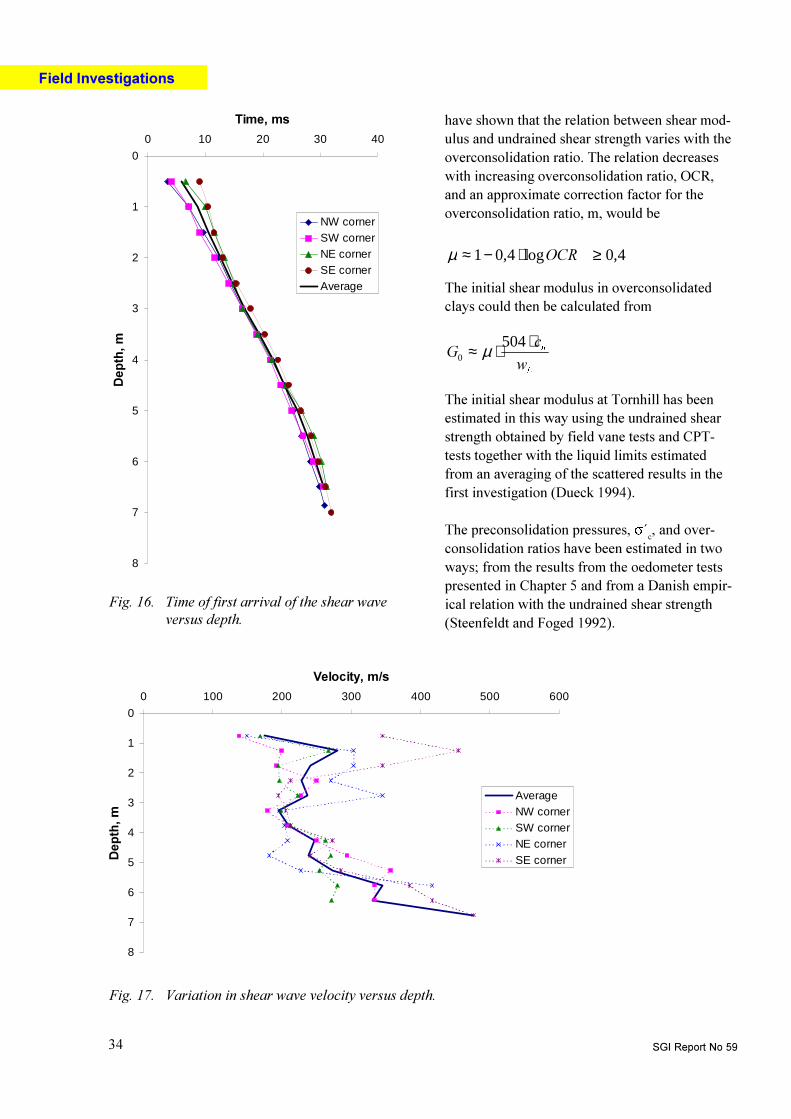
The results from the different holes differ consid-erably also after a certain averaging, but plottedtogether they still yield a fairly consistent picture.The general trend for the time of first arrival ver-sus depth is the same in all four tests, Fig. 16. Inspite of the scatter, the evaluated shear wave
velocities in the different depth intervals alsoyield a consistent picture, which strongly resem-bles the evaluated variation in undrained shearstrength, Fig. 17.
The shear wave velocity, vs, is used to calculate
the initial shear modulus by the relation G0=r vs2.
In this case, the average values of vs have been
used. The variation in initial shear modulus thusestimated is shown in Fig. 18.
The initial shear modulus for other Scandinavianclays has been found to be related to the und-rained shear strength and the liquid limit of thesoil (Larsson and Mulabdic 1991). The initialshear modulus can thus be estimated from
/
X
ZF
*⋅≈ 504
0
This relation was obtained mainly in normallyconsolidated or only slightly overconsolidatedsoils. Investigations by Andersen et al (1988)
Fig. 15. Arrival times at different depths in a seismic CPT-test at Tornhill.
SGI Report No 5934
Field Investigations
0
1
2
3
4
5
6
7
8
0 10 20 30 40
7LPH��PV'HS
WK��P
NW cornerSW cornerNE cornerSE cornerAverage
Fig. 17. Variation in shear wave velocity versus depth.
Fig. 16. Time of first arrival of the shear waveversus depth.
0
1
2
3
4
5
6
7
8
0 100 200 300 400 500 600
9HORFLW\��P�V
'HS
WK��P
AverageNW cornerSW cornerNE cornerSE corner
have shown that the relation between shear mod-ulus and undrained shear strength varies with theoverconsolidation ratio. The relation decreaseswith increasing overconsolidation ratio, OCR,and an approximate correction factor for theoverconsolidation ratio, m, would be
4,0log4,01 ≥⋅−≈ 2&5µ
The initial shear modulus in overconsolidatedclays could then be calculated from
/
X
ZF
*⋅⋅≈ 504
0 µ
The initial shear modulus at Tornhill has beenestimated in this way using the undrained shearstrength obtained by field vane tests and CPT-tests together with the liquid limits estimatedfrom an averaging of the scattered results in thefirst investigation (Dueck 1994).
The preconsolidation pressures, s´c, and over-
consolidation ratios have been estimated in twoways; from the results from the oedometer testspresented in Chapter 5 and from a Danish empir-ical relation with the undrained shear strength(Steenfeldt and Foged 1992).

Investigations and Load Tests in Clay Till 35
Fig. 18.Variation in initial shearmodulus with depth at Tornhill.
0
1
2
3
4
5
6
7
8
0 100 200 300 400 500 600
,QLWLDO�VKHDU�PRGXOXV��*���03D
'HS
WK��P
Seismic cone tests
Estimated trend
85.0/1
00 ´4.0
´´
⋅
≈σ
σσ X
F
F
These two ways of estimating the preconsolida-tion pressure yield very different results in thiscase, with the latter method giving preconsolida-tion pressures 1.5 �2.5 times higher than the oed-
Fig. 19.Comparison between empiricallyestimated shear moduli and resultsfrom the seismic cone tests.
0
1
2
3
4
5
6
7
8
0 200 400 600 800
,QLWLDO�VKHDU�PRGXOXV��*���03D
'HS
WK��P
Estimated trend from seismic cone tests
Empical values using results fromoedometer tests
Empirical values using empirical relationfor overconsolidation
ometer tests, which will be discussed later. How-ever, the sensitivity of the correction factor forthe initial shear modulus is limited for changes inoverconsolidation ratios of this size. The initialshear modulus has been calculated using bothtypes of estimation of the preconsolidation pres-sure, and the results are shown and compared tothe results of the seismic cone tests in Fig. 19.

SGI Report No 5936
As can be seen in the figure, a consistent picturewas obtained of the variation in the initial shearmodulus. However, it must be emphasised thatthe procedure for obtaining this picture was notstraightforward. The estimation of the shearmodulus from the seismic cone tests involvedaveraging the results from several tests and theempirical estimation involves averaging a largenumber of determinations of shear strength andliquid limit and the combination of two empiricalrelations. The apparently very good correlationbetween the measured and the empirically esti-mated values in the figure may thus not be typi-cal.
3.33 Dynamic probing testsDynamic probing tests were performed in boththe initial investigation (Dueck 1994) and thecurrent investigation. In both cases, the testswere performed according to the Swedish Hfamethod, (Bergdahl 1984). This method uses a tipwith a diameter of 45 mm and cone angle of 90°,and a weight of 63.5 kg with a free fall of 0.5 m.Penetration is registered as the number of blowsfor each 0.2 metre of penetration. The method
falls between the international DPH and DPSHmethods. The specific work per blow is 167, 200and 238 kJ/m2 for the DPH, Hfa and DPSHmethods respectively.
Investigations in stiff clay and clay till by Butch-er et al (1995) have shown that lighter dynamicprobing methods are to be preferred since theyyield a better resolution of the soil properties.However, the initial investigations using the Hfamethod penetrated only to about 8 metres, whichwas marginally more than the CPT-tests. Onereason for this was the very high friction againstthe rods. The Hfa method stipulates that the fric-tion against the rods should be measured at regu-lar intervals and accounted for in the interpreta-tion. A special torquemeter has been designed forthis purpose. In the initial investigations, a muchcruder and subjective measure was used to esti-mate the rod friction. However, also this methodclearly showed that the friction was considerable,Fig. 20. Butcher et al (1995) recommend a re-duction of the rod friction by pumping in slurryabove the tip.
Field Investigations
Fig. 20.Results from the early dynamicprobing tests, average of threetests (after Dueck 1994)
0
1
2
3
4
5
6
7
8
9
10
0 20 40 60 80 100 120 140
3HQHWUDWLRQ�UHVLVWDQFH��EORZV����P�RU�03D
'HSWK��P
Blows/0,2m
rd, MPa
qd, MPa
Heavy to turn
Barely possible to turn by use of an extension rod
Impossible to turn

Investigations and Load Tests in Clay Till 37
The new investigations were performed in orderto study the possibility of penetrating further andobtaining more reliable results if a suitable meth-od was used. The new soundings were thereforeperformed with a slip coupling between the tipand the rods. This coupling enabled the rods tobe retracted 0.2 metre at regular intervals and adirect measure of the friction in terms of thenumber of blows required to ram them down thesame distance again. Hollow rods were used andbentonite slurry was pumped out at the coupling.The crawler drill rig was used and this enabled afurther reduction of the friction by extensive ro-tation of the rods, if necessary.
Three probing tests were carried out in this way.The reduction in friction already became signifi-cant at a depth of about 3.5 metres. Two of thetests penetrated all the way to about 14 metresdepth, where they stopped on the bedrock. Thethird test stopped at about 7.5 metres depth,where the sound from the drill rods appeared toindicate a large boulder.
It was thus possible also to penetrate the North-east till when suitable equipment was used. Asomewhat higher stop criterion than normal hadto be employed since extra hammering wassometimes necessary to pass larger objects in theground. However, it was fairly easy to distin-guish these from a real stop. The rod friction wasconsiderable when passing certain layers, partic-ularly at the interface between the North-east tilland the overlying layers. This friction was almosteliminated when the mud lubrication had becomefully effective after further penetration and rota-tion of the rods.
It is thus concluded that dynamic probing can beperformed in every type of clay till in this area,provided that a suitable method is used. Frictionreduction is necessary, but even then it must beexpected that some tests will stop at a higherlevel because of large embedded objects in thesoil mass. The suggestion of using lighter pene-tration methods could not be followed if thewhole soil profile was to be investigated, since itwas barely possible to penetrate the soil even
with the heavy to super heavy method employed.
The results from a dynamic probing test can bepresented in terms of blows for a certain intervalof penetration depth or by the variation in theresistance numbers r
d or q
d with depth. The resist-
ance numbers are calculated from
3D00
0UTDQG3D
$H0J+
UGGG
,´
,+
==
whereM = mass of the falling weight, kgg = acceleration of gravity = 9.81 m/s2
H = height of free fall, mA = cross sectional area of the tip, m2
e = average penetration per blow within thedepth interval, m
M´ = total mass of sounding rods, anvil andguide tube, kg
For the Hfa method, the parameter rd expressedin MPa is numerically approximately equal to thenumber of blows per 0.2 metre of penetration,which is normally reported in Sweden, Fig. 21.
The parameter qd, also called the dynamic tipresistance, accounts for the mass of the parts ofthe equipment involved. This parameter has beenfound to be independent of the equipment andmethod and is thus most suitable for describingthe stiffness of stiff clays and clay tills (Butcheret al 1995). According to these authors, the shearstrength of the soil can be calculated from
cu = qd/22
This gives a very good correlation with thestrengths determined by field vane tests andCPT-tests also for the clay till at Tornhill. Theauthors furthermore suggest that the parameter q
d
should be approximately equal to the tip resist-ance in CPT-tests. This was not found at Torn-hill. Instead, the relation between the two valueswas almost constant at 2.0. This is also reflectedin the factor 22 in the formula above and thecone factor N
KT» 11.

SGI Report No 5938
3.34 Soil-rock drillingSoil-rock drilling is normally performed whenthe content of stones and cobbles is so high thatneither CPT-tests nor dynamic probing tests pen-etrate or when the soundings are to be continuedinto the underlying bedrock. The method hasrecently been developed in such a way that sixadditional and independent drilling parameterscan be registered continuously. The parameters,which are registered together with depth and rateof penetration, are:
� Applied static vertical force, kN
� Applied torque (measured as pressure in thehydraulic device providing the rotation andtorsion force), MPa.
� Speed of rotation, rpm
� Pressure of flushing medium, MPa
� Flow of flushing medium, litres/min
� Applied hammering energy (measured aspressure in the hydraulic hammer), MPa
(The Field Committee of the Swedish Geotechni-cal Society 1998)
The drillings are normally performed with con-stant settings of the pump for the flushing medi-um, the rate of rotation and the applied verticalforce and hammering energy. However, whenvery different materials are encountered, the set-tings may have to be altered in order to reduce orincrease the rate of penetration. Two such drill-ings were carried out at Tornhill with slightlydifferent settings. The results from one of theseare shown in Fig. 22.
Field Investigations
Fig. 21. Results from the new dynamic probing tests at Tornhill � average of the tests. (The parameter rd
is plotted in the figure, but is difficult to detect since it is almost completely obscured by thecurve for blows/0.2 m).
0
2
4
6
8
10
12
14
16
0 20 40 60 80 100
3HQHWUDWLRQ�UHVLVWDQFH��EORZV����P�RU�03D�'HS
WK��P
blows/0,2mrd, MPaqd, MPa

Investigations and Load Tests in Clay Till 39
Fig
. 22.
Res
ults
from
a s
oil-
rock
dri
lling
at T
ornh
ill.

SGI Report No 5940
From the results, it can be seen that the soil issofter and more permeable in the top metre ofsoil, that there is a peak in stiffness and a dip inpermeability between 1.5 and 2.5 m depth, andthat the properties are thereafter fairly similardown to 6.5 metres depth. In this latter layer,there is a large scatter in vertical force and rate ofpenetration, indicating a heterogeneous material.At 6.5 metres depth, the character of the materialchanges considerably. The material becomesmuch stiffer, which is indicated by a tenfold de-crease in rate of penetration in spite of a doublingof the applied static force. The torque required torotate the rods at the same speed also increasesby a factor of 3 � 4. The material appears to beless permeable since the pressure in the flushingmedium increases and the flow drops. The bed-rock is then found at 14 metres depth. This canbe seen mainly in an even lower rate of penetra-tion and a considerably more homogeneous ma-terial with respect to permeability. Soil-rockdrilling is found to be a fast and effective way ofestablishing the soil-rock profile in this type ofmaterial. It also yields a fairly good qualitativepicture of the relative stiffness of the material inthe profile. However, it is not yet possible toevaluate any quantitative parameters from theresults.
3.4 IN SITU TESTS
3.41 SASW measurementsMeasurement of the variation of the Raleighwave velocity in the test field at Tornhill wasperformed in a separate joint project between theUniversity of Lund and SGI (Svensson 2000). Inthis project, SASW measurements have beenperformed in a number of test fields where theinitial shear wave velocity has been determinedby seismic cone tests. The aim of this project wasto determine the accuracy that would be obtainedwith the method, which is simpler in certain re-spects, and the effectiveness of recent attempts toimprove the interpretation by using �forwardmodelling techniques�.
The tests at Tornhill were performed at the sametime as the investigations in the current projectand involved a larger area covering the presenttest area and its surroundings, Fig. 23. The re-sults of the SASW measurements proved to berather difficult to interpret. The ordinary andsimplest method of interpretation yielded valuesof the shear wave velocity that had a trend simi-lar to those evaluated from the seismic cone tests,but were considerably lower. When a more ad-
Field Investigations
Fig. 23.SASW measurements in progress.

Investigations and Load Tests in Clay Till 41
vanced interpretation method was employed,another similar trend was obtained, but with con-siderably higher values. The combined resultsfrom all the test fields indicated that the interpre-tation of SASW measurements was quite satis-factory in homogeneous clay profiles with con-tinuously increasing stiffness with depth. How-ever, in heterogeneous, considerably layeredprofiles with irregularly varying stiffness, as atTornhill, the accuracy of the interpretation is stilllimited.
3.42 Resistivity measurementsMeasurements of the soil resistivity in the fieldhave recently been performed in a diplomaproject at Lund University (Leveen and Palm,2000). The measurements have been performedboth as vertical resistivity soundings using anRCPT probe and as geo-electrical surface meas-urements. The electrical resistivity was found tovary between 10 and 130 Wm/m, which is typicalfor relatively fine-grained soils. The variation inresistivity with depth reflects the composition ofthe soil layers. The lowest values are found in themost homogeneous fine-grained soil in the
Baltic clay till between about 0.4 and 3 m depth,and the resistivity then increases with depth asthe soil becomes coarser in the mixed clay tilland the North-east till below. Various thinnerlayers within the main layers can also be dis-cerned, Fig. 24.
The variation in thickness of the various layersand their uneven lateral distribution is illustratedby the results from the geo-electrical surfacemeasurements, Fig. 25. A number of differenttest set-ups and interpretation techniques havebeen used. These methods have various advan-tages and limitations in terms of vertical and lat-eral resolution. However, in principle, they allyielded good illustrations of the heterogeneouscomposition of the soil and the great variation inextent and thickness of the soil layers above theNorth-east till, particularly in the Baltic clay tillwith its large embedded pockets of coarse mate-rial. This picture is very helpful for understand-ing the variation in the test results and the rele-vance of individual test results for the larger soilmass.
Fig24.Variation in measured soil resistivity withdepth in RCPT. (Leveen and Palm 2000)

SGI Report No 5942
3.43 Field vane testsField vane tests were performed in the initialinvestigations (Dueck 1994) with the Danishfield vane (DGF Feltekomité 1993). This equip-ment is designed for tests in clay till and is morerobust than ordinary field vanes. The tests con-firmed that the Danish relation between fieldvane tests and CPT-test results could be appliedalso in the test field at Tornhill. According toSteenfelt and Sörensen (1995), the CPT-test canbe considered superior to the field vane test fordetermination of the undrained shear strength.This is primarily a result of less scatter in theresults. No further field vane tests were thereforeperformed in the current project.
3.44 Dilatometer testsTwo dilatometer tests were performed in the testarea. The dilatometer penetrated down to 6.6 and7.4 metres without blows, which is approximate-ly the same depth as for the CPT-tests. No at-tempt was made to ram it down further, since thiswas only expected to damage the equipment.
The tests were performed according to the stand-ard procedure, e.g. SGF 1995, with the exceptionthat the pressure readings were taken and storedelectronically by a computer with the readingstriggered by the signals from the dilatometer.The results from the two tests were surprisinglyconsistent in spite of the heterogeneous soil,Fig. 26. The same pattern as for the other typesof tests was observed, with a peak in the stiffnessbetween 1.5 and 2.5 metres depth, a fairly con-stant stiffness between 3 and 6 metres depth, andthereafter rapidly increasing values. The resultsare more scattered between 5 and 6.5 metres
Field Investigations
Fig. 25. Results of geo-electrical surface measurements at Tornhill.(Leveen and Palm 2000)

Investigations and Load Tests in Clay Till 43
depth, which probably reflects a more heteroge-neous soil and larger disturbance effects.
The results were interpreted using the SWEDILLinterpretation programme according to the guide-lines given in SGI Information No. 14. The soilclassification was fairly accurate in designatingthe soil in the upper part as very stiff clay and thesoil below as stiff silty clay with occasional lay-ers of silt or sand.
The undrained shear strengths followed the sametrend as the vane tests and the CPT-tests, but thevalues were only about half those from the othertests. This was valid regardless of whether theMarchetti (1980) evaluation or the evaluationproposed by Larsson (1989) was used. However,the evaluation proposed by Roque et al (1988) onthe basis of results from Norwegian very siltyclays and clayey silts would have yielded shearstrength values closer to those from the othertests.
The evaluated coefficients of earth pressureranged from about 5 in the upper layer of Balticclay till to 1.5 � 2 in the intermediate layer ofmixed till below, Fig. 27a. This is in the samerange as was later obtained from the pressureme-ter tests and from empirical relations with thepreconsolidation pressures measured in the labo-ratory. The estimated overconsolidation ratioswere very high in the upper layer, but in this caseare very dependent on the evaluation method.The empirical methods normally used for evalu-ating overconsolidation ratios in clays refer tosoil profiles where very high values are foundonly in dry crusts and other fissured soils. Thesemethods strongly overestimate high overconsoli-dation ratios in non-fissured soils. Based on Brit-ish experience from non-fissured soils, Powelland Uglow (1988) proposed that the overconsoli-dation ratio, OCR, could be evaluated from
Fig. 26. Zero pressures, p0, and expansion pressures, p1, in the dilatometer tests.
0
1
2
3
4
5
6
7
8
0 5 10 15 20 25
3UHVVXUH��EDU
'HS
WK��P
p0, test1
p0, test2
p1, test1
p1, test2

SGI Report No 5944
Field Investigations
Fig. 27. Evaluated coefficient of horizontal earth pressure and overconsolidation ratio from thehorizontal stress index measured in the two dilatometer tests at Tornhill.a) coefficient of horizontal earth pressure.b) overconsolidation ratio.
0
1
2
3
4
5
6
7
8
0 1 2 3 4 5 6 7
.�
'HSWK��P
0
1
2
3
4
5
6
7
8
0 5 10 15 20 25 30 35 40
2&5
'HSWK��P
a)
b)

Investigations and Load Tests in Clay Till 45
32,124.0'
.2&5 ≈
where KD is the horizontal stress index evaluated
from the dilatometer test. This has been appliedto the data from Tornhill and the results showoverconsolidation ratios in the order of 25 to 30in a layer between 1.5 and 2.5 metres depth, de-creasing to about 6.5 below 3 metres depth.These values are of about the same size as thoseobtained from the preconsolidation pressuresestimated from oedometer tests, but only abouthalf of what is estimated from the field vane testsusing Danish empiricism, Fig. 27 b.
The evaluated compression moduli (oedometermoduli) show a peak in the stiff layer of Balticclay till with values around 80 MPa and thendecrease to values around 30 MPa in the interme-diate mixed clay till, Fig. 28.
The results from the dilatometer tests were thusconsistent and yielded what appear to be fairlyrelevant soil parameters. The main exceptions arethat the undrained shear strength estimated with
the ordinary methods is only half of what is ob-tained from field vane and CPT-tests, and that aspecial empirical relation for non-fissured clayshad to be employed for the overconsolidationratio. However, it was possible to penetrate onlythe upper two types of clay till.
3.45 Pressuremeter testsPressuremeter tests were performed with twotypes of equipment; the ordinary Menard type ofpressuremeter and new equipment similar to theTEXAM pressuremeter. In both cases, the testswere performed in predrilled holes using thickbentonite slurry to stabilise the holes.
Preparation of test cavitiesTwo methods were tried to prepare the test cavi-ties; the original tool designed by Menard and aspecial screw auger (Joelson screw) with a hol-low stem and hollow drill rods through whichbentonite slurry can be pumped when the augeris retracted. The original Menard tool proved togive slightly better test cavities. However, whenlarger objects were encountered in the ground,
Fig. 28. Evaluated moduli, M, from the dilatometer tests at Tornhill.
0
1
2
3
4
5
6
7
8
0 20 40 60 80 100 120
0RGXOXV��03D
'HSWK��P

SGI Report No 5946
this tool created holes that were misaligned. Acombination of both tools often proved to be thebest solution. The auger was then used to preparea straight hole down to just above the test leveland thereafter the Menard tool was used to pre-pare the test cavity. It was also found very im-portant to insert the probe in the test cavity andstart the test immediately after preparation of thecavity. The walls of the cavity deteriorated rapid-ly and any significant delay meant that the testwas performed in a cavity of inferior quality.
Menard pressuremeterThe tests with the Menard pressuremeter wereperformed with a probe fitted with a �canvascover�, which is a relatively thick and stiff rub-ber membrane. This outer cover was chosen be-cause of the relatively high amount of sharp flintparticles in the ground. Although it causes a rela-tively high pressure correction, careful and re-peated calibrations showed that this correctioncould be determined accurately.
The tests with this pressuremeter were performedin three holes with a vertical distance betweenthe test levels of 1 metre. The first hole was pri-marily used to elaborate the method of preparingthe test cavities and some of the results from thishole were therefore discarded. The other twoholes were prepared in such a way that tests wereperformed at every metre depth in one hole andat depths of 1.5 m, 2.5 m and so on in the other,in order to obtain, as far as possible, a continuousprofile. The maximum testing depth was 6 me-tres. Below this depth, it was not possible to cre-ate test cavities with the method employed. Toperform tests in the underlying North-east till,tests would have to be performed inside slotteddrilling tubes or in cavities created with a special,more elaborate technique developed for this ma-terial by Ekdahl et al.(1996). Since no referencedata would be obtained for this soil from the laterplate load tests, this was not considered relevantfor the present project.
The tests were performed according to the ordi-nary procedure with new pressure incrementsapplied every minute and readings of the volume
changes after 30 and 60 seconds. About 12 pres-sure increments were used in each test. No at-tempts were made to cycle the stress and meas-ure unload-reload moduli in these tests.
New pressuremeterThe other type of pressuremeter test was per-formed with equipment designed along theguidelines given by Briaud (1992) and which inprinciple works in the same way as the TEXAMpressuremeter. The probe was an ordinary Me-nard probe from which the inner rubber mem-branes and the gas supply tube had been re-moved. The probe was thus converted to a mono-cell covered by a canvas cover and completelysaturated with water. The cell had a diameter of56.4 mm and a length of 408 mm, giving an L/Dratio of approximately 7.2.
The probe was connected to a stainless hydrauliccylinder in which the piston was operated by aturning wheel through a play-free gearbox. Theposition of the piston was measured accuratelyby a pulse counter on the wheel axis. A pressuretransducer in the pressure pipe to the probemeasured the pressure in the system. The signalsfrom the pulse counter and the pressure transduc-er were recorded by a computer, Fig 29.
The probe and the system were first saturated.The probe was then inserted into a tight fittingsteel tube and the system was leak tested. Thistube was also used to zero the volume readingsystem in the field tests and to test the correctionfor system compressibility. The volume measure-ment was then checked by expanding the probeand studying its shape and change in radius. Itwas found that the canvas cover expanded veryevenly with practically parallel sides of the ex-panded probe and very small radii at the fixedends. The translation of the volume change asmeasured by the movement of the piston intochange of radius of the probe was thus a straight-forward procedure.
The system was calibrated for pressure correc-tions because of resistance in the rubber mem-brane and loss of pressure because of water flow.
Field Investigations

Investigations and Load Tests in Clay Till 47
-0,5
0
0,5
1
1,5
2
2,5
3
3,5
-200 -100 0 100 200 300 400 500 600 700 800
9ROXPH��FP�
3UHVV
XUH��%
DU
Loading
Unloading
The calibration was performed with constantwater flow at different rates, by stopping the ex-pansion at regular intervals and letting the pres-sure stabilise, and by repeating this process withreversed water flow and deflation of the probe. Acorrection was thus obtained which accountedfor the resistance in the rubber membrane, hys-teresis effects at reversal of the volume changeand combined rate effects on both the resistancein the rubber membrane and the pressure lossbecause of the flow velocity in the pressure pipe,Fig. 30.
Briaud (1992) proposed various test proceduresfor evaluating the modulus at unloading and re-loading, its dependence on stress level and strainlevel in the cycle, and the time dependence(creep effects) on the results. Based on this, Ek-dahl and Bengtsson (1996) proposed a test proce-dure that would enable the most comprehensiveevaluation of parameters from a single test. Inthis procedure, the probe is expanded at a fairlyconstant rate. The expansion is halted at regularintervals in order to read off a stabilised pressureafter 15 seconds. Únloading and reloading cyclesare also performed at regular intervals in the ex-
Fig. 29. Performing a test with the newpressuremeter at Tornhill.
Fig. 30. Calibration curve for pressure corrections to be applied to the new pressuremeter.Volume readings refer to the zero reading in the steel tube.

SGI Report No 5948
pansion. At least three series of such cycles areperformed, each series consisting of three cycleswith three different fixed amounts of volumechange. The amounts of volume change are pre-selected with consideration to the probe size insuch a way that the strains within the cycle re-main �elastic�. A minimum of nine unload-re-load cycles are thus performed in each test. Atone stage, the expansion is changed in such away that the pressure is kept constant and thefurther expansion due to creep effects is recordedfor about ten minutes. If the creep within the�elastic� part is to be investigated, this shouldideally be performed within the unloading-re-loading loop. In the current series of tests, theprocedure was carried out after the loop had beencompleted and the expansion had more or lessreturned to the virgin curve in practically thesame way as recommended by Briaud for ordi-nary pressuremeter tests. This procedure wasfollowed in all tests with the new equipment,Fig. 31. The only deviation was that the volumechange and pressure were recorded continuously.
This was done during both volume changes andstops for about 15 seconds at regular intervals,both at loading and unloading, in order to studythe influence of creep on the recorded stress-strain relations. Each test performed in this wayoccupied about two hours. The tests were per-formed in two adjacent boreholes with the testdepths overlapping each other in the same way asfor the tests with the Menard pressuremeter.
Results
■ Menard parametersThe traditional parameters evaluated from a pres-suremeter test are the in situ horizontal stress p
0,
the yield pressure py or pfl, the limit pressure, pL,and the pressuremeter modulus E
M. In the Me-
nard pressuremeter test, the in situ horizontalstress and the yield pressure are evaluated usingthe shape of the pressuremeter curve (the plottedpressure-volume change relation), and the curvefor creep versus pressuremeter pressure. Thecreep is then evaluated as the difference between
Field Investigations
Fig. 31. Example of a test at Tornhill with the new pressuremeter.
0
200
400
600
800
1000
1200
1100 1200 1300 1400 1500 1600 1700 1800 1900
3UHVVXUHPHWHU�YROXPH��FP�
3UHVV
XUHPHWHU�SUHVV
XUH��N
3D

Investigations and Load Tests in Clay Till 49
the volume readings taken 30 and 60 secondsafter the application of the pressure increment.The in situ horizontal pressure is interpreted asthe pressure when the stress-volume change rela-tion becomes linear after an initial expansion ofthe probe required to bring it into full contactwith the cavity walls. The interpretation of thispoint is facilitated by the fact that the creep-pres-sure curve becomes a minimum at the same pointin ideal tests. The yield pressure is evaluated atthe point where the stress-volume change rela-tion leaves the straight line relation. The pressureat this point should coincide with the pressurewhere the creep-pressure relation changes andthe creep rate starts to increase significantly. Theinitial volume of the test cavity is evaluated fromthe initial volume of the pressuremeter probeplus the volume increase required for the probeto make full contact with the cavity walls. Thelimit pressure is then evaluated as the pressure atwhich the initial volume of the test cavity hasbeen doubled. Finally, the pressuremeter modu-lus is evaluated from the slope of the straightpressure � volume change relation and the cur-rent volume of the cavity in this stage, Fig. 32.
Pressuremeter tests performed according to thenew procedure have to be interpreted in a some-what different way. No creep curve is obtainedfrom these tests. However, the creep that occursduring the test significantly influences the re-sults, and these effects are much larger in a testthat lasts for about two hours than in a test lastingonly about ten minutes. Furthermore, the resultsfrom the new tests are influenced by the effectsof the repeated unloading-reloading cycles,which result in extra volume changes and mayalso influence the limit pressure. The in situ hori-zontal pressure must therefore be interpretedsolely from the shape of the pressure-volumechange curve (or pressure radius change curve).For this case, it has been suggested that the hori-zontal stress should be evaluated at the point ofminimum radius of the curve before it attains itsstraight relation (Briaud 1992), Fig. 33.
The volume of the test cavity is then determinedby extrapolation of the straight pressure- radiuschange relation to the estimated in situ horizontalpressure. The yield pressure also has to be esti-mated solely from the shape of the pressure �
Fig. 32. Evaluation of parameters from a Menard pressuremeter test.

SGI Report No 5950
volume change curve, which makes it somewhatmore uncertain. The evaluation can be performedas a subjective interpretation of the point atwhich the relation leaves the straight line, at theintersection of extrapolated parts of the curvebefore and after yield (which is difficult since thecurve after yield is not a straight line) or at thepoint of minimum radius of the curve. Here, thelatter interpretation has been chosen. The inter-pretation is complicated further by the fact that itis sensitive to the rate at which the test has beenperformed and to possible interfering effects ofunloading and reloading loops. The pressureme-ter modulus is evaluated in the same way as theMenard tests, but the limit pressure has to beevaluated using another procedure. Otherwise,the evaluated limit pressures consistently becomeconsiderably lower than those evaluated from thetests performed according to the Menard proce-dure.
Mair and Wood (1987), have presented a proce-dure for estimating the limit pressure at infiniteexpansion of the cavity, when DV/V = 1. In thisprocedure DV/V, the volume change versus thecurrent volume is plotted in a logarithmic scaleagainst the pressuremeter pressure. The relation
becomes a straight line, which is extrapolated toDV/V = 1 and the limit pressure is read off. Inthis plot, the limit pressure according to the Me-nard procedure corresponds to the pressure atDV/V = 0.5. This procedure has been applied tothe tests according to the Menard procedure as asupplement to the manual extrapolation and in-terpretation of the pressuremeter curve and thusprovides a more objective estimation of the limitpressure. It has also been applied to the tests per-formed according to the new procedure and boththe Menard criterion and the criterion DV/V = 1have been applied to the latter tests.
The results in terms of horizontal stresses, whichare very sensitive to the quality of the test cavity,show a certain degree pf scatter, Fig. 34. How-ever, if a few odd values are sorted out there is aconsistent trend for the in situ horizontal stressescorresponding to K
0-values of 3 to 4 in the upper
layers to decrease to about 1.5 between 3.5 and5.5 metres depth and then to increase again. As acomparison, previous tests with a self-boringCamcometer had yielded K
0-values of about 5 at
1.9 metres depth and 6 to12 at 2.9 metres depth(Skanska Teknik 1998).
The yield pressures from both tests give a fairlyconsistent picture of the variation with depth, butthe values from the new type of test are generallylower than the values from the Menard tests,Fig. 35. The typical picture with a peak between2 and 2.5 metres depth is found for both types oftest.
The limit pressures show a clear trend versusdepth, which is similar to the yield pressures. Inorder to achieve compatibility between the twotypes of tests, the limit criteria DV/V = 1 has tobe applied to the latter type. Also when this isdone, the yield pressures from the new type ofpressuremeter tests in general become somewhatlower, Fig.36.
Field Investigations
Fig. 33. Evaluation of in situ horizontal stressand initial radius of the test cavity.(Briaud 1992)

Investigations and Load Tests in Clay Till 51
Fig. 34. Evaluated in situ horizontal stresses and coefficients of earth pressure frompressuremeter tests at Tornhill.
Fig. 35. Evaluated yield pressuresfrom the pressuremetertests at Tornhill.
0
1
2
3
4
5
6
7
8
0 1 2 3 4 5
&RHIILFLHQW�RI�HDUWK�SUHVVXUH��.�
'HSWK��P
Pressuremeter Menard
New pressuremeter
0
1
2
3
4
5
6
7
8
0 0,5 1 1,5 2 2,5 3
,Q�VLWX�KRUL]RQWDO�VWUHVV��S���%DU
'HSWK��P
Pressuremeter Menard
New pressuremeter
0
1
2
3
4
5
6
7
8
0 2 4 6 8 10 12
<LHOG�SUHVVXUH��S\��%DU
'HSWK��P
Pressuremeter Menard
New pressuremeter (rmin)
The pressuremeter moduli evaluated from thetwo types of tests fell within the same scatterband and no significant difference was observed.The pattern with peak values between 2 and 2.5metres depth, decreasing to a lower and fairlyconstant value between 3.5 and 5.5 metres depth,is repeated, Fig. 37.
( )
( )

SGI Report No 5952
Fig. 36. Evaluated limit pressures fromthe pressuremeter tests at Tornhill.
Fig. 37. Evaluated pressuremeter moduli fromthe pressuremeter tests at Tornhill.
0
1
2
3
4
5
6
7
0 100 200 300 400
3UHVVXUHPHWHU�PRGXOXV��(0��%DU
'HSWK��P
PressuremeterMenardNew pressuremeter
0
1
2
3
4
5
6
7
8
0 5 10 15 20
/LPLW�SUHVVXUH��S/��%DU'HS
WK��P
Pressuremeter Menard
New pressuremeter
■ Evaluation of creep effectsThe parameters measured in a Menard type ofpressuremeter test relate to a loading time of oneminute. For a longer duration, the volumetricexpansion during the stress increment will in-crease with time. This creep effect is approxi-mately a function of the logarithm of the timeand can be written in different ways. Schmert-mann (1978) proposed that creep effects be writ-ten as
)log1(1
1 WWαεε +=
Riggins (1981) proposed that the creep effects bewritten as
WQ
WW
((−
=
00
and in the pressuremeter test the creep exponentn
t is evaluated from
W
XWHW
Q
&& PLQXWHPLQXWHVW
55
=
1
,)min1(
∆∆
Both approaches have been used to evaluate thecreep parameters from the holding periods duringthe tests with the new pressuremeter. The resultswere fairly constant with depth, yielding an aver-age value of a of 0.114 and an average value ofn
t of 0.047. Briaud (1995) proposed that a creep
exponent twice that determined in pressuremetertests be applied when calculating settlements offootings.
Field Investigations

Investigations and Load Tests in Clay Till 53
Fig. 38. Evaluation of undrained shear strength according to Gibson and Anderson (1961).Example of a pressuremeter test in clay till.
■ Evaluation of shear strengthA number of different ways have been proposedto estimate the undrained shear strength in cohe-sive soils on the basis of pressuremeter test re-sults. The traditional way of interpreting theshear strength is by using the equation:
X
/
X
F*SS
Fln1
0
+
−=
Use of the formula requires knowledge of therigidity index G/cu, which is rarely known pre-cisely. Instead, an empirical relation is normallyused. For most practical estimations, the value ofpLdetermined according to Menard has been usedtogether with a value of the �pressuremeter con-stant� (1+G/c
u) of 5.5. Mair and Wood (1987)
point out that a theoretically correct evaluationshould use p
L evaluated using the limit criteria
DV/V = 1 and that the pressuremeter constantshould rather be approximately 6.2.
Briaud recommends that the undrained shearstrength be evaluated from the empirical relation:
75.0
021.0
−=D
/
DX S
SSSF
where pa is the atmospheric pressure.
Gibson and Anderson (1961) presented a methodof interpreting the expansion of a cylindricalcavity in an ideal elastic-perfectly plastic materi-al. Using this method, the undrained shearstrength can be interpreted as the slope of thepressuremeter curve when plotted as ln(DV/V)versus the pressuremeter pressure, i.e. in thesame plot as used for evaluation of pL, Fig. 38.
Ideally, the curve should be corrected for initialdeformations due to unloading of the cavity be-fore it becomes reloaded by the probe, but this isnot necessary when relatively large deformationsare used for the interpretation. More elaborate
0
2
4
6
8
10
12
14
-4 -3,5 -3 -2,5 -2 -1,5 -1 -0,5 0
OQ�∆9�9
3UHVV
XUH��%
DU
PL δV/V=1
1
cu

SGI Report No 5954
0
1
2
3
4
5
6
0 100 200 300 400 500 600
(YDOXDWHG�XQGUDLQHG�VKHDU�VWUHQJWK��N3D
'HSWK��P
Gibson&AnderssonMair&WoodMenardBriaudField vane 478Field vane 414CPT Nk=11SBP Gibson&Andersson
interpretations along similar lines yielding stressstrain relations also for soils exhibiting peakstrength followed by strain softening have beenpresented by authors such as Palmer (1972, La-danyi (1972) and Baguelin et al. (1972). Thesemethods have not been employed here since notendencies for peak strengths could be detectedin the pressuremeter curves.
The undrained shear strengths evaluated from theMenard type pressuremeter tests are shown to-gether with the results from the CPT-tests andthe field vane tests in Fig. 39. As can be seen inthe comparison, the strength values evaluated
according to Menard or Mair and Wood areabout equal and in general compatible with thereference data. The strength values evaluatedaccording to Briaud are only about half of thereference data and the values evaluated accord-ing to Gibson and Anderson generally becomehigher than the reference data. The differenceincreases with depth and becomes up to abouttwo times.
The results from the pressuremeter tests accord-ing to the new procedure have been interpreted inthe same way. In this case, the best correspond-ence with the reference data was obtained withthe Gibson and Anderson method. The resultsobtained with the Menard and the Mair andWood methods corresponded to about two thirdsof those in the reference data and values obtainedby the Briaud method equalled less than halfthose in the reference data, Fig. 40.
From the results, it is obvious that the results ofthe pressuremeter tests are rate and proceduredependent, and that the interpretation methodshould be chosen accordingly. The Menard inter-pretation has traditionally been used togetherwith the Menard procedure and both this and themore objective Mair and Wood procedure appearto yield relevant strength values also in thepresent case. Slower tests yield lower limit pres-sures and consequently also lower strengthswhen interpreted with these methods. For thenew testing procedure, the Gibson and Andersonmethod yielded the best correlation with the ref-erence data. However, this method does not ei-ther account for rate or creep effects and an evenslower testing rate might result in excessivelylow values being evaluated also with this meth-od, whereas an increased testing rate would re-sult in excessively high values. So far, no methodhas been presented which takes the testing rateinto account.
Field Investigations
Fig. 39. Evaluated undrained shear strengthfrom Menard type pressuremeter testsat Tornhill.

Investigations and Load Tests in Clay Till 55
0
1
2
3
4
5
6
0 100 200 300 400 500 600
(YDOXDWHG�XQGUDLQHG�VKHDU�VWUHQJWK��N3D
'HSWK��P
Gibson&Andersson
Mair&Wood
Menard
Briaud
Field vane 478
■ Evaluation of moduli at small strainsThe purpose of the new equipment was to enablemeasurement of moduli at small strains in un-loading-reloading loops. This requires very care-ful calibration and measurement of the volumechanges, which the equipment and calibrationwas designed to provide. Correction was thusmade for stresses in the rubber membrane, in-cluding hysteresis and rate effects, pressure lossdue to flow in the pressure pipe and system com-pressibility. Furthermore, the expansion and de-flation was stopped for about 15 seconds at sev-eral stages also in the unloading-reloading loopsin order to check that no significant errors oc-curred because of loading rate.
The initial volume and radius of the cavity, V0
and R0, have been determined by the method for
evaluation of in situ horizontal stress describedabove. The relative increase in cavity radius DR/R
0 has then been calculated and the pressureme-
ter curves have been plotted as pressure versusthis parameter, Fig. 41. The curves have beenstudied carefully and relevant minimum andcrossover points for the loops have been selected.
Unload-reload loops are affected by creep andhysteresis effects that have to be accounted for insome way. The creep effects are most pro-nounced at the start of the unloading cycle,where the pressuremeter pressure decreases evenif the volume is kept constant, and at the end ofthe reloading cycle where significant creep startsagain. The �elastic� part of the curve, which isrelatively unaffected by creep effects, may beassumed to be between the lowest pressure atunloading and the point where the reloadingcurve intersects the unloading curve. This is alsothe point to which the creep effects tend to takethe virgin loading curve when the expansion isstopped and the pressure decreases because ofcreep and stress relaxation. A condition for thestrains remaining elastic at unloading in a clay isthat the decrease in pressure in the loop does notexceed twice the undrained shear strength(Wroth 1982). This has been checked for the testdata and the loops have then been evaluated asan unloading from the pressure at the crossoverpoint to the minimum pressure in the loop andreloading again.
There is a significant hysteresis effect within theloops and the moduli for the reloading loopshave been determined as secant moduli for thewhole loop or from the point at the minimumpressure in the loop to the particular pressure orstrain under consideration. When the unloadingcurve has been studied, the secant moduli havebeen calculated from the crossover point.
The current radius of the cavity, RC, has beencalculated continuously and the cavity strain inthe loops, e
c, has been calculated as DR
C/R
C. The
secant shear modulus, G, is then calculated as
Fig. 40. Evaluated undrained shear strengthfrom the new type of pressuremetertests at Tornhill.

SGI Report No 5956
&
S*
ε∆∆=
2
The shear modulus can be converted into modu-lus of elasticity, E, by
)1(2 ν+= *(
where Poisson�s ratio n is generally assumed tobe 0.33.
The cavity strain, ec, is the strain at the cavity
wall, and the shear strain in the surrounding soildecreases with distance from the wall. Accordingto Briaud et al (1987), the average shear strain inthe affected soil mass can be estimated as 0.32 ec.Jardine (1991) has proposed another empiricalway of translating the cavity strains to shearstrains. According to this method, the shearstrain, es, that corresponds empirically to thesame shear modulus as measured in this type ofpressuremeter test can be calculated from
+
≈
−510log8.02,1 F
F
V εεε
The shear modulus and the modulus of elasticityare stress and strain dependent. The strain de-pendence is often written as a hyperbolic func-tion (Kondner 1963):
εED(
+=1 , secant modulus
and the stress dependence as an exponentialfunction (Janbu 1963):
Q
DS
SN(
= ´ , tangent modulus
where p´ is the mean effective normal stress andpa is the atmospheric pressure.
Field Investigations
Fig. 41. Pressuremeter curve from 2 metres depth at Tornhill presented as radial stress versus relativeincrease in cavity radius.
0
200
400
600
800
1000
1200
0 0,05 0,1 0,15 0,2 0,25 0,3
∆5��5��F
5DG
LDO�V
WUHV
V��N3D

Investigations and Load Tests in Clay Till 57
If p´ is taken as the average effective stress in thestress interval for which the modulus is valid, theshear modulus or modulus of elasticity at anystress and strain can be written as
ε**
Q
D
ED
SS
*+
=
´
and
ε((
Q
D
ED
SS
(+
=
´
These formulas then provide secant moduli.
The mean effective normal stress in the soil is
3
´´´´ 321 σσσ ++=S
which in the pressuremeter case becomes
3
´´´´ YUS
σσσ θ ++=
where s´r, s´
q and s´
v are the effective radial,
circumferential and vertical stresses.
However, only the initial vertical stress and theradial pressure at the cavity wall are known. Ac-cording to Briaud et al. (1987), a reasonable esti-mate of the mean effective normal stress in thesoil mass around the pressuremeter can be ob-tained from
3
´´8.0´ YUS
σσ +=
and the relevant mean stress for a secant modulusevaluated in a loop should be calculated from themean radial stress in the interval for which themodulus is determined.
The stresses in the equations above are effectivestresses and, in fine-grained soils, the pore pres-sures should ideally be measured and an estimatemade of the radial pore pressure distribution.This could not be done in the current tests andthe evaluation had to be made under the assump-tion that the initial pore pressures remained fairlyconstant during the test. The relevance of thisassumption is difficult to judge, but it was notedthat the tests were rather slow and that the porepressures developed in the later plate load testswere very low.
The stress dependence of the moduli can be de-termined from loops with equal strains. This hasbeen done for all the tests. The intention of theprocedure using series of loops with equal volu-metric deflation of the probe in loops belongingto the different series was to provide data fromloops with equal strains but at different stresslevels. However, also the current radius of thecavity increases as the test proceeds and thestrains therefore become somewhat different inthis way. This led to a certain extra scatter in theresults and uncertainty in the evaluation. In thiscase, the pressure and volume changes were re-corded continuously and it was thus possible toselect portions with equal strains within all loopsand to plot the data together. This procedure pro-vided fairly good relations when the moduli atrelatively small strains were considered, Fig. 42.However, the scatter increases significantly whenlarger strains are considered and the relationsalso appear to change somewhat.
The strain dependence of the moduli was thenestimated. It was possible to do this from loopswith almost equal effective mean stresses, whichthe test procedure was also designed to produce.The estimation could also be made by first nor-malising the moduli for the estimated stress de-pendence as
Q
D
(Q
D
*
S
S
(NRU
S
S
*N
=
=
´
´
´
´

SGI Report No 5958
Field Investigations
and the inverse of the normalised modulus wasthen plotted against the corresponding strain.This was done in different ways depending onhow the relevant shear strain was estimated.Fig. 43 shows two such plots, one for modulus ofelasticity versus shear strain estimated accordingto Briaud et al (1987) and the other for shearmodulus versus shear strain estimated accordingto Jardine (1991). As can be seen in the figure, afairly good correlation can be obtained for bothtypes of relation, but the strain dependence dif-fers significantly depending on the method usedto estimate the shear strain.
Three parameters are evaluated in this way:
� n, which describes the stress dependence ofthe modulus
� a, which is a measure of the initial stiffness ofthe soil
� b, which is a measure of the strain depend-ence of the modulus
A high value of n entails a high sensitivity of themodulus to stress level, a high value of a entailsa low initial stiffness and a high value of b entailsa high sensitivity of the modulus to strain level.The evaluated parameters are listed in Tables 1and 2.
Depth, m n a b
1 0.930 0.0186 2.391.5 0.640 0.0089 3.252 0.617 0.0100 2.712.5 0.456 0.0085 2.623 0.676 0.0119 3.083.5 0.732 0.0138 3.674 0.580 0.0127 3.134.5 0.621 0.0172 3.005 0.992 0.0104 3.915.35 0.726 0.0135 2.82
Table 1. Evaluated parameters for the modulusof elasticity with respect to shearstrains estimated according to Briaudet al. (1987).
Fig. 42. Shear moduli versus normalised effective mean stress at a cavity strain of 0.002at 2 metres depth at Tornhill.
y = 0,6168x + 1,3743
R2 = 0,974
1,2
1,3
1,4
1,5
1,6
-0,3 -0,2 -0,1 0 0,1 0,2 0,3
log(p´/p´a)
logG

Investigations and Load Tests in Clay Till 59
Fig. 43. Evaluation of strain dependence for the moduli at 2 metres depth at Tornhill.a) Modulus of elasticity versus shear strain estimated according to Briaud et al. (1987)b) Shear modulus versus shear strain estimated according to Jardine (1991).
y = 9.2954x + 0.0242
R2 = 0.9671
0,03
0,035
0,04
0,045
0,05
0,055
0,06
0,065
0,07
0,075
0,08
0 0,001 0,002 0,003 0,004 0,005 0,006
6KHDU�VWUDLQ��εV
��N
*
a)
b)
y = 2.7136x + 0.01
R2 = 0.9793
0
0,005
0,01
0,015
0,02
0,025
0,03
0,035
0 0,001 0,002 0,003 0,004 0,005 0,006 0,007 0,008
�����εc
��N
(

SGI Report No 5960
A comparison of the data reveals that the initialstiffness becomes about 10 % lower when thestrains are evaluated according to Jardine (1991).It also decreases somewhat faster with strainwhen evaluated in this way.
A study of the parameters versus depth showsthat the stress dependence of the modulus (pa-rameter n) appears to be somewhat lower in thelayer of Baltic clay, which in general has thehighest clay content, Fig. 44a. All values arewithin the normal limits between 0.38 and 1.45reported by Briaud et al. (1983). The initial stiff-ness (the inverted value of parameter a) shows apronounced peak between 1.5 and 2.5 metresdepth in agreement with what has been found inall other tests, Fig. 44b, and the parameter bshows a somewhat lower strain dependence inthe upper layers, Fig. 44c.
These evaluated parameters should ideally enablean estimation of the moduli at any stress andstrain level. However, this assumes that the mod-els used correctly describe the soil behaviour. Acomparison between the moduli estimated con-tinuously for the reloading loops and those calcu-lated with the evaluated factors shows that thismodel corresponds fairly well to the measuredmoduli within the shear strain region 0.002 -0.01, Fig. 45.
It should be observed that the shear strains in thehigher region are no longer �elastic� strains with-in the unload-reload loop, but include plasticstrains in the loading path after the crossoverpoint has been passed.
A further comparison with the estimated valuescan be made by calculating the modulus at zerostrain using the estimated parameters and in situstresses, which ideally would yield a measure ofthe initial shear modulus. This gives a variationin shear modulus that more or less reflects thatevaluated from the seismic cone tests, but theformer values are only about a third of the latter,Fig. 46.
Thus, the model described above reproducesfairly well the shear modulus as measured withina certain strain interval. For very small strains,which constitute the major part of the loop, the fitis poor and the model overpredicts the values inrelation to measured values. However, there isanother way of describing what is happening inunload- reload cycles on soils, which has previ-ously been found useful in evaluating oedometertests (Larsson 1981). According to this method,the swelling of the soil at unloading can be de-scribed by a swelling index, as. The relative ex-pansion, e
swell, of the soil can then be calculated
from
min
max
´
´ln
σσε
VVZHOOD=
where s´max and s´min are the maximum and mini-mum effective vertical stresses in the loop. Thesecant reloading modulus, Mrl, then becomes
VZHOO
0UOε
σσ minmax ’´ −=
The same approach has been applied to the loopsin the pressuremeter tests using the radial pres-sure instead of the effective vertical stress. Theevaluated shear modulus has thus been plottedagainst the parameter (p
max � p
min)/ln(p
max/p
min) and
a corresponding swelling index has been evaluat-ed, Fig. 47. In this way, a very consistent picturewas obtained with an almost constant relationbetween the two parameters.
Table 2. Evaluated parameters for the shearmodulus with respect to shear strainsestimated according to Jardine (1991).
Depth, m n a b
1 0.930 0.0443 8.751.5 0.640 0.0207 11.482 0.617 0.0242 9.302.5 0.456 0.0195 9.273 0.676 0.0272 11.153.5 0.732 0.0330 12.174 0.580 0.0305 10.894.5 0.621 0.0417 10.665 0.992 0.0246 10.725.35 0.726 0.0333 9.67
Field Investigations

Investigations and Load Tests in Clay Till 61
0
1
2
3
4
5
6
0 0,2 0,4 0,6 0,8 1 1,2
6WUHVV�GHSHQGHQFH�IDFWRU��Q
'HSWK��P a) stress dependence factor n.
Fig. 44. Evaluated parameters for the shear modulus versus depth at Tornhill.
c) strain dependence factor b.
b) initial stiffness factor a.
0
1
2
3
4
5
6
0 0,002 0,004 0,006 0,008 0,01 0,012 0,014 0,016 0,018 0,02
,QLWLDO�VWLIIQHVV�IDFWRU��D
'HSWK��P
0
1
2
3
4
5
6
0 0,5 1 1,5 2 2,5 3 3,5 4
6WUDLQ�GHSHQGHQFH�IDFWRU��E
'HSWK��P

SGI Report No 5962
0
10
20
30
40
50
60
0,0001 0,001 0,01
6KHDU�VWUDLQ
*��03D
Measured 1st loop
Measured 2nd loop
Measured 3rd loop
Measured 4th loop
Measured 5th loop
Measured 6th loop
Measured 7th loop
Measured 8th loop
Measured 9th loop
Calculated loops 1-3, lowest stress
Calculated loops 1-3, highest stress
Calculated loops 4-6, lowest stress
Calculated loops 4-6, highest stress
Calculated loops 7-9, lowest stress
Calculated loops 7-9, highest stress
Fig. 46. Initial shear modulus at in situ stresses calculated from the pressuremeter tests.
Fig. 45. Comparison between the evaluated shear moduli in the different unloading-reloading loops andthe estimated relations between modulus and shear strain at 2 metres depth at Tornhill. Theevaluated curves are shown in three groups, each representing one of the unload-reload seriesin the tests. The estimated curves are shown as upper and lower boundaries corresponding to themaximum and minimum mean stresses in the loops within each series.
0
1
2
3
4
5
6
0 10 20 30 40 50 60
&DOFXODWHG�LQLWLDO�VKHDU�PRGXOXV�*���03D
'HSWK��P
Field Investigations

Investigations and Load Tests in Clay Till 63
Fig. 47. Evaluation of the swelling parameter from pressuremeter tests.
0
100
200
300
400
500
600
700
800
900
0 5 10 15 20 25 30 35
*XU��03D
�SPD[�SPLQO��OQ�SPD[�SPLQ���N3D
x=47.651yas=2.0986%
Fig. 48. Variation in swelling index with depth.
Fig. 47 contains the results from all loops in thetests. Naturally, some scatter is present, whichrelates to variations within the tests and also vari-ation with depth. The average values for each testdepth are shown in Fig. 48.
The variation in the evaluated swelling indexwith depth is relatively small and it is difficult todiscern any particular pattern. It may therefore beconsidered as a constant for the soil profile. Thevariation in unloading-reloading modulus is thenprimarily related to the different pressures atwhich unloading starts and the size of the un-loading. The measured variation in stiffness withdepth then becomes a function of the stiffnessand strength of the soil as reflected by the virginexpansion curve, from which the unloadingstarts.
The above relation can be used to predict thevariation in modulus in the unload-reload loops.In this case, it has to be assumed that the shapeof the loop is inversely symmetric, i.e. that theinitial stiff modulus and its decrease at unloadingare reflected by an identical stiff modulus andcurvature from the start of reloading. This as-sumption may be somewhat general, but the pos-
0
1
2
3
4
5
6
0 1 2 3
6ZHOOLQJ�SDUDPHWHU�DV���
'HS
WK��P
sible error decreases with strain level and iseliminated when the whole loop is considered.The initial stiff modulus at both ends of the loopbecomes
G0= p´max/as

SGI Report No 5964
For a certain decrease in radial stress to the pres-sure p´, the secant shear modulus can be calculat-ed from
´
´ln
´´
max
max
SS
D
SS*
V
−=
The cavity strain at the wall can be calculatedfrom
*SS
F 2
´max −=ε
from which the shear strain in the soil mass canbe calculated by one of the empirical methods.
This has been illustrated for the results from thetest at 2 metres depth at Tornhill in Fig. 49. Ascan be seen in the figure, this method describesmuch better what is actually measured in themain part of the unload-reload loops and coversthe whole strain interval from 0.0001 to 0.01.
However, the translation to geotechnical designparameters is more uncertain since it also in-volves an estimation of the previous maximumnormal stress in the current loading direction.
Fig. 49. Comparison between the evaluated shear moduli in the different unloading-reloading loops at2 metres depth at Tornhill and the estimated relations between modulus and shear strain usingthe swelling index.
0
10
20
30
40
50
60
0,0001 0,001 0,01
6KHDU�VWUDLQ
*��0
3D
Measured loop 1Measured loop 2Measured loop 3Measured loop 4Measured loop 5Measured loop 6Measured loop 7Measured loop 8Measured loop 9Calculated loop1Calculated loop 2Calculated loop 3Calculated loop 4Calculated loop 5Calculated loop 6Calculated loop 7Calculated loop 8Calculated loop 9
Field Investigations

Investigations and Load Tests in Clay Till 65
3.5 SAMPLING
3.51 Tube samplingIn Sweden, tube sampling in clay is normallyperformed with the Swedish standard piston sam-pler. However, in clay tills, the content of coarseparticles is so great that a diameter of 50 mm istoo small to obtain representative samples. Also,the equipment is not designed for this type ofvery stiff soil with large contents of flint andcoarse objects. Even if samples could be ob-tained, the wear on the equipment would be con-siderable. For tube sampling in this type of soil,open samplers with larger diameters are normallyused.
Tube sampling in the present project was per-formed with equipment similar to the Danish�Americanerrör�. The sampling tubes are madefrom ordinary thin-walled seamless stainlesstubes with an inner diameter of 70 mm and a wallthickness of about 2 mm. These are cut intolengths of 600 mm. The lower end of the sam-pling tube is turned into a sharp edge and threeholes are drilled for fixing bolts at the upper end.
The upper end of the sampling tube is threadedonto an adapter with the same outer diameter asthe tube. The lower part of the adapter has beenturned down to fit tightly inside the tubes over alength long enough to provide a stiff connectionwith proper guidance for the tube. It also con-tains two outer grooves with O-rings making theconnection airtight. After the tube has beenthreaded on, it is fixed in this position by threebolts.
The adapter also contains a vertical air-waterchannel with a ball valve. This enables air andwater on top of the sample to be flushed outwhen the sampler is pushed down, but shuts offand prevents the sample being sucked out duringwithdrawal of the sampler. The upper end of theadapter is connected to stiff drill rods. The sam-pler thus conforms to the normal requirementsfor thin walled sampling in fine grained solis,except that there is no inner clearance in thetubes above the cutting edge. Such clearances
often create more problems than benefits accord-ing to Swedish experience.
Sampling is performed from the bottom of pre-drilled holes. These can be prepared with differ-ent types of auger and stabilised in differentways. In this case, a hollow stem auger with ashaft wide enough to accommodate the samplerwas used. The auger was rotated down to justabove the sampling depth and then the centrepart was drawn up and the sampler was loweredinto the shaft, Fig. 50. The open-ended samplerwas then pushed down 500 mm or to refusal,whichever came first. After a short rest periodlasting a few minutes, the sampler was with-drawn.
Fig. 50. Sampling operation with tube samplerin progress. The hollow stem auger isrotated down and the prepared tubesampler is suspended at the side, readyto be lowered into the shaft.

SGI Report No 5966
On reaching the ground surface, the ball valvewas opened, the fixing bolts removed and thesampling tube released from the adapter. Theends of the tube were then sealed and the wholetube wrapped in plastic.
This operation continued through the upper lay-ers of Baltic clay till and mixed clay till. Sam-pling was performed at approximately every 0.5metre from 1 to 6 metres depth. However, coarseobjects were encountered and this resulted inmost of the sampling strokes failing to fullyreach the intended length of 500 mm. It alsomeant that at some levels it was necessary topredrill past a large object before the samplercould be lowered. Thus, this type of sampling didnot provide a fully continuous profile. No at-tempt was made to take samples in the underly-ing North-east till in this way since it was consid-ered impossible.
Afterwards, the samples were placed well pro-tected inside their stiff sampling tubes. Their sizealso enabled very careful transport to the labora-tory in the rear seat of a private car. At the labo-ratory, they were stored in a room with control-led temperature and humidity.
Most attempts at sampling had been terminatedbecause of refusal to penetration and the cuttingedges of almost every sampling tube had buckledinwards during the sampling operation. Apartfrom possible disturbance, this also resulted inthe formation of an automatic shutter when thesampler was withdrawn. There were no indica-tions that the samples had tended to be drawn outof the sampler during its withdrawal from theground. Buckling of the edge apparently alsodirectly led to refusal in penetration since nocorresponding grooves in the samples could befound when these were extruded.
Before extrusion of the samples, the buckled partof the edges had to be sawn off in the workshop.The sampling tubes were then placed verticallyin a special extrusion rig where they were pushedout by a hydraulic piston.
The sampling tubes can be re-used after a newcutting edge has been turned. However, it mustbe expected that a certain length of the tube islost after each sampling operation and thenumber of times the tube can be re-used is there-fore limited.
3.52 Core drilling Core drilling was performed with the Geobor-Striple tube wire line core sampling system. Thisequipment was originally designed for takingcores in rock, but techniques for taking cores inclay tills have also been elaborated (Jonsson etal. 1995), Fig. 51.
Drilling is performed with a rotating drill bit andflushing with a drilling fluid. The drilled out corehas a diameter of 102 mm and is inserted into aplastic sample tube with a length of 1.5 metres.The sampler can be equipped with different typesof shutter, which are selected according to thetype of soil or rock in the core. After drilling outa core with the same length as the sample tube,the core is drawn up inside the tube with the aidof a wire which is first lowered inside the drillrods and hooked onto the sampling tube.
The sampling tube can be split lengthways andthen opened for inspection and classification ofthe core material directly on site. It can also beused as an integral tube, which is an advantagewhen it is to be sealed and used as a container fortransporting and storing the cores.
The Geobor-S equipment can be used in a widerange of stiff soils and rock. During operation, itis possible to vary the design and construction ofthe drill bit, the drilling fluid and its pressure andflow, the position of the inlet of the flushing flu-id, the applied vertical force, the applied torqueand the speed of rotation. As mentioned above,the type of shutter is also selected depending onthe material in the drilled-out core.
It has been found that �impregnated drill bitswith matrix quality� are required for drillingthrough pieces of flint in limestone, while �sur-face set bits� yield better core qualities in clay
Field Investigations

Investigations and Load Tests in Clay Till 67
till, particularly when this contains layers ofcoarse soils (Jonsson et al. 1995). The appliedvertical force is regulated according to the stiff-ness of the soil or rock. The force must be suffi-ciently high to make the drill bit cut, but exces-sive force increases both the wear on the drill bitand disturbance of the soil. The flow of the flush-ing medium also has to be carefully controlled. Arise in the pressure indicates that the flushingchannels are becoming clogged, whereas exces-sive pressure or flow creates excessive erosion inthe soil. The other parameters must also be regu-lated more or less continuously as drilling pro-ceeds and the composition of the soil or rockvaries. It has been shown that high quality sam-ples can be obtained in this way even in complexsoil profiles. However, handling of the equip-ment then becomes more demanding and re-quires a very skilled and experienced operator.
Flushing with water, which is the normal drillfluid, entails an obvious risk of the soil sampleabsorbing water during the sampling operation.Dueck (1997) found indications that this may bethe case also in clay till. Furthermore, whenflushing with water, a considerable amount ofwater is pumped down into the ground and thenflows up to the ground surface. Even if it is col-lected here, the drilling operation often entails aconsiderable soaking of the adjacent ground. Thecoring operation with the Geobor-S equipment inthe current project was therefore moved a short
distance away from the test area where most ofthe other investigations and subsequent load testswere performed.
The drilling operation was performed to providea continuous core from the ground surfacethrough the various layers of clay till and into thebedrock. A core with a total length of about 15metres was therefore taken. Drilling was per-formed with the utmost care and all the experi-ence previously acquired was utilised. The wholeoperation occupied two full working days.
Success in core drilling is often measured interms of the recovery ratio, i.e. the ratio betweenthe length of the core brought to the ground sur-face in relation to the drilled length. In this re-spect, the operation was a total success, since thecores fully corresponded to the drilled lengthwithin the measuring accuracy, (carpenters rule).For determination of the soil profile, the samplescould thus be considered to be excellent. Howev-er, the quality of soil samples for testing strengthand deformation properties depends also onwhether the properties have been preserved dur-ing the sampling operation and on how carefullythey are transported to and stored in the laborato-ry and other handling before the actual tests areperformed. In the Geobor-S system, which wasoriginally designed for rock, the cores are takenin plastic sample tubes with a relatively low ri-gidity. The split tubes have practically no rigidity
Fig. 51.Principle for the coring system inGeobor-S and example of a coretaken in Baltic clay till. The core istaken with a split sample tube and theupper half is removed for inspectionof the sample. Atlas Copco andJonsson et al. (1995).

SGI Report No 5968
and also the intact tubes are relatively flexible.This means that the samples can hardly be liftedand handled without some bending occurringwhen they contain soil samples. Their weight andlength also normally prevent the most carefultransport in a private car.
The cores taken in the current project were im-mediately sealed and wrapped in an additionalsheet of plastic. They were then transported care-fully to a padded section of the floor in a lorryand transported to the laboratory 400 km away,where they were stored in a room with controlledtemperature and humidity before testing. Thecores were removed from the tubes by slitting thetubes lengthways at two opposite sides in theworkshop and then lifting off one half of thetube. They were then inspected and divided intoselected samples for different types of testing. Ifthe tests were not to be performed directly, thesamples were wrapped in plastic and returned tothe store room.
There is thus a considerable risk that Geobor-Ssamples of soils will undergo a significantamount of disturbance during transport and han-dling, and this should be taken into account whendiscussing the quality of the samples. This re-mark applies both in general and to the presentproject.
Field Investigations

Investigations and Load Tests in Clay Till 69
4.1 GROUND WATER OBSERVATIONSIn the ground water observations, it was foundthat the response in open standpipes was veryslow. Reliable measurements of the pore waterpressure and its fluctuations in clay till thereforerequire the use of closed piezometers. Problemswith the long-term stability of such piezometerswere encountered and these are believed to berelated to chemical reactions and development ofgases. Great care therefore has to be taken in theselection of tips, filters and pipes in order toavoid such problems as far as possible.
4.2 SOUNDINGS
CPT-testsCPT-tests yielded a fairly good picture of thestratigraphy and composition of the soil layers.However, the tests only penetrated the Baltic claytill and mixed clay till, and stopped at the transi-tion to the North-east till. The reason for this stopwas primarily excessive side friction on theprobe itself, which could not be eliminated withmeasures such as friction reduction for the drillrods. CPT-tests in the North-east till would re-quire much heavier equipment than what is readi-ly available in Sweden, in addition to new, morerobust CPT-probes designed for very high sidefriction. The CPT-tests should be performed withmeasurement of pore pressure and preferablywith the use of slot filters and grease in the meas-uring system.
The undrained shear strength could be evaluatedusing relations between the Danish field vaneand CPT-tests similar to those proposed by vari-ous Danish researchers. The CPT-tests providecontinuous curves with depth and are more ra-tional to perform than the vane tests, since thelatter have to be performed at the bottom of pre-drilled holes.
Because of the great heterogeneity of the materi-al, a relatively large number of tests have to beperformed in order to obtain a measure of thevariation and results that are representative forthe bulk of the soil mass.
Dynamic probing testsDynamic probing tests can be used for all typesof clay till. However, they require the rod frictionto be almost completely eliminated and, particu-larly in the North-east till, a heavy-super heavyprobing method to be used. The interpretation ofthe undrained shear strength in the clay till pro-posed by Butcher et al. (1995) yielded reasonablevalues.
Soil-rock drillingSoil-rock drilling with continuous registration ofthe six drilling parameters yielded a fairly goodpicture of the stratigraphy and the variation insome of the soil properties. However, no quanti-tative values of properties could be evaluated.This is probably the most rational soundingmethod for obtaining an overall picture of thesoil stratigraphy and the depth to bedrock. Thequality of the bedrock can also be estimated withthis method.
Seismic CPT-testsSeismic CPT-tests could be used to determine theshear wave velocities down to the top of theNorth-east clay till, i.e. as deep as the probe pen-etrated. The scatter in the results was very largein this heterogeneous material and the signalnoise was also considerable. Several tests at dif-ferent points together with a substantial amountof filtering and averaging were therefore requiredto obtain a relevant picture of the variation inshear modulus in the profile.
4. Experience from the field tests
SGI Report No 5970
Field Experiences
4.3 IN SITU TESTS
Resistivity measurementsGeo-electrical surface measurements proved togive a good picture of the variation in the soilcomposition both vertically and horisontally.They are thus a useful supplement to the sound-ings for creating a relevant soil model for theinvestigated area.
Field vane testsDanish field vane tests are often used as refer-ence tests in clay till. However, they are time-consuming since they have to be performed atthe bottom of predrilled holes and the scatter inthe test results is often considerable. The tests areoften performed in combination with samplingby auger, which makes the method more rational,but CPT-tests are still to be preferred.
Dilatometer testsDilatometer tests are rational, particularly whenthe reading of the values is automated, and canbe performed down to the same depths as theCPT-tests. The results were surprisingly uniformand the evaluated soil profile was fairly relevant.The estimated coefficients of earth pressure wereconsistent with what was estimated from thepressuremeter tests and what was estimated em-pirically from the overconsolidation ratios ob-tained from oedometer tests. The overconsolida-tion ratios were estimated fairly well with therelations proposed by Powell and Uglow (1988)for non-fissured soils. However, the undrainedshear strengths became too low when estimatedwith any of the commonly used methods for clay.The estimated moduli appear to be of relevantsizes, which will be discussed further when com-pared to the results of the plate load tests. Theestimated moduli in the Baltic clay till were ofapproximately the same size as those measured atreloading in the oedometer tests. In the mixedclay further down, they were lower or much low-er than the corresponding oedometer values. Thedisturbance when inserting the dilatometer bladein the mixed clay till may thus be expected tohave been significant to considerable.
Pressuremeter testsPressuremeter tests have been performed accord-ing to the Menard procedure and the procedurewith a number of unloading-reloading loops pro-posed by Ekdahl and Bengtsson (1996). Bothtypes of test are performed in predrilled holes.Self-boring pressuremeter tests in this type ofsoil had previously been shown to be very diffi-cult to perform, Skanska Teknik (1998).
The preparation of the test cavity was best per-formed by using a combination of an auger withhollow stem and rods and the original tool de-signed by Menard, (Baguelin et al 1978). Theauger was then used to prepare a straight holedown to just above the test level and the Menardtool was used to prepare the final test cavity be-low. Thick bentonite drilling mud was used tostabilise the holes and it was found to be veryimportant to lower the pressuremeter probe andstart the test without any unnecessary delay. Be-cause of the large content of flint particles in thesoil, a �canvas cover� was used on the probe.This entailed a significant resistance to expan-sion in the probe itself and required very carefulcalibration.
The Menard type tests were straightforward toperform and interpret. There was some scatter inthe results, which may be related to variation inboth cavity quality and soil properties, but ingeneral a fairly consistent picture of the variationin soil properties was obtained. This relates toboth horizontal stresses, yield and limit pressuresand pressuremeter moduli.
The more advanced pressuremeter tests withvolume controlled expansion of the probe andseveral unload and reload cycles were muchmore time-consuming. The tests can be rational-ised considerably by running them with a compu-ter-controlled electric motor instead of manually.A programme for this purpose has recently beenpresented by Holmén and Lindh (1999). Thesame type of results as for the Menard type testswas obtained when evaluating the new tests simi-lar to the Menard procedure. An allowance for

Investigations and Load Tests in Clay Till 71
rate effects had to be made for the evaluation oflimit pressure and undrained shear strength.
The results from the unload-reload loops werefairly consistent, particularly when the stress andstrain dependence was evaluated with the pro-posed alternative method. The unload-reloadloops are performed to enable an evaluation ofthe properties in an overconsolidated range in atest cavity in which the effects of disturbancewhen creating the test cavity have largely ceasedto affect the results. This goal was apparentlyachieved. Also the creep effects evaluated bykeeping the pressure constant during the expan-sion of the probe yielded consistent results.
4.4 SAMPLING
Open tube samplingSampling with the open tube sampler was a rela-tively simple operation in the two upper layers ofclay till, although it required a considerableamount of equipment. In this case, a large hollowstem auger was used for predrilling to the sam-pling depth. This in turn required the use of apowerful drill rig. The sampling tubes were easi-ly prepared from standard steel tubes and theadapter for the drill rods was a fairly simple con-struction. However, this required access to awell-equipped workshop.
The pressing down of the thin-walled tubes wasalso relatively easy until large objects, whichbuckled the cutting edge, were encountered. Thiseffectively stopped the penetration and in mostcases determined the length of the sample. With-drawal of the sampler did not entail any prob-lems with retaining the samples. Neither did seal-ing, transportation and storage of the sampleswithin the steel tubes present any difficulties.The quality of the samples as judged by inspec-tion both in the field and after extrusion in thelaboratory appeared to be good.
The later extrusion of the samples required ac-cess to a workshop, where the buckled ends ofthe tubes were first sawn off. It then required a
rig with a powerful hydraulic jack in which thetubes were placed and fixed vertically and thesamples pushed up and out of the tubes. Re-useof the sample tubes then required re-turning ofthe cutting edges in the workshop.
Core drillingCore drilling was performed with a Geobor-Striple tube wire line system. The procedure fol-lowed the recommendations given by Johnssonet al. (1996) and experienced operators at LundUniversity. This made it possible to obtain a con-tinuous core with 100 % recovery ratio. The op-eration was time-consuming and taking a 15 mlong core through the layers of clay till and onemetre into the bedrock occupied two full workingdays, including preparations and clean-up opera-tions.
The quality of the cores was found to vary. Thefirst disturbance effects during sampling werefound in the uppermost 1 � 1.5 metres, where thedrill bit apparently did not drill through all thelarge objects in the soil, but partly tore themloose and mixed them into the soil mass. Theconsistency of this part of the core was thus con-siderably softer than the rest of the profile. Forthe rest of the layer of Baltic clay till, the qualityof the cores appeared to be good. In the mixedclay till with frequent layers and pockets ofcoarse material, the flushing medium appears tohave caused erosion. In this material, there werea number of cavities and the large pores betweenthe coarse gravel and cobble size particles weresometimes clean or only partly filled with finermaterial. In the North-east clay till further down,the sample quality appears to have been good.
The samples were brought up to the ground in-side plastic tubes. These were pushed out of theencasing steel tubes on a horizontal workingbench. During this operation and subsequenttransfer to the transport vehicle, as well as trans-port and handling in the laboratory, it was almostimpossible to fully protect the slender 1.5 m longplastic tubes from bending moments resultingfrom the weight of the core itself. The handlingand transport of the cores in such a way that they
SGI Report No 5972
remained as undisturbed as possible was thusfound to be a major problem and the degree towhich this was successful is uncertain. Somedevelopment of the equipment and the handlingand transport procedure is called for if the equip-ment is to be used regularly for taking undis-turbed soil samples. However, for regular sam-ples of rock and for soil samples used only forinspection and classification, this is not a greatproblem.
Also the core samples required access to a work-shop where the plastic tubes could be split openand the cores parted into suitable lengths forspecimen preparation.
Field Experiences

Investigations and Load Tests in Clay Till 73
5.1 ROUTINE TESTS
GeneralThe routine tests and classifications performed inthis project were intended as supplements to theprevious investigations performed by Dueck(1995). Classifications and a detailed descriptionof the soil profile were made on the continuouscore taken with the Geobor-S sampler. Someadditional determinations of the grain size distri-bution were also made in this context in order toverify the classifications based on inspection.Routine tests and detailed classification were alsoperformed on all specimens in the triaxial tests.This was done to enable a comparison of theresults with existing empirical relations based onparameters such as void ratio, clay content andwater content. Also the specimens in the oedom-eter tests were classified and tested in regard todensity and water content. With respect to theheterogeneity of the material, the tests were asfar as possible performed on the bulk of the spec-imen. When it was necessary to part the speci-men, care was taken to ensure that the tested soilwas representative of the bulk of the material.The only exceptions were determination of liquidlimit, where large grains shall be excluded, anddetermination of specific density, where the larg-est particles were also excluded.
ClassificationThe continuous core obtained with Geobor-Sproved to be of varying quality. The first sampledown to 1.5 metres depth appeared to be some-what remoulded. At this shallow depth, the soilwas less stiff and the effective stress level wasprobably insufficient to keep large particles inplace and allow them to be drilled through. In-stead, they appear to have been torn loose andremoulded into the more fine-grained soil matrixtogether with some of the flushing water. This
problem appears to have been restricted to thetopmost metre in the soil profile and the samplesare generally of better quality further down.However, problems with erosion of some of thematerial in the soil matrix were also detected incoarse gravelly layers further down in the profile.
The layering found in the profile in this pointwas according to Table 3.
Examples of the cores can be seen in Figs 52 a-h.
The profile is in general agreement with the pic-ture of the layering in the test field found byDueck (1995). As has been pointed out earlier,the detailed layering varies from point to pointwithin the test field. Therefore, the profile foundin the continuous core cannot be applied to thetest results from the various other tests withoutconsiderable caution. A further classification ofthe soil in the test field was made for the samplestaken with the tube sampler. These samples weretaken at the test area, but the profile is not contin-uous and many details, in particular zones withcoarse soils, are therefore left out. It should benoted that also this profile is not necessarily quiterelevant for the adjacent tests within the test area.A further classification was therefore made onsamples taken with a screw auger at the centre ofeach plate loading test after these tests had beencompleted. The results of these are shown to-gether with the results of the load tests. For theother tests, the general picture will have to suf-fice.
However, the classification of the samples takenwith the tube sampler is fully relevant for theother laboratory tests performed on these sam-ples. The classification for the samples at thispoint was as follows, (Table 4):
5. Laboratory tests

SGI Report No 5974
Table 3. Classification of continuous core obtained by Geobor-S.
Depth, m Classification
0-0.15 Dark-brown topsoil composed by organic silty clay with infusions of sand and gravel and a high contentof plant remains
0.15-0.45 Dark-brown topsoil composed by organic silty clay with pieces of bricks and tiles and infusions of sand, graveland plant remains
0.45-0.70 Yellow-brown rust-stained silty clay till with some root threads and gravel size particles0.70-1.08 Yellow-brown silty clay till rich in gravel size particles of limestone and flint with small layers or pockets of sand
and some root threads1.08-1.23 Yellow-brown silty clay till with particles of limestone and flint1.23-1.55 Brown-grey clay till with infusions of sandy clay till and small silt pockets, some root threads and rust stains.1.55-2.2 Brown-grey clay till2.2-2.4 Brown-grey clay till with a thin layer of clayey silt and small pockets of silt2.4-3.75 Brown-grey clay till with significant content of grains of limestone3.75-4.1 Brown-grey clay till mixed with layers of gravelly soil4.1-4.2 Brown-grey clay till4.2-4.6 Brown-grey clay till mixed with layers of gravelly soil4.6-4.8 Brown-grey sandy silty clay till4.8-5.0 Brown-grey somewhat clayey silty sand5.0-5.1 Brown-grey sandy silty clay till5.1-5.15 Brown-grey silty sand5.15-5.32 Brown-grey sandy silty clay till5.32-5.38 Grey mixture of gravel and cobbles from clay shale and crystalline rock5.38-5.45 Grey gravelly sandy clay till5.45-5.52 Grey cobble (covering the whole cross section of the core)5.52-5.84 Grey gravelly sandy clay till containing a drilled through slice of clay shale5.84-6.45 Dark-grey sandy gravelly till with cobbles/slices of clay shale. The gravel is a mixture of crystalline rock and
clay shale particles, mainly the latter.6.45-6.5 Black slice of clay shale6.5-6.95 Dark-grey gravelly silty clay till6.95-7.02 Black slice of clay shale7.02-7.4 Dark-grey gravelly silty clay till with gravel and cobble size particles of mainly clay shale7.4-7.5 Cobble of granite covering the whole cross section of the core7.5-8.23 Dark-grey sandy silty clay till with layer of silty sand and infusions of cobbles of both clay shale and
crystalline rock8.23-8.53 Dark-grey sandy silty clay till8.53-8.7 Dark-grey gravelly sandy silty clay till8.7-9.0 Dark-grey sandy silty clay till with thin layers of silty sand and infusions of a sand pocket, gravel and cobbles of
clay shale9.0-9.65 Dark grey sandy gravelly clay till with infusions of cobbles and a small amount of lime9.65-10.38 Dark-grey sandy silty clay till with a thin layer of sand and infusions of gravel size particles of clay shale.10.38-11.9 Dark-grey sandy silty clay till with several, about 50mm thick, layers of sand and one layer with rounded gravel
and cobble size particles of crystalline rock11.9-12.0 Black slice of clay shale12.0-12.3 Dark-grey sandy silty clay till12.3-12.6 Dark-grey gravelly sandy silty clay till12.6-13.4 Dark-grey sandy silty clay till with a small pocket of sand13,4-13.7 Dark-grey sandy silty clay till with several thin layers of sand. Infusions of gravel size particles13.7-13.85 Dark-grey gravelly sandy silty clay till13.85- Black bedrock of clay shale
Laboratory Tests

Investigations and Load Tests in Clay Till 75
Fig. 52 Examples of cores from the test field at Tornhill.
a) core from 0 to 0.5 metre depthshowing the transition from top soil toBaltic clay till
b) core from 1.7 to 2.3 metres depth showing homogeneousclay till
c) core from 3.9 to 4.6 metres depthshowing clay till mixed with layers ofgravelly soil
d) core from 5.3 to 5.8metres depth showinggravel and cobbles inthe mixed till layer
e) core from 5.9 to 6.5 metres depthshowing sandy, gravelly till at thebottom of the layer of mixed till
f) core from 6.5 to 7.5 metres depth showinggravelly, silty clay till with cobble sizeparticles at the top of the North-east till
g) core from 7.5 to 9.0metres depth showingsandy, silty North-east claytill with infusions of cobbles
h) core from 13.6 to 14.8metres depth showing thetransition from North-eastclay till to bedrock of clayshale

SGI Report No 5976
Laboratory Tests
A comparison with the classification in the previ-ous profile shows that the main layering is thesame, although the levels and composition ofvarious layers may differ somewhat and the pres-ence of various sand and silt layers or pocketsmay only be very local.
Grain size distributionThe grain size distributions in the layers of claytill generally coincided with the bands for thedifferent types of clay till presented by Dueck(1995). However, when the pockets and layers ofsand, silt and gravel are considered, the bulk ofthe material becomes somewhat coarser. Thisshould be taken into account when the averageproperties of the soil mass and larger specimensare considered.
DensityThe densities were measured on the specimen foroedometer and triaxial tests and for the core sam-ples also as an average for the whole length ofthe 1.5 m long samples. The test specimens hadvolumes of 115.45 and 314.16 cm3 for the oed-ometer tests on 70 and 100 mm diameter speci-mens respectively. The volumes for the triaxialtests were approximately 500 and 1500 cm3 forthe 70 and 100 mm diameter samples, dependingon the height of the individual specimen.
The measured densities in the upper two layersof clay till had a slightly higher average than inthe previous investigations by Dueck: 2.18 t/m3
compared to 2.13 t/m3. However, the scatter inthe results was considerably less and it was alsopossible to discern a certain trend with a higherdensity around 2 metres depth, decreasing to aminimum at 3 m depth and then slowly increas-ing with depth, Fig. 53. The selected specimensfrom the continuous cores showed slightly lowerdensities than the specimens from the tube sam-ples. However, this is probably a result of theselection of the specimens, in which particularlyuniform fine-grained sections of the cores werechosen for testing. The average densities of thecores were fully compatible with those from thetube samples. The measured densities in the coresamples of North-east till were approximately2.42 t/m3.
Dry densityThe dry density of the specimens was determinedfrom the volume of the specimens before testingand the dry mass of the carefully collected mate-rial after testing. The corresponding variationwas found in the measured dry densities, with anaverage value of approximately 1.85 t/m3 in theupper two layers of clay till and 2.25 t/m3 in theNorth-east till, Fig. 54.
Table 4. Classification of samples taken by tube sampler.
Depth, m Classification
0.8-1.1 Fine sand1.1-2.8 Sandy silty clay till with grains of limestone2.8-3.3 Silty clay till with grains of limestone and infusions of small sand pockets3.3-3.4 Silty sand with infusions of clay3.4-3.7 Silty clay till with thin layers and small pockets of silt3.7-3,85 Sandy silty clay till3.85-4.25 Sandy silty clay till mixed with layers of gravelly silty sand4.24-5.1 Silty clay till with grains of limestone5.1-5.4 Sandy clay till5.4-5.7 Sandy clay till with coarse gravel size particles

Investigations and Load Tests in Clay Till 77
Fig. 54. Measured dry densities in the specimensfrom the test field.
Fig. 53. Measured densities in the testspecimens from the test field.
0
2
4
6
8
10
12
1,5 1,7 1,9 2,1 2,3 2,5
%XON�GHQVLW\��W�P�
'HSWK��P
0
2
4
6
8
10
12
1 1,5 2 2,5
'U\�GHQVLW\��W�P�
'HSWK��P

SGI Report No 5978
Laboratory Tests
Particle densityThe particle density was measured mainly on thefiner part of the material, i.e. gravel size particleswere not included. This is common practicewhen the results are intended to be used for eval-uating grain size distributions from sedimenta-tion analyses. The determinations were per-formed according to the Swedish standard meth-od. The measured values ranged between 2.6 and2.7 t/m3. No systematic variation with depthcould be found within the investigated depthinterval between 1.1 and 5.6 metres. The particledensity varies with the mineral composition ofthe tested specimen. Since the coarsest particleswere not included, the measured values may besomewhat misleading for the bulk of the materi-al, particularly in the more gravelly specimen.
A special study was made on one of the speci-men. This was first divided into different frac-tions and the particle density for each fractionwas determined. For the finest material, wherecoarse sand and gravel size particles had beensorted out, a particle density of 2.68 t/m3 wasmeasured. When coarser sand particles wereincluded, the value decreased to 2.66 t/m3. Theaverage particle density for a large number ofgravel particles was 2.68 t/m3. However, whenthe gravel particles were divided into differentmineral groups, the particle densities varied con-siderably from about 2.49 t/m3 in soft limestone/chalk to 2.76 in black crystalline rock. Harderlimestone and clay shale had particle densities of2.58 t/m3 and 2.70 m3 respectively. In order toobtain a correct value of the average particledensity of the specimen, all particles would thushave to be included in the determination.
Natural water contentThe natural water content of the specimen wasdetermined from the mass of the specimen beforetesting and the dry mass after testing. The scatterof the determined values is within almost exactlythe same range as in the previous investigation,Fig. 55. The values from the specimens from theupper core samples are generally on the highside, but again this is probably a result of theselection of the specimens.
Liquid limitOnly a few determinations were made of the liq-uid limit. The determined values all fell withinthe range of scatter in the previous investigationsby Dueck (1995).
Clay contentThe clay content was determined for the triaxialtest specimens. It was also determined for anumber of specimens from the core samples inorder to check the classification and for samplestaken later by auger at the points where the loadtests had been performed. A comparison with thedata presented by Dueck shows that the clay con-tents are similar, Fig. 56. However, the valuesfrom the present investigation are generally onthe low side and particularly the uppermost lay-ers are considerably more sandy and less clayeythan was found in the previous investigation.This can mainly be attributed to the local varia-tion. The picture may also be somewhat affectedby the sampling technique, since more of thecoarse material may have been included in thesamples taken by tube sampler than in those tak-en by auger.
Fig. 55. Determined natural water contents inthe specimens from the test field.
0
2
4
6
8
10
12
0 5 10 15 20 25 30
1DWXUDO�ZDWHU�FRQWHQW���
'HS
WK��P

Investigations and Load Tests in Clay Till 79
Void ratioThe void ratio is calculated from the dry densityand the particle density. The value of the particledensity strongly affects the calculated void ratio.There are some doubts regarding the relevance ofthe determined particle density for the bulk ofthe material and the calculated void ratios maythus contain errors. The particle densities havetherefore also been checked against the calculat-ed saturation ratios as described below. When thecalculated saturation ratios have exceeded 100%, the particle densities have been increasedsomewhat, unless this in turn would yield unrea-sonable values in view of the soil compositionand possible ranges. The void ratios for the spec-imens in the present investigation were similarbut generally somewhat lower than in the previ-ous investigation, Fig. 57. This is a combinedresult of slightly higher dry densities and some-what lower particle densities in the present inves-tigation.
Degree of saturationThe degree of saturation is calculated from thedry density, the particle density and the naturalwater content. When calculated with the deter-mined values for particle density, the degree ofsaturation in general was between 100 and 105%.There was one lower value and a few higher val-ues. Saturation ratios higher than 100 % are im-possible and indicate errors in the parametersused for the calculation. In this case, the particledensity was considered as the value whose rele-vance might be questioned. Somewhat highervalues of the particle density would yield satura-tion ratios of 100 % and this correction was ap-plied for those specimens where the ratio was toohigh. This meant only a small correction for themajority of the determined values. However,since no particle density higher than 2.72 t/m3
has been measured in this or previous investiga-tions in this type of clay till, this value was usedas an upper limit. The saturation ratios thus cal-culated were 100 % for the entire profile exceptfor one specimen, in which the ratio was onlyabout 90 %, Fig. 58. Half of this specimen con-
Fig. 56. Measured clay contents in specimen from the test field.
0
2
4
6
8
10
12
0 5 10 15 20 25 30 35 40 45
&OD\�FRQWHQW���
'HS
WK��P
Dueck 1995
Serie2
Specimen in present investigation
Below test plates

SGI Report No 5980
Laboratory Tests
Fig. 57. Calculated void ratios in the present investigation.
Fig. 58. Calculated degree of saturation.
0
2
4
6
8
10
12
0 0,1 0,2 0,3 0,4 0,5 0,6 0,7
9RLG�UDWLR'HS
WK��P
0
2
4
6
8
10
12
0 20 40 60 80 100 120
'HJUHH�RI�VDWXUDWLRQ��6U���
'HS
WK��P
Investigations and Load Tests in Clay Till 81
sisted of sand and the capillarity of the sand wasprobably not high enough to fully retain the wa-ter when the specimen was pushed out of thesampling tube. At a few levels, the calculatedsaturation ratios are still slightly above 100%,which is believed to be related to other measur-ing errors. These values all relate to particularlylow void ratios and the lower this ratio is, themore sensitive the calculated saturation ratiobecomes to possible errors in the measurementsof masses and volumes.
5.2 OEDOMETER TESTSOedometer tests were performed as incremental-ly loaded tests. For this purpose, two new oed-ometers were constructed, one for 70 mm diame-ter specimens and the other for 100 mm diameterspecimens. The oedometer rings were thick-walled to prevent lateral expansion during thetests. The 70 mm diameter ring had a height of30 mm and the 100 mm diameter ring a height of40 mm.
The oedometer rings were fixed and drainagewas provided at both ends of the specimen. Thevertical compression of the specimen was meas-ured by two transducers fixed on opposite sideson the ring to measure the penetration of thepiston into the ring. Measuring errors arisingfrom compliance of the apparatus were thusavoided. The loading of oedometers of this sizecould not be performed conveniently in the usualway with weights on balanced loading arms.Instead, two different types of pneumatic andhydraulic loading system were used.
The smallest oedometer used an existing loadingframe, in which a regulated air pressure acts on apiston through a pair of bellows with very largearea and thereby creates a very high and stableload. For the largest oedometer, a special loadingsystem was constructed. In this assembly, a con-stant pressure device from Wykeham Farrance,originally intended for constant high pressure intriaxial cells, was used together with a high pre-cision hydraulic cylinder. The hydraulic cylinderhad a built-in return spring and a non-dismissiveinternal friction because of the necessary sealing.
This meant that it was relatively difficult toachieve exact predetermined load steps, particu-larly in the unloading-reloading loops. However,once a change in pressure had created a certainload, this remained very stable with time. Theapplied load was measured by load cells andrecorded continuously throughout the tests inboth arrangements.
For the smallest oedometer, the specimen waspushed directly from the sampling tube into theoedometer ring, which was lubricated internallywith high pressure grease. The specimen wasthen cut off above and below the ring, and theend surfaces were carefully prepared to besmooth and flush with the ends of the ring. Theoedometer ring was weighed before this opera-tion and then again containing the prepared spec-imen. Smaller cavities from particles that had tobe removed were filled in with as solid materialas possible. In this process, some of the speci-mens had to be rejected because the cavities weretoo numerous and/or large and were thus expect-ed to significantly influence the results. A newspecimen was then prepared from the same sam-ple tube. One tube from about 5.6 m depth hadsuch a high content of gravel size particles that itwas impossible to prepare a satisfactory speci-men from the sample.
For the l00 mm oedometer, a uniform fine-grained part of the continuous core was selectedand cut off. One end was then levelled sufficient-ly for the piece to stand steady and vertically,and the sides of the cylindrical sample were thencarefully trimmed. This trimming was necessarysince the shutter in the sampler creates finegrooves along the perimeter of the sample. Thesample has a diameter of 102 mm and the trim-ming was thus limited to about 1 mm which isalso sufficient to remove the grooves. Thegreased oedometer ring was then carefullythreaded over the sample and the same procedurefor preparing the end surfaces as for the smalleroedometer specimen commenced.
The oedometer ring with the specimen was thenplaced in the oedometer bowl on top of a dry

SGI Report No 5982
Laboratory Tests
filter stone. A guide ring for the piston was fittedand the piston, also with a dry filter stone, wasapplied. The deformation transducers were fittedand the assembled oedometer was placed in theloading frame. The first load step was applieddirectly and water was then filled into the oed-ometer bowl until the specimen was fully sub-merged. The deformations were then studied andif there was any tendency for the sample to suckup water and swell, the load was increased toprevent this. The loading was then applied with anew doubled load step after approximately each24 hours. At a load of about 90 % of the estimat-ed preconsolidation pressure, an unloading cyclestarted with a reduction in the load of 50 % ineach step down to the in situ effective verticalstress. From this point, the specimen was reload-ed in the same sequence as the first loading up tothe maximum stress well beyond any preconsoli-dation pressure. The maximum stress in the testswas between 3000 and 5000 kPa. As mentionedearlier, it was difficult to apply an exact prede-termined load in the large oedometer, but theload actually achieved was measured by the loadcell and achieving exactly doubled (or halved)load steps is not important.
A preconsolidation pressure was estimated be-fore the tests on the basis of the results of thevane shear tests and the previously performedoedometer tests. This means that the preconsoli-dation pressures may have been exceeded beforeunloading in some of the tests. However, this hasnot obviously affected most of the evaluated pa-rameters and it is possible to rectify the discrep-ancy for the others. The duration of each loadstep of 24 hours was followed in principle, but insome load steps, in particular directly after re-versal of the loading procedure, it was possible toshorten this time since the primary deformationswere soon completed and it was possible to ex-trapolate the small secondary creep effects withsufficient accuracy.
When evaluating a preconsolidation pressure,there should ideally be a distinct break in thestress-strain relation with a decrease in moduluswhen passing this yield stress. No such breaks
were obtained in the curves and the preconsoli-dation pressures had to be evaluated using lessdistinctive changes and less certain methods.Recommendations for evaluation of preconsoli-dation pressures in clay tills have been made byJacobsen (1992) and Trankjaer (1996).
According to Jacobsen (1992), the preconsolida-tion pressure can be evaluated by the classicalCasagrande construction using an additional aux-iliary construction, Fig. 59 a. The stress-strainrelation for the loading part of the curve is thenplotted in log-linear scales. The ultimate straightline relation in this plot is never reached in thetests, but has to be constructed. This is done byadding a common value of stress, s´k, to all thepoints on the curve until this new stress-straincurve forms a straight line in the plot. The high-est emphasis should then be put on the part forhigher stresses to become a straight line. Thepreconsolidation pressure can then be estimateddirectly from
NF´5.2´ σσ =
The straight line can also be used in a Casa-grande type of evaluation. The point with mini-mum radius on the curve is then found at theeffective vertical stress s´
k and the preconsolida-
tion pressure is found where the bisectrix of theangle between the tangent to the curve and a hor-izontal line from this point cuts the straight line,Fig. 59 b.
In international practice, the stress-strain curve isoften plotted for the strains at 100 % primaryconsolidation, whereas in Sweden the strains at24 hours after load application are used. Bothapproaches have been used for the tests in thisproject, but no apparent difference was obtained.
A further indication of the preconsolidation pres-sure can be obtained by studying the variation ofthe coefficient of secondary compression, e
s, in
the tests. This value is then evaluated for eachload step in the first loading and plotted againstthe applied load, Figs 60 a and b.

Investigations and Load Tests in Clay Till 83
The outcome of this method varies depending onthe stability of the trends in the variation and thecloseness of the nearest point to the preconsoli-dation pressure. In some cases, there was verygood agreement between the preconsolidationpressures estimated in this and the previousways, but in other cases the evaluation becamevery subjective, with a large possible interval dueto the wide span between the doubled loads.
Trankjaer (1996) proposed a third method ofinterpreting the preconsolidation pressure. In thismethod, the variation of the modulus with verti-cal effective stress is studied. Ideally, a relativelyhigh modulus should be measured as long as thesoil is overconsolidated. At the preconsolidationpressure, there should be a decrease in modulusand for stresses above the preconsolidation pres-sure the modulus should increase almost linearlywith the effective stress, Fig. 61. As mentioned,no such decrease in modulus was observed in thetests. The moduli for high stresses formedstraight line relations with the effective stressesand the moduli at low stresses were higher thanthis relation. However, the evaluation of thepoint at which the relation connects to thestraight line relation was very subjective. It could
Fig. 59. Evaluation of preconsolidation pressure according to Jacobsen (1992)a) Construction of the straight virgin compression line and evaluation of s´k
b) Evaluation of preconsolidation pressure according to Casagrande with support from thepreviously constructed straight line and evaluated s´k
Fig. 60. Evaluation of preconsolidationpressure based on the variation increep properties (Jacobsen 1992 basedon Akai 1960).a) Evaluation of coefficient ofsecondary compression.b) Estimation of preconsolidationpressure based on the variation increep rate.
a) b)
a)
b)

SGI Report No 5984
Laboratory Tests
in principle be estimated anywhere in the intervalof doubled load between the last point with amodulus above the straight line relation and thefirst point on it.
All four types of evaluation were applied to theresults of the oedometer tests and the evaluatedvalues were weighted with the highest stress puton the first types of evaluation, Fig. 62.
The compression modulus varies with stress anddepends on whether the soil is overconsolidatedand in a reloading state or if it is normally con-solidated and in a virgin loading state. For clays,the modulus in the virgin loading state is normal-ly a linear function of the effective vertical stress,dM = M´ds´. For coarse and stiff soils, the rela-tion can often be approximated to M = M´s´.This was also found in all oedometer tests in thisproject. The factor M´ is a material parameterand varies with the type of soil, (Janbu 1970).
For determination of the modulus in the overcon-solidated state, an unloading is performed from astress just below the preconsolidation pressure tothe in-situ effective vertical stress and the soil isthen reloaded. The reloading modulus varies withthe stress at which unloading starts and the stressto which unloading has been performed. It istherefore very important for these stresses to becorrect if the reloading modulus, i.e. the modulusin the overconsolidated state, is to be evaluateddirectly from the curve.
A more general way of describing the modulus inthe overconsolidated state is to make use of theempirical observation that the stress strain curveat unloading forms a straight line when the stressis plotted in a logarithmic scale, Fig. 63. Theunloading modulus (or swelling modulus), M
s,
can then be written as
V
Y
V D0
´σ=
Fig. 61. Evaluation of preconsolidation pressure from variation in modulus,Trankjaer 1996.

Investigations and Load Tests in Clay Till 85
Fig. 62. Example of a result of an oedometer test on clay till, Tornhill 1.25m depth, 70 mm diameter.a) Stress-strain curve in linear scales.b) Stress-strain curve with stress in logarithmic scale and evaluation of preconsolidationpressure.
0
2
4
6
8
10
12
14
0 500 1000 1500 2000 2500 3000 3500
(IIHFWLYH�YHUWLFDO�SUHVVXUH��N3D
&RPSUHVV
LRQ���
0
2
4
6
8
10
12
14
1 10 100 1000 10000
(IIHFWLYH�YHUWLFDO�SUHVVXUH��N3D
&RPSUHVV
LRQ���
a)
b)

SGI Report No 5986
Fig. 62. c) Variation in secondary compression and evaluation of preconsolidation pressure.d) Variation in modulus and evaluation of preconsolidation pressure.
c)
d)
0
0,05
0,1
0,15
0,2
0,25
0,3
0 500 1000 1500 2000 2500 3000 3500 4000
(IIHFWLYH�YHUWLFDO�SUHVVXUH��N3D
εV
����OR
JW
Laboratory Tests

Investigations and Load Tests in Clay Till 87
The parameter as is the swelling index , which isa material parameter, (Larsson 1986).
At reloading, the stress-strain relation normallybecomes a fairly straight line when plotted inlinear scales, i.e. the modulus is almost constant,up to the point of unloading where the curvebreaks and retains the relation for the first load-ing. If the swelling index is known, the swellingand the reloading modulus can thus be calculatedfor any case of unloading and reloading. Becauseof creep effects, the swelling does not start im-mediately when the stress is lowered below thepreconsolidation pressure and the reloadingcurve does not pass through the point on the vir-gin compression line at the preconsolidationpressure where the unloading started. The cross-over point between the unloading and reloadingcurves occurs at the same strain as when unload-ing started, but at a pressure bs´
c, where b is £ 1.
b is a material parameter which is close to 1 incoarse materials such as sand and gravel, butdecreases with decreasing average grain size andincreasing plasticity to about 0.8 in clays. It isabout 0.9 in silts and most clay tills, and this val-ue was found to be relevant also in the presenttests.
The recompression modulus, Mrl, after a soil has
been unloaded from the preconsolidation pres-sure, s´c, to a pressure s´min can thus be calculat-ed from
−=
min
min
´
´ln
´´
σσ
σσ
F
V
F
UO
ED
E0
In some cases, particularly when the unloadinghas been performed to effective stresses close tozero, the recompression curve has been found todeviate significantly from the straight line rela-tion. Also the modulus at reloading then has to beexpressed as a function of stress. However, thiswas not found in the present series of tests.
If the unloading has started just below the pre-consolidation pressure and been performed to thein situ vertical stress, the reloading modulusevaluated directly from the curve and the calcu-lated modulus should coincide. However, theresults will be different if a) the preconsolidationpressure has been misjudged prior to the test andunloading has started at higher or lower stressesthan the appropriate, and b) it has been difficultto unload to the exact in situ stress, as in the caseof the larger oedometer. Fig. 64 shows the direct-ly measured values compared to those calculatedusing the evaluated preconsolidation pressuresand swelling indexes. As can be seen, there isgeneral agreement, but in some cases the correc-tions for different stresses are relatively large.
Apart from the oedometer tests in the presentinvestigation, test results have also been reportedby Dueck (1996). These results have been inter-
Fig. 63. Evaluation of the swelling index as.

SGI Report No 5988
Laboratory Tests
preted in the same way and yielded correspond-ing ranges of possible preconsolidation pres-sures. The average values obtained by the meth-ods described above are included for purposes ofcomparing and supplementing the general pic-ture.
The evaluated preconsolidation pressures form aconsistent picture with a preconsolidation pres-sure of 600�700 kPa in the stiff layer of Balticclay till at approximately 2 metres depth, de-creasing to 400�500 kPa in the mixed till belowand then increasing as the boundary to the North-east till is approached, Fig. 65.
The values are fairly consistent, but should beseen as minimum values since the sampling mustbe expected to have caused some disturbance.Even if consistent, the values are still only about50�70 % of those evaluated empirically usingthe Danish relation with the field vane
85.0/1
00 ´4.0
´´
=
στσσ Y
F
where tv is the undrained shear strength meas-ured by the vane and s´
0 is the effective overbur-
den pressure.
The preconsolidation pressures evaluated fromthe specimen taken with the Geobor-S samplerare considerably lower in the uppermost part ofthe profile. This is related to the excessive distur-bance caused by this sampling technique in thepart of the profile with very low effective stress-es. These values have therefore been disregard-ed. At greater depths, the quality of these sam-ples improves. However, no tests were per-formed on specimens from this sampler at depthsgreater than 3.2 metres since it was not possibleto find sections of the cores down to 6 metresdepth that were sufficiently free from coarsegravel size particles to prepare specimens for thelarge oedometer.
Fig. 64. Comparison between measured and calculated reloading moduli.
0
50
100
150
200
250
0 50 100 150 200
0HDVXUHG�UHORDGLQJ�PRGXOXV��03D
&DOFXODWHG�FRUUHFWHG�UHORDGLQJ�PRGXOXV��03D

Investigations and Load Tests in Clay Till 89
For the North-east till, there are only results fromtwo oedometer tests reported by Dueck (1997).The results from these two tests differ widely.There are also results from three triaxial tests inwhich the specimens were consolidated forstresses lower than the preconsolidation pressure.When using the above empirical relation appliedto the measured strength in relation to the consol-idation stress, additional indications are obtainedof the possible level of the consolidation pressurein the North-east till. The average of the dataindicates a preconsolidation pressure of about1100 kPa in this till, Fig. 66.
The modulus numbers, M´, are approximately 30in the upper two layers of till, Fig. 67. The varia-tion relates to the composition of the individualspecimen. The values from the tests on the coresamples are thus generally among the lowest,since the specimens were prepared from selected,homogeneous, fine-grained parts of the cores.The highest values are found for specimens richin gravel size particles and specimens containinglayers or pockets of sand. With regard to compo-sition, all measured values fall within the rangeproposed by Janbu, (1970). Since the specimensare not fully representative of the more coarse-
Fig. 66. Evaluated preconsolidation pressuresfor the soil profile at Tornhill. Filledsymbols represent oedometer tests andopen symbols data estimated fromtriaxial tests.
Fig. 65. Evaluated preconsolidation pressuresfrom oedometer tests in the Baltic andmixed clay tills.
0
1
2
3
4
5
6
0 200 400 600 800
3UHFRQVROLGDWLRQ�SUHVVXUH��N3D
'HSWK��P
70mm tube samples
Geobor-S
Dueck 1996
0
2
4
6
8
10
12
0 200 400 600 800 1000 1200 1400 1600
3UHFRQVROLGDWLRQ�SUHVVXUH��N3D
'HSWK��P

SGI Report No 5990
Laboratory Tests
grained parts of the profile, a slightly higher av-erage modulus number of 35, for example,would be more representative of the bulk of theupper two layers of clay till. The correspondingvalues from the two oedometer tests in the coars-er North-east till are approximately 50.
The swelling index, as, also depends on the com-position of the soil: the coarser the material, thelower the swelling index. A tentative relationbetween the swelling index and the average grainsize, d
50, was presented by Larsson (1986). Ac-
cording to this relation, swelling indexes between0.1 and 0.7 %, with an average of 0.3 %, mightbe expected for the grain size distributions meas-ured in the profile. From the tests, swelling in-dexes between 0.08 and 0.65 % were evaluated,with an average of 0.27 %. The lowest valueswere obtained in specimens containing layers orpockets of sand. A more detailed comparisoncannot be made since the grain size distributionsfor the individual oedometer specimens were notdetermined.
5.3 TRIAXIAL TESTSThe triaxial tests in this project were primarilyperformed on the samples from the tube sampler.This is because these samples, based on the re-sults from the oedometer tests, were judged to beof better quality in the upper layers and also be-cause some erosion appeared to have occurred inthe core samples from the coarser layers furtherdown. A small number of additional tests wereperformed on samples from the cores in theNorth-east till, which were judged to be both ofbetter quality and the only type of samples avail-able for this type of material. The triaxial testspreviously performed by Dueck (1997) were allperformed on specimens taken with the Geobor-S sampler.
Most of the new tests were performed as consoli-dated undrained tests with a relatively high back-pressure. The high back-pressure was not prima-rily required for saturation, since the specimenswere fully saturated in their natural condition, butto ensure that no negative pore pressures would
Fig. 67. Evaluated modulus numbers from the oedometer tests.
0
1
2
3
4
5
6
7
8
0 10 20 30 40 50 60 70 80
0RGXOXV�QXPEHU�0�'HS
WK��P

Investigations and Load Tests in Clay Till 91
develop during the tests. The previous tests byDueck were performed according to Danish prac-tice as CU
u=0 tests, in which the pore pressure is
zero throughout the test and the volume of thespecimen after consolidation is kept constantthrough regulation of the cell pressure.
The specimens were pushed out from the sam-pling tubes and the end surfaces were prepared inthe same way as the oedometer specimen. For thecore samples, a uniform part of the core was se-lected after the tube had been split and the corewas then parted and the specimen lifted out. Notrimming of the sides was performed and gener-ally there were no cavities that had to be filled in.The intended height of the specimen was twicethe diameter, but the final height was often con-siderably shorter because of large gravel sizeparticles encountered in the intended end surfac-es.
The base pedestals and the top caps in the triaxialapparatuses were supplied with polished stainlesssteel plates in order to reduce the end friction. Anarrangement recommended by authors such asLacasse and Berre (1988) and DeGroot andSheahan (1995) was used with greased rubber
membranes between the specimen end surfacesand the polished steel plates, and with filter paperstrips on the specimen periphery in contact withring-shaped filters at the rear of the polishedplates, Fig. 68.
The specimens were first consolidated for a ver-tical stress of about 90 % of the preconsolidationpressure evaluated from the oedometer tests witha K0 value of 0.5. The consolidation was per-formed stepwise and during this process a checkwas made to ensure that the axial and volumetricstrains were small and compatible. The strains atthe end of the consolidation were typically about2 %. In a few of the tests, the strains tended to beexcessive at the end of the consolidation and thefinal stresses were then slightly reduced.
After the first consolidation, the samples werebrought back to in situ stresses. According to thetest results, the horizontal stresses are higher thanthe vertical stresses in the field. The stresses inthe triaxial tests were therefore brought back toisotropic stress conditions corresponding to theestimated horizontal stresses. No attempt wasmade to create a condition with lower verticalstresses since this was expected to create moreproblems than benefits.
Fig . 68. Arrangement for reducing end frictionin triaxial tests

SGI Report No 5992
Laboratory Tests
After the consolidation stages, the specimenswere subjected to compression tests with con-stant rate of axial deformation. The undrainedtests were performed with the normal rate ofdeformation of 0.6 %/hour and the drained testswere run ten times slower to ensure full drainage.These rates are more or less standard rates in theSGI laboratory. The rates were also checkedagainst estimated coefficients of consolidation toensure that they would provide the required de-grees of pore pressure equalisation and excesspore pressure dissipation respectively.
The undrained tests were run to an axial com-pression of 15 %. At this strain, all the samplesexcept one had passed failure or asymptoticallyapproached an end value. All the samples alsoshowed a pronounced dilatant behaviour. Nopeak strengths were developed in the tests. Afteran initial stiff response in approximately the first0.5 % of axial compression, where the pore pres-sure increased, there was a significant change inthe stress-strain curve with a much slower in-crease in shear stress with strain and the porepressures started to decrease. This decrease inpore pressure continued until both the stress-strain and the pore pressure-strain relations hadasymptotically reached their end values, Fig. 69.
The corresponding stress-paths showed a steeprise towards the failure line within the first �elas-tic� part of the test and just after yield attained astraight line relation corresponding to the failureconditions in terms of fully mobilised effectiveshear strength parameters, Fig. 70.
The arrangement for reducing end friction ap-peared to perform well since uniform specimensdeformed in a uniform way, i.e. they remained asstraight cylinders for most of the tests. In somecases, single shear planes developed at the veryend of the tests well after the maximum shearstress had been reached. However, the �friction-less� end surfaces were no guarantee for a uni-form deformation of the specimen. Several speci-mens contained layers of different materials andthe deformations after yield then became concen-trated to the weakest of these layers, Fig. 71.
Some specimens also contained single largegravel particles located asymmetrically in thespecimen. This eventually led to tilting of thespecimen, causing it to partly slide off the endplates. This also facilitated the formation of asingle shear surface at the end of the test.
The measured undrained shear strengths variedin the same way as the preconsolidation pres-sures, Fig. 72. The measured undrained shearstrength was thus about 175 kPa in the Balticclay till, decreasing to about 120 kPa in themixed clay till and then increasing in the transi-tion to the North-east till. The only exception tothis picture was a specimen from 3.8 m depth.This specimen contained an unusually highamount of sand and gravel size particles and wasvery close to the boundary of what should beclassified as clay till. The shear stresscontinued to increase and the pore pressures todecrease also at large strains, and no end valueseemed to be approached within the testingrange. The specimen deformed in a fairly uni-form manner, but at the end of the test, coarseparticles could be seen to protrude from the soilmass and the specimen had started to tilt, Fig. 73.Results from the triaxial tests performed byDueck (1997) have been included for compari-son. These tests were carried out for a differentpurpose and somewhat different consolidationstresses were therefore used, which may haveaffected the results to some degree. Only tests inwhich the preconsolidation stresses have notbeen exceeded during the consolidation havebeen included.
A comparison has been made between the meas-ured shear strengths and empirically expectedstrengths with consideration to preconsolidationand overconsolidation ratio.

Investigations and Load Tests in Clay Till 93
Fig. 69. Example of a result from an undrained triaxial test on clay till from Tornhill

SGI Report No 5994
Fig. 70. Stress paths from the undrained triaxial tests in Baltic and mixed clay till.
Laboratory Tests

Investigations and Load Tests in Clay Till 95
Fig. 71.Two-layer specimensafter testing.
Fig. 72. Measured undrained shear strengthsfrom the triaxial tests
Fig. 73.The specimen from3.8 metres depthafter testing.
0
1
2
3
4
5
6
0 50 100 150 200 250
8QGUDLQHG�VKHDU�VWUHQJWK��N3D
'HS
WK��P
Present investigation
Dueck 1997

SGI Report No 5996
According to Danish experience, (Steenfelt andFoged (1992), the undrained shear strength, c
u,
can be evaluated from
Λ= 2&5DFYX 0´σ
The exponent L is assumed to be 0.85, which is afairly normal value also for other types of clay.The normal value of a is given as 0.4.
A back calculation has been made of the value ofa using the consolidation stresses and the im-posed overconsolidation ratio in the first step ofthe consolidation together with the measuredundrained shear strength and the value 0.85 forL. This gives an average value of a of 0.41, ex-cluding the odd value for 3.8 metres depth,Fig. 74. The measured strength values are thus to
be considered as normal for the stress history. InDanish practice, the above relation is often usedto estimate the preconsolidation pressure usingundrained shear strengths from field vane tests.The specimens are then reconsolidated for 90 %of this pressure before being brought back to thein situ stresses and tested. This procedure, if ap-plied in the present project, would most probablyhave resulted in very good correspondence be-tween the strengths measured in the field vanetests and the triaxial tests. However, it would alsohave led to excessive strains during consolidationand would not have yielded an independentmeasure of the strength based on �undisturbed�sampling and laboratory testing. The estimationof the shear strength would then in both cases bebased mainly on the results of the field vanetests.
There is thus a considerable difference betweenthe shear strengths as measured by triaxial testsin the laboratory using results from oedometertests for determination of stress history and theshear strengths measured by field vane tests inthe field. This difference may be attributed partlyto disturbance of the samples during sampling,transport and handling, and partly to uncertain-ties in the evaluation of the oedometer tests.However, it is difficult to estimate the degree towhich the difference can be attributed to the re-spective cause and the exact relevance of theresults from the field vane tests.
The additional triaxial tests on North-east tillwere performed on specimens consolidated foreffective stresses corresponding approximately tothe in situ stresses. The specimens were thus notinitially reconsolidated to estimated preconsoli-dation stresses. A similar test had also been per-formed by Dueck (1997). The results from thesetests yielded undrained shear strengths between550 and 825 kPa. These values may be consid-ered to be on the low side since a proper recon-solidation had been omitted. The only type ofavailable reference data consists of the results ofthe dynamic probing tests, which indicated und-rained shear strengths of about 1000 kPathroughout the layer of North-east clay till.
Fig. 74. Estimation of factor a from thetriaxial tests.
0
1
2
3
4
5
6
0 0,2 0,4 0,6 0,8
D FX��σ�Y��2&5����
�
'HSWK��P
Laboratory Tests

Investigations and Load Tests in Clay Till 97
The effective strength parameters were estimatedfrom the stress paths. The stress paths for all thetests in the Baltic and mixed clay tills formedfairly straight line relations for the failure states,with inclinations corresponding to a friction an-gle of 30°, Fig. 70. The variation could mainlybe interpreted as a variation in the effective cohe-sion intercept c´. In the tests on North-east till,the stress paths indicated friction angles of 32-33°.
In Swedish practice, the cohesion intercept c´ forclay is normally evaluated empirically from thepreconsolidation pressure or the undrained shearstrength as 0.03s´
c or 0.1c
u. A comparison be-
tween the evaluated values of c´, cu and s´c fromthe laboratory tests in the present project yieldsthe average relations c´/ s´
c = 0,027 and c´/c
u =
0,08, Fig. 75. There is a considerable spread inthe measured relations, but the common relations
appear to be useful also for a rough preliminaryestimate in these types of clay till.
Two different sets of empirical relations havepreviously been elaborated for clay till to link theundrained shear strength, the effective frictionangle and the cohesion intercept with other soilproperties. These are the Danish Jacobsen (1970)and the Swedish Hartlén (1974) relations. Ac-cording to Jacobsen, the shear strength propertiescan be estimated from the void ratio e
k , (» e
0 ),
using the formulas
N3DHF NH
X,10 )77,0( 2,1−⋅⋅=
N3DHF NH ,430´ )3.7( ⋅−⋅=
°⋅−= ,93.35´NHφ
e = the base of the natural logarithm, (= 2.718)
The corresponding, more elaborate formulasproposed by Hartlén take both void ratio, watercontent, w
0, and clay content, l
c, into account.
The clay content is calculated from materialpassing the 20 mm sieve.
Fig. 75. Relations between effective cohesionintercept, preconsolidation pressureand undrained shear strengthmeasured in the laboratory tests onclay till from Tornhill.
0
2
4
6
8
10
12
0 0,05 0,1 0,15 0,2
1RUPDOLVHG�FRKHVLRQ�LQWHUFHSW
'HSWK��P
c´/sigma´c
c´/sigma´c,drained testsc´/cu
- " -
Mean value
Mean value
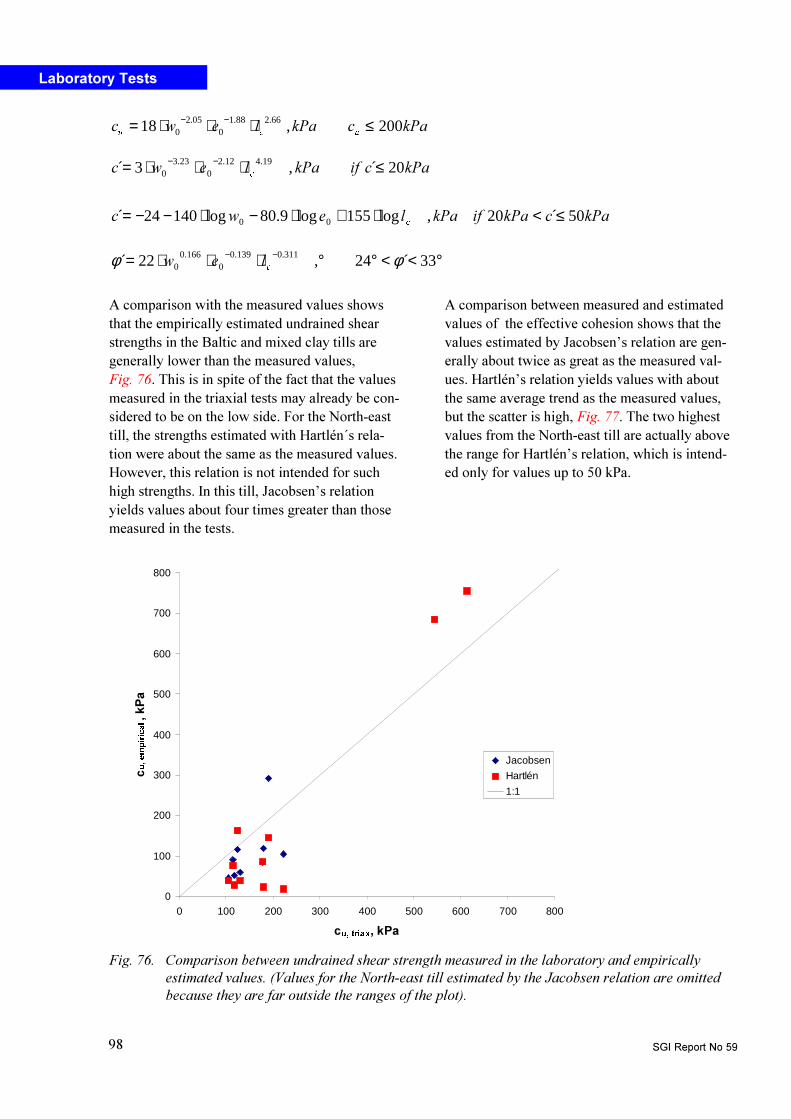
SGI Report No 5998
A comparison with the measured values showsthat the empirically estimated undrained shearstrengths in the Baltic and mixed clay tills aregenerally lower than the measured values,Fig. 76. This is in spite of the fact that the valuesmeasured in the triaxial tests may already be con-sidered to be on the low side. For the North-easttill, the strengths estimated with Hartlén´s rela-tion were about the same as the measured values.However, this relation is not intended for suchhigh strengths. In this till, Jacobsen�s relationyields values about four times greater than thosemeasured in the tests.
A comparison between measured and estimatedvalues of the effective cohesion shows that thevalues estimated by Jacobsen�s relation are gen-erally about twice as great as the measured val-ues. Hartlén�s relation yields values with aboutthe same average trend as the measured values,but the scatter is high, Fig. 77. The two highestvalues from the North-east till are actually abovethe range for Hartlén�s relation, which is intend-ed only for values up to 50 kPa.
N3DFN3DOHZFXFX
200,18 66.288.10
05.20 ≤⋅⋅⋅= −−
N3DFN3DLIN3DOHZF
N3DFLIN3DOHZF
F
F
50´20,log155log9.80log14024´
20´,3´
00
19.412.20
23.30
≤<⋅+⋅−⋅−−=
≤⋅⋅⋅= −−
°<<°°⋅⋅⋅= −− 33´24,22´ 311.0139.00
166.00 φφ
FOHZ
Fig. 76. Comparison between undrained shear strength measured in the laboratory and empiricallyestimated values. (Values for the North-east till estimated by the Jacobsen relation are omittedbecause they are far outside the ranges of the plot).
0
100
200
300
400
500
600
700
800
0 100 200 300 400 500 600 700 800
FX��WULD[��N3D
F
X��HPSLULFDO
��N3D
Jacobsen
Hartlén
1:1
Laboratory Tests

Investigations and Load Tests in Clay Till 99
The span for the measured friction angles wasvery narrow, 30° in the Baltic and mixed claytills and 32°�33° in the North east till. The rang-es for the estimated friction angles were alsovery narrow, 30° to 33.5° for Jacobsen�s relationand 30.5° to 33° for Hartlén�s relation. However,33° is the upper limit for Hartlén�s relation andthis had to be applied for most of the tests. In thisway, a fairly good correlation was obtained, withslightly higher estimated values than those meas-ured, Fig. 78.
The general outcome of this comparison is thatthe accuracy of both types of empirical estima-tions proposed for clay till was poor. The empiri-cal relation proposed by Hartlén and which hasbeen extensively used in this part of south-westSweden yielded values of the undrained shearstrength which in general were too low. The scat-ter in the relation between measured and estimat-ed effective cohesion was larger than for the sim-ple relation normally used for clays in Swedenand the more elaborate estimation of the effectivefriction angle did not improve the simple as-
sumption of a constant friction angle of 30° inSwedish clays.
The drained triaxial tests were performed mainlyin order to check the relevance of the effectivestrength parameters evaluated from the und-rained tests also for drained conditions.Three such tests were performed as supplementsto the undrained tests. However, one of the speci-mens buckled at an early stage in the test andthus only two of the results are relevant. Thestress strain curves from these tests also showeda dilatant behaviour after a small deformationwith elastic compression. The maximum rate ofdilation then occurred at a relatively small axialdeformation and the maximum value of shearstress was reached within 3 % of axial deforma-tion. The tests were terminated after 5 % axialdeformation and the deformations up to this pointwere uniform, with the specimens remaining asstraight cylinders.
The specimens in the two tests came from differ-ent levels in the Baltic and mixed clay till, but the
Fig. 77. Comparison between effective cohesion intercepts measured in the laboratory andempirically estimated values.
0
20
40
60
80
100
120
0 10 20 30 40 50 60 70
F�WULD[���N3D
F�
HPS���N3D
Jacobsen
Hartlén
1:1
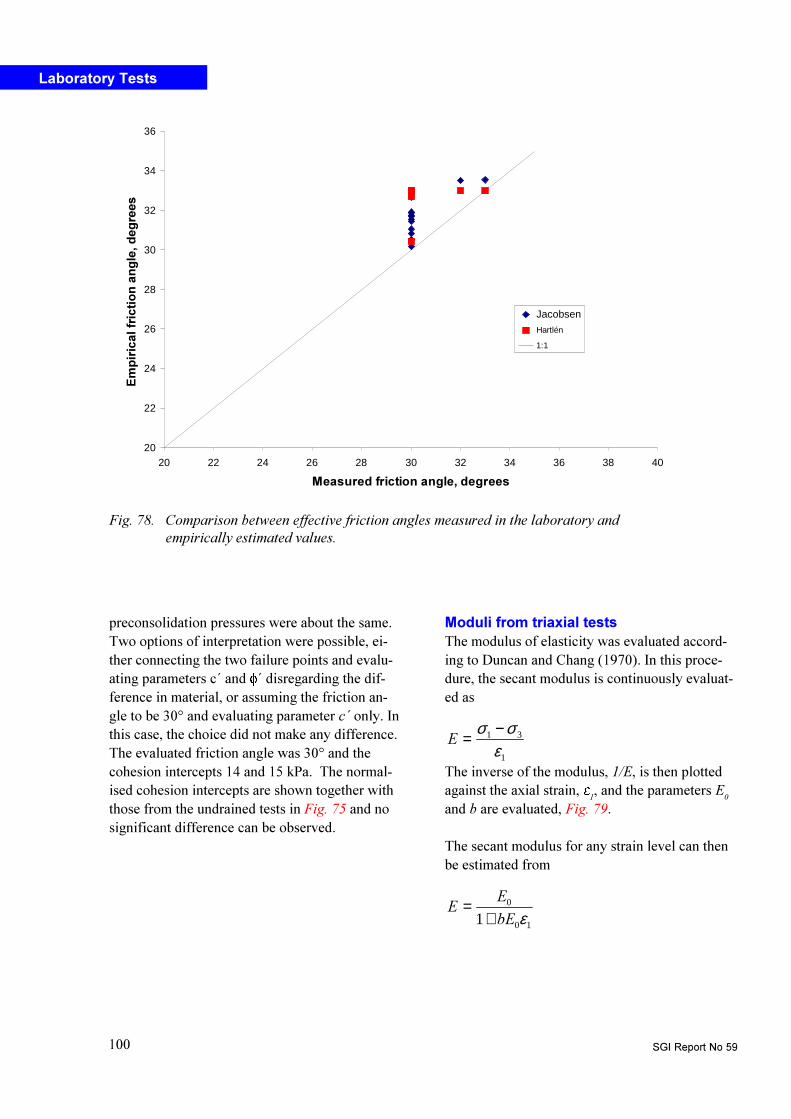
SGI Report No 59100
preconsolidation pressures were about the same.Two options of interpretation were possible, ei-ther connecting the two failure points and evalu-ating parameters c´ and f´ disregarding the dif-ference in material, or assuming the friction an-gle to be 30° and evaluating parameter c´ only. Inthis case, the choice did not make any difference.The evaluated friction angle was 30° and thecohesion intercepts 14 and 15 kPa. The normal-ised cohesion intercepts are shown together withthose from the undrained tests in Fig. 75 and nosignificant difference can be observed.
Fig. 78. Comparison between effective friction angles measured in the laboratory andempirically estimated values.
20
22
24
26
28
30
32
34
36
20 22 24 26 28 30 32 34 36 38 40
0HDVXUHG�IULFWLRQ�DQJOH��GHJUHHV
(PSLULFDO�IULFWLRQ�DQJOH��G
HJUHHV
Jacobsen
Hartlén
1:1
Moduli from triaxial testsThe modulus of elasticity was evaluated accord-ing to Duncan and Chang (1970). In this proce-dure, the secant modulus is continuously evaluat-ed as
1
31
εσσ −=(
The inverse of the modulus, 1/E, is then plottedagainst the axial strain, e
1, and the parameters E
0
and b are evaluated, Fig. 79.
The secant modulus for any strain level can thenbe estimated from
10
0
1 εE((
(+
=
Laboratory Tests

Investigations and Load Tests in Clay Till 101
The evaluation is sensitive to possible errors inthe measurement of deformation in terms ofcompliance of the system and imperfect fittingbetween the specimen ends and the end plates.The evaluation is therefore normally restricted tostrains larger than 1 per cent in the ordinary tri-axial set up. The range can be increased to some-what smaller strains by using internal transducersinside the cell mounted on the specimen. Howev-er, this also limits the upper working range,which has to be large for clay till specimens.
The evaluation was performed for all undrainedtests on Baltic and mixed clay tills. The fit of astraight line to the plotted relations varied. Forsome of the tests, the fit was good from verysmall strains and throughout the test. For othertests, the straight line relations held only for thefirst part of the tests and in a few tests, there washardly any straight line relation to be found at all.For the latter curves, only the slope of the curve
Fig. 79. Evaluation of parameters E0 and b. Data from the undrained triaxial tests on a specimenfrom 2.2 m depth at Tornhill.
at an inflexion point and at relatively smallstrains could be evaluated. The evaluated valuesof E0 and b have been weighted with considera-tion to the portion of the curve for which they arerelevant and are plotted in Fig. 80. a and b.
There may be a certain trend in the results withrelatively high initial moduli in the Baltic clay tilland lower values in the mixed clay till, whichincrease again as the transition to the North-easttill is approached. In a similar way, the b-valuesmay be found to be lower in the Baltic clay till,higher in the mixed clay till and then decreasingagain with depth. However, the values are de-pendent on effective stress, stress history, thecomposition of the particular specimen and thedegree of disturbance caused by sampling andhandling, and the scatter is large.
0
0,05
0,1
0,15
0,2
0,25
0,3
0,35
0,4
0,45
0 0,02 0,04 0,06 0,08 0,1 0,12 0,14 0,16
ε�
��(�����03D�
1/( �
E
( � �=38.5 MPaE = 2.64
1

SGI Report No 59102
Fig. 80. Evaluated parameters for description of the modulus of elasticity from undrained triaxial tests.The size of the symbols represents the allotted weight for the results.
a) E0
0
1
2
3
4
5
6
0 20 40 60 80 100 120
(���03D
'HS
WK��P
0
1
2
3
4
5
6
0 1 2 3 4 5
3DUDPHWHU�E
'HS
WK��P
b) Parameter b
Laboratory Tests

Investigations and Load Tests in Clay Till 103
6.1 HANDLING OF SOIL SAMPLESThe handling of the samples in the laboratoryentailed some difficulties, which are not encoun-tered for more normal soil samples. The 1.5 mlong slender tubes with core samples weighed upto 30 kg and were very difficult to handle with-out introducing bending moments. Both types ofsampling tubes had to be brought into the work-shop before the samples could be taken out. Thebuckled part of the steel tubes had to be sawn offbefore the sample could be pushed out whereasthe plastic tubes had to be cut through length-ways at two opposite sides. One half of the tubecould then be lifted off and the sample could beparted into selected portions. All this had to bedone without disturbing the samples and withoutlosing some of the water content before the testspecimens could be prepared in the laboratory.This required a fair amount of time and auxiliaryequipment and great care.
6.2 ROUTINE TESTSDue to the heterogeneity of the soil, relativelylarge specimen had to be used to obtain repre-sentative values of bulk density, dry density andwater content. These determinations were madeon the entire specimens for oedometer- and triax-ial tests and thus on volumes ranging from about115 cm3 to 1600 cm3 and dry weights rangingfrom about 250 g to 4 kg.For accurate determination of dry weights andwater contents in clays, the samples should beallowed to cool off in desiccators, which putnew demands on the sizes of the latter. The de-termination of water content could also be affect-ed by layers or lenses of coarser material whichcould not fully retain the water when taken out ofthe sampling tubes.
At determination of particle density, quite differ-ent values may be obtained depending on whatpart of the soil mass is included in the test. The
clay till consists of a heterogeneous mixture ofclay to gravel size particles with occasional cob-bles and boulders. The origin of the individualparticles varies from different crystalline rocks todifferent sedimentary rocks and the sedimentaryrocks have yielded particles ranging from chalkto flint. The determined particle density couldthus vary significantly from specimen to speci-men and may not even be fully representative forthe whole specimen since not all grain sizes wereincluded in the tested material.
The calculated void ratios and saturation ratiosare very sensitive to the particle density and pos-sible errors in the determinations of water con-tent and dry density. The sensitivity increaseswith decreasing void ratio.
The classification of the material is difficult be-cause of the heterogeneity and a full descriptionof the soil profile requires continuous cores.
6.3 OEDOMETER TESTSOedometer tests were performed on both tubesamples and core samples. The tube sampleswere pushed directly from the sampling tubesinto the oedometer ring. The specimen prepara-tion was thus limited to creating smooth end sur-faces flush with the ends of the oedometer ring.This preparation should be limited to prevent lossof water and other disturbances during the prepa-ration. Some protruding coarser objects have tobe removed and replaced during this operationbut this should be limited as far as possible. Sam-ples in steel tubes could not be inspected before-hand. This entailed that a large number of intend-ed specimens had to be rejected and new portionsof the sample had to be pushed out and the prep-aration retried. For one of the samples from themixed clay till, it was not possible to find anyportion from which an oedometer specimencould be prepared.
6. Experiences from the laboratory tests

SGI Report No 59104
The specimen from the core samples had to betrimmed slightly also on the periphery beforethey could be fitted into the oedometer ring. Thedepth of this trimming was restricted to about 1mm. Both this and the subsequent trimming ofthe end surfaces were facilitated by the fact thatthe samples could be inspected beforehand andthat particularly fine-grained and homogeneousportions could be selected.
The oedometer tests have been evaluated using agreat number of approaches; even more than arepresented in this report. In general, none of thesemethods gave clear indications of the preconsoli-dation pressure and the results of a number ofapproaches had to be gathered and weighed be-fore the combined results could yield a probablevalue. The other evaluated parameters in terms ofmodulus number, swelling index and creep ratewere within the limits of what would be expectedfrom empirical experience.
6.4 TRIAXIAL TESTSThe triaxial tests entailed similar problems ofcreating smooth and parallel end surfaces. Anexcess of coarse particles in an intended end sur-face could normally be remedied by decreasingthe height of the specimen. The tests were per-formed with �friction free� end plates and thedeformation of the specimen appeared to be uni-form for most of the test. However, because ofthe heterogeneity of the soil, the specimens oftentended to tilt at the end of the tests and they thenalso tended to slide off the end plates. Thisseemed to be restricted to what happened at largestrains after failure had occurred. It is often rec-ommended to use some type of pins at the centreof the end surfaces to prevent the specimen fromsliding on the end plates. This was not consid-ered to be feasible in the clay till with its abun-dance of coarser particles.
The smallest specimen sizes with 70 mm diame-ter may be considered as minimum sizes for thistype of material. In fact, the results of the testwith the coarsest material showed that the speci-men size in this case was too small. The 70 mmsize should therefore preferably be limited to
non-gravelly soils and larger specimen should beused in tests on coarser material.
The results of the triaxial tests were normal withrespect to the measured preconsolidation pres-sures. However, since the latter were considera-bly lower than what was empirically estimatedfrom the field tests, also the undrained shearstrength values were correspondingly lower. Ac-cording to the results, the effective shear strengthparameters may be estimated with the same em-pirical relations that are normally used for othertypes of clay in Sweden.
Laboratory Experiences

Investigations and Load Tests in Clay Till 105
7.1 PRINCIPLE OF THEPLATE LOADING TESTS
The plate loading tests were performed in orderto check the applicability of different methods ofestimating bearing capacity and settlements forshallow foundations on clay till. The tests wereperformed as a series of tests on square plateswith dimensions chosen in such a way that ulti-mate bearing capacity failure was expected to bereached for at least the smallest plate and withsuch variations that the effect of the stresses ex-tending to various depths could be studied. Thelargest plate also had dimensions similar to anordinary foundation.
Foundations in Sweden are made so deep thatthey are unaffected by frost action, which nor-mally means a foundation level 1.1 � 2.5 m be-low the ground surface, unless special precau-tions are taken. In the plate loading tests, it wasalso desired to lay the plates on top of fairly ho-mogeneous soil below the top soil and desiccatedcrust in order to facilitate interpretation of theresults. In ordinary foundations, part or all of theexcavation for the foundation is often back-filledafter the foundation work has been completed.
Much of the loading equipment is standard forthis type of test, which sets limits on possibledimensions and maximum loads. The loadingequipment consisted of a system of beams,ground anchors and hydraulic jacks and pumps.The main beams consisted of three 17 m longsteel profiles which could be bolted together.Such beams are kept in Swedish National RailAdministration depots distributed throughout thecountry for use in temporary emergency repairsof railway lines and can often be made availablefor loading tests. Because of the high loads, asecondary system of beams was placed acrossand on top of the main beams over the largestplate. The ends of the beams were placed on sup-
ports consisting of wooden rafts of the type nor-mally used to support excavators on soft ground.In this case, they were used to provide firm andlevel bases, and the number of rafts at the endscan also be adjusted to place the beams in a hori-zontal position. The required reaction force canbe provided by dead-weights or by ground an-chors. In this case, it was considered unsuitableto use dead-weights and a system of eight groundanchors was installed. The ground anchors con-sisted of tie rods, which were lowered in pre-drilled holes down to 10 metres in the bedrockand then fixed by pumping in cement grout. Theground anchors were placed in pairs, one on eachside of the ends of the beam systems, and extend-ed well above the beams. Shorter beams wereplaced across the ends of the beam systems andwere tied down with a pre-stress in the tie rods inorder to secure the system.
The dimensions of the reaction system made itpossible to install three plates measuring 0.5 x0.5 m, 1 x 1 m and 2 x 2 m in a row along themain beams without significant interference interms of the same soil mass being affected by thedifferent load tests. The distances between theplates and the loading sequence were also adjust-ed to minimise the influence from a precedingload test on the results from the following loadtests. Thus, the smallest plate was placed at oneend of the row, the largest plate was placed ap-proximately in the middle but somewhat closer tothe smallest plate, and the intermediate plate wasplaced at the other end of the row. The plateswere then tested in a sequence with the smallestplate first and the largest plate last.
No large amount of backfill was put in placeafter the plates had been installed. The plateswere installed 0.2 m deeper than the rest of theexcavation and only the gaps left after removalof the moulds were filled in.
7. Plate loading tests

SGI Report No 59106
The load on the plates was provided by hydraulicpumps and jacks. According to Swedish practice,the load in tests on friction soils is normally ap-plied in steps with a duration long enough toenable a study of the creep rate of the deforma-tions (Bergdahl et al. 1993). For cohesive soils, alonger duration is required to permit for full dis-sipation of excess pore pressures and relatedconsolidation if the drained properties are to bestudied. A minimum of ten steps is normallyused to enable evaluation of both load settlementcurves and failure loads. In tests on friction soilsand in undrained tests on clays, a duration foreach load step of about 8 minutes is normallyconsidered sufficient. In the present series oftests, the tests were performed in steps with dura-tions that were determined with respect to themeasured pore pressures and time settlementcurves. The durations of the load steps weretherefore somewhat shorter for the first loadsteps and then increased at higher loads as thetime-settlement relations changed. The durationswere thus mainly 2 hours for the 0.5 m squareplate, 4 hours for the 1 m square plate and 6hours for the 2 m square plate. The duration ofthe load steps in the unloading and reloadingloops was only about 12 minutes for each step.The pore pressure in the soil below the plate wasmeasured during the tests in order to verify thatfull excess pore pressure dissipation wasachieved.
Different systems for application of both con-stant static loads, cyclic loads and dynamic loadsby hydraulic jacks have been developed at theInstitute. In this case, an electronically operatedsystem was used in which the load was measuredand regulated by means of an electronic load cell.Because of the high loads and pressures and thelong duration of the tests, a back-up system formaintaining oil pressure was installed which wasautomatically engaged if the pressure shoulddrop. This proved to be well-advised, since thefirst oil pump failed at the end of the series oftests.
7.2 INSTALLATION OF PLATESAND INSTRUMENTATION
The reinforced concrete plates were to be cast inplace at the bottom of excavated pits. The groundwater observations in previous years had shownthat the free ground water level would normallybe about 2 m below the ground surface in sum-mertime. However, the spring this year was wet,with a ground water level at the ground surface,and no significant lowering of the ground waterwas observed during the period of the investiga-tions and subsequently. An attempt was made tolower the ground water locally by excavatinglarge holes to 2 metres depth at the ends of theintended excavation for the tests and pumpingout the water from the bottom of these. This con-tinued for a couple of weeks, but no effect wasobserved at the observation points in the testarea. Time was then running short and it wasdecided to perform the excavation and to try tokeep the water out and preserve the soil proper-ties at the bottom of the excavation in the usualway. This entailed the excavation of ditches andpumping at the bottom of the excavation, whileminimising the length of the periods betweenexcavation and reloading by installation of theplates.
The excavation work was started using an exca-vator to about 0.2 m above the foundation level.A 1.3 metre deep pit with base dimensions ofabout 13 x 5 metres was thus excavated. Theslopes at one of the long sides had an inclinationof about 1:1 but the slopes at the other sides weresteeper. Care was taken to perform the last partof this excavation smoothly without excessivedeepening of the pit in the separate digging oper-ations. At two opposite corners of the excavation,holes were dug to 2 metres depth and the pumpswere lowered into these. Ditches were then dugalong the sides of the excavation. The further 0.2metre of excavation for the tests plates was car-ried out manually, Fig. 81. The prefabricatedmoulds were then put in place.
After the excavation work, part of the instrumen-tation below the plates was installed. This con-sisted of settlement gauges. In this stiff soil, the
Plate loading tests
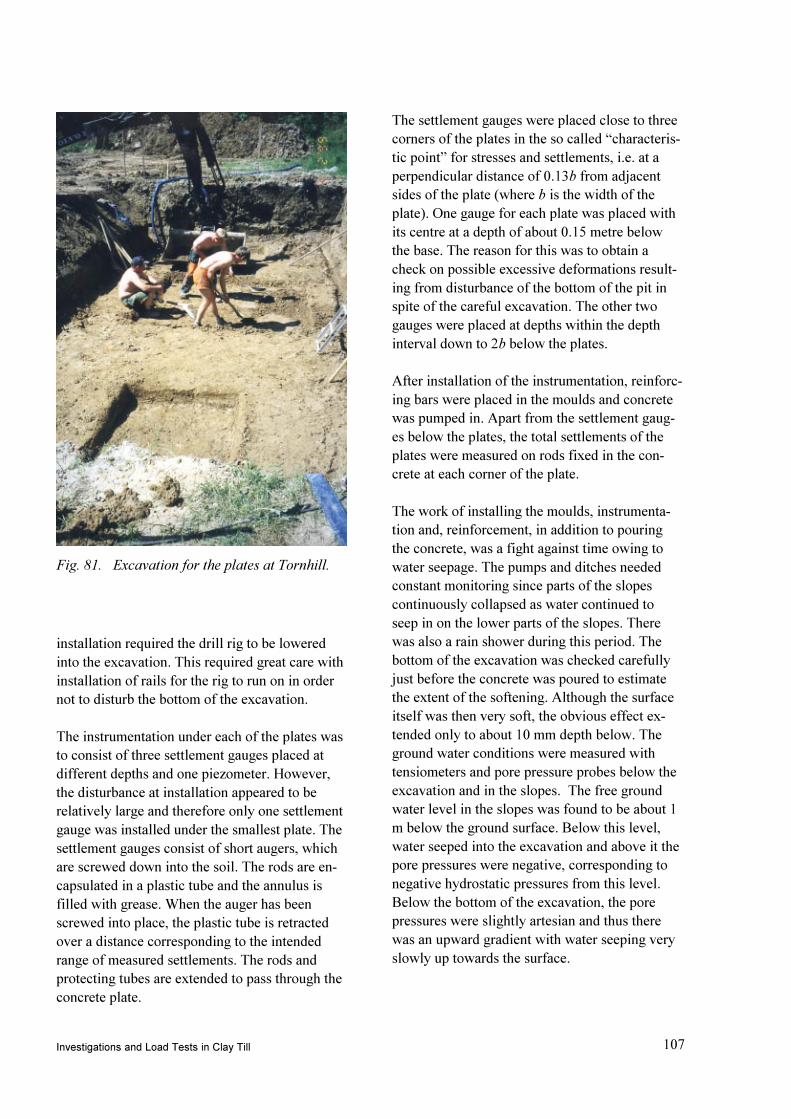
Investigations and Load Tests in Clay Till 107
installation required the drill rig to be loweredinto the excavation. This required great care withinstallation of rails for the rig to run on in ordernot to disturb the bottom of the excavation.
The instrumentation under each of the plates wasto consist of three settlement gauges placed atdifferent depths and one piezometer. However,the disturbance at installation appeared to berelatively large and therefore only one settlementgauge was installed under the smallest plate. Thesettlement gauges consist of short augers, whichare screwed down into the soil. The rods are en-capsulated in a plastic tube and the annulus isfilled with grease. When the auger has beenscrewed into place, the plastic tube is retractedover a distance corresponding to the intendedrange of measured settlements. The rods andprotecting tubes are extended to pass through theconcrete plate.
The settlement gauges were placed close to threecorners of the plates in the so called �characteris-tic point� for stresses and settlements, i.e. at aperpendicular distance of 0.13b from adjacentsides of the plate (where b is the width of theplate). One gauge for each plate was placed withits centre at a depth of about 0.15 metre belowthe base. The reason for this was to obtain acheck on possible excessive deformations result-ing from disturbance of the bottom of the pit inspite of the careful excavation. The other twogauges were placed at depths within the depthinterval down to 2b below the plates.
After installation of the instrumentation, reinforc-ing bars were placed in the moulds and concretewas pumped in. Apart from the settlement gaug-es below the plates, the total settlements of theplates were measured on rods fixed in the con-crete at each corner of the plate.
The work of installing the moulds, instrumenta-tion and, reinforcement, in addition to pouringthe concrete, was a fight against time owing towater seepage. The pumps and ditches neededconstant monitoring since parts of the slopescontinuously collapsed as water continued toseep in on the lower parts of the slopes. Therewas also a rain shower during this period. Thebottom of the excavation was checked carefullyjust before the concrete was poured to estimatethe extent of the softening. Although the surfaceitself was then very soft, the obvious effect ex-tended only to about 10 mm depth below. Theground water conditions were measured withtensiometers and pore pressure probes below theexcavation and in the slopes. The free groundwater level in the slopes was found to be about 1m below the ground surface. Below this level,water seeped into the excavation and above it thepore pressures were negative, corresponding tonegative hydrostatic pressures from this level.Below the bottom of the excavation, the porepressures were slightly artesian and thus therewas an upward gradient with water seeping veryslowly up towards the surface.
Fig. 81. Excavation for the plates at Tornhill.

SGI Report No 59108
Piezometers were installed beneath the plates inorder to check that the tests were drained and thatall excess pore pressures had dissipated at theend of each load step. The piezometers wereelectrical and were intended to be installed atdepths where the pore pressures could be expect-ed to be highest with consideration to stress in-creases and drainage paths. The piezometerswere pushed in at the corners where no settle-ment gauges had been installed and with suchinclinations that they would be positioned cen-trally beneath the plates. After pushing the pie-zometer into place, the drill rods were retracted,leaving only the piezometer connected to a wireand the signal cable in the ground. However, thisoperation had to be performed with the drill rigstanding on the slope of the excavation and theresistance of the soil was so great that the intend-ed depths could not always be fully reached.
The concrete plates were 0.5 metre thick. Oneday after casting the plates, the moulds were re-moved and the gaps between the plates and thesurrounding soil in the excavation were filled inwith excavated soil. The work with setting up thereaction, loading and measuring systems wasthen commenced.
7.3 INSTALLATION OF THEREACTION SYSTEM
The eight ground anchors had been installed byPEAB Grundteknik about one month in advance.The ground surface at each pair of ground an-chors was now scraped off and levelled. Anumber of wooden rafts, or �excavator mats�,were then stacked and adjusted in such a waythat the top surfaces of the stacks were at theintended levels and horizontal. The three railwaybridge beams were placed side by side with theends resting on the stacks at the ends of the exca-vation and then bolted together. Their commoncentre line was carefully aligned with the centreline of the row of plates. Two short beams werethen placed on top and across the ends of thelarge beams, and were connected to the tie rodsfrom the ground anchors. Above the centre of thelargest plate, two other beams were placed on topof and across the railway bridge beams with theirends resting on the two stacks of excavator matsat the sides of the excavation. The ends of thesebeams were connected to the corresponding tiebars in the same way as the ends of the longbeams. The tie rods were pre-stressed and thewhole reaction system was thereby fixed, Fig. 82.
Fig. 82.Reaction systembeing mounted.
Plate loading tests

Investigations and Load Tests in Clay Till 109
7.4 INSTALLATION OFTHE LOADING SYSTEM
The loading system used for the tests at Tornhillconsisted of a hydraulic pump and electronicallyoperated regulation valves, two hydraulic jacksfor different load ranges, corresponding loadcells for measuring the load and providing thesignal for regulating the hydraulic pressure, and acomputer for data collection and regulation of theloading process. A back-up system for the hy-draulic pressure was also installed.
For the two smaller plates, a circular stress distri-bution plate was centred directly on the concrete.The load cell and the jack were then positionedon this plate and on top of them further plateswere laid as required to fill the gap up to the re-action beams. For the largest plate, an additionalsquare stress distribution steel plate covering alarge part of the top surface was laid in positionbefore the above mentioned assembly was put inplace. In order to distribute the load on the reac-tion beams evenly, a short beam was fixed underand across them at the loading point.
Measuring systemThe measuring system consisted of the compu-terised data collection and load regulation sys-tem, the load cells, the piezometers and the dis-placement transducers. The displacement trans-ducers were fixed on special measurement beams(ladders), whose ends rested on the ground out-side the area affected by the particular test. Thedisplacement transducers measured the move-ments of the top of the plate and the settlementgauges in relation to this ladder. The whole sys-tem was protected from sun and weather by tar-paulins, using the reaction beams as a ridge. Themeasurement beam was supplied with a fixedvertical scale and was continuously levelled by ahigh precision instrument in order to check thatthe reference level was stable, Fig. 83.
Fig. 83.Installation of themeasuring system.

SGI Report No 59110
Loading procedureThe load tests were to be performed in steps withmaintained constant loads. In order to ascertainthat all excess pore pressures would dissipateduring the time for each load step, a number ofpreliminary calculations were made using some-what conservative assumptions. On the basis ofthese calculations, a tentative schedule was setup where each load step for the smallest platewas to be applied for 2 hours. The correspondingtimes for the middle and the largest plates were4 hours and 6 hours respectively.
Preliminary calculations of the bearing capacityhad given widely differing results depending onwhich strength parameters were used. However,the preconsolidation pressure in the upper partbelow the plate was estimated to be at least650 kPa and the calculated bearing capacitieswere somewhat or much higher than this value.For the first test plate, which was the smallest 0.5x 0.5 metre plate, it was therefore decided to startwith load steps of 25 kN, corresponding to 100kPa, which would give the desired minimum ofeight load steps.
The first load test resulted in failure after ten loadsteps and it was decided to make the steps some-what smaller in the next test. The 1 m x 1 m platewas thus loaded in steps of 75 kN correspondingto 75 kPa. No direct failure was obtained in thistest, but the frequently used failure criterion ofthe settlement being equal to 10 % of the platewidth was approached.
The maximum design load for the reaction sys-tem varied depending on where the load wasapplied. The tie rods were designed to take amaximum force of 500 kN each, However, thisforce could not be mobilised simultaneously inevery rod and it was difficult to estimate the in-teraction within the beam system. For the 1 m x1 m plate, the load was applied about midway onthe free span of the large beams between theirends and the crossing beams above the 2 m x 2 mplate. The pair of tie rods at the ends of thebeams would have to take about half of the ap-plied load and with a possible imbalance in thesystem, one of them might have to take morethan the other. The loading of the 1 m x 1 m platewas therefore stopped at a load of 1350 kN.
For the 2 m x 2 m plate, the main load would betaken by the crossing beams and their tie rods. Acontribution would also be obtained from thelong railway bridge beams, but this would re-quire a fairly large deflection because of the longspan. The crossing beams and their tie rods weredesigned for a maximum load of 2000 kN. Theloading of the large plate was applied in steps of200 kN, corresponding to 50 kPa, and no failurewas expected. The loading was continued up to atotal load of 2800 kN, where it was stopped be-cause of large and permanent deflections in thecrossing reaction beams, Fig. 84.
The settlements and pore pressures were studiedcontinuously during the load steps. During theinitial steps of each test, the settlements essential-ly stopped within a short time. The time-settle-ment curves then showed straight-line relation-ships between log time and settlement, with verylow creep rates. At the same time, the piezometerreadings showed that no or only very small ex-cess pore pressures developed and that theseappeared to dissipate rapidly. It was thus possi-ble to shorten the first load steps in each series.The time settlement curves then graduallychanged in such a way that the time required toreach a straight-line settlement-log time relation-ship increased and the duration of the load stepswas increased. However, the times in the prelimi-nary schedule did not have to be exceeded.
Fig. 84. Deflections in the reaction beams at the end ofthe loading test on the largest plate.
Plate loading tests
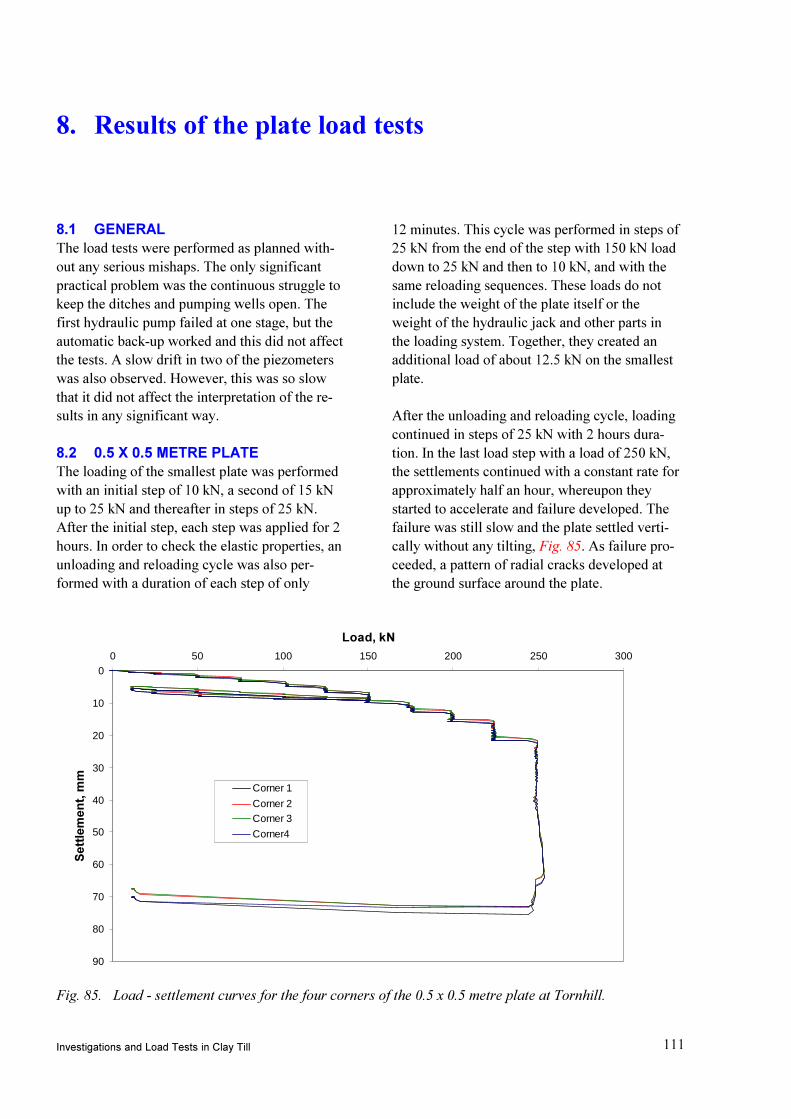
Investigations and Load Tests in Clay Till 111
8.1 GENERALThe load tests were performed as planned with-out any serious mishaps. The only significantpractical problem was the continuous struggle tokeep the ditches and pumping wells open. Thefirst hydraulic pump failed at one stage, but theautomatic back-up worked and this did not affectthe tests. A slow drift in two of the piezometerswas also observed. However, this was so slowthat it did not affect the interpretation of the re-sults in any significant way.
8.2 0.5 X 0.5 METRE PLATEThe loading of the smallest plate was performedwith an initial step of 10 kN, a second of 15 kNup to 25 kN and thereafter in steps of 25 kN.After the initial step, each step was applied for 2hours. In order to check the elastic properties, anunloading and reloading cycle was also per-formed with a duration of each step of only
12 minutes. This cycle was performed in steps of25 kN from the end of the step with 150 kN loaddown to 25 kN and then to 10 kN, and with thesame reloading sequences. These loads do notinclude the weight of the plate itself or theweight of the hydraulic jack and other parts inthe loading system. Together, they created anadditional load of about 12.5 kN on the smallestplate.
After the unloading and reloading cycle, loadingcontinued in steps of 25 kN with 2 hours dura-tion. In the last load step with a load of 250 kN,the settlements continued with a constant rate forapproximately half an hour, whereupon theystarted to accelerate and failure developed. Thefailure was still slow and the plate settled verti-cally without any tilting, Fig. 85. As failure pro-ceeded, a pattern of radial cracks developed atthe ground surface around the plate.
8. Results of the plate load tests
Fig. 85. Load - settlement curves for the four corners of the 0.5 x 0.5 metre plate at Tornhill.
0
10
20
30
40
50
60
70
80
90
0 50 100 150 200 250 300
/RDG��N1
6HWWOHP
HQW��P
P
Corner 1
Corner 2Corner 3
Corner4

SGI Report No 59112
Only one settlement gauge was installed underthis plate. It was located at a depth of about 0.14m below the plate, or 0.3 times the plate width.The measurements showed that initially almostall settlements occurred within this depth and bythe end of the test, just before failure, about 50 %of the total settlements had occurred in this depthinterval, Fig. 86.
The time - settlement curves for each load step,except the last, started with a certain curvaturebut eventually formed straight lines in a settle-ment - log time plot, Fig. 87. The time until thisstage was reached increased successively as theload increased. The shape of the initial curvedepended on the time for load application andhow the zero time was selected. However, thisdid not significantly affect the evaluated creeprates or settlements at the end of the load steps.
The evaluated slopes of these lines constitute ameasure of the creep rate in the load steps. Thecreep rates increase continuously with increasingload. The relation is smoothly rounded and there
is no particular point where there is a significantchange in behaviour and thereby an indication ofa creep failure load until the penultimate step. Inthis step there is a significant increase in thecreep rate and failure may be considered to havestarted already in this step. Fig. 88.
Under the assumption that the pattern in themeasured time-settlement curves continues,the measured creep settlement rates enable anextrapolation of the measured (or extrapolated)settlements after 2 hours to expected settlementsafter 10 years, which is the time perspective nor-mally considered in settlement predictions. Boththe measured 2-hour curve and the extrapolated10-year curve for settlement versus load aresmoothly rounded without any sign of a bearingcapacity failure for loads up to 200 kN, Fig. 89.Above this load, the creep settlements increaseconsiderably and the extrapolated 10-year settle-ments almost reach the failure criterion for settle-ments, amounting to 10 % of the plate width asearly as at a load of 225 kN.
Fig. 86. Measured settlement of plate and settlement gauge below the 0.5 x 0.5 metre plateat Tornhill.
0
10
20
30
40
50
60
70
80
0 50 100 150 200 250 300
/RDG��N1
6HWWOHP
HQW��P
P
Average settlement of the plate
0.14 m below the plate
Results plate load test

Investigations and Load Tests in Clay Till 113
Fig. 87. Settlement - log time curves measuredin the load test on the 0.5 x 0.5 metreplate at Tornhill.
Fig. 88. Rate of creep settlements versus load measured in the load test on the 0.5 x 0.5 metre plateat Tornhill.
0
5
10
15
20
25
1 10 100 1000 10000
7LPH�V
6HWWOHP
HQW��P
P
10 kN25kN50 kN75 kN100 kN125 kN150 kN175 kN200 kN225 kN
0
1
2
3
4
5
6
0 50 100 150 200 250
/RDG��N1
&UHHS
�UDWH��P
P�OR
JW

SGI Report No 59114
The time dependence of settlements in coarsesoils is normally estimated by assuming that thecalculated settlements for a certain time can beadjusted to another time by applying the formula
6 6 FWWW
= + ⋅00
1( log )
where St = settlement at time tS
0 = settlement at time t
0
c = constant
From the load steps, the constant c has been cal-culated versus the total settlement at the end ofthe current load step. The values are somewhatsensitive to the time used as a reference, which inthis case has been set to t
0 =1 year. The results
from the current load test yield a factor c with anaverage value of approximately 0.07. However,the value appears to increase gradually with theload from a minimum of 0.04 to a maximum of0.09 before creep failure is approached and thevalue becomes even higher, Fig. 90.
The measured excess pore pressures were verysmall. They were insignificant in the first twoload steps and then increased sufficiently to ena-ble monitoring of the pore pressure generationand dissipation. The pore pressures increasedonly about 0.5 kPa in each load step and werethen seen to dissipate fully within the 2-hourperiods with constant load. In the unloading andreloading loop, the times for the load steps wereshorter and this dissipation then took place onlypartly. The excess pore pressure thus fell gradu-ally to about �1.5 kPa at the end of the unloadingand then gradually rose to about 1 kPa in the laststeps of the reloading. When the 2-hour durationof the load steps was resumed, the excess porepressures also returned to 0.5 kPa and dissipatedwithin the load step. In the last load step, the porepressure generation changed and the excess porepressures became negative when failure oc-curred, Fig. 91.
Fig. 89. Measured and extrapolated load - settlement curves in the load test on the 0.5 x 0.5 metreplate at Tornhill.
0
5
10
15
20
25
30
35
40
45
50
0 50 100 150 200 250 300
/RDG��N16HWWOHP
HQW��P
P
2h
10years
Results plate load test

Investigations and Load Tests in Clay Till 115
Fig. 90. Relative creep settlement rate versus load in the load test on the 0.5 x 0.5 metre plateat Tornhill
Fig. 91. Measured pore pressure changes during the load test on the 0.5 x 0.5 metre plate at Tornhill.
0
0,02
0,04
0,06
0,08
0,1
0,12
0,14
0 50 100 150 200 250
/RDG��N1
&UHHS
�UDWH��\
HDU�VH
WWOHPHQ
W����OR
JW
-2
-1,5
-1
-0,5
0
0,5
1
1,5
1999-06-09 18:00 1999-06-10 00:00 1999-06-10 06:00 1999-06-10 12:00 1999-06-10 18:00
'DWH�DQG�WLPH
([F
HVV�SRUH�SUHVV
XUH��N
3D
0
50
100
150
200
250
300
350
/RDG��N1
Pore pressure
Load

SGI Report No 59116
On the basis of the pore pressure measurements,the load test can thus be considered to have beena drained test and the time chosen for load appli-cation was found to be well suited.
8.3 1 X 1 METRE PLATELoading of the 1 x 1 metre plate was performedin steps of 75 kN up to a total load of 1350 kN.The load was applied for 4 hours in most of thesteps. An unloading-reloading cycle was per-formed from 300 kN load with a duration of 12minutes for each step. The test was terminated at1350 kN load, when the average total settlementwas 88 mm. The failure criterion for a settle-ment, amounting to 10% of the plate width, wasthen well exceeded for the extrapolated 10-yearsettlements. The plate settled straight downwithout any significant tilt, Fig. 92.
The measurements of the deep settlement gaugesshowed that the settlements started just below theplate and then spread downwards with increasingload, but only just reached a level of 2.0 m(=2.0b) below the plate. By the end of the test,
when the total settlements were 88 mm, only 2mm of settlement had occurred at 2 metres belowthe plate, Fig. 93.
Also in this case, the settlement - log time curvesfor the load steps eventually formed fairlystraight lines and it was possible to evaluate thecreep rates, Fig. 94.
The curve for the creep rate versus load formed acurve with a distinct break at a load of about 700kPa, Fig. 95. Up to this point, the curve had beensmoothly rounded and after this point it changedto a significantly steeper but fairly straight line.Thus, there is no indication of an imminent creepfailure in the measured creep rates.
Both the measured average 4-hour settlementsand the extrapolated 10-year settlements showsmoothly rounded curves versus load withoutany indication of an imminent bearing capacityfailure before the test was stopped at 1350 kNload, Fig. 96. However, the failure criterion for asettlement, amounting to 10 % of the plate width,
Fig. 92. Load - settlement curves for the four corners of the 1 x 1 metre plate at Tornhill.
0
10
20
30
40
50
60
70
80
90
0 200 400 600 800 1000 1200 1400
/RDG��N1
6HWWOHP
HQW��P
P
Corner 1
Corner 2
Corner 3
Corner 4
Results plate load test

Investigations and Load Tests in Clay Till 117
Fig. 93.Measured settlements at differentlevels below the plate in the 1 x 1metre plate at Tornhill.
Fig. 94.Settlement - log time curvesmeasured in the load test onthe1 x 1 metre plate at Tornhill.
0
10
20
30
40
50
60
70
80
90
0 200 400 600 800 1000 1200 1400
/RDG��N1
6HWWOHP
HQW��P
P
Average settlement of the plate
0.14 m below the plate
1.05 m below the plate
2.00 m below the plate
0
10
20
30
40
50
60
70
80
90
100
1 10 100 1000 10000 100000
7LPH��V
6HWWOHP
HQW��P
P
75 kN
150 kN
225 kN
300 kN
375 kN
450 kN
525 kN
600 kN
675 kN
750 kN
825 kN
900 kN
975 kN
1050 kN
1125 kN
1200 kN
1275 kN
1350 kN
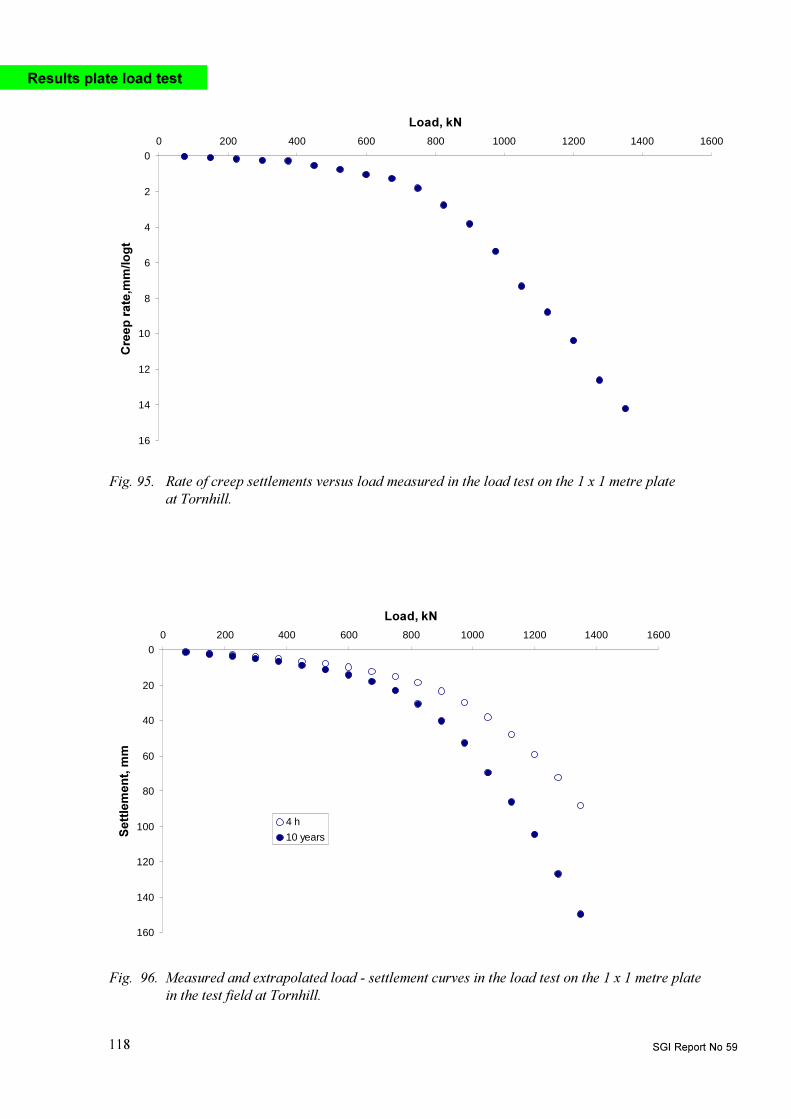
SGI Report No 59118
Fig. 96. Measured and extrapolated load - settlement curves in the load test on the 1 x 1 metre platein the test field at Tornhill.
Fig. 95. Rate of creep settlements versus load measured in the load test on the 1 x 1 metre plateat Tornhill.
0
2
4
6
8
10
12
14
16
0 200 400 600 800 1000 1200 1400 1600
/RDG��N1&UHHS
�UDWH�PP�OR
JW
0
20
40
60
80
100
120
140
160
0 200 400 600 800 1000 1200 1400 1600
/RDG��N1
6HWWOHP
HQW��P
P
4 h
10 years
Results plate load test

Investigations and Load Tests in Clay Till 119
Fig. 97. Relative creep settlement rate versus load in the load test on the 1 x 1 metre plate at Tornhill.
had been passed at a load of 1200 kN for the 10-year settlements. The load - settlement curvesand the previously shown creep curve may beinterpreted as indicating that a preconsolidationpressure was exceeded at a load of approximate-ly 700 kN, or 700 kPa in vertical stress.
Parameter c, which describes the creep rate inrelation to the total settlement, was found to in-crease linearly with the load. The value increasedfrom 0.03 at the start of loading to about 0.11 atthe break in the creep-load curve. It then re-mained fairly constant for the steps with higherloads, Fig. 97.
The piezometer below the plate recorded a porepressure increase of about 3.5 kPa during the testperiod. However, this increase was mainly linearwith time and continued also during the periodsof constant load, when the pore pressure should
instead have decreased. The pore pressure in-crease also largely remained after the final un-loading of the plate when negative excess porepressures ought to have been registered. Most ofthe recorded increase in pore pressure is there-fore believed to have been an electronic driftwith a continuous zero shift. If this is assumed tohave been linear with time and to amount to therecorded excess pore pressure after unloading, acorrected curve can be obtained, Fig. 98. Onlyextremely small excess pore pressures then re-main and the only significant changes are thedecreasing and returning pore pressures in thefaster unloading-reloading loop and the decreaseat final unloading. In either case, corrected oruncorrected, the generated pore pressures are sosmall that the test can be considered fullydrained.
0
0,02
0,04
0,06
0,08
0,1
0,12
0,14
0 200 400 600 800 1000 1200 1400 1600
/RDG��N1
&UHHS
UDWH���\HD
U�VH
WWOHPHQ
W����OR
JW

SGI Report No 59120
8.4 2 X 2 METRE PLATEThe load test on the 2 x 2 metre plate was per-formed with load steps of 200 kN and a durationusually of 6 hours. No unloading - reloading wasperformed in this test. The test was stopped at aload of 2800 kN owing to excessive deforma-tions in the reaction system. The settlements thenamounted to 56 mm and the plate had settledalmost vertically without any significant tilting,Fig. 99.
The settlements versus depth showed the samepattern, with settlements starting just below theplate and then spreading downwards with in-creasing load. When the test was stopped at 2800kN load, the settlement at 2 metres depth belowthe plate, i.e. a depth equal to the plate width,was only 6.2 mm or 11 % of the total settlement,Fig. 100.
Also in this case, the settlements in the load stepseventually formed the typical straight-line rela-tions in the settlement - log time plots, Fig. 101.
Fig. 98. Measured pore pressure changes and corrected excess pore pressures in the loadtest on the 1 x 1 metre plate at Tornhill.
0
200
400
600
800
1000
1200
1400
1600
1999-06-14 12:00 1999-06-15 06:00 1999-06-16 00:00 1999-06-16 18:00 1999-06-17 12:00
'DWH�DQG�WLPH
/RDG
��N1
-1
0
1
2
3
4
5
([F
HVV�3RUH�SUHVV
XUH��N
3D
Load
Pore pressure
Corrected porepress re
The evaluated creep rates are plotted versus ap-plied load in Fig. 102. The relation is smoothlycurved with continuously increasing creep ratesat increasing load and no breakpoint can beclearly discerned. There may possibly be a breakfor the last step, but this is not clear enough to beconsidered a fact.
The measured and extrapolated load - settlementcurves are smoothly rounded without any indica-tion of an imminent bearing capacity failure,Fig. 103.
The rate of the creep settlement in relation to thesettlement is about the same as for the previoustests, Fig. 104.
The measured excess pore pressures were similarto those measured in the previous test, Fig. 105.On the same grounds, a zero drift may be expect-ed to have occurred during the testing period, butin this case it does not appear to have been quitelinear versus time. However, the measured ex-
Results plate load test

Investigations and Load Tests in Clay Till 121
Fig. 100. Measured settlements at different levels below the plate in the 2 x 2 metre plate at Tornhill.
Fig. 99. Load - settlement curves for the four corners of the 2 x 2 metre plate at Tornhill.
0
10
20
30
40
50
60
70
0 500 1000 1500 2000 2500 3000
/RDG��N1
6HWWOHP
HQW��P
P
Corner1
Corner 2
Corner 3
Corner 4
0
10
20
30
40
50
60
70
80
0 500 1000 1500 2000 2500 3000
/RDG��N1
6HWWOHP
HQW��P
P
Average settlement of the plate0.16 m below the plate1.00 m below the plate2.00 m below the plate
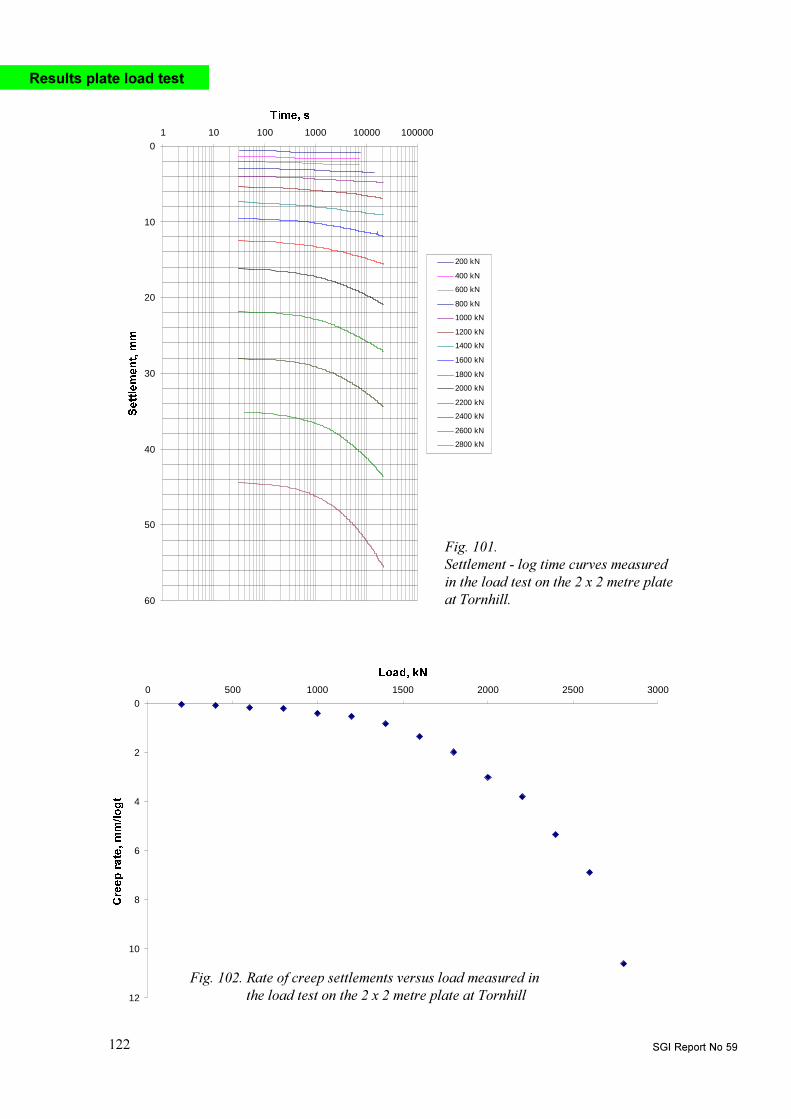
SGI Report No 59122
Fig. 102. Rate of creep settlements versus load measured inthe load test on the 2 x 2 metre plate at Tornhill
Fig. 101.Settlement - log time curves measuredin the load test on the 2 x 2 metre plateat Tornhill.
0
10
20
30
40
50
60
1 10 100 1000 10000 100000
7LPH��V
6HWWOHPHQW��PP
200 kN
400 kN
600 kN
800 kN
1000 kN
1200 kN
1400 kN
1600 kN
1800 kN
2000 kN
2200 kN
2400 kN
2600 kN
2800 kN
0
2
4
6
8
10
12
0 500 1000 1500 2000 2500 3000
/RDG��N1
&UHHS�UDWH��PP�ORJW
Results plate load test

Investigations and Load Tests in Clay Till 123
Fig. 104. Relative creep settlement rate versus load in the load test on the 2 x 2 metre plate at Tornhill.
Fig. 103. Measured and extrapolated load - settlement curves in the load test on the2 x 2 metre plate at Tornhill.
0
20
40
60
80
100
120
0 500 1000 1500 2000 2500 3000
/RDG��N1
6HWWOHP
HQW��P
P
6 h
10 years
0
0,02
0,04
0,06
0,08
0,1
0,12
0,14
0 500 1000 1500 2000 2500 3000
/RDG��N1
&UHHS
�UDWH���\H
DU�VHWWOHP
HQW����OR
JW

SGI Report No 59124
cess pore pressures are very small and when thesame correction is applied most of them disap-pear. From the curve, it can still be seen thatthere is a small increase in the pore pressure eachtime the load is increased and that this excesspore pressure dissipates during the load step. Nosignificant excess pore pressures accumulatedduring the test and the load test can be regardedas a drained test.
Fig. 105. Measured pore pressure changes and corrected excess pore pressure inthe load test on the 2 x 2 metre plate at Tornhill.
8.5 SETTLEMENT DISTRIBUTIONIN THE LOAD TESTS
The settlement distributions measured in the testsshow that all significant settlements occurredwithin a depth of 2b under the plates, Fig. 106.However, it should also be observed that the dis-tribution of settlements with depth changes withthe applied load, with more settlements occurringat greater depths as the load increases. The distri-bution shown in the figure refers to settlementsin the stress regions where no preconsolidationstresses or creep failure loads have been exceed-ed.
0
500
1000
1500
2000
2500
3000
1999-06-17 00:00 1999-06-18 00:00 1999-06-19 00:00 1999-06-20 00:00 1999-06-21 00:00
'DWH�DQG�WLPH
/RDG
��N1
-1
0
1
2
3
4
5
([F
HVV�SRUH�SUHVV
XUH��N
3D
Load
Pore pressure
Corrected porepressure
Results plate load test

Investigations and Load Tests in Clay Till 125
8.6 COMMENTS ON THEPLATE LOAD TESTS
The tests were performed as planned and theplates settled vertically without any significanttilting. Actual failure was obtained for the small-est plate, whereas only the �failure load� at arelative settlement of 0.1 times the plate widthwas obtained for the medium size plate and thecorresponding value could be extrapolated fromthe largest plate. However, the load - settlementcurves were fairly steep at the ends of both testsand it was also possible to make a general esti-mate of the �ultimate failure load�. All three testscould be considered drained tests.
The relative settlements for the three plates wereuneven, Fig. 107. The response under the 1.0 mx 1.0 m plate, which was located furthest to theeast in the row, was considerably stiffer, withsmaller settlements than for the other two plates.The reason for this can be found in the composi-
Fig. 106. Settlement distribution with depth measured in load tests at Tornhill.
tion of the soil below the plates. When pumpingholes had previously been dug outside the exca-vated area in the attempt to lower the groundwater table, a large pocket of almost clean sandwas found in the hole to the east of the excava-tion. At the same time, homogeneous clay tillwas found in the hole to the west. A varyingcomposition of the material in the floor of theexcavation was also observed. After the platetests, continuous samples were taken with ascrew auger at the centre of the removed platesdown to a depth of twice the plate width. Theresults of the soil classification and the deter-mined water contents and liquid limits clearlyshow that the soil in the affected compressiblelayers was considerably coarser below the 1.0 mx 1.0 m plate than below the other two plates,Table 5. These differences should be consideredwhen comparing the results to calculated settle-ments and bearing capacities.
0
0,5
1
1,5
2
2,5
0 0,1 0,2 0,3 0,4 0,5 0,6 0,7 0,8 0,9 1
6�6�
5HODWLYH�GHS
WK��'
�%

SGI Report No 59126
All tests showed more or less pronounced breaksin the curves, indicating a creep load or passing apreconsolidation pressure. These breaks occurredin the ground pressure interval of about 600 �800 kPa and thus generally correspond to theestimated level of the preconsolidation pressuresfrom the oedometer tests. However, the precon-solidation pressures were only exceeded in su-
Fig. 107. Relative settlements below the plates.
Table 5. Soil profiles below the plates.
Relativedepth Plate 0.5 x 0.5 m Plate 1.0 x 1.0 m Plate 2.0 x 2.0 m
D/B Soil type wN, % w
L, % Soil type w
N, % w
L, % Soil type w
N, % w
L, %
0-0.25 Clay Till 22 42 sa si Clay Till 15 22 Clay Till 20 430.25-0.5 -�- 22 42 -�- 15 22 -�- 20 430.5-0.75 -�- 22 42 cl Sand Till 10 -�- 17 310.75-1.0 cl sa Silt 15 sa Clay Till 14 25 -�- 17 311.0-1.25 Clay Till 16 36 -�- 14 25 sa si Clay Till 17 231.25-1.5 -�- 16 36 si Clay Till 16 35 -�- 18 261.5-1.75 -�- 16 36 -�- 16 35 -�- 18 261.75-2.0 -�- 16 36 si Sand 18 sa gr cl Till 13 17
perficial layers and the change in modulus whenpassing the preconsolidation pressure is relative-ly moderate. At these ground pressures, alsomost of the estimated bearing capacity was mobi-lised. The break in the curves may thus also berelated to a yield for excessive shear stresses inthe ground.
0
0,01
0,02
0,03
0,04
0,05
0,06
0,07
0,08
0,09
0,1
0 200 400 600 800 1000 1200 1400
*URXQG�SUHVVXUH��N3D5HODWLYH�VH
WWOHPHQ
W�V�E
Plate 0.5x0.5 m, 2h
Plate 0.5x0.5 m, 10 years
Plate 1.0x1.0, 4h
Plate 1.0x1.0 m, 10 years
Plate 2.0x2.0 m, 6h
Plate 2.0x2.0 m, 10 years
Results plate load test

Investigations and Load Tests in Clay Till 127
9.1 SETTLEMENTSThe settlements have been calculated on the basisof the oedometer and triaxial tests in the labora-tory and the pressuremeter and dilatometer testsin the field. A calculation has also been made onthe basis of the initial shear modulus measuredby the seismic CPT-tests and empirical relationsfor its decline with increasing strains.
Oedometer testsThe common method of calculating settlementsusing theory of elasticity and moduli from oed-ometer tests yielded values that were too small inrelation to the measured settlements except forvery small loads. In these calculations, the re-loading moduli estimated from parameters deter-mined in the unloading-reloading loops wereused up to the estimated preconsolidation pres-sures. For higher stresses, use was made of themoduli for the normally consolidated state calcu-lated by the estimated modulus numbers and thecurrent effective vertical stress.
A correction of the calculated settlements forcreep effects measured in the oedometer testsapproximately doubles the calculated settlementsin a 10-year perspective when settlements forstresses above the preconsolidation pressure areconsidered. However, in most of the load steps,the effective vertical stresses remained below thepreconsolidation pressures and in those stepswhere they were exceeded, this only occurred ina narrow zone just beneath the plate. The creepeffects for stresses below the preconsolidationpressure are small and so is therefore the possiblecorrection.
A much better estimation of the actual settlementcurves was obtained when the empirical Jabob-sen (1967) correction was applied. This correc-tion is based on the estimated safety factoragainst bearing capacity failure. In this case, the
drained bearing capacity was calculated to becritical and approximate values of this, (seeChapter 9.2, Table 10), were used to estimate thesafety factors.
From the observations made during the tests, theloading tests were also considered to be drained.The Jacobsen correction factor includes observa-tions of real full-scale constructions and shouldbe fairly relevant for the design settlements,which normally refer to the 10-year settlements.In view of the heterogeneity of the soil in the testfield, the correspondence between settlementsestimated in this way and the extrapolated 10-year settlements from the plate load tests must beconsidered to be good, Fig. 108. a-c. The largestdifference was obtained for the 1.0 x 1.0 m plate,which can at least partly be attributed to the soilconditions beneath this plate.
The corresponding empirical correction based onresults from sands and silts proposed by Larsson(1996) was found to be inapplicable to the resultsfrom the clay till.
Dilatometer testsThe results from dilatometer tests are interpretedto yield compression moduli compatible to theoedometer moduli. These moduli are correspond-ingly used in the same type of calculations. Forclays, the interpreted moduli may be assumed tobe valid in the overconsolidated range for stress-es below the preconsolidation pressure, which inprinciple should be relevant for the current cases.
The oedometer moduli and the dilatometer mod-uli were generally of similar sizes. However, thedilatometer tests were performed in the naturalground before the excavation was made, whereasthe oedometer tests were performed and inter-preted to include this unloading. The moduli inthe oedometer tests were also interpreted from
9. Comparison between predicted and measuredsettlements and bearing capacity

SGI Report No 59128
0
10
20
30
40
50
60
70
80
90
0 50 100 150 200 250 300
/RDG��N1
6HWWOHPHQW��PP
Plate settlement 2h
Plate settlement 10 years
Calculated
Corrected according to Jacobsen
Fig. 108.Comparison between measuredand extrapolated settlementsand settlements calculated fromresults from oedometer tests.
c) 2.0 m plate
b) 1.0 m plate
a) 0.5 m plate
Comparison ...
0
20
40
60
80
100
120
140
160
0 200 400 600 800 1000 1200 1400
/RDG��N1
6HWWOHPHQW��PP
Plate settlement 4h
Plate settlement10 years
Calculated
Corrected according to Jacobsen
0
20
40
60
80
100
120
140
160
0 500 1000 1500 2000 2500 3000
/RDG��N1
6HWWOHPHQW��PP
Plate settlement 6h
Plate settlement 10 år
calculated
Corrected according to Jacobsen

Investigations and Load Tests in Clay Till 129
the unloading-reloading loop, where the distur-bance effects are largely eliminated. Possibly asa consequence of this, the dilatometer moduliwere higher than the oedometer moduli in theupper part of the profile and then became lowerfurther down. This variation can also be seen inthe calculated settlements, in that the settlementsfor the smallest plate calculated on the basis ofdilatometer moduli become significantly smallerthan those measured and calculated from oedom-eter test results. Beneath this plate, only the up-permost part of the profile was affected by theload. For the larger plates, where larger parts ofthe profiles were affected, the calculated settle-ments became more similar. Since the modulievaluated from the dilatometer tests correspondto oedometer moduli, it should be appropriate toapply the Jacobsen correction also in these calcu-lations. This is verified by the comparison withthe load test results, Fig. 109.
Also the calculated settlements from the dilatom-eter tests can thus be considered to be fairly rele-vant after a correction according to Jacobsen(1967). However, effects of softening because ofunloading and other changes in the conditions inrelation to those prevailing during the test cannotbe taken into account.
Pressuremeter tests
Menard procedureThe traditional way of calculating settlementsfrom results from pressuremeter tests is the semi-empirical Menard procedure. This calculationyields a straight load-settlement relation and thecalculated settlements should be applicable fornormal ground pressures and the design time forthe construction, i.e. about 10 years. The normalground pressures should in this case be up to 400kPa, which corresponds to loads of 100, 400 and1600 kN on the respective plates. A comparisonwith the measured and extrapolated load settle-ment relations shows that this is mainly the casealso in the current case, Fig. 110. The main dif-ference involves the smallest plate, where thecalculated settlements are on the low side. Thismay to some extent be attributed to the softeningbecause of the excavation.
The Menard procedure involves the use of a rhe-ological factor a, which is selected on the basisof soil type and the relation between the pres-suremeter modulus, EM, and the net limit pres-sure, p
L*, evaluated from the test results. In the
current case, the soil classification �overconsoli-dated clay� would yield an a-factor of 1, where-as the average E
M/ p
L* relation of just below 16
would yield an a-factor of 2/3. Calculations havebeen made using both factors and the a-factor of1 was found to be most appropriate.
Since the calculations with the Menard procedureyield linear load-settlement relations, the settle-ments for small loads become overpredicted andthe settlements for higher loads than the normalground pressures become underestimated.
Briaud procedureThe Briaud procedure uses a weighted average ofthe actual pressuremeter curves as described inappendix. The results from all Menard pres-suremeter tests have therefore been corrected andplotted according to Briaud�s procedure,Fig. 111.
The results have then been weighted in relationto their influence for the particular plate andcombined into average pressuremeter curves foreach plate, Fig. 112.
The average pressuremeter curves have thenbeen converted into load-settlement curves ac-cording to Briaud. For this purpose, both theconversion factors proposed by Briaud (1995)and the factors later suggested by Larsson (1997)have been applied. For transformation of the 1-minute readings in the pressuremeter tests to theactual loading times in the plate load tests and to10-year values, an exponent npmt of 0.047 hasbeen used. This value was evaluated from hold-ing periods during the new type of pressuremetertests. The scatter was relatively small. In thetranslation, both the value of 0.047 and twice thisvalue, as proposed by Briaud, have been used asexponents.

SGI Report No 59130
0
10
20
30
40
50
60
0 50 100 150 200 250 300
/RDG��N1
6HWWOHPHQW��PP
Plate settlement 2h
Plate settlement 10 years
Calculated
Corrected according to Jacobsen
Fig. 109.Comparison betweenmeasured and extrapolatedsettlements and settlementscalculated from results fromdilatometer tests.c) 2.0 m plate
b) 1.0 m plate
a) 0.5 m plate0
20
40
60
80
100
120
140
160
0 200 400 600 800 1000 1200 1400 1600
/RDG��N1
6HWWOHPHQW��PP
Plate settlement 4h
Plate settlement 10 years
Calculated
Corrected according to Jacobsen
0
20
40
60
80
100
120
140
160
180
0 500 1000 1500 2000 2500 3000
/RDG��N1
6HWWOHPHQW��PP
Plate settlement 6h
Plate settlement 10 years
Calculated
Corrected according to Jacobsen
Comparison ...

Investigations and Load Tests in Clay Till 131
Fig. 110.Comparison betweenmeasured and extrapolatedsettlements and settlementscalculated from Menardpressuremeter tests.
0
5
10
15
20
25
30
35
40
45
50
0 50 100 150 200 250 300
/RDG��N1
6HWWOHPHQW��PP
Plate settlement 2h
Plate settlement 10 years
Calculated alfa=2/3
Calculated alfa=1
0
20
40
60
80
100
120
140
160
0 200 400 600 800 1000 1200 1400 1600
/RDG��N1
6HWWOHPHQW��PP
Plate settlement 4h
Plate settlement 10 years
Calculated alfa=2/3
Calculated alfa=1
0
20
40
60
80
100
120
0 500 1000 1500 2000 2500 3000
/RDG��N1
6HWWOHPHQW��PP
Plate settlement 6h
Plate settlement 10 years
Calculated alfa =2/3
Calculated alfa=1
c) 2.0 m plate
b) 1.0 m plate
a) 0.5 m plate

SGI Report No 59132
Fig. 111. Pressuremeter curves plotted according to Briaud.
Fig. 112. Average pressuremeter curves for the three plates.
0
2
4
6
8
10
12
14
16
18
0 0,05 0,1 0,15 0,2 0,25 0,3 0,35 0,4 0,45
∆5F�5F
3UHVV
XUHPHWHU�SUHVV
XUH��%
DU
Plate 0.5x0.5m
Plate 1x1m
Plate 2x2m
Comparison ...
0
2
4
6
8
10
12
14
16
18
0 0,05 0,1 0,15 0,2 0,25 0,3 0,35 0,4 0,45 0,5
∆5F�5F
3UHVV
XUHPHWHU�SUHVV
XUH��%
DU
Hole1 2m
Holel1 2,95m
Hole1 4m
Hole 2 2m
Hole 2 3m
Hole 2 4m
Hole 2 5m
Hole 2 6m
Hole 3 1,5m
Hole 3 2,5m
Hole 3 3,5m
Hole 3 4,5 m
Hole 3 5,3m
2m2m
2,5
4m
4m 1,5m
4,5 3m
2,95m
3,5m
5m6m
5,3m

Investigations and Load Tests in Clay Till 133
The calculated load-settlement curves are com-pared to the results from the plate load tests inFig. 113 a-c.
0
10
20
30
40
50
60
70
80
90
0 200 400 600 800 1000 1200 1400 1600
*URXQG�SUHVVXUH��N3D
6HWWOHPHQW��PP
Plate load test 2h
Plate load test 10 years
Calculated 2h, 2npmt
Calculated 10 years, 2npmt
Calculated 2h,1npmt
Calculated 10 years, 1npmt
Calculated, Briaud factor, 10years,2npmt
0
10
20
30
40
50
60
70
80
90
100
0 200 400 600 800 1000 1200 1400 1600
*URXQG�SUHVVXUH��N3D
6HWWOHPHQW��PP
Plate load test 4h
Plate load test 10years
Calculated 4h, 2npmt
Calculated 10-years, 2npmt
Calculated, 4h, 1npmt
Calculated, 10 years, 1nmpt
Calculated, Briaud factor, 10 years,2npmt
Fig. 113. Comparison between measured and extrapolated load settlement curves from the plate load testsand relations calculated on the basis of ordinary pressuremeter tests according to the Briaudprocedure. Unless otherwise stated, the SGI G-factors, (Larsson (1997), have been used.
a) Plate 0.5 x 0.5 m
b) Plate 1.0 x 1.0 m

SGI Report No 59134
The comparisons showed directly that the G-factors proposed by Briaud (1995) for sand weretoo large for the clay till. This was mainly foundalso for silts and sands in Sweden and was thententatively attributed to the quality of the testcavity (Larsson 1997). Since test cavities in stiffclay may be expected to be of higher quality thanin sands, the G-factors may be expected to besmaller. The factors proposed by Larsson appearto be of the right size also for the clay till in thecurrent investigation, but the spread in the resultsis too large to enable a more exact evaluation. Inthe presented figures, the calculations using Bri-aud factors are only shown for 10-year settle-ments estimated with a maximum time exponentof 2 x 0.047. The other curves calculated withthese factors are located further up and to theright in the diagrams.
The use of a doubled time exponent appears tobe somewhat exaggerated, while most of the re-sults indicate that the evaluated exponent fromthe tests is not quite sufficient. Except for thesmallest plate, where the results may be seriouslyaffected by unloading effects from the excava-tion, the use of the evaluated exponent directly asit is appears to yield more relevant results interms of settlements within normal loading rang-es. However, the real load settlement curve be-comes steeper at higher loads and this time cor-rection of the test results may not be sufficientfor estimation of the failure load.
The calculations using the Briaud procedure withSGI conversion factors and the measured timerelation thus predict fairly well the actual shapesof the load-settlement curves. However, possibleeffects of an excavation entailing swelling andsoftening after the tests have been performedcannot be taken into account and the failure loadmay be somewhat overestimated.
Fig. 113. Comparison between measured and extrapolated load settlement curves from theplate load tests and relations calculated on the basis of ordinary pressuremetertests according to the Briaud procedure. Unless otherwise stated, the SGIG-factors, (Larsson (1997), have been used.
0
20
40
60
80
100
120
140
160
180
200
0 200 400 600 800 1000 1200 1400 1600
*URXQG�SUHVVXUH��N3D
6HWWOHPHQW��PP
Plate settlement, 6h
Plate settlement, 10 years
Calculated 6h, 2npmt
Calculated 10 years, 2npmt
Calculated 6h, 1npmt
Calculated 10 years, 1 npmt
Calculated 10 years, Briaud factor, 2 npmt
c) Plate 2.0 x 2.0 m
Comparison ...
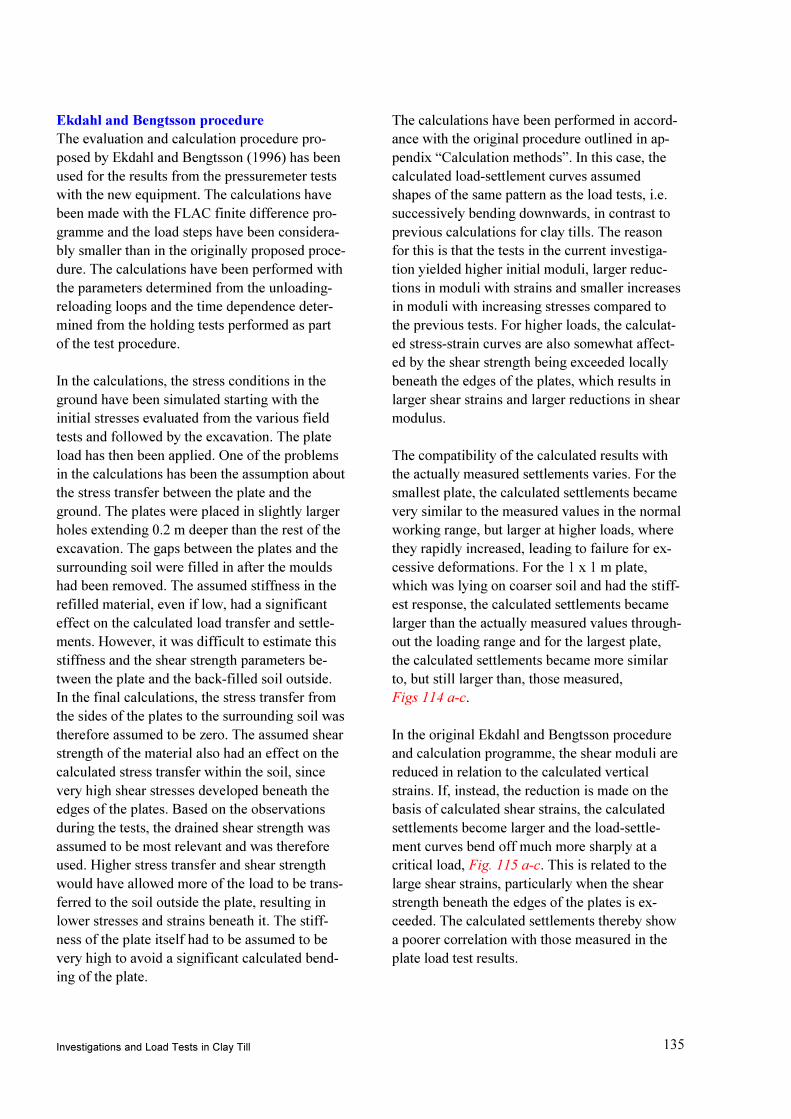
Investigations and Load Tests in Clay Till 135
Ekdahl and Bengtsson procedureThe evaluation and calculation procedure pro-posed by Ekdahl and Bengtsson (1996) has beenused for the results from the pressuremeter testswith the new equipment. The calculations havebeen made with the FLAC finite difference pro-gramme and the load steps have been considera-bly smaller than in the originally proposed proce-dure. The calculations have been performed withthe parameters determined from the unloading-reloading loops and the time dependence deter-mined from the holding tests performed as partof the test procedure.
In the calculations, the stress conditions in theground have been simulated starting with theinitial stresses evaluated from the various fieldtests and followed by the excavation. The plateload has then been applied. One of the problemsin the calculations has been the assumption aboutthe stress transfer between the plate and theground. The plates were placed in slightly largerholes extending 0.2 m deeper than the rest of theexcavation. The gaps between the plates and thesurrounding soil were filled in after the mouldshad been removed. The assumed stiffness in therefilled material, even if low, had a significanteffect on the calculated load transfer and settle-ments. However, it was difficult to estimate thisstiffness and the shear strength parameters be-tween the plate and the back-filled soil outside.In the final calculations, the stress transfer fromthe sides of the plates to the surrounding soil wastherefore assumed to be zero. The assumed shearstrength of the material also had an effect on thecalculated stress transfer within the soil, sincevery high shear stresses developed beneath theedges of the plates. Based on the observationsduring the tests, the drained shear strength wasassumed to be most relevant and was thereforeused. Higher stress transfer and shear strengthwould have allowed more of the load to be trans-ferred to the soil outside the plate, resulting inlower stresses and strains beneath it. The stiff-ness of the plate itself had to be assumed to bevery high to avoid a significant calculated bend-ing of the plate.
The calculations have been performed in accord-ance with the original procedure outlined in ap-pendix �Calculation methods�. In this case, thecalculated load-settlement curves assumedshapes of the same pattern as the load tests, i.e.successively bending downwards, in contrast toprevious calculations for clay tills. The reasonfor this is that the tests in the current investiga-tion yielded higher initial moduli, larger reduc-tions in moduli with strains and smaller increasesin moduli with increasing stresses compared tothe previous tests. For higher loads, the calculat-ed stress-strain curves are also somewhat affect-ed by the shear strength being exceeded locallybeneath the edges of the plates, which results inlarger shear strains and larger reductions in shearmodulus.
The compatibility of the calculated results withthe actually measured settlements varies. For thesmallest plate, the calculated settlements becamevery similar to the measured values in the normalworking range, but larger at higher loads, wherethey rapidly increased, leading to failure for ex-cessive deformations. For the 1 x 1 m plate,which was lying on coarser soil and had the stiff-est response, the calculated settlements becamelarger than the actually measured values through-out the loading range and for the largest plate,the calculated settlements became more similarto, but still larger than, those measured,Figs 114 a-c.
In the original Ekdahl and Bengtsson procedureand calculation programme, the shear moduli arereduced in relation to the calculated verticalstrains. If, instead, the reduction is made on thebasis of calculated shear strains, the calculatedsettlements become larger and the load-settle-ment curves bend off much more sharply at acritical load, Fig. 115 a-c. This is related to thelarge shear strains, particularly when the shearstrength beneath the edges of the plates is ex-ceeded. The calculated settlements thereby showa poorer correlation with those measured in theplate load test results.

SGI Report No 59136
Fig. 114.Comparison between measured and extrapolatedsettlements and settlements calculated from newpressuremeter tests following the Ekdahl andBengtsson (1996) procedure.
0
5
10
15
20
25
30
35
40
45
50
0 200 400 600 800 1000
*URXQG�SUHVVXUH��N3D
6HWWOHPHQW��PP
Plate settlement, 2h
Plate settlement, 10 years
Calculated, no time effects
Calculated, 2h
Calculated, 10 years
0
10
20
30
40
50
60
70
80
90
100
0 200 400 600 800 1000 1200 1400
*URXQG�SUHVVXUH��N3D
6HWWOHPHQW��PP
Plate settlement, 4h
Plate settlement, 10 years
Calculated, no time effects
Calculated, 4h
Calculated, 10 years
0
20
40
60
80
100
120
140
160
180
200
0 200 400 600 800 1000
*URXQG�SUHVVXUH��N3D
6HWWOHPHQW��PP
Plate settlement, 6h
Plate settlement, 10 years
Calculated, no time effects
Calculated, 6h
Calculated, 10 years
c) 2.0 m plate
b) 1.0 m plate
a) 0.5 m plate
Comparison ...

Investigations and Load Tests in Clay Till 137
0
20
40
60
80
100
120
140
160
180
200
0 100 200 300 400 500 600 700 800
*URXQG�SUHVVXUH��N3D
6HWWOHPHQW��PP
Plate settlement, 6h
Plate settlement, 10 years
Calculated, no time effects
Calculated, 6h
Calculated, 10 years
Fig. 115.Comparison between measured and extrapolatedsettlements and settlements calculated from newpressuremeter tests following the Ekdahl andBengtsson (1996) procedure but using modulireferring to shear strain.c) 2.0 m plate
b) 1.0 m plate
a) 0.5 m plate
0
5
10
15
20
25
30
35
40
45
50
0 200 400 600 800 1000
*URXQG�SUHVVXUH��N3D
6HWWOHPHQW��PP
Plate settlement, 2h
Plate settlement, 10 years
Calculated, no time effects
Calculated, 2h
Calculated, 10 years
0
10
20
30
40
50
60
70
80
90
100
0 200 400 600 800 1000 1200 1400
*URXQG�SUHVVXUH��N3D
6HWWOHPHQW��PP
Plate settlement, 4h
Plate settlement, 10 years
Calculated, no time effects
Calculated, 4h
Calculated, 10 years

SGI Report No 59138
As stated above, the calculations are very sensi-tive to assumptions about load distribution andshear strength. A load transfer between the sidesof the plates and the surrounding soil results inlower stresses beneath the plates, a higher criticalload and a smaller curvature of the load-settle-ment curve up to this load. An assumption ofhigher shear strength also increases the criticalload and lessens the curvature. The relevance ofthe measured moduli and the method for calcu-lating settlements is thereby primarily reflectedin the first part of the curves for relatively lowstresses. The remainder of the calculated curvesbecome more and more dependent on the as-sumptions on load transfer and shear strength asthe stresses increase.
Calculations using the alternativeinterpretation of the new pressuremeter testsThe same calculations as in the previously de-scribed procedure have been made using the al-ternative formulation of the variation of the mod-ulus described in �Evaluation of moduli at smallstrains�. In these calculations, also the preconsol-idation pressures determined from the oedometertests have to be introduced. They are used incalculating both the initial modulus and its de-cline as the preconsolidation pressure is re-ap-proached during loading. These calculations thusbecome very sensitive both to the determinationof the preconsolidation pressure and the calcula-tion of the stress distribution and current stresslevel in the ground. On the other hand, they areless sensitive to the assumption on shear strengthsince the reduction in modulus is related to stressand not to strains.
The formulation of the modulus in practice leadsto failure when passing the preconsolidationpressure. The calculations cannot therefore becontinued for stresses higher than the preconsoli-dation pressure without introducing another mod-ulus formulation for higher stresses. This has notbeen done here. The calculations have thus beenperformed up to the vertical stress where thepreconsolidation pressure is exceeded in the up-permost layer. The calculations yield smaller
settlements until the preconsolidation pressure isapproached and a more brittle behaviour whenpassing a critical creep pressure than the calcula-tions with the previous formulation of the modu-lus, Fig. 116. The relation between the two typesof calculations varies with the assumptions onload transfer and shear strength.
Calculations based on the resultsof triaxial testsThe calculation procedure has also been usedtogether with the modulus parameters evaluatedfrom the triaxial tests. The triaxial tests weremainly undrained, but the emphasis in the evalu-ation was put on relatively small strains, wherethe difference between drained and undrainedmoduli is small. The modulus parameters wereassumed to relate to 1-day deformations and the10-year settlements have been calculated on theassumption of a 10 % increase per log cycle oftime. These calculations also produced load-settlement curves of similar shapes to the meas-ured curves. In general, the results were verysimilar to those calculated from the pressureme-ter test results using the Ekdahl and Bengtssonprocedure and moduli related to shear strains andthe soil response in the load tests showed a sig-nificantly higher stiffness than the calculatedresponse, Fig. 117. Once again, the results arevery dependent on the assumptions on load trans-fer and shear strength.
Calculation with moduli fromseismic cone testsA final calculation with the same calculationprocedure was made using moduli estimatedfrom the seismic cone tests. In these tests, onlythe initial shear modulus G
0 at very small strains
is measured. This value then has to be convertedto a modulus that varies with strain by using em-pirical relations.
According to Hardin and Drnevich (1972), thechange in modulus with shear strain can be ex-pressed by the modified hyperbolic stress-strainrelation
Comparison ...

Investigations and Load Tests in Clay Till 139
Fig. 116.Comparison between measured andextrapolated settlements andsettlements calculated from the newpressuremeter tests and thealternative formulation of themodulus.
c) 2.0 m plate
b) 1.0 m plate
a) 0.5 m plate
0
5
10
15
20
25
30
35
40
45
50
0 200 400 600 800 1000
*URXQG�SUHVVXUH��N3D
6HWWOHPHQW��PP
Plate settlement, 2h
Plate settlement, 10 years
Calculated, no time effects
Calculated, 2h
Calculated, 10 years
0
10
20
30
40
50
60
70
80
90
100
0 200 400 600 800 1000 1200 1400 1600
*URXQG�SUHVVXUH��N3D
6HWWOHPHQW��PP
Plate settlement, 4h
Plate settlement, 10 years
Calculated, no time effects
Calculated, 4h
Calculated, 10 years
0
20
40
60
80
100
120
140
160
180
200
0 100 200 300 400 500 600 700 800
*URXQG�SUHVVXUH��N3D
6HWWOHPHQW��PP
Plate settlement, 6h
Plate settlement, 10 years
Calculated, no time effects
Calculated, 6h
Calculated, 10 years

SGI Report No 59140
Fig. 117.Comparison between measured andextrapolated settlements andsettlements calculated from the resultsof the triaxial tests.c) 2.0 m plate
b) 1.0 m plate
a) 0.5 m plate
0
5
10
15
20
25
30
35
40
45
50
0 200 400 600 800 1000
*URXQG�SUHVVXUH��N3D
6HWWOHPHQW��PP
Plate settlement, 2h
Plate settlement, 10 years
Calculated, no time effects
Calculated, 10 years
0
10
20
30
40
50
60
70
80
90
100
0 200 400 600 800 1000 1200 1400
*URXQG�SUHVVXUH��N3D
6HWWOHPHQW��PP
Plate settlement, 4h
Plate settlement, 10 years
Calculated, no time effects
Calculated, 10 years
0
20
40
60
80
100
120
140
160
180
200
0 100 200 300 400 500 600 700 800
*URXQG�SUHVVXUH��N3D
6HWWOHPHQW��PP
Plate settlement, 6h
Plate settlement, 10 years
Calculated, no time effects
Calculated, 10 years
Comparison ...

Investigations and Load Tests in Clay Till 141
K
**
γ+=
10
where
+=
−U
E
U
KDH γ
γ
γγγ 1
In this expression
g = shear straing
r= reference strain, t
max/G
0
a and b = material constants. For saturated clay,a » 1 and b » 1.3
e = base of the natural logarithm, » 2.72
For tmax, the undrained shear strength may beused. An estimation of the undrained shearstrength is obtained directly from the results ofthe seismic cone penetration test and these valueshave been used in the present calculations.
The Hardin and Drnevich relation is an averagerelation, which should be modified with respectto the composition of the particular clay. Thevariation in modulus versus shear strain for dif-ferent types of clayey soils has been presented byVucetic and Dobry (1991). In the present soilprofile, an average value of the plasticity indexwould be about 12 %. The curve correspondingto this plasticity index according to Vucetic andDobry is almost identical to the curve obtained ifa shear strain of 2.2g is used in calculating theactual shear modulus with the given equation,Fig. 118.
The modulus - strain curves estimated in thisway are shown in Fig. 119.
Fig. 118. Comparison between the modulus-shear strain relation for IP = 12 % given by
Vucetic and Dobry and the hyperbolic and modified hyperbolic relationobtained by the Hardin and Drnevich equations.
0
0,2
0,4
0,6
0,8
1
1,2
0,000001 0,00001 0,0001 0,001 0,01 0,1 1
6KHDU�VWUDLQ
*�*
�
Vucetic&Dobry IP=12%
Hardin&Drnevich hyperbolic
Hardin&Drnevich modified hyperbolic
Modified hyperbolic strain using 2.2xstrain tocalculate the modulus

SGI Report No 59142
Use of the initial shear modulus entails a verystiff calculated initial response, which thenbreaks down with increasing stresses and strains.The initial moduli determined by the seismiccone are several times larger than the corre-sponding moduli from the pressuremeter or triax-ial tests. However, the empirical relations implythat these high moduli are rapidly reduced whenthe stresses increase, particularly in low plasticsoils. Compared to the other types of tests, theinitial shear modulus is determined at very rapidloading and the time corrections would be con-siderable. However, there are no guidelines forhow such a correction should be performed. Inthis case, the seismic loading has been assumedto correspond to a time of about 1 millisecondand the conversion to plate loading times hasbeen made using a time exponent of 0.05.
The calculations yielded load-settlement relationsthat were initially stiffer than those measured, butwhich then sharply bent off at a critical pressure,Fig. 120. Considering the very large and crudecorrection for time effects, the relevance of thesecalculations may be seriously questioned.
Comments on thesettlement calculationsFor reasons described earlier, the reference datafrom the plate load tests contained a considerablescatter. The comparison between calculated andmeasured settlements should be made with this inmind.
The earlier, best-proven methods for estimatingsettlements in this type of soil are using oedome-ter tests or Menard pressuremeter tests. When theempirical correction factor proposed by Jacobsen(1967) was applied, the straightforward calcula-tion using oedometer moduli proved to give thebest overall fit to the measured settlements. How-ever, even if the calculations are simple, the costfor taking undisturbed samples and performingan adequate number of oedometer tests for ob-taining the required parameters is high. A fairlygood estimation of the settlements was also ob-tained when using oedometer moduli evaluatedfrom dilatometer tests and treated in the sameway as those estimated from the oedometer tests.The cost for obtaining these moduli is much less,but no other reference data exist for this type ofsoil to verify that this agreement is general.
Fig. 119. Modulus-strain relations estimated from initial shear moduli from seismic cone testsand Vucetic and Dobry�s empirical relations for modulus reduction with strain.
0
20
40
60
80
100
120
140
160
180
0,000001 0,00001 0,0001 0,001 0,01 0,1 1
6KHDU�VWUDLQ, γ
*��0
3D
1.5m
2m
2.5m
3m
3.5m
4m
4.5m
5m
5.35m
5.35
2
1.5
5
2.5
4.54
3.5
3
Comparison ...

Investigations and Load Tests in Clay Till 143
Fig. 120.Comparison between measured andextrapolated settlements andsettlements calculated from theresults of the seismic cone tests.
0
5
10
15
20
25
30
35
40
45
50
0 200 400 600 800 1000
*URXQG�SUHVVXUH��N3D
6HWWOHPHQW��PP
Plate settlement, 2h
Plate settlement, 10 years
Calculated, no time effects
Calculated, 2h
Calculated, 10 years
c) 2.0 m plate
b) 1.0 m plate
a) 0.5 m plate
0
10
20
30
40
50
60
70
80
90
100
0 200 400 600 800 1000 1200 1400
*URXQG�SUHVVXUH��N3D
6HWWOHPHQW��PP
Plate settlement, 4h
Plate settlement, 10 years
Calculated, no time effects
Calculated, 4h
Calculated, 10 years
0
20
40
60
80
100
120
140
160
180
200
0 200 400 600 800 1000
*URXQG�SUHVVXUH��N3D
6HWWOHPHQW��PP
Plate settlement, 6h
Plate settlement, 10 years
Calculated, no time effects
Calculated, 6h
Calculated, 10 years

SGI Report No 59144
The Menard type of pressuremeter test, evalua-tion and calculation yields straight-line load-settlement relations that are intended to yieldrelevant settlements within the normal range ofpermitted loads. This was found also in this case.The cost for this procedure is higher than for thedilatometer tests, but still relatively low. TheBriaud procedure of calculating settlements fromthe same type of pressuremeter tests yieldedload-settlement curves more similar in shape tothe measured curves and thereby provided some-what better predictions for the whole loadingrange. This assumes that the SGI factors and atime exponent of 1 · n
pmt are used. The cost for
this procedure is only marginally higher than forthe Menard procedure.
Calculations using the Ekdahl and Bengtssonprocedure for results from the new type of pres-suremeter tests yielded load-settlement curves ofthe same shape and settlements approximatelyequal to or somewhat larger than the measuredvalues. This assumes that the original procedureis followed. A stricter evaluation of the decreasein modulus based on shear strains yielded highersettlements and poorer correlation with the meas-ured settlements. The cost for performing andevaluating the tests is considerably higher thanfor the traditional pressuremeter tests, and thetime and cost for performing the modelling andcalculation are also considerable.
Calculations using moduli from the alternativemethod of interpretation yielded somewhatsmaller settlements with a similar or slightly bet-ter correlation with the measured values, but inthis case also the preconsolidation pressure hadto be determined, which entails a much highercost.
Calculations of the same type using modulus ofelasticity from triaxial tests also yielded loadsettlement curves with shapes similar to thosemeasured, but with larger settlements at the cor-responding loads. When using these moduli, theinitial stiffness in the soil was missed and thecalculated load-settlement curves were steeperthan those measured throughout the loading
ranges. The results were very similar to thoseobtained when using new pressuremeter tests andevaluating the decrease in modulus from calcu-lated shear strains. The cost for taking undis-turbed samples and performing the required labo-ratory tests is higher than for performing the newtype of pressuremeter tests.
The calculations using moduli estimated from theseismic cone tests yielded an initially much stiff-er response to the load than measured. The esti-mation of the variation in modulus with strainrelies entirely on empirical relations and thetranslation to relevant loading times for a con-struction is hitherto very uncertain. The useful-ness of the method with present knowledge musttherefore be questioned. However, the cost forobtaining the moduli is very moderate.
The correlations for the calculations with ad-vanced numerical methods based on moduli var-ying with strain are heavily dependent on as-sumptions concerning stress transfer and shearstrength in the soil. In this case, no stress transferwas assumed and the drained shear strength asdetermined in laboratory tests was used. Becauseof the shallow foundation depth and the lowoverburden pressures, this strength became rela-tively low and significantly less than any estima-tion of the undrained shear strength. Assump-tions of higher load transfer and shear strengthswould have improved the correlations betweenthe settlements calculated in this way and themeasured values. However, it would not haveimproved the correlation between the calculatedand observed settlement distributions. In the cal-culations, the settlements became more concen-trated to the zone closest to the plate as the loadincreased. In the load tests, the settlements start-ed directly beneath the plate and then spreaddownwards as the load increased.
It is also very difficult to find a sound basis foran assumption of a significant load transfer andshear strength higher than the drained parametersin the present case.
Comparison ...

Investigations and Load Tests in Clay Till 145
9.2 BEARING CAPACITYThe bearing capacity is traditionally calculated asan ultimate load on the basis of the measuredshear strength of the soil. In the current loadtests, failure was obtained only for the smallestplate. Probable ranges for the failure load couldbe obtained by extrapolation of the load-settle-ment curves from the other two plates. It shouldbe observed that the failure obtained in the loadtest on the smallest plate was a punching typefailure and not the classical shear surface as-sumed in most bearing capacity theories.
Other criteria for �failure� or �creep� loads areoften used. The alternative �failure� load is thennormally given as the load for which a certainrelative settlement is obtained. A criterion ofs/b = 0.1 is often used, i.e. the settlementamounts to 10 % of the foundation width. Forthis criterion, the question arises concerningwhich time perspective should be applied. Sincea settlement of this size is considered to cause theconstruction to cease to function, the lifetime ofthe construction (normally set to about 10 years)should instead be taken into account. Creep fail-ure is evaluated from the shapes of the load-settlement curve and the load-creep rate curve.Creep failure is then estimated at a point wherethere is a significant break in the curves and bothsettlements and creep increase more rapidly thanaccording to the trend before this load. Unlessthere is a brittle failure in the soil beneath theplate, the alternative failure load is not directlyrelated to the shear strength of the soil but has tobe calculated from a load-settlement calculationtaking the curved load-settlement relation into
account. The creep load may be associated withmobilisation of a certain degree of the shearstrength or local failure in the soil mass, but canalso be associated with exceeding of the precon-solidation pressure.
From the plate loading tests, it was possible toestimate the following approximate failure andcreep ground pressures beneath the plates (Ta-ble 6):
Calculations of ultimate failure loads in clay tillare usually made both for undrained and drainedconditions using undrained shear strength anddrained effective shear strength parameters. Thelowest bearing capacity obtained from these cal-culations, after application of appropriate safetyfactors or safety coefficients, is then used as de-sign failure load. No such factors or coefficientsare applied in comparisons with results from loadtests to check the calculation methods.
The undrained shear strength has been deter-mined in different ways yielding very differentresults. These can be divided into three maingroups:
� Field vane tests and CPT-tests. Since the eval-uation of the CPT-tests is calibrated againstthe field vane test, there is no significant dif-ference in these results.
� Pressuremeter tests evaluated according toMenard or Mair and Wood. Both evaluationmethods yield approximately the same results.
Table 6. Estimated failure and creep pressures from the load tests.
Plate Ultimate failure s = 0.1b, s = 0.1b, Creep pressurekPa load test, kPa 10 years kPa kPa
0.5 x 0.5 950 950 910 8001.0 x 1.0 1600 1400 1150 7002.0 x 2.0 950 950 780 800

SGI Report No 59146
� Triaxial tests and pressuremeter tests evaluat-ed according to Briaud (1992) which in thiscase yielded values of similar sizes.
Other evaluations of the undrained shearstrengths by alternative methods for pressureme-ter tests or from dilatometer tests yielded consid-erably higher or lower values respectively.
The weighted undrained shear strengths for therelevant soil volume beneath the plates and thecorresponding calculated bearing capacities areshown in Table 7.
The only calculated bearing capacities calculatedon the basis of undrained shear strength that werethe same size as the measured values were thosecalculated on the basis of results from triaxialtests (or pressuremeter tests with the strengthevaluated according to Briaud (1992). Bearingcapacities evaluated from the commonly usedfield vane tests were much too high. However,the results from the plate load tests showed thatthese tests should be considered as drained tests.Their results in terms of ultimate bearing capaci-ty cannot therefore be used to estimate the rele-vance for various undrained strength determina-tions.
The corresponding calculations with drainedeffective shear strength parameters have beenperformed with a friction angle of 30° and vari-ous assumptions about the effective cohesion c´.The latter parameter is dominant in the currentcase because of the low overburden pressures inthe excavation. The effective cohesion has beenestimated in five different ways:
� as evaluated from the triaxial tests
� estimated empirically as 0.03 times the pre-consolidation pressure from oedometer tests
� estimated empirically as 0.1 times the und-rained shear strength from field vane tests
� estimated empirically from void ratio, watercontent and clay content according to Hartlén(1974)
� estimated empirically from the void ratio ac-cording to Jacobsen (1967)
The estimated relevant effective cohesion and thecorresponding calculated bearing capacities areshown in Table 8.
Table 7. Undrained shear strengths and calculated bearing capacities for the test plates.
Plate Undrained shear strength, kPaField vane and Pressuremeter test Triaxial test andCPT tests (Menard and Mair&Wood) pressuremeter test (Briaud)
0,5 x 0.5 360 275 1751.0 x 1.0 360 275 1752.0 x 2.0 290 220 145
Bearing capacity, kPa0,5 x 0.5 2537 1939 12361.0 x 1.0 2381 1820 11602.0 x 2.0 1861 1573 933
Comparison ...

Investigations and Load Tests in Clay Till 147
A comparison with the plate test data shows thatall the calculated bearing capacities are fairlyrelevant, except for those using empirical estima-tions from field vane tests, which are too high. Inthis context, it should be remembered that thesoil below the 1.0 x 1.0 m plate is considerablycoarser, and thereby probably more dilatant withhigher effective cohesion, than the general soilconditions in the test field.
The ultimate bearing capacity has also been cal-culated from pressuremeter tests according toMenard. These calculations yielded the followingresults (Table 9):
The results from these calculations are generallytoo high. The discrepancy decreases with depthand the correlation may be influenced by theeffect of the excavation. The pressuremeter testswere performed at higher overburden pressuresand initial horizontal stresses than the plate loadtests. However, there is no method that can cor-rect for this.
The �failure� loads at the deformation criterias = 0.1b can only be calculated with methods thattake the curved load-settlement relation into ac-count. These are the methods using moduli fromoedometer tests together with Jacobsen�s correc-tion factor, the Briaud method for calculation ofsettlements from pressuremeter tests and the ad-vanced methods using moduli that vary withstrain. The �failure� loads thus calculated and thecreep loads estimated from the shapes of the cal-culated load-settlement curves are given in Ta-ble 10.
The corresponding calculations using the alterna-tive formulation of the moduli from pressureme-ter tests result in creep pressures of 700 kPa andfailure stresses of 725 kPa for all three plates.However, this is a direct result of reaching theestimated preconsolidation pressures.
Table 8. Estimated effective cohesion and calculated drained bearing capacity for the test plates.
Plate Effective cohesion, kPaTriaxial test 0.03 x s´c 0.1 x cuvane Hartlén Jacobsen
0.5 x 0.5 20 19.5 36 24 231.0 x 1.0 20 19.5 36 24 232.0 x 2.0 16.5 18 29 18 19
Bearing capacity, kPa0.5 x 0.5 868 849 1485 1020 9741.0 x 1.0 840 823 1419 983 9402.0 x 2.0 741 784 1178 794 819
Plate Bearing capacity, kPa
0.5 x 0.5 15681.0 x 1.0 13182.0 x 2.0 1082
Table 9. Bearing capacities for the test platescalculated from pressuremeter testsaccording to Menard.

SGI Report No 59148
Comments on the calculationsof bearing capacityThe calculated ultimate bearing capacities werebest estimated using the general bearing capacityand drained shear strength parameters. The porepressure measurements and the time-settlementsobservations during the tests also indicated thatthe load tests were to be considered as drained.
Failure in terms of creep load and excessivesettlements was estimated fairly well by usingoedometer test results and Jacobsen´s empiricalcorrection. The creep load could also be estimat-ed using Briaud´s method of calculating settle-ment based on pressuremeter tests. However, thealmost brittle failure after exceeding this loadcould not be fully estimated by this method.
Table 10. Calculated �failure� pressures and estimated yield stresses for the load plates.
The creep load almost coincided with the precon-solidation pressures estimated from the oedome-ter tests. It is still difficult to estimate the degreeto which this yield occurred because a preconsol-idation pressure was exceeded and the degree towhich it was related to development of plasticzones beneath the edges of the plates where theyield limit in terms of shear stresses had beenexceeded. According to the correlations betweencalculated and observed settlements, these criti-cal shear stresses are higher than the failurestresses calculated using the estimated drainedshear strength parameters.
Method Plate s/b = 0.1 time for s/b = 0.1, Creep pressure,load test, kPa 10 years, kPa kPa
Oedometer 0.5 x 0.5 825 750modulus, 1.0 x 1.0 825 750Jacobsen 2.0 x 2.0 720 600correction
Briaud, 0.5 x 0.5 1600 1400 850pressuremeter 1.0 x 1.0 1400 1250 850test 2.0 x 2.0 1300 1100 650
Ekdahl and 0.5 x 0.5 650 635 575Bengtsson, 1.0 x 1.0 650 635 575new pressuremeter 2.0 x 2.0 650 635 575
Triaxial modulus 0.5 x 0.5 560 540 4501.0 x 1.0 530 520 4502.0 x 2.0 530 520 450
Comparison ...

Investigations and Load Tests in Clay Till 149
Akai, K. (1960). Die strukturellen Eigenschaftenvon Schluff. Mitteilungen, Heft 22, Tech-nische Hochschule, Aachen.
Andersen, K.H., Kleven, A. and Heien, D.(1988). Cyclic Soil Data for Design of Gravi-ty Structures. ASCE, Journal of GeotechnicalEngineering, Vol. 114, No.5, 1988.
Atkinson, J.H. and Little, J.A. (1988). Und-rained Triaxial Strength and Stress-StrainCharacteristics of a Glacial Till Soil. Canadi-an Geotechnical Journal, Vol. 25, No.3.
Atkinson, J.H. and Sällfors, G. (1991). Experi-mental Determination of Stress-Strain-TimeCharacteristics in Laboratory and In-SituTests. General Report. Proceedings, 10th Eu-ropean Conference on Soil Mechanics andFoundation Engineering, Florence, Vol. 3.
Baguelin, F., Jezequel, J.F., LeMee, E. andLeMehaute, A. ((1972). Expansion of Cylin-drical Probes in Cohesive Soils. ASCE, Jour-nal of the Soil Mechanics and FoundationDivision, Vol. 98, No. SM11, Nov. 1972.
Baguelin, F., Jézequel, J.F. and Shields, D.H.(1978). The Pressuremeter and FoundationEngineering. Trans. Tech. Publications.
Baziw, E.J. (1993). Digital Filtering Techniquesfor Interpreting Cone Data. ASCE, Journal ofGeotechnical Engineering, Vol. 119, No. 6,1993.
Bergdahl, U. (1984). Geotekniska undersöknin-gar i fält. Swedish Geotechnical Institute,Information No. 2, Linköping.
Bergdahl, U., Ottosson, E. och Malmborg,B.S. (1993). Plattgrundläggning. Svensk Byg-gtjänst, Solna.
Berre, T. (1982). Triaxial Testing at the Norwe-gian Geotechnical Institute. GeotechnicalTesting Journal, Vol. 5, No. 1/2, 1982.
Berre, T. (1988). Effekt av prøvehøjde og ende-friksjon ved treaxialforsøk og enaksiale trykk-forsøk. Nordiske geoteknikkermøte 10,NGM-88, Oslo, Artikler og �poster�-samman-drag.
Berre, T. (1995). Methods for Triaxial Compres-sion Tests on Water-Saturated Soils. 11thEuropean Conference on Soil Mechanics andFoundation Engineering, Copenhagen , Work-shop 2: Standardisation of Laboratory Test-ing, Report prepared by the European Techni-cal Committee ETC 5.
Briaud, J.-L. (1992). The Pressuremeter. A.A.Balkema, Rotterdam.
Briaud, J.-L. (1995). Pressuremeter Method forSpread Footings on Sand. The Pressuremeterand its New Avenues, Bailly (ed.), Balkema,Rotterdam.
Briaud, J.-L., Lytton, R.L. and Hung, J.T.(1983). Obtaining Moduli from Cyclic Pres-suremeter Tests, ASCE, Journal of Geotech-nical Engineering, Vol. 109, No. GT5.
Briaud, J.-L., Cosentino, P.J. and Terry, T.A.(1987). Pressuremeter Moduli for AirportPavement Design and Evaluation. FAA Re-port DOT/FAA/PM-87-10. Civil EngineeringDepartment, Texas A&M University, CollegeStation.
Brinch-Hansen, J. (1961). A General Formulafor Bearing Capacity. Danish GeotechnicalInstitute, Bulletin No. 11, Copenhagen.
Brown, J. D., and Meyerhof, G. G. (1669).Experimental Study of Bearing Capacity inLayered Clays. Proceedings, Seventh Interna-tional Conference on Soil Mechanics andFoundation Engineering, Mexico City, Vol. 2,pp. 45-51.
References

SGI Report No 59150
Burland, J.B. (1989). The Ninth Bjerrum Me-morial Lecture: Small is Beautiful - the Stiff-ness of Soils at Small Strains. Canadian Geo-technical Journal, Vol. 26, pp. 499-516.
Butcher, A.P., McElmeel, K. and Powell,J.J.M. (1995). Dynamic Probing and its Usein Clay Soils. Proceedings, International Con-ference on Advances in Site InvestigationPractice, London, Vol.2.
Butcher, A.P. and Powell, J.J.M. (1995). Ef-fects of Geological History on the DynamicStiffness in Soils. Proceedings, 11th EuropeanConference on Soil Mechanics and Founda-tion Engineering, Copenhagen, Vol. 1.
Butcher, A.P. and Powell, J.J.M. (1995). Prac-tical Considerations for Field GeophysicalTechniques used to Assess Ground Stiffness.Proceedings, International conference on ad-vances in site investigation practice, London,Vol.2.
Campanella, R.G., Robertson, P.K. andGillespie, D. (1986). Seismic Cone Penetra-tion Tests. Proceedings of In Situ 86´, a Spe-cialty Conference on Use of In Situ Tests inGeotechnical Engineering, Balcksburg, Vir-ginia. ASCE, New York.
CEN (1994). Eurocode 7: Geotechnical design -Part 1: General rules. European Committeeefor Standardization, Brussels.
Clarke, B.G. (1995). Pressuremeters in Geotech-nical Design. Blackie Academic & Profes-sional, London.
DeGroot, D.J. and Sheahan, T.C. (1995). Lab-oratory Methods for Determining EngineeringProperties of Overconsolidated Clays. Engi-neering Properties and Practice in Overcon-solidated Clays, Transportation ResearchRecord, No. 1479.
DGF Feltekomité (The field committée of theDanish Geotechnical Society) (1993). Refer-eceblad for vingeforsøg. Referenceblad 1,Revision1, Dansk Geoteknisk Forening,København.
Dueck, A. (1995). Reference Site for Clay Till.Lund Institute of Technology, Lund Universi-ty, Department of Geotechnology, LUTVDG/TVGT -3025-SE.
Dueck, A. (1997). Egenskaper i lermorän. Enlaboratoriestudie utförd vid Laboratoriet forFundering, Aalborgs Unviversitetscenter.Lund Institute of Technology, Lund Universi-ty, Department of Geotechnology, LUTVDG/TVGT-3028-SE.
Dueck, A. (1998). Shear Strength and MatrixSuction in Clay Tills - Triaxial Test Proce-dures to evaluate Shear Strength of Clay Tillsfrom Southwestern Sweden. Diss, Lund Insti-tute of Technology, Lund University, Depart-ment of Geotechnology, Lund.
Dueck, A. och Garin, H. (1995). Pressometer-försök i fast lera och lermorän - Samarbet-sprojekt mellan Institutionen för Geoteknolo-gi, Lunds tekniska högskola och Skanska Te-knik AB Malmö. Lund Institute of Technolo-gy, Lund University, Department of Geotech-nology, LUTVDG/TVGT-3022-SE.
Duncan, J.M. and Chang, C.-Y. (1970). Non-linear Analysis of Stress and Strain in Soils.ASCE, Journal of the Soil Mechanics andFoundation Division, Vol. 96, No. SM5.
Ekdahl, U. (1997). Kung Oscars bro - Planskildkorsning i Lund. Grundläggningsdagen 97,Rätt i grunden; 2. Nyhetspasset - GD 97,Stockholm. Svenska Geotekniska Föreningen,Linköping.
Ekdahl, U. och Bengtsson, P.-E. (1996). Nymetod att räkna sättningar vid platt-grundläggning. Väg- och Vattenbyggaren, Nr.3, 1996.
Ekdahl, U., Lindh, P. och Jonsson, A. (1996).Västkustbanan, Kävlinge - Lund; Komplet-terande geoteknisk undersökning. PEABGrundteknik, Malmö.
Fredlund, D. G. and Rahardjo, H. (1993 ). SoilMechanics for Unsaturated Soils. Wiley andSons, New York.
References

Investigations and Load Tests in Clay Till 151
Foged, N. og Steenfelt J.S. (1992). An Engi-neering Approach to Preloaded Clay TillStrength. Nordiske geoteknikermøde, NGM-92, Aalborg, DGF-Bulletin No. 9, Vol. 1/3.
Gibson, R.E. and Andersson, W.F. (1961). InSitu Measurements of Soil Properties with thePressuremeter. Civil Engineering and PublicWorks Review, London, Vol. 56, No, 658,May 1961.
Hansbo, S., and Sällfors, G. (1984). Jordme-kanik. (Soil Mechanics). Handboken Bygg,Geoteknik, Kapitel G 05, Liber Förlag, Stock-holm
Hardin, B.O. and Drnevich, V.P. (1972). ShearModulus and Damping in Soils: Design Equa-tions and Curves. ASCE, Journal of the SoilMechanics and Foundation Division, Vol. 98,No. SM7.
Hartlén, J. (1974). Skånska moränlerors håll-fasthets- och bärighetsegenskaper. Diss.Chalmers University of Technology, Depart-ment of Geotechnical Engineering, Göteborg.
Hird, C.C., Powell, J.J.M. and Yung, P.C.Y.(1991). Investigations of the Stiffness of aGlacial Clay Till. Proceedings, 10th EuropeanConference on Soil Mechanics and Founda-tion Engineering, Vol. 1. Florence.
Holmén, M. och Lindh, P. (1999). Automatiser-ing av en pressometer. Geo´99 - Geotekniskaforskardagar. Swedisj Geotechnical Institute,Varia No. 485, Linköping
Jacobsen, M. (1967). Morænelers geotekniskeegenskaber. Diss. Danish university of Tch-nology, København. Reprinted by AalborgUniversity Centre 1994.
Jacobsen, M. (1970). Strength and DeformationProperties of Preconsolidated Moraine Clays.Danish Geotechnical Institute, Bulletin No.27, København.
Jacobsen, M. (1975). Nogle danske moræneler-ers styrke- og deformationsegenskaber. Nord-iske geoteknikermøde i København.
Jacobsen, M. (1992). Bestemmelse av forbe-lastningstryk i laboratoriet. 11. Nordiske Ge-oteknikermøde, NGM-92, Aalborg, Vol. 2/3.
Jacobsen, M. (1992). Karakteristiske belastning-stilstande for moræneler. 11. Nordiske Geote-knikermøde, NGM-92, Aalborg, Vol. 2/3.
Jardine, R.J. (1991). Strain-Dependent Moduliand Pressuremeter Tests. Discussion. Géo-technique, Vol. 41, No. 4, pp 621-626.
Janbu, N. (1963). Soil Compressibility as Deter-mined by Oedometer and Triaxial Tests. Eu-ropean Conference on Soil Mechanics andFoundation Engineering, Wiesbaden, Vol.1.
Janbu, N. (1970). Grunnlag i geoteknikk. Tapirforlag. Trondheim
Jelinek. R. (1951). Der Einfluss von Gründung-stiefe und begrenzter Schictmässigkeit auf dieDruckausbreitung im Baugrund. Bautechnik,Vol. 28, Heft 6, 1951.
Jonsson, A., Andersson, B. och von Strokirch,C. (1995). A Method Study of Geobor S - aTriple Tube Wire Line Coring System, per-formed in Limestone and Clay Till. Lund In-stitute of Technology, Lund University, De-partment of Geotechnology, LUTVDG/TVTG- 5040-SE.
Jørgensen, M. og Denver, H. (1992). CPT-Tol-kningsprocedurer. 11. Nordiske Geotekniker-møde, NGM-92, Aalborg, Vol.1/3.
Kammer Mortensen, J., Hansen, G. og Sø-rensen, B. (1991). Correlation of CPT andField Vane Test for Clay Tills. Dansk Geote-knisk Forening, DGF Bulletin Nr.7. Køben-havn.
Karlsson, R. and Hansbo, S. (1984). Soil Clas-sification. Swedish Council for Buiding Re-search, T21:1982. Second Edition, Revised in1984. Stockholm.
Kondner, R.L. (1963). Hyperbolic Stress-StrainResponse: Cohesive Soils. ASCE, Journal ofthe Soil Mechanics and Foundation Engineer-ing Division, Vol. 89, No. SM1, 1963.
Kristensen, P.S., Erichsen, L. og Sørensen,C.S. (1992). Great Belt - Foundation of theWest Bridge. 11. Nordiske Geoteknikermøde,NGM-92, Aalborg, Vol. 1/3.

SGI Report No 59152
Lacasse, S. and Berre, T. (1988). Triaxial Test-ing Methods for Soils. Advanced TriaxialTesting of Soil and Rock. ASTM SpecialTechnical Publication STP 977.
Ladanyi, B.(1972) In Situ Determination of Un-drained Stress- Strain Behaviour of SensitiveClays with the Pressuremeter. Canadian Geo-technical Journal, Vol. 9, No. 3, Aug. 1972.
Ladd, C.C. and Foott, R. (1974). New DesignProcedure for Stability of Soft Clays. ASCE,Journal of the Geotechnical Engineering Divi-sion, Vol. 100, No. GT7.
Larsson, R, (1981). Drained Behavior of Swed-ish Clays. Swedish Geotechnical Institute,Report No. 12, Linköping.
Larsson, R, (1986). Consolidation of Soft Soils.Swedish Geotechnical Institute, Report No.29, Linköping.
Larsson, R. (1989). Dilatometerförsök - En in-situmetod för bestämning av lagerföljd ochegenskaper i jord. Utförande och utvärdering.Swedish Geotechnical Institute, InformationNo. 10, Linköping.
Larsson, R. (1992). CPT-sondering. Utförande -utförande - utvärdering. En in-situ metod förbestämning av jordlagerföljd och egenskaper ijord. Swedish Geotechnical Institute, Infor-mation No. 15, Linköping.
Larsson, R. (1992). Deformationsegenskaper ijord - Deformationsmoduler och enkla jord-modeller med speciellt avseende på relativtsmå deformationer inom det �elastiska� områ-det. Chalmers University of Technology, De-partment of Geotechnical Engineering, ReportB 1994:6. Göteborg.
Larsson, R. (1997). Investigations and LoadTests in Silty Soils - Results from a Series ofInvestigations in Silty Soils in Sweden. Swed-ish Geotechnical Institute , Report No. 54,Linköping.
Larsson, R. (2000). Lermorän - en litteraturstud-ie; Förekomst och geotekniska egenskaper.Swedish Geotechnical Institute, Varia No.480, Linköping.
Larsson, R., Bergdahl, U. and Eriksson, L.(1984). Evaluation of Shear strength in Cohe-sive Soils with Special Reference to SwedishPractice and Experience. Swedish Geotechni-cal Institute, Information No. 3. Linköping.
Larsson, R., Löfroth, B. och Möller, B. (1995).Processing of Data from CPT Tests. Interna-tional Symposium on Cone Penetration Test-ing, CPT´95, Vol.2, Linköping.
Larsson, R. och Mulabdic, M. (1991). ShearModuli in Scandinavian Clays. Swedish Geo-technical Institute, Report Nr. 40, Linköping.
Larsson, R. och Mulabdic, M. (1991). Piezo-cone Tests in Clay. Swedish GeotechnicalInstitute, Report Nr. 42, Linköping.
Leveen, F. och Palm, M. (2000). Utvärdering avkombinerad resistivitets- och CPTU-sond.Lund Institute of Technology, Lund Universi-ty, Department of Geotechnology, Lund.
Luke, K. (1996). Cone Factors from Field Vaneand Triaxial Tests in Danish Soils. XII Nord-iska Geoteknikermötet, NGM-96, Reykjavik.
Mair, R.J. and Wood, D.M. ( 1987). Pres-suremeter Testing. Ciria, Butterworths, Lon-don.
McManis, K.L. and Lourie, D.E. (1995). Issuesand Techniques for Sampling Overconsolidat-ed Clays. Engineering properties and practicein overconsolidated clays, TransportationResearch Record, No. 1479.
Marchetti, S. (1980). In Situ Tests by FlatDilatometer. ASCE, Journal of the Geotechni-cal Engineering Division, Vol. 106, No.GT3
The Menard pressuremeter (1975). Interpreta-tion and Application of Pressuremeter TestResults to Foundation Design. Menard Gener-al Memorandum D. 60. AN Sols Soils No. 26- 1975.
Palmer, A.C. (1972). Undrained Plane-StrainExpansion of a Cylindrical Cavity in Clay: ASimple Interpretation of the PressuremeterTest. Géotechnique, Vol. 22, No. 3, Sept.1972.
References

Investigations and Load Tests in Clay Till 153
Powell, J.J.M. and Butcher, A.P. (1991). As-sessment of Ground Stiffness from Field andLaboratory Tests. Proceedings, 10th EuropeanConference on Soil Mechanics and Founda-tion Engineering, Florence, Vol.1.
Powell, J.J.M. and Butcher, A.P. (1997). De-termining the Modulus of the Ground fromIn-Situ Geophysical Testing. Proceedings,14th International Conference on Soil Me-chanics and Foundation Engineering, Ham-burg, Vol. 1.
Powell, J.J.M. and Uglow, I.M. (1988). TheInterpretation of the Marchetti DilatometerTest in UK Clays. Penetration Testing in theUK. Thomas Telford, London.
Riggins, M. (1981). The Viscoelastic Character-istics of Marine Sediments in Large ScaleSimle Shear. Diss. Civil Engineering, TexasA&M University.
Roque, R., Janbu, N. and Senneset, K. (1988).Basic Interpretation Procedures of FlatDilatometer Tests. Proceedings of 1st Interna-tional Symposium on Penetration Testing,Orlando, Florida, Vol. 1.
Schmertmann (1978). Guidelines for Cone Pen-etration Tests, Performance and Design. Fed-eral Highway Administration, Report FHWA-TS-78-209, Washington.
SGF:s fältkommitté (The Field Committee ofthe Swedish Geotechnical Society) (1998).Rekommenderad standard för Jord-bergson-dering, (Jb-sondering). Svenska GeotekniskaFöreningen, Linköping.
SGF:s laboratoriekommitté (The LaboratoryCommittee of the Swedish GeotechnicalSociety) (1996). Bestämning av kompression-smodul, M0, för överkonsoliderad jord. Med-delande från laboratoriekommittén. SvenskaGeotekniska Föreningen, Linköping.
Skanska Teknik (1998). Pressometerundersökn-ing i lermorän. Skanska Teknik AB, Geote-knik och Grundläggning, Malmö.
Steenfelt, J.S. and Foged, N. (1992). Clay TillStrength - SHANSEP and CSSM. Nordiskegeoteknikermøde i Aalborg, DGF-BulletinNo. 9, Vol. 1/3.
Steenfelt, J.S. og Sørensen, C.S. (1995). CPT -Contraption for Probing in Tills? InternationalSymposium on Cone Penetration Testing,CPT´95, Vol.2, Linköping
Svensson, M. (1999). Ytvågsseismik - magi ellerett verktyg inom geotekniken. Bygg & Te-knik, Vol. 91, Nr.1.
Svensson, M. (2000). Surface Wawe Seismics -A Comparison between In Situ Shear Modulidetermined by SASW-Technique and OtherMethods. In preparation.
Swedish Geotechnical Society (1993). Recom-mended Standard for Cone Penetration Tests.Report 1:93, Linköping.
Swedish Geotechnical Society (1995). Recom-menderad standard for dilatometerförsök.Report 1:95, Linköping.
Swedish Standard SS 02 71 14 (1977). Geote-kniska provningsmetoder - Skrymdensitet.(Geotechnical Test - Bulk Density). SwedishBuilding Standards Institution, Stockholm.
Swedish Standard SS 02 71 16 (1977). Geote-kniska provningsmetoder - Vattenkvot ochvattenmättnadsgrad. (Geotechnical Test - Wa-ter Content and Saturation Ratio). SwedishBuilding Standards Institution, Stockholm.
Swedish Standard SS 02 71 18 (1989). Geote-kniska provningsmetoder - Konsistensgränser.(Geotechnical Test - Consistency Limits).Swedish Building Standards Institution,Stockholm.
Swedish Standard SS 02 71 24 (1992). Geote-kniska provningsmetoder - Kornfördelning,Sedimentering - Hydrometermetoten. (Geo-technical Test - Particle Size Distribution,Sedimentation Test - Hydrometer Method).Swedish Building Standards Institution,Stockholm.
Swedish Standard SS 02 71 29 (1992). Geote-kniska provningsmetoder - Kompressionseg-enskaper - ödometerförsök med stegvispålastning - kohesionsjord. (GeotechnicalTest - Incrementally Loaded OedometerTests). Swedish Building Standards Institu-tion, Stockholm.

SGI Report No 59154
Trankjaer, H. (1995). Forbelastet moraenelersdeformationsegenskaber. Diss. Laboratorietfor Fundering, Aalborg University. Aalborg.
Trankjær, H. (1996). Deformationsmodel forintakt moræneler. XII Nordiska Geotekniker-mötet, NGM-96, Reykjavik.
Tremblay, M. (1990). Mätning av grundvatten-ninå och portryck. Swedish National RoadAdministration - Vbg, Publication 1990:41,Borlänge. Also in Swedish Geotechnical In-stitute, Information No. 11, Linköping.
Tscheng, Y. (1957). Fondations Superficielles enMillieu Stratifié. Proceedings, Fouth Interna-tional Conference on Soil Mechanics andFoundation Engineering, London, Vol. 1, pp.449 - 452
Vesic, A. (1973). Analysis of Ultimate Loads ofShallow Foundations. ASCE, Journal of theSoil Mechanics and Foundation Division,Vol. 99, No. SM1, Jan. pp. 45-73.
Vucetic, M. and Dobry, R. (1991). Effect ofSoil Plasticity on Cyclic Response. ASCE,Journal of Geotechnical Engineering, Vol.117, No. 1, Jan. 1991.
Wood, D. M. (1990). Strain-Dependent Moduliand Pressuremeter Tests. Technical note,Géotechnique, Vol. 40, No.3. (Discussion inGéotechnique Vol. 41, No. 4.)
Wroth, C.P. (1982). British Experience with theSelf-Boring Pressuremeter. Proceedings,Symposium on the Pressuremeter and its Ma-rine Applications. Institut de Petrole, Labora-toire des Ponts et Chaussées, Paris.
Öberg, A-L. (1997). Matrix Suction in Silt andSand Slopes; Significance and Practical Usein Stability Analysis. Thesis. Department ofGeotechnical Engineering, Chalmers Univer-sity of Technology, Gothenburg
References

Investigations and Load Tests in Clay Till 155
Appendix

SGI Report No 59156
A.1 GENERALEkdahl and Bengtsson (1996) presented a newmethod of calculating settlements of foundationson clay till based on results from pressuremetertests and Jacobsen (1967) had previously pre-sented an empirical chart for correction of settle-ments calculated for the same case on the basisof reloading modulus from oedometer tests.Apart from this, there are no special methods forcalculation of bearing capacity and settlements inclay till.
Because of its loading history, the clay till is nor-mally overconsolidated to such an extent thatonly the compression characteristics in the re-loading mode are of interest for normal founda-tions. Furthermore, because of the heterogeneityand the high moduli, the soil in many respectsoften behaves more like a silt than a clay. In thisproject, those methods designed particularly withclay till in mind have been tested. An investiga-tion has also been made of the extent to whichmethods normally used for silts and other over-consolidated clays can be applied to clay till. Theconditions and properties of the clay till in Torn-hill are sometimes far outside the restrictionsnormally applying to their use. Thus, the resultsin the present investigations do not reflect thegeneral applicability of the methods to the areasfor which they are intended.
Some methods are general and are intended tocover all types of soil and geometric conditions.As its name implies, the �general equation forbearing capacity� is thus intended for all soilsand conditions. In this equation, both empiricallyestimated shear strength parameters and parame-ters determined by more elaborate testing may beintroduced. Also the Menard type of pressureme-ter test and the related method of calculation ofbearing capacity are intended to be generallyapplicable. The new interpretation and calcula-
tion method for pressuremeter tests presented byBriaud (1995) was, on the other hand, originallyproposed to be valid only under certain condi-tions in sand, and has later been extended to silt(Larsson 1997).
For calculation of settlements, the methods usingtheory of elasticity to estimate the distribution ofthe stress increase and moduli are applicable toall types of soil. The moduli may then be evaluat-ed semi-empirically from dilatometer tests ormeasured in oedometer tests, triaxial tests or inunload-reload loops in pressuremeter tests,among other methods. As before, the calculationmethods based on pressuremeter tests accordingto Menard are general, but the Briaud methodhas so far been restricted to sand and silt.
A.2 PREDICTION OF SETTLEMENTS
Calculations based on stress distributionaccording to theory of elasticity andmoduliSettlements can be calculated using theory ofelasticity to estimate the distribution of thestresses and moduli (E or M) to describe the stiff-ness of the soil. For widespread flexible loads,such as wide fills, the variation in the stress dis-tribution is calculated both with depth and dis-tance across the area. The settlements may thenbe calculated with moduli determined semi-em-pirically from dilatometer tests or pressuremetertests or directly from unload-reload loops inpressuremeter tests, or in the laboratory by oed-ometer tests or triaxial tests. In the latter cases,the variation in moduli with stress may also betaken into account. For high fills, the shearstrength below the edges of the fills may be mo-bilised to such a degree that allowance has to bemade for lateral movements in the soil.
Calculation methods for prediction of settlementsand bearing capacity

Investigations and Load Tests in Clay Till 157
For rigid footings, the stress distribution is calcu-lated below the characteristic point. Ideally, theoedometer modulus M should be used for wide-spread loads and the modulus of elasticity E fornarrow footings. This distinction is not alwaysmade in practice, except in more elaborate analy-ses using more advanced calculationmethods.The settlements are calculated usingmoduli determined as above. For pressuremetertests, also other calculation methods are used.For rigid footings of limited width in relation tothe compressible soil layer, the mobilisation ofthe shear strength increases as the vertical stressincreases and the same increase in the soil stiff-ness because of the increasing vertical stress asin the oedometer case can not be counted upon.On the contrary, a strain softening with a gradu-ally decreasing modulus with increasing load andsettlement must be taken into consideration. Thiscan be done by making iterative calculations inwhich the calculated settlements are matchedwith the moduli at the corresponding strains.
The settlements are calculated from
V(
] RU V0
]]
]
]
]
]
]
= =∑ ∑∆ ∆ ∆ ∆σ σ
� �
and the calculation is made over a depth z whichat least comprises all depth intervals in which theincrease in effective vertical stress is ³ 10 %.Another way of limiting the depth for which thesettlements are calculated is to use the empiricalobservations that for square or circular footingsthere are normally no significant settlements be-low a depth of twice the width of the footingunder its base. The corresponding limiting depthfor strip foundations is four times the foundationwidth, (Schmertmann 1978).
Some types of estimation of moduli yield valuesthat can be used to calculate the 10-year settle-ments. In other cases, a similar type of correctionfor time as in the Schmertmann (1978) methodhas to be used, i.e. a 20 % increase in settlementper increase in log time, a modulus which is afunction of time or some other correspondingmethod.
The real load-settlement curves for footings onthick deposits of compressible soil are curved,which means that settlement predictions using aconstant modulus will normally overestimate theactual settlements at small loads and underesti-mate them at high loads. The Swedish handbookfor design of shallow foundations, (Bergdahl etal. 1993), recommends that if the load is in-creased above 2/3 of the design failure load, theempirical moduli should be reduced by 50 % forthe higher load. However, since the design calcu-lations involve a large number of partial safetyfactors depending on the particular constructionand the risk involved, this is rather difficult totranslate into general terms enabling a compari-son to be made against the results of load tests,for example. A very approximate translationwould be that the breaking point where the mod-ulus should be reduced corresponds to the per-missible ground pressures according to the oldbuilding codes, which in turn implies that thiscorrection would normally not be applicable toordinary constructions.
A study of the results in previous projects togeth-er with plate loading tests performed by SGI onsands and silts, as well as other empirical obser-vations, has shown that the load-settlementcurves have a parabolic shape. The same obser-vation was made by Jacobsen (1967) for founda-tions on clay till. Based on a large number ofsettlement observations, he proposed that thesettlements calculated on the basis of reloadingmoduli determined in oedometer tests should becorrected. The correction factor increases withincreasing mobilisation of the bearing capacity,Fig. 121, and thus provides the observed curvedload-settlement relation.
For sands and silts, the settlements calculatedwith stress distribution according to theory ofelasticity and using the most relevant estimatesof the constant moduli coincide with the actualsettlements at a relative settlement of about0.014b (Larsson 1997). Based on these results, itwas proposed that the settlements could be calcu-lated according to the following procedure:

SGI Report No 59158
1. A settlement factor, Fs, comprising the thick-
ness of the compressible layer contributing tothe settlements, the stress distribution and thecompression moduli is calculated as
)I(
]V
]
]
]
= ∑�
∆
where fz = influence factor under thecharacteristic point in the centreof the sublayer Dz according totheory of elasticity.
2. A reference stress, qref, which gives the refer-ence settlement sref = 0 0.014b is calculated as
T E )UHI V= � ���� � .
3. The relative settlement s/b for all other ap-plied stresses up to failure is calculated as
VE
TTUHI
=
� ���
�
�
Calculation of settlements of footingsbased on Menard type pressuremetertestsCalculation of settlements of footings based onpressuremeter tests is usually performed accord-ing to Menard (1975) and Baguelin et al. (1978).The 10-year settlement is then calculated as
V(
SEEE (
S EG
G
F
F= +2
9 900
∆ ∆( )λ α λα , m
whereE
d= weighted harmonic mean value of
measured pressuremeter moduli Epm
down to a depth of 8b below thefoundation level, kPa
Ec = harmonic mean value of measuredpressuremeter moduli Epm down todepth b/2, kPa
b0 = reference width = 0.6 mb = width of foundation, ma = rheological factor depending on soil type
and the relation Epm/pl*, Table 11ld and lc= shape factors, see Table 12Dp = net ground pressure (p� - p�
0), kPa
p´0 = effective overburden pressure at thefoundation level, kPa
Fig. 121.Empirical correction factorfor settlements offoundations on clay tillcalculated with reloadingmoduli from oedometer tests,(Jacobsen 1967).
Appendix: Calculation
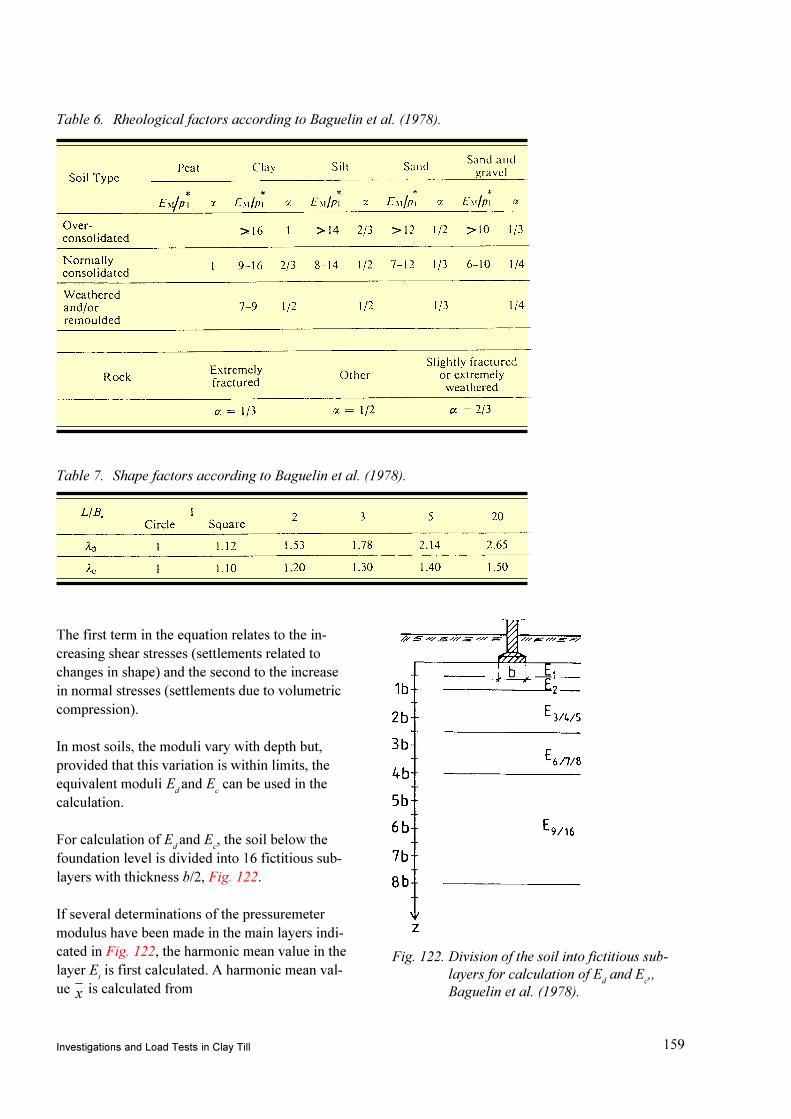
Investigations and Load Tests in Clay Till 159
The first term in the equation relates to the in-creasing shear stresses (settlements related tochanges in shape) and the second to the increasein normal stresses (settlements due to volumetriccompression).
In most soils, the moduli vary with depth but,provided that this variation is within limits, theequivalent moduli E
d and E
c can be used in the
calculation.
For calculation of Ed and E
c, the soil below the
foundation level is divided into 16 fictitious sub-layers with thickness b/2, Fig. 122.
If several determinations of the pressuremetermodulus have been made in the main layers indi-cated in Fig. 122, the harmonic mean value in thelayer Ei is first calculated. A harmonic mean val-ue [ is calculated from
Table 7. Shape factors according to Baguelin et al. (1978).
Table 6. Rheological factors according to Baguelin et al. (1978).
Fig. 122. Division of the soil into fictitious sub-layers for calculation of Ed and Ec,,Baguelin et al. (1978).
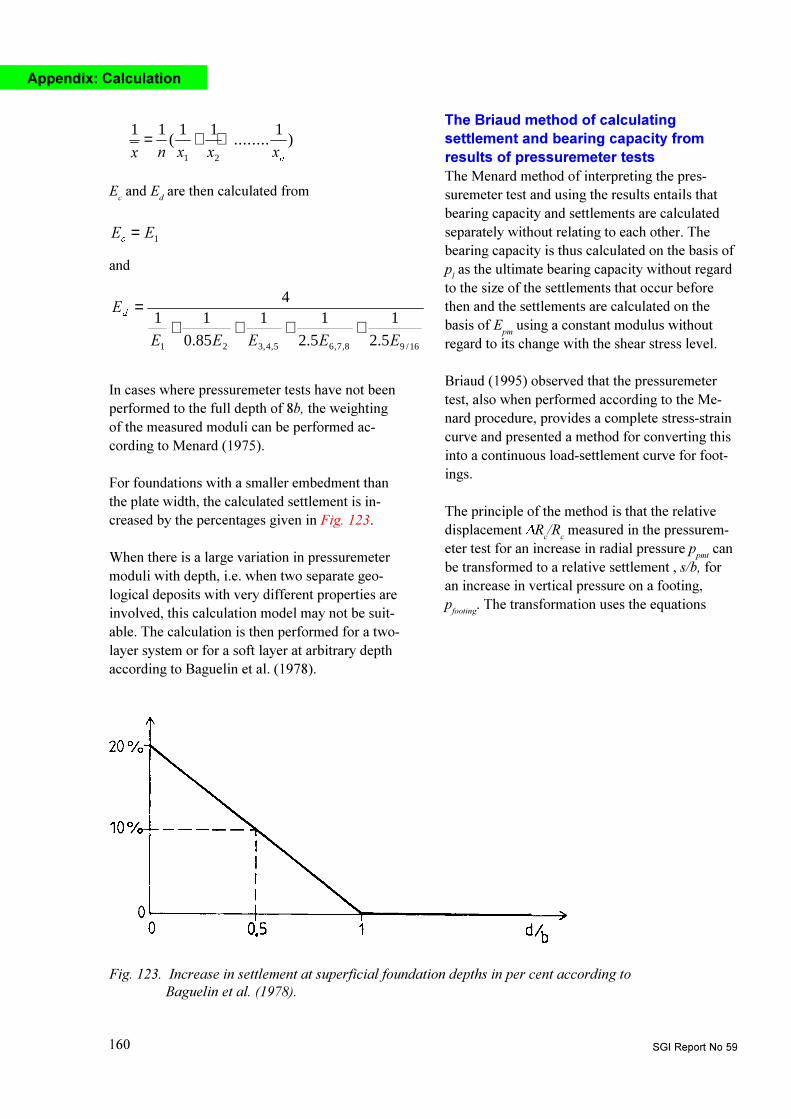
SGI Report No 59160
In cases where pressuremeter tests have not beenperformed to the full depth of 8b, the weightingof the measured moduli can be performed ac-cording to Menard (1975).
For foundations with a smaller embedment thanthe plate width, the calculated settlement is in-creased by the percentages given in Fig. 123.
When there is a large variation in pressuremetermoduli with depth, i.e. when two separate geo-logical deposits with very different properties areinvolved, this calculation model may not be suit-able. The calculation is then performed for a two-layer system or for a soft layer at arbitrary depthaccording to Baguelin et al. (1978).
The Briaud method of calculatingsettlement and bearing capacity fromresults of pressuremeter testsThe Menard method of interpreting the pres-suremeter test and using the results entails thatbearing capacity and settlements are calculatedseparately without relating to each other. Thebearing capacity is thus calculated on the basis ofp
l as the ultimate bearing capacity without regard
to the size of the settlements that occur beforethen and the settlements are calculated on thebasis of E
pm using a constant modulus without
regard to its change with the shear stress level.
Briaud (1995) observed that the pressuremetertest, also when performed according to the Me-nard procedure, provides a complete stress-straincurve and presented a method for converting thisinto a continuous load-settlement curve for foot-ings.
The principle of the method is that the relativedisplacement DR
c/R
c measured in the pressurem-
eter test for an increase in radial pressure ppmt
canbe transformed to a relative settlement , s/b, foran increase in vertical pressure on a footing,pfooting. The transformation uses the equations
Fig. 123. Increase in settlement at superficial foundation depths in per cent according toBaguelin et al. (1978).
1 1 1 1 1
1 2[ Q [ [ [Q
= + +( ........ )
Ec and Ed are then calculated from
( (F
= 1
and
16/98,7,65,4,321 5.2
1
5.2
11
85.0
114
(((((
(G
++++=
Appendix: Calculation

Investigations and Load Tests in Clay Till 161
S SIRRWLQJ SPW= Γ
and
VE
55F
F
= ∆4 2.
wheres = settlement of footingb = width of footingR
c= radius of the cavity in the
pressuremeter testDRc = increase in radius in the
pressuremeter testppmt = pressure in the pressuremeter test
corresponding to DRc/Rc
pfootin
= footing pressure corresponding to s/bG = transformation function, which
depends on s/b
The procedure is started by plotting the pres-suremeter curve as DRc/Rc versus ppmt instead ofthe normal Menard curve with volume versuspressure. The cavity radius Rc at zero pressure isfound by plotting the relative change in pres-suremeter radius DR
p/R
p and extrapolating the
shape of the curve after initial seating errors backto zero pressure, Fig. 124.
The pressuremeter curves over a depth of 3bbelow the foundation level are then weightedwith respect to an assumed distribution of theinfluence, which is similar to that proposed bySchmertmann (1978), Fig. 125.
Fig. 124. Plotting of pressuremeter curve andevaluation of Rc.
Fig. 125. Recommended distribution of theinfluence factor and example ofallocation of influence areas a
i.
The various pressuremeter curves are weightedinto an average curve by allocating an influencearea to each curve corresponding to the test leveland the distances between the test depths. Foreach value of DR
c/R
c the average p
pmt is then
calculated as
S$
S DL L
= ∑1
wherepi = pressure at DRc/Rc in test iai = allocated influence area for test iA = total allocated influence area
and the average pressuremeter curve is thus gen-erated, Fig. 126. It is an advantage if a sufficientnumber of test curves are available so that theinfluence of a possible non-representative test issubdued.

SGI Report No 59162
The relative load-settlement curve is now con-structed by using the function G. A tentativecurve for the variation of this function was pro-posed by Briaud (1995) and this was modified byLarsson (1997) with respect to experience fromtests on Swedish sands and silts, Fig. 127.
For larger deformations, the factor G is fairlyconstant. However, for small deformations itrapidly increases. The G-factor thereby increasesthe curvature of the already rounded pressure-relative displacement curves from the pressure-
meter tests. The resulting load-settlement curvebecomes a shape with an initially stiff responseof the soil to the applied load, after which thesettlements accelerate with increasing load. Themethod is applicable for relative settlements upto 0.1b, where failure because of excessive set-tlements is considered to occur.
One problem with the method arises from thetime effects. The time steps in a pressuremeter
Fig. 126.Generation of theaverage pressuremetercurve for a footing.
Fig. 127.The transformationfunction G according toBriaud (1995) andLarsson (1997).
Appendix: Calculation

Investigations and Load Tests in Clay Till 163
test are often only applied for one minute andsettlements of a footing are normally calculatedfor a 10-year perspective. Briaud proposed thatthe pressures in some of the steps in the pres-suremeter test should be held constant longenough to enable an evaluation of the creep ex-ponent npmt
∆ ∆5 5W XWH
XWHF F
Q
W XWH
SPW
( ) ( )(
( ))=
1 1PLQ
PLQPLQ
This procedure was used in the tests with the newpressuremeter in the present investigations.
From comparisons with a number of load tests,Briaud proposed that the settlements of the testfootings could be calculated as
V VW XWH
XWHW XWH
QSPW
( ) ( ) (( )
)= 12
1PLQ
PLQPLQ
Briaud found this to apply in comparisons withload tests with a duration of up to 30 minutes.Similar corrections are used also when trans-forming 1-year settlements to 10-year settlementsand 100-year settlements respectively, However,transformation of a 1-minute settlement to a 10-year settlement involves 6 � 7 orders of magni-tude in time and is thus a considerable source oferror.
The Briaud method was evaluated in a study ofthe results of the previous plate load tests on sandand silt, (Larsson 1997). It was then not possibleto evaluate the method proposed by Briaud fortransformation of the pressuremeter test resultswith regard to time because the required holdingtests for evaluation of the exponent npmt weremissing. Like the Menard interpretation and set-tlement calculation, the calculation by the Briaudmethod appears to be sensitive to the quality ofthe predrilled hole. A new transformation func-tion was therefore proposed, based on the Swed-ish results. In the Menard procedure, there arecertain possibilities for compensating for thequality of the hole by selecting the rheologicalfactor a accordingly, but for the Briaud methodno such method has been elaborated.
New approaches to to taking the variationin modulus with stress and strain intoconsiderationAnother method of calculating settlements inoverconsolidated soils from the results of pres-sure meter tests has been proposed by Ekdahland Bengtsson (1996). The method uses themoduli determined from the repeated unloadingand reloading cycles at several stress levels in therelated proposal for a new testing procedure, see�Pressuremeter tests: New pressuremeter�. Thisprocedure allows an evaluation of both the in-crease in modulus of elasticity with increasingnormal stresses and its decrease with increasingshear strains. The calculation method has beenshown to give promising results in clay till. How-ever, the original method appeared to requiresome modification with respect to the relationsbetween the influence of the decrease in moduluswith increase in shear strain and the simultaneousincrease in stiffness because of the increasingstress level. This proved to be the case for thefoundations with limited widths for which it wastested and where the calculated load-settlementcurves tended to bend off in the wrong direction.
The method is based on stress calculations fromtheory of elasticity, whereby both increases invertical and horisontal directions are calculatedcontinuously with depth. The stresses are calcu-lated under the �characteristic� point where thestress (and settlement) is independent of the ri-gidity of the foundation. When the foundation isembedded in the ground, an increased depth kz,which is a function of the relation between foun-dation width and embedment depth, is calculatedaccording to Jelinek (1951) and used in the stresscalculation. The vertical strain is then calulatedas
( )( )\[]
]
] (σ∆σ∆νσ∆ε∆ +−= 1
Where Dsx, Ds
y and Ds
z are the stress changes in
x, y and z directions. Ez is the modulus of elastici-ty at depth z and n is the Poisson�s ratio

SGI Report No 59164
The increase in mean stress level Dqq caused by
the external load is (Dsx +Dsy +Dsz)/3.
The proposed calculation process is as follows:
� The bearing capacity of the foundation is cal-culated according to the Menard procedurefor results from pressuremeter tests.
� A load increment equal to 10 % of the bearingcapacity is selected.
� The stress increases in the ground resultingfrom the load increment are calculated
� The stress level is calculated as the initialstress at depth z in the ground, s´z0 (1+2K0)/3,plus half of the increase in stress level causedby the external load. s´
z0 is the in situ vertical
stress and K0 is the in situ coefficient of earthpressure.
� Values of Ez are assumed on the basis of thestress levels, assumed strain levels and therelations between these parameters and themoduli evaluated from the pressuremetertests.
� The strains are calculated as described aboveand compared to the assumed strain levels.An iterative procedure is then used to matchthe moduli and the strains. When these con-verge, the actual moduli and strains are foundand the settlement of the foundation is ob-tained by integration over the depth of influ-ence. This depth is limited according toSchmertmann (1978).
� The procedure is repeated successsively forequally large load increments until a completeload-settlement curve is obtained.
In principle, the calculation method describedabove can be used also for other test results, suchas results from triaxial tests. Also other formula-tions of the variation in modulus depending onshear stress, strain and normal stresses level canbe evaluated from e.g. the pressuremeter tests
and used in the calculation method. The calcula-tion of stresses may have to be modified depend-ing on the geometry of the loading, the depth ofthe compressible layers and the stratigraphy ofthe soil. The relative influence of stress, strainand time on the moduli may have to be modifiedand empirical correction factors may also have tobe introduced, but the general calculation proce-dure will still be useful.
The calculated strains and settlements need to bemodified with respect to time in order to yieldvalues that are relevant for the design life of afoundation. This can be done by using any of theaforementioned methods of describing time ef-fects. The time aspects in this correction willdepend on how fast the test was performed, inwhich the modulus was determined. Normally,the settlement calculations refer to 10-yearsettlements.When using a correction of the mod-ulus with respect to time, this can be done al-ready when the moduli are introduced into thecalculations and no subsequent correction is thennecessary.
A very approximate way of estimating the varia-tion in modulus in stiff soils is to use the initialshear modulus G0 together with empirical knowl-edge about the variation of this modulus withmobilisation of the shear strength. The shearmodulus can then be converted to a correspond-ingly changing modulus of elasticity and the set-tlements can be roughly estimated. However, thisrequires a coupling to a model for calculating therelated settlements caused by volumetric com-pression or, alternatively, this compression mustbe so small that it can be neglected. Furthermore,the time effects will have to be considered. Whenmeasuring G0 by seismic methods, the time in-volved in the measurement is only a fraction of asecond and the conversion to 10-year deforma-tions is not straightforward.
Appendix: Calculation

Investigations and Load Tests in Clay Till 165
A.3 PREDICTION OFBEARING CAPACITY
The general bearing capacity equationThe general equation for bearing capacity isbased on the original Prandtl formula, which hasbeen supplemented with correction factors forinclined load, eccentric load, depth of embed-ment, shape of the foundation, inclined groundsurface, inclined base of the foundation and lay-ered soil profile, (Brinch-Hansen 1961 and 1973,Brown and Meyerhof 1969, Tscheng 1957, Vesic1973). The correction factors are partly based onexperimental results and slightly different bear-ing capacity factors have also been proposed. InSweden, the factors given by Hansbo and Säll-fors (1984) in the BYGG engineering handbookhave recently been updated by Bergdahl et al.(1993) in the new handbook for shallow founda-tions. A new and partly different proposal forbearing capacity and correction factors has sub-sequently been presented by CEN (1994).
According to Bergdahl et al., the general equa-tion can be written
T F1 T1 E 1E F F T T HI= + +ξ ξ γ ξγ γ� ��
whereqb = ground pressure at failure, kPac = cohesion, part of the shear strength,
kPaq = overburden pressure at the
foundation level, kPag´ = effective unit weight of the soil
below the foundation level, kN/m3
bef = effective width of the foundation, m(at centric loading b
ef=band at
eccentric loading bef = b - 2eb, whereeb = eccentricity, m)
Nc, N
q, N
g= bearing capacity factors being
functions of the effective frictionangle in the soil as described below
xc´ x
q´ x
g= correction factors for conditions
differing from those for which thebearing capacity factors wereelaborated
xc = dc ·sc· ic· gc· bc
xq = d
q ·s
q ·i
q · g
q ·b
q
xg = d
g · s
g · i
g ·g
g ·b
g
where d, s, i, g, and b are correction factors fordepth of embedment, shape of foundation, in-clined load, inclined ground surface and inclinedbase respectively.
For the current investigation, the latter three cor-rections are not relevant.
The first term in the general equation relates tothe contribution of the cohesion, c, in the soil, thesecond to the contribution from the overburdenpressure at the foundation level, q, and the thirdto the contribution from the weight of the wedgeof soil sliding out from below the foundation atfailure, g, Fig. 128.
Fig. 128. Bearing capacity - schematicprinciple of the general equation.
In its basic form, the general equation is valid foran infinitely long foundation placed directly onthe ground surface and loaded by a centric load.Differing conditions can be taken into account bymultiplying the bearing capacity factors Nc, Nq
and Ng by the correction factors (x).

SGI Report No 59166
In cohesive soils and undrained conditions, thefriction angle is assumed to be zero, whereby N
g
becomes zero and Nq = 1. The equation is then
reduced to
T F1 TE F F T= +ξ ξ
In cohesionless soil, (c = 0), the equation be-comes
T T1 E 1E T T HI= +ξ γ ξγ γ� ��
Bearing capacity factors
The bearing capacity factors, N, are calculated asfollows:
In undrained conditions, i.e. f´ = 0
1
1
1
FX
TX
X
= +
=
=
π
γ
�
�
�
In drained conditions
1 1F T= −� �FRW � φ
1 HT = +−
��
VLQ VLQ
WDQ φφ
π φ
1 ) Hγ
π φφ φ
φ= +
−−
� �
VLQ VLQ
WDQ ��
�
��
where F(f´) = 0.08705 + 0.3231 sin(2f´) -0.04836 sin2(2f´).
Determination of the relevant vertical stressat the foundation levelIn undrained conditions, the bearing capacity isdependent on the total vertical stress at the foun-dation level
T G= γ PLQ
where dmin
is the minimum foundation depth, seeFig. 129.
Fig. 129. Determination of minimumfoundation depth.
In drained conditions, the bearing capacity isdependent on the effective vertical stress at thefoundation level q´. If the foundation level islocated below the free ground water level, therelevant effective vertical stress, which replacesq in the equation, becomes q´ = q-u, where u isthe pore water pressure at the foundation level.In the case of negative pore pressures, the totaloverburden pressure q is used in the equation andthe effect of the negative pore pressure is con-verted to a �false cohesion� as described below.
Determination of relevant unit weight of thesoil below the foundationWhen the free ground water level is locateddeeper than bef below the foundation level, theunit weight g is introduced in the calculations.When the free ground water level is located at orabove the foundation level, the effective unitweight g´ should be used, provided that theground water conditions are hydrostatic. In non-hydrostatic conditions, a corresponding unitweight g
i may be used
Appendix: Calculation

Investigations and Load Tests in Clay Till 167
γ γ γL Z L= − +� ��
wheregw = unit weight of water, kN/m3
i = hydraulic gradient DH/d in theupward direction
DH/d = change in hydraulic head per unitdepth, m/m
When the free ground water level is located with-in bef below the foundation level, a relevant valueof g
eq between g and g´, which is weighted over
the depth bef, is used.
Correction for foundation depth, dThe shear strength of the soil above the founda-tion level also contributes to the bearing capacity.This is taken into account by using the followingcorrection factors:
Nc: G
GEFHI
= +� � ��� ; dc £ 1.7
Nq: GGETHI
= +� � ��� ; dq £ 1.7
Ng: d
g = 1
Correction for foundation shape, sThe basic equation is valid for an infinitely longstrip foundation. For other shapes, correctionshave to be applied. According to Lee et al.(1983) the following correction factors apply
Nc: VE
OFHI
HI= +� � �� if f´ = 0
V1
1
E
OFT
F
HI
HI= +� if f´ ¹ 0
Nq: VE
OTHI
HI= +� �WDQ �φ
Ng: V
E
OHI
HIγ = −� � ��
In all cases bef £ lef.
Further correction factors, i, g and b, and correc-tions for dry crust or coarse soil on soft clay,which are not relevant for the current investiga-tion, are described in Bergdahl et al. (1993),among others.
Estimation of the effect ofnegative pore pressuresThe effect of negative pore pressures (matrixsuction) on the bearing capacity can be verygreat. Before this effect is utilised in a design, ithas to be ascertained that the matrix suction ismaintained at all times. Furthermore, a determi-nation must be made of the minimum values thatcan safely be counted upon. Unless this has beenclarified, the effect of matrix suction should notbe taken into account.
When evaluating plate loading tests and alsocertain other field tests such as screw plate testsand pressuremeter tests, the matrix suction pre-vailing at the time of the test has to be consid-ered. According to Fredlund and Rahardjo(1993), the effect of the matrix suction can beconverted into a �false cohesion�. According toÖberg (1997), this can be calculated from
F X X 6D D Z U≈ −� � WDQ φ
wherec
a= apparent cohesion
ua = pore air pressure, normally assumed tobe equal to the atmospheric pressure
uw
= pore water pressureSr = saturation ratiof´ = friction angle
According to the pore pressure measurements,there were no effects of natural matrix suction inthe ground during the investigations and loadtests in the present project.
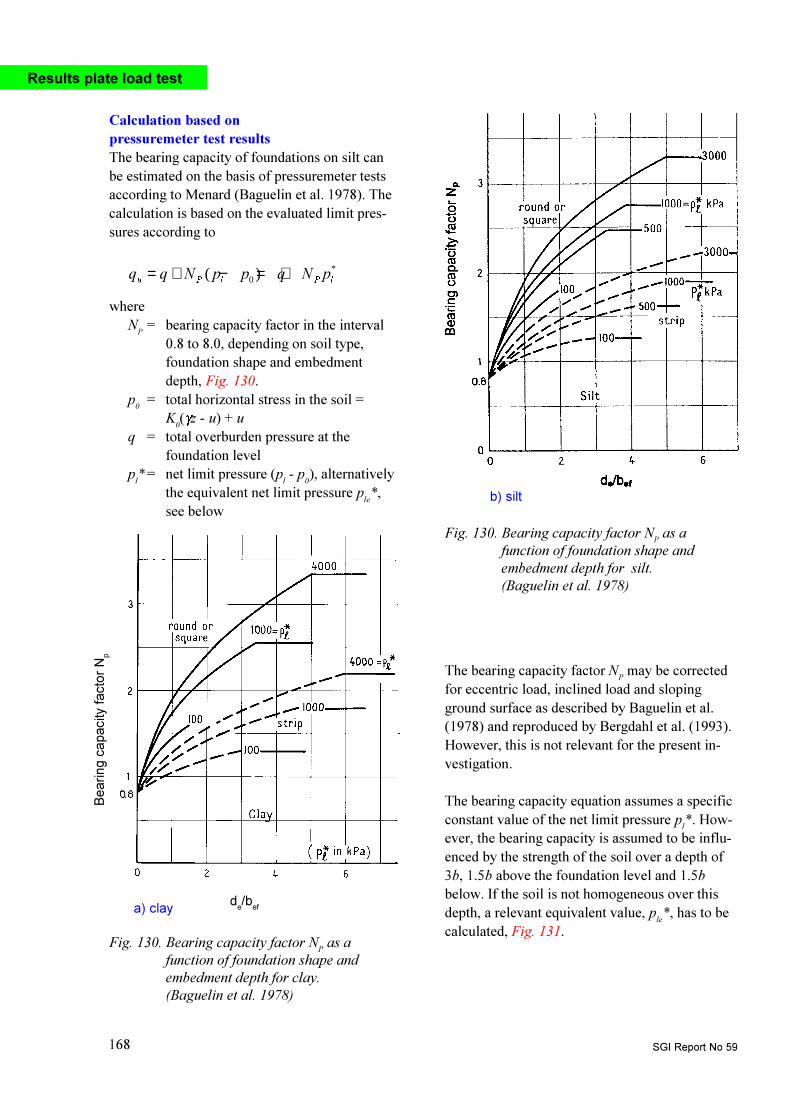
SGI Report No 59168
Calculation based onpressuremeter test resultsThe bearing capacity of foundations on silt canbe estimated on the basis of pressuremeter testsaccording to Menard (Baguelin et al. 1978). Thecalculation is based on the evaluated limit pres-sures according to
T T 1 S S T 1 SX 3 O 3 O
= + − = +( ) *0
whereN
P= bearing capacity factor in the interval
0.8 to 8.0, depending on soil type,foundation shape and embedmentdepth, Fig. 130.
p0 = total horizontal stress in the soil =K
0(gz - u) + u
q = total overburden pressure at thefoundation level
pl* = net limit pressure (p
l - p
0), alternatively
the equivalent net limit pressure ple*,
see below
Fig. 130. Bearing capacity factor NP as afunction of foundation shape andembedment depth for clay.(Baguelin et al. 1978)
de/b
ef
Be
ari
ng
ca
pa
city
fa
cto
r N
p
Fig. 130. Bearing capacity factor NP as afunction of foundation shape andembedment depth for silt.(Baguelin et al. 1978)
b) silt
a) clay
The bearing capacity factor NP may be corrected
for eccentric load, inclined load and slopingground surface as described by Baguelin et al.(1978) and reproduced by Bergdahl et al. (1993).However, this is not relevant for the present in-vestigation.
The bearing capacity equation assumes a specificconstant value of the net limit pressure pl*. How-ever, the bearing capacity is assumed to be influ-enced by the strength of the soil over a depth of3b, 1.5b above the foundation level and 1.5bbelow. If the soil is not homogeneous over thisdepth, a relevant equivalent value, p
le*, has to be
calculated, Fig. 131.
Results plate load test
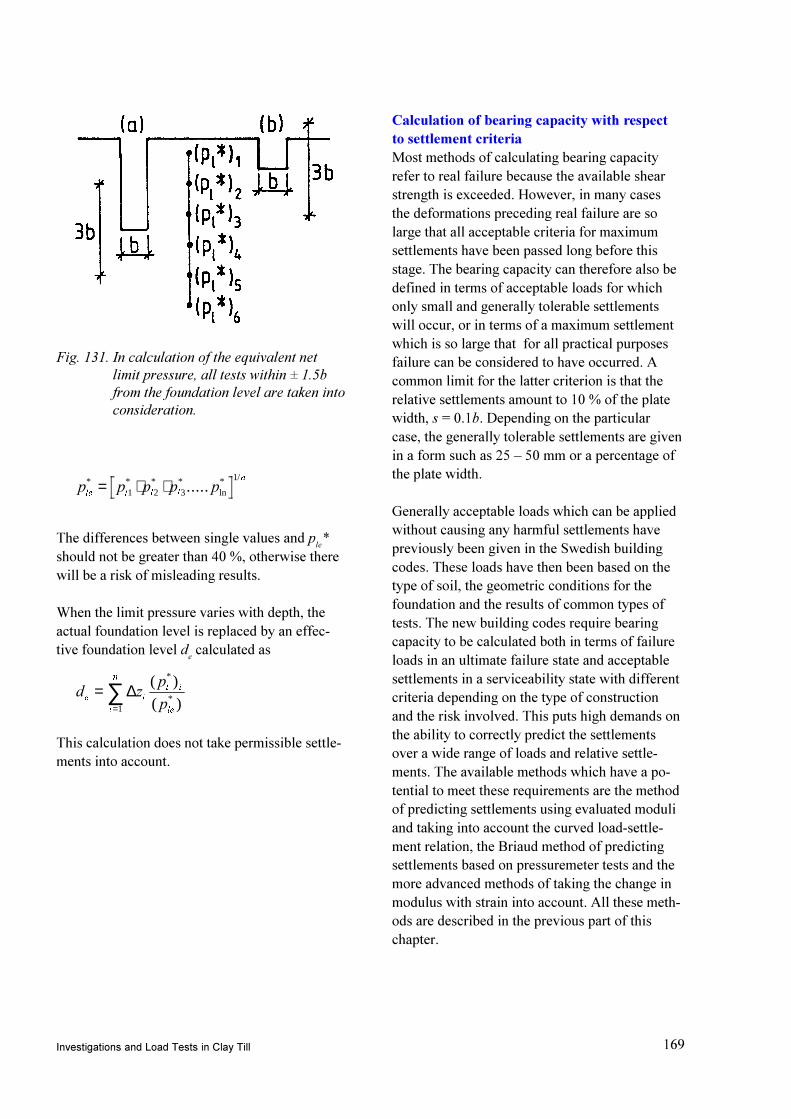
Investigations and Load Tests in Clay Till 169
S S S S SOH O O O
Q* * * *ln* /
.....= ⋅ ⋅1 2 3
1
The differences between single values and ple*
should not be greater than 40 %, otherwise therewill be a risk of misleading results.
When the limit pressure varies with depth, theactual foundation level is replaced by an effec-tive foundation level d
e calculated as
G ]SSH L
L
Q
O L
OH
==∑ ∆
1
( )
( )
*
*
This calculation does not take permissible settle-ments into account.
Calculation of bearing capacity with respectto settlement criteriaMost methods of calculating bearing capacityrefer to real failure because the available shearstrength is exceeded. However, in many casesthe deformations preceding real failure are solarge that all acceptable criteria for maximumsettlements have been passed long before thisstage. The bearing capacity can therefore also bedefined in terms of acceptable loads for whichonly small and generally tolerable settlementswill occur, or in terms of a maximum settlementwhich is so large that for all practical purposesfailure can be considered to have occurred. Acommon limit for the latter criterion is that therelative settlements amount to 10 % of the platewidth, s = 0.1b. Depending on the particularcase, the generally tolerable settlements are givenin a form such as 25 � 50 mm or a percentage ofthe plate width.
Generally acceptable loads which can be appliedwithout causing any harmful settlements havepreviously been given in the Swedish buildingcodes. These loads have then been based on thetype of soil, the geometric conditions for thefoundation and the results of common types oftests. The new building codes require bearingcapacity to be calculated both in terms of failureloads in an ultimate failure state and acceptablesettlements in a serviceability state with differentcriteria depending on the type of constructionand the risk involved. This puts high demands onthe ability to correctly predict the settlementsover a wide range of loads and relative settle-ments. The available methods which have a po-tential to meet these requirements are the methodof predicting settlements using evaluated moduliand taking into account the curved load-settle-ment relation, the Briaud method of predictingsettlements based on pressuremeter tests and themore advanced methods of taking the change inmodulus with strain into account. All these meth-ods are described in the previous part of thischapter.
Fig. 131. In calculation of the equivalent netlimit pressure, all tests within ± 1.5bfrom the foundation level are taken intoconsideration.