report
TRANSCRIPT

PREPARATION OF DESIGN AIDS FOR COLUMN AND
BEAM
Jagriti Mandal, Tripti Dubey, V. Shantha Kumari

PREPARATION OF DESIGN AIDS FOR COLUMN AND
BEAM
In partial fulfillment, this dissertation is submitted to
Dr. B. R. Ambedkar Institute of Technology
Pondicherry University
for award of
Bachelor of Technology in CIVIL ENGINEERING
by
JAGRITI MANDAL
TRIPTI DUBEY
V.SHANTHA KUMARI
Under the guidance of
Prof.JENSON DANIEL, HOD (CIVIL)
DEPARTMENT OF CIVIL ENGINEERING
DR. B. R. AMBEDKAR INSTITUTE OF TECHNOLOGY, PORT
BLAIR
APRIL 2014

DECLARATION
I certify that
a. The work contained in the report has been done by my project mates and me
under the guidance of my guide.
b. I have followed the guidelines provided by the Institute in writing the report.
c. I have conformed to the norms and guidelines given in the Ethical Code of
Conduct of the Institute.
d. Whenever I have used written material or other materials from other sources, I
have given them due credit by citing them in detail.
e. I have not resorted to plagiarism and have given due citation and credit to original
source of work whenever referred.
Signature of the Student

ABSTRACT
This project aims at preparing the interaction curves for designing and analysis of
columns which will help in filling the gaps of Design Handbook SP-16. The Design
Handbook SP-16 provides design aids for columns in the form of non-dimensional
interaction curves. The design aids cover the following three cases of symmetrically
arranged reinforcement:
1. Rectangular sections with reinforcement distributed equally on two sides
(Charts 27-38).
2. Rectangular sections with reinforcement distribute equally on four sides
(Charts 39-50).
3. Circular column sections (Charts 51-62).
Corresponding to each of the above three cases, there are only 12 charts available for
each case covering the three grades of steel (Fe 250, Fe 415, Fe 500), with four
values of d’/D ratio for each grade (i.e. 0.05, 0.10, 0.15, 0.20). Each of the 36 charts
cover a family of non-dimensional design interaction curves with p/fck values ranging
from 0 to 0.26 i.e., each chart comprises of 14 curves.
In actual practice, d’/D value varies from 0.035 to 0.25(approximately).For the
purpose of designing and analysis, the value of d’/D is approximated to the nearest
value specified in the design charts which creates approximation errors.
To fill the gaps in design aids and hence minimizing the approximation errors, 57
charts are prepared for each of the three cases of reinforcement covering the three
grades of steel (Fe 250, Fe 415, Fe 500), with nineteen values of d’/D ratio for each
grade (i.e. 0.03, 0.04, 0.06, 0.07, 0.08, 0.09, 0.11, 0.12, 0.13, 0.14, 0.16, 0.17, 0.18,
0.19, 0.21, 0.22, 0.23, 0.24, 0.25). Each of the charts will comprise of 14 curves for
14 values of p/fck.Altogether the project aims at preparing 2394 interaction curves for
designing and analysis of columns.
Keywords:-
Interaction Curves
d’/D ratio
p/fck

ACKNOWLEDGEMENT
We express our gratefulness and sincere gratitude to our guide Prof.Jenson
Daniel, Head of the Department (Civil Engineering), Dr. B. R. Ambedkar Institute of
Technology, Port Blair, for his excellent guidance and immense encouragement.
We would like to express our thanks to Dr. Utpal Sharma, Principal, Dr. B. R.
Ambedkar Institute of Technology, Port Blair, for providing the necessary facilities
and encouragement for the successful completion of the project.
We express our thanks to Prof. G. K. Loganathan, CCF Laboratory In charge
and other staff members of Department of Civil Engineering, for their timely suggestion
and help during this project work.
We would like to thank the staff members of the Project Review Committee,
Prof. GunvantiParmar, Prof. AlaguSundaramfor their constructive criticism and
encouragement.
Jagriti Mandal
Tripti Dubey
V. Shantha Kumari

CONTENTS
Chapter
No.
Chapter Name
Project consent certificate
Certificate
Declaration
Abstract
Acknowledgement
List of figures
List of symbols and abbreviations 1 INTRODUCTION
1.1 Objective
1.2 Features
1.2.1 Applications
1.2.2 Advantage 2 LITERATURE REVIEW
2.1 Design Aids for Reinforced concrete to IS 456: 1978
(SP: 16)
2.2 Reinforced Concrete Design (2nd Revised Edition)
- S. N. Sinha
2.3 Reinforced Concrete Design (3rd Edition)
- S. Unnikrishna Pillai
- Devdas Menon
2.4 Limit state theory and design of Reinforced concrete
- Dr. S. R. Karve
- Dr. V. L. Shah
3 Development of the system 3.1 Methodology 3.2 Concept

CHAPTER 1
INTRODUCTION
1.1 Overview:
This project aims at preparing non-dimensional interaction curves (design charts) for
rectangular and circular sections of columns. The Design handbook SP: 16 already
provides design charts for three cases of reinforcement arrangement in column which
helps in easy and fast design and analysis of columns. The three cases of reinforcement
are:
a) Rectangular sections with reinforcement distributed equally on two sides
b) Rectangular sections with reinforcement distribute equally on four sides
c) Circular column sections
For each of the above three cases, there areonly 12 charts available covering the three
grades of steel (Fe 250, Fe 415, Fe 500), with four values of d’/D ratio for each grade
(i.e. 0.05, 0.10, 0.15, 0.20). But in real practice the value of d’/D varies from 0.035 to
0.25(approximately).
Existing with
interval of 0.05 Requirement with interval of 0.01 Gap
d’/D
values:
0.05, 0.10, 0.15,
0.20
0.03, 0.04, 0.05, 0.06, 0.07, 0.08
0.09, 0.10, 0.11, 0.12, 0.13, 0.14
0.15, 0.16, 0.17, 0.18, 0.19, 0.20
0.21, 0.22, 0.23, 0.24, 0.25
0.03, 0.04, 0.06, 0.07, 0.08,
0.09, 0.11, 0.12, 0.13, 0.14,
0.16, 0.17, 0.18, 0.19, 0.21,
0.22, 0.23, 0.24, 0.25
No.
of charts:
36 207 171
Total No.
of curves:
504 2898 2394
For intermediate values of d’/D approximation or linear interpolation has to be done
which creates error in the results.
To minimize this error, design charts for the intermediate values of d’/D are prepared by
keeping an interval of 0.01.
1.2 Objective:
To prepare non-dimensional interaction curves for rectangular and circular sections of
columns.

1.3 Features:
1.3.1 Application:
a) The design charts are useful in simplified and fast designing and analysis
of column.
b) The design charts gives additional information about the type of failure of
the column section.
1.3.2 Advantage:
a) The design charts gives a simplified approach of design and analysis of
column.
b) By preparing design charts for the intermediate values of d’/D, the
approximation error is reduced in design and analysis procedures and
more accurate results are obtained.

CHAPTER 2
LITERATURE REVIEW
2.1 TITLE:Design Aids for Reinforced Concrete to IS 456:1978(SP 16)
PUBLISHED IN:Bureau of Indian Standards
Bahadur Shah Zafar Marg,
New Delhi- 110 002
2.1.1 Abstraction:
Design Aids is an explanatory handbook toIS: 456-1978 Code of practice for Plain
and Reinforced Concrete (Third Edition). It covers the basis/source of each clause,
the interpretation of the clause and worked out examples to illustrate the application
of the clauses. The objective of this design aids is to reduce design time in the use of
certain clauses in the Code for the design of beams, slabs and columns in general
building structures.
2.1.2 Overview:
2.1.2.1 Features:
The design aids cover the following:
a) Material Strength and Stress-Strain Relationships
b) Flexural members (Limit State Design)
c) Compression Members (Limit State Design)
d) Shear and torsion(Limit State Design)
e) Development Length and Anchorage(Limit State Design)
f) Working Stress Method
g) Deflection Calculation
h) General Tables
The format of this design aids is as follows:
a) Assumption regarding the material strength
b) Explanation of the basis of preparation of individual sets of design aids as related
to the appropriate clauses in the code
c) Worked example illustrating the use of design aids
Some important points to be noted in the use of design aids are:
a) The design units are entirely in SI units as per the provisions of IS : 456-1978
b) Notations as per IS : 456-1978 are maintained here as far a possible
c) Both charts and tables are given for flexural members. The charts can be used
conveniently for preliminary design where greater accuracy is required, the tables
may be used
d) Design of column is based on uniform distribution of steel on two faces or on four
faces

e) Charts and tables for flexural members do not take into consideration crack
control and are meant for strength calculations only. Detailing rules given in the
code should be followed for crack control
f) If the steel being used in the design has a strength which is slightly different from
the one used in the charts and tables, the chart or table for the nearest value may
be used and areaof reinforcement thus obtained modified in proportion to the ratio
of the strength of steels
2.1.2.2 Inference:
The Design Handbook SP: 16 provides non-dimensional interaction curves (design
charts) for design and analysis of columns. The interaction curves is obtained by
plotting various combinations of axial force and moment capacity of section
determined for different positions of neutral axis. It provides additional information
about the type of failure occurring in the section of columns. Any combination of
axial load and moment falling within the interaction curve is safe combination.
Fig. 2.1 Pu – Mu interaction curve
The ‘interaction curve’ is a complete graphical representation of the design strength
of a uniaxially eccentrically loaded column of any proportion. Each point on the
curve corresponds to the design strength values of Pur and Mur associated with
specific eccentricity (e) of loading.
As the use of interaction curve (Fig. 2.1) is limited to the chosen dimensions of the
section and the area of reinforcement, therefore it has been modified by expressing
Pu and Mu in non-dimensional form as Pu/(fckbD) and Mu/(fckbD2) respectively and
plotting curves for various values of p/fck so that it can be used for any dimensions
of column section, area of reinforcement and values of fck.

The design charts (non-dimensional interaction curves) given in the Design
HandbookSP: 16, cover the following three cases of symmetrically arranged
reinforcement:
a) Rectangular sections with reinforcement distributed equally on two sides
(Charts 27-38): the ‘two sides’ refer to the sides parallel to the axis of
bending; there are no inner rows of bars, and each outer row has an area of
0.5As(figure 2.2); As being the total area of steel
b) Rectangular sections with reinforcement distribute equally on four sides
(Charts 39-50): Two outer rows (with area 0.3As each) and four inner rows
(with area 0.1As each) has been considered in the calculations. However the
use of these charts can be extended without significant error, to cases of not
less than two inner rows (with a minimum area of 0.3Asin each outer row), as
shown in figure 2.3.
c) Circular column sections (Charts 51-62): the charts are applicable for circular
sections with at least six bars (of equal diameter) uniformly spaced
circumferentially, as shown in the figure 2.4.
Corresponding to each of the above three cases, there are 12 charts available for
each case covering the three grades of steel (Fe 250, Fe 415, Fe 500), with four
values of d’/D ratio for each grade (i.e. 0.05, 0.10, 0.15, 0.20). For intermediate
values of d’/D, linear interpolation may be done. Each of the 36 charts cover a
family of non-dimensional design interaction curves with p/fck values ranging
from 0 to 0.26 i.e., each chart comprises of 14 curves.
Fig. 2.4 Circular column section
Fig. 2.2 Rectangular section with
reinforcement distributed equally on
two sides
Fig. 2.3 Rectangular section with
reinforcement distributed equally on all
sides

Figure 2.5 to figure 2.7 shows such non-dimensional interaction curves for
rectangular and circular sections of column as adopted in design handbook SP-16 of
Indian Standard Publications. It is obtained for particular value of d’/D and fy.
Fig 2.5 Interaction curve for rectangular section with reinforcement
equally distributed on two opposite faces

Fig 2.6 Interaction curve for rectangular section with reinforcement
equally distributed on four faces

Fig 2.7 Interaction curve for circular section
The design of column section with the use of such interaction curve is simple. The
cross-sectional dimension, distribution of reinforcement and its effective cover is
fixed.Then the values of Pu/(fckbD) and Mu/(fckbD2) are plotted as ‘p’ and ‘m’
respectively. The intersection of horizontal and vertical lines from ‘p’ and ‘m’
respectively at point ‘s’ gives the value of p/fck. Thus, the value of p i.e., percentage
of reinforcement, is obtained.

2.2 TITLE: REINFORCED CONCRETE DESIGN, SECOND
REVISED EDITION
AUTHOR: S. N. SINHA
Professor
Department of Civil Engineering
Indian Institute of Technology
New Delhi
PUBLICATION: Tata McGraw Hill Education Private Limited, New Delhi
2.2.1 Abstraction:
The primary objective of this book is to furnish a basic understanding of materials for
reinforced concrete, and the behaviour an design of basic reinforced concrete
structural elements. Emphasis has been laid on limit-state method of design in
accordance with the latest Indian code and design practice.
2.2.2 Overview:
2.2.2.1 Features:
This book covers the following topics:
a) Properties of concrete and reinforcement.
b) Basic philosophy of design highlighting working stress, ultimate strength and
limit state methods of design.
c) Analysis and design of beam sections with use of design curves for rectangular
and T-sections.
d) The behaviour and design of beam under shear, torsion and bond.
e) Servicebility limit state design consisderations.
f) Design of beam elements and reinforcement detailing intergrating all the design
aspects.
g) Design of one-way, two-way and fat slabs.
h) The design of columns.
i) Design of staircase
j) Design of retaining walls
k) Design of Foundations.
2.2.2.2 Inference:
This book describes about the behaviour of column under load, design approach for
column section using Limit State Method. It provides the procedure to design
columns using Design Handbook SP: 16.
This book also provides assumptions for design of columns. Following are the basic
assumptions made in the limit state design method:

a) The plane section normal to the axis of the column before deformations remains
plane after deformation i.e., the strain at any point is proportional to its distance
from the neutral axis
b) The tensile strength of concrete is ignored
c) The failure of concrete is governed by the maximum strain criteria. For member
under concentric load, the ultimate strain in concrete is taken as 0.002. The
ultimate strain in concrete in bending is taken as 0.0035. For the entire section in
compression under axial load and moment, the transition of strain from 0.002 for
pure axial load condition to 0.0035 for pure bending governs the failure of the
column section as shown in the figure 2.8. The strain distribution line passes
through the point of intersection F of strain distribution lines of two extreme
conditions of uniform strain of 0.002 for purely axial load case and when strain at
the least compressed edge is 0 and strain at the highly compressed edge is 0.0035
for the neutral axis lying at the edge of the least compressed edge. Thus, the
maximum strain at the most compressed edge of the section shall be taken as
0.0035 minus 0.75 times the strain in the least compressed edge of the section as
shown in figure 2.8.
Fig. 2.8 Limiting strain diagram for column section
d) The design stress-strain curve of concrete is shown in Fig.2.9. Compressive
strength of concrete in the structure is assumed to be 0.67 times the characteristic
strength of concrete. The partial factor of safety γmequal to 1.5 is applied to the
strength of concrete in addition to it. Therefore, the design strength of concrete is
0.67fck/1.5, i.e., 0.446fck.The equation for the parabolic part of the curve is given
by,
fcc= 446 fck(ec-250(ec)2)
The short term static modulus of elasticity of concrete is given by,
Ec = 5000(fck)½
e) The design stress-strain curves for mild and cold worked deformed bars as shown
in the figure 2.10 and fig. 2.11 respectively. The partial factor of safety, γm to the

strength of steel is taken as 1.15. Therefore, the strength is fy/1.15, i.e., 0.87 fy.
For mild steel, the design stress-strain curve is linear up to a stress of 0.87fy and
thereafter, the strain increase at a constant stress. For cold-worked deformed bars,
the design stress-strain curve is linear up to a stress of 0.8 × 0.87fy = 0.696fy and
thereafter it is non-linear up to a stress of 0.87fy at a strain of 0.002 + 0.87fy/Es.
The value of design stress and the corresponding value of inelastic strain at some
typical points have been shown in table 2.1. It also gives the values of total strain
and design stress for steel of grade Fe 415 and Fe 500.
Fig. 2.9 Design stress-strain curve for concrete
Fig. 2.10 Design stress-strain curve for mild steel

Fig. 2.11 Design stress-strain curve for cold worked deformed bar
Design
Stress
Inelastic
Strain
Grade of steel
Fe 415 Fe 500
Strain Stress Strain Stress
0.8 × 0.87 fy 0.0 0.00144 288.7 0.00174 347.8
0.85 × 0.87 fy 0.0001 0.00163 306.7 0.00195 369.6
0.9 × 0.87 fy 0.0003 0.00192 324.8 0.00226 391.3
0.95 × 0.87 fy 0.0007 0.00241 342.8 0.00277 413.0
0.975 × 0.87
fy
0.001 0.00276 351.8 0.00312 423.9
1.0 × 0.87 fy 0.002 0.0038 360.9 0.00417 434.8
Table 2.1 Salient Points on Design Stress-strain Curve of Cold Worked Deformed Steel
It lays down the steps to determine the axial load and moment capacity for a section
of column subjected to combined axial load and uniaxial moment. The computation
of axial load and moment capacity of the sectionfor an assumed position of neutral
axis can be made by establishing the strain profile based on the failure criteria of
column section. Figure 12 (a) and (b) shows the position of neutral axis outside and
within the section and the corresponding strain profiles respectively. The stress
diagrams for concrete and steel can be detremined from their design stress-strain
curves as shown in the figure.
For neutral axis lying outside the section, the axial load capacity can be determined as
follows.
Pu = Cc + Cs

The moment capacity of the section can be determined by taking the moment of forces
about the centre of the section as follows:
Mu = Cc (0.5D – yc) + ∑ Csi ysi
where Cc = compressive force in concrete
Cs = compressive force in steel
yc = distance of centroid of compressive force in concrete from the
most compressed edge of the section
ysi = distance of reinforcement I from the centre of the section
Thus, interaction curves can be plotted by between various combination of axial force
and moment capacity of section determined for different positions of neutral axis.

2.3 TITLE: REINFORCED CONCRETE DESIGN, THIRD EDITION
AUTHORS: S. Unnikrishna Pillai
Fellow, American Society of Civil Engineers
Former Principal, Regional Engineering College (now NIT), Calicut and
Director, Cooperative Academy of Professional Education, Trivandrum
Devdas Menon
Professor, Department of Civil Engineering
Indian Institute of Technology, Madras, Chennai
PUBLICATION: Tata McGraw Hill Education Private Limited, New Delhi
2.3.1 Abstraction:
This book presents a state-of-the-art coverage of all the topics in reinforced concrete
design generally required for a civil-engineering degree programme in Indian
universities. Several advanced topics in the bookare also relevant at the post-graduate
level. This book lays emphasis on conceptual clarity and strength in fundamentals.
2.3.2 Overview:
2.3.2.1 Features:
This book covers the following topics:
a) Concepts of reinforced concrete structures.
b) Basic material properties and basic design concepts
c) Elastic and inelastic behavior of reinforced concrete beams under flexure
d) Design of beams and one-way slabs for flexure
e) Design for shear, design for bondand design for torsion
f) Analysis for design moments in continuous systems
g) Serviceability limit states: deflection and cracking
h) Design of two-way slab systems
i) Design concepts of staircases, compression members, footings and retaining
walls
j) Information on good detailing, construction practices and special provisions
for earthquake-resistant design
k) Design for shear by compression field theory
l) Design using strut-and-tie model and fire resistance
2.3.2.2 Inference:
This book describes the behavior and design of short compression members subject
to axial compression combined with uniaxial bending, i.e., bending with respect to
either the major axis or minor axis (but not both).This book describes and illustrate

the distribution of strains at Ultimate Limit State. It also describes the types of
failure in eccentric compression of columns and gives salient points on the
interaction curve.
Strain Distribution at Ultimate Limit State:
A special limiting case of uniaxial eccentric compression is the condition of zero
eccentricity (e = 0, i.e., Mu = 0) which corresponds to the axial loading condition.
Corresponding to this condition, the strain across the column section is uniform and
limited to εcu = 0.002 at the limit state of collapse in compression (as per the Code).
The other limiting case of uniaxial eccentric compression corresponds to infinite
eccentricity (e = ∞, i.e., Pu = 0), which is equivalent to a condition of ‘pure’ flexure.
Corresponding to this condition, the strains are linearly distributed across the
section with a ‘neutral axis’ (NA) located somewhere within the section, and with
tensile strains on one side of the NA and compressive strains on the other side.
Under ultimate load conditions, i.e., at the limit state of collapse in flexure, the
strain in the highly compressed edge of the column is specified by the Code as εcu =
0.0035.
Fig. 2.13 Possible strain profiles under ultimate limit state in eccentric
compression

In the general case of uniaxial eccentric compression (Mu ≠ 0, Pu ≠ 0), it follows
that 0 ≤ e ≤ ∞, and for such a condition, the strain profile is non-uniform and
assumed to be linearly varying across the section, with the maximum strain in the
highly compressed edge, εcu, having a value between 0.002 and 0.0035 at the
ultimate limit state. This is depicted in the Figure 2.14.
The Code (Cl. 39.1) permits εcu = 0.0035 to be considered in cases where the
loading eccentricity (i.e., Mu/Pu) is sufficiently high as to induce some tensile strain
in the column section, i.e., xu ≤ D. the limiting condition for this occurs when the
resulting neutral axis coincides with the edge farthest removed from the highly
compressed edge, i.e., xu = D, corresponding to which e = exu = D ≡ eD, as indicated
in Figure 2.13.
When the loading eccentricity is relatively low, such that the entire section is
subjected to (non-uniform) compression and the NA lies outside the section (xu>
D), the Code (Cl. 39.1b) limits the strain in the highly compressed edge to a value
between 0.002 and 0.0035 as follows:
εcu = 0.0035 – 0.75 εc, min for xu ≥ D
Where εc,min is the strain in the least compression edge, as shown Fig. 2.13. It can
be seen that the above satisfies the limiting strain conditions εcu = 0.0035
(corresponding to εc, min = 0; i.e., xu = D or e = ed) and εcu = 0.002 (corresponding to
εc, min = 0.002; i.e., xu = ∞ or e = 0). The point of intersection of these two limiting
strain profiles (corresponding to e = 0 and e = eD) occurs at a distance of 3D/7 from
the ‘highly compressed edge’, and in fact5, this point acts like a ‘pivot’ for strain
profiles when xu ≥ D. it serves as a common point through which all strain profiles
(with xu ≥ D) pass, as indicated in Fig. 2.13.
Modes of Failure in Eccentric Compression:
The mode of failure depends on the eccentricity of loading; i.e., the
relative magnitudes of Pu and Mu. If the eccentricity e = Mu/Pu is relatively small,
the axial compression behavior predominates, and the consequent failure, is
termed compression failure. On the other hand, if the eccentricity is relatively
large, the flexure behavior predominates, and the consequent failure is termed
tension failure. In fact, depending on the exact magnitude of the loading
eccentricity e, it is possible to predict whether a ‘compression failure’ or ‘tension
failure’ will take place.
Balanced Failure: In between ‘compression failure’ and ‘tension failure’, there
exists a critical failure condition, termed ‘balanced failure’. This failure condition
refers to that ultimate limit state wherein the yielding of the outermost row of
longitudinal steel on the tension side and the attainment of the maximum
compressive strain in concrete εcu = 0.0035 at the highly compressed edge of the

column occur simultaneously. In other words, both crushing of concrete (in the
highly compressed edge) and yielding of steel (in the outermost tension steel)
occur simultaneously.
Compression Failure: When the loading eccentricity is less than that
corresponding to the ‘balanced failure’ condition, i.e., when e <eb, ‘yielding’ of
longitudinal steel in tension does not take place, and failure occurs at the ultimate
limit state by crushing of concrete at the highly compressed edge. The
compression reinforcement may or may not yield, depending on the grade of steel
and its proximity to the highly compressed edge.
Tension Failure: When the loading eccentricity is greater than that
corresponding to the ‘balanced failure’ condition, i.e., when e >eb, failure will be
initiated by the yielding of the tension steel. The outermost longitudinal bars in
the tension side of the neutral axis first undergo yielding and successive inner
rows (if provided), on the tension side of the neutral axis, may also yield in
tension with increasing strain. Eventually, collapse occurs when the concrete at
the highly compressed edge gets crushed.
Salient Points on the Interaction Curves:
The salient points, marked 1 to 5 on the interaction curve (Fig. 2.14) correspond
to the failure strain profiles, marked 1 to 5 in Fig. 2.14:
a) The point 1 in Fig. 2.14 corresponds to the condition of axial loading with
e = 0. For this case of ‘pure’ axial compression, Mur = 0 and Pur is denoted
as Pu0
b) The point 1’ in Fig. 2.14 corresponds to the condition of axial loading
with the mandatory minimum eccentricity emin [prescribed by the Code
(Cl. 25.4 and 39.3)]. The corresponding ultimate resistance is
approximately given by Pu0
c) The point 3 Fig. 2.14 corresponds to the condition xu = D, i.e., e = eD, the
entire section is under compression and the neutral axis is located outside
the section (xu > D), with 0.002 < εcu< 0.0035. For e > eD, the NA is
located within the section (xu< D) and εcu = 0.00035 at the ‘highly
compressed edge’.
Point 2 represents a genera case, with the neutral axis outside the section
(e < eD).
d) The point 4 in Fig. 2.14 corresponds to the balanced failure condition,
with e = eb and xu = xu, b. The design strength values for this ‘balanced
failure’ condition are denoted as Pub and Mub. For Pur< Pub (i.e., e >eb), the
mode of failure is called tension failure. It may be noted that Mub is close
to the maximum value of ultimate moment of resistance that the given
section is capable of, and this value is higher than the ultimate moment
resisting capacity Mu0 under ‘pure’ flexure conditions.

e) The point 5 in Fig. 2.14 corresponds to a ‘pure’ bending condition (e = ∞,
Pur = 0); the resulting ultimate moment of resistance is denoted Mu0 and
the corresponding NA depth takes on a minimum value xu,min.

2.4 LIMIT STATE THEORY AND DESIGN OF REINFORCED
CONCRETE
AUTHORS: Dr. S. R. Karve
B. E. (Civil), M. E. (Structures), Ph.D., M.I.E.
Formerly at Department of Applied Mechanics
College of Engineering, Pune
Dr. V. L. Shah
B.E. (Civil), M.E. (Structures), Ph.D., M.I.E
Formerly Professor and Head of Applied Mechanics Department
B.V. Engineering College, Pune
PUBLICATION: Structures Publishers, Jal-Tarang, Pune
2.4.1 Abstraction:
This book is an explanatory textbook for proper understanding of the new philosophy
of design. It provides a clear apprehension about the analysis and design of reinforced
concrete structures. This textbook deals with limit state theory and design of
reinforced concrete structures.
2.4.2 Overview:
2.4.2.1 Features
This book broadly covers the following topics:
a) Limit State Theory
b) Material Properties
c) Limit Analysis of R. C. Structures
d) Limit State of Collapse – Flexure, Shear, Bond and Torsion
e) Limit State of Servicebility
f) Limit State of Collapse – Axial Compression and Bending
g) Design of Slabs
2.4.2.2 Inference
This book emphasis on the behaviour of columns subjected to axial compression
and uniaxial bending. The behaviour of column depends upon the amount of
eccentricity or the magnitutde of bending moment in relation to the axial load.
The load on column is rarely axial. There is always some minimum inherent
eccentricity on account of nonhomogeneity in loading and construction, lateral
deflection of column etc. Besides, many times, column is subjected to end
moments on account of monolithic connections of beams and columns. In such
case, the column is subjected to combined action of axial load Pu and bending

moment Mu. This loading system can be reduced to a single resultant load Pu
acting at an eccentricity e = Mu/Pu.
This book provides the methods for analysis and design of columns under axial
compression and uniaxial bending: Trial and Error method and Design Aids
Method.
TRIAL AND ERROR METHOD:
The design of column section for axial load and uni-axial moment can be made by
preassigning the section and then checking its adequacy. The adequacy of the
section may be checked by assuming the position of neutral axis. Then the strain
profile can be established based on the failure criteria of column section and the
corresponding stress profiles for concrete and steel can be determined from their
stress-strain curves. The axial force and moment capacity of section can be
computed which should satisfy the requirement that the internal axial force is
acting at the same eccentricity at that of the external load. If it is not satisfied,
then the assumed position of neutral axis is not correct and it is altered and the
method is repeated till the resultant internal force act at the same eccentricity as
that of the external load. The section is considered safe if the external load is
within its ultimate load capacity.
Procedure of analysis:
The values of Pu and Mu depends on xu and ku, which are unknown in the
beginning, the analysis procedure is always, therefore, of trial and error. Now
since, the equations for neutral axis lying outside the section ( xu> D or ku> 1) are
different from those for neutral axis lying inside the section( xu< D or ku< 1), one
does not know in the beginning from which equations one should start with. For
this, the following procedure may prove to be useful:
a) Assume xu = D (i.e., ku = 1) or N.A. lying on the edge opposite to the load.
b) Obtain Pu1 and Mu1using equations:
a. Pu1 = 0.36 kufckbD + ∑ Asi (fsi - fci)
b. Mu1 = 0.36kufckbD2 (0.5 – 0.416ku) + ∑ Asi(fsi – fci)xi
c) Compare Pu1 with given Pu when Pu is given.
a. If given Pu<Pu1, actual xu < D
b. If given Pu>Pu1, actual xu > D
Or compare Mu1with given Mu when Mu is given,
a. If given Mu<Mu1, actual xu > D
b. If given Mu>Mu1, actual xu < D
d) Carry out the second trial with revised value of xu judging the difference
between given Pu and Pu1 or that between given Mu and Mu1. Obtain now
Pu2and Mu2 using appropriate equations.
e) Compare the values Pu2 or Mu2 of the second trial with the corresponding
given values. If the given values tallies with the calculated value, it

indicates that this trial gives correct position of neutral axis and the values
of Pu and Mu corresponding to this value of xu gives the correct the Pu –
Mu combination. Having known the correct combination, required Mu
corresponding to given Pu or required Pu corresponding to given Mu is
obtained.
Analysis of a given section from first principles is very laborious and time
consuming.
DESIGN AIDS METHOD:
The analysis of eccentrically loaded columns from basic principle is laborious and
time consuming. Therefore, Design Aids, in the form of charts and tables, are
prepared for practical design. The charts consist of interaction diagrams for Pu
and Mu in non-dimensional form.
a) Procedure for Analysis of column:
Given: Size of the column, Area and arrangement of reinforcement, grade of
concrete and steel, length of column and end condition, Pu.
Requirement: Mu
STEPS:
1. Calculate d’/D taking appropriate axis of bending. D is the dimension
perpendicular to the axis of bending.
2. Calculate p/fck.
3. Calculate Pu/fckbD for rectangular section and Pu/fckD2 for circular section.
4. Select chart appropriate to the shape of section, grade of steel, position of
reinforcement and the nearest value of d’/D.
5. Select the appropriate curve referring the p/fck value.
6. Obtain the point of intersection of a horizontal line corresponding to
calculated value of Pu/fckbD and the curve for the calculated value of p/fck.
Note: if a curve for given p/fck is not available, it will be interpolated between
the two adjacent curves taking it nearly parallel to them by visual inspection.
7. Having located the point of intersection, its coordinate on x-axis gives
Mu/fckbD2 from which Mu can be calculated.
b) Procedure for Design of column:
Given: size of column, grade of concrete and steel, factored load and moment
Requirement: Area of reinforcement
STEPS:

1. Calculate cover as per IS 456:2000 requirement to the center of main steel
i.e.,
d’ = Nominal cover + diameter of stirrup + ½ dia of main reinforcement
2. Find d’/D ratio.
3. Calculate, Pu/fckbD and Mu/fckbD2
4. Use appropriate chart from design aids appropriate to the shape of section,
grade of steel, position of reinforcement and the nearest value of d’/D.
5. Find value of p/fck
6. Calculate the percentage of reinforcement
p = (p/fck) × fck
Area of reinforcement, As = b × D × p/100
The basic parameters for charts are as follows:
a) Shape of section
b) Arrangement of reinforcement
c) Grade of steel
d) Ratio of d’/D.

CHAPTER 3
DEVELOPMENT OF THE SYSTEM
3.1 Methodology:
This section addresses the progress plan of this project. For the construction of
interaction diagrams, it is mandatory to understand the procedure to be followed.
The analysis of few selected sections (rectangular and circular section) of column
was done following the said procedure. The validation of the procedure was done
by co-relating the results of the analysis with the existing interaction diagrams
provided in Design Aids SP-16. The validated procedure was used as a base for
making the Algorithm (Flowchart), which was then used to write the computer
programs using MATLAB software.
3.1.1 Block diagram:
START
UNDERSTANDING THE PROCEURE TO BE FOLLOWED TO GENERATE INTERACTION CURVES
VALIDATION OF THE PROCEDURE BY MATCHING THE RESULTS WITH THE EXISTING INTERACTION
CURVES
MAKING ALGORITHM(FLOW CHART)
WRITING PROGRAM IN MATLAB
DEBUGGING THE MATLAB PROGRAM
VALIDATION OF THE MATLAB PROGRAM USING EXISTING INTERACTION CURVES
STOP

3.2 Concept:
The design of columns is complex since it is subjected to axial load and moments
which may vary independently. Its design requires determination of the cross-
sectional dimensions, the area of longitudinal steel and its distribution and
transverse steel. The cross-sectional dimensions and area of longitudinal steel and
its distribution are governed by the axial load and moments acting on the section.
The maximum axial load and moments acting along the length of the column are
considered for the design of the design of the column section either by the
working stress method or by the limit state method
The transverse reinforcement is provided to impart effective lateral
support against buckling to every longitudinal bar. It is either in the form of
circular rings or polygonal links (lateral ties) with internal angles not exceeding
135º. Its design considerations are semi-empirical in nature and are as important
as the theoretical considerations for determining column section and longitudinal
reinforcement.
The working stress method of design column is based on the behaviour of
the structure at working load ensuring that the stresses in concrete and steel do
not exceed their allowable values. It is assumed to possess adequate safety against
collapse. The limit state method of design of column is based on the behaviour of
structure at collapse ensuring adequate margin of safety. The serviceability limits
of deflections and cracks are assumed to be satisfied as the column being
primarily a compression member has very small deflection and cracks.
The working stress method of design is not covered in this section, not
only because of the fact that it has become obsolete, but also because the Code
(Cl. B 4.3) makes it mandatory that designs for eccentric compression by WSM,
based on ‘cracked section’ analysis should be further checked for their strength
under ultimate load conditions to ensure the desired margin of safety. This
condition effectively makes WSM redundant, as it suffices to design in
accordance with LSM.
The behaviour and strength of a R. C. member under axial compression at
collapse is based on the basic assumptions made in the limit state design method.
These assumptions are already stated under Section 2.2.2.2.
The design of columns subjected to concentric axial load and uniaxial
moment or axial load and biaxial moments are described below:
3.2.1 Sections subjected to concentric axial load:
Ultimate load capacity of column with lateral ties is attained when it develops a
limiting strain of 0.002 resulting in the uniform stress of 0.446 fck in concrete. The
stresses induced in mild and high strength deformed bars corresponding to strain
of 0.002 are 0.87 fy and 0.75 fy respectively.

Therefore, the ultimate concentric load capacity is determined as follows.
Puz = 0.446 fck Ac + 0.87 fy As for mild steel
= 0.446 fck Ac + 0.75 fy As for high strength deformed bars
Where Ac = the area of concrete
As = the area of steel
It is very rare that the column is subjected to truly concentric load. Therefore, all
compression members are designed for a minimum eccentricity of load in two
principal directional.
𝑒𝑚𝑖𝑛 = 𝑢𝑛𝑠𝑢𝑝𝑝𝑜𝑟𝑡𝑒𝑑 𝑙𝑒𝑛𝑔𝑡ℎ 𝑜𝑓 𝑐𝑜𝑙𝑢𝑚𝑛
500+
𝑙𝑎𝑡𝑒𝑟𝑎𝑙 𝑑𝑖𝑚𝑒𝑛𝑠𝑖𝑜𝑛
30
≥ 20 mm
where the unsupported length of a compression member shall be taken as
the clear distance between the end restraints.
When the minimum eccentricity does not exceed 0.05 times the lateral
dimension, the axial load carrying capacity is reduced by 11%. Then the axial
load capacity is given by the following equations.
Pu = 0.4 fck Ac + 0.77 fy As for mild steel
= 0.4 fck Ac + 0.67 fy As for high strength deformed bars
The ultimate load-carrying capacity of columns having longitudinal bars
tied with spirals can be taken as 1.05 times the ultimate load for similar members
with lateral ties, provided the ratio of volume of helical reinforcement to the
volume of core is not less than 0.36 (Ag /Ac – 1.0) fck /fy where,
Ag = the gross area of section
Ac = the area of the core of the helically reinforced column measured to
the outside diameter of the helix
fck = the characteristic compressive strength of concrete
fy = the characteristic strength of the helical reinforcement but not
exceeding 415 N/mm2
3.2.1 Section subjected to combined axial load and uniaxial moment:
The design of column section for axial load and uni-axial moment can be made
by preassigning the section and then checking its adequacy as stated in section
2.4.2.2 under Trial and Error method.

The computation of axial load and moment capacity of the section for an
assumed position of neutral axis can be made by establish the strain profile based
on the failure criteria of column section. Figure 3.1 (a) and (b) shows the position
of neutral axis outside and within the section and the corresponding strain profiles
respectively. The stress diagrams for concrete and steel can be determined from
their design stress-strain curves as shown in the figure.
Fig. 3.1 Section under combined axial load and uni-axial moment
For neutral axis lying outside the section (Fig. 3.1 (a)), the axial load
capacity can be determined as follows.
Pu = Cc + Cs
The moment capacity of the section can be determined by taking the
moment of forces about the centre of the section as follows.
Mu = Cc (0.5D – yc) + ∑ Csi ysi
where Cc = compressive force in concrete
= 0.446𝑓𝑐𝑘 𝐵𝐷 − 𝑔
3 ×
4
7𝐵𝐷 = 0.446𝑓𝑐𝑘𝐵𝐷 −
4
21𝑔 𝐵𝐷

g = difference between the stress at the highly compressed edge
and the stress at the least compressed edge
= 0.446𝑓𝑐𝑘 (4𝐷/7
𝑘𝐷 − 3𝐷/7)
2
= 0.446𝑓𝑐𝑘 (4
7𝑘 − 3)
2
∴ 𝐶𝑐 = 0.466𝑓𝑐𝑘𝐵𝐷 (1 −4
21× (
4
7𝑘−3)
2
)
= 𝐶𝑐′ 𝑓𝑐𝑘𝐵𝐷
𝐶𝑐, = 0.466 (1 −
4
21× (
4
7𝑘−3)
2
)
Cs = compressive force in steel
= ∑ 𝐴𝑠𝑖 (𝑓𝑠𝑐𝑖 − 𝑓𝑐𝑐𝑖)
fsci = stress in reinforcement i
fcci = stress in concrete at the level of reinforcement i
Asi = area of reinforcement i
yc = distance of centroid of compressive force in concrete from the
most compressed edge of the section
=
moment of the conpressive force in concrete from the most compressed edge
compressive force in concrete
=0.446𝑓𝑐𝑘𝐵𝐷 × 0.5𝐷 −
4
21𝑔𝐷 (
3
7𝐷 +
3
4×
4
7𝐷)
0.446𝑓𝑐𝑘𝐵𝐷 − 4𝑔𝐵𝐷/21
=0.223𝑓𝑐𝑘𝐵𝐷 × 0.5𝐷 −
4
21𝒈𝐵𝐷2/49
0.446𝑓𝑐𝑘𝐵𝐷 − 4𝑔𝐵𝐷/21= 𝑦′𝑐𝐷
𝑦′𝑐 =0.223𝑓𝑐𝑘 − 8𝑔/49
0.446𝑓𝑐𝑘 − 4𝑔/21
ysi = distance of reinforcement i from the x-x axis
∴ 𝑃𝑢 = 𝐶′𝑐𝑓𝑐𝑘𝐵𝐷 + ∑ 𝐴𝑠𝑖(𝑓𝑠𝑐𝑖 − 𝑓𝑐𝑐𝑖)
and 𝑀𝑢 = 𝐶′𝑐𝑓𝑐𝑘𝐵𝐷(0.5𝐷 − 𝑦′
𝑐𝐷) + ∑ 𝐴𝑠𝑖(𝑓𝑠𝑐𝑖 − 𝑓𝑐𝑐𝑖)𝑦𝑠𝑖

The values of coefficients 𝐶′𝑐 and 𝑦′𝑐 for different values of k has been given in
Table 3.1
𝒌 = 𝒙𝒖/𝑫 𝑪𝒐𝒆𝒇𝒇𝒊𝒄𝒊𝒆𝒏𝒕
𝑪′𝒄 = 𝑪𝒄/𝒇𝒄𝒌𝑩𝑫
𝑪𝒐𝒆𝒇𝒇𝒊𝒄𝒊𝒆𝒏𝒕
𝒚′𝒄 = 𝒚𝒄/𝑫
1.0 0.361 0.416
1.05 0.374 0.432
1.1 0.384 0.443
1.2 0.399 0.458
1.3 0.409 0.468
1.4 0.417 0.475
1.5 0.422 0.480
2.0 0.435 0.491
2.5 0.440 0.495
3.0 0.442 0.497
4.0 0.444 0.499
Table 3.1 Coefficient 𝐶′𝑐 and 𝑦′𝑐 when the Neutral axis lies outside the section
For neutral axis lying within the section (Fig. 3.1 (b)), the axis load
capacity be determined as follows:
𝑃𝑢 = 𝐶𝑐 + 𝐶𝑠 − 𝑇𝑠
The moment capacity of the section can be determined by taking the
moment of forces about the centre of the section as follows:
𝑀𝑢 = 𝐶𝑐(0.5𝐷 − 𝑦𝑐) + ∑ 𝐶𝑠𝑖𝑦𝑠𝑐𝑖 + ∑ 𝑇𝑠𝑖𝑦𝑠𝑡𝑖
= 0.446𝑓𝑐𝑘𝐵𝑥𝑢(0.5𝐷 − 𝑦𝑐) + ∑ 𝐴𝑠𝑐𝑖(𝑓𝑠𝑐𝑖 − 𝑓𝑐𝑐𝑖)𝑦𝑠𝑐𝑖 + ∑ 𝐴𝑠𝑡𝑖𝑓𝑠𝑡𝑖𝑦𝑠𝑡𝑖
where 𝐶𝑐 = compressive force in concrete
= 0.446𝑓𝑐𝑘𝐵𝑥𝑢
𝐶𝑠 = compressive force in compression steel i
= ∑ 𝐴𝑠𝑐𝑖(𝑓𝑠𝑐𝑖 − 𝑓𝑐𝑐𝑖)
𝐴𝑠𝑐𝑖 = area of compression reinforcement i
𝑓𝑠𝑐𝑖 = stress in compression reinforcement i
𝑓𝑐𝑐𝑖 = stress in concrete at the level of compression reinforcement i
𝑇𝑠 = tensile force in tension reinforcement i
= ∑ 𝐴𝑠𝑡𝑖𝑓𝑠𝑡𝑖
𝐴𝑠𝑡𝑖 = area of tension reinforcement i

𝑓𝑠𝑡𝑖 = stress in tension reinforcement i
𝑦𝑐 = distance of centroid of compressive force in concrete from the
most compressed edge of the section
= 0.416𝑥𝑢
𝑦𝑠𝑐𝑖 = distance of compression reinforcement i from the centre of the section
𝑦𝑠𝑡𝑖 = distance of tension reinforcement i from the centre of the section
∴ 𝑃𝑢 = 0.36𝑓𝑐𝑘𝐵𝑥𝑢 + ∑ 𝐴𝑠𝑐𝑖(𝑓𝑠𝑐𝑖 − 𝑓𝑐𝑐𝑖) − ∑ 𝐴𝑠𝑡𝑖𝑓𝑠𝑡𝑖
and 𝑀𝑢 = 0.36𝑓𝑐𝑘𝐵𝑥𝑢(0.5𝐷 − 0.416𝑥𝑢) + ∑ 𝐴𝑠𝑐𝑖(𝑓𝑠𝑐𝑖 − 𝑓𝑐𝑐𝑖)𝑦𝑠𝑐𝑖 −
∑ 𝐴𝑠𝑡𝑖𝑓𝑠𝑡𝑖 𝑦𝑠𝑡𝑖
3.3 Construction of Interaction Diagrams:
Design charts for combined axial compression and bending are given in the form of
interaction diagrams in which curves for 𝑃𝑢/𝑏𝐷𝑓𝑐𝑘 versus 𝑀𝑢/𝑏𝐷2𝑓𝑐𝑘 are plotted for
different values of 𝑝 𝑓𝑐𝑘⁄ , where 𝑝 is the reinforcement percentage.
When bending moments are acting in addition to axial load, the points for plotting
the Charts are obtained by assuming different positions of neutral axis. For each
position of neutral axis, the strain and stress distribution is determined. The stresses
in the reinforcement are calculated from the known strains. Thereafter the resultant
axial force and the moment about the centroid of the section are calculated as
follows.
Generalized expressions for the resultant axial force 𝑃𝑢 and the moment 𝑀𝑢:
𝑃𝑢 = 𝐶′𝑐𝑓𝑐𝑘𝐵𝐷 + ∑ 𝐴𝑠𝑖(𝑓𝑠𝑐𝑖 − 𝑓𝑐𝑐𝑖) eq. 3.1
𝑀𝑢 = 𝐶′𝑐𝑓𝑐𝑘𝐵𝐷(0.5𝐷 − �̅�) + ∑ 𝐴𝑠𝑖(𝑓𝑠𝑐𝑖 − 𝑓𝑐𝑐𝑖)𝑦𝑠𝑖 eq. 3.2
where 𝐶′𝑐 ≡ stress block area factor
�̅� ≡ distance between highly compressed edge and the line of
action of 𝐶𝑐 (i.e., centroid of stress block area)
𝑎 = {0.362 𝑥𝑢 𝐷⁄ 𝑓𝑜𝑟 𝑥𝑢 ≤ 𝐷
0.447(1 − 4𝑔 21) 𝑓𝑜𝑟 𝑥𝑢 > 𝐷⁄ } eq.3.3
�̅� = {0.416𝑥𝑢 𝑓𝑜𝑟 𝑥𝑢 ≤ 𝐷(0.5 − 8𝑔 49⁄ ){𝐷 (1 − 4𝑔 21⁄ )⁄ } 𝑓𝑜𝑟 𝑥𝑢 > 𝐷
} eq. 3.4
𝑔 =16
(7𝑥𝑢 𝐷 − 3)⁄ 2

𝑓𝑐𝑐𝑖 = {
0 𝑖𝑓𝜀𝑠𝑖 ≤ 00.447𝑓𝑐𝑘 𝑖𝑓 𝜀𝑠𝑖 ≥ 0.002
0.447𝑓𝑐𝑘[2(𝜀𝑠𝑖 0.002⁄ ) − (𝜀𝑠𝑖 0.002⁄ )2] 𝑜𝑡ℎ𝑒𝑟𝑤𝑖𝑠𝑒 } eq. 3.5
𝜀𝑠𝑖 = {0.0035 [
𝑥𝑢−𝐷 2⁄ +𝑦𝑖
𝑥𝑢] 𝑓𝑜𝑟 𝑥𝑢 ≤ 𝐷
0.002 [1 +𝑦𝑖−𝐷 14⁄
𝑥𝑢−3𝐷 7⁄] 𝑓𝑜𝑟 𝑥𝑢 > 𝐷
} eq. 3.6
where
𝐴𝑠𝑖 ≡ area of steel in ith row(of n rows) [refer Fig. 3.1]
𝑦𝑠𝑖 ≡ distance of ith row of steel from the centroidal axis, measured
positive in the direction towards the highly compressed edge
𝑓𝑠𝑐𝑖 ≡ design stress in the ith row(corresponding to the strain 𝜀𝑠𝑖)
obtainable from design stress strain curves for steel (Fig. 2.11)
𝜀𝑠𝑖 ≡ strain in the ith row, obtainable from strain compatibility
conditions(𝜀𝑠𝑖and 𝑓𝑠𝑐𝑖 are assumed to be positive if
compressive, negative if tensile)
𝑓𝑐𝑐𝑖 ≡ design compressive stress level in concrete, corresponding to
the strain 𝜀𝑐𝑖 = 𝜀𝑠𝑖 adjoining the ith row of steel, obtainable
from the design stress-strain curve for concrete (Fig. 2.9)
[Note: 𝑓𝑐𝑐𝑖 = 0 if strain is tensile]
3.3.1 Block diagram:
Assume k (position of N.A.)
Determine Strain distribution (eq. 3.6)
Determine Stress distribution (for concrete use eq. 3.5 and for steel use stress strain curve (refer fig. 2.11))
Determine stresses in each row of reinforcement corresponding the strain(use stress strain curve (refer fig. 2.11))
Calculate the resultant axial force (Pu) and moment capacity (Mu) (use eq. 3.1 and eq.3.2)
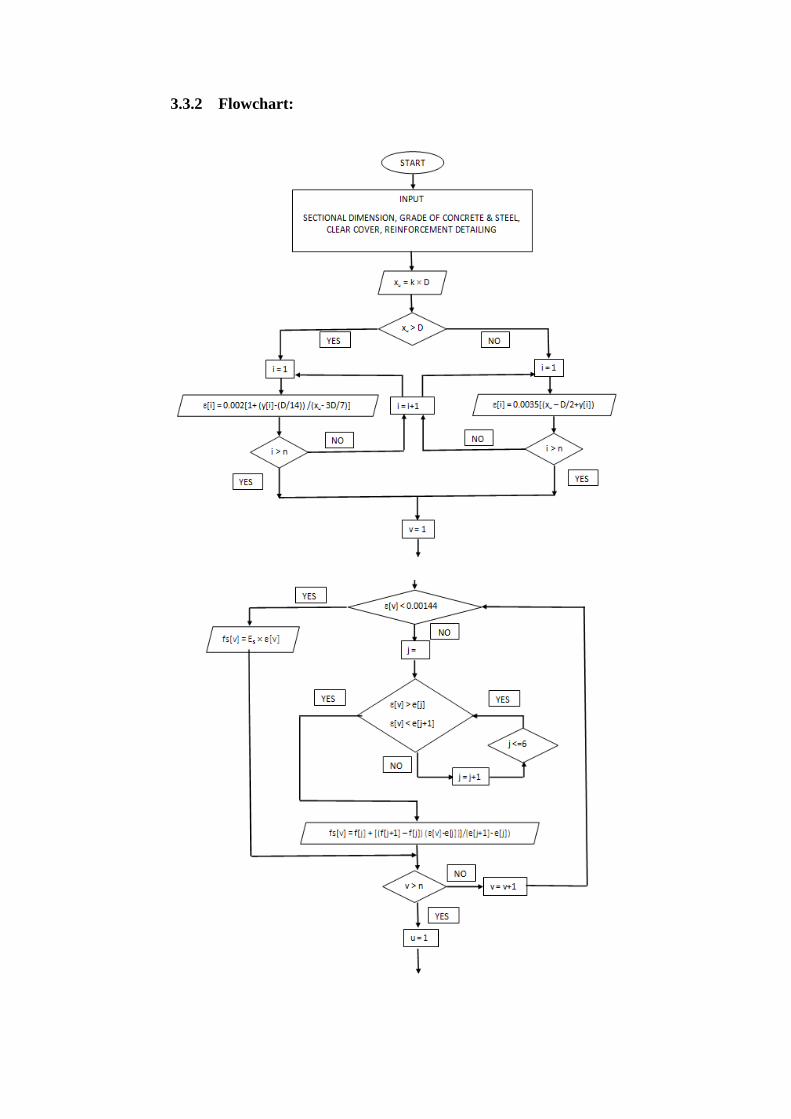
3.3.2 Flowchart:


3.3.3 MATLAB Program
Based on the above flowchart, a computer program was developed for drawing
interaction diagrams by MATLAB software. Following are the programs written
in m-script of MATLAB software:
(a) For rectangular section of column:
D=input('Enter the depth of the section: ');
fck=input('Enter the strength of concrete: ');
fy=input('Enter the strength of steel: ');
k=[10 5.5 5 4.5 4 3.5 3 2.5 2 1.5 1.4 1.3 1.2 1.1 1.05 1 0.9 0.8 0.7 0.6 0.55 0.5
0.475 0.45 0.4 0.35 0.3 0.25 0.2 0.15 0.1 0.05 0.025 0];
Es=200000;
cv=input('Enter the clear cover: ');
str=input('Enter the dia of the stirrup: ');
e1=[0.00144 0.00163 0.00192 0.00241 0.00276 0.0038];%Fe415
f1=[288.7 306.7 324.8 342.8 351.8 360.9];
e2=[0.00174 0.00195 0.00226 0.00277 0.00312 0.00417];%Fe500
f2=[347.8 369.6 391.3 413.0 423.9 434.8];
n=input('Enter the no: of rows of reinforcement: ');
m=input('Enter the array of no: of rods in each row: ');
d=input('Enter the dia of steel: ');
N=input('Enter the no: of strips: ');
B=input('Enter the p/fck value: ');
dr = cv+ str + d/2; %d'
i=1;
y=zeros(1);
Dr=(D - 2*dr);
Dr1=Dr/(n-1);
while(i<=n)

y(i)= (-Dr/2)+(i-1)*Dr1;
i=i+1;
end
if(fy==415)
e=e1;
f=f1;
ey1=0.00380525;
ey2=0.00144;
elseif(fy==500)
e=e2;
f=f2;
ey1=0.004175;
ey2=0.00174;
end
Pu=zeros(1);
Mu=zeros(1);
Cs=zeros(1);
P=zeros(1);
Ms=zeros(1);
xu=zeros(1);
Cc=zeros(1);
Mc=zeros(1);
M=zeros(1);
h=1;
while(h<=34)
xu(h)=k(h)*D;
dc=D/N;
i=1;
Ns=0;%no. of bars in the cs
while(i<=n)
Ns=Ns+m(i);
i=i+1;
end
if(B==0)
b=D*(2/3);
else
b=((pi/4)*(d^2)*Ns*100)/(D*B*fck);
end
if(xu(h)>D)%strain
E=zeros(1);
i=1;
while(i<=n)
E(i)=0.002*(1+(y(i)-(D/14))/(xu(h)-(3*D/7)));
i=i+1;
end
else
E=zeros(1);
i=1;
while(i<=n)
E(i)=0.0035*((xu(h)-(D/2)+y(i))/xu(h));

i=i+1;
end
end
fs=zeros(1);%stress in steel
if(fy==250)
E1=(0.87*fy)/Es;
i=1;
while(i<=n)
if(E(i)<=(-(E1)))
fs(i)= (-1)* 0.87*fy;
elseif(E(i)<E1)
if(E(i)>(-(E1)))
fs(i)= E(i)*Es;
end
else
fs(i)=0.87*fy;
end
i=i+1;
end
else
i=1;
while(i<=n)
if (E(i) <= (-ey1))
fs(i)= -1* 0.87* fy;
elseif(E(i)<=(-ey2))
if(E(i)>(-ey1))
j=1;
while(j<=6)
if(E(i)<(-e(j)))
if(E(i)>(-e(j+1)))
fs(i)=(-f(j))+(((-f(j+1)+f(j))*(E(i)+e(j)))/(-e(j+1)+e(j)));
end
end
j=j+1;
end
end
elseif(E(i)>=ey2)
if(E(i)<ey1)
j=1;
while(j<=6)
if(E(i)>e(j))
if(E(i)<e(j+1))
fs(i)=f(j)+(((f(j+1)-f(j))*(E(i)-e(j)))/(e(j+1)-e(j)));
end
end
j=j+1;
end
end
elseif(E(i)> (-ey2))
if (E(i)<ey2)

fs(i)= Es*E(i);
end
else
fs(i)= 0.87*fy;
end
i=i+1;
end
end
fc=zeros(1);%stress in concrete
i=1;
while(i<=n)
if(E(i)<=0)
fc(i)=0;
elseif(E(i)>=0.002)
fc(i)=0.446*fck;
else
fc(i)=0.446*fck*(2*(E(i)/0.002)-((E(i)/0.002)^2));
end
i=i+1;
end
X=zeros(1);
i=1;
while(i<=(N+1))
if(i==1)
X(i)=D/2;
else
X(i)=(D/2)-(dc*(i-1));
end
i=i+1;
end
if(xu(h)>D)%strain
E1=zeros(1);
i=1;
while(i<=(N+1))
E1(i)=0.002*(1+(X(i)-(D/14))/(xu(h)-(3*D/7)));
i=i+1;
end
else
E1=zeros(1);
i=1;
while(i<=(N+1))
E1(i)=0.0035*((xu(h)-(D/2)+X(i))/xu(h));
i=i+1;
end
end
Fc=zeros(1);
i=1;
while(i<=(N+1))
if(E1(i) <=0)
Fc(i)=0;

elseif(E1(i)>=0.002)
Fc(i)=0.446*fck;
else
Fc(i)=0.446*fck*(2*(E1(i)/0.002)-((E1(i)/0.002)^2));
end
i=i+1;
end
i=1;
Y=zeros(1);
while(i<=(N))
if(Fc(i)==0)
Y(i)=0;
else
Y(i)=(((2*Fc(i)+Fc(i+1))/(Fc(i)+Fc(i+1)))*(dc/3)+((i-1)*dc));
end
i=i+1;
end
i=1;
Fc1=zeros(1);
while(i<(N+1))
Fc1(i)=(Fc(i)+Fc(i+1))/2;
i=i+1;
end
i=1;
CcS=zeros(1);
McS=zeros(1);
while(i<=(N))
CcS(i)=Fc1(i)*b*dc;
McS(i)=CcS(i)*((D/2)-Y(i));
i=i+1;
end
i=1;
Cc(h)=0;
Mc(h)=0;
while(i<=(N))
Cc(h)=Cc(h)+CcS(i);
Mc(h)=Mc(h)+McS(i);
i=i+1;
end
i=1;
As=zeros(1);%Area of steel in each row
while(i<=n)
As(i)=m(i)*pi*(d^2)/4;
i=i+1;
end
i=1;
F=zeros(1);
Cs(h)=0;
while(i<=n)
F(i)=(fs(i)-fc(i))*As(i);

Cs(h)=Cs(h)+F(i);
i=i+1;
end
P(h)=Cc(h)+Cs(h);
i=1;
Mo=zeros(1);
Ms(h)=0;
while(i<=n)
Mo(i)=(fs(i)-fc(i))*y(i)*As(i);
Ms(h)=Ms(h)+Mo(i);
i=i+1;
end
M(h)=Mc(h)+Ms(h);
Pu(h)=P(h)/(fck*b*D);
Mu(h)=M(h)/(fck*b*D*D);
h=h+1;
end
plot(Mu,Pu)
(b) For circular section of column:
D=input('Enter the depth of the section: ');
fck=input('Enter the strength of concrete: ');
fy=input('Enter the strength of steel: ');
Es=200000;
k=[10 5.5 5 4.5 4 3.5 3 2.5 2 1.5 1.4 1.3 1.2 1.1 1.05 1 0.9 0.8 0.7 0.6 0.55 0.5
0.475 0.45 0.4 0.35 0.3 0.25 0.2 0.15 0.1 0.05 0.025 0];
cv=input('Enter the clear cover: ');
str=input('Enter the dia of the stirrup: ');
e1=[0.00144 0.00163 0.00192 0.00241 0.00276 0.0038];%Fe415
f1=[288.7 306.7 324.8 342.8 351.8 360.9];
e2=[0.00174 0.00195 0.00226 0.00277 0.00312 0.00417];%Fe500
f2=[347.8 369.6 391.3 413.0 423.9 434.8];
n=input('Enter the no: of rows of reinforcement: ');
m=input('Enter the array of no: of rods in each row: ');
d=input('Enter the dia of steel: ');
N=input('Enter the no: of strips: ');
B=input('Enter the value of p/fck: ');
dr = cv+ str + d/2; %d'
i=1;
y=zeros(1);
Dr=(D - 2*dr)/2;
Ns=0;%no. of bars in the cs
while(i<=n)
Ns=Ns+m(i);
i=i+1;
end
Q=(2/Ns);
i=1;

while(i<=n)
y(i)= -1 *Dr*cos((i-1)*Q*pi);
i=i+1;
end
if(fy==415)
e=e1;
f=f1;
ey1=0.00380525;
ey2=0.00144;
elseif(fy==500)
e=e2;
f=f2;
ey1=0.004175;
ey2=0.00174;
end
Pu=zeros(1);
Mu=zeros(1);
Cs=zeros(1);
P=zeros(1);
Ms=zeros(1);
xu=zeros(1);
Cc=zeros(1);
Mc=zeros(1);
M=zeros(1);
h=1;
while(h<=34)
xu(h)=k(h)*D;
dc=D/N;
if(xu(h)>D)%strain
E=zeros(1);
i=1;
while(i<=n)
E(i)=0.002*(1+(y(i)-(D/14))/(xu(h)-(3*D/7)));
i=i+1;
end
else
E=zeros(1);
i=1;
while(i<=n)
E(i)=0.0035*((xu(h)-(D/2)+y(i))/xu(h));
i=i+1;
end
end
fs=zeros(1);%stress in steel
if(fy==250)
E1=(0.87*fy)/Es;
i=1;
while(i<=n)
if(E(i)<=(-(E1)))
fs(i)= (-1)* 0.87*fy;

elseif(E(i)<E1)
if(E(i)>(-(E1)))
fs(i)= E(i)*Es;
end
else
fs(i)=0.87*fy;
end
i=i+1;
end
else
i=1;
while(i<=n)
if (E(i) <=(-ey1))
fs(i)= -1* 0.87* fy;
elseif(E(i)<=(-ey2))
if(E(i)>(-ey1))
j=1;
while(j<=6)
if(E(i)<(-e(j)))
if(E(i)>(-e(j+1)))
fs(i)=(-f(j))+(((-f(j+1)+f(j))*(E(i)+e(j)))/(-e(j+1)+e(j)));
end
end
j=j+1;
end
end
elseif(E(i)>=ey2)
if(E(i)<ey1)
j=1;
while(j<=6)
if(E(i)>e(j))
if(E(i)<e(j+1))
fs(i)=f(j)+(((f(j+1)-f(j))*(E(i)-e(j)))/(e(j+1)-e(j)));
end
end
j=j+1;
end
end
elseif(E(i)> (-ey2))
if (E(i)<ey2)
fs(i)= Es*E(i);
end
else
fs(i)= 0.87*fy;
end
i=i+1;
end
end
fc=zeros(1);%stress in concrete
i=1;

while(i<=n)
if(E(i) <=0)
fc(i)=0;
elseif(E(i)>=0.002)
fc(i)=0.446*fck;
else
fc(i)=0.446*fck*(2*(E(i)/0.002)-((E(i)/0.002)^2));
end
i=i+1;
end
X=zeros(1);%distance of strip from centroid
i=1;
while(i<=(N+1))
if(i==1)
X(i)=D/2;
else
X(i)=(D/2)-(dc*(i-1));
end
i=i+1;
end
if(xu(h)>D)%strain
E1=zeros(1);%strain in each strip
i=1;
while(i<=(N+1))
E1(i)=0.002*(1+(X(i)-(D/14))/(xu(h)-(3*D/7)));
i=i+1;
end
else
E1=zeros(1);
i=1;
while(i<=(N+1))
E1(i)=0.0035*((xu(h)-(D/2)+X(i))/xu(h));
i=i+1;
end
end
Fc=zeros(1);%stress in each strip
i=1;
while(i<=(N+1))
if(E1(i) <=0)
Fc(i)=0;
elseif(E1(i)>=0.002)
Fc(i)=0.446*fck;
else
Fc(i)=0.446*fck*(2*(E1(i)/0.002)-((E1(i)/0.002)^2));
end
i=i+1;
end
i=1;
Y=zeros(1);%distance from cg of each strip to centroid of section
while(i<=(N))

if(Fc(i)==0)
Y(i)=0;
else
Y(i)=(((2*Fc(i)+Fc(i+1))/(Fc(i)+Fc(i+1)))*(dc/3)+((i-1)*dc));
end
i=i+1;
end
i=1;
Fc1=zeros(1);%stress at cg of each strip
while(i<(N+1))
Fc1(i)=(Fc(i)+Fc(i+1))/2;
i=i+1;
end
i=1;
b=zeros(1);
while(i<=N)
b(i)=2*((((D/2)^2)-((X(i))^2))^0.5);
i=i+1;
end
i=1;
CcS=zeros(1);
McS=zeros(1);
while(i<=(N))
CcS(i)=Fc1(i)*b(i)*dc;
McS(i)=CcS(i)*((D/2)-Y(i));
i=i+1;
end
i=1;
Cc(h)=0;
Mc(h)=0;
while(i<=(N))
Cc(h)=Cc(h)+CcS(i);
Mc(h)=Mc(h)+McS(i);
i=i+1;
end
i=1;
As=zeros(1);%Area of steel in each row
while(i<=n)
As(i)=m(i)*pi*(d^2)/4;
i=i+1;
end
i=1;
F=zeros(1);
Cs(h)=0;
while(i<=n)
F(i)=(fs(i)-fc(i))*As(i);
Cs(h)=Cs(h)+F(i);
i=i+1;
end
P(h)=Cc(h)+Cs(h);

i=1;
Mo=zeros(1);
Ms(h)=0;
while(i<=n)
Mo(i)=(fs(i)-fc(i))*y(i)*As(i);
Ms(h)=Ms(h)+Mo(i);
i=i+1;
end
M(h)=Mc(h)+Ms(h);
Pu(h)=P(h)/(fck*D*D);
Mu(h)=M(h)/(fck*D*D*D);
h=h+1;
end
plot(Mu,Pu)