report
TRANSCRIPT

A PROJECT REPORT
ON
“WORKING CAPITAL MANAGEMENT”
@
Lamiya Silks, Thrissur, Kerala
Submitted to
Indian Institute of Planning and Management (IIPM),
New Delhi
By
JIBIN BABU
SS 11 / 13
ID- D1113SSIBSEPGP10207 (COC – 5 – CA – 1050)
in partial fulfillment of the requirement for the award of the degree of MASTER OF BUSINESS ADMINISTRATION
10th April 2012– 25th May 2012
Phone- 8860598398 Email- [email protected]
Page 1 of 72

Acknowledgement
It is a matter of great satisfaction and pleasure to present this report on Working Capital
Management of Lamiya Silks. I take this opportunity to owe my thanks to all those involved in
my training.
Firstly I would like to thank LAMIYA SILKS for giving the opportunity to complete my project
in the organization. I put on record my sincere thanks to my college, Indian Institute of
Planning and Management (IIPM), New Delhi, for giving me such an opportunity. I am
extremely grateful to Mr. Mohammed Rashin for the encouragement, discussions and critical
assessment of the project.
It was a good experience for me to work with Lamiya Silks, a pioneer in the textile industry. I
am greatly obliged to Mr. Mohammed Rashin my industry guide, and Mr. Mansoor. P.A, Mr.
Lishad. K.A who have shared their expertise and knowledge with me without which the
completion of project would not have been possible.
I express my gratitude towards staff of Lamiya Silks, those who have helped me directly or
indirectly in completing the training.
Page 2 of 72

TABLE OF CONTENTS
Sl.No. Contents Page No.
1. Executive Summary 1 – 2
2. Introduction 3 – 20
2.1 Working Capital 4 – 8
2.2 Operating Cycle 9
2.3 Working Capital Management 9 – 18
2.4 Concept of Working Capital 19 - 20
3. Research Methodology 21 – 23
4. Sector Overview 24 – 30
4.1 Textile Sector 25 – 27
4.2 SWOT of Textile Industry 28 – 30
5. Company Overview 31 – 38
6. Internship Activities 39 – 57
7. Internship Assessment 58 – 59
8. Conclusion 60 – 61
Page 3 of 72

9. Illustration 62 – 65
10. Bibliography 66 – 67
LIST OF TABLES
Table No. Contents Page No.
1. Comparative Profit & Loss Account 49
2. Trend analysis (Liability Side) 50
3. Trend Analysis (Asset Side) 51
4. Cash Flow Analysis 52
5. Cash Flow Statement 53
6. Profit & Loss Account 55
7. Balance Sheet 56
LIST OF CHARTS
Chart No Contents Page No.1. Main Department Sales 632. Other Department sales 64
Page 4 of 72

EXECUTIVE
SUMMARY
Page 5 of 72

Lamiya Silks is a very well famous textile outlet in Kerala. It has more than 10 branches all over
the state with wide variety of apparels mainly for women. It has broadened its business towards
the gulf as well.
The major purpose of the study is to analyze the working capital management of Lamiya Silks by
considering the annual report of two years. The financial statement explains the trend analyzes
and the ratio analyzes along with the comparative balance statements.
Working capital is one of the most difficult financial concepts to understand for the small-
business owner. In fact, the term means a lot of different things to a lot of different people. By
definition, working capital is the amount by which current assets exceed current liabilities. It
involves the relationship between a firm’s short term assets and its short term liabilities.
Funds needed for short term needs for the purpose like payment of wages and other day to day
expenses are known as working capital. The goal of working capital management is to ensure
that the firm is able to continue its operation and that it has sufficient cash flow to satisfy both
maturing short term debt and upcoming operational expenses. Working capital is primarily
concerned with inventories management, receivable management, cash management and payable
management.
The study involved few personal interviews with the financial heads of the company and through
observation methods. Company annual reports were being evaluated and working capital
management was being analyzed from it. For the purpose of the study convenience sampling
technique has been used.
Page 6 of 72

The study has shown that the working capital of the company has improved as the current asset
is more than that of the current liabilities.
INTRODUCTION
Page 7 of 72

Management is an art of anticipating and preparing for risks, uncertainties and overcoming
obstacles. An essential precondition for sound and consistent assets management is establishing
the sound and consistent assets management policies covering fixed as well as current assets. In
modern financial management, efficient allocation of funds has a great scope, in finance and
profit planning, for the most effective utilization of enterprise resources, the fixed and current
assets have to be combined in optimum proportions.
Working capital in simple terms means the amount of funds that a company requires for
financing its day-to-day operations. Finance manager should develop sound techniques of
managing current assets.
WHAT IS WORKING CAPITAL?
Working capital refers to the investment by the company in short terms assets such as cash,
marketable securities. Net current assets or net working capital refers to the current assets less
current liabilities.
Symbolically, it means,
Net Current Assets = Current Assets Current Liabilities.
In accounting,” Working capital is the difference between the inflow and outflow of funds. In
other words, it is the net cash inflow. It is defined as the excess of current assets over current
liabilities and provisions. In other words, it is net current assets or net working capital.
Page 8 of 72

Working capital represents the total of all current assets. In other words it is the Gross working
capital , it is also known as Circulating capital or Current capital for current assets are rotating in
their nature.
A study of working capital is of major importance to internal and external analysis because of its
close relationship with the day-to-day operations of a business. Working Capital is the portion of
the assets of a business which are used on or related to current operations, and represented at any
one time by the operating cycle of such items as against receivables, inventories of raw
materials, stores, work in process and finished goods, merchandise, notes or bill receivables and
cash.
Working capital comprises current assets which are distinct from other assets. In the first
instance, current assets consist of these assets which are of short duration.
Working capital may be regarded as the life blood of a business. Its effective provision can do
much to ensure the success of a business while its inefficient management can lead not only to
loss of profits but also to the ultimate downfall of what otherwise might be considered as a
promising concern.
The funds required and acquired by a business may be invested to two types of assets:
1. Fixed Assets.
2. Current Assets
Fixed assets are those which yield the returns in the due course of time. The various decisions
like in which fixed assets funds should be invested and how much should be invested in the fixed
assets etc. are in the form of capital budgeting decisions. This can be said to be fixed capital
management.
Other types of assets are equally important i.e. Current Assets.
These types of assets are required to ensure smooth and fluent business operations and can be
said to be life blood of the business. There are two concepts of working capital — Gross and Net.
Gross working capital refers to gross current assets. Net working capital refers to the difference
Page 9 of 72

between current assets and current liabilities. The term current assets refers to those assets held
by the business which can be converted into cash within a short period of time of say one year,
without reduction in value. The main types of current assets are stock, receivables and cash. The
term current liabilities refer to those liabilities, which are to be paid off during the course of
business, within a short period of time say one year. They are expected to be paid out of current
assets or earnings of the business. The current liabilities mainly consist of sundry creditors, bill
payable, bank overdraft or cash credit, outstanding expenses etc.
NEED FOR WORKING CAPITAL
Working capital may be regarded as the lifeblood of the business. Without insufficient working
capital, any business organization cannot run smoothly or successfully. In the business the
Working capital is comparable to the blood of the human body. Therefore the study of working
capital is of major importance to the internal and external analysis because of its close
relationship with the current day to day operations of a business. The inadequacy or
mismanagement of working capital is the leading cause of business failures.
The need of gross working capital or current assets cannot be overemphasized. The object of any
business is to earn profits. The main factor affecting the profits is the magnitude of sales of the
business. But the sales cannot be converted into cash immediately. There is a time lag between
the sale of goods and realization of cash. There is a need of working capital in the form of
current assets to fill up this time lag. Technically, this is called as operating cycle or working
capital cycle, which is the heart of need for working capital. This working capital cycle can be
described in the following words. If the company has a certain amount of cash, it will be required
for purchasing the raw material though some raw material may be available on credit basis. Then
the company has to spend some amount for labour and factory overheads to convert the raw
material in work in progress, and ultimately finished goods. These finished goods when sold on
credit basis get converted in the form of sundry debtors. Sundry debtors are converted in cash
only after the expiry of credit period. Thus, there is a cycle in which the originally available cash
is converted in the form of cash again but only after following the stages of raw material, work in
progress, finished goods and sundry debtors. Thus, there is a time gap for the original cash to get
converted in form of cash again. Working Capital needs of company arise to cover the
Page 10 of 72

requirement of funds during this time gap, and the quantum of working capital needs varies as
per the length of this time gap.
Thus, some amount of funds is blocked in raw materials, work in progress, finished goods,
sundry debtors and day-to-day requirements. However some part of these current assets may be
financed by the current liabilities also. E.g. some raw material may be available on credit basis,
all the expenses need not be paid immediately, workers are also to be paid periodically etc. But
still the amounts required to be invested in these current assets is always higher than the funds
available from current liabilities. This is precise reason why the needs for working capital arise.
From the Financial management point of view, the nature of fixed assets and current assets differ
from each other--
1. The fixed assets are required to be retained in the business over a period of time and they yield
the returns over their life, whereas the current assets loose their identity over a short period of
time, say one year.
2. In the case of current assets, it is always necessary to strike a proper balance between the
liquidity and profitability principles, which is not the case with fixed assets. E.g. If the size of
current assets is large, it is always beneficial from the liquidity point of view as it ensures smooth
and fluent business operations. Sufficient raw material is always available to cater to the
production needs, sufficient finished goods are available to cater to any kind of demand of
customers, liberal credit period can be offered to the customers to improve the sales and
sufficient cash is available to pay off the creditors and so on.
However, if the investment in current assets is more than what is ideally required, it affects the
profitability, as it may not be able to yield sufficient rate of return on investment. On the other
hand, if the size of current assets is too small, it always involves the risk of frequent stock out,
inability of the company to pay its dues in time etc. As such, the investment in current assets
should be optimum. Hence, it is necessary to manage the individual components of current assets
in a proper way. Thus, working capital management refers to proper administration of all aspects
of current assets and current liabilities. Working Capital Management is concerned with the
problems arising out of the attempts to manage current assets, current liabilities and inter-
Page 11 of 72

relationship between them. The intention is not to maximize the investment in working capital
nor is it to minimize the same. The intention is to have optimum investment in working capital.
In other words, it can be said that the aim of working capital management is to have minimum
investment in working capital without affecting the regular and smooth flow of operations. The
level of current assets to be maintained should be sufficient enough to cover its current liabilities
with a reasonable margin of safety. Moreover, the various sources available for financing
working capital requirements should be properly managed to ensure that they are obtained and
utilized in the best possible manner.
Working Capital Cycle
Working capital cycle indicates the length of time between a firm’s paying for materials entering
into stock and receiving the cash from sale of finished goods. In a manufacturing firm, the
duration of time required to complete the sequence of events is called operating cycle.
In case of a manufacturing company, the operating cycle is the length of time necessary to
complete the following cycle of events –
1. Conversion of cash into raw materials
2. Conversion of raw materials into work-in-progress
3. Conversion of work-in-progress into finished goods
4. Conversion of finished goods into accounts receivables
5. Conversion of accounts receivable into cash
The above operating cycle is repeated again and again over the period depending upon the nature
of the business and type of product etc. the duration of the operating cycle for the purpose of
estimating working capital is equal to the sum of duration allowed by the suppliers.
Working capital cycle can be expressed as
R+W+F+D+C
Where,
Page 12 of 72

R - raw material storage period = avg. stock of raw material / avg. cost of production per day
W – work in progress holding period = avg. work in progress inventory / avg. cost of production
per day
F – finished goods storage period = avg. stock of finished goods / avg. cost of goods sold per day
D – debtors collection period = avg. book debts / avg. credit sales per day
C – credit period availed = avg. trade creditors avg. credit purchases per day.
OPERATING CYCLE OF MANUFACTURING BUSINESS
Realization Sales
Accounts Receivable
Cash Finished Goods
Purchases Production
Production
Raw Materials Work-in-progress
Page 13 of 72
WORKING CAPITAL MANAGEMENT
To start any business, First of all we need finance and the success of that business entirely
depends on the proper management of day-to-day finance and the management of this short term
capital or finance of the business is called Working Capital Management.
Working Capital is the key difference between the long term financial management and short
term financial management in terms of the timing of cash. Working capital management is a
short term financial management. Working capital management is concerned with the problems
that arise in attempting to manage the current assets, the current liabilities & the inter
relationship that exists between them. The current assets refer to those assets which can be easily
converted into cash in ordinary course of business, without disrupting the operations of the firm.
Working capital management or short-term financial management is a significant facet of
financial management. It is important due to 2 reasons:
Investment in current assets represents a substantial portion of total investment
Investment in current assets and the level of current liabilities have to be geared quickly
to changes in sales.
Working capital involves activities such as arranging short-term finance, negotiating favorable
credit terms, controlling the movement of cash, administrating accounts receivables, and
monitoring the investment in inventories also take a great deal of time.
Management of working capital is concerned with the problem that arises in attempting to
manage the current assets, current liabilities. The basic goal of working capital management is to
manage the current assets and current liabilities of a firm in such a way that a satisfactory level
of working capital is maintained, i.e. it is neither adequate nor excessive as both the situations
are bad for any firm. There should be no shortage of funds and also no working capital should be
ideal. WORKING CAPITAL MANAGEMENT POLICES of a firm has a great on its
probability, liquidity and structural health of the organization. So working capital management is
three dimensional in nature as
Page 14 of 72

1. It concerned with the formulation of policies with regard to profitability, liquidity
and risk.
2. It is concerned with the decision about the composition and level of current assets.
3. It is concerned with the decision about the composition and level of current
liabilities.
Composition of working capital--
Major Current Assets
1) Cash in hand and cash at bank
2) Bills receivables
3) Sundry debtors
4) Short term loans and advances.
5) Inventories of stock as:
a. Raw material
b. Work in process
c. Stores and spares
d. Finished goods
6) Temporary investment of surplus funds.
7) Prepaid expenses
Page 15 of 72

8) Accrued incomes.
9) Marketable securities.
Major Current Liabilities
1) Accrued or outstanding expenses.
2) Short term loans, advances and deposits.
3) Dividends payable.
4) Bank overdraft.
5) Provision for taxation , if it does not amt. to app. Of profit.
6) Bills payable.
7) Sundry creditors.
The gross working capital concept is financial or going concern concept whereas net working
capital is an accounting concept of working capital. Both the concepts have their own merits.
The gross concept is sometimes preferred to the concept of working capital for the following
reasons:
1. It enables the enterprise to provide correct amount of working capital at correct time.
2. Every management is more interested in total current assets with which it has to operate
then the source from where it is made available.
3. It take into consideration of the fact every increase in the funds of the enterprise would
increase its working capital.
Page 16 of 72

4. This concept is also useful in determining the rate of return on investments in working
capital.
The Goal of Capital Management is to manage the firm s current assets & liabilities, so that the
satisfactory level of working capital is maintained. If the firm can not maintain the satisfactory
level of working capital, it is likely to become insolvent & may be forced into bankruptcy. To
maintain the margin of safety current asset should be large enough to cover its current assets.
Main theme of the theory of working capital management is interaction between the current
assets & current liabilities.
CLASSIFICATION OF WORKING CAPITAL
Working capital may be classified in two ways:
o On the basis of concept.
o On the basis of time.
On the basis of concept working capital can be classified as gross working capital and net
working capital. On the basis of time, working capital may be classified as:
Ø Permanent or fixed working capital.
Ø Temporary or variable working capital
PERMANENT OR FIXED WORKING CAPITAL
Permanent or fixed working capital is minimum amount which is required to ensure effective
utilization of fixed facilities and for maintaining the circulation of current assets. Every firm has
to maintain a minimum level of raw material, work- in-process, finished goods and cash balance.
This minimum level of current assets is called permanent or fixed working capital as this part of
Page 17 of 72

working is permanently blocked in current assets. As the business grow the requirements of
working capital also increases due to increase in current assets.
TEMPORARY OR VARIABLE WORKING CAPITAL
Temporary or variable working capital is the amount of working capital which is required to
meet the seasonal demands and some special exigencies. Variable working capital can further be
classified as seasonal working capital and special working capital. The capital required to meet
the seasonal need of the enterprise is called seasonal working capital. Special working capital is
that part of working capital which is required to meet special exigencies such as launching of
extensive marketing for conducting research, etc.
The extra working capital needed to support the changing production and sales
activities, is called variable or functioning or temporary working capital.
Temporary working capital differs from permanent working capital in the sense that is required
for short periods and cannot be permanently employed gainfully in the business.
IMPORTANCE OR ADVANTAGE OF ADEQUATE WORKING CAPITAL
Ø Solvency of the business: Adequate working capital helps in maintaining the solvency of
the business by providing uninterrupted of production.
Ø Goodwill: Sufficient amount of working capital enables a firm to make prompt
payments and makes and maintain the goodwill.
Ø Easy loans: Adequate working capital leads to high solvency and credit standing can
arrange loans from banks and other on easy and favorable terms.
Ø Cash Discounts: Adequate working capital also enables a concern to avail cash
discounts on the purchases and hence reduces cost.
Ø Regular Supply of Raw Material: Sufficient working capital ensures regular supply of
raw material and continuous production.
Page 18 of 72

Ø Regular Payment Of Salaries, Wages And Other Day TO Day Commitments: It leads to
the satisfaction of the employees and raises the morale of its employees, increases their
efficiency, reduces wastage and costs and enhances production and profits.
Ø Exploitation of Favorable Market Conditions: If a firm is having adequate working
capital then it can exploit the favorable market conditions such as purchasing its
requirements in bulk when the prices are lower and holdings its inventories for higher
prices.
Ø Ability to Face Crises: A concern can face the situation during the depression.
Ø Quick And Regular Return On Investments: Sufficient working capital enables a
concern to pay quick and regular of dividends to its investors and gains confidence of the
investors and can raise more funds in future.
Ø High Morale: Adequate working capital brings an environment of securities, confidence,
high morale which results in overall efficiency in a business.
EXCESS OR INADEQUATE WORKING CAPITAL
Every business concern should have adequate amount of working capital to run its business
operations. It should have neither redundant or excess working capital nor inadequate nor
shortages of working capital. Both excess as well as short working capital positions are bad for
any business. However, it is the inadequate working capital which is more dangerous from the
point of view of the firm.
DISADVANTAGES OF INADEQUATE WORKING CAPITAL
Every business needs some amounts of working capital. The need for working capital arises due
to the time gap between production and realization of cash from sales. There is an operating
cycle involved in sales and realization of cash. There are time gaps in purchase of raw material
and production; production and sales; and realization of cash.
Thus working capital is needed for the following purposes:
Page 19 of 72

· For the purpose of raw material, components and spares.
· To pay wages and salaries
· To incur day-to-day expenses and overload costs such as office expenses.
· To meet the selling costs as packing, advertising, etc.
· To provide credit facilities to the customer.
· To maintain the inventories of the raw material, work-in-progress, stores and spares and
finished stock.
For studying the need of working capital in a business, one has to study the business under
varying circumstances such as a new concern requires a lot of funds to meet its initial
requirements such as promotion and formation etc. These expenses are called preliminary
expenses and are capitalized. The amount needed for working capital depends upon the size of
the company and ambitions of its promoters. Greater the size of the business unit, generally
larger will be the requirements of the working capital.
FACTORS AFFECTING WORKING CAPITAL MANAGEMENT
The amount of working capital required depends upon a number of factors which can be stated as
below
Nature of Business:
Some businesses are such, due to their very nature, that their requirement of fixed capital is more
rather than working capital. These businesses sell services and not the commodities and not the
commodities and that too on cash basis. As such, no funds are blocked in piling inventories and
also no funds are blocked in receivables. E.g. Public utility services like railways, electricity
boards, infrastructure oriented projects etc. Their requirement of working capital is less. On the
other hand, there are some business like trading activity, where the requirement of fixed capital
Page 20 of 72

is less but more money is blocked in inventories and debtors. Their requirement of the working
capital is more.
Length of Production Cycle:
In some business like machine tool industry, the time gap between the acquisitions of raw
material till the end of final production of finished product itself is quite high. As such more
amounts may be blocked either in raw materials, or work in progress or finished goods or even in
debtors. Naturally, their needs of working capital are higher. On the other hand, if the production
cycle is shorter, the requirement of working capital is also less.
Size and Growth of Business:
In very small companies the working capital requirements are quite high overheads, higher
buying and selling costs etc. As such, the medium sized companies positively have an edge over
the small companies. But if the business starts growing after a certain limit, the working capital
requirements may be adversely affected by the increasing size.
Business I Trade Cycles:
If the company is operating in the period of boom, the working capital requirements may be
more as the company may like to buy more raw material, may increase the production and sales
to take the benefits of favourable markets, due to the increased sales, there may be more and
more amount of funds blocked in stock and debtors etc. Similarly, in case of depression also, the
working capital requirements may be high as the sales in terms of value and quantity may be
reducing, there may be unnecessary piling up of stocks without getting sold, the receivables may
not be recovered in time etc.
Rate of Stock Turnover:
There is an inverse co-relationship between the question of working capital and the velocity or
speed with which the sales are affected. A firm having a high rate of stock turnover wuill needs
lower amt. of working capital as compared to a firm having a low rate of turnover.
Page 21 of 72

Credit Policy:
The firm’s credit policy directly affects the working capital requirement. If the firm
has liberal credit policy, hence the more credit period will be provided to the debtors so this
will lead to more working capital requirement. With the liberal credit policy
operating cycle length increases and vice versa.
Production Policy:
If the policy is to keep production steady by accumulating inventories it will require higher
working capital.
Seasonal Variations:
In certain industries like raw material is not available throughout the year. They have to buy raw
material in bulk during the season to ensure an uninterrupted flow and process them during the
year. Generally, during the busy season, a firm requires larger working capital than in slack
season.
Earning Capacity And Dividend Policy:
Some firms have more earning capacity than other due to quality of their products, monopoly
conditions, etc. Such firms may generate cash profits from operations and contribute to their
working capital. The dividend policy also affects the requirement of working capital. A firm
maintaining a steady high rate of cash dividend irrespective of its profits needs working capital
than the firm that retains larger part of its profits and does not pay so high rate of cash dividend.
Price Level Changes:
Changes in the price level also affect the working capital requirements. Generally rise in prices
leads to increase in working capital.
Page 22 of 72
Others FACTORS:
Operating efficiency.
Management ability.
Irregularities of supply.
Import policy.
Asset structure.
Importance of labor.
Banking facilities, etc
CONCEPT OF WORKING CAPITAL:
There are 2 concepts:
Gross Working Capital
Net Working Capital
Gross working capital: - It is referred as total current assets.
Focuses on,
Optimum investment in current assets:
Excessive investments impairs firm s profitability, as idle investment earns nothing. Inadequate
working capital can threaten solvency of the firm because of its inability to meet its current
obligations. Therefore there should be adequate investment in current assets.
Financing of current assets:
Whenever the need for working capital funds arises, agreement should be made quickly. If
surplus funds are available they should be invested in short term securities.
Net working capital (NWC) defined by 2 ways,
Page 23 of 72

Difference between current assets and current liabilities
Net working capital is that portion of current assets which is financed with long term
funds.
NET WORKING CAPITAL = CURRENT ASSETS CURRENT
LIABILITIES
If the working capital is efficiently managed then liquidity and profitability both will improve.
They are not components of working capital but outcome of working capital. Working capital is
basically related with the question of profitability versus liquidity & related aspects of risk.
PLANNING OF WORKING CAPITAL:
Working capital is required to run day to day business operations. Firms differ in their
requirement of working capital (WC). Firm s aim is to maximize the wealth of share holders and
to earn sufficient return from its operations. WCM is a significant facet of financial management.
Its importance stems from two reasons:
Investment in current asset represents a substantial portion of total investment.
Investment in current assets and level of current liability has to be geared quickly to
change in sales.
Business undertaking required funds for two purposes:
To create productive capacity through purchase of fixed assets.
To finance current assets required for running of the business.
The importance of WCM is reflected in the fact that financial managers spend a great deal of
time in managing current assets and current liabilities. The extent to which profit can be earned
Page 24 of 72

is dependent upon the magnitude of sales. Sales are necessary for earning profits. However, sales
do not convert into cash instantly; there is invariably a time lag between sale of goods and the
receipt of cash. WC management affect the profitability and liquidity of the firm which are
inversely proportional to each other, hence
proper balance should be maintained between two.
To convert the sale of goods into cash, there is need for WC in the form of current asset to deal
with the problem arising out of immediate realization of cash against good sold. Sufficient WC is
necessary to sustain sales activity. This is referred to as the operating or cash cycle.
RESEARCHMETHODOLOGY
Page 25 of 72

Objective of the study
To study the various proportions of working capital of Lamiya Silks
To find out different ratios related with working capital
To check the impact of cash flows on working capital of Lamiya Silks
To know the current trend of Assets and Liabilities
Target
Working capital of Lamiya Silks
Sampling Unit
Working capital of Lamiya Silks at Thrissur Store
Sampling Area
Thrissur
Page 26 of 72

Sampling Size
Accounts of 2 years
Sampling Technique
Convenience Sampling
Limitations of the study
Department heads were busy so time for interaction was less.
The entire financial position of the company cannot be disclosed.
Company provides only secondary data, so certain type of bias is in study.
Majority of the raw materials is purchased by the main head office. So more detailed
information cannot be received about these.
SOURCES OF INFORMATION
Primary Data
The personal interview with senior officials and various members of finance and accounts
department and also with other departments and collected the data.
Secondary Data
Necessary for the study was available within the company itself. Other sources-
Website
Page 27 of 72

Textbooks
Page 28 of 72

SECTOR OVERVIEW
Textile sector
The Indian Textile sector plays an exceptionally significant role in shaping the economy of India
notably in terms of employment, foreign exchange earnings and share in value added. This sector
is the second largest sector after agriculture. The industry is rich and varied, embracing the hand-
spun and hand-woven sector at one end and the capital intensive, sophisticated mill sector at the
other. Its association with the ancient culture and tradition of the country lends it a unique
advantage in comparison with textiles industry of other countries, thus giving it an uncommon
edge to cater to a vast variety of products and market segments both domestically, as well as,
globally.
Page 29 of 72

The Indian economy is fundamentally depended upon manufacturing of textiles and its trade.
This sector has been one of the major sources for foreign exchange earnings in India . The
industry registered has ensured value of US dollar 10.1 Billion in 2003 – 2004 as compared to us
dollar 9.6 billion in the previous year. One of the key strengths of Indian textile industry is the
abundance of raw material with India being one of the major producers of fabric in the world.
Until the economic liberalization of Indian economy, the India Textile Industry was
predominantly unorganized industry. The opening up of Indian economy post 1990s led to a
stupendous growth of this industry. India Textile Industry is one of the largest textile industries
in the world. Today, Indian economy is largely dependent on textile manufacturing and exports.
The industry currently contributes about 14 per cent to industrial production, 4 per cent to GDP,
and 17 per cent to the country’s export earnings, according to the Annual Report 2010-11 of the
Ministry of Textiles. The industry accounts for nearly 12 per cent share of the country's total
exports basket. It provides direct employment to more than 35 million people.
There were various stages - from a historical perspective - where the textile industry evolved
from being a domestic small-scale industry, to the status of supremacy it currently holds. The
‘cottage stage’ was the first stage in its history where textiles were produced on a domestic basis.
During this period cloth was made from materials including wool, flax and cotton. The material
depended on the area where the cloth was being produced, and the time they were being made.
During the Industrial Revolution, new machines such as spinning wheels and handlooms came
into the picture. Making clothing material quickly became an organized industry - as compared
to the domesticated activity it had been associated with before. A number of new innovations led
to the industrialization of the textile industry in Great Britain. Clothing manufactured during the
Industrial Revolution formed a big part of the exports made by Great Britain. They accounted for
almost 25% of the total exports made at that time, doubling in the period between 1701 and
1770.
In this era, a lot of effort was made to increase the speed of the production through inventions
such as the flying shuttle in 1733, the flyer-and-bobbin system, and the Roller Spinning machine
by John Wyatt and Lewis Paul in 1738.
Page 30 of 72

In the initial phases, textile mills were located in and around the rivers since they were powered
by water wheels. After the steam engine was invented, the dependence on the rivers ceased to a
great extent. In the later phases of the 20th century, shuttles that were used in the textile industry
were developed and became faster and thus more efficient. This led to the replacement of the
older shuttles with the new ones.
Recent Trends
The mood in the Indian textile industry given the phase-out of the quota regime of the Multi-
Fibre Arrangement (MFA) is upbeat with new investment flowing in and increased orders for the
industry as a result of which capacities are fully booked up to April 2005. As a result of various
initiatives taken by the government, there has been new investment of Rs.500 billion in the
textile industry in the last five years. Nine textile majors invested Rs.26 billion and plan to invest
another Rs.64 billion. Further, India's cotton production increased by 57% over the last five
years; and 3 million additional spindles and 30,000 shuttles-less looms were installed. The
industry expects investment of Rs.1,400 billion in this sector in the post-MFA phase.
A Vision 2010 for textiles formulated by the government after intensive interaction with the
industry and Export Promotion Councils to capitalize on the upbeat mood aims to increase
India's share in world's textile trade from the current 4% to 8% by 2010 and to achieve export
value of US $ 50 billion by 2010 Vision 2010 for textiles envisages growth in Indian textile
economy from the current US $ 37 billion to $ 85 billion by 2010; creation of 12 million new
jobs in the textile sector; and modernization and consolidation for creating a globally competitive
textile industry. The textile industry is undergoing a major reorientation towards non-clothing
applications of textiles, known as technical textiles, which are growing roughly at twice rate of
textiles for clothing applications and now account for more than half of total textile production.
The processes involved in producing technical textiles require expensive equipment’s and skilled
workers and are, for the moment, concentrated in developed countries. Technical textiles have
many applications including bed sheets; filtration and abrasive materials; furniture and
healthcare upholstery; thermal protection and blood-absorbing materials; seatbelts; adhesive
tape, and multiple other specialized products and applications.
Page 31 of 72

Today, modern techniques, electronics and innovation have led to a competitive, low-priced
textile industry offering almost any type of cloth or design a person could desire.
Industry sub-sectors
The textile industry comprises the following:
Organised Cotton/Man-Made Fibre Textiles Mill Industry
Man-Made Fibre / Filament Yarn Industry
Wool and Woollen Textiles Industry
Sericulture and Silk Textiles Industry
Handlooms, Handicrafts, the Jute and Jute Textiles Industry
Textiles Exports
Anticipating massive growth in medical and automobile sectors, these sectors assures substantial
demand for non woven facilities in India. Albeit, home textiles also will lure higher demand,
there are specific demands for home textile facilities also. The 7th Five Year Plan has huge
consideration on agricultural growth that also includes cotton textile industry, resulting a
prosperous future forecast for the textile industry in India.
Strengths of Indian Textile Industry –
1. Indian Textile Industry is an Independent & Self-Reliant industry.
2. Abundant Raw Material availability that helps industry to control costs and reduces the lead-
time across the operation.
3. Availability of Low Cost and Skilled Manpower provides competitive advantage to industry.
4. Availability of large varieties of cotton fiber and has a fast growing synthetic fiber industry.
5. India has great advantage in Spinning Sector and has a presence in all process of operation and
value chain.
Page 32 of 72

6. India is one of the largest exporters of Yarn in international market and contributes around
25% share of the global trade in Cotton Yarn.
7. The Apparel Industry is one of largest foreign revenue contributor and holds 12% of the
country’s total export.
8. Industry has large and diversified segments that provide wide variety of products.
9. Growing Economy and Potential Domestic and International Market.
10. Industry has Manufacturing Flexibility that helps to increase the productivity.
11. Entrepreneurial skills
12. Huge export potential
13. Very low import content
Weaknesses of Indian Textile Industry –
1. Indian Textile Industry is highly Fragmented Industry.
2. Industry is highly dependent on Cotton.
3. Lower Productivity in various segments.
4. There is Declining in Mill Segment.
5. Lack of Technological Development that affect the productivity and other activities in whole
value chain.
6. Infrastructural Bottlenecks and Efficiency such as, Transaction Time at Ports and
transportation Time.
7. Unfavorable labor Laws.
8. Lack of Trade Membership, which restrict to tap other potential market.
Page 33 of 72

9. Lacking to generate Economies of Scale.
10. Higher Indirect Taxes, Power and Interest Rates.
Opportunities of Indian Textile Industry:
1. Growth rate of Domestic Textile Industry is 6-8% per annum.
2. Large, Potential Domestic and International Market.
3. Product development and Diversification to cater global needs.
4. Elimination of Quota Restriction leads to greater Market Development.
5. Market is gradually shifting towards Branded Readymade Garment.
6. Increased Disposable Income and Purchasing Power of Indian Customer opens New Market
Development.
7. Emerging Retail Industry and Malls provide huge opportunities for the Apparel, Handicraft
and other segments of the industry.
8. Greater Investment and FDI opportunities are available.
Threats:
1. Competition from other developing countries, especially China.
2. Continuous Quality Improvement is need of the hour as there are different demand patterns all
over the world.
3. Elimination of Quota system will lead to fluctuations in Export Demand.
4. Threat for Traditional Market for Power loom and Handloom Products and forcing them for
product diversification.
5. Geographical Disadvantages.
Page 34 of 72

6. International labor and Environmental Laws.
7. To balance the demand and supply.
8. To make balance between price and quality
Page 35 of 72

COMPANY OVERVIEW
Page 36 of 72

Page 37 of 72

COMPANY OVERVIEW
Lamiya Silks, the largest showroom network, has been the most trusted brand in Kerala. Today
Lamiya Silks prides itself in world-class showrooms all over Kerala. Lamiya Silks has its main
branch at Kozhikode, Kerala. It has about 15 branches at various places in Kerala. Thrissur store
is one among them.
Lamiya Silks’ product lines are different from other players in the textile industry. So are its
infrastructure facilities. Lamiya Silks has a string of looms in all major centers across the
country. In-house designing centers and manufacturing units help Lamiya Silks bring the latest
trends to its shelves. In addition to all this, Lamiya Silks owns India’s largest wholesale textile
showroom, which powers this heritage brand to control prices and maximize quality right
through the year.
Lamiya Silks is spread across three floors. The ground floor has kids’ collection and dhotis, the
first floor is dedicated to the women’s section and the second floor is exclusively for men.
The ground floor in this apparel store displays has clothes for kids from 5-12 years of age. The
garments are organized size-wise, making it easier to browse through. Ethnic wear like kids’
Page 38 of 72
ghaghra cholis, sherwanis for your little ones along with kasavu and cotton dhotis for men
starting at Rs. 250 are all available. Western wear for kids like shirts, trousers and T-shirts are
there too.
The stairs that lead to the first floor has door mats, curtains, bed sheets, blankets, bedspreads and
some small household items on display.
Page 39 of 72

The floor above has sarees including wedding srees, party wear designer sarees, office wear
cotton sarees and ordinary cotton sarees for Rs. 200 onwards. Salwar kameez material and
readymade churidars are there too. The wedding collection in this section has a good collection
of sarees, starting from Rs. 1,500.
Page 40 of 72

There is a wide range of designer saree collection. The area allotted for designer saree is
comparatively more than the others.
The second floor at Lamiya Silks, exclusively for men, has an assortment of branded readymade
shirts and trousers, shirting material, sherwanis and kurtas. The readymade shirts in this section
start at Rs. 200 for the unbranded ones and Rs. 400 for the branded ones. Here you can also find
shirting material, the price of which starts from Rs. 90 for a meter. Also check out the sherwanis
here that cost around Rs. 2,500.
Page 41 of 72

Lamiya Silks can be easily located since it is on the roadside. Price wise, it seems reasonable
compared to other stores in the vicinity. It accepts cash and credit card for payment. It falls short
of adequate parking space.
Lamiya Silks provides a complete wedding package to its customers. The world of wedding
fashion is witnessing a revolution in Bridal Wear. Revolutions that will alter the way millions of
Indian celebrate their weddings, and Lamiya Silks is at the helm of this revolution. The wedding
centre brings under one roof the finest selection of wedding saris and other accessories. With the
availability of wedding saris, dress material and readymade garments at the centre, marriage
shopping would be a convenient and enjoyable experience. Created by a panel of India’s best
designers, these materials conform to the highest standards of quality with wide range accessible
to all. Lamiya Silks also offers exclusive collection of life style items including perfumes, leather
accessories for men and women and a large collection of premium quality wedding gifts.
Objectives of the Company
Objectives establish the goals and the aims of the business and determine the shape of future
events. Objectives are the way of achieving motives for profit of social service.
Main objectives of Lamiya Silks are-
Increasing productivity of work force
To introduce new products and create new markets
Page 42 of 72

Customers service and customer satisfaction
Improving work culture among the employees
Capitalizing on company strength and use of corporate assets
Continuous innovation
To improve the advertising effectiveness
To ensure that a large proportion of its sales is directed towards the sectors and urban
sectors.
ORGANISATION CHART
Page 43 of 72

INTERNSHIPACTIVITIES
Page 44 of 72

METHODS OF WORKING CAPITAL ANALYSIS
There are so many methods for analysis of financial statements used in companies. Here the
following techniques are being used to analysis the working capital management of Lamiya
Silks-
Comparative size statement
Trend analysis
Cash flow statement
Ratio analysis
A detail description of these methods is as follows-
COMPARATIVE SIZE STATEMENT
When two or more than two years figures are compared to each other we call them comparative
size statements in order to estimate the future progress of the business, it is necessary to look at
the performance of the company. These statements show the absolute figures and also show the
change from one year to another.
Benefits of this method to the company-
To indicate the trends, these statements show the change in production, sales and
expenses.
To make the data simple and more understandable
TREND ANALYSIS
To analyse many years financial statements, this method is used. This indicates the direction on
movement over the long time and help in the financial statements.
Procedure for calculating trends-
1. Previous year is taken as the base year
Page 45 of 72

2. Figures of the base year are taken as 100
3. Trend % are calculated in relation to base year.
Benefits-
It is beneficial to find out the long run changes
It is helpful in future forecasting.
CASH FLOW STATEMENT
Cash flow statements are the statements of changes in the financial position prepared on the basis
of funds defined in cash or cash equivalents. In short cash flow statement summaries the cash
inflows and outflows of the firm during a particular period of time.
Benefits for the company-
To prepare the cash budget
To compare the cash budgets
To show the position of the cash and cash equivalents.
RATIO ANALYSIS
Ratio analysis is the process of the determining and presenting the relationship of the items and
group of items in the statements. Ratio can assist management in its basic functions of
forecasting, planning, coordination, control and communication.
Benefits to the company-
Helpful in analysis of financial statements
Helpful in comparative study
Helpful in locating the weak spots of the company
Helpful in forecasting
Estimate about the trend of the business
Page 46 of 72

Fixation of ideal standards
Effective control
Study of financial soundness
Types of ratio-
Liquidity Ratio- they indicate the firms ability to meet its current obligation out of current
resources.
Current ratio = current assets / current liabilities
Quick ratio = liquid assets / current liabilities
Liquid assets = current assets – stock – prepaid expenses
Leverage or Capital Structure Ratio- this ratio discloses the firms ability to meet the
interest costs regularly and long term solvency of the firm.
Debt equity ratio = long term loans / shareholders funds or net worth
Debt to total fund ratio = long term loans / shareholder funds + long term loan
Proprietary ratio = shareholders fund / shareholders fund + long term loan
Activity ratio or Turnover ratio - they indicate the rapidity with which the resources
available to the concern are being used to produce sales.
Stock turnover ratio = cost of goods sold / average stock
cost of goods sold = net sales / gross profit,
Average stock = opening stock + closing stock / 2
Debtors turnover ratio = net credit sales / average debtors + average B/R
Average collection period = debtors+ B/R Credit sales per day
Credit sales per day = net credit sales of the year /365
Creditors turnover ratio = net credit purchases / average creditors + avg. B/P
Average payment period = creditors + B/P / credit purchase perday
Fixed assets turnover ratio = cost of goods sold / net fixed assets
Net fixed assets = fixed assets – depreciation
Page 47 of 72

Working capital turnover ratio = cost of goods sold / working capital
Working capital = current assets – current liabilities
Profitability ratios or Income ratios - the main objective of every business concern is to
earn profits. A business must be able to earn adequate profit in relation to the risk and
capital invested in it.
Gross profit ratio = gross profit / net sales *100
Net sales = sales – sales return
Net profit ratio = net profit / net sales * 100
Operating net profit = operating net profit / net sales * 100 or gross profit –
operating expenses
Operating ratio = cost of goods sold + operating expenses / net sales * 100
Cost of goods sold = net sales – gross profit
Operating expenses = office and administration expenses + selling & distribution
expenses + discount + bad debts + interest on short term loans
Earning per share(EPS) = net profit – dividend on preference share / no. of equity
shares
Dividend per share (DPS) = dividend paid to equity shareholders / no. of equity
shares * 100
Dividend payout ratio (DP) = DPS /EPS * 100
RATIO ANALYSIS FOR LAMIYA SILKS
Current ratio
2010
C.R = 1321.22 / 969.15 = 1.36
2011
C.R = 1517.69 / 1266.86 = 1.20
Page 48 of 72

Comment-
As compared to previous year, current ratio has decreased in current year because of
increase in current liabilities.
Quick ratio
2010
Q.R = 570.49 / 969.15 = 0.59
2011
Q.R = 693.55 / 1266.86 = 0.55
Comment-
As compared to previous year, quick ratio has decreased in current year.
Debt equity ratio
2010
DER = 1979.67 / 4982.08 = 0.40
2011
DER = 2951.56 / 6230.04 = 0.47
Interest coverage ratio
2010
I.C.R = 1201.90 / 103.38 = 11.67 times
2011
I.C.R = 2189.26 / 111.84 = 19.57 times
Comment-
Interest coverage ratio is increasing as compared to previous year. This indicates that the
firm will be able to pay the interest on long term loans regularly.
Fixed assets turnover ratio
2010
F.A.T.R = 5159 / 3004.63 = 1.72 times
2011
Page 49 of 72

F.A.T.R = 6097 / 3390.44 = 1.80 times
Comment-
This ratio reveals how efficiently the fixed assets are being utilized. As compared to
previous year, this ratio is increasing which indicates that there is better utilization of fixed
assets.
Debt to total fund ratio
2010
D.T.F.R = 1979.67 / 6961.75 = 0.28 or 28%
2011
D.T.F.R = 2951.56 / 9181.60 = 0.32 or 32%
Proprietary ratio
2010
P.R = 4982.08 / 6961.75 = 0.71 or 71%
2011
P.R = 6230.04 / 9181.60 = 0.67 or 67%
Capital turnover ratio
2010
C.T.R = 5159 / 3356.70 = 1.54 times
2011
C.T.R = 6097 / 3641.27 = 1.67times
Comment-
This ratio reveals how efficiently capital employed is being used. As compared to
previous year, this ratio is increasing which indicates that there is better use of capital employed.
Working capital turnover ratio
2010
W.C.T.R = 5159 / 352.07 = 14065 times
2011
W.C.T.R = 6097 / 250.83 = 24.3 times
Page 50 of 72

Comment-
This ratio reveals how efficiently working capital has being utilized in making sales. As
compared to previous year, this ratio is increasing which indicates the efficient use of working
capital.
Stock turnover ratio
2010
S.T.R = 5159 / 715 = 7.22 times
2011
S.T.R = 6097 / 784.44 = 7077 times
Comment-
This ratio indicates whether stock has been efficiently used or not. As compared to
previous year, there is a slight increase in this ratio.
Gross profit ratio
2010
G.P.R = 1494 / 6621 * 100 = 22.56%
2011
G.P.R = 2507 / 8604 * 100 = 29.14%
Net profit ratio
2010
N.P.R = 1202 / 6621 * 100 = 18.15%
2011
N.P.R = 2189 / 8604 * 100 = 25.44%
Operating net profit ratio
2010
O.N.P.R = 1590.9 / 6621 * 100 = 24.02%
2011
O.N.P.R = 2619 / 8604 * 100 = 30.44%
Earning per share
Page 51 of 72

2010
E.P.S = 8630000000 / 91808510 = 94 Rs
2011
E.P.S = 15360000000 / 91428571 = 168 Rs
Dividend per share
2010
D.P.S = 1836176200 / 91808510 = 20 Rs
2011
D.P.S = 2514285703 / 91428571 = 27.5 Rs
Dividend payout ratio
2010
D.P.R = 20 / 94 * 100 = 22%
2011
D.P.R = 27.5 / 168 * 100 = 17%
Proportion of various sources of working capital in percentage –
Current assets, loans and advances
Interest accured on investments
2010
1.46 / 2026.76 * 100 = 0.07%
2011
0.70 / 2342.39 * 100 = 0.02%
Inventories
2010
750.73 / 2026.76 * 100 = 37.04%
2011
824.14 / 2342.39 * 100 = 35.18%
Sundry debtors
2010
Page 52 of 72

413.45 / 2026.76 * 100 = 20.39%
2011
576.48 / 2342.39 * 100 = 24.64%
Cash and bank balances
2010
155.58 / 2026.76 * 100 = 7.67%
2011
116.38 / 2342.39 * 100 = 4.96%
Loans and advances
2010
705.54 / 2026.76 * 100 = 34.83%
2011
824.69 / 2342.39 * 100 = 35.20%
Current liabilities and provisions-
Current liabilities
2010
969.15 / 1273.37 * 100 = 76.10%
2011
1266 / 1450.06 * 100 = 87.36%
Provisions
2010
304.22 / 1273.37 * 100 = 23.90%
2011
183.20 / 1450.06 * 100 = 12.63%
Page 53 of 72

TABLE 1
COMPARATIVE P&L ACCOUNT
(For the year 2010-2011)
(Rs. in Crores)
FY 2011 FY 2010 % change
Net turnover 14095.2 10224.0 38
Other income 317.7 267.9 19
Total expenditure 10122.8 8155.3 24
Operating profit (PBIT) 4290.1 2336.6 84
Interest 228.6 218.3 5
Depreciation 610.0 563.1 8
Exceptional items - 4.1 -
Profit before tax 3451.5 1559.3 121
Total tax expenses 1092.1 402.7 171
Net profit after total tax 2359.4 1156.6 104
Minority share 391.9 116.0 238
Net profit 1967.5 1040.6 89
Page 54 of 72
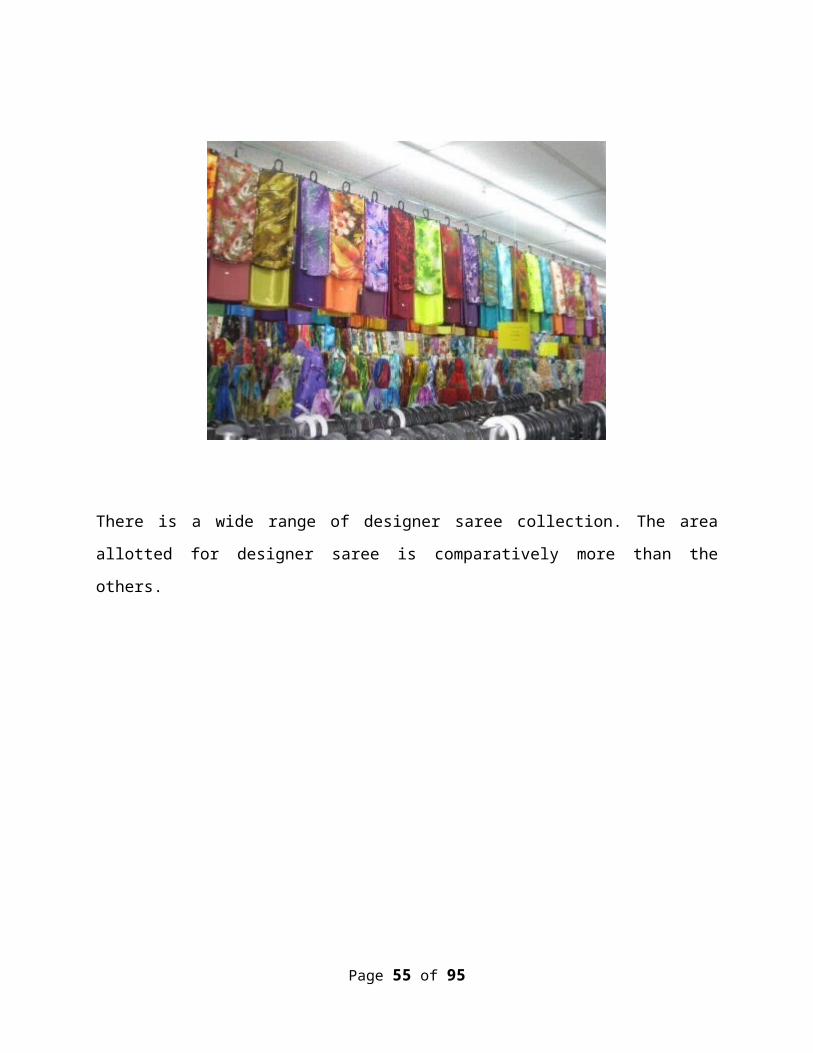
TABLE 2
TREND ANALYSIS
(For the liability side of 2010-2011)
Particulars 2011 2010 Base Trend % Current Tend %
Current liability
Liability 1266.86 969.15 100 130.73
Provisions 183.20 304.22 100 60.21
Total (A) 1450.06 1273.37 100 113.87
Fixed liability
Share capital 91.69 91.69 100 100
Reserves &
surplus
6138.35 4890.39 100 125.5
Loans 2951.56 1979.67 100 149.09
Def. tax liability 582.55 584.38 100 99.68
Total (B) 9764.15 7546.13 100 129.39
Total liability
(A+B)
11214.21 8819.50 100 127.15
Page 55 of 72

TABLE 3
TREND ANALYSIS
(For assets side of 2010-2011)
Particulars 2011 2010 Base trend % Current trend
%
Fixed assets
Fixed assets 4582.79 3298.27 100 138.94
Fixed assets held
for disposable
14.33 12.76 100 112.30
Investments 4274.70 3481.71 100 122.79
Total (A) 8871.82 6792.74 100 130.60
Current assets
Stock 824.14 750.73 100 109.77
Interest accrued .70 1.46 100 47.94
Debtors 576.48 413.45 100 139.43
Cash 116.38 155.58 100 74.80
Loans 824.69 705.54 100 116.88
Total (B) 2342.39 2026.76 100 115.59
Total assets
(A+B)
11214.21 8819.50 100 127.15
TABLE 4
Page 56 of 72

CAH FLOW ANALYSIS
(For 2010-2011)
(Rs in Crores)
Particulars FY 2011 FY 2010
SOURCES OF CASH
Cash from operations 1816.0 1077.1
Increase in debts 947.6 -
Non operating cash flow 114.0 67.1
Decrease in cash and cash equivalent 39.2 -
Decrease in working capital - 205.2
2916.8 1349.4
USES OF CASH
Net increase in investments 647.1 549.2
Net capital expenditure 1598.2 399.5
Decrease in debts - 53.3
Interest 109.4 112.7
Dividend 478.8 165.8
2916.8 1349.4
TABLE 5
CASH FLOW STATEMENT
Page 57 of 72
(For year 2010 – 2011)
(Rs in Crores)
Cash flow from operating
activities
2011 2010
Net profit before tax 2189.26 1201.90
Depreciation 317.91 291.64
Interest expenses 111.84 103.38
Interest income (31.84) (29.48)
Dividend income (81.43) (38.04)
Profit / loss on sale of fixed
assets (Net)
(4.62) 3.99
Profit on sale of long term
investments(Net)
(2.70) (62.57)
Profit on sale of current
investments (Net)
(49.41) (7.27)
Operating profit before
working capital changes
2449.01 1330.06
Trade and other receivables (314.56) (116.66)
Inventories (73.41) (72.41)
Assets held for disposal (1.57) 0.97
Trade payables 306.17 159.70
Cash generated from
operations
2365.64 1668.74
Direct taxes paid(Net) (632.97) (380.42)
Net cash from operating
activities
1732.67 1288.32
Cash flow from investing
activities
Purchase of fixed assets 326.4 410.5
Sale of fixed assets (354.13) (388.73)
Page 58 of 72

Purchase of investments (150.11) (173.66)
Sale of investments (128.19) (91.57)
Investments / advances in joint
ventures, subsidiaries & others
(16.77) (11.75)
Interest received (322.8) (255.21)
Net cash from investing
activities
(301.75) (231.24)
Cash flow from financing
activities
19.71 5.65
Proceeds from borrowings (75.41) (792.83)
Repayments of borrowings 666.13 53.64
Interest paid (1294.15) 24.74
Dividends paid 3.37 1.79
Corporate dividend tax 74.29 55.28
Dividend received 39.37 86.32
Net cash from financing
activities
(868.44) (796.65)
Net increase / decrease in
cash & cash equivalent
(140.78) 117.37
At beginning of year 227.48 110.11
At end of year 86.7 227.48
TABLE 6
PROFIT & LOSS A/C
of the year ending 2010-2011
Page 59 of 72

(Rs. in Crores)
2011 2010
INCOME
Gross sales
Less- Excise Duty
9607.97
986.29
7638.41
985.80
Net sales 8603.59 6652.61
Interest & dividend income 113.27 67.53
Other income 168.49 152.41
Increase / decrease in stock (16.44) (43.48)
868.91 6829.07
EXPENDITURE
Raw material consumed 2219.32 1822.69
Manufacturing expenses 1744.33 1580.34
Purchases of finished & other products 321.16 240.15
Payments to & provisions for employees 459.40 407.64
Selling, distribution, administration & other expenses 1505.69 1181.33
Interest 111.84 103.38
Depreciation 317.91 291.64
6679.65 5627.17
Profit before tax & exceptional items 2189.26 1201.90
Surplus on pre-payment of sales tax loan - 4.13
Write back of provision for diminution 37.10 -
Profit before tax 2226.36 1206.03
Provision for current tax (692.38) (369.82)
Deferred tax 1.83 27.00
Profit after tax 1535.81 863.21
Debenture redemption reserve no longer required 38.56 8.62
Investment allowance reserve no longer required 0.05 0.25
Balance brought forward from previous year 878.37 815.35
Profit available for appropriation 2452.79 1687.43
Page 60 of 72

Appropriations-
Interim dividend 252.10 -
Proposed dividend - 183.35
Corporate dividend tax 35.36 25.41
General reserve 1200.00 600.00
Balance carried to balance sheet 965.33 878.37
2452.79 1687.43
TABLE 7
BALANCE SHEET
For the year ended 2011
(Rs in Crores)
SOURCES OF FUNDS
SHAREHOLDERS FUND
FY(2010-2011) FY(2009-
2010)
Share capital 91.69 91.69
Reserve & surplus 6138.35 4890.39
Loan funds
Secured loans 2291.00 1386.12
Unsecured loans 660.56 593.55
2951.56 1979.67
Deferred tax liabilities 582.55 584.38
TOTAL 9764.15 7546.13
APPLICATIONS OF FUNDS
Fixed assets
Gross block 6770.97 6114.12
Page 61 of 72

Less – depreciation 3380.53 3109.49
Net block 3390.44 3004.63
Capital work-in-progress 1192.35 293.64
4582.79 3298.27
Fixed assets held for disposal 14.33 12.76
Investments 4274.70 3481.71
Current assets, loans & advances
Interest accrued on investments 0.70 1.46
Inventories 824.14 750.73
Sundry debtors 576.48 413.45
Cash and bank balances 116.38 155.58
Loans and advances 824.69 705.54
2342.39 2026.76
Less-
Current liabilities & provisions
Liabilities 1266.86 969.15
Provisions 183.20 304.22
1450.06 1273.37
Net current assets 892.33 753.39
TOTAL 9764.15 7546.13
Page 62 of 72

INTERNSHIPASSESSMENT
Internship has helped a lot to understand the practical side of job, which is different from
the textbook theories. It has also helped me to improve my communication skills.
Customer handling was one of the important learning that I gained from my internship.
From the customer point of view, it is easy. But not so when in the position of a staff or
employee. Was also able to maintain a good relationship with the employees on and off
the shop floor. I did my internship on ‘working capital management’. It helped me to
Page 63 of 72

know how the analysis is being done by comparing the Balance Sheets of 2subsequet
years.
During the period of internship, I was supposed to thoroughly go through the financial
statements of the company and understand the aspects and concepts involved in it. In the
meanwhile, I also contributed in the sales department and helped in the billing session,
which gave me a very different experience.
Having done my internship in the finance sector my interest for it has increased which
will help me in my coming semesters.
It is very well said that “Finance always need a theory backup”. One needs to really know
what finance is all about and how much it is important for the company’s smooth
functioning.
Page 64 of 72

CONCLUSION
FINDINGS
In 2011 there is increase in current assets by 24% than 2010 and there is increase in current
liability by 17%, because of greater increase in current assets than in current liabilities, the
position of Working Capital has improved.
Page 65 of 72

The % of fixed assets has come down in 2011 from 2010
As per current ratio firm is able to pay its current liability
Quick ratio presents a better test of short term financial position, which shows better
working capital position of the firm
Debt equity ratio and debt to total fund ratio presents protection to long term lenders and
shows sufficient working capital in the firm
Gross profit and net profit have increased from previous year
Cash flow statement indicates outflow of cash in comparison to past year
Due to better long term and short term financial conditions firm’s working capital is
better than that of previous year.
RECOMMENDATIONS
The company must concentrate on the percentage of fixed assets in the coming years.
The company must keep on maintaining the firms’ debt and equity and debt to total fund
so as to maintain the working capital.
Apart from the topic recommendations, the billing sector must involve more number of
persons in order to reduce the rush.
The company should try to improve working capital turnover ratio by efficient utilization of
working capital.
The company should try to use more proprietors fund in current assets, so that they can
improve current assets to proprietors fund.
By using proprietors fund properly, the company can increase return on capital employed.
Page 66 of 72

ILLUSTRATION
The details of sales in different sessions in the store during the month of April – June 2012.
CHART 1
MAIN DEPARTMENT SALES
Page 67 of 72
36%
17%14%
15%
19%
Department SalesDesigner Saree Wedding Saree Churidhar Kids Wear Gents Wear
The statistics of the apparels department shows that the customers demand more for designer
sarees. Now-a-days lady customers are increasing and so is such a result. The trend of churidhars
and salwars have come down when compared to the designer sarees. 35% of the department sales
is in the designer saree session.
The different sales percentage of each apparels are-
Designer Saree 35%
Gents Wear 19%
Wedding Saree 17%
Kids Wear 15%
Churidhar 14%
Page 68 of 72

Sales details of other sessions in the store, which includes cosmetics, bed spreads, blankets,
curtains, etc.
CHART 2
SALES OF OTHER DEPARTMENTS
28%
35%
14%
18%
5%
SalesCosmetics Bed Spreads Blanket Curtain Doormat
When conducting a study among the other accessories and materials, we can come to a
conclusion that customers give more preference to cosmetics and then to others. The demand for
blanket is relatively less when compared to bed spreads. This is because of the climate conditions
in Kerala.
The different sales percentage of other materials in the store are-
Bed Spreads 35%
Cosmetics 28%
Page 69 of 72

Curtains 18%
Blanket 14%
Doormat 5%
Page 70 of 72

BIBLIOGRAPHY
COMPANY REPORTS
Annual reports of Lamiya Silks
2009-10
2010-11
Page 71 of 72

BOOKS REFERRED
Khan, M.Y. and Jain, P.K., 2011, Financial Management, Tata McGraw-Hill, New
Delhi.
Sekaran, U. and Bougie, R., 2010, Research Methods for Business, New Delhi, Wiley-
India Edition, 5th edition.
2. Kothari, C.R., 1985, Research Methodology- Methods and Techniques, New Delhi,
Wiley Eastern Limited.
WEBLIOGRAPHY
http://lamiyasilks.com/
http://en.wikipedia.org/wiki/Textile_industry
http://www.textilehistory.org/
http://en.wikipedia.org/wiki/Working_capital
Page 72 of 72