report - 2016 untapped potential - daily herald
TRANSCRIPT

UNTAPPED POTENTIAL
Report - 2016
Presented by:
2
Table of Contents
I. INTRODUCTION
II. GIFTED CHILDREN LEFT BEHIND
III. THE IDENTIFICATION PROBLEM
IV. METHODOLOGY
V. ILLINOIS SNAPSHOT
A. SAMPLE RESULTS
B. BLACK STUDENTS
C. HISPANIC STUDENTS
D. LOW INCOME STUDENTS
E. GENDER
VI. CHICAGO PUBLIC SCHOOLS SNAPSHOT
VII. BEST PRACTICES IN IDENTIFICATION
VIII. FURTHER RESEARCH
IX. APPENDICES

3
Introduction“A quiet crisis.”
That’s how a report by the U.S. Department of Education in 1993 - “National Excellence: The Case for Developing America’s Talent” - described the state of gifted education in America.
Its major fi nding: the nation’s education system is failing to provide the country’s brightest students with the rigorous academic environment they need and deserve.1
Fast forward twenty-plus years - not much has changed.
The common belief that gifted students - because of their unusually high intelligence - will do fi ne without additional academic support still guides federal, state, and local policy regarding gifted education, despite studies and reports detailing otherwise.
Gifted students, even more than their peers, need emotional and academic support in order to reach their full potential. Unfortunately, that is what many gifted students - especially those from low-income or minority families - are not receiving.
One reason is that these populations are least likely to live in school districts that have gifted programs. Data from the Early Childhood Longitudinal Study show that only 83 percent of black students nationwide wide have access to gifted programs as compared to 91 percent of white students and 90 percent of Asian students.2
Moreover, gifted education is not a priority. An amalgam of federal and state policies - which have caused superintendents, principals, and teachers to almost exclusively focus on academically struggling students - has made gifted education an afterthought in most communities. In fact, in 2014, U.S. spending on gifted education only constituted 1/33 of 1 percent of the federal education budget.3
Finally, due to subjective identifi cation policies, low-income and minority students are underrepresented in gifted programs nationwide. Data from the O� ce for Civil Rights at the U.S. Department of Education shows that, as of 2009, black students comprised 16.7 percent of the population, but only 9.8 percent of students in gifted programs. The same is true for Hispanic students, who constituted 22.3 percent of the student population, but only 15.4 percent of the gifted population.4
1. U.S. Department of Education, O� ce of Educational Research and Improve-ment, “National Excellence: The Case for Developing America’s Talent”, http://fi les.eric.ed.gov/fulltext/ED359743.pdf
2. U.S. Department of Education, Civil Rights Data Collection, 2009-2010: National and State Estimations, http://ocrdata.ed.gov/StateNationalEsti-mations/Projections_2009_10
3. Carolyn M. Callahan, Tonya R. Moon, and Sarah Oh,“National Surveys of Gifted Programs”, University of Virginia - National Research Center on the Gifted and Talented - 2014, http://www.nagc.org/sites/default/fi les/key%20reports/2014%20Survey%20of%20GT%20programs%20Exec%20Summ.pdf
4. U.S. Department of Education, Civil Rights Data Collection, http://ocrdata.ed.gov/StateNationalEsti-mations/Projections_2009_10

4
There is hope. A study by Vanderbilt’s David Lubinski, Camilla Benbow and Harrison J. Kell using data from the Study of Mathematically Precocious Youth - a research project begun by Johns Hopkins’ professors in 1971, which identifi ed 12-year-olds and continues to track them to this day - shows what happens when gifted students are provided the enriching academic environment and emotional support they need and deserve.
Examining the life outcomes of 1,650 previously identifi ed gifted students forty years later, Lubinski, Benbow, and Kell found that the cohort’s accomplishments far exceeded the expectations of researchers at John Hopkins’ decades earlier. Across the group, 4.1 percent had earned tenure at a major research university, 2.3 percent were executives at “name brand” or Fortune 500 companies, and 2.4 percent were attorneys at major fi rms or organizations - much higher percentages than the general population. In addition, the cohort had published 85 books and 7,572 referenced articles, secured 681 patents, and received $358 million in grants.5
Another study, by Eric Hanushek and Ludger Woessman, found that a 10 percent increase in the share of top-performing students is associated with 1.3 percentage points in additional annual economic growth - almost as much the average U.S. annual growth rate over the past four decades.6
These studies, and others like it, show that taking the time to properly identify gifted students and provide adequate funding for gifted education is an investment that will yield signifi cant returns in the future.
5. David Lubinski, Camilla P. Benbow, and Harrison J. Kell, “Life Paths and Accomplishments of Mathematically Precocious Males and Females Four Decades Later”, Association for Psychological Science - 2014, https://my.vanderbilt.edu/smpy/fi les/2013/02/Article-PS-Lubinski-et-al-2014-DEC-FINAL.pdf
6. Chester E. Finn and Brandon L. Wright, “Why Bother Educating Smart Kids”, Hoover Institute - 2015, http://www.hoover.org/research/why-bother-educating-smart-kids
5
Gifted Children Left BehindThe passage of the No Child Left Behind Act, or NCLB, in 2001 dramatically changed the priorities of school districts nationwide. Previous iterations of the Elementary and Secondary Education Act, or ESEA, introduced assessments and accountability, but never on this scale.
Instead of allowing states to defi ne adequate yearly progress, or AYP, NCLB defi ned it for them. It also called for states to assess students grades 3 to 8 and prescribed specifi c interventions - public school choice and tutoring - for schools failing to make AYP, especially for low-income and minority students. Lastly, it required districts to transition towards only hiring highly-qualifi ed teachers.7
Because of its intense focus on helping struggling students reach profi ciency, NCLB all but ignored gifted education. Not only did funding for the gifted education reach an all-time low, but NCLB also incentivized states, including Illinois, to redirect what was previously money set aside for gifted programs to general state education funds.8
The Illinois State Board of Education’s, or ISBE, last o� cial report - issued in 2003, described a robust gifted education sector.
A majority of Illinois districts o� ered gifted programming to elementary and middle school students. 708 of the then 819 school districts, or 85.1 percent, o� ered a gifted elementary program, and 659, or 78.9 percent, o� ered a middle school program. In all, 64,327 K-8 students statewide were enrolled in gifted programs.9
Despite the wide availability of gifted programs, a deeper dive into the 2003data reveals racial and ethnic disparities in enrollment.
Black students only made up 11.7 percent of the gifted student population even though they comprised 21.1 percent of the student population. Hispanic students were even more underrepresented. They constituted only 7.8 percent of the gifted student population, even though they were 16.9 percent of the student population statewide.10
Unfortunately, ISBE didn’t track the enrollment of low-income students - a group that researchers have found is consistently underrepresented in gifted programs.
7. U.S. Department of Education, “No Child Left Behind”, http://www2.ed.gov/nclb/landing.jhtml
8. Kristen Stephens and Jan Riggsbee, “The Children Neglected by No Child Left Behind”, Duke Today - 2007, https://today.duke.edu/2007/02/gifted_oped.html
9. Illinois State Board of Education - Data Analysis and Progress Reporting Division, “Gifted Education in Illinois School Year 2013”, http://www.isbe.net/research/pdfs/gifted_stats_02-03.pdf
10. Ibid

6
The Identifi cation ProblemIn most states, participation in gifted programs is usually infl uenced by two factors: parent advocacy and teacher identifi cation.
Some school districts, like Illinois’ Naperville Community Unit School District 203 and Indian Prairie School District 204, have developed more complex processes aimed at identifying under-served populations, but most districts nationwide rely on a subjective process to choose which students gain access to gifted programming.
The parents of low-income and minority students are less likely to advocate for their children to enter gifted programs, not because they aren’t passionate about their children’s education, but oftentimes because their work schedules, lack of institutional knowledge, or strained fi nancial resources preclude them from doing so.11
Suburban parents, on the other hand, often su� er from what one Illinois school district superintendent said is the “Lake Wobegon” e� ect, where they believe their children are above average and qualifi ed for gifted programming.
This reliance on parent advocacy is part of the reason why low-income and minority students are persistently under-enrolled in gifted programs.
One might suspect that teacher identifi cation - because it is being done by a trained professional - would yield more equitable results. Unfortunately, recent studies show that isn’t the case.
One such study, written by Vanderbilt University’s Jason Grissom and Christopher Redding, investigated what factors a� ect the likelihood that students are enrolled in gifted programs. Analyzing National Center for Education Statistics data for more than 14,000 elementary school students in districts with gifted programs, Grissom and Redding found that even among students with the same high standardized test scores, black students were less likely to be assigned to gifted programs in both math and reading - even after controlling for factors like the student’s socioeconomic status.12
Interestingly, the only factor that increased the likelihood that a black student would be enrolled in a gifted program was if the teacher who referred the student was also black.
Why are white teachers less likely to refer black students to gifted programs, even when those students are performing at the same academic level as their white peers? The phenomenon is likely due to what researchers call implicit biases - nearly unconscious, split-second judgments that humans make when they encounter people or things.13
11. Roslyn Arlin Mickelson, “When are Racial Disparities in Education the Result of Racial Discrimination? A Social Science Perspective”, Teacher’s College Record - 2003, https://www.researchgate.net/publication/255635788_When_Are_Racial_Disparities_in_Education_the_Result_of_Racial_Discrimination_A_Social_Science_Perspective
12. Jason A. Grissom and Christopher Redding, “Discretion and Disproportionality: Explaining the Underrepresentation of High-Achieving Students of Color in Gifted Programs”, AERA Open - 2016, http://news.vanderbilt.edu/fi les/Grissom_AERAOpen_GiftedStudents1.pdf
13. Cheryl Staats, Kelly Capatosto, Robin A. Wright, and Danya Contractor, “State of the Science: Implicit Bias Review 2015”, Kirwan Institute for the Study of Race and Ethnicity, http://kirwaninstitute.osu.edu/wp-content/uploads/2015/05/2015-kirwan-implicit-bias.pdf

7
Implicit biases are partially responsible for “the Belief Gap” - the distance between what students can achieve and what others believe they can achieve. This gap is perfectly captured in the fi ndings of a study by Seth Gershenon, Stephen B. Holt, and Nicholas W. Papageorge. Their research examined teachers’ views on high school students’ future education attainment. Using data from the federal Educational Longitudinal Survey, the researchers determined that when students were assigned to a teacher of a mismatched race or gender, that teacher was signifi cantly more likely to perceive the student as being frequently disruptive, frequently inattentive, and less likely to complete homework. They were also less likely to believe the student would graduate high school and successfully enroll in and complete college.14
Given these fi ndings, and the fact that more than 85 percent of the current national teacher workforce is white, it’s not surprising that black and Hispanic students are less likely to be referred to gifted programs.15
Sometimes, these biases go even deeper, causing teachers to not only underestimate a student’s academic ability based on their race, but also by something as arbitrary as their name. A fascinating study of teacher expectations of student academic ability by Northwestern’s David Figlio showed that teachers were less likely to refer children to gifted programs the more the student’s name was associated with low-income status. For example, a student named “Damarcus” is 2.5 percentage points less likely to be referred to a gifted program in a school with few black teachers than his brother “Drew”.16
Highlighting these studies is not to suggest that teachers are consciously preventing low-income and minority students from enrolling in gifted programs. Instead, they demonstrate just how subjective the teacher identifi cation process is - that a characteristic as arbitrary as race or a student’s name can have a statistically signifi cant impact on whether that student is able to enroll in gifted programming.
14. Seth Gershenson, Stephen B. Holt, and Nicholas Papageorge, “Who Believes in Me? The E� ect of Student-Teacher Demographic Match on Teacher Expectation”, W.E. Upjohn Institute for Employment Research - 2015, http://research.upjohn.org/cgi/viewcontent.cgi?article=1248&context=up_workingpapers
15. National Center for Education Statistics, “Schools and Sta� ng Survey: Number of public school teachers, number and percentage of public schools teachers who entered the profession in 2011 or 2012, and percentage distribution of new public school teachers, by race/ethnicity: 2011-2012”, https://nces.ed.gov/surveys/sass/tables/SASS1112_2014_03_t1n.asp
16. David N. Figlio, “Names, Expectations, and the Black-White Test Score Gap”, National Bureau of \Economic Research - 2005, http://www.nber.org/papers/w11195.pdf

8
MethodologyOne Chance Illinois solicited gifted demographic data from every school district in the state. After gathering a sample of the data, we calculated the proportion of low-income, minority, and female students in gifted programs run by the largest 10 percent of unit and elementary school districts.
We compared these proportions to whole district demographics to determine disparities.17 For example, 30.25 percent of students in Alton CUSD 11 are black, but only 10.57 percent of the district’s gifted program students are black. This means black students in Alton CUSD 11 are less likely to be identifi ed as gifted than students in other racial or ethnic groups. We looked for similar instances of under-representation across all target groups and districts in our sample.
We then checked that the di� erences between whole-district demographics and gifted program demographics were likely not random, in order to ensure we did not blame districts for disparities outside of their control. We hypothesized that each district’s gifted program has the same demographic makeup as that district’s student body. District-by-district, we checked whether this hypothesis was true by determining the likelihood that disparities at least as large as those we calculated from district data would occur in another sampling of each district’s student population.18
For instance, 9.71 percent of students in Peoria SD 150 are Hispanic. 9.69 percent of Peoria’s identifi ed gifted students are Hispanic, giving a .02 percentage point disparity. We applied our hypothesis, and supposed that this di� erence is so small that it’s statistically insignifi cant. We checked this hypothesis by calculating that there is a 91.33 percent chance that a gap this small would occur in another randomly selected group of students in Peoria. Because the probability that any group of students in Peoria would be 9.69 percent Hispanic is so high, we could not reject the hypothesis that the gap between the proportion of the entire district population which is Hispanic and the proportion of the gifted population which is Hispanic is zero. Therefore, we did not report any disparity for Hispanic students in Peoria.
In order to reject our hypothesis of equality and consider a disparity statistically signifi cant, we required a 1 percent or lower probability that another random sampling of a district’s students would demonstrate a disparity at least as extreme as those we observed. All of the disparities reported below meet this highly rigorous threshold for statistical signifi cance.19 After identifying the gaps that are statistically distinguishable from zero, we ranked the districts by disparity size for black, Hispanic, and low-income students.
18. One sample Z test
19. We chose an alpha level of .01 to minimize the margin of error, due to relatively small sample sizes.

99
Figure 1
Illinois SnapshotDo the trends reported in 2003 still hold? Are black and Hispanic giftedstudents still under-enrolled in gifted programs compared to their studentpopulation numbers? What about low-income students - a population the State Board collected no data for?
Unfortunately, little has changed. Across our sample of the state’s largest 10 percent of districts that operate middle and elementary schools, black and Hispanic students are still under-enrolled at rates shockingly similar to those 13 years ago.
Low-income students, regardless of race, are enrolled at even lower ratesthan students of color.
Though some districts include an assessment component as part of their identifi cation process, they still rely on parent advocacy and teacher identifi cation to determine who is able to take the test. They do not universally screen.
Interestingly, the loss of state gifted education funding had little to no bearing on black, Hispanic, or low-income enrollment rates.
Sample Results
Figure 1 shows the sample-wide disparities between district demographics and gifted program demographics.20
20. See Appendix A for a listing of disparities in all the districts for which we compiled data. Visit www.onechanceillinois.org for our full dataset.
G&T 17.49% 0.25% 16.31% 16.33% 0.21% 44.94% 3.80% 32.81%
Whole Sample
35.04% 0.33% 7.41% 23.79% 0.12% 30.52% 2.79% 56.87%
50%
40%
30%
20%
10%
0%
His
pan
ic
Am
eric
an
Ind
ian
Asi
an
Bla
ck
OP
I
Wh
ite
Tw
o
or
Mo
re
Low
In
com
e
Demographic Disparities in Illinois Gifted Programs
10
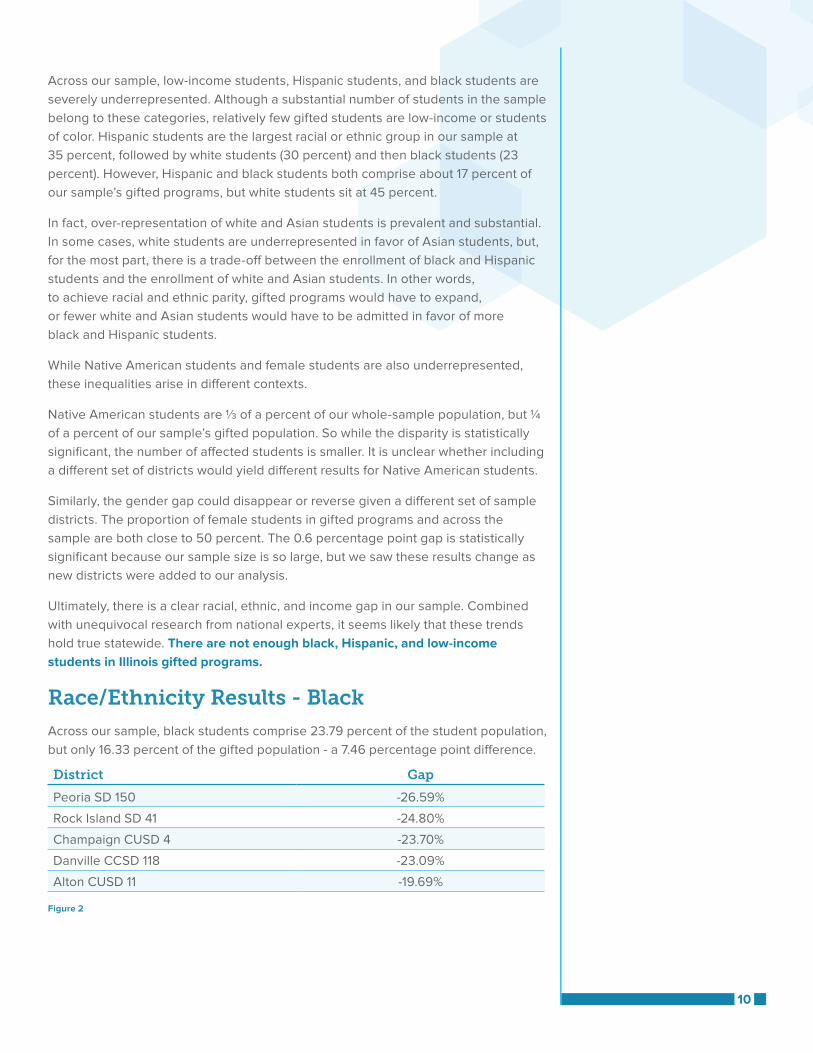
Across our sample, low-income students, Hispanic students, and black students are severely underrepresented. Although a substantial number of students in the sample belong to these categories, relatively few gifted students are low-income or students of color. Hispanic students are the largest racial or ethnic group in our sample at 35 percent, followed by white students (30 percent) and then black students (23 percent). However, Hispanic and black students both comprise about 17 percent of our sample’s gifted programs, but white students sit at 45 percent.
In fact, over-representation of white and Asian students is prevalent and substantial. In some cases, white students are underrepresented in favor of Asian students, but, for the most part, there is a trade-o� between the enrollment of black and Hispanic students and the enrollment of white and Asian students. In other words, to achieve racial and ethnic parity, gifted programs would have to expand, or fewer white and Asian students would have to be admitted in favor of more black and Hispanic students.
While Native American students and female students are also underrepresented, these inequalities arise in di� erent contexts.
Native American students are ⅓ of a percent of our whole-sample population, but ¼ of a percent of our sample’s gifted population. So while the disparity is statistically signifi cant, the number of a� ected students is smaller. It is unclear whether including a di� erent set of districts would yield di� erent results for Native American students.
Similarly, the gender gap could disappear or reverse given a di� erent set of sample districts. The proportion of female students in gifted programs and across the sample are both close to 50 percent. The 0.6 percentage point gap is statistically signifi cant because our sample size is so large, but we saw these results change as new districts were added to our analysis.
Ultimately, there is a clear racial, ethnic, and income gap in our sample. Combined with unequivocal research from national experts, it seems likely that these trends hold true statewide. There are not enough black, Hispanic, and low-income students in Illinois gifted programs.
Race/Ethnicity Results - Black
Across our sample, black students comprise 23.79 percent of the student population, but only 16.33 percent of the gifted population - a 7.46 percentage point di� erence.
District Gap
Peoria SD 150 -26.59%
Rock Island SD 41 -24.80%
Champaign CUSD 4 -23.70%
Danville CCSD 118 -23.09%
Alton CUSD 11 -19.69%
Figure 2

11
21. David M. Fetterman, “Gifted and Talented Education: A National Test Case in Peoria”, Educational Evalution and Policy Analysis - 1986, http://epa.sagepub.com/content/8/2/155
22. Peoria Public Schools, Gifted Education, http://www.psd150.org/Page/22161
23. Illinois Report Card, Peoria SD 150, Educators - Teacher Demographics https://illinoisreportcard.com/District.aspx?source =EducatorInformation&source2 =TeacherDemog raphics&Districtid=48072150025
The district with the largest disparity between its black student population and its black gifted student population is Peoria SD 150.
This isn’t the fi rst time the school district has had issues with black student under-enrollment in its gifted program. In 1986, the Illinois State Board of Education found that the district’s gifted student population was only .4 percent black although black students comprised 40 percent of the district’s population. David Fetterman - a Stanford professor - used the district as a case study in how fl awed gifted identifi cation systems can cause under-enrollment issues for traditionally disadvantaged populations.21
As a result of the study and subsequent lawsuit, Peoria SD 150 made changes to its gifted program identifi cation process. It now requires all fourth grade students to take the Cognitive Abilities Test (CoGAT) as well as the NWEA Measures of Academic Progress test (MAP). Some students identifi ed as gifted are also asked to take the Wechsler Intelligence Scale for Children test (WISC-V).22 The admissions process also requires a teacher referral.
A student is permitted to apply to the district’s gifted school - Washington Gifted Middle School - only if the student meets the 90th percentile or higher in reading and math on two out of the last three nationally-normed NWEA Measures of Academic Progress (MAP) achievement tests, meets predetermined scores on the Cognitive Abilities Test (CoGAT), and is referred by a teacher.
Unfortunately, it is the last component - the teacher referral - that is likely causing the disparity in Peoria’s gifted program. As research in the Identifi cation Problem section of this report shows, the teacher referral process is very subjective and can be infl uenced by arbitrary factors such as a student’s race or name. The fact that 917 of Peoria’s 1,030 teachers are white - 89.1 percent - may contribute to the under-enrollment of black students in the district’s gifted program.23
Race/Ethnicity Results - Hispanic
Across our sample, Hispanic students comprise 35.04 percent of the student population, but only 17.49 percent of the gifted population - a 17.55 percentage point di� erence.
Figure 3
The district with the largest disparity between its Hispanic student population and its Hispanic gifted student population is West Chicago ESD 33.
This is likely the result of a very subjective gifted identifi cation process. The district does not universally screen students using an assessment like the CoGAT.
District Gap
West Chicago ESD 33 -39.11%
Palatine CCSD 15 -35.01%
Wheeling CCSD 21 -29.85%
Woodstock CUSD 200 -25.60%
Aurora West 129 -21.53%
12
It relies on teacher referrals, previous classroom performance, and performance on achievement tests to identify gifted students.
Palatine CCSD 15, on the other hand, has a much more structured gifted identifi cation process. First, all second and fourth grade students have achievement in reading and math screened via the NWEA MAP test. In order to be eligible to take the CoGAT, students must perform in both reading and math at a level that is equal to or exceeds the 90th percentile nationally.24
Research shows, however, that the use of an achievement test as a gateway to an abilities test, and vice versa, will likely result in the under-enrollment of high-ability students in the fi rst scenario and high-achieving students in the second. Looking at both simultaneously is considered best-practice, especially if the district has both enrichment and accelerated programs.
In addition, setting cut scores at national norms is likely to leave out students that would otherwise qualify for gifted programming at the local level.
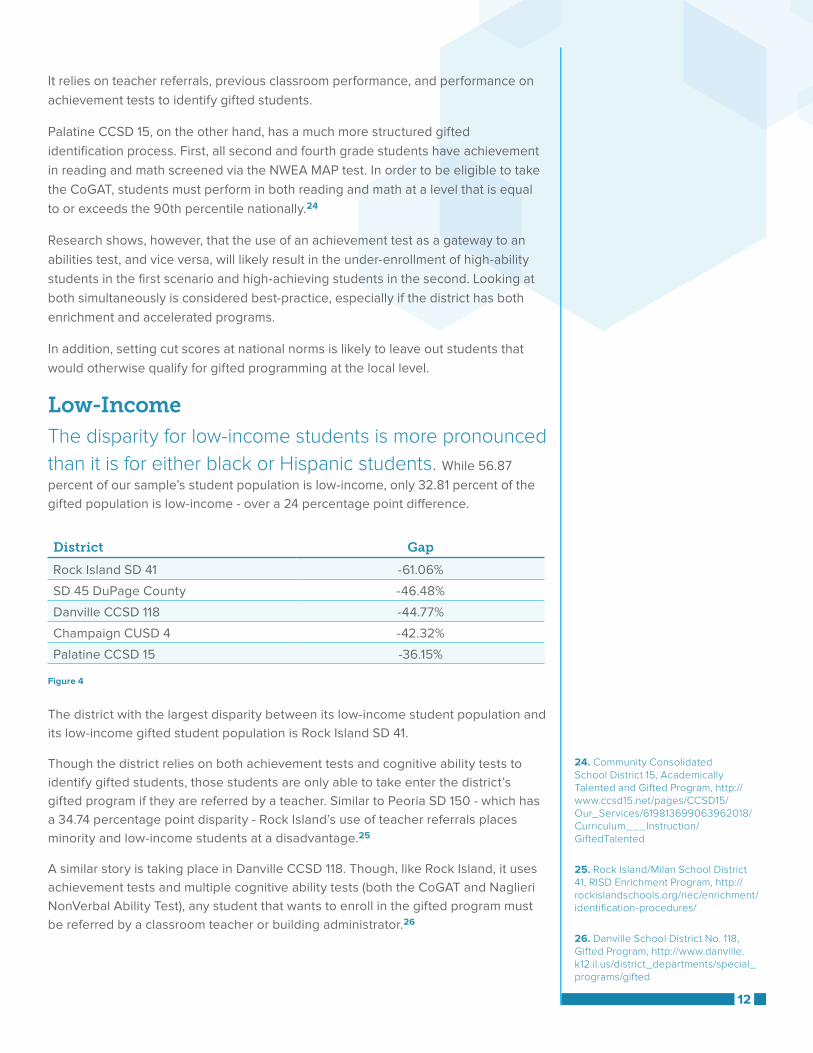
Low-Income
Figure 4
The district with the largest disparity between its low-income student population and its low-income gifted student population is Rock Island SD 41.
Though the district relies on both achievement tests and cognitive ability tests to identify gifted students, those students are only able to take enter the district’s gifted program if they are referred by a teacher. Similar to Peoria SD 150 - which has a 34.74 percentage point disparity - Rock Island’s use of teacher referrals places minority and low-income students at a disadvantage.25
A similar story is taking place in Danville CCSD 118. Though, like Rock Island, it uses achievement tests and multiple cognitive ability tests (both the CoGAT and Naglieri NonVerbal Ability Test), any student that wants to enroll in the gifted program must be referred by a classroom teacher or building administrator.26
District Gap
Rock Island SD 41 -61.06%
SD 45 DuPage County -46.48%
Danville CCSD 118 -44.77%
Champaign CUSD 4 -42.32%
Palatine CCSD 15 -36.15%
24. Community Consolidated School District 15, Academically Talented and Gifted Program, http://www.ccsd15.net/pages/CCSD15/Our_Services/619813699063962018/Curriculum___Instruction/GiftedTalented
25. Rock Island/Milan School District 41, RISD Enrichment Program, http://rockislandschools.org/riec/enrichment/identifi cation-procedures/
26. Danville School District No. 118, Gifted Program, http://www.danville.k12.il.us/district_departments/special_programs/gifted
The disparity for low-income students is more pronounced than it is for either black or Hispanic students. While 56.87 percent of our sample’s student population is low-income, only 32.81 percent of the gifted population is low-income - over a 24 percentage point di� erence.
13
Gender
Although the data shows signifi cant and substantial gender disparities, they do not all defi cit female students. Of the 45 districts for which we have gender data, 14 under-represent male students. Wheeling CCSD 21 has the biggest gap in our sample for male students. Whereas female students comprise 47.70% of the district, they are 56.23% of the gifted program, leaving an 8.53 percentage point gap. The City of Chicago 299 has the smallest gap for male students, at a little over half a percentage point.
16 districts in our sample under-represent female students. The largest gap occurs in Wilmette SD 39, where female students are 48.55% of the student population but only 39.33% of the gifted program, giving a 9.22 percentage point gap. Naperville CUSD 203 has the smallest gap at 1.38 percentage points.
15 districts strike the right balance and do not under-represent maleor female students.
Across the sample, girls are under-represented by 3/5ths of a percentage point. This disparity is signifi cant and beyond the margin of error. However, whereas race and income are indisputable problem areas for gifted programs, a slightly di� erent sample could show equal- or over-representation of female students. In fact, in the process of gathering and aggregating our data, we saw statistical signifi cance disappear and reappear as we added new districts.

14
Chicago Public School SnapshotIllinois’ largest school district has a vast and complex gifted system. Although selective enrollment is prevalent at the high school level, this snapshot focuses on elementary and middle school gifted programs in order to more closely compare CPS with the rest of our sample.
Not every non-neighborhood school in CPS is part of the gifted network. All charter schools and many magnet schools run lotteries to determine admission. Neither type of school is necessarily selective. However, some neighborhood and magnet schools have selective gifted tracks within them. Moreover, there are several CPS schools that are entirely dedicated to gifted students. Some of these gifted schools are also magnet schools, and have a particular subject matter focus. Finally, a handful of high schools run gifted programs for 7th and 8th graders. Although CPS does not release the names of tests it uses for selective enrollment admissions, all tests for giftedness administered by CPS are of higher order logic and reasoning.27 Figure 5 summarizes the myriad elementary and middle school gifted options for CPS students.28
Type DescriptionGrade Level
School or Program
Admissions
Academic Center
Allow high-achieving and motivated students the opportunity to complete the elementary curriculum and enter high school classes in English, social studies, science, mathematics, world language, and music or art.
7-8 Program Test
Classical School
A challenging liberal arts course of instruction for students with high academic potential.
K-8 School Test
ELL Regional Gifted Center
Designed to meet the needs of high-ability students whose primary language is Polish, Russian, or Spanish.
K-8 School Test
International Gifted
Intensive study in English, French, social studies, laboratory science, mathematics, technology, arts, physical education, library science, and advanced research.
K-8 Program Test
Regional Gifted Center
An accelerated instructional program that places an emphasis on thinking, reasoning, problem solving and creativity
K-8 School Test
Specifi c Aptitude
Comprehensive gifted programs serve grades 1-8 and cover all core subjects. Specifi c Aptitude Programs are pullout programs in specifi c subjects and serve varying grades.
K-8 Program School
Figure 5
27. Information obtained via special request.
28. Chicago Public Schools, “Options for Knowledge Guide: 2016-2017”, http://www.cpsoae.org/Options%20for%20Knowledge%20Guide_2016-2017_English.pdf

15
No central o� ce at CPS tracks enrollment or demographic data for specifi c aptitude programs.29
The district could not give us data on comprehensive gifted programs as a matter of district policy.30
District o� cials estimate that a little over a third of all CPS students identifi ed as gifted are housed in
these two types of program.31
This data collection di� culty is signifi cant because it seems likely that nobody actually knows the total demographic makeup of CPS’ gifted schools and programs. Moreover, specifi c aptitude and comprehensive gifted admissions are determined by assessments that may vary from school to school.
Figure 6 shows the disparities in CPS school and program demographics based on the data One Chance
Illinois received from the district.32
Figure 6
The largest disparities exist for low-income students and Hispanic students. Chicago Public Schools is
82 percent low-income, so even though low-income students comprise 60 percent of the sample, they
are still underrepresented. The gross underrepresentation of Hispanic students is particularly distressing
and confusing because Chicago Public Schools runs three schools for English Language Learners.
These schools are overwhelmingly attended by Hispanic students.
We hypothesize that these disparities occur because CPS parents must opt to have their child tested for entrance into gifted programs. That barrier, combined with the dense application process, inhibits disadvantaged families, who often have less time and institutional knowledge, from seeking admissions to gifted options.
29. Information obtained via special request.
30. Ibid.
31. Ibid.
32. All results are statistically signifi cant. Margin of error for the sample is .22%.
G&T 25.46% 0.24% 8.42% 36.15% 0.45% 25.16% 3.73% 60.73%
Whole Sample
46.10% 0.24% 3.73% 38.85`% 0.16% 9.63% 1.30% 82.57%
100%
75%
50%
25%
0%
His
pan
ic
Am
eric
an
Ind
ian
Asi
an
Bla
ck
OP
I
Wh
ite
Tw
o
or
Mo
re
Low
In
com
e
CPS Demographic Disparities
16
33. David Card & Laura Giuliano, “Can Universal Screening Increase the Representation of Low-Income and Minority Students in Gifted Education?”, National Bureau of Economic Research - 2015, http://www.nber.org/papers/w21519
34. Donna Y. Ford, “The Underrepresentation of Minority Students in Gifted Education: Problems and Promises in Recruitment and Retention,” Journal of Special Education - 1998, http://sed.sagepub.com/content/32/1/4.short
Best Practices in Identifi cationWhat steps can be taken - especially in the short term - to ensure that black, Hispanic, and low-income students are properly represented in gifted programs?
Recent research by UC Berkeley’s David Card and University of Miami’s Laura Giuliano shows that universal screening - testing all students in a particular grade for giftedness via a cognitive ability test - may help identify gifted low-income and minority students that might otherwise fall through the cracks.
Examining the impact of introducing this policy in Florida’s Broward County School District during second and fi fth grade, Card and Giuliano found that universal screening boosted low-income and minority participation rates dramatically. With no change in the minimum standards for the county’s gifted program, universal screening led to a 180 percent increase in the gifted rate among all disadvantaged students, with a 130 percent increase for Hispanic students and an 80 percent increase for black students.33
Card and Giuliano’s study isn’t the only one to fi nd these results. Numerous studies by other gifted education experts, like Donna Y. Ford, show that universal screening is a great fi rst step in identifying low-income and minority students who would have otherwise not been referred to gifted programs.34
Additionally, districts should set score ranges on ability and achievement tests at local norms, rather than national or international norms. Doing so ensures that students that would otherwise not be identifi ed as gifted are eligible for gifted programming. Setting them di� erently for subgroups - or at the school level - can be benefi cial too, though it may require teachers to catch students up-to-speed before they enter gifted classes.
Until teacher referral can become a reliable process free from subjectivity, districts should eliminate its use in their gifted identifi cation process. Too often, it disqualifi es low-income or minority students that have high scores on ability and/or achievement tests from participating in gifted programs. The same goes for parent advocacy. A policy that requires parents to tell school districts that their child is gifted will automatically disadvantage low-income and minority students, whose parents often don’t have the time, resources, or institutional knowledge to navigate the gifted education system.
In the long run, the development of more holistic identifi cation policies, increased teacher professional development in gifted identifi cation, and the hiring of more highly qualifi ed teachers of color, will ensure that more gifted low-income and minority students are taking advantage of gifted programming.

17
Further ResearchWhile we can begin to draw conclusions about low-income and minority participation in gifted programs from observational studies like ours, further research is required to support more comprehensive, rigorous, and nuanced analysis.
First, greater clarity is needed to di� erentiate between gifted and accelerated programs. One district school board member that we spoke to, for example, noted that relying on past academic performance is not a true indicator of giftedness. She argued that a program like the one in her district, which onlytargets high performing students for acceleration in certain subjects, should not be considered a “gifted program.”
We decided to include data for this district and others that may have not have “true” gifted programs. We made this decision because a race, class, or gender disparity in any sort of selective program is worth reporting. Moreover, poor identifi cation methods might be the only di� erence between some “accelerated programs” technically qualifying as “gifted programs.” Therefore, we felt that “accelerated programs” that were reported as “gifted programs” by district o� cials were well within the scope of this paper. Still, more research is needed to determine the exact number of accelerated programs versus the exact number of programs that technically qualify as gifted.
Second, research should determine the availability of gifted programs statewide. Due to the limited scope of this paper, and its focus on district identifi cation policies and low-income and minority under-enrollment in gifted programs, it only briefl y touched on the availability of gifted programs across Illinois. There is a high likelihood that school districts that used to have gifted programs no longer do. Further research will likely show - because they disproportionately attend schools that rely on state education funding - that a majority of low-income and minority students statewide attend schools without gifted programs. Since studies show that gifted students benefi t from gifted programming, this is concerning. Additionally, a survey should be conducted to determine the potential impact of gifted and talented funding on program availability.
Third, under-enrollment research should extend to accelerated courses in high school. We received some feedback from gifted coordinators at unit districts that low-income and minority under-enrollment was occurring in honors and Advanced Placement classes as well as in gifted programs. Unfortunately, this report only looks at elementary school gifted programs. If research in Illinois on the under-enrollment of low-income and minority students in accelerated high school courses refl ects other national studies, it is likely to fi nd that these students are less likely to be enrolled in these courses, even holding previous achievement constant.35
35. College Board, “The 10th Annual AP Report to the Nation - State Supplement: Illinois”, http://media.collegeboard.com/digitalServices/pdf/ap/rtn/10th-annual/10th-annual-ap-report-state-supplement-illinois.pdf
18
Fourth, research is needed to develop policies that could increase the number of high-quality minority teachers in Illinois. Grissom and Redding’s demonstration that students of color are more likely to be identifi ed by teachers of color indicates that a more diverse teacher workforce could be part of the solution.
Lastly, further research should include additional controls whenever possible. Race, income, and gender may all a� ect a student’s likelihood of being admitted to gifted programs. Factors like parental education, a student’s prior achievement, or preschool attendance may also change a student’s chance of being identifi ed. Intervention policies to address the achievement gap are di� erent than those that address identifi cation defi cits. Policymakers would benefi t from knowing the degree to which both issues contribute to the disparity in gifted programs.

19
District HispanicAmerican
IndianAsian Black OPI White
Two or More
Gender Income
Total -17.55% -0.08% 8.90% -7.47% 0.09% 14.42% 1.01% -0.60% -24.07%
Alton CUSD 11
-2.55% 0.66% 0.93% -19.69% 21.65% -0.95% 3.18% -28.92%
Aurora West USD 129
-21.53% 1.82% -5.91% 24.97% 0.65% -24.41%
Barrington CUSD 220
-10.24% 15.28% -0.98% -4.89% 0.94% -11.43%
Batavia USD 101 -7.34% -0.19% 3.98% -2.64% -0.12% 8.23% -1.93% -17.00%
CCSD 93 -20.21% 0.89% 2.52% -6.15% 18.99% 4.06% -9.01% -25.84%
Champaign CUSD 4 -6.60% 27.15% -23.70% -0.11% 3.70% -42.32%
Cicero SD 99 5.89% -1.62% -0.16% -1.77% -3.75% -0.10% -4.16% -2.93%
City of Chicago 299 -20.64% 4.70% -2.71% 0.29% 15.53% 2.43% 0.58% -21.83%
Cook County SD 130 -18.42% -0.24% 1.66% -9.76% 28.05% -1.30% 3.19% -35.12%
Crystal Lake CCSD 47
-14.41% 2.29% -1.25% 12.98% 1.49% -21.30%
Danville CCSD 118 -3.89% -0.35% -23.09% 0.62% 34.18% -7.26% 4.21% -44.77%
Downers Grove GSD 58
-8.42% -0.20% 3.83% -3.14% 6.41% 1.53% -2.06% -9.13%
Edwardsville CUSD 7
-1.38% 0.41% 1.67% -1.72% -0.24% -1.53% 2.79% -17.49%
Elmhurst SD 205 6.06%
Glenview CCSD 34 -12.33% 3.97% -1.32% -0.19% 9.29% 0.71% -18.86%
Harlem UD 122 -0.44% 5.97% -4.86% 5.65% -5.91% -19.71%
Appendix A - Illinois School District Disparities

20
District HispanicAmerican
IndianAsian Black OPI White
Two or More
Gender Income
Indian Prairie CUSD 204 - Elementary
-7.60% -0.19% 26.45% -7.71% -0.06% -11.12% 2.60% -12.72%
Indian Prairie CUSD 204 - Math
-8.76% -0.19% 35.19% -8.15% -0.06% -17.36% -0.67% -6.68% -11.13%
Indian Prairie CUSD 204 – Reading
-8.38% -0.19% 26.07% -7.29% -0.06% -9.77% 0.58% 1.26% -11.17%
Kaneland CUSD 302 -7.33% -0.29% -2.48% -1.68% 14.73% -2.91% 2.83% -16.59%
Kankakee SD 111 -8.15% 0.24% 1.25% -11.37% 19.30% -1.26% -1.92% -22.87%
Lake Zurich CUSD 95
-4.77% 10.99% -0.53% -3.24% -1.78% -8.36% -11.92%
Maywood-Melrose Park-Broadview 89
5.30%
McLean County USD 5
-2.38% 0.15% 7.42% -9.67% -0.15% 6.44% -1.80% -2.69% -28.75%
Naperville CUSD 203
-7.01% 15.78% -3.96% -5.25% 0.52% -1.38% 2.19%
New Lenox SD 122 -2.12% -0.25% 0.65% -0.89% -0.17% 3.49% -0.72% -2.44% -5.45%
Oak Park ESD 97 -7.35% 4.07% -14.49% 15.90% 1.94% 2.18% -14.48%
Orland SD 135 -7.08% 2.51% -2.76% 7.22% -14.50%
Oswego CUSD 308 -11.19% 4.51% -5.09% -0.06% 13.16% -1.39%
Palatine CCSD 15 -35.01% -0.24% 39.70% -3.12% 0.14% -2.39% -36.15%
Park Ridge CCSD 64 -2.89% 0.19% 1.13% -0.71% -0.29% 2.10% -2.77% -3.74%
Peoria SD 150 -0.46% 3.23% -26.59% -0.20% 29.63% -5.58% 3.78% -34.74%
Plainfi eld SD 202 -11.00% 4.89% -6.43% 0.06% 11.08% 1.33% -1.96% -15.55%
Appendix A (continued)

21
District HispanicAmerican
IndianAsian Black OPI White
Two or More
Gender Income
Rock Island SD 41 -8.19% -0.17% -3.95% -24.80% -0.17% 40.91% -3.64% -61.06%
Schaumburg CCSD 54
-19.78% 16.27% -5.34% 0.11% 7.85% 0.83% 3.72% -18.50%
SD 45 DuPage County
-10.43% -0.51% 17.07% -7.13% -0.23% 5.09% -3.86% -46.48%
SD U-46 -13.68% -0.56% 13.68% -4.19% -0.04% 5.40% -0.60% -3.47% -18.39%
St Charles CUSD 303
-8.23% 0.20% 5.16% -0.73% 6.02% -2.38% -5.37% -7.36%
Waukegan CUSD 60 -6.18% 1.00% 2.41% -6.62% -0.13% 9.32% -3.70% -1.64%
West Chicago ESD 33
-39.11% 11.93% -1.95% 28.92% -16.73%
Wheeling CCSD 21 -29.85% 0.37% 4.62% -0.98% 24.48% 1.45% 8.53% -29.99%
Wilmette SD 39 -4.78% 0.31% 9.54% -0.52% -10.91% 2.06% -9.22% -2.52%
Woodland CCSD 50 -20.98% -0.30% 8.56% -5.74% 19.01% -24.44%
Woodstock CUSD 200
-25.60% -0.15% 1.89% -2.10% 24.81% 1.25% -3.36% -32.24%
Yorkville CUSD 115 -9.95% 1.56% -3.53% 14.83% -2.72% 2.56%
Appendix A (continued)