report 17 – period july 2013 - home | nz transport agency · work package july aug sep oct ......
TRANSCRIPT

Waterview Connection Project (CA3466):
Auckland Council Monthly Environmental Report Report 17 – Period July 2013
Document 025-RPT-02394
31 August 2013

July 2013 Environmental Report
AC Monthly Report July 2013.docx Page 1 31 August 2013
1. Introduction
To meet reporting requirements for the Waterview Connection, a monthly report will be prepared and sent to AC in the 2nd week of the following month.
This report sets out the reporting requirements for the Waterview Connection for the period July 2013.
2. Resource Consents
Appendix A provides a table of all the consents triggered by works to date.
3. Construction Works - June until September
The table below outlines the construction works carried out in July and an indicative programme which shows the anticipated works in the coming 3 months until 31st October 2013.
South Work Package July Aug Sep Oct
Dominion Road to Maioro St
Install Traffic Management Install erosion and sediment controls and site establishment Bulk earthworks Drainage installation, service relocations and ground improvements
Maioro St to Richardson Road
Drainage installation Construct cycleway (including earthworks)
Construct CTKS Noise wall Richardson Rd bridge services and finishing works Construct soil nail walls at 903 retaining wall Construct Retaining Wall 901 Subgrade preparation and pavements installation – Northbound
Richardson
Rd to Oakley Creek
Construct Oakley Creek bridge & aqueduct (SW Culvert) Construct tunnel spoil building incl sheet piling, bored piling and conc works Construct TP10 pond at rear of Richardson Rd tavern Construct Oakley Creek pedestrian bridge No.3 Subgrade prep & pavements installation- southbound alignment Construct soil nail walls at 903 retaining wall Drainage Installation
Oakley Creek
Bridge to cut in Southern Approach Trench (SAT)
Branch 9 Hendon sewer realignment
Construct haul roads from Oakley Creek to SAT Hendon field converted to carpark and laydown area Hendon Footbridge Approach Ramp

July 2013 Environmental Report
AC Monthly Report July 2013.docx Page 2 31 August 2013
SAT cut to CY9 Bulk excavation of East Coast Bays material from SAT
Construct drainage in SAT Construct SAT Sump Subgrade preparation and pavements in SAT Construct TBM launching platform Construct CY9 & 10 laydown, crane platform, pond & buildings Hendon Swale (East of the SAT) Construct Haul Roads outside the SAT Drainage installation outside of the SAT Construct segment yard platform in SAT TBM mobilisation to site TBM assembly and commissioning Constuct spoil conveyor system TBM Tunnelling
North Work Package July Aug Sep Oct
Northern Approach Trench (NAT) & surrounds to cut
Construct NAT props NAT excavation Stage 1 Construct ground anchors, proprs, whalers at Stage 1 excavation level NAT stage 2 excavation
Northern Fill Embankment, North Oakley Creek inlet (the Bog) & Ramp 2
Lay structural fill for northern fill embankment Construct permanent piles at Ramps 1, 3 and 4 Construct columns and cross heads at Ramps 1, 3 and 4 Construct staging and access platforms at Ramp 2 Construct permanent piles at Ramp 2
Great North Road Interchange
Site establishment, haul road & environmental controls in Tear Drop Construct permanent piles in the Tear Drop Construct columns and cross heads in Tear Drop Construct traffic diversion at Great North Road off ramp (Big Flint) Site establishment, haul road & environmental controls in Spear Head Construct permanent piles in Spear head Construct abutment, columns and cross heads in Spear head Drill permanent piles in Splinter east Site establishment in the Little Flint Site establishment, haul Rd, envl controls & services in Machete
Carrington Rd Interchange works
Construct Retaining Wall 502 (Eastern Splinter) Tree Clearance at Retaining Wall 603
4. Site Meetings and Inspections
Auckland Council’s Erosion and Sediment Control officer visited the Southern and Northern Area works on the 4th, 11th and 18th of July.

July 2013 Environmental Report
AC Monthly Report July 2013.docx Page 3 31 August 2013
5. Environmental Monitoring
5.1. Tree Management
Grant Sirl, Arborist – Arbor Advice Ltd (the Project Arborist) has provided the following report for the amenity trees affected by the works;
Amenity Tree
Species Location Health Fencing Observations/recommended actions
South 522 Zelkova Within compound
area adjacent north side Richardson Rd
Good Good Protective fencing – steel pipe/ mesh free standing panels in good condition. No materials within exclusion zone around the tree.
698 Group various native species
Alan Wood Reserve, access via Methuen Rd
Good/ fair Sound barrier wall appropriate protection
Remaining trees of group 698 appear in reasonable health/ condition. Numerous native tree seedlings establishing. Weeds, e.g. Chinese privet & woolly nightshade to be removed.
Grove various species
Small Kowhai, Karamu etc
Located southwest side of Alan Wood Reserve.
Good Good No actions required.
512, 513 to
516 and 519
groups
Titoki, Prunus, Totara, Tarata, Karaka & Cabbage
Near western end of Alan Wood Reserve adjacent basketball court. (outside designation).
Good/Fair Sth Totara
in good condition. Rootplate mulched. Northern
tree in fair condition.
Good - southern side of work site alignment. Good – Northern Side of work site alignment, with the exception of section of fencing around northern side Totara tree.
Southern side protective fencing erected/sturdy and in good condition. Fencing seperates site area from vegetation. Northern Totara tree – Need to remove pipes away from tree and erect steel pipe/netting fence around tree. Secure site fence excludes remaining trees/vegetation in Park area from construction.
North
N/A Pohutukawa Waterview Primary School, outside designation.
Good Sound barrier wall erected eastern side of tree.
Epicormic growth establishing upon reduced stems following tree cutting regime. No actions required at this stage.
811 Titoki Herdman Street – Street trees
Good/Fair Tree in designation to be preserved if possible. Noise wall protects tree.
No actions required. Tree located outside construction zone.
#247 Pohutukawa Waterview Reserve
Fair Tree relocated to within Reserve
Tree status appears reasonably good following tree relocation procedure. No actions required.
272, 276, 300, 315, 330, 729, 730, 732
Totara Robinia x6 Robinia Robinia x4 Robinia x3 Robinia x3 Karaka Karaka
Located within Star Mill archaeological area
Good/Fair Trees in archaeological area have been fenced off from construction zone.
Regular maintenance required.
Minor damage evident to side crown strucuture of Totara tree (#272), torn branches presumably caused by a digger. Minor remedial work required.

July 2013 Environmental Report
AC Monthly Report July 2013.docx Page 4 31 August 2013
#’s 804, 805, 806, 807,
808 & 809
Kowhai, Silver Birch, Kawaka, Kahikatea, Bottlebrush, Lancewood & Cabbage tree
23/25 Waterbank Crescent
Majority Good
Trees retained around remaining dwellings & excluded from work area with steel mesh security fencing
Weed infestation occurring where previous under-storey vegetation has been cleared.
5.2. Noise and Vibration Monitoring
Noise monitoring has been undertaken for new plant and activities since commencement of construction in January 2012 to assess levels against noise predictions (as per the Construction Noise and Vibration Management Plan) and confirm compliance with the project noise criteria, specifically as relates to Consent conditions CNV.2 for noise, CNV.3 for noise from air blast and CNV.4 and CNV.5 for vibration.
No blasting was carried out during July. The focus for noise and vibration during July has been assessment of extended works required outside normal working hours (07.30 – 18.00hrs Monday to Saturdays) and submission of Site Specific Noise management Plans (SSNMPs) to Council.This was particularly in relation to works at the Southern approach trench in anticipation of the TBM delivery in July and service works at Great North Road Interchange (GNRI). Noise monitoring was also undertaken in the Northern area during the night-time gas relocation works to assess noise levels under SSNMP#35 and during day-time trenching works near St Francis School. The table below shows the maximum measured noise levels, which confirmed that noise limits would be met at nearest receivers in relation to construction activities.
Date/time Measurement location Activity Noise level LAeq (dB)
Noise level LAMax (dB)
12/07/13 10am
St Francis School 1m from façade Classroom 10, nearest to GNR/SH16 Background noise from traffic
Great North Road/SH16 prior to start of service works
60.6 68.6
St Francis School internal measurement in Classroom 10, nearest to GNR/SH16 41.9 52.5
29/07/13 10:53am
St Francis School 1m from façade Classroom 10, nearest to service works
Trenching works approx. 50m from school (excavator unloading into truck)
62.5 (internal
43.8) 76.9
Project noise criteria: internal noise for licensed educational facilities 45
23/07/13 10.55pm
At receiver 1243 Great North Road, near Carrington Road/Pt Chev Road junction
Gas relocation trenching works (under SSNMP# 35). Sawcutting concrete, excavator, generator & truck.
59.2 64.7
29/07/13 10.38pm
Near receiver 1255 Great North Road (Works 15m from measurement position, 20m from receiver), near Carrington Road/Pt Chev Road junction
Gas relocation trenching works (under SSNMP# 35). Backfilling underway, excavator and plate compactor.
62.1 73.6
Project noise criteria Northern area (20.00-06.30) (Apply at residential property) 60 75
Table showing Measured Noise Levels

July 2013 Environmental Report
AC Monthly Report July 2013.docx Page 5 31 August 2013
The SSNMP submitted and approved in July 2013 under consent condition CNV13 are listed below.
SSNMP Ref Date of Works
Night Works or
Day Works
Location of Works
Description of
Works
Works start time
Works end time
Date SSNMP
Submitted to Council
Date SSNMP Approved by
Council
Works now
complete
SSNMP#24 Rev3
25/07/13-04/08/13
Night Richardson Road Final paving works
Richardson Road
8pm 5am 17/07/2013 26/07/2013 yes
SSNMP#29Rev3
07/07/13-28/07/13
Sunday SAT carriageway & Hendon Avenue
backfill works
9am 5.30pm
1/07/2013 5/07/2013 yes
SSNMP#29Rev4
28/07/13&04/08/13
Sunday SAT carriageway & Hendon Avenue
backfill works
9am 5.30pm
19/07/2013 22/07/2013 yes
SSNMP#30Rev3
03/07/2013-19/07/2013
Night SAT carriageway near Richardson
Rd/Maioro
Paving works 6pm 6am 25/06/2013 5/07/2013 yes
SSNMP#32
22/07/2013-29/07/2013
Night SH20 to SAT TBM assembly area
TBM Delivery 2am 6am 28/06/2013 9/07/2013 yes
SSNMP#32 Rev2
30/07/2013-04/08/2014
Night SH20 to SAT TBM assembly area
TBM Delivery 2am 6am 19/07/2013 22/07/2013 yes
SSNMP#33
29/07/2013 - 29/10/2013
Night SAT TBM assembly area
TBM Assembly
7pm 7am 1/07/2013 9/07/2013 no
SSNMP#34
14/07/2013 Night Great North Road Interchange
Tree clearance
(splinter east & machete)
10pm 4am 8/07/2013 10/07/2013 yes
SSNMP#35
21/07-15/08/13
Night Great North Road Interchange
Gas relocation
9pm 4am 15/07/2013 19/07/2013 no
SSNMP#35 Rev2
21/07-15/08/13
Night Great North Road Interchange
Gas relocation
9pm 4am 24/07/2013 6/08/2013 no
SSNMP#36
4/08/2013 Night Great North Road Interchange
Paving works GNR
westbound offramp
8.30 pm
5am 24/07/2013 6/08/2013 yes
5.3. Air Quality Monitoring
Two Total Suspended Particulate (TSP) analysers and one met mast are required in the Southern Area (Sector 9) and one TSP analyser with met mast is required in the Northern Portal Area (sector 7) under consent conditions AQ16 and AQ17.
Two E-BAM TSP monitors are currently co-located at a site in Hendon Park considered representative of relevant exposure to the Southern area main works. The Northern Portal area E-BAM is located outside the Waterview School grounds.
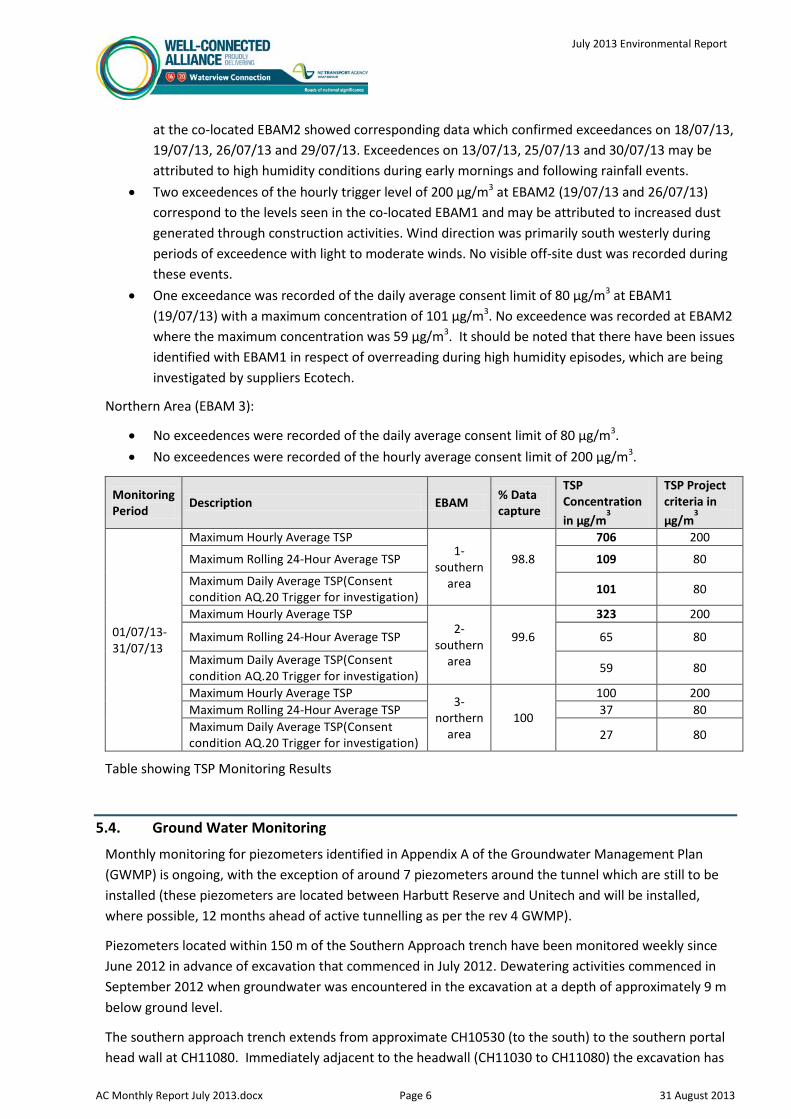
E-BAM results for July show levels below the project consent limit for TSP with the exception of the following episodes.
Southern Area (EBAMs 1 &2):
• Exceedences of the hourly trigger level of 200 µg/m3 at EBAM1 (13/07/13, 18/07/13, 19/07/13, 25/07/13, 26/07/13, 29/07/13 and 30/07/13) with a maximum concentration of 706 µg/m3. Data
July 2013 Environmental Report
AC Monthly Report July 2013.docx Page 6 31 August 2013
at the co-located EBAM2 showed corresponding data which confirmed exceedances on 18/07/13, 19/07/13, 26/07/13 and 29/07/13. Exceedences on 13/07/13, 25/07/13 and 30/07/13 may be attributed to high humidity conditions during early mornings and following rainfall events.
• Two exceedences of the hourly trigger level of 200 µg/m3 at EBAM2 (19/07/13 and 26/07/13) correspond to the levels seen in the co-located EBAM1 and may be attributed to increased dust generated through construction activities. Wind direction was primarily south westerly during periods of exceedence with light to moderate winds. No visible off-site dust was recorded during these events.
• One exceedance was recorded of the daily average consent limit of 80 µg/m3 at EBAM1 (19/07/13) with a maximum concentration of 101 µg/m3. No exceedence was recorded at EBAM2 where the maximum concentration was 59 µg/m3. It should be noted that there have been issues identified with EBAM1 in respect of overreading during high humidity episodes, which are being investigated by suppliers Ecotech.
Northern Area (EBAM 3):
• No exceedences were recorded of the daily average consent limit of 80 µg/m3. • No exceedences were recorded of the hourly average consent limit of 200 µg/m3.
Monitoring Period Description EBAM % Data
capture
TSP Concentration in µg/m
3
TSP Project criteria in µg/m
3
01/07/13-31/07/13
Maximum Hourly Average TSP 1-
southern area
98.8
706 200
Maximum Rolling 24-Hour Average TSP 109 80
Maximum Daily Average TSP(Consent condition AQ.20 Trigger for investigation) 101 80
Maximum Hourly Average TSP 2-
southern area
99.6
323 200
Maximum Rolling 24-Hour Average TSP 65 80
Maximum Daily Average TSP(Consent condition AQ.20 Trigger for investigation) 59 80
Maximum Hourly Average TSP 3-
northern area
100
100 200 Maximum Rolling 24-Hour Average TSP 37 80 Maximum Daily Average TSP(Consent condition AQ.20 Trigger for investigation) 27 80
Table showing TSP Monitoring Results
5.4. Ground Water Monitoring
Monthly monitoring for piezometers identified in Appendix A of the Groundwater Management Plan (GWMP) is ongoing, with the exception of around 7 piezometers around the tunnel which are still to be installed (these piezometers are located between Harbutt Reserve and Unitech and will be installed, where possible, 12 months ahead of active tunnelling as per the rev 4 GWMP).
Piezometers located within 150 m of the Southern Approach trench have been monitored weekly since June 2012 in advance of excavation that commenced in July 2012. Dewatering activities commenced in September 2012 when groundwater was encountered in the excavation at a depth of approximately 9 m below ground level.
The southern approach trench extends from approximate CH10530 (to the south) to the southern portal head wall at CH11080. Immediately adjacent to the headwall (CH11030 to CH11080) the excavation has

July 2013 Environmental Report
AC Monthly Report July 2013.docx Page 7 31 August 2013
reached full depth and the base slab has been poured. Between CH10530 and CH11030 the excavation has also largely reached full depth. Dewatering via sump pumps in the excavation and below the base slab is occurring between chainages 10600 and 11080. Accordingly groundwater levels in piezometers within 150 m of the Southern Approach Trench are monitored twice-weekly in accordance with condition G.6.
CH11000 to CH11080
Piezometers in very close proximity to the trench (i.e. less than 50 m distance, and inside the construction zone) have recorded a drop in groundwater level of up to 18.5 m in the East Coast Bays Formation (ECBF), 6.8 m in the Tauranga Group alluvium and up to 5 m in the basalt (Figure 1). Drawdown in the basalt and alluvium reached near steady state conditions in March / April 2013, and in most piezometers the groundwater level rose in mid-April and remained steady as a result of normal to above normal rainfall through to the end of June. Since the end of June a slight drop (generally of less than 0.5 m) in levels has again been seen as a result of low rainfall in July (33% of normal, Figure 2).
Drawdown in the ECBF appears to have reached a pseudo-steady state (excluding seasonal fluctuations) now that excavation has reached maximum depth. As the base slab is drained we do not expect to see any recovery of these water levels; however as maximum depth has been reached we do not expect that there will be any further significant drawdown.
Beyond the construction zone (> 50 m distance) piezometers in this areas have recorded a drop in groundwater level of up to 4 m in the basalt and alluvium, and up to 6 m in the ECBF. Nine (9) piezometers have recorded a groundwater level below alert trigger level. Several of the affected piezometers (BH519, BH1106, BH1108 and SPZ005) are located along the axis (and deepest part) of the basalt lobe that is intersected by the Southern Approach Trench excavation. The zone of greater drawdown along this axis likely reflects a fracture, of low storativity, that runs through the middle of the basalt lobe. As outlined in previous reports there is 8 m to 20 m of incompressible basalt in this area so the potential for damaging consolidation settlement is considered to be very low. An alarm trigger level for bores in this area was recommended (December 2012) to be 8 m (i.e. allowing sufficient time to warn against drawdown approaching that which might result in settlement exceeding the consented levels); groundwater levels at the end of July remain well above this level. As with those piezometers in close to the excavation, we are not anticipating any further drawdown in the groundwater level at these locations.

July 2013 Environmental Report
AC Monthly Report July 2013.docx Page 8 31 August 2013
Figure 1: Drawdown vs. Distance Graph for SAT (to July 2013)
The other affected piezometers (BH503, BH525, DH825, DH826 and DH829) are clustered around the Southern portal head wall. Within these piezometers only the groundwater level within the ECBF is below an alert level. Groundwater levels in the basalt and alluvium remain above trigger levels and have been steady or rising since April 2013; hence the potential for damaging consolidation settlement is considered to be very low.
In light of the alert level exceedances we have increased the number and extent of wells being monitored twice-weekly (the majority of which are continuously logged) and groundwater level data will continue to be reviewed every other day until the pressure has fully stabilised. In addition we are currently reviewing the groundwater level and settlement predictions for this area to confirm that there is no increase in the potential for effects resulting from this drawdown.
Markers within 100 m of the area (generally located on control sections K, L and M) have been specifically reviewed, with movement being within the trigger levels for these areas.
CH10500 to CH11000
Within this zone excavation has reached maximum depth and groundwater levels in all piezometers have been steady or rising since the end of March 2013. Groundwater levels in this area are all above trigger levels.
Seasonal Trends
Monitoring confirms that recorded drawdowns continue to be exacerbated by the exceptionally low rainfall that fell in Auckland in January, February, March, and again in July. Total rainfall for the Jan to March period was less than 30 % of normal rainfall, and during the month of January less than 10 % of normal rainfall was recorded. This followed a dry period between September 2012 and December 2012; during this time although total rainfall was 50 % to 80% of normal, most of the rain fell in discrete storm

July 2013 Environmental Report
AC Monthly Report July 2013.docx Page 9 31 August 2013
events therefore it can be expected that a significant proportion of the rain would have discharged to stormwater without recharging the aquifers.
Rainfall in April, May and June 2013 has been above normal (around 600 mm over these months compared to an expected norm of around 350 mm). More than 60 % of piezometers around the SAT have recorded a trend in rising groundwater levels since April 16th when the first significant rainfall of the year fell (see example of BH1106, Figure 2 below). This trend is also seen in monitoring of piezometers in the wider Project area. The rise is generally of the order of 0.5 m to 2.0 m (since mid-April) however in some areas the groundwater level has risen by more than 3.0 m.
Figure 2: Groundwater Levels in BH1106 compared to daily rainfall
Rainfall in July was 33 % of normal and has resulted in a drop in water level of typically between 0.1 m and 0.5 m in all piezometers in the Southern Area (see example in Figure 2).
5.5. Oakley Creek Flow Monitoring
Six (6) continuous flow monitoring stations have been established by NIWA in Oakley Creek. The data from these are updated and reviewed on a monthly basis to investigate whether the construction works have had any effect on base flows in Oakley Creek. Five gauges were installed in late 2010, with the sixth (Cradock Street footbridge) installed in September 2009.
Comparison of records for April to July 2013 show recorded flows generally increasing at gauges the further downstream, from the sewer bridge to Waterview Downs. This is consistent with increasing contribution from the aquifer and increasing catchment moving downstream.
The next full review of creek flows will in reported in September 2013.

July 2013 Environmental Report
AC Monthly Report July 2013.docx Page 10 31 August 2013
5.6. Settlement Monitoring
Monthly monitoring of framework ground settlement markers identified in the Settlement Effects Management Plan (SEMP rev3), and additional markers installed since that time continues.
Framework markers within 150 m of the Southern Approach Trench have been being monitored weekly since June 2012 (Figure 5). Surveyed ground levels have been relatively static since the end of May (following a rise in ground level though April & May in response to rainfall and seasonal swelling). The majority of markers continue to show movement within +/- 3 mm of their adopted pre-construction minimum (i.e. within the accuracy of the survey). Five markers (M9, X12, X23a, Z154 and Z161) have shown movement in the range of 4 mm to 10 mm however this level of movement is still well within adopted trigger levels.
Figure 3: Ground movement for markers within 150 m of the Southern Approach Trench (to July 2013)
For two marks (Z154 and Z155) downward movements of up to 10 mm have been recorded in June and early July approaching the alert trigger level of 10 mm at this location. These markers have shown some recovery in late July / early August. These markers form a differential pair (in accordance with condition S.17); differential settlement between the two markers is calculated to be flatter than 1/25,000 therefore the potential for any adverse effects is considered to be negligible and all other markers in this area have indicated movement of less than 3 mm to 5 mm (well within trigger levels). Regardless we will continue to monitor these markers.
Differential movement between markers is flatter than 1 in 4000 in all other areas and remains well below trigger levels, as are assessed building damage categories in the area. Markers will continue to be monitored and reviewed weekly.
The Alliance has recently installed 7 No. fixed deep survey benchmarks to supplement the 2nd order LINZ benchmarks to which this survey data has historically been tied. The LINZ benchmarks are shallow and

July 2013 Environmental Report
AC Monthly Report July 2013.docx Page 11 31 August 2013
likely to have been moving seasonally and therefore the seasonal range may have been underestimated. Once the benchmarks have been fully established and incorporated into the survey loops, the Alliance will be reviewing the seasonal range of movement around the Northern Area and tunnels. This will be presented in the updated SEMP.
5.7. Ecological, Water Quality Monitoring & Sediment Quality Monitoring: Oakley Creek
Construction phase water quality monitoring has been carried out monthly, as required by consent conditions, with the most recent routine monitoring carried out on 24 July 2013. Results for January 2012 to July 2013 are summarised in Figures 5 to 10 below. Full laboratory transcripts are available on request.
Figure 5: Turbidity data from sites WR1-WR5 Figure 6: pH data from sites WR1-WR5
Figure 7: TSS data from sites WR1-WR5 Figure 8: Total copper data from sites WR1-WR5
0
5
10
15
20
25
30
35
Janu
ary
Febr
uary
Mar
ch
Apri
l
May
June July
Augu
st
Sept
embe
r
Oct
ober
Nove
mbe
r
Dece
mbe
r
Janu
ary
Febr
uary
Mar
ch
Apri
l
May
June July
Turb
idity
(NTU
)
Month sampled in 2012 - 2013
WR1
WR2
WR3
WR4
WR5
0
2
4
6
8
10
12
Janu
ary
Febr
uary
Mar
ch
Apri
l
May
June July
Augu
st
Sept
embe
r
Oct
ober
Nove
mbe
r
Dece
mbe
r
Janu
ary
Febr
uary
Mar
ch
Apri
l
May
June July
pH u
nits
Month sampled in 2012 - 2013
WR1
WR2
WR3
WR4
WR5
0
2
4
6
8
10
12
Janu
ary
Febr
uary
Mar
ch
Apri
l
May
June July
Augu
st
Sept
embe
r
Oct
ober
Nove
mbe
r
Dece
mbe
r
Janu
ary
Febr
uary
Mar
ch
Apri
l
May
June July
pH u
nits
Month sampled in 2012 - 2013
WR1
WR2
WR3
WR4
WR5
0
0.002
0.004
0.006
0.008
0.01
0.012
0.014
0.016
0.018
Janu
ary
Febr
uary
Mar
ch
Apri
l
May
June July
Augu
st
Sept
embe
r
Oct
ober
Nove
mbe
r
Dece
mbe
r
Janu
ary
Febr
uary
Mar
ch
Apri
l
May
June July
Tota
l Cop
per (
g/m
3 )
Month sampled in 2012 - 2013
WR1
WR2
WR3
WR4
WR5

July 2013 Environmental Report
AC Monthly Report July 2013.docx Page 12 31 August 2013
Figure 9: Total lead data from sites WR1-WR5 Figure 10: Total zinc data from sites WR1-WR5
The July routine monitoring data are summarised as follows:
• Turbidity and suspended solids results were comparable to June results and to baseline data collected prior to the commencement of construction.
• pH was near-neutral at all sites and well within the accepted range that is representative of good water quality (pH 6-9).
• Concentrations of metals (copper, lead, zinc) were slightly elevated at sites upstream of the WCA works area (WR5 and WR4), but were lower at the sites downstream of the works, and generally within the pre-construction baseline range. This indicates that there area activities in the Oakley Creek catchment upstream of (and unrelated to) the WCA site, which were the cause of elevated metal concentrations, but that the spatial extent of any adverse effects was limited.
An incident involving the accidental discharge of water from the stormwater pond near CY11 occurred on the night of 17/18 July. The results of follow-up water quality and ecological monitoring to date have been reported to Council separately. Further ecological monitoring is being carried out in August, and the results of this monitoring will also be reported to Council as soon as data are available.
Six-monthly sediment quality monitoring was carried out at WR1 to WR5 on 24 July and the resultant laboratory report is attached. The majority of analytes were below the analytical detection limit (ADL). Those notably above the ADL were metals (copper, lead and zinc). However, concentrations of all three metals were higher at the sites upstream of the WCA than at the downstream sites, indicating that the works have had no adverse effects on sediment quality in Oakley Creek.
Six-monthly ecological and stream channel profile monitoring was completed in May, as required by consent conditions. The resulting report has recently been submitted to Council. The next 6 monthly monitoring exercise will take place in September, ahead of the 2013-2014 earthworks season.
Fortnightly monitoring of significant vegetation, including geraniums, continues to be carried out. All translocation of geranium plants from areas that will be affected by the works has been completed. This has included successful transplanting into the Diversion C area. The annual lizard and geranium relocation report will be issued to Counil before the end of September.
0
0.001
0.002
0.003
0.004
0.005
0.006
Janu
ary
Febr
uary
Mar
ch
Apri
l
May
June July
Augu
st
Sept
embe
r
Oct
ober
Nove
mbe
r
Dece
mbe
r
Janu
ary
Febr
uary
Mar
ch
Apri
l
May
June July
Tota
l Lea
d (g
/m3 )
Month sampled in 2012 - 2013
WR1
WR2
WR3
WR4
WR5
0
0.01
0.02
0.03
0.04
0.05
0.06
0.07
0.08
0.09
0.1
Janu
ary
Febr
uary
Mar
ch
Apri
l
May
June July
Augu
st
Sept
embe
r
Oct
ober
Nove
mbe
r
Dece
mbe
r
Janu
ary
Febr
uary
Mar
ch
Apri
l
May
June July
Tota
l Zin
c (g
/m3 )
Month sampled in 2012 - 2013
WR1
WR2
WR3
WR4
WR5

July 2013 Environmental Report
AC Monthly Report July 2013.docx Page 13 31 August 2013
5.8. Contaminated Soil Monitoring
5.8.1. Site monitoring
Slight hydrocarbon odours were reportedly encountered during the drilling of Ramp 2 Pile 7 on 4 July 2013. This pile is located between Oakley Creek and SH16. A site inspection was carried out by the contaminated land specialist the same day. During the site visit, soil from the pile which had been stockpiled separately close to the drilling works, did not contain any sheen, hydrocarbon odours and/or staining. It was observed that the drill site was close to an area which had been asphalted the day before. Two soil samples were collected from two stockpiles (no more than 10 m3 each) and were sent for analytical testing for total petroleum hydrocarbon (TPH) and polyaromatic hydrocarbon (PAH). The testing results show that TPH and PAH concentrations are all below laboratory detection limit. A copy of the laboratory transcript is provided in Appendix C.
On 22 July 2013, rainbow sheen was reported on the surface of water that had ponded around the works to the north of Oakley Creek and south of SH16. Orange stained material was present around the ponded water. The water appears to be seeping from above a rock outcrop and around an existing nova coil drain. A photograph provided by site personnel is provided below. A site inspection was carried out the next day by a contaminated land specialist. Site personnel had removed the rainbow sheen from the water using absorbent pads. No hydrocarbon odours were evident in the soil and water around the area. The absence of hydrocarbon odours and presence of orange staining indicate that the sheen is most likely to be associated to iron sheen. A sample of the orange stained material was taken for testing for iron. The laboratory report confirmed the presence of elevated iron concentrations (300,000 mg/kg). A copy of the report is provided in Appendix C. Site engineers and environmental personnel are continuing to monitor this area for presence of sheens, however, none have been observed since then.

July 2013 Environmental Report
AC Monthly Report July 2013.docx Page 14 31 August 2013
5.8.2. Soil disposal
Tables 5.1 and 5.2 below provide a breakdown of the soil volumes removed from the project area in July. A total of approximately 34,400 tonnes of soil and rock were removed from the project that month. All rock was excavated from the southern area of the project and was removed to Wiri Cleanfill for processing.
About 90% of the soil was removed to Wiri Cleanfill and comprised surplus soils from earthworks relating to the excavation of East Coast Bays Formation (ECBF) at the Southern and Northern Approach Trenches. Relatively small volumes were removed to other disposal sites as indicated below:
• About 1,200 tonnes to Three Kings Managed Fill from near surface soils from the southern and northern areas relating to establishment works around CY9 and CY10 in the south and Great North Interchange (GNRI) Ramp works in the north.
• About 1,700 tonnes to Ridge Road fill site mainly from near surface soils from establishment works around CY9 and CY10 in the south and Ramp 3 Pile 4 of Great North Interchange (GNRI) Ramp works in the north.
• About 500 tonnes of asbestos contaminated soil to Redvale Landfill from earthworks between chainages 1100 and 1300.
• About 700 tonnes of East Coast Bays Formation soils from the southern approach trench excavation to the Onehunga Foreshore Project.
Earthworks requiring contaminated soil monitoring and off-site disposal in August are summarised below.
• Between Maioro Interchange and Richardson Road for motorway alignment and retaining wall construction to Wiri cleanfill/Onehunga Foreshore Project (up to September 2013).
• CY9, CY10 and CY11 (spoil building) formation works for disposal to both Wiri cleanfill and/or Three Kings Managed Fill (up to September 2013).
• Works within Southern Approach Trench for disposal to Wiri cleanfill/Onehunga Foreshore Project (up to September 2013).
• Northern portal trench excavation for disposal to Wiri Cleanfill (up to 2014).
• Establishment works, utility diversion and and piling works for the GNRI works for disposal to either Wiri cleanfill, Three Kings Managed Fill, Ridge Road, Greenmount Landfill and/or Redvale Landfill (up to 2014).

July 2013 Environmental Report
AC Monthly Report July 2013.docx Page 15 31 August 2013
Table 5.1: Disposal location and approximate quantity of soil disposed off site from the south in July 2013
Notes:
* Estimated volume based on a soil density of 1.7 tonnes/m3 ^ Estimated volume based on 19 tonnes for a articulated truck
Volume Volume Volume Volume Volume Volume Volume VolumeTonnes tonnes m3 * Tonnes tonnes m3 * Tonnes tonnes m3 * Tonnes tonnes m3 * Tonnes tonnes m3 * Tonnes tonnes m3 * Tonnes ^ tonnes m3 * Tonnes ^ tonnes m3 *
1-Jul-13 0 167212.93 98361 541.82 73921.71 43483 0.00 12051.2 7089 0.00 272441.08 160259 729.78 248247.592 146028 307.80 8483.64 4990 608.00 15,571 9,159 0.00 2,299 1,3522-Jul-13 0 167212.93 98361 110.68 74032.39 43548 0.00 12051.2 7089 0.00 272441.08 160259 0.00 248247.592 146028 0.00 8483.64 4990 0.00 15,571 9,159 0.00 2,299 1,3523-Jul-13 0 167212.93 98361 327.92 74249.63 43676 0.00 12051.2 7089 0.00 272441.08 160259 0.00 248247.592 146028 147.12 8630.76 5077 0.00 15,571 9,159 0.00 2,299 1,3524-Jul-13 0 167212.93 98361 0.00 73921.71 43483 0.00 12051.2 7089 0.00 272441.08 160259 0.00 248247.592 146028 0.00 8483.64 4990 456.00 16,027 9,428 0.00 2,299 1,3525-Jul-13 0 167212.93 98361 0.00 73921.71 43483 0.00 12051.2 7089 0.00 272441.08 160259 0.00 248247.592 146028 50.54 8534.18 5020 0.00 16,027 9,428 0.00 2,299 1,3526-Jul-13 0 167212.93 98361 0.00 73921.71 43483 0.00 12051.2 7089 0.00 272441.08 160259 618.80 248866.392 146392 0.00 8534.18 5020 0.00 16,027 9,428 0.00 2,299 1,3528-Jul-13 0 167212.93 98361 0.00 73921.71 43483 0.00 12051.2 7089 0.00 272441.08 160259 568.72 249435.112 146727 0.00 8534.18 5020 0.00 16,027 9,428 0.00 2,299 1,3529-Jul-13 0 167212.93 98361 0.00 73921.71 43483 0.00 12051.2 7089 0.00 272441.08 160259 447.62 249882.732 146990 0.00 8534.18 5020 589.00 16,616 9,774 0.00 2,299 1,352
10-Jul-13 0 167212.93 98361 0.00 73921.71 43483 0.00 12051.2 7089 0.00 272441.08 160259 504.36 250387.092 147287 0.00 8534.18 5020 0.00 16,616 9,774.12 0.00 2,299.00 1,352.3511-Jul-13 0 167212.93 98361 0.00 73921.71 43483 0.00 12051.2 7089 0.00 272441.08 160259 243.90 250630.992 147430 0.00 8534.18 5020 0.00 16,616 9,774.12 0.00 2,299.00 1,352.3512-Jul-13 0 167212.93 98361 0.00 73921.71 43483 0.00 12051.2 7089 0.00 272441.08 160259 256.76 250887.752 147581 0.00 8534.18 5020 0.00 16,616 9,774.12 0.00 2,299.00 1,352.3515-Jul-13 0 167212.93 98361 0.00 73921.71 43483 0.00 12051.2 7089 0.00 272441.08 160259 1081.86 251969.612 148217 0.00 8534.18 5020 0.00 16,616 9,774.12 0.00 2,299.00 1,352.3516-Jul-13 0 167212.93 98361 0.00 73921.71 43483 0.00 12051.2 7089 0.00 272441.08 160259 1529.50 253499.112 149117 0.00 8534.18 5020 0.00 16,616 9,774.12 0.00 2,299.00 1,352.3517-Jul-13 0 167212.93 98361 0.00 73921.71 43483 0.00 12051.2 7089 0.00 272441.08 160259 912.44 254411.552 149654 0.00 8534.18 5020 0.00 16,616 9,774.12 0.00 2,299.00 1,352.3519-Jul-13 0 167212.93 98361 0.00 73921.71 43483 0.00 12051.2 7089 0.00 272441.08 160259 1234.78 255646.332 150380 0.00 8534.18 5020 0.00 16,616 9,774.12 0.00 2,299.00 1,352.3520-Jul-13 0 167212.93 98361 0.00 73921.71 43483 0.00 12051.2 7089 0.00 272441.08 160259 26.06 255672.392 150396 0.00 8534.18 5020 0.00 16,616 9,774.12 0.00 2,299.00 1,352.3522-Jul-13 0 167212.93 98361 0.00 73921.71 43483 0.00 12051.2 7089 24.16 272465.24 160274 937.32 256609.712 150947 0.00 8534.18 5020 0.00 16,616 9,774.12 0.00 2,299.00 1,352.3523-Jul-13 0 167212.93 98361 0.00 73921.71 43483 0.00 12051.2 7089 308.07 272773.31 160455 25.78 256635.492 150962 0.00 8534.18 5020 0.00 16,616 9,774.12 0.00 2,299.00 1,352.3524-Jul-13 0 167212.93 98361 0.00 73921.71 43483 0.00 12051.2 7089 0.00 272773.31 160455 1346.26 257981.752 151754 0.00 8534.18 5020 0.00 16,616 9,774.12 0.00 2,299.00 1,352.3525-Jul-13 0 167212.93 98361 0.00 73921.71 43483 0.00 12051.2 7089 0.00 272773.31 160455 1250.13 259231.882 152489 0.00 8534.18 5020 0.00 16,616 9,774.12 0.00 2,299.00 1,352.3526-Jul-13 0 167212.93 98361 0.00 73921.71 43483 0.00 12051.2 7089 0.00 272773.31 160455 979.56 260211.442 153066 0.00 8534.18 5020 0.00 16,616 9,774.12 0.00 2,299.00 1,352.3529-Jul-13 0 167212.93 98361 0.00 73921.71 43483 0.00 12051.2 7089 0.00 272465.24 160274 1350.40 257960.112 151741 0.00 8534.18 5020 0.00 16,616 9,774.12 0.00 2,299.00 1,352.3530-Jul-13 0 167212.93 98361 0.00 73921.71 43483 0.00 12051.2 7089 0.00 272465.24 160274 1274.40 257884.112 151697 0.00 8534.18 5020 0.00 16,616 9,774.12 0.00 2,299.00 1,352.3531-Jul-13 0 167212.93 98361 0.00 73921.71 43483 0.00 12051.2 7089 0.00 272773.31 160455 25.16 256660.652 150977 0.00 8534.18 5020 0.00 16,616 9,774.12 703.00 3,002.00 1,765.88
Month of July 0 980.42 0.00 332.23 15,343.59 505.46 1,653.00 703.00
Onehunga ForeshoreCummulative total
Ridge Road Disposal SiteCummulative total
Redvale Disposal SiteCummulative total
Wiri Disposal Site (Cleanfill)Cummulative total
DateCummulative total
Puketutu Managed Fill SiteCummulative total
Wiri Disposal Site (Rock)Three Kings Managed Fill SiteCummulative total
Greenmount Managed Fill SiteCummulative total

July 2013 Environmental Report
AC Monthly Report July 2013.docx Page 16 31 August 2013
Table 5.2: Disposal location and approximate quantity of soil disposed off site from the north in July 2013
Notes:
* Estimated volume based on a soil density of 1.7 tonnes/m3 ^ Estimated volume based on 19 tonnes for a articulated truck
Volume Volume Volume Volume Volume Volume VolumeTonnes tonnes m3 * Tonnes tonnes m3 * Tonnes tonnes m3 * Tonnes tonnes m3 * Tonnes tonnes m3 * Tonnes tonnes m3 * Tonnes ^ tonnes m3 *
1-Jul-13 0 0 0 0.00 14,282.50 8401 0.00 0 0 0.00 0 0 812.78 85028.62 50017 0.00 941.38 554 0.00 0 02-Jul-13 0 0 0 0.00 14,282.50 8401 0.00 0 0 0.00 0 0 1007.38 86036.00 50609 0.00 941.38 554 0.00 0 03-Jul-13 0 0 0 0.00 14282.5 8401 0.00 0 0 0.00 0 0 1056.40 87092.4 51231 0.00 941.38 554 0.00 0 04-Jul-13 0 0 0 0.00 14282.5 8401 0.00 0 0 0.00 0 0 167.45 87259.85 51329 0.00 941.38 554 0.00 0 05-Jul-13 0 0 0 30.42 14312.92 8419 0.00 0 0 0.00 0 0 602.94 87862.79 51684 0.00 941.38 554 38.00 38 226-Jul-13 0 0 0 0.00 14312.92 8419 0.00 0 0 0.00 0 0 398.00 88260.79 51918 0.00 941.38 554 0.00 38 228-Jul-13 0 0 0 18.80 14331.72 8430 0.00 0 0 0.00 0 0 895.88 89156.67 52445 0.00 941.38 554 0.00 38 229-Jul-13 0 0 0 12.78 14344.5 8438 0.00 0 0 0.00 0 0 543.60 89700.27 52765 0.00 941.38 554 0.00 38 22
10-Jul-13 0 0 0 0.00 14344.5 8438 0.00 0 0 0.00 0 0 365.60 90065.87 52980 0.00 941.38 554 0.00 38 2211-Jul-13 0 0 0 30.98 14375.48 8456 0.00 0 0 0.00 0 0 988.92 91054.79 53562 0.00 941.38 554 0.00 38 2212-Jul-13 0 0 0 0.00 14375.48 8456 0.00 0 0 0.00 0 0 928.70 91983.49 54108 0.00 941.38 554 0.00 38 2213-Jul-13 0 0 0 0.00 14375.48 8456 0.00 0 0 0.00 0 0 667.62 92651.11 54501 0.00 941.38 554 0.00 38 2215-Jul-13 0 0 0 32.44 14407.92 8475 0.00 0 0 0.00 0 0 1468.04 94119.15 55364 0.00 941.38 554 0.00 38 2216-Jul-13 0 0 0 10.18 14418.1 8481 0.00 0 0 0.00 0 0 778.48 94897.63 55822 0.00 941.38 554 0.00 38 2217-Jul-13 0 0 0 0.00 14418.1 8481 0.00 0 0 0.00 0 0 318.14 95215.77 56009 0.00 941.38 554 0.00 38 2219-Jul-13 0 0 0 0.00 14418.1 8481 0.00 0 0 0.00 0 0 340.26 95556.03 56209 0.00 941.38 554 0.00 38 2220-Jul-13 0 0 0 0.00 14418.1 8481 0.00 0 0 0.00 0 0 85.62 95641.65 56260 0.00 941.38 554 0.00 38 2222-Jul-13 0 0 0 0.00 14418.1 8481 0.00 0 0 0.00 0 0 807.78 96449.43 56735 0.00 941.38 554 0.00 38 2223-Jul-13 0 0 0 9.30 14427.4 8487 0.00 0 0 0.00 0 0 613.90 97063.33 57096 0.00 941.38 554 0.00 38 2224-Jul-13 0 0 0 17.20 14435.3 8491 0.00 0 0 0.00 0 0 463.68 96913.11 57008 0.00 941.38 554 0.00 38 2225-Jul-13 0 0 0 0.00 14418.1 8481 0.00 0 0 0.00 0 0 404.42 96853.85 56973 0.00 941.38 554 0.00 38 2226-Jul-13 0 0 0 0.00 14418.1 8481 0.00 0 0 0.00 0 0 231.96 96681.39 56871 0.00 941.38 554 0.00 38 2229-Jul-13 0 0 0 0.00 14418.1 8481 0.00 0 0 0.00 0 0 629.50 97078.93 57105 0.00 941.38 554 0.00 38 2230-Jul-13 0 0 0 0.00 14418.1 8481 0.00 0 0 0.00 0 0 0.00 96449.43 56735 0.00 941.38 554 0.00 38 2231-Jul-13 0 0 0 29.28 14456.68 8504 0.00 0 0 0.00 0 0 29.76 97093.09 57114 0.00 941.38 554 0.00 38 22
Month of July 0 191.38 0.00 0.00 14,606.81 0.00 38.00
Ridge Road Disposal SiteCummulative total
Date
Puketutu Managed Fill Site Three Kings Managed Fill Site Greenmount Managed Fill Site Wiri Disposal Site (Rock) Redvale Disposal SiteCummulative total Cummulative total Cummulative total Cummulative total Cummulative total Cummulative total
Wiri Disposal Site (Cleanfill)

July 2013 Environmental Report
AC Monthly Report July 2013.docx Page 17 31 August 2013
5.9. Erosion and Sediment Control Monitoring
Erosion and sediment control devices constructed this month, were as-built and certified in accordance with the approved CESCPs and consent conditions, with documentation sent to Auckland Council as follows: • CESCP No. 103, SSF at ramp 2 gulley and west of bog 31st July 2013
CESCP No. 32, Hendon Footbridge was submitted to Auckland Council during the month of July. CESCP Nos. 107, 108, GNRI ‘Spearhead’ and ‘Big Flint’ were approved by Auckland Council during July. CESCP Nos. 109, 110, GNRI ‘Little Flint’ and ‘Splinter East’ were submitted to and approved by Auckland Council during July. Regular daily visits to areas of the site have been made during July by a member of the Erosion and Sediment Control Team.
Pumping monitoring records based on the site wide pumping and dewatering plan are recorded and maintained onsite, and are being submitted to Council for file records.
5.10. Archaeological monitoring
General archaeological monitoring of the works has been undertaken by the Project Archaeologists from Clough and Associates in accordance with consent conditions and the following New Zealand Historic Place Trust (NZHPT) Authorities:
• 2013/174 - General Authority for earthworks in association with Stage 3 Northern Portal Works.
• 2013/518 - General Authority for earthworks in association with Stage 4 Great North Road Interchange Works.
6. Stakeholder Management
6.1. Stakeholders – selected local liaison activity
Southern Works area (Owairaka / New Windsor)
• Ongoing discussions with local residents in and around Hendon Avenue/ Stewart Road and site staff in relation to truck movements and arrival of TBM.
• Meeting with Christ the King Church and School to discuss noise walls and and changes relating to Richardson Road, in particular night works/ closures/ weekend work.
• Providing notification to Sandringham Road residents in relation to arrival of TBM. • Meeting Wesley Primary to discuss assistance with road works project. • Providing updates in relation to Richardson Tavern to using the land at the back of the Tavern for a
stormwater pond. Agreement reached in relation to tree/ shrub removal. • Letterbox drop/ meeting Richardson Road residents to discuss night closure works, footpath/
pavement reinstatement and realignment of Richardson Road.

July 2013 Environmental Report
AC Monthly Report July 2013.docx Page 18 31 August 2013
• Ongoing discussions with Mt Roskill Business Association, advising of project work and providing update.
• Updating Barrymore Residents in relation to site access via Barrymore. • Meeting with The Police to provide a general update/ confirm key local contacts • Fortnightly distribution of Construction Updates to local residents / businesses / cafes / libraries /
community centres / banks. Northern sector community liaison
• Meetings with residents in Pt Chevalier around the upcoming works and post construction urban design
• Letterbox drop/meeting/ongoing liaison with Montrose Street residents to discuss night works, for service relocation on Great North Road, which required relocation of residenst from six properties into a hotel over a period of two weeks.
• Door knocking/letterdrop with Great North Road residents to discuss settlement monitoing around their property and get approval to do so
• Meeting with principal of St Francis Catholic School, Pt Chevalier to discuss service relocation works near the school and to discuss what presentation WCA can do with the school pupils over the coming months.
• Advertised weekly timeslots at the Waterview Coffee Project • Ongoing facilitation of school noise wall mural design with Waterview School kids • Presetation to two Year 12 Geography classes at Rutherford High School, Te Atatu on the ‘How the
opinion of the Waterview community has changed since the project started’. • Presenations on the Tunnel Boring Machine to Gladstone Primary School • Participation in Waterview Neighbourhood Safety Panel group • Fortnightly distribution of Construction Updates to local residents / businesses / cafes / libraries /
community centres. General
• TBM naming and facebook page launch • Art installation and TBM arrival event • Media coverage on arrival of TBM and project progress • Info centre establishment works • Time-lapse and live-feed camera installation / operation
Commentary
July saw us dramatically raise the profile of the project to a regional and national audience, through a number of innovative campaigns around the Tunnel Boring Machine, now known as Alice.
The naming competition culminated with a presentation to 9-year-old Branden Hall at Everglade School, whose suggested name (and reason) was chosen by readers of Stuff. The naming was featured across Auckland through the Suburban newspaper network and also on Stuff, promoting the project’s website for more information. Short news stories also featured in the Sunday Star Times and NZ Herald.
The announcement of the name was complemented by the launch of the Alice’s own Facebook page. Deliberately less formal than the project’s website, this has provided the opportunity for us to interact with people who are interested in the project, and also massively increase our audience. In the first week online

July 2013 Environmental Report
AC Monthly Report July 2013.docx Page 19 31 August 2013
we had reached over 8000 people through the Facebook site, with the 500+ people who “liked” us sharing videos, photos and news with their own friends. An AliceTBM twitter site has also been set up, but we are holding back on using this until assembly is complete.
The TBM arrival was marked with an installation at the port of Te Haerenga Hou – the 14m diameter Maori artwork designed by Ngati Whatua Ta moko artist, Graham Tipene. This seems to have been really well received, with the 1000 postcards of the artwork provided to the Waterfront kiosk needing to be replenished within the first five days. In addition to strengthening the project’s relationship with Ngati Whatua, the artwork also received praise from Auckland Council’s urban design department, as a “fantastic story telling opportunity for the Waterview Connection and a great way to enliven Quay Street!”
The arrival and subsequent transportation to site of the TBM gave rise to positive media coverage on both mainstream TV news channels, with TVNZ and TV3 visits to site accommodated.
The time-lapse cameras at both the south and north ends are in place, providing excellent quality footage of progress. The footage has been used by the news media as part of their broadcasts on the project. We have also established a live feed to the TBM assembly, and are working on getting this hooked up to key portals around the site, including the offices, construction yards and the 4 Valonia visitor centre, which is due to open in September.
6.2. Queries, Concerns and Complaints
In summary, 14 complaints were received;
• 7 Traffic – One regarding acces to cycleway/overbridge from northbound lanes at GNRI; a member of the public reportied unsafe driving of Waterview construction staff (JFC) on public roads; a request for a clearway on Richardson Road before Maioro Street Interchange to eleviate congestion at peak times; query about Unsigned detour for closure from Great North Road westbound SH16 and barriers on Richardson Road.
• 6 Environmental – Night noise was reported at various addresses adjacent to the site: Montrose Street, Pt Chev and GNRI and crane noise was reported along Hendon Ave near SAP10.
• 1 complaint was received disputing ACH Report on house in Methuen Road.

July 2013 Environmental Report
AC Monthly Report July 2013.docx Page 20 31 August 2013
Appendix A
Consents Triggered by Works to Date

July 2013 Environmental Report
AC Monthly Report July 2013.docx Page 21 31 August 2013
Consent Description Trigger Great North Road Interchange Works EPA 10/2.005 For a new designation, SH16, SH20 and Great North underpass –
NOR4. A new surface designation for construction, operation and maintenance of new interchange and structures associated with tunnel operation, including ventilation building and stack, mitigation and local road access, taking in new pieces of land, and allowing for construction and operation of ramps, stormwater, wetland ponds, ancillary safety and operational services and maintenance, temporary works, vegetation removal and restoration, relocation of services, works on north-western cycleway, landscaping and planting, open space restoration and restoration of the Oakley Inlet heritage area.
Works within the designation.
EPA 10/2.010 (ARC: 38313)
Land Disturbance (Sectors 1 – 9). Earthworks and roading / tracking/ trenching during construction - within and outside the Sediment Control Protection Area (includes the associated discharge of sediment laden water as a discharge consent)
Earthworks and roading /tracking/trenching during construction. Land disturbance activities.
EPA 10/2.025 (ARC 38329)
Discharge to air – Roadworks Discharge to air associated with roadworks (including dust emission)
General activities associated with road construction (Construction).
EPA 10/2.035 (ARC: 38340)
Erection of Temporary Structures in the CMA (Sector 5) This consent relates to the erection of temporary (construction) structures within the CMA including piers for ramps, conveyor structures, temporary staging platforms, stormwater discharge devices and other consequential activities such as disturbance and/or vegetation removal. In CPA 1 – Oakley Creek Inlet.
Erecting temporary structures within the Oakley Creek Inlet for the construction of the Great North Interchange Ramps (Construction)
EPA 10/2.041 (ARC: 38345)
Disturbance of Foreshore and Seabed (Sectors 4 and 5) Disturbance of the foreshore and seabed during construction including vegetation removal and mangrove removal, use of motor vehicles, disturbance of sediment, temporary structures and erosion and sediment control measures including, in CPA1, to access existing lawful structures, but excluding the disturbance consequential to activities under which other consents are sought. This includes disturbance for activities such as machinery access to temporary construction areas in the CMA (e.g. the estuary, Causeway Bridges, pedestrian/cycle way facility, coastal protection works, rock revetment / batters, and temporary staging platforms within Oakley Inlet etc).
Disturbance of the foreshore and seabed to access existing lawful structures during construction of the Great North Road Interchange which is not covered by other consents
EPA 10/2.042 (ARC: 38346)
Disturbance of Foreshore and Seabed (Sectors 4 and 5) The use of motor vehicles in any CPA.
Using motor vehicles in the CPA during construction of the Great North Road Interchange ramps
EPA 10/2.046 (ARC: 38350)
Discharge of Contaminants (Sectors 1 through 5) This consent relates to the discharge of contaminants during construction into the CMA and discharge of contaminants in stormwater flows during construction along Sectors 1 – 5, including point source and sheet flow discharges.
Discharge of contaminants during construction of the Great North Road Interchange Ramps and from stormwater associated with impermeable surfaces (Ramps) during construction
EPA 10/2.047 (ARC: 38351)
Discharge of Contaminants (Sectors 1 through to 5) This consent relates to the discharge of contaminants during construction into the CMA and discharge of stormwater during construction along Sectors 1 – 5, including point source and sheet flow discharges
Discharge of contaminants during construction and stormwater from impermeable surfaces (Ramps) during construction

July 2013 Environmental Report
AC Monthly Report July 2013.docx Page 22 31 August 2013
EPA 10/2.056 (ARC: 38361)
Occupation of CMA (Sectors 4 and 5) Occupation of the CMA for construction works in, on and over the seabed and foreshore for Project works including stormwater outfall and ancillary works in General Management Area.
Temporary occupation of the CMA during construction of the Great North Road Interchange Ramps and associated works
EPA 10/2.021 (ARC: 36474)
Discharge of contaminants to land or water from contaminated land (that is undergoing disturbance or remediation) (Sectors 1, 3, 5, 6, 7, 8 and 9) It cannot be determined at this time whether compliance with Rule 5.5.44 can be met and so, in an abundance of caution consent is being sought under Rule 5.5.44A.
Disturbance or remediation of contaminated land during construction
Northern Portal Works EPA 10/2.005 For a new designation, SH16, SH20 and Great North underpass –
NOR4. A new surface designation for construction, operation and maintenance of new interchange and structures associated with tunnel operation, including ventilation building and stack, mitigation and local road access, taking in new pieces of land, and allowing for construction and operation of ramps, stormwater, wetland ponds, ancillary safety and operational services and maintenance, temporary works, vegetation removal and restoration, relocation of services, works on north-western cycleway, landscaping and planting, open space restoration and restoration of the Oakley Inlet heritage area.
Works within the designation.
EPA 10/2.010 (ARC: 38313)
Land Disturbance (Sectors 1 – 9). Earthworks and roading / tracking/ trenching during construction - within and outside the Sediment Control Protection Area (includes the associated discharge of sediment laden water as a discharge consent)
Earthworks and roading /tracking/trenching during construction. Land disturbance activities.
EPA 10/2.017 (ARC: 38322)
Discharge to the Water Table of a Road (Sectors 1 – 9). Diversion and discharge of stormwater from impermeable areas into the water table of a road.
Discharges from the sealed carriageway.
EPA10/2.018 (ARC: 38323)
Discharge of Water from Roads (Sectors 1– 9). Diversion and discharge of stormwater into any watercourse for the purpose of draining roads.
Discharges from the sealed carriageway.
EPA 10/2.019 (ARC 38324)
Stormwater Discharge - Network Operator Activities within Urban Areas (Sectors 5, 7, 9). Stormwater discharge onto land and water. This includes discharges into Oakley Creek, Meola Stream & Pixie Stream.
Discharges to the permanent stormwater system.
EPA 10/2.025 (ARC 38329)
Discharge to Air – Roadworks. Taking precautionary approach consent is sought for discharges to air associated with roadworks (including dust emissions).
General activities associated with the road construction.
Southern Area Enabling Works EPA 10/2.008 (ACC: Plan Modification 202)
For new designation, SH20, southern tunnel portal to Maioro Street Interchange – NOR7.
Works within the designation.
EPA 10/2.010 (ARC: 38313)
Land use consents – Land disturbance (Sectors 1-9 inclusive). Earthworks and roading/tracking/trenching during construction. Land disturbance activities.
EPA 10/2.021 (ARC 36474)
Discharge of contaminants to land or water from contaminated land (that is undergoing disturbance or remediation) (Sectors 1, 3, 5, 6, 7, 8 and 9).
Land disturbance activities within areas potentially containing contaminated material.
EPA 10/2.025 (ARC: 38329)
Discharge to air – Roadworks. Discharge to air associated with roadworks (including dust emission).
General activities associated with the road construction.

July 2013 Environmental Report
AC Monthly Report July 2013.docx Page 23 31 August 2013
Additional consents obtained:
Consent Description Trigger R/LUC/2011/4677 35 Valonia Street, New Windsor
Land use consent for temporary carpark and accessway, associated earthworks and tree removal, and works within the dripline of protected trees.
Construction of temporary and permanent playing field outside designation requiring resource consents in accordance with Auckland City District Plan.
ARC: 39983 35 Valonia Street, New Windsor
Landuse consent for earthworks. Earthworks for carpark and playing field outside the designation requiring resource consents in accordance with Auckland City District Plan.
R/LUC/2012/991 Alan Wood Reserve
Removal and works within the dripline of protected trees associated with the relocation of a wastewater pipe (the Hendon Sewer) within Alan Wood Reserve.
Works for the Watercare sewer relocation located outside the designation requiring resource consents in accordance with Auckland City District Plan.
R/LUC/2012/1879 6 Barrymore Road, Owairaka
Land use consent for removal of eight protected trees associated with the creation of pedestrian and vehicular accesses within Barrymore Road Reserve.
Access to CY11 from Barrymore Road involving removal of trees outside the designation requiring resource consents in accordance with Auckland City District Plan.
Southern Area Main Works EPA 10/2.008 (ACC: Plan Modification 202)
For new designation, SH20, southern tunnel portal to Maioro Street Interchange – NOR7.
Works within the designation.
EPA 10/2.010 (ARC: 38313)
Land use consents – Land disturbance (Sectors 1-9 inclusive) Earthworks and roading/tracking/trenching during construction.
Land disturbance activities.
EPA 10/2.001 (ARC: 38316)
Use, Erection or Placement of New Structures (Sector 9). For a stormwater pipe underneath Oakley Creek as a permanent stream.
Construction of the Hendon Park Culvert.
EPA 10/2.012 (ARC: 38317)
Use, Erection or Placement of New Structures (Sector 9). For bridges constructed over Oakley Creek – includes Hendon Park Bridge and cycleway bridges.
Construction of Oakley Creek Bridge, Hendon Pedestrian Bridge and cycle and pedestrian bridges.
EPA 10/2.014 (ARC: 38319)
Use, Erection or Placement of New Structures (Sector 9). Stormwater outfall structures for Oakley Creek.
Diversion and relocation of existing stormwater outfalls.
EPA 10/2.016 (ARC:38321)
Disturbance of bed of lakes and rivers (Sector 9). Excavation, drilling or tunnelling or other disturbance for the purpose of diverting a permanent river or stream to a new course.
Diversion of three sections of the Oakley Creek.
EPA 10/2.017 (ARC: 38322)
Discharge to the water table of a road (Sectors 1-9). Diversion and discharge of stormwater from impermeable areas into the water table of a road.
Discharges from the sealed carriageway.
EPA10/2.018 (ARC: 38323)
Discharge to the water table of a road (Sectors 1-9). Diversion and discharge of stormwater into any watercourse for the purpose of draining roads.
EPA 10/2.019 (ARC 38324)
Stormwater discharge – Network Operator activities within urban areas (Sectors 1, 3, 5, 6, 7, 9). Stormwater discharge onto land or water.
Discharges to the permanent stormwater system.
EPA 10/2.025 (ARC 38329)
Discharge to air – Roadworks Discharge to air associated with roadworks (including dust emission)
General activities associated with the road construction.
EPA 10/2.027 (ARC: 38330)
Diversion of water other than open coastal water (Sector 9). Structures for diversion of water flows of a floodplain and associated diversion and deposition of material in Sector 9.
EPA 10/2.021 (ARC:36474)
Discharge of contaminants to land or water from contaminated land (that is undergoing. disturbance or remediation) (Sectors 1, 3, 5, 6, 7, 8 and 9).
Land disturbance activities within areas potentially containing contaminated material.

July 2013 Environmental Report
AC Monthly Report July 2013.docx Page 24 31 August 2013
Consent Description Trigger ARC: 40097 and 40166 53 Ormiston Road, East Tamaki
Land use consents for land modification and land disturbance for construction of a Pre-Cast Facility.
Earthworks for East Tamaki Pre-Cast Yard requiring resource consents in accordance with Manukau City District Plan.
R/LUC/2012/2168 142-160A Stoddard Rd, Mount Roskill
Land use consent for the construction and use of a new Project Site Office at Stoddard Rd, including associated earthworks and parking.
Construction of project office requiring resource consents in accordance with Auckland City District Plan.
ARC: 40316 - Stormwater ARC: 40318 - Industrial & Trade; ARC: 40319 - Air Discharge; and ARC:40627 – Landuse 53 Ormiston Road, East Tamaki
Integrated Land use consents (District & Regional) for the diversion and discharge of stormwater, the discharge of contaminants from an industrial or trade activity, the discharge of contaminants to air and parking and vehicular access infringements associated with the construction and operation of a Pre-Cast concrete facility at 53 Ormiston Road, East Tamaki.
Construction and operation of the East Tamaki Pre-Cast Yard requiring resource consents in accordance with Manukau City District Plan and Auckland Regional Plan: Air, Land and Water.
R/LUC/2012/2568 Installation of above ground duct containing power, water and telecommunication services
Installation of an above ground duct containing power, water and telecommunication services to provide services to Construction Yard 11
Works for the required above ground cable to provide services to CY11 located outside the designation requiring resource consents in accordance with Auckland City District Plan.
R/LUC/2012/4601 Valonia Sportsfield Lights 35 Valonia Street, New Windsor
To construct a sportsfield lighting column, with 2000 watt medium beam lights mounted on a 16.5 metre high pole, at Valonia Sports Field (Field No.2).
Construction of a sportsfield lighting column at Valonia sportsfield, located outside the Project designation, requires discretionary activity resource consent in accordance with the Auckland City Isthmus District Plan.
R/TRC/2013/709 Richardson Rd Tree Removal
The removal of a generally protected tree located within the road reserve of Richardson Road associated with the shared pedestrian and cycleway.
The removal of a generally protected tree located within the road reserve of Richardson Road and outside the Project designation, requires Restricted Discretionary Consent in accordance with the Auckland City Isthmus District Plan.
R/LUC/2013/646 CY11 Carpark & Storage
CY11 Carpark Extension and Storage, including associated earthworks
Located outside the Project designation the proposal required Restricted controlled consent for earthworks;Discretionary and Restrricted discretionary consent for car parking; and Discretionary consent for the placement of containers under the Auckland City Isthmus District Plan.
ARC: 41436 Stormwater CY11 Carpark & Storage
CY11 Carpark Extension – associated stormwater diversion
Located outside the Project designation the proposal required Controlled activity consent for the diversion and discharge of stormwater (Rule 5.5.2) under the Auckland Regional Plan: Air, Land and Water.
ARC: 41437 Earthworks CY11 Carpark & Storage
CY11 Carpark Extension – associated earthworks
Located outside the Project designation the proposal required Restricted discretionary consent for earthworks under the Auckland Regional Plan: Air, Land and Water.

July 2013 Environmental Report
AC Monthly Report July 2013.docx Page 25 31 August 2013
Consent Description Trigger NZHPT Authority Southern Area Enabling Works
General NZHPT Authority for Earthworks in association with Southern Area Enabling Works
Archaeological Authority required in accordance with Section 12 of the Historic Places Act.
NZHPT Authority Southern Area Main Works
General NZHPT Authority for Earthworks in association with Southern Area Main Works
Archaeological Authority required in accordance with Section 12 of the Historic Places Act.
NZHPT Authority Northern Portal Works
General HPT Authority for Earthworks in association with Northern Portal Works
Archaeological Authority required in accordance with Section 12 of the Historic Places Act.
NZHPT Authority Great North Interchange Works
General HPT Authority for Earthworks in association with Great North Interchange Works
Archaeological Authority required in accordance with Section 14 of the Historic Places Act.

July 2013 Environmental Report
AC Monthly Report July 2013.docx Page 26 31 August 2013
Appendix B
Oakley Creek Sediment Monitoring Results, July 2013

R J Hill Laboratories Limited1 Clyde StreetPrivate Bag 3205Hamilton 3240, New Zealand
+64 7 858 2000+64 7 858 [email protected]
TelFaxEmailWeb
This Laboratory is accredited by International Accreditation New Zealand (IANZ), which represents New Zealand in the InternationalLaboratory Accreditation Cooperation (ILAC). Through the ILAC Mutual Recognition Arrangement (ILAC-MRA) this accreditation isinternationally recognised.The tests reported herein have been performed in accordance with the terms of accreditation, with the exception of tests marked *, whichare not accredited.
A N A L Y S I S R E P O R T Page 1 of 5
Client:Contact: Lean Phuah
C/- Well-Connected AlliancePrivate Bag 76914Manukau Mail CentreAUCKLAND 2241
Well-Connected Alliance Lab No:Date Registered:Date Reported:Quote No:Order No:Client Reference:Submitted By:
115951325-Jul-201306-Aug-20134715020IN1228129.9308C Sjardin
SPv1
Sample Type: SedimentSample Name:
Lab Number:
WR1/E224-Jul-2013 12:00
pm
WR2 24-Jul-201312:25 pm
WR4/E124-Jul-2013 12:05
pm
WR5 24-Jul-20131:30 pm
1159513.2 1159513.4 1159513.6 1159513.8 1159513.10
WR3 24-Jul-201312:40 pm
Individual Tests
g/100g as rcvd 60 79 71 61 45Dry Mattermg/kg dry wt 22 21 3.5 38 152Total Recoverable Coppermg/kg dry wt 53 39 6.3 180 161Total Recoverable Leadmg/kg dry wt 200 270 19.7 430 350Total Recoverable Zinc
Polycyclic Aromatic Hydrocarbons Trace in Soil
mg/kg dry wt 0.007 0.006 < 0.002 < 0.003 0.004Acenaphthenemg/kg dry wt 0.015 0.006 < 0.002 0.008 0.015Acenaphthylenemg/kg dry wt 0.037 0.016 < 0.002 0.014 0.021Anthracenemg/kg dry wt 0.24 0.130 < 0.002 0.181 0.170Benzo[a]anthracenemg/kg dry wt 0.26 0.137 < 0.002 0.171 0.197Benzo[a]pyrene (BAP)mg/kg dry wt 0.34 0.179 < 0.002 0.25 0.31Benzo[b]fluoranthene + Benzo[j]
fluoranthenemg/kg dry wt 0.22 0.110 < 0.002 0.156 0.26Benzo[g,h,i]perylenemg/kg dry wt 0.135 0.069 < 0.002 0.094 0.103Benzo[k]fluoranthenemg/kg dry wt 0.189 0.101 < 0.002 0.153 0.137Chrysenemg/kg dry wt 0.031 0.017 < 0.002 0.022 0.024Dibenzo[a,h]anthracenemg/kg dry wt 0.46 0.22 < 0.002 0.27 0.28Fluoranthenemg/kg dry wt 0.009 0.004 < 0.002 < 0.003 0.007Fluorenemg/kg dry wt 0.20 0.106 < 0.002 0.136 0.164Indeno(1,2,3-c,d)pyrenemg/kg dry wt < 0.012 < 0.010 < 0.010 < 0.011 < 0.015Naphthalenemg/kg dry wt 0.174 0.074 < 0.002 0.061 0.073Phenanthrenemg/kg dry wt 0.46 0.22 < 0.002 0.28 0.31Pyrene
Haloethers Trace in SVOC Soil Samples by GC-MS
mg/kg dry wt < 0.18 < 0.14 < 0.16 < 0.9 < 0.3Bis(2-chloroethoxy) methanemg/kg dry wt < 0.18 < 0.14 < 0.16 < 0.9 < 0.3Bis(2-chloroethyl)ethermg/kg dry wt < 0.18 < 0.14 < 0.16 < 0.9 < 0.3Bis(2-chloroisopropyl)ethermg/kg dry wt < 0.18 < 0.14 < 0.16 < 0.9 < 0.34-Bromophenyl phenyl ethermg/kg dry wt < 0.18 < 0.14 < 0.16 < 0.9 < 0.34-Chlorophenyl phenyl ether
Nitrogen containing compounds Trace in SVOC Soil Samples, GC-MS
mg/kg dry wt < 0.9 < 0.7 < 0.8 < 5 < 1.33,3'-Dichlorobenzidinemg/kg dry wt < 0.4 < 0.3 < 0.4 < 1.8 < 0.52,4-Dinitrotoluenemg/kg dry wt < 0.4 < 0.3 < 0.4 < 1.8 < 0.52,6-Dinitrotoluenemg/kg dry wt < 0.18 < 0.14 < 0.16 < 0.9 < 0.3Nitrobenzenemg/kg dry wt < 0.4 < 0.3 < 0.4 < 1.8 < 0.5N-Nitrosodi-n-propylaminemg/kg dry wt < 0.4 < 0.3 < 0.4 < 1.8 < 0.5N-Nitrosodiphenylamine
Organochlorine Pesticides Trace in SVOC Soil Samples by GC-MS
mg/kg dry wt < 0.18 < 0.14 < 0.16 < 0.9 < 0.3Aldrin

Sample Type: SedimentSample Name:
Lab Number:
WR1/E224-Jul-2013 12:00
pm
WR2 24-Jul-201312:25 pm
WR4/E124-Jul-2013 12:05
pm
WR5 24-Jul-20131:30 pm
1159513.2 1159513.4 1159513.6 1159513.8 1159513.10
WR3 24-Jul-201312:40 pm
Organochlorine Pesticides Trace in SVOC Soil Samples by GC-MS
mg/kg dry wt < 0.18 < 0.14 < 0.16 < 0.9 < 0.3alpha-BHCmg/kg dry wt < 0.18 < 0.14 < 0.16 < 0.9 < 0.3beta-BHCmg/kg dry wt < 0.18 < 0.14 < 0.16 < 0.9 < 0.3delta-BHCmg/kg dry wt < 0.18 < 0.14 < 0.16 < 0.9 < 0.3gamma-BHC (Lindane)mg/kg dry wt < 0.18 < 0.14 < 0.16 < 0.9 < 0.34,4'-DDDmg/kg dry wt < 0.18 < 0.14 < 0.16 < 0.9 < 0.34,4'-DDEmg/kg dry wt < 0.4 < 0.3 < 0.4 < 1.8 < 0.54,4'-DDTmg/kg dry wt < 0.18 < 0.14 < 0.16 < 0.9 < 0.3Dieldrinmg/kg dry wt < 0.4 < 0.3 < 0.4 < 1.8 < 0.5Endosulfan Img/kg dry wt < 0.5 < 0.5 < 0.5 < 1.8 < 0.5Endosulfan IImg/kg dry wt < 0.4 < 0.3 < 0.4 < 1.8 < 0.5Endosulfan sulphatemg/kg dry wt < 0.4 < 0.3 < 0.4 < 1.8 < 0.5Endrinmg/kg dry wt < 0.4 < 0.3 < 0.4 < 1.8 < 0.5Endrin ketonemg/kg dry wt < 0.18 < 0.14 < 0.16 < 0.9 < 0.3Heptachlormg/kg dry wt < 0.18 < 0.14 < 0.16 < 0.9 < 0.3Heptachlor epoxidemg/kg dry wt < 0.18 < 0.14 < 0.16 < 0.9 < 0.3Hexachlorobenzene
Polycyclic Aromatic Hydrocarbons Trace in SVOC Soil Samples
mg/kg dry wt < 0.10 < 0.10 < 0.10 < 0.5 < 0.13Acenaphthenemg/kg dry wt < 0.10 < 0.10 < 0.10 < 0.5 < 0.13Acenaphthylenemg/kg dry wt 0.11 < 0.10 < 0.10 < 0.5 < 0.13Anthracenemg/kg dry wt 0.65 0.19 < 0.10 < 0.5 0.37Benzo[a]anthracenemg/kg dry wt 0.77 0.24 < 0.16 < 0.9 0.5Benzo[a]pyrene (BAP)mg/kg dry wt 0.77 0.26 < 0.16 < 0.9 0.6Benzo[b]fluoranthene + Benzo[j]
fluoranthenemg/kg dry wt 0.53 0.19 < 0.16 < 0.9 0.5Benzo[g,h,i]perylenemg/kg dry wt 0.32 < 0.14 < 0.16 < 0.9 < 0.3Benzo[k]fluoranthenemg/kg dry wt < 0.10 < 0.10 < 0.10 < 0.5 < 0.132-Chloronaphthalenemg/kg dry wt 0.57 0.17 < 0.10 < 0.5 0.34Chrysenemg/kg dry wt < 0.18 < 0.14 < 0.16 < 0.9 < 0.3Dibenzo[a,h]anthracenemg/kg dry wt 1.32 0.37 < 0.10 0.7 0.74Fluoranthenemg/kg dry wt < 0.10 < 0.10 < 0.10 < 0.5 < 0.13Fluorenemg/kg dry wt 0.45 0.16 < 0.16 < 0.9 0.3Indeno(1,2,3-c,d)pyrenemg/kg dry wt < 0.10 < 0.10 < 0.10 < 0.5 < 0.132-Methylnaphthalenemg/kg dry wt < 0.10 < 0.10 < 0.10 < 0.5 < 0.13Naphthalenemg/kg dry wt 0.45 0.12 < 0.10 < 0.5 0.22Phenanthrenemg/kg dry wt 1.25 0.39 < 0.10 0.6 0.79Pyrene
Phenols Trace in SVOC Soil Samples by GC-MS
mg/kg dry wt < 0.5 < 0.5 < 0.5 < 1.8 < 0.54-Chloro-3-methylphenolmg/kg dry wt < 0.2 < 0.2 < 0.2 < 0.9 < 0.32-Chlorophenolmg/kg dry wt < 0.2 < 0.2 < 0.2 < 0.9 < 0.32,4-Dichlorophenolmg/kg dry wt < 0.4 < 0.4 < 0.4 < 0.9 < 0.42,4-Dimethylphenolmg/kg dry wt < 0.4 < 0.4 < 0.4 < 1.8 < 0.53 & 4-Methylphenol (m- + p-
cresol)mg/kg dry wt < 0.2 < 0.2 < 0.2 < 0.9 < 0.32-Methylphenol (o-Cresol)mg/kg dry wt < 0.4 < 0.4 < 0.4 < 1.8 < 0.52-Nitrophenolmg/kg dry wt < 6 < 6 < 6 < 18 < 6Pentachlorophenol (PCP)mg/kg dry wt < 0.4 < 0.3 < 0.4 < 1.8 < 0.5Phenolmg/kg dry wt < 0.4 < 0.3 < 0.4 < 1.8 < 0.52,4,5-Trichlorophenolmg/kg dry wt < 0.4 < 0.3 < 0.4 < 1.8 < 0.52,4,6-Trichlorophenol
Plasticisers Trace in SVOC Soil Samples by GC-MS
mg/kg dry wt 1.6 < 0.6 < 0.7 < 4 11.9Bis(2-ethylhexyl)phthalatemg/kg dry wt < 0.4 < 0.3 < 0.4 < 1.8 1.8Butylbenzylphthalatemg/kg dry wt < 0.2 < 0.2 < 0.2 < 0.9 < 0.3Di(2-ethylhexyl)adipatemg/kg dry wt < 0.4 < 0.3 < 0.4 < 1.8 < 0.5Diethylphthalate
Lab No: 1159513 v 1 Hill Laboratories Page 2 of 5

Sample Type: SedimentSample Name:
Lab Number:
WR1/E224-Jul-2013 12:00
pm
WR2 24-Jul-201312:25 pm
WR4/E124-Jul-2013 12:05
pm
WR5 24-Jul-20131:30 pm
1159513.2 1159513.4 1159513.6 1159513.8 1159513.10
WR3 24-Jul-201312:40 pm
Plasticisers Trace in SVOC Soil Samples by GC-MS
mg/kg dry wt < 0.4 < 0.3 < 0.4 < 1.8 < 0.5Dimethylphthalatemg/kg dry wt < 0.4 < 0.3 < 0.4 < 1.8 0.8Di-n-butylphthalatemg/kg dry wt < 0.4 < 0.3 < 0.4 < 1.8 < 0.5Di-n-octylphthalate
Other Halogenated compounds Trace in SVOC Soil Samples by GC-MS
mg/kg dry wt < 0.4 < 0.3 < 0.4 < 1.8 < 0.51,2-Dichlorobenzenemg/kg dry wt < 0.4 < 0.3 < 0.4 < 1.8 < 0.51,3-Dichlorobenzenemg/kg dry wt < 0.4 < 0.3 < 0.4 < 1.8 < 0.51,4-Dichlorobenzenemg/kg dry wt < 0.4 < 0.3 < 0.4 < 1.8 < 0.5Hexachlorobutadienemg/kg dry wt < 0.9 < 0.7 < 0.8 < 5 < 1.3Hexachlorocyclopentadienemg/kg dry wt < 0.4 < 0.3 < 0.4 < 1.8 < 0.5Hexachloroethanemg/kg dry wt < 0.18 < 0.14 < 0.16 < 0.9 < 0.31,2,4-Trichlorobenzene
Other SVOC Trace in SVOC Soil Samples by GC-MS
mg/kg dry wt < 1.8 < 1.4 < 1.6 < 9 < 3Benzyl alcoholmg/kg dry wt < 0.18 < 0.14 < 0.16 < 0.9 < 0.3Carbazolemg/kg dry wt < 0.18 < 0.14 < 0.16 < 0.9 < 0.3Dibenzofuranmg/kg dry wt < 0.18 < 0.14 < 0.16 < 0.9 < 0.3Isophorone
Total Petroleum Hydrocarbons in Soil
mg/kg dry wt < 12 < 9 < 10 < 11 < 15C7 - C9mg/kg dry wt < 30 < 20 < 20 < 30 < 30C10 - C14mg/kg dry wt < 50 106 < 40 < 50 73C15 - C36mg/kg dry wt < 80 106 < 70 < 80 < 100Total hydrocarbons (C7 - C36)
Sample Type: AqueousSample Name:
Lab Number:
WR1/E224-Jul-2013 12:00
pm
WR2 24-Jul-201312:25 pm
WR4/E124-Jul-2013 12:05
pm
W5 24-Jul-20131:30 pm
1159513.1 1159513.3 1159513.5 1159513.7 1159513.9
WR3 24-Jul-201312:40 pm
Individual Tests
NTU 4.6 7.5 8.1 7.9 7.5Turbidityg/m3 6 9 10 26 9Total Suspended Solidsg/m3 0.0023 0.0024 0.0027 0.0043 0.0064Total Copperg/m3 0.00074 0.00073 0.00063 0.00116 0.00118Total Leadg/m3 0.031 0.024 0.0191 0.040 0.076Total Zinc
Nutrient Profile
g/m3 0.024 0.135 0.015 0.137 0.111Total Ammoniacal-Ng/m3 0.013 0.031 0.031 0.048 0.026Nitrite-Ng/m3 1.62 0.98 0.99 1.28 0.80Nitrate-Ng/m3 1.64 1.01 1.02 1.33 0.83Nitrate-N + Nitrite-Ng/m3 0.024 0.046 0.023 0.118 0.057Dissolved Reactive Phosphorus
Sample Name:
Lab Number:
100m BelowDischarge
24-Jul-2013 1:15pm
1159513.11Individual Tests
NTU 9.2 - - - -Turbidityg/m3 30 - - - -Total Suspended Solidsg/m3 0.0046 - - - -Total Copperg/m3 0.00090 - - - -Total Leadg/m3 0.044 - - - -Total Zinc
Nutrient Profile
g/m3 0.067 - - - -Total Ammoniacal-Ng/m3 0.041 - - - -Nitrite-Ng/m3 1.13 - - - -Nitrate-Ng/m3 1.17 - - - -Nitrate-N + Nitrite-N
Lab No: 1159513 v 1 Hill Laboratories Page 3 of 5
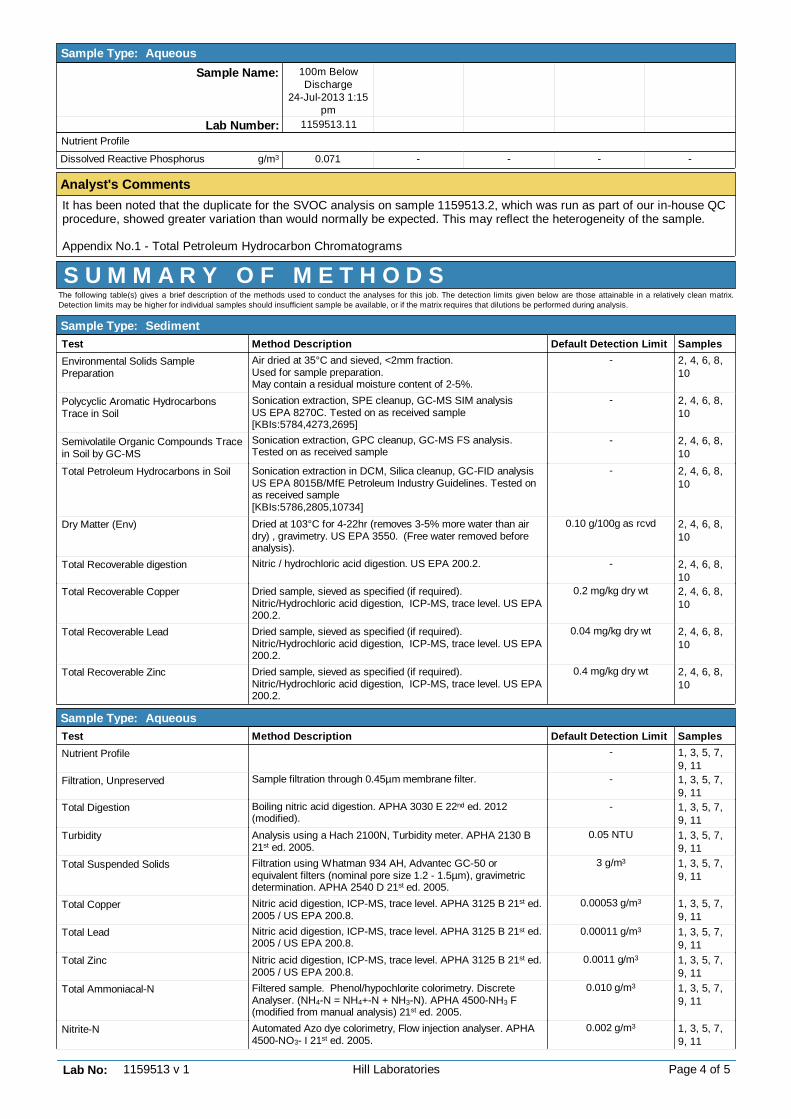
Sample Type: AqueousSample Name:
Lab Number:
100m BelowDischarge
24-Jul-2013 1:15pm
1159513.11Nutrient Profile
g/m3 0.071 - - - -Dissolved Reactive Phosphorus
Lab No: 1159513 v 1 Hill Laboratories Page 4 of 5
Analyst's CommentsIt has been noted that the duplicate for the SVOC analysis on sample 1159513.2, which was run as part of our in-house QCprocedure, showed greater variation than would normally be expected. This may reflect the heterogeneity of the sample.
Appendix No.1 - Total Petroleum Hydrocarbon Chromatograms
The following table(s) gives a brief description of the methods used to conduct the analyses for this job. The detection limits given below are those attainable in a relatively clean matrix.Detection limits may be higher for individual samples should insufficient sample be available, or if the matrix requires that dilutions be performed during analysis.
S U M M A R Y O F M E T H O D S
Sample Type: SedimentTest Method Description Default Detection Limit Samples
2, 4, 6, 8,10
Environmental Solids SamplePreparation
Air dried at 35°C and sieved, <2mm fraction.Used for sample preparation.May contain a residual moisture content of 2-5%.
-
2, 4, 6, 8,10
Polycyclic Aromatic HydrocarbonsTrace in Soil
Sonication extraction, SPE cleanup, GC-MS SIM analysisUS EPA 8270C. Tested on as received sample[KBIs:5784,4273,2695]
-
2, 4, 6, 8,10
Semivolatile Organic Compounds Tracein Soil by GC-MS
Sonication extraction, GPC cleanup, GC-MS FS analysis.Tested on as received sample
-
2, 4, 6, 8,10
Total Petroleum Hydrocarbons in Soil Sonication extraction in DCM, Silica cleanup, GC-FID analysisUS EPA 8015B/MfE Petroleum Industry Guidelines. Tested onas received sample[KBIs:5786,2805,10734]
-
2, 4, 6, 8,10
Dry Matter (Env) Dried at 103°C for 4-22hr (removes 3-5% more water than airdry) , gravimetry. US EPA 3550. (Free water removed beforeanalysis).
0.10 g/100g as rcvd
2, 4, 6, 8,10
Total Recoverable digestion Nitric / hydrochloric acid digestion. US EPA 200.2. -
2, 4, 6, 8,10
Total Recoverable Copper Dried sample, sieved as specified (if required).Nitric/Hydrochloric acid digestion, ICP-MS, trace level. US EPA200.2.
0.2 mg/kg dry wt
2, 4, 6, 8,10
Total Recoverable Lead Dried sample, sieved as specified (if required).Nitric/Hydrochloric acid digestion, ICP-MS, trace level. US EPA200.2.
0.04 mg/kg dry wt
2, 4, 6, 8,10
Total Recoverable Zinc Dried sample, sieved as specified (if required).Nitric/Hydrochloric acid digestion, ICP-MS, trace level. US EPA200.2.
0.4 mg/kg dry wt
Sample Type: AqueousTest Method Description Default Detection Limit Samples
1, 3, 5, 7,9, 11
Nutrient Profile -
1, 3, 5, 7,9, 11
Filtration, Unpreserved Sample filtration through 0.45µm membrane filter. -
1, 3, 5, 7,9, 11
Total Digestion Boiling nitric acid digestion. APHA 3030 E 22nd ed. 2012(modified).
-
1, 3, 5, 7,9, 11
Turbidity Analysis using a Hach 2100N, Turbidity meter. APHA 2130 B21st ed. 2005.
0.05 NTU
1, 3, 5, 7,9, 11
Total Suspended Solids Filtration using Whatman 934 AH, Advantec GC-50 orequivalent filters (nominal pore size 1.2 - 1.5µm), gravimetricdetermination. APHA 2540 D 21st ed. 2005.
3 g/m3
1, 3, 5, 7,9, 11
Total Copper Nitric acid digestion, ICP-MS, trace level. APHA 3125 B 21st ed.2005 / US EPA 200.8.
0.00053 g/m3
1, 3, 5, 7,9, 11
Total Lead Nitric acid digestion, ICP-MS, trace level. APHA 3125 B 21st ed.2005 / US EPA 200.8.
0.00011 g/m3
1, 3, 5, 7,9, 11
Total Zinc Nitric acid digestion, ICP-MS, trace level. APHA 3125 B 21st ed.2005 / US EPA 200.8.
0.0011 g/m3
1, 3, 5, 7,9, 11
Total Ammoniacal-N Filtered sample. Phenol/hypochlorite colorimetry. DiscreteAnalyser. (NH4-N = NH4+-N + NH3-N). APHA 4500-NH3 F(modified from manual analysis) 21st ed. 2005.
0.010 g/m3
1, 3, 5, 7,9, 11
Nitrite-N Automated Azo dye colorimetry, Flow injection analyser. APHA4500-NO3- I 21st ed. 2005.
0.002 g/m3

Sample Type: AqueousTest Method Description Default Detection Limit Samples
1, 3, 5, 7,9, 11
Nitrate-N Calculation: (Nitrate-N + Nitrite-N) - NO2N. 0.002 g/m3
1, 3, 5, 7,9, 11
Nitrate-N + Nitrite-N Total oxidised nitrogen. Automated cadmium reduction, flowinjection analyser. APHA 4500-NO3- I 21st ed. 2005.
0.002 g/m3
1, 3, 5, 7,9, 11
Dissolved Reactive Phosphorus Filtered sample. Molybdenum blue colorimetry. DiscreteAnalyser. APHA 4500-P E (modified from manual analysis) 21st
ed. 2005.
0.004 g/m3
Lab No: 1159513 v 1 Hill Laboratories Page 5 of 5
These samples were collected by yourselves (or your agent) and analysed as received at the laboratory.
Samples are held at the laboratory after reporting for a length of time depending on the preservation used and the stability ofthe analytes being tested. Once the storage period is completed the samples are discarded unless otherwise advised by theclient.
This report must not be reproduced, except in full, without the written consent of the signatory.
Peter Robinson MSc (Hons), PhD, FNZICClient Services Manager - Environmental Division

Sample: 1159513.4
Sample: 1159513.10
C7 C10 C15 C20 C25 C30 C34 C44
1 2 3 4 5 6 7 8
Minutes
-5
0
10
20
30
40
mVolts
i:\mhdata\w30_07_13\gc\jj\ jj2707\xstph.4686.15.run
1 2 3 4 5 6 7 8
Minutes
-5
0
10
20
30
40
mVolts
i:\mhdata\w30_07_13\gc\jj\ jj2707\xstph.4686.18.run
Appendix No.1 - Total Petroleum Hydrocarbon Chromatograms - Page 1 of 1

July 2013 Environmental Report
AC Monthly Report July 2013.docx Page 27 31 August 2013
Appendix C
Contaminated soil monitoring reports, July 2013

R J Hill Laboratories Limited1 Clyde StreetPrivate Bag 3205Hamilton 3240, New Zealand
+64 7 858 2000+64 7 858 [email protected]
TelFaxEmailWeb
This Laboratory is accredited by International Accreditation New Zealand (IANZ), which represents New Zealand in the InternationalLaboratory Accreditation Cooperation (ILAC). Through the ILAC Mutual Recognition Arrangement (ILAC-MRA) this accreditation isinternationally recognised.The tests reported herein have been performed in accordance with the terms of accreditation, with the exception of tests marked *, whichare not accredited.
A N A L Y S I S R E P O R T Page 1 of 2
Client:Contact: Lean Phuah
C/- Well-Connected AlliancePrivate Bag 76914Manukau Mail CentreAUCKLAND 2241
Well-Connected Alliance Lab No:Date Registered:Date Reported:Quote No:Order No:Client Reference:Submitted By:
115332306-Jul-201309-Jul-20134715033PL07
Rachel Pickett
SPv1
Sample Type: SoilSample Name:
Lab Number:
Pile 7 S/P105-Jul-2013
Pile 7 S/P205-Jul-2013
1153323.1 1153323.2Individual Tests
g/100g as rcvd 84 87 - - -Dry Matter
Polycyclic Aromatic Hydrocarbons Screening in Soil
mg/kg dry wt < 0.03 < 0.03 - - -Acenaphthenemg/kg dry wt < 0.03 < 0.03 - - -Acenaphthylenemg/kg dry wt < 0.03 < 0.03 - - -Anthracenemg/kg dry wt < 0.03 < 0.03 - - -Benzo[a]anthracenemg/kg dry wt < 0.03 < 0.03 - - -Benzo[a]pyrene (BAP)mg/kg dry wt < 0.03 < 0.03 - - -Benzo[b]fluoranthene + Benzo[j]
fluoranthenemg/kg dry wt < 0.03 < 0.03 - - -Benzo[g,h,i]perylenemg/kg dry wt < 0.03 < 0.03 - - -Benzo[k]fluoranthenemg/kg dry wt < 0.03 < 0.03 - - -Chrysenemg/kg dry wt < 0.03 < 0.03 - - -Dibenzo[a,h]anthracenemg/kg dry wt < 0.03 < 0.03 - - -Fluoranthenemg/kg dry wt < 0.03 < 0.03 - - -Fluorenemg/kg dry wt < 0.03 < 0.03 - - -Indeno(1,2,3-c,d)pyrenemg/kg dry wt < 0.13 < 0.14 - - -Naphthalenemg/kg dry wt < 0.03 < 0.03 - - -Phenanthrenemg/kg dry wt < 0.03 0.03 - - -Pyrene
Total Petroleum Hydrocarbons in Soil
mg/kg dry wt < 8 < 8 - - -C7 - C9mg/kg dry wt < 20 < 20 - - -C10 - C14mg/kg dry wt < 40 < 40 - - -C15 - C36mg/kg dry wt < 70 < 70 - - -Total hydrocarbons (C7 - C36)
The following table(s) gives a brief description of the methods used to conduct the analyses for this job. The detection limits given below are those attainable in a relatively clean matrix.Detection limits may be higher for individual samples should insufficient sample be available, or if the matrix requires that dilutions be performed during analysis.
S U M M A R Y O F M E T H O D S
Sample Type: SoilTest Method Description Default Detection Limit Samples
1-2TPH Oil Industry Profile + PAHscreen Sonication in DCM extraction, SPE cleanup, GC-FID & GC-MSanalysis. Tested on as received sample.US EPA 8015B/MfE Petroleum Industry Guidelines[KBIs:5786,2805,10734;2695]
-
1-2Dry Matter (Env) Dried at 103°C for 4-22hr (removes 3-5% more water than airdry) , gravimetry. US EPA 3550. (Free water removed beforeanalysis).
0.10 g/100g as rcvd

These samples were collected by yourselves (or your agent) and analysed as received at the laboratory.
Samples are held at the laboratory after reporting for a length of time depending on the preservation used and the stability ofthe analytes being tested. Once the storage period is completed the samples are discarded unless otherwise advised by theclient.
This report must not be reproduced, except in full, without the written consent of the signatory.
Ara Heron BSc (Tech)Client Services Manager - Environmental Division
Lab No: 1153323 v 1 Hill Laboratories Page 2 of 2

R J Hill Laboratories Limited1 Clyde StreetPrivate Bag 3205Hamilton 3240, New Zealand
+64 7 858 2000+64 7 858 [email protected]
TelFaxEmailWeb
This Laboratory is accredited by International Accreditation New Zealand (IANZ), which represents New Zealand in the InternationalLaboratory Accreditation Cooperation (ILAC). Through the ILAC Mutual Recognition Arrangement (ILAC-MRA) this accreditation isinternationally recognised.The tests reported herein have been performed in accordance with the terms of accreditation, with the exception of tests marked *, whichare not accredited.
A N A L Y S I S R E P O R T Page 1 of 1
Client:Contact: Rachel Pickett
C/- Well-Connected AlliancePrivate Bag 76914Manukau Mail CentreAUCKLAND 2241
Well-Connected Alliance Lab No:Date Registered:Date Reported:Quote No:Order No:Client Reference:Submitted By:
115869823-Jul-201301-Aug-201356197335T03M001
Rachel Pickett
SPv1
Sample Type: SludgeSample Name:
Lab Number:
CMA Seep[Sludge]
22-Jul-20131158698.1
mg/kg dry wt 300,000 - - - -Total Recoverable Iron
The following table(s) gives a brief description of the methods used to conduct the analyses for this job. The detection limits given below are those attainable in a relatively clean matrix.Detection limits may be higher for individual samples should insufficient sample be available, or if the matrix requires that dilutions be performed during analysis.
S U M M A R Y O F M E T H O D S
Sample Type: SludgeTest Method Description Default Detection Limit Samples
1Environmental Solids SamplePreparation
Air dried at 35°C and sieved, <2mm fraction.Used for sample preparation.May contain a residual moisture content of 2-5%.
-
1Total Recoverable digestion Nitric / hydrochloric acid digestion. US EPA 200.2. -
1Total Recoverable Iron Dried sample, sieved as specified (if required).Nitric/Hydrochloric acid digestion, ICP-MS, screen level. USEPA 200.2.
40 mg/kg dry wt
These samples were collected by yourselves (or your agent) and analysed as received at the laboratory.
Samples are held at the laboratory after reporting for a length of time depending on the preservation used and the stability ofthe analytes being tested. Once the storage period is completed the samples are discarded unless otherwise advised by theclient.
This report must not be reproduced, except in full, without the written consent of the signatory.
Carole Rodgers-Carroll BA, NZCSClient Services Manager - Environmental Division