report 11: changes in children’s mental health symptoms
TRANSCRIPT

Cite this report: Skripkauskaite, S., Shum, A., Pearcey, S., McCall, A., Waite, P., & Creswell, C. (2021). Changes in children’s mental health symptoms from March 2020 to June 2021 (Report 11). Co-SPACE study. http://cospaceoxford.org/findings/changes-in-childrens-mental-health-symptoms-from-march-2020-to-june-2021/ For further information or to request specific analyses, please visit www.cospaceoxford.org/ or contact the research team at [email protected]
1
Report 11: Changes in
children’s mental health
symptoms from March 2020 to
June 2021
Date: 23 July 2021
Report Authors: Simona Skripkauskaite,
Adrienne Shum, Samantha Pearcey, Amy
McCall, Polly Waite and Cathy Creswell

2
The Co-SPACE Study Background COVID-19 has caused major disruptions to families’ lives in many ways, including through social distancing, home learning requirements, and lockdown. This is also a rapidly changing situation where different pressures have arisen and continue to arise for children, young people and their families over time.
The Co-SPACE project is tracking the mental health of school-aged children and young people aged 4-16 years (at the beginning of the study) throughout the COVID-19 crisis. An online survey is sent out and completed on a monthly basis by parents/carers and young people (if aged 11-16 years at baseline) throughout the pandemic. The study has full ethical and data protection approval (ethical approval ref: R69060) and is fully GDPR compliant.
The findings will help identify what protects children and young people from deteriorating mental health over time, and at particular stress points. Findings are being shared directly with health and education services to inform the development and provision of effective support for children and families.
Recruitment The study sample has been recruited through a variety of means, including social media, distribution through partner organisations, networks and charities, the media and targeted online advertising. The self-selecting nature of recruitment means that this will not be a nationally representative sample. In the current report, 91.0% of the 9,161 participants included were female. Furthermore, the majority of the sample was employed either part-time (34.5%) or full-time (35.9%), had an average income of >£16,000 (82.5%), and were white (91.5%). Eighty eight percent of the participants resided in England (with 45.5% in Southern England), 3.7% in Wales, 6.3% in Scotland, and 1.5% in Northern Ireland. Further information about participants’ characteristics can be found at the end of the report. See Appendix A for the full demographic table.
Funding This research is funded by the Economic and Social Research Council (ESRC) as part of the UK Research and Innovation’s rapid response to COVID-19, and the Westminster Foundation. It is supported by the NIHR Oxford Health Biomedical Research Centre, the Oxford and Thames Valley NIHR Applied Research Consortium and the UKRI Emerging Minds Research Network Plus.
3
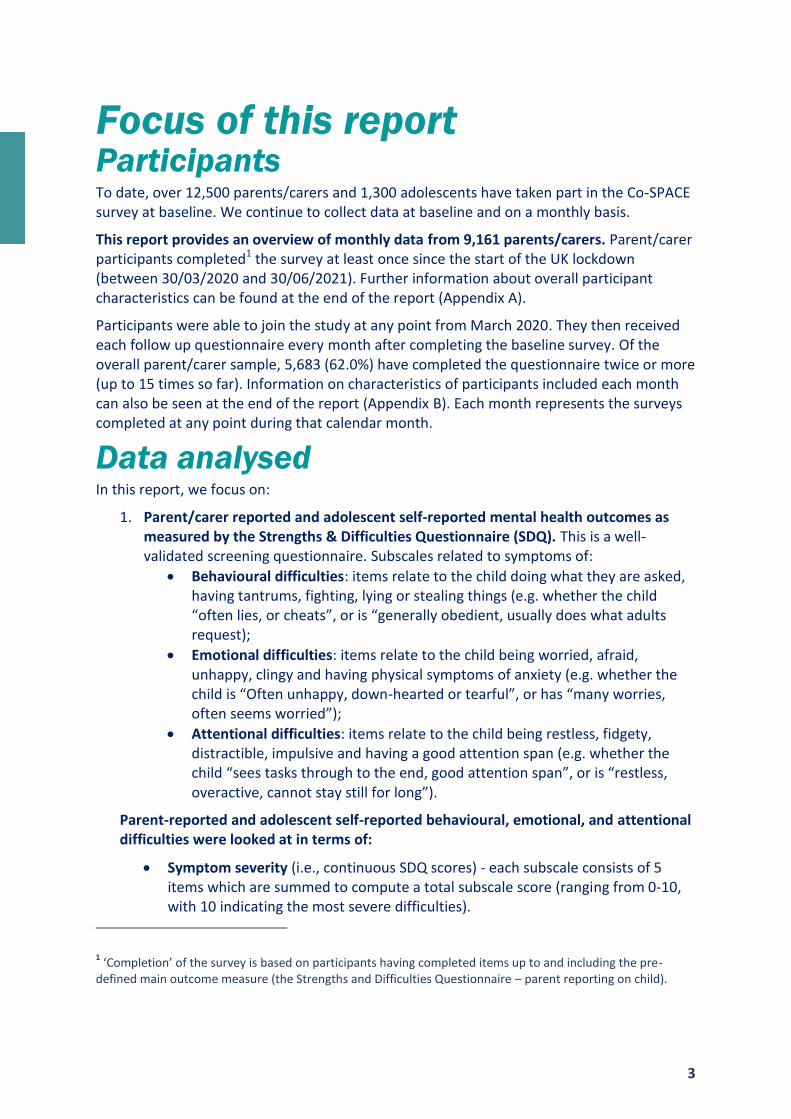
Focus of this report Participants To date, over 12,500 parents/carers and 1,300 adolescents have taken part in the Co-SPACE survey at baseline. We continue to collect data at baseline and on a monthly basis.
This report provides an overview of monthly data from 9,161 parents/carers. Parent/carer participants completed1 the survey at least once since the start of the UK lockdown (between 30/03/2020 and 30/06/2021). Further information about overall participant characteristics can be found at the end of the report (Appendix A).
Participants were able to join the study at any point from March 2020. They then received each follow up questionnaire every month after completing the baseline survey. Of the overall parent/carer sample, 5,683 (62.0%) have completed the questionnaire twice or more (up to 15 times so far). Information on characteristics of participants included each month can also be seen at the end of the report (Appendix B). Each month represents the surveys completed at any point during that calendar month.
Data analysed In this report, we focus on:
1. Parent/carer reported and adolescent self-reported mental health outcomes as measured by the Strengths & Difficulties Questionnaire (SDQ). This is a well-validated screening questionnaire. Subscales related to symptoms of:
Behavioural difficulties: items relate to the child doing what they are asked, having tantrums, fighting, lying or stealing things (e.g. whether the child “often lies, or cheats”, or is “generally obedient, usually does what adults request);
Emotional difficulties: items relate to the child being worried, afraid, unhappy, clingy and having physical symptoms of anxiety (e.g. whether the child is “Often unhappy, down-hearted or tearful”, or has “many worries, often seems worried”);
Attentional difficulties: items relate to the child being restless, fidgety, distractible, impulsive and having a good attention span (e.g. whether the child “sees tasks through to the end, good attention span”, or is “restless, overactive, cannot stay still for long”).
Parent-reported and adolescent self-reported behavioural, emotional, and attentional difficulties were looked at in terms of:
Symptom severity (i.e., continuous SDQ scores) - each subscale consists of 5 items which are summed to compute a total subscale score (ranging from 0-10, with 10 indicating the most severe difficulties).
1 ‘Completion’ of the survey is based on participants having completed items up to and including the pre-
defined main outcome measure (the Strengths and Difficulties Questionnaire – parent reporting on child).

4
‘Caseness’ (i.e., SDQ scores categorised on the basis of symptoms and impact) – a combination of SDQ symptom score and rated impact in daily life were used to determine the likelihood (i.e., possible or probable) of meeting diagnostic criteria for emotional problems (e.g. anxiety or depression), behavioural problems (e.g. conduct disorder or oppositional defiant disorder) or attentional problems (e.g. Attention Deficit Hyperactivity Disorder; ADHD). The SDQ impact supplement assesses interference caused by the identified problems across four domains (the child’s home life, friendships, school-life and leisure activities) and distress. Impact items are scored on a 4 point scale from 0 if either “not at all” or ”only a little”, 1 if “quite a lot” and 2 if “a great deal”. Scores on the impact items are totalled, leading to a maximum total impact score of 10. In this report, we categorised participants as being either ‘possible’/’probable’ or ‘unlikely’ cases, to err on the side of being inclusive to those who might be a potential ‘case’.
The parent/carer reports were examined for the following groups:
a. Whole sample; b. Child age (primary school aged [4-10 years] or secondary school aged [11-18
years]); c. Child gender (female or male2); d. Children and young people with and without special educational needs and/or
neurodevelopmental disorder3 (SEN/ND or no SEN/ND); e. Household income (more or less than £16,000 per year, i.e., below the poverty
line).
2 A small number (0.8%) of parents/carers indicated “Other/prefer not to say” option when reporting on their
child’s gender. Due to the small number these cases were excluded from the ‘Gender’ analysis. 3 The parents/carers are asked to report whether the child has a diagnosis of Attention-Deficit Disorder
(ADD)/Attention-Deficit Hyperactivity Disorder (ADHD) or Autism Spectrum Disorder (ASD). To reflect the diagnostic criteria in this question, we use an umbrella term of neurodevelopmental disorders in line with DSM-5.

5
Timeline of significant events

6
Key findings
Based on parent/carer reports within the Co-
SPACE sample:
On average, behavioural, emotional, and attentional difficulties decreased as COVID-19 related restrictions eased from February to April 2021. They remained relatively stable between April and June (the month-to-month change was not statistically significant).
The decrease in symptoms since February was especially pronounced for primary school aged children (4-10 years old).
On average, children with SEN/ND and those from low-income households have not shown this post-lockdown recovery and have continued to have elevated mental health symptoms.
7
Findings Notes for interpretation SDQ mental health symptoms (parent/carer and adolescent self-report)
In the figures, the dots represent the average SDQ scores for all surveys completed within that calendar month. As each follow-up survey asks about the experiences in the past month, parents/carers and adolescents will be partially reporting on some of the experiences of the previous month.
The shaded areas in the figures represent the confidence intervals (95% CI) around these scores, which indicate the range of values that the true population average score may fall in. As average scores are heavily affected by the variability in the data, a larger sample size will result in narrower and more accurate estimations of the population mean. This means that the true population mean is less accurately represented for the smaller groups (e.g. SEN/ND and <£16,000 household income groups in this report). Overlapping confidence intervals should be interpreted with caution.
Explanation of the findings about change in symptoms is provided based on statistical analysis rather than just graphical representation. Each analysis evaluated the effect of group and/or change from month to month. When possible, within family dependency over time was included in the analysis (i.e. over time scores from one family will be more similar than another). This allowed a more reliable estimation of month-to-month changes, where changes were mostly modelled based on full data (in this case, change in people who have both data points at each month-to-month comparison), but adjusted for partial and missing data too.
Additionally, this report investigates SDQ ‘caseness’. Figures in this part of the analysis represent the percentage of participants that month who were classified as possible/probable cases for behavioural, emotional, or attentional problems as opposed to those where such problems are less likely. Please note that the sample of participants slightly differed each month (see Appendix B). Thus, small changes in percentages could reflect changes in sample rather than pandemic-induced effects and should be interpreted with caution.

8
1. Whole sample
Figure 1a. Means and 95% CI’s of parents/carers reported SDQ scores per month
Figure 1b. Percentage of possible/probable SDQ cases per month

9
On average, behavioural, emotional, and attentional difficulties have decreased since the restrictions of the last lockdown eased after February 2021 (see Report 10 for interpretation of data prior to March). The monthly change in average level of these difficulties since April 2021 has not been statistically significant.
19.5% of the children whose parents/carers took part in the study in June 2021 were classified as possible/probable cases for behavioural problems, 21.8% as possible/probable cases for emotional problems, and 24.1% as possible/probable cases for attentional problems. These proportions were lower than those observed during the previous peaks in in June 2020 and February 2021 lockdowns (see Appendix C: Table 1b for monthly data).

10
2. Child age Figure 2a. Means and 95% CI’s of parents/carers reported SDQ scores per month and age group
Figure 2b. Percentage of possible/probable SDQ cases per month and age group

11
On average (throughout the pandemic), parents/carers reported higher levels of symptoms of behavioural and attentional difficulties for primary (4-10 years old) compared to secondary (11-18 years old) school aged children. They reported similar levels of symptoms of emotional difficulties for both groups.
Overall, primary aged children have had more marked changes in symptoms of behavioural, emotional and attentional difficulties throughout the pandemic, while reported symptoms for secondary aged children have been relatively stable.
According to parents/carers who took part in the study in June 2021, 21.9% of primary aged school children and 15.9% of secondary school aged children were classified as possible/probable cases for behavioural problems. More primary (27.3%) than secondary (19.4%) school aged children were also classified as possible/probable cases for attentional problems. Yet, a similar proportion of primary (21.2%) and secondary (22.6%) school aged children were classified as possible/probably cases for emotional problems.

12
3. Child gender Figure 3a. Means and 95% CI’s of parents/carers reported SDQ scores per month and child gender
Figure 3b. Percentage of possible/probable SDQ cases per month and child gender

13
Overall, parents/carers reported higher symptoms of behavioural and attentional difficulties for boys than girls. However, they reported higher levels of emotional difficulties for girls than boys.
The patterns of parent/carer reported behavioural, emotional, and attentional difficulties over time were relatively similar for boys and girls.
In June 2021, proportionally more boys than girls were classified as possible/probable cases for attentional (male: 27.5%, female: 19.9%) and behavioural (male: 20.6%, female: 18.0%) problems. Yet, a similar proportion of boys and girls were classified as possible/probable cases for emotional problems (male: 20.7%, female: 22.2%).

14
4. Special educational needs and/or
Neurodevelopmental disorders
(SEN/ND) Figure 4a. Means and 95% CI’s of parents/carers reported SDQ scores per month and SEN/ND
Figure 4b. Percentage of possible/probable SDQ cases per month and SEN/ND

15
Throughout the pandemic, parents/carers reported substantially higher levels of behavioural, emotional and attentional difficulties for children with SEN/ND than those without SEN/ND.
Whilst children without SEN/ND showed a decrease in reported levels of behavioural, emotional, and attentional difficulties between February and April 2021, similar decreases were not observed in emotional and attentional difficulties in children with SEN/ND. Instead, they continued to show elevated symptoms throughout the pandemic.
In June 2021, 62.7% of children with SEN/ND were classified as possible/probable cases for attentional problems, in comparison to 15.7% of those without SEN/ND. Over half of the children with SEN/ND (54.2%) and 14.7% of children without SEN/ND were classified as possible/probable cases for emotional problems. Proportionally more children with SEN/ND (39.5%) than without SEN/ND (15.2%) were also classified as possible/probable cases for behavioural problems.

16
5. Household income Figure 5a. Means and 95% CI’s of parents/carers reported SDQ scores per month and household income
Figure 5b. Percentage of possible/probable SDQ cases per month and household income

17
Only around 9% of parents/carers included in this analysis had a regular household income of less than £16,000. Throughout the pandemic, parents/carers from households with lower annual incomes (< £16,000 p.a.) reported that their children had higher levels of symptoms of behavioural, emotional, and attentional difficulties than parents/carers from households with higher annual income (> £16,000 p.a.).
As lockdown eased between February and April 2021, parents/carers from higher income households reported decreases in symptoms of behavioural, emotional and attentional difficulties. However, reported levels of behavioural, emotional, and attentional difficulties have not significantly changed for children from lower income households since February 2021.
In June 2021, a larger proportion of children from households with lower (< £16,000 p.a.), compared to higher (> £16,000 p.a.), annual incomes were classified as possible/probable cases for behavioural (37.0% versus 18.3%), emotional (31.9% versus 21.3%), or attentional (37.7% versus 23.3%) problems. The proportion of children from lower annual income households classified as as possible/probable cases for behavioural problems was higher than in February 2021 (see Appendix C: Table 5b for monthly data).

18
Appendix A Parent participants’ demographics at baseline: March 2020 to June 2021
Parents/carers National Figures*
N= 9161
Relationship to Child
Grandparent 65.0 (0.7%) - Other 71.0 (0.8%) - Parent 8946 (97.7%) - Step-parent 68.0 (0.7%) - Missing 11.0 (0.1%)
Location
Greater London 969 (10.6%) 13.4% Northern England 1842 (20.1%) 23.2% Northern Ireland 134 (1.5%) 2.8% Scotland 575 (6.3%) 8.2% Southern England 4171 (45.5%) 22.1% The Midlands 1118 (12.2%) 16.1% Wales 341 (3.7%) 4.7% Missing 11.0 (0.1%)
Parent Gender
Female 8336 (91.0%) 51% Male 758 (8.3%) 49% Other/Prefer not to say 67.0 (0.7%) -
Employment Status
Self employed 953 (10.4%) 8.5% Unemployed/Other 1746 (19.1%) 3.8% Working full time 3290 (35.9%) 50.7% Working part time 3162 (34.5%) 16.9% Missing 10.0 (0.1%)
Household income (16k)
<£16,000 982 (10.7%) 19% >£16,000 7559 (82.5%) 81% Prefer not to say 620 (6.8%) -
Parent Ethnicity
White: British, Irish, other 8384 (91.5%) 86% Other ethnic backgrounds 652 (7.1%) 14% Missing 125 (1.4%) -
Index Child’s Gender
Female 4385 (47.9%) 52% Male 4701 (51.3%) 48% Other/Prefer not to say 75.0 (0.8%) -
Index Child’s Age
Secondary (11-18 years) 3386 (37.0%) 45% Primary (4-10 years) 5773 (63.0%) 55% Missing 2.00 (0.0%)
Index Child’s SEN/ND Status
No SEN/ND 7538 (82.3%) 85.3% SEN/ND 1612 (17.6%) 14.7% Missing 11.0 (0.1%)
Index Child’s Pre-existing Mental Health Problems Depression, anxiety, or other 524 (5.7%) 12.8% No 8637 (94.3%) 87.2%

19
*National Figures were extracted from the following sources on 12/05/2020: https://digital.nhs.uk/data-and-information/publications/statistical/mental-health-of-children-and-young-people-in-england/2017/2017 https://www.ons.gov.uk/peoplepopulationandcommunity/populationandmigration/populationprojections/datasets/z1zippedpopulationprojectionsdatafilesuk https://www.ons.gov.uk/employmentandlabourmarket/peopleinwork/employmentandemployeetypes/bulletins/employmentintheuk/september2019#:~:text=Main%20points%20for%20May%20to%20July%202019,and%20unchanged%20on%20the%20quarter. https://www.ons.gov.uk/peoplepopulationandcommunity/personalandhouseholdfinances/incomeandwealth/bulletins/householddisposableincomeandinequality/yearending2018 https://www.gov.uk/government/collections/statistics-special-educational-needs-sen https://assets.publishing.service.gov.uk/government/uploads/system/uploads/attachment_data/file/814244/SEN_2019_Text.docx.pdfhttps://www.ethnicity-facts-figures.service.gov.uk/uk-population-by-ethnicity/demographics/age-groups/latest#data-sources https://en.wikipedia.org/wiki/Countries_of_the_United_Kingdom_by_population https://www.unison.org.uk/get-help/knowledge/pay/low-pay/

20
Appendix B Parent/carer participants’ demographics per month: March 2020 to June 2021 2020 2021
Mar Apr May Jun Jul Aug Sep Oct Nov Dec Jan Feb Mar Apr May Jun
N = 1066 4444 3702 3223 2653 2985 2336 2027 1699 1765 2215 2277 2189 1985 2005 1512
Location
Greater London 99.0
(9.3%) 466
(10.5%) 365
(9.9%) 320
(9.9%) 266
(10.0%) 279
(9.3%) 236
(10.1%) 199
(9.8%) 174
(10.2%) 162
(9.2%) 217
(9.8%) 219
(9.6%) 222
(10.1%) 196
(9.9%) 242
(12.1%) 173
(11.4%) Northern England
173 (16.2%)
829 (18.7%)
736 (19.9%)
605 (18.8%)
473 (17.8%)
659 (22.1%)
483 (20.7%)
414 (20.4%)
328 (19.3%)
339 (19.2%)
428 (19.3%)
434 (19.1%)
455 (20.8%)
400 (20.2%)
376 (18.8%)
317 (21.0%)
Northern Ireland 9.00
(0.8%) 60.0
(1.4%) 42.0
(1.1%) 33.0
(1.0%) 28.0
(1.1%) 46.0
(1.5%) 29.0
(1.2%) 24.0
(1.2%) 20.0
(1.2%) 21.0
(1.2%) 26.0
(1.2%) 25.0
(1.1%) 25.0
(1.1%) 22.0
(1.1%) 21.0
(1.0%) 16.0
(1.1%)
Scotland 55.0
(5.2%) 261
(5.9%) 242
(6.5%) 176
(5.5%) 165
(6.2%) 174
(5.8%) 120
(5.1%) 106
(5.2%) 70.0
(4.1%) 92.0
(5.2%) 123
(5.6%) 128
(5.6%) 118
(5.4%) 98.0
(4.9%) 98.0
(4.9%) 60.0
(4.0%) Southern England
593 (55.6%)
2172 (48.9%)
1750 (47.3%)
1601 (49.7%)
1310 (49.4%)
1291 (43.2%)
1099 (47.0%)
955 (47.1%)
836 (49.2%)
866 (49.1%)
1060 (47.9%)
1103 (48.4%)
1023 (46.7%)
942 (47.5%)
949 (47.3%)
709 (46.9%)
the Midlands 89.0
(8.3%) 491
(11.0%) 439
(11.9%) 384
(11.9%) 320
(12.1%) 424
(14.2%) 288
(12.3%) 257
(12.7%) 224
(13.2%) 227
(12.9%) 288
(13.0%) 295
(13.0%) 268
(12.2%) 259
(13.0%) 251
(12.5%) 190
(12.6%)
Wales 48.0
(4.5%) 165
(3.7%) 127
(3.4%) 104
(3.2%) 91.0
(3.4%) 112
(3.8%) 81.0
(3.5%) 71.0
(3.5%) 46.0
(2.7%) 52.0
(2.9%) 69.0
(3.1%) 72.0
(3.2%) 77.0
(3.5%) 67.0
(3.4%) 67.0
(3.3%) 44.0
(2.9%)
Missing 0 (0%) 0 (0%)
1.00 (0.0%) 0 (0%) 0 (0%) 0 (0%) 0 (0%)
1.00 (0.0%)
1.00 (0.1%)
6.00 (0.3%)
4.00 (0.2%)
1.00 (0.0%)
1.00 (0.0%)
1.00 (0.1%)
1.00 (0.0%)
3.00 (0.2%)
Parent Gender
Female 982
(92.1%) 4109
(92.5%) 3470
(93.7%) 3022
(93.8%) 2449
(92.3%) 2686
(90.0%) 2173
(93.0%) 1847
(91.1%) 1559
(91.8%) 1606
(91.0%) 2011
(90.8%) 2081
(91.4%) 2000
(91.4%) 1813
(91.3%) 1828
(91.2%) 1369
(90.5%)
Male 76.0
(7.1%) 319
(7.2%) 213
(5.8%) 188
(5.8%) 176
(6.6%) 280
(9.4%) 149
(6.4%) 164
(8.1%) 128
(7.5%) 143
(8.1%) 191
(8.6%) 178
(7.8%) 173
(7.9%) 158
(8.0%) 165
(8.2%) 131
(8.7%) Other/ Prefer not to say
8.00 (0.8%)
16.0 (0.4%)
19.0 (0.5%)
13.0 (0.4%)
28.0 (1.1%)
19.0 (0.6%)
14.0 (0.6%)
16.0 (0.8%)
12.0 (0.7%)
16.0 (0.9%)
13.0 (0.6%)
18.0 (0.8%)
16.0 (0.7%)
14.0 (0.7%)
12.0 (0.6%)
12.0 (0.8%)
Employment Status
Self employed 110
(10.3%) 498
(11.2%) 375
(10.1%) 332
(10.3%) 270
(10.2%) 283
(9.5%) 219
(9.4%) 212
(10.5%) 171
(10.1%) 182
(10.3%) 212
(9.6%) 247
(10.8%) 208
(9.5%) 200
(10.1%) 189
(9.4%) 129
(8.5%) Unemployed/ Other
137 (12.9%)
717 (16.1%)
595 (16.1%)
510 (15.8%)
388 (14.6%)
648 (21.7%)
441 (18.9%)
396 (19.5%)
323 (19.0%)
311 (17.6%)
415 (18.7%)
381 (16.7%)
375 (17.1%)
348 (17.5%)
384 (19.2%)
287 (19.0%)
Working full time
410 (38.5%)
1644 (37.0%)
1331 (36.0%)
1112 (34.5%)
926 (34.9%)
922 (30.9%)
757 (32.4%)
653 (32.2%)
529 (31.1%)
568 (32.2%)
724 (32.7%)
758 (33.3%)
707 (32.3%)
651 (32.8%)
681 (34.0%)
507 (33.5%)
Working part 409 1585 1400 1269 1069 1132 919 765 675 698 860 890 898 785 750 587

21
time (38.4%) (35.7%) (37.8%) (39.4%) (40.3%) (37.9%) (39.3%) (37.7%) (39.7%) (39.5%) (38.8%) (39.1%) (41.0%) (39.5%) (37.4%) (38.8%)
Missing 0 (0%) 0 (0%)
1.00 (0.0%) 0 (0%) 0 (0%) 0 (0%) 0 (0%)
1.00 (0.0%)
1.00 (0.1%)
6.00 (0.3%)
4.00 (0.2%)
1.00 (0.0%)
1.00 (0.0%)
1.00 (0.1%)
1.00 (0.0%)
2.00 (0.1%)
Household Income
<£16,000 49.0
(4.6%) 305
(6.9%) 292
(7.9%) 200
(6.2%) 144
(5.4%) 410
(13.7%) 210
(9.0%) 184
(9.1%) 148
(8.7%) 153
(8.7%) 218
(9.8%) 210
(9.2%) 207
(9.5%) 172
(8.7%) 196
(9.8%) 138
(9.1%)
>£16,000 946
(88.7%) 3819
(85.9%) 3135
(84.7%) 2784
(86.4%) 2309
(87.0%) 2397
(80.3%) 1967
(84.2%) 1702
(84.0%) 1436
(84.5%) 1490
(84.4%) 1841
(83.1%) 1922
(84.4%) 1833
(83.7%) 1688
(85.0%) 1680
(83.8%) 1260
(83.3%)
Prefer not to say 71.0
(6.7%) 320
(7.2%) 275
(7.4%) 239
(7.4%) 200
(7.5%) 178
(6.0%) 159
(6.8%) 141
(7.0%) 115
(6.8%) 122
(6.9%) 156
(7.0%) 145
(6.4%) 149
(6.8%) 125
(6.3%) 129
(6.4%) 114
(7.5%)
Parent Ethnicity
White: British, Irish, other
996 (93.4%)
4187 (94.2%)
3512 (94.9%)
3045 (94.5%)
2514 (94.8%)
2769 (92.8%)
2185 (93.5%)
1907 (94.1%)
1596 (93.9%)
1663 (94.2%)
2072 (93.5%)
2130 (93.5%)
2060 (94.1%)
1881 (94.8%)
1839 (91.7%)
1394 (92.2%)
Other ethnic backgrounds
62.0 (5.8%)
219 (4.9%)
157 (4.2%)
149 (4.6%)
116 (4.4%)
181 (6.1%)
118 (5.1%)
100 (4.9%)
86.0 (5.1%)
81.0 (4.6%)
112 (5.1%)
124 (5.4%)
112 (5.1%)
83.0 (4.2%)
147 (7.3%)
98.0 (6.5%)
Missing 8.00
(0.8%) 38.0
(0.9%) 33.0
(0.9%) 29.0
(0.9%) 23.0
(0.9%) 35.0
(1.2%) 33.0
(1.4%) 20.0
(1.0%) 17.0
(1.0%) 21.0
(1.2%) 31.0
(1.4%) 23.0
(1.0%) 17.0
(0.8%) 21.0
(1.1%) 19.0
(0.9%) 20.0
(1.3%)
Index Child Age Secondary (11-18 years)
387 (36.3%)
1636 (36.8%)
1318 (35.6%)
1081 (33.5%)
904 (34.1%)
1223 (41.0%)
888 (38.0%)
796 (39.3%)
681 (40.1%)
719 (40.7%)
947 (42.8%)
973 (42.7%)
952 (43.5%)
867 (43.7%)
766 (38.2%)
602 (39.8%)
Primary (4-10 years)
679 (63.7%)
2808 (63.2%)
2384 (64.4%)
2142 (66.5%)
1749 (65.9%)
1762 (59.0%)
1448 (62.0%)
1231 (60.7%)
1018 (59.9%)
1045 (59.2%)
1268 (57.2%)
1304 (57.3%)
1237 (56.5%)
1118 (56.3%)
1239 (61.8%)
909 (60.1%)
Missing 0 (0%) 0 (0%) 0 (0%) 0 (0%) 0 (0%) 0 (0%) 0 (0%) 0 (0%) 0 (0%)
1.00 (0.1%) 0 (0%) 0 (0%) 0 (0%) 0 (0%) 0 (0%)
1.00 (0.1%)
Index SEN/ND Status
No SEN/ND 865
(81.1%) 3674
(82.7%) 3042
(82.2%) 2685
(83.3%) 2199
(82.9%) 2461
(82.4%) 1954
(83.6%) 1650
(81.4%) 1401
(82.5%) 1467
(83.1%) 1835
(82.8%) 1885
(82.8%) 1820
(83.1%) 1651
(83.2%) 1673
(83.4%) 1238
(81.9%)
SEN/ND 201
(18.9%) 770
(17.3%) 659
(17.8%) 538
(16.7%) 454
(17.1%) 524
(17.6%) 382
(16.4%) 376
(18.5%) 297
(17.5%) 292
(16.5%) 376
(17.0%) 391
(17.2%) 368
(16.8%) 333
(16.8%) 331
(16.5%) 271
(17.9%)
Missing 0 (0%) 0 (0%)
1.00 (0.0%) 0 (0%) 0 (0%) 0 (0%) 0 (0%)
1.00 (0.0%)
1.00 (0.1%)
6.00 (0.3%)
4.00 (0.2%)
1.00 (0.0%)
1.00 (0.0%)
1.00 (0.1%)
1.00 (0.0%)
3.00 (0.2%)
Index Child’s Pre-existing Mental Health Problems Depression, anxiety, or other
89.0 (8.3%)
265 (6.0%)
182 (4.9%)
158 (4.9%)
135 (5.1%)
151 (5.1%)
115 (4.9%)
102 (5.0%)
84.0 (4.9%)
92.0 (5.2%)
108 (4.9%)
108 (4.7%)
96.0 (4.4%)
102 (5.1%)
78.0 (3.9%)
57.0 (3.8%)
No 977
(91.7%) 4179
(94.0%) 3520
(95.1%) 3065
(95.1%) 2518
(94.9%) 2834
(94.9%) 2221
(95.1%) 1925
(95.0%) 1615
(95.1%) 1673
(94.8%) 2107
(95.1%) 2169
(95.3%) 2093
(95.6%) 1883
(94.9%) 1927
(96.1%) 1455
(96.2%)

22
Appendix C The accompanying tables provide further information on the variability of the data by reporting means and standard deviations (SD) of reported difficulties, as well as percentages of caseness. Standard deviations represent how spread out individual responses are around the average scores. A low standard deviation indicates that the values tend to be close to the average score, while a high standard deviation indicates that the values are spread out over a wider range. Changes in average scores with high SDs should also be interpreted with caution.
Table 1a. Means and standard deviations (SD) of parent/carer reported SDQ scores per month
2020 2021
Mar Apr May Jun Jul August Sep Oct Nov Dec Jan Feb Mar Apr May Jun
Behavioural difficulties Mean 1.94 2.01 2.09 2.21 2.05 2.04 1.80 1.73 1.73 1.73 1.85 1.99 1.88 1.79 1.86 1.94 (SD) (1.86) (1.91) (1.84) (1.91) (1.87) (1.91) (1.79) (1.79) (1.79) (1.76) (1.83) (1.86) (1.84) (1.81) (1.82) (1.91)
Emotional difficulties Mean 3.05 3.02 3.13 3.21 3.04 2.95 2.79 2.80 2.79 2.83 3.02 3.29 3.12 2.98 3.03 3.07 (SD) (2.66) (2.56) (2.64) (2.66) (2.60) (2.64) (2.66) (2.68) (2.69) (2.66) (2.64) (2.77) (2.72) (2.69) (2.72) (2.78)
Attention difficulties Mean 4.17 4.35 4.67 4.83 4.56 4.44 4.18 4.04 4.16 4.18 4.57 4.75 4.41 4.18 4.34 4.25 (SD) (2.76) (2.76) (2.79) (2.81) (2.78) (2.72) (2.73) (2.75) (2.79) (2.80) (2.78) (2.85) (2.82) (2.81) (2.86) (2.88)
Table 1b. Percentage of parent/carer reported possible/probable SDQ cases per month
2020 2021
Mar Apr May Jun Jul August Sep Oct Nov Dec Jan Feb Mar Apr May Jun
Behavioural problems Probable/possible % 17.8 19.2 20.2 21.8 20.1 19.9 16.1 15.8 15.8 15.1 17.2 20.3 17.3 16.7 16.6 19.5 Unlikely % 82.2 80.8 79.8 78.3 79.8 80.1 83.9 84.2 84.2 84.6 82.7 79.6 82.7 83.3 83.3 80.4
Emotional problems Probable/possible % 20.1 19.1 20.3 22.3 20.2 18.9 18.8 18.1 17.9 18.1 20.6 23.0 20.5 19.9 21.2 21.8 Unlikely % 79.9 80.9 79.7 77.7 79.8 81.1 81.2 81.9 82.1 81.6 79.3 77.0 79.5 80.1 78.8 78.2
Attentional problems Probable/possible % 21.1 22.8 25.8 28.6 24.9 22.2 21.4 20.0 22.1 21.4 25.0 28.0 24.3 20.9 24.7 24.1 Unlikely % 78.8 77.2 74.1 71.4 75.1 77.8 78.6 80.0 77.9 78.3 74.9 72.0 75.7 79.1 75.3 75.8
23
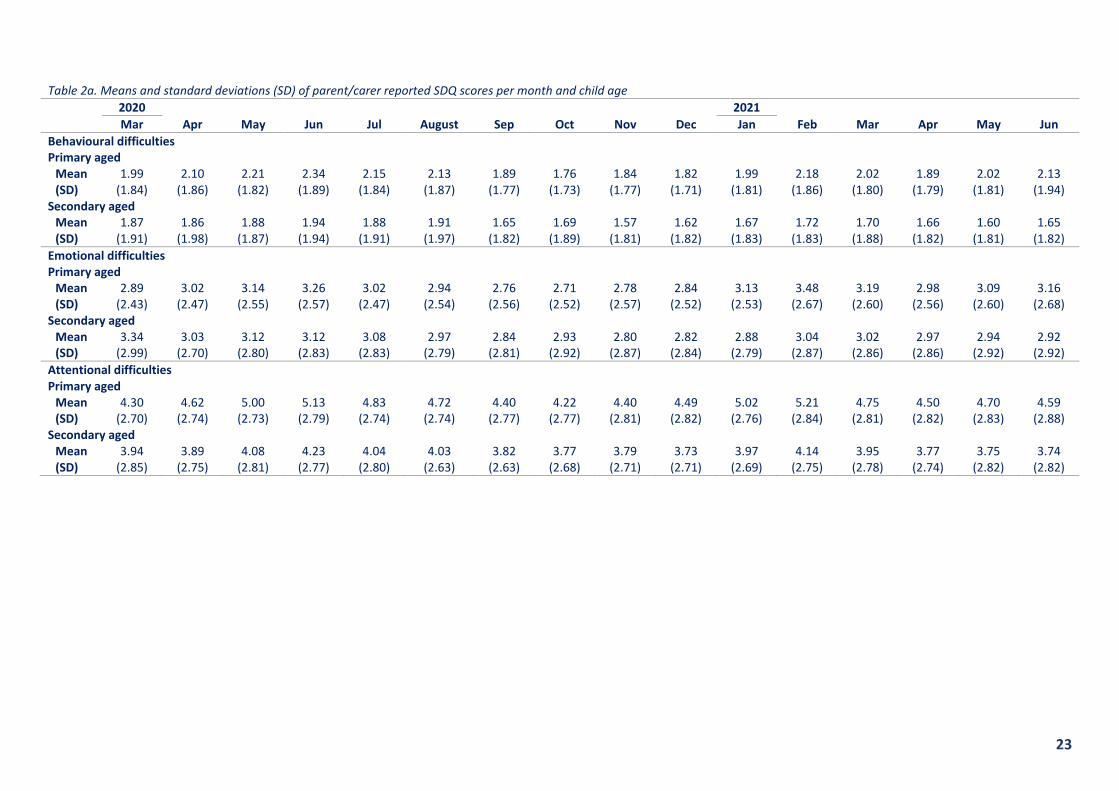
Table 2a. Means and standard deviations (SD) of parent/carer reported SDQ scores per month and child age
2020 2021
Mar Apr May Jun Jul August Sep Oct Nov Dec Jan Feb Mar Apr May Jun
Behavioural difficulties Primary aged
Mean 1.99 2.10 2.21 2.34 2.15 2.13 1.89 1.76 1.84 1.82 1.99 2.18 2.02 1.89 2.02 2.13 (SD) (1.84) (1.86) (1.82) (1.89) (1.84) (1.87) (1.77) (1.73) (1.77) (1.71) (1.81) (1.86) (1.80) (1.79) (1.81) (1.94)
Secondary aged Mean 1.87 1.86 1.88 1.94 1.88 1.91 1.65 1.69 1.57 1.62 1.67 1.72 1.70 1.66 1.60 1.65 (SD) (1.91) (1.98) (1.87) (1.94) (1.91) (1.97) (1.82) (1.89) (1.81) (1.82) (1.83) (1.83) (1.88) (1.82) (1.81) (1.82)
Emotional difficulties Primary aged
Mean 2.89 3.02 3.14 3.26 3.02 2.94 2.76 2.71 2.78 2.84 3.13 3.48 3.19 2.98 3.09 3.16 (SD) (2.43) (2.47) (2.55) (2.57) (2.47) (2.54) (2.56) (2.52) (2.57) (2.52) (2.53) (2.67) (2.60) (2.56) (2.60) (2.68)
Secondary aged Mean 3.34 3.03 3.12 3.12 3.08 2.97 2.84 2.93 2.80 2.82 2.88 3.04 3.02 2.97 2.94 2.92 (SD) (2.99) (2.70) (2.80) (2.83) (2.83) (2.79) (2.81) (2.92) (2.87) (2.84) (2.79) (2.87) (2.86) (2.86) (2.92) (2.92)
Attentional difficulties Primary aged
Mean 4.30 4.62 5.00 5.13 4.83 4.72 4.40 4.22 4.40 4.49 5.02 5.21 4.75 4.50 4.70 4.59 (SD) (2.70) (2.74) (2.73) (2.79) (2.74) (2.74) (2.77) (2.77) (2.81) (2.82) (2.76) (2.84) (2.81) (2.82) (2.83) (2.88)
Secondary aged Mean 3.94 3.89 4.08 4.23 4.04 4.03 3.82 3.77 3.79 3.73 3.97 4.14 3.95 3.77 3.75 3.74 (SD) (2.85) (2.75) (2.81) (2.77) (2.80) (2.63) (2.63) (2.68) (2.71) (2.71) (2.69) (2.75) (2.78) (2.74) (2.82) (2.82)

24
Table 2b. Percentage of parent/carer reported possible/probable SDQ cases per month and child age
2020 2021
Mar Apr May Jun Jul August Sep Oct Nov Dec Jan Feb Mar Apr May Jun
Behavioural problems
Primary aged
Probable/possible % 18.4 20.2 20.9 23.9 22 21.2 16.9 15.4 16.9 15.4 19 23.1 18.3 18.2 18 21.9 Unlikely % 81.6 79.8 79.1 76.1 77.9 78.8 83.1 84.6 83.1 84.4 80.9 76.8 81.7 81.8 81.9 78.1
Secondary aged
Probable/possible % 16.8 17.5 18.8 17.4 16.5 18.2 14.8 16.3 14.1 14.7 14.8 16.6 16.1 14.8 14.4 15.9 Unlikely % 83.2 82.5 81 82.6 83.5 81.8 85.2 83.7 85.9 85 85 83.4 83.9 85.2 85.6 84.1
Emotional problems
Primary aged
Probable/possible % 15.2 17.5 18 21.5 18.6 17 17 15.6 16.2 16.4 20 23.5 19.6 17.7 19.9 21.2 Unlikely % 84.8 82.5 82 78.5 81.4 83 83 84.4 83.8 83.4 79.9 76.5 80.4 82.3 80.1 78.8
Secondary aged
Probable/possible % 28.7 21.9 24.5 24 23.5 21.7 21.8 21.9 20.4 20.6 21.3 22.3 21.7 22.7 23.4 22.6 Unlikely % 71.3 78 75.5 76 76.5 78.3 78.2 78.1 79.6 79.1 78.5 77.7 78.3 77.3 76.6 77.4
Attentional problems
Primary aged Probable/possible % 19.7 23.6 26.5 30.1 25.4 23.6 21.9 20.4 23.3 22.8 28.5 31.5 26.3 21.9 25.7 27.3 Unlikely % 80.1 76.4 73.5 69.9 74.6 76.4 78.1 79.6 76.7 77 71.4 68.5 73.7 78.1 74.3 72.7
Secondary aged
Probable/possible % 23.5 21.4 24.7 25.6 23.9 20.3 20.5 19.5 20.3 19.5 20.2 23.3 21.7 19.5 23 19.4 Unlikely % 76.5 78.6 75.3 74.4 76.1 79.7 79.5 80.5 79.6 80.3 79.6 76.7 78.3 80.5 77 80.6

25
Table 3a. Means and standard deviations (SD) of parent/carer reported SDQ scores per month and child gender
2020 2021
Mar Apr May Jun Jul August Sep Oct Nov Dec Jan Feb Mar Apr May Jun
Behavioural difficulties Female
Mean 1.73 1.83 1.96 2.06 1.90 1.84 1.69 1.66 1.63 1.61 1.77 1.82 1.82 1.69 1.75 1.85 (SD) (1.68) (1.82) (1.82) (1.86) (1.80) (1.81) (1.74) (1.74) (1.74) (1.68) (1.80) (1.80) (1.83) (1.73) (1.79) (1.92)
Male Mean 2.15 2.18 2.22 2.36 2.20 2.22 1.90 1.79 1.80 1.85 1.91 2.14 1.93 1.87 1.94 2.00 (SD) (2.00) (1.97) (1.86) (1.95) (1.91) (1.98) (1.84) (1.83) (1.83) (1.82) (1.81) (1.90) (1.85) (1.86) (1.83) (1.88)
Emotional difficulties Female
Mean 3.17 3.19 3.29 3.30 3.15 3.05 2.97 2.91 2.99 3.03 3.21 3.44 3.30 3.20 3.21 3.26 (SD) (2.64) (2.63) (2.70) (2.71) (2.64) (2.67) (2.77) (2.73) (2.77) (2.65) (2.67) (2.78) (2.75) (2.78) (2.81) (2.83)
Male Mean 2.89 2.84 2.96 3.11 2.93 2.83 2.62 2.67 2.58 2.63 2.80 3.12 2.92 2.74 2.84 2.85 (SD) (2.65) (2.47) (2.55) (2.59) (2.55) (2.60) (2.53) (2.63) (2.61) (2.63) (2.58) (2.74) (2.66) (2.58) (2.61) (2.69)
Attentional difficulties Female
Mean 3.55 3.79 4.13 4.33 4.07 3.99 3.80 3.58 3.74 3.86 4.18 4.25 4.06 3.87 3.87 3.85 (SD) (2.60) (2.55) (2.70) (2.74) (2.69) (2.60) (2.67) (2.71) (2.63) (2.66) (2.74) (2.73) (2.77) (2.74) (2.77) (2.78)
Male Mean 4.76 4.88 5.18 5.30 5.01 4.87 4.52 4.45 4.54 4.51 4.91 5.23 4.72 4.48 4.74 4.59 (SD) (2.77) (2.85) (2.78) (2.80) (2.78) (2.77) (2.74) (2.71) (2.86) (2.89) (2.77) (2.88) (2.83) (2.84) (2.88) (2.92)

26
Table 3b. Percentage of parent/carer reported possible/probable SDQ cases per month and child gender
2020 2021
Mar Apr May Jun Jul August Sep Oct Nov Dec Jan Feb Mar Apr May Jun
Behavioural problems
Female
Probable/possible % 14.8 16.2 17.5 19.1 17.1 16.9 14.3 14.6 13.6 12.8 15.6 17.1 15.6 14.9 14.9 18 Unlikely % 85.2 83.8 82.4 80.9 82.9 83.1 85.7 85.4 86.4 87.2 84.4 82.9 84.4 85.1 85.1 82
Male
Probable/possible % 20.5 22.1 22.5 24.5 23 22.7 17.6 16.5 17.4 17.3 18.4 23.2 18.6 18.1 17.7 20.6 Unlikely % 79.5 77.9 77.5 75.5 77 77.3 82.4 83.5 82.6 82.7 81.6 76.7 81.4 81.9 82.2 79.4
Emotional problems
Female
Probable/possible % 18.6 19.4 21.9 22.1 20.3 18.9 21.1 18 19.2 18.2 21.6 23.2 22.1 21.3 22.5 22.2 Unlikely % 81.4 80.6 78.1 77.9 79.7 81.1 78.9 82 80.8 81.8 78.4 76.8 77.9 78.7 77.5 77.8
Male
Probable/possible % 21.1 18.6 18.4 22 20.1 18.5 16.6 17.8 16.6 17.6 19 22.3 18.7 18.2 19.7 20.7 Unlikely % 78.9 81.4 81.5 78 79.9 81.5 83.4 82.2 83.4 82.4 81 77.7 81.3 81.8 80.3 79.3
Attentional problems
Female Probable/possible % 15.1 16.3 20.3 21.9 19.4 17.4 18 16.2 17.4 17 21.4 22.4 20.9 18 20.3 19.9 Unlikely % 84.7 83.6 79.7 78.1 80.6 82.6 82 83.8 82.5 83 78.6 77.6 79.1 82 79.7 80.1
Male
Probable/possible % 26.9 28.8 30.9 34.9 29.9 26.8 24.2 23.1 26.1 26 27.8 33.2 27.3 23.6 28.3 27.5 Unlikely % 73.1 71.1 69.1 65.1 70.1 73.2 75.8 76.9 73.9 74 72.2 66.8 72.7 76.4 71.7 72.5

27
Table 4a. Means and standard deviations (SD) of parent/carer reported SDQ scores per month and SEN/ND
2020 2021
Mar Apr May Jun Jul August Sep Oct Nov Dec Jan Feb Mar Apr May Jun
Behavioural difficulties SEN/ND
Mean 3.39 3.45 3.23 3.26 3.04 3.17 2.95 2.94 2.91 2.77 2.86 2.92 2.90 2.72 2.88 3.04 (SD) (2.33) (2.39) (2.19) (2.20) (2.17) (2.31) (2.19) (2.19) (2.18) (2.06) (2.17) (2.09) (2.15) (2.14) (2.08) (2.16)
No SEN/ND Mean 1.61 1.71 1.85 1.99 1.85 1.80 1.57 1.46 1.48 1.53 1.65 1.79 1.67 1.60 1.66 1.70 (SD) (1.56) (1.63) (1.66) (1.78) (1.73) (1.73) (1.61) (1.57) (1.59) (1.62) (1.68) (1.75) (1.70) (1.67) (1.69) (1.76)
Emotional difficulties SEN/ND
Mean 5.24 4.97 4.97 4.75 4.74 4.90 4.63 4.70 4.57 4.70 4.72 4.78 4.86 4.90 4.81 5.01 (SD) (2.82) (2.72) (2.88) (2.91) (2.80) (2.83) (2.95) (2.93) (3.04) (2.91) (2.74) (2.89) (2.86) (2.98) (2.90) (2.98)
No SEN/ND Mean 2.54 2.62 2.73 2.90 2.69 2.53 2.43 2.36 2.41 2.47 2.67 2.98 2.77 2.59 2.68 2.64 (SD) (2.34) (2.32) (2.40) (2.49) (2.41) (2.41) (2.44) (2.43) (2.45) (2.44) (2.48) (2.64) (2.55) (2.46) (2.55) (2.54)
Attentional difficulties SEN/ND
Mean 6.76 6.87 6.93 7.05 6.82 6.78 6.57 6.37 6.61 6.53 6.79 6.78 6.73 6.47 6.78 6.66 (SD) (2.62) (2.66) (2.64) (2.61) (2.66) (2.62) (2.68) (2.65) (2.65) (2.70) (2.61) (2.71) (2.68) (2.80) (2.76) (2.74)
No SEN/ND Mean 3.57 3.82 4.19 4.38 4.09 3.94 3.71 3.51 3.63 3.72 4.12 4.33 3.93 3.72 3.85 3.72 (SD) (2.42) (2.48) (2.57) (2.64) (2.57) (2.47) (2.48) (2.48) (2.52) (2.57) (2.58) (2.69) (2.61) (2.57) (2.62) (2.64)

28
Table 4b. Percentage of parent/carer reported SDQ possible/probable cases per month and SEN/ND
2020 2021
Mar Apr May Jun Jul August Sep Oct Nov Dec Jan Feb Mar Apr May Jun
Behavioural problems
SEN/ND
Probable/possible % 43.3 46.5 41.7 42.2 38.1 39.9 36.9 34.6 34.7 34.9 35.1 38.4 36.7 30.3 34.7 39.5 Unlikely % 56.7 53.5 58.1 57.8 61.9 60.1 63.1 65.4 65.3 65.1 64.9 61.6 63.3 69.7 65 60.5
No SEN/ND
Probable/possible % 11.9 13.5 15.5 17.7 16.4 15.7 12 11.5 11.7 11.2 13.5 16.6 13.4 13.9 13 15.2 Unlikely % 88.1 86.5 84.5 82.3 83.5 84.3 88 88.5 88.3 88.8 86.5 83.4 86.6 86.1 87 84.8
Emotional problems
SEN/ND
Probable/possible % 57.2 53.4 51.4 51.5 49.3 52.9 49.5 48.4 45.5 46.6 50.3 48.6 49.7 51.4 50.2 54.2 Unlikely % 42.8 46.6 48.4 48.5 50.7 47.1 50.5 51.6 54.5 53.4 49.7 51.4 50.3 48.6 49.8 45.8
No SEN/ND
Probable/possible % 11.4 11.9 13.6 16.5 14.2 11.7 12.8 11.1 12 12.5 14.6 17.7 14.6 13.6 15.5 14.7 Unlikely % 88.6 88.1 86.4 83.5 85.8 88.3 87.2 88.9 88 87.5 85.4 82.3 85.4 86.4 84.5 85.3
Attentional problems
SEN/ND
Probable/possible % 66.2 66.6 68.3 70.3 65.4 63.7 63.1 58.5 65 62.3 64.6 65.2 65.8 60.1 68.3 62.7 Unlikely % 33.8 33.4 31.7 29.7 34.6 36.3 36.9 41.5 35 37.7 35.4 34.8 34.2 39.9 31.7 37.3
No SEN/ND
Probable/possible % 10.6 13.6 16.6 20.3 16.6 13.4 13.2 11.2 12.9 13.3 16.8 20.3 15.9 12.9 16 15.7 Unlikely % 89.2 86.4 83.3 79.7 83.4 86.6 86.8 88.8 87 86.7 83.2 79.7 84.1 87.1 84 84.3

29
Table 5a. Means and standard deviations (SD) of parent/carer reported SDQ scores per month and household income
2020 2021
Mar Apr May Jun Jul August Sep Oct Nov Dec Jan Feb Mar Apr May Jun
Behavioural difficulties < £16,000 p.a.
Mean 3.29 2.65 2.78 2.76 2.52 2.46 2.26 2.19 2.31 2.17 2.30 2.49 2.44 2.35 2.72 2.83 (SD) (2.78) (2.04) (2.05) (2.08) (1.99) (2.14) (2.01) (1.86) (2.18) (1.93) (2.12) (2.11) (2.16) (2.25) (2.19) (2.24)
> £16,000 p.a. Mean 1.88 1.96 2.04 2.18 2.05 1.99 1.78 1.70 1.69 1.70 1.83 1.96 1.85 1.76 1.78 1.89 (SD) (1.77) (1.88) (1.82) (1.90) (1.86) (1.86) (1.76) (1.78) (1.75) (1.74) (1.79) (1.83) (1.80) (1.76) (1.75) (1.87)
Emotional difficulties < £16,000 p.a.
Mean 4.37 4.35 4.21 4.23 4.13 3.35 3.35 3.55 3.57 3.46 3.43 3.62 3.87 3.49 3.88 3.83 (SD) (3.14) (2.86) (2.78) (2.96) (2.83) (2.91) (2.69) (2.93) (2.99) (3.04) (2.84) (2.97) (3.07) (3.10) (2.91) (3.13)
> £16,000 p.a. Mean 2.98 2.89 3.05 3.13 2.96 2.89 2.74 2.72 2.70 2.79 2.99 3.26 3.05 2.94 2.93 3.02 (SD) (2.63) (2.49) (2.60) (2.62) (2.57) (2.60) (2.64) (2.64) (2.64) (2.60) (2.63) (2.74) (2.67) (2.65) (2.68) (2.73)
Attentional difficulties < £16,000 p.a.
Mean 5.41 5.66 5.59 5.71 5.63 4.94 5.05 5.07 4.95 5.08 4.96 5.32 5.29 4.78 5.30 5.15 (SD) (2.99) (2.72) (2.95) (2.82) (2.79) (2.79) (2.58) (2.73) (2.67) (2.80) (2.70) (2.75) (2.80) (2.89) (2.86) (3.01)
> £16,000 p.a. Mean 4.10 4.26 4.62 4.79 4.52 4.40 4.11 3.96 4.10 4.10 4.56 4.73 4.35 4.15 4.25 4.20 (SD) (2.73) (2.73) (2.76) (2.81) (2.78) (2.69) (2.72) (2.72) (2.78) (2.78) (2.78) (2.86) (2.82) (2.79) (2.85) (2.85)

30
Table 5b. Percentage of parent/carer reported SDQ possible/probable cases per month and household income
2020 2021
Mar Apr May Jun Jul August Sep Oct Nov Dec Jan Feb Mar Apr May Jun
Behavioural problems
< £16,000 p.a.
Probable/possible % 40.8 28.9 33.9 28 27.1 30 24.8 25.5 25.7 26.1 28.9 31 27.5 27.9 31.6 37 Unlikely % 59.2 71.1 66.1 72 72.9 70 75.2 74.5 74.3 73.9 71.1 69 72.5 72.1 68.4 63
> £16,000 p.a.
Probable/possible % 16.6 18.4 19.1 21.5 19.9 18.6 15.6 15 15.1 14.1 16.1 19.6 16.7 16.1 15.3 18.3 Unlikely % 83.4 81.6 80.8 78.5 80 81.4 84.4 85 84.9 85.9 83.9 80.4 83.3 83.9 84.6 81.6
Emotional problems
< £16,000 p.a.
Probable/possible % 42.9 37.4 37 40 34.7 24.4 26.7 28.3 28.4 30.1 30.3 30.5 32.4 32 32.7 31.9 Unlikely % 57.1 62.6 63 60 65.3 75.6 73.3 71.7 71.6 69.9 69.7 69.5 67.6 68 67.3 68.1
> £16,000 p.a.
Probable/possible % 18.8 17.5 19 21.1 19.2 18.1 18.2 17 16.6 17.1 19.7 22.2 19.3 18.9 20.2 21.3 Unlikely % 81.2 82.5 81 78.9 80.8 81.9 81.8 83 83.4 82.9 80.3 77.8 80.7 81.1 79.8 78.7
Attentional problems
< £16,000 p.a.
Probable/possible % 40.8 42.6 41.8 42 39.6 27.8 31.4 34.2 29.7 33.3 35.8 36.2 39.1 30.8 37.8 37.7 Unlikely % 59.2 57 58.2 58 60.4 72.2 68.6 65.8 70.3 66.7 64.2 63.8 60.9 69.2 62.2 62.3
> £16,000 p.a.
Probable/possible % 20.2 21.2 24.7 27.9 24.3 21.5 20.4 18.6 21.4 20.5 24.1 27.6 23 20.2 23.6 23.3 Unlikely % 79.7 78.8 75.2 72.1 75.7 78.5 79.6 81.4 78.5 79.5 75.9 72.4 77 79.8 76.4 76.6