report 010 - deufol.comfinancial report. these envisage sales in a corridor between € 280 million...
TRANSCRIPT

010SECOND QUARTER
SEMI-ANNUAL FINANCIAL REPORT
1 / 400

in € thousand Q2 2010 Q2 2009 6M 2010 6M 2009
Results of operations
Revenue (total) 75,516 69,761 146,320 141,005
Germany 40,386 39,118 78,649 81,744
Rest of the World 35,130 30,643 67,671 59,261
International revenue ratio (%) 46.52 43.9 46.25 42.0
EBITDA 5,197 3,530 9,549 7,451
EBIT 2,966 1,203 5,147 2,779
EBT 1,809 313 2,971 914
Income tax income (expenses) (761) (214) (1,169) (609)
Income (loss) 1,048 99 1,802 305
of which attributable to minority interests 109 83 236 166
of which attributable to the shareholders
of the parent company
939
16
1,566
139
Earnings per share (€) 0.021 0.000 0.036 0.003
Balance sheet
Noncurrent assets 149,818 154,944 149,818 154,944
Current assets 84,801 85,899 84,801 85,899
Balance sheet total 234,619 240,843 234,619 240,843
Equity 95,458 92,875 95,458 92,875
Liabilities 139,161 147,968 139,161 147,968
Equity ratio (%) 40.69 38.56 40.69 38.56
Net financial liabilities 43,620 50,512 43,620 50,512
Cash flow / investments
Cash flow from operating activities 6,500 4,134 7,845 5,585
Cash flow from investing activities (448) (536) (327) (1,512)
Cash flow from financing activities (4,525) (3,236) (4,569) (1,567)
Investments in property, plant and equipment 996 1,166 2,019 2,640
Employees
Employees (as of June 30) 2,724 3,037 2,724 3,037
Key Figures for the D.Logistics Group

Table of Contents
002 Second Quarter 2010
003 Management Report 003 Economic Outline Conditions 004 Results of Operations, Financial and Asset Position 008 Outlook
010 Consolidated Interim Financial Statements 010 Consolidated Income Statement 010 Consolidated Statement of Comprehensive Income 011 Consolidated Balance Sheet 012 Consolidated Cash Flow Statement 013 Consolidated Statement of Changes in Equity
014 Notes to the Consolidated Interim Financial Statements
U03 Additional Information U03 Financial Calendar / Key to Symbols U03 Contact / Imprint
001

D.Logistics in the Second Quarter: Continuing Positive Trend
Adjusted Sales Growth a Good 12 %
Total sales in the second quarter of 2010 were at € 75.5 million 8.2 % above the same period
in the previous year. If the sales trend is adjusted for the changes to the consolidated group
(sale of D.Logistics Airport Services GmbH), this represents organic growth of 12.4 %.
At € 2.97 million, the operating result (EBITA) in the second quarter was 146.6 % above
the level for the same period in the previous year (€ 1.20 million). All segments thus provided
positive operating results. The second-quarter operating cash flow was € 6.50 million (pre-
vious year: € 4.13 million).
The net profit attributable to the shareholders of D.Logistics AG amounted to € 0.94 mil-
lion, compared to € 0.02 million in the same period in the previous year. Earnings per share
in the second quarter were € 0.021 (previous year: € 0.000).
Annual General Meeting Resolves Change of Name
On June 22, the Annual General Meeting of D.Logistics AG resolved to change the Company’s
name to “Deufol Aktiengesellschaft”. This resolution will be implemented in the second half
of the year. This is in line with our goal of working toward a single brand, so as to provide
the Group with a new external profile and thus support our growth strategy. For this purpose,
we shall bring together all the Group companies under a single brand.
Outlook – Planning Confirmed
D.Logistics AG confirms its planning figures published for fiscal year 2010 in its annual
financial report. These envisage sales in a corridor between € 280 million and € 300 million
and an operating result (EBITA) in excess of € 10 million. However, with regard to the sales
trend the business performance to date means that there is still a possibility of exceeding
the upper limit of the forecast range.
Stock Market Slightly Weaker in Q2 – D.Logistics Share Realizes Marginal Growth
In a market environment for shares whose overall trajectory was marginally downward, the
price of the D.Logistics share remained firm. In the first quarter, the share was in a corridor be-
tween € 1.08 and € 1.39. It reached its highest closing price at € 1.39 on June 3, and marked
its lowest at € 1.13 on April 9. The D.Logistics share closed the second quarter at a price of
€ 1.23. Relative to the end of the first quarter, this corresponds to an increase of 2.1 %.
The sector index of logistics stocks quoted in the Prime Standard suffered a fall of 2.0 % in
the second quarter, while the multiple-sector CDAX – on which D.Logistics is listed – dropped
by 3.1 %.
D.Logistics AG CDAX DAXsubsector Logistics
Apr 10 May 10 Jun 10
The D.Logistics share in the second quarter
indexed, in %
115
110
105
100
95
90
85
D.Logistics in the Second Quarter002 Second Quarter 2010

Economic Outline Conditions
Global Economy: Strong Recovery in the First Half of the Year
According to the summer forecast issued by the Kiel Institute for the World Economy, the
global economy has recovered faster than predicted but the risks surrounding the upturn
have increased in the course of the past few weeks. Following a strong boost in the fourth
quarter of 2009, the first three months of the current year saw further global real gross do-
mestic product growth; measured in terms of purchasing-power parities, in the first quarter
of 2010 this may be presumed to have been around 4.5 % higher than a year previously
where output reached its low point during the global recession. A strong increase in global
output should also be expected for the second quarter, according to the Kiel Institute’s indi-
cator for global economic activity which is based on sentiment indicators for 41 countries.
However, the clear increase in output follows in the aftermath of an economic slump which
is unprecedented in post-war history, so that global output is likely to remain significantly
underutilized.
Recovery Still Sluggish in the Eurozone
According to the Kiel Institute, in the first quarter of 2010 overall economic output in the
Eurozone once again grew only slightly, by an annualized rate of 0.8 %. The fact that any
increase was realized at all is attributable to warehouse investments whose growth contri-
bution amounted to 3.5 percentage points, thus more than making up for the other compo-
nents’ weakness. Private consumption fell slightly – probably as a result of the expiry of
scrappage bonuses in various countries – while gross fixed-capital investments were also
wound down significantly, due in part to the severe winter. The growth contribution pro-
vided by external trade was also markedly negative. While exports increased significantly,
the rise in imports was considerably stronger. The economic trend was more or less uni-
form in the key Eurozone countries.
Continued Recovery in Germany
Germany’s economic recovery continued in the 2009 / 2010 winter period, albeit at a mod-
erate pace. However, growth may be expected to have picked up considerably in the spring.
This is suggested by key early indicators which have realized considerable improvements
over the past few months. At the same time though, the risks associated with the economic
trend have also recently increased. Share prices temporarily came under pressure in con-
nection with the turbulence on the financial markets and several Eurozone countries’ bud-
get problems, while volatility increased on the financial markets. The high level of govern-
ment debt in industrialized nations in general is probably the most significant risk for the
economy and for growth.
Business Trend in the Transport and Logistics Sector
Current business conditions in the transport and logistics sector improved in June 2010 rela-
tive to the previous month, according to the survey results of the SCI logistics barometer.
The proportion of companies judging their business conditions to be “good” rose in monthly
terms from 26 % to 47 %, and the proportion of companies judging their current situation to
be “poor” decreased from 15 % to 6 %.
Business situation in thetransport and logistics sector
in %
80
70
60
50
40
30
20
10
0
2009 2010
Source: SCI Verkehr GmbH
poo
r
nor
mal
goo
d
poo
r
nor
mal
goo
d
poo
r
nor
mal
goo
d
April May June
Economic Outline Conditions 003Management Report

Results of Operations, Financial and Asset Position
Clear Sales Growth
Total sales in the second quarter of 2010 were at € 75.5 million 8.2 % above the same period
in the previous year. If the sales trend is adjusted for the changes to the consolidated group
(sale of D.Logistics Airport Services GmbH), this represents organic growth of 12.4 %.
In Industrial Goods Packaging, sales were 3.8 % stronger than in the same quarter in the
previous year, while in the Consumer Goods Packaging segment, sales were 19.2 % higher
than in the previous year, not least due to the strong improvement in the USA. In the Ware-
house Logistics segment, sales decreased by 2.6 %, but after adjustment for the airport busi-
ness an increase of 23.4 % resulted.
With a 53.5 % share of Group sales, the proportion accounted for by Germany declined
by 2.6 percentage points on the previous year. This was partly due to the above-mentioned
company sale. The USA’s share of sales rose by 4.7 percentage points to 19.7 %. The pro-
portion of sales elsewhere in Europe fell from 29.0 % to 26.8 %.
In the first six months, at € 146.3 million, sales were 3.8 % higher than in the same
period in the previous year. Adjusted for changes to the consolidated group, this means
organic growth of 7.4 %. Allowing for currency fluctuations, the growth rate also amounts
to approx. 7.4 %.
Strong Improvement in Operating Result
At € 2.97 million, the operating result (EBITA) in the second quarter was 146.6 % above
the level for the same period in the previous year (€ 1.20 million). At € 5.20 million, earn-
ings before interest, taxes, depreciation and amortization (EBITDA) were 47.2 % higher
than in the same quarter in the previous year. The EBITDA margin was 6.9 % (previous
year: 5.1 %). Depreciation of tangible assets and amortization of other intangible assets
decreased from € 2.33 million to € 2.23 million.
The individual segments performed as follows: Industrial Goods Packaging recorded
an EBITA decrease of 24.0 % to € 1.95 million. In Consumer Goods Packaging, EBITA
amounted to € 0.98 million, compared to a loss of € 0.34 million in the previous year. Ware-
house Logistics recorded an operating profit of € 0.66 million (previous year: – € 0.62 mil-
lion). Besides the improved business trend, the end to the losses resulting from the airport
business and the start-up losses in Euskirchen were further positive factors here. The EBITA
loss of D.Logistics AG (Holding) was € 0.65 million (previous year: € 0.39 million). In the
first half of the year, the Group EBITA of € 5.15 million is 85.2 % higher than in the same
period in the previous year (€ 2.78 million).
Financial results decreased on the same quarter in the previous year from – € 0.89 mil-
lion to – € 1.16 million. Financial income declined slightly (– 0.6 to € 0.34 million), finance
costs increased (+ 0.2 to € 1.64 million) and the share of earnings accounted for by associ-
ates was slightly lower (– 0.05 to € 0.14 million).
Earnings before taxes (EBT) in the second quarter amounted to € 1.81 million (previous
year: € 0.30 million) and in the first six months to € 2.97 million (previous year: € 0.91 mil-
lion). After tax expenses (€ 0.76 million), the result for the second quarter is € 1.05 million
(previous year: € 0.10 million).
After deduction of the third-party profit shares (€ 0.11 million), there is a net profit of
€ 0.94 million (previous year: € 0.02 million) attributable to the shareholders of D.Logistics
AG. The cumulative profits for the shareholders of D.Logistics AG as of June 30, 2010
71.2
03/09
60%
40%
70.8
03/10
54%
46%
Sales
in € million
400
350
300
250
200
150
100
50
0
09/09
56%
44%
215.3
06/09
58%
42%
141.0
06/10
54%
46%
146.3
Germany Rest of the World
12/09
290.0
55%
45%
EBITA
in € million
8
7
6
5
4
3
2
1
0
6.4
5.1
2.8
5.1
2.2
1.6
03/09 03/10 06/09 06/10 09/09 12/09
004 Management Report Results of Operations, Financial and Asset Position
Results of Operations

amounted to € 1.56 million (previous year: € 0.14 million). The earnings per share in the
second quarter were € 0.021 (previous year: € 0.000); in the first half-year, they reached
€ 0.036 (previous year: € 0.003).
Positive Cash Flow Development
The second-quarter net cash provided by operating activities amounted to € 6.50 million and
was thus more than 57 % higher than in the previous year (€ 4.13 million).
The net cash used in investing activities was negative at – € 0.45 million (previous year:
– € 0.54 million). The outflows of funds resulted from the payments made for acquisitions of
assets (– € 0.93 million) and the increase in financial receivables (– € 0.29 million) plus the
purchase of minority interests (– € 0.09 million). Inflows of funds resulted from the disposal of
assets (+ € 0.24 million), interest received (+ € 0.33 million) and dividends (+ € 0.30 million).
The net cash used in financing activities was negative at – € 4.53 million (previous
year: – € 3.24 million). The outflows resulted from the decrease in amounts owed to banks
(– € 2.40 million), interest paid (– € 1.60 million), the decrease in other financial liabilities
(– € 0.42 million) and dividends paid to minority shareholders (– € 0.10 million). Cash in-
creased in quarterly terms by € 1.53 million to € 17.80 million.
Slight Fall in Financial Indebtedness
The financial indebtedness of the D.Logistics Group decreased in the first six months of
the fiscal year by € 1.1 million to € 77.8 million. As cash and financial receivables simul-
taneously increased (+ € 2.8 million), the net financial liabilities fell more significantly, by
€ 3.9 million, from € 47.5 million at the end of the year to € 43.6 million.
Balance Sheet Total Marginally Higher
The balance sheet total as of June 30, 2010 is at € 234.6 million 0.9 % above the level at
the end of the previous year (€ 232.5 million). Of the noncurrent assets, property, plant and
equipment (+ 0.4 to € 51.5 million) and goodwill – which rose due to the increase in the
investment in Alltrans GmbH (+ 0.3 to € 64.8 million) – realized the largest rises in value.
Financial receivables decreased (– 0.9 to € 12.5 million), as did “other receivables and
other assets” (– 0.5 to € 3.5 million) and other intangible assets (– 0.4 to € 3.3 million). The
other noncurrent assets remained largely unchanged. Of the current assets, cash (+ 3.0 to
€ 17.8 million), the “other receivables and other assets” item (+ 2.0 to € 8.0 million) and
inventories (+ 1.2 to € 12.9 million) realized the strongest increases. Financial receivables
(+ 0.8 to € 3.8 million) and tax receivables (+ 0.2 to € 1.8 million) also increased. Trade re-
ceivables significantly declined (– 3.8 to € 40.5 million).
On the liabilities side, the equity (including minority interests) rose in the first six
months of 2010 on balance by € 3.8 million to € 95.5 million. The other recognized income
and expense (+ € 2.2 million) and the profit for the period (+ € 1.6 million) had a positive
effect here. The minority interests also rose slightly (+ 0.1 to € 1.3 million). With a slightly
increased balance sheet total, the equity ratio increased from 39.4 % to 40.7 %. The liabili-
ties decreased on balance by € 1.7 million to € 139.2 million.
16
14
12
10
8
6
4
2
0
Net cash provided by (used in) operating activities
in € million
60
50
40
30
20
10
0
Net financial liabilities
in € million
100
90
80
70
60
50
40
30
20
10
0
Balance sheet structure
Share in %
Current
assets
Noncurrent
assets
12/09 06/1012/09 06/10
65%
Assets Equity and liabilities
Current
liabilities
Equity
Noncurrent
liabilities
35%37%
22%
39%64%
38%
23%
41%
36%
1.5
03/09 03/10
1.4
06/09
5.6
06/10
7.9
12/09
15.0
09/09
9.4
48.247.543.6
49.950.5
03/1012/09 06/1009/0906/09
005Management ReportResults of Operations, Financial and Asset Position
Financial Position
Asset Position

Slight Increase in Number of Employees
On June 30, 2010, the D.Logistics Group had 2,724 employees worldwide. This is 19 employ-
ees or 0.7 % more than at the end of last year. The main increases were in Industrial Goods
Packaging (+ 14 employees) but Warehouse Logistics also recorded workforce growth
(+ 6 employees), while Consumer Goods Packaging registered a slight fall in personnel
(– 2 employees).
As of the cut-off date of June 30, 2010, D.Logistics had 1,588 employees in Germany
(March 31, 2010: 1,576) and 1,136 employees elsewhere (March 31, 2010: 1,129).
Development in the Segments
Industrial Goods Packaging
in € thousand Q2 2010 Q2 2009 6M 2010 6M 2009
Sales 40,197 38,388 80,904 81,319
Consolidated sales 34,184 32,925 68,509 69,709
Gross profit 4,007 5,002 8,020 9,731
EBITA 1,947 2,563 3,900 5,109
EBITA margin (%) 5.7 7.8 5.7 7.3
EBTA 1,759 2,461 3,567 4,963
At € 34.2 million, the consolidated sales for Industrial Goods Packaging in the second
quarter of 2010 exceeded the sales for the same quarter in the previous year by 3.8 %. For
the first six months, at € 68.5 million, sales were slightly lower than in the previous year
(– 1.7 %). This segment is therefore now contributing 46.8 % to Group sales (compared to
49.4 % in the first half of 2009).
The operating result (EBITA) fell in the second quarter in annual terms by 24.0 % to
€ 1.95 million. The cumulative EBITA of € 3.90 million was 23.7 % below the same period in the
previous year. This fall is mainly due to a lack of project business which was successfully handled
in the previous year.
Employees 06 / 2010 03 / 2010
D,Logistics Group
Industrial Goods Packaging 1,098 1,084
Share (%) 40.31 40.08
Consumer Goods Packaging 736 738
Share (%) 27.02 27.28
Warehouse Logistics 883 877
Share (%) 32.41 32.42
Holding company 7 6
Share (%) 0.26 0.22
Total 2,724 2,705
006 Management Report Results of Operations, Financial and Asset Position
Employees
Development in the Segments

Consumer Goods Packaging
in € thousand Q2 2010 Q2 2009 6M 2010 6M 2009
Sales 30,384 25,453 56,581 48,994
Consolidated sales 29,803 24,998 55,512 48,038
Gross profit 3,719 2,541 6,551 5,209
EBITA 980 (344) 1,348 (570)
EBITA margin (%) 3.3 (1.4) 2.4 (1.2)
EBTA 198 (820) (156) (1,768)
In the Consumer Goods Packaging segment, the consolidated sales in the second quarter
were at € 29.8 million 19.2 % higher than in the same period in the previous year. In the
first six months, sales increased by 15.6 %. This segment is therefore contributing 37.9 %
to Group sales (compared to 34.1 % in the first half of 2009). Adjusted for the exchange
rate change, the sales were 15.3 % above the level for the previous year. The strong result
in the USA – where sales rose by 38.9 % (on a currency-adjusted basis: 38.4 %) – was a
key factor behind this sales trend.
The second-quarter operating result (EBITDA) increased to € 0.98 million (previous
year: – € 0.34 million). In the first six months, the EBITA amounted to € 1.35 million (previ-
ous year: – € 0.57 million). This improvement is mainly due to better results in the USA
and Belgium.
Warehouse Logistics
in € thousand Q2 2010 Q2 2009 6M 2010 6M 2009
Sales 11,781 12,381 22,848 24,283
Consolidated sales 11,456 11,759 22,153 23,102
Gross profit 1,802 602 3,458 1,221
EBITA 659 (616) 1,074 (1,076)
EBITA margin (%) 5.8 (5.2) 4.8 (4.7)
EBTA 546 (721) 845 (1,238)
In the Warehouse Logistics segment, in the second quarter at € 11.5 million consolidated
sales were 2.6 % lower than in the previous year, and in the first six months they registered
a fall of 4.1 %. This segment is therefore contributing 15.1 % to Group sales (compared to
16.4 % in the first half of 2009). After adjustment for the sold airport business a favorable
increase of 21.1 % resulted.
The operating profit (EBITA) in the second quarter amounted to € 0.66 million,
compared to a loss in the previous year of € 0.62 million. After six months, EBITA were
€ 1.07 million (previous year: – € 1.08 million). Besides the improved business trend, the
end to the losses resulting from the airport business was a further positive factor here.
Results in the first half of 2009 also suffered due to the start-up losses incurred for the
“customization center” in Euskirchen.
007Management ReportResults of Operations, Financial and Asset Position
Development in the Segments

OutlookGlobal Economic Recovery Slows
According to the Kiel Institute for the World Economy, most early indicators currently indi-
cate continuing strong output growth. In the spring quarter, the global economy is likely to
have realized a further strong upturn. However, for the second half of 2010 and for 2011 in
particular, the economists predict a noticeable slowdown in the global economic trend, es-
pecially due to the winding-down of the economic policy incentives which had encouraged
the upswing. In some countries – not least in several key emerging markets – the early
indicators have already registered significant falls. A key issue is the extent to which the
restrictive influence of financial policy and a gradual tightening of monetary policy and, in
industrialized nations, above all the withdrawal of quantitative stimulus measures will trig-
ger an economic slowdown.
In overall terms, the Kiel Institute predicts a rise in global output which this year, at a
rate of 4.4 %, will roughly match the level seen in the pre-recession boom years, thanks
to the strong trend up to the middle of the year. However, in the coming year, real gross
domestic product growth may be expected to fall to 3.7 %, a rate which will not enable any
further increase in utilization of global capacities.
Eurozone: Declining Economic Trend
In the Eurozone, the economic revival currently underway has been supported by the up-
turn in the global economy. A further factor is catch-up effects in the construction sector
following the weather-related stoppages during the winter period. However, according to
the Kiel Institute, there will be a downturn in output growth in the second half of the year
and in the coming year in particular the pan-European consolidation measures will have
a slowdown effect, so that only a moderate rise in output should be expected in this time
frame. The consequences of the crisis of confidence – which in some cases has led to ef-
forts to find drastic savings in public budgets – are likely to be particularly acute in the
countries situated on the Eurozone’s periphery. Besides the consolidation measures, the
recent turbulences on the financial markets will also have a negative effect on the econ-
omy. The increased current yields on government bonds have impacted on bonds issued
by companies and banks and have temporarily brought about a significant worsening in
financing terms, at least in the peripheral countries. As a result of the financial policy con-
traction, Greece and also Spain and Portugal should experience further significant falls in
output during the forecast period.
In respect of overall economic output in the Eurozone, the economists predict a rise of
roughly one percent both this year and next.
008 Management Report Outlook

Germany: Slowdown in the Pace of Recovery
The economic trend in Germany is currently very strong, and a pronounced increase in over-
all economic output may be assumed for the second quarter. However, a clear slackening of
the pace of recovery should be expected for the remainder of the year. The key factor here
is that global economic growth has likely peaked, so that impulses from outside Germany
will drop off. In particular, the rise in demand elsewhere in the Eurozone will only be very
moderate, since several countries have adopted a clearly restrictive financial policy or sig-
naled their intention to do so.
There should be a significant increase in domestic demand this year in Germany, due in
part to the stimuli provided by financial policy which is still providing the construction in-
dustry with a boost and has granted tax cuts to private households. Moreover, the interest
rate level is extremely low, and long-term interest rates even recorded a further fall in the
period under review, partly due to the turbulences on the financial markets in the Eurozone.
This should buoy demand for housing construction in particular. There will probably only
be a very moderate increase in corporate investments. In the context of a continuing low
level of capacity utilization, no major expansion investments should be expected. Unlike in
the previous year, external trade will once again provide a positive growth contribution.
All in all, for 2010 the Kiel economists predict a 2.1 % increase in real gross domestic
product. In 2011, GDP should rise by just 1.2 %.
No Change in Positive Industry Outlook
The business predictions for the transport and logistics sector remained largely unchanged
in June. The proportion of companies surveyed which predict a more favorable business
trend in the next three months decreased from 35 % in May to 33 % in June; 61 % expect
the trend to remain unchanged, while 6 % of those surveyed expect to see a weaker busi-
ness trend in the next quarter.
With regard to the future cost trend, over the next three months 59 % of the companies
surveyed expect to see a constant trend, while with regard to the price trend 58 % predict
unchanged prices.
Company-Specific Outlook
Risks and Opportunities
The risks and opportunities described in the report on expected developments and the risk
report contained in the Group management report for the 2009 annual financial statements
remain applicable.
Outlook – Planning Confirmed
D.Logistics AG confirms its planning figures published for fiscal year 2010 in its annual fi-
nancial report. These envisage sales in a corridor between € 280 million and € 300 million
and an operating result (EBITA) in excess of € 10 million. However, with regard to the sales
trend the business performance to date means that there is still a possibility of exceeding
the upper limit of the forecast range. Source: SCI Verkehr GmbH
Expected business trend in thetransport and logistics sector
in %
80
70
60
50
40
30
20
10
0
2009 2010
wor
se
un
chan
ged
bet
ter
wor
se
un
chan
ged
bet
ter
wor
se
un
chan
ged
bet
ter
April May June
009Management ReportOutlook

Consolidated Income Statement (IFRS)
Apr. 1, 2010 – Apr. 1, 2009 – Jan. 1, 2010 – Jan. 1, 2009 –in € thousand Jun. 30, 2010 Jun. 30, 2009 Jun. 30, 2010 Jun. 30, 2009 Note / Page
Sales 75,516 69,761 146,320 141,005 01 / 15
Cost of sales (65,911) (61,885) (128,245) (125,319)
Gross profit 9,605 7,876 18,075 15,686
Selling expenses (1,312) (1,124) (2,696) (2,220)
General and administrative expenses (5,335) (5,963) (10,137) (11,719)
Other operating income 436 552 699 1,606
Other operating expenses (428) (138) (794) (574)
Profit (loss) from operations (EBIT) 2,966 1,203 5,147 2,779
Financial income 336 403 690 889
Finance costs (1,636) (1,481) (3,119) (3,106)
Share of profit of associates 143 188 253 352
Profit (loss) before taxes (EBT) 1,809 313 2,971 914
Income tax expenses (761) (214) (1,169) (609)
Income (loss) 1,048 99 1,802 305
of which income (loss) attributable to minority interests 109 83 236 166
of which income attributable to equity holders of parent
939
16
1,566
139
Earnings per share in €
Basic and diluted earnings per share, based on
the income (loss) attributable to common shareholders
of D.Logistics AG
0.021
0.000
0.036
0.003
02 / 15
Average number of shares in circulation 43,773,655 43,772,824 43,773,655 43,860,648 02 / 15
Consolidated Statement of Comprehensive Income
Apr. 1, 2010 – Apr. 1, 2009 – Jan. 1, 2010 – Jan. 1, 2009 –in € thousand Jun. 30, 2010 Jun. 30, 2009 Jun. 30, 2010 Jun. 30, 2009 Note / Page
Income 1,048 99 1,802 305
Other recognized income and expense 1,304 (2,393) 2,214 (630)
Exchange rate differences on translation of foreign operations
Before tax 1,273 (2,481) 2,231 (472)
Tax 0 0 0 0
After tax 1,273 (2,481) 2,231 (472)
Gain (loss) on cash flow hedges
Before tax 44 124 (24) (224)
Tax (13) (36) 7 66
After tax 31 88 (17) (158)
Total comprehensive income after tax 2,352 (2,294) 4,016 (325)
of which attributable to minority interests 109 83 236 166
of which attributable to equity holders of parent 2,243 (2,377) 3,780 (491)
010 Consolidated Interim Financial Statements Consolidated Income Statement

Consolidated Balance Sheet (IFRS)
Assets Jun. 30, 2010 Dec. 31, 2009 Note / Pagein € thousand
Noncurrent assets 149,818 151,007
Property, plant and equipment 51,461 51,112
Investment property 467 495
Goodwill 64,750 64,464
Other intangible assets 3,262 3,672
Equity-method accounted investments 2,766 2,813
Financial receivables 12,537 13,423
Other financial assets 225 225
Other receivables and other assets 3,440 3,974
Deferred tax assets 10,910 10,829
Current assets 84,801 81,496
Inventories 12,894 11,688
Trade receivables 40,500 44,282
Other receivables and other assets 7,984 6,019
Tax receivables 1,832 1,637
Financial receivables 3,789 3,017
Cash and cash equivalents 17,802 14,853
Total assets 234,619 232,503
Liabilities Jun. 30, 2010 Dec. 31, 2009 Note / Pagein € thousand
Equity 95,458 91,614
03 / 16
Equity attributable to equity holders of D.Logistics AG 94,124 90,344
Subscribed capital 43,774 43,774
Capital reserves 107,240 107,240
Accumulated losses (52,288) (53,854)
Other recognized income and expense (4,602) (6,816)
Equity attributable to minority interests 1,334 1,270
Noncurrent liabilities 51,519 53,612
Financial liabilities 43,074 44,869
Provisions for pensions 1,318 1,335
Other provisions 508 508
Other liabilities 4,545 4,688
Deferred tax liabilities 2,074 2,212
Current liabilities 87,642 87,277
Trade payables 25,084 26,084
Financial liabilities 34,674 33,948
Other liabilities 22,800 22,147
Tax liabilities 2,774 2,083
Other provisions 2,310 3,015
Total equity and liabilities 234,619 232,503
011Consolidated Interim Financial StatementsConsolidated Balance Sheet

Consolidated Cash Flow Statement
Apr. 1, 2010 – Apr. 1, 2009 – Jan. 1, 2010 – Jan. 1, 2009 –in € thousand Jun. 30, 2010 Jun. 30, 2009 Jun. 30, 2010 Jun. 30, 2009 Note / Page
Profit (loss) from operations (EBIT) 2,966 1,203 5,147 2,779
Adjustments to reconcile income (loss)
to cash flows from operating activities
Depreciation and amortization charges 2,231 2,327 4,402 4,672
(Gain) loss from disposal of property, plant and equipment (19) 1 (39) 0
Other noncash expenses (revenue) 0 1 0 2
Taxes paid (498) (761) (889) (894)
Changes in assets and liabilities from operating activities
Change in trade accounts receivable 583 3,559 3,782 (697)
Change in inventories (964) (822) (1,206) (2,448)
Change in other receivables and other assets 397 (1,868) (1,265) (403)
Change in trade accounts payable 1,233 (1,185) (1,000) (885)
Change in other liabilities 744 1,512 251 3,355
Change in accrued expenses 208 (7) (749) (27)
Change in other operating assets / liabilities (net) (381) 174 (589) 131
Net cash provided by (used in) operating activities 6,500 4,134 7,845 5,585 04 / 16
Purchase of intangible assets and property,
plant and equipment
(934)
(1,108)
(1,673)
(2,714)
Proceeds from the sale of intangible assets and property,
plant and equipment
235
502
428
516
Proceeds from the sale of financial assets 0 0 0 1,012
Purchase of minority interests (87) 0 (175) 0
Dividends received 300 0 300 0
Net change in financial receivables (292) 0 114 (1,057)
Interest received 330 342 679 731
Net cash provided by (used in) investing activities (448) (536) (327) (1,512) 04 / 16
Net change in borrowings (2,406) 610 (589) 326
Payments for the purchase of treasury stock 0 (389) 0 (389)
Dividends paid to minority shareholders (102) 73 (102) 73
Net change in other financial liabilities (422) 3,861 (846) (4,566)
Interest paid (1,595) (1,519) (3,032) (2,933)
Net cash provided by (used in) financing activities (4,525) 1,669 (4,569) (1,567) 04 / 16
Effect of exchange rate changes and changes in the scope of
consolidation on cash and cash equivalents
0
0
0
0
Change in cash and cash equivalents 1,527 2,144 2,949 2,506 04 / 16
Cash and cash equivalents at the beginning of the period 16,275 12,143 14,853 12,143
Cash and cash equivalents at the end of the period 17,802 14,287 17,802 14,649
012 Consolidated Interim Financial Statements Consolidated Cash Flow Statement

Consolidated Statement of Changes in Equity
Sub
scri
bed
capi
tal
Acc
umul
ated
loss
es
Other recognized
income
and expense
Equ
ity
attr
ibut
able
to
equi
ty h
olde
rs o
f D
.Log
isti
cs A
G
in € thousand Cap
ital
res
erve
s
Cum
ulat
ive
tran
slat
ion
adju
stm
ent
Res
erve
for
cash
flo
w h
edge
s
Equ
ity
attr
ibut
able
to
min
orit
y in
tere
sts
Tota
l equ
ity
Balance at Dec. 31, 2008 44,155 107,243 (51,159) (4,406) (637) 95,196 1,528 96,724
Income (loss) — — 139 — — 139 166 305
Changes recognized directly in equity — — — (472) (224) (696) — (696)
Deferred taxes for valuation changes
recognized directly in equity
—
—
—
—
66
66
—
66
Total recognized income and expense — — 139 (472) (158) (491) 166 (325)
Treasury stock (382) (7) — — — (389) — (389)
Share-based payment — 2 — — — 2 — 2
Dividends — — (3,064) — — (3,064) (73) (3,137)
Balance at June 30, 2009 43,773 107,238 (54,084) (4,878) (795) 91,253 1,610 92,875
Balance at Dec. 31, 2009 43,774 107,240 (53,854) (6,083) (733) 90,344 1,270 91,614
Income (loss) — — 1,566 — — 1,566 236 1,802
Changes recognized directly in equity — — — 2,231 (24) 2,207 — 2,207
Deferred taxes for valuation changes
recognized directly in equity
—
—
—
—
7
7
—
7
Total recognized income and expense — — 1,566 2,231 (17) 3,780 236 4,016
Dividends — — — — — — (102) (102)
Purchase of minority interests — — — — — — (70) (70)
Balance at June 30, 2010 43,774 107,240 (52,288) (3,852) (750) 94,124 1,334 95,458
013Consolidated Interim Financial StatementsConsolidated Statement of Changes in Equity

Notes to the Consolidated Interim Financial Statements
These consolidated financial statements for the interim report – which have not been audited or verified
by an auditor – describe the business activities of D.Logistics AG and its subsidiaries (the “Group”). The
statements were produced in accordance with IFRS (“International Financial Reporting Standards”).
All IFRSs (IFRSs, IASs, IFRICs, SICs) as adopted by the European Union and effective as of the balance
sheet date were applied.
In principle, the balancing and valuation methods used are those for the last consolidated financial
statements as of the end of the fiscal year. A detailed description of these methods is provided in our
annual report for the year 2009. In addition, IAS 34 “Interim Financial Statements” was applied.
The first-time application of the new standards and interpretations which are mandatory from fiscal year
2010 had no effect on the recognition and measurement of assets and liabilities.
All significant subsidiaries subject to the legal and factual control of D.Logistics AG were included in
the consolidated financial statements.
The consolidated group is as follows:
Dec. 31, 2009 Additions Disposals Jun. 30, 2010
Consolidated subsidiaries 36 0 0 36
thereof in Germany 23 0 0 23
thereof abroad 13 0 0 13
Companies valued using the equity method
4
0
0
4
thereof in Germany 3 0 0 3
thereof abroad 1 0 0 1
Total 40 0 0 40
General Accounting and Valuation Methods
New Accounting Standards
Scope of Consolidation
014 Consolidated Interim Financial Statements Notes to the Consolidated Interim Financial Statements

In accordance with IAS 21, the financial statements of the foreign subsidiaries included in the consolidated
financial statements whose functional currency is not the euro were converted into the Group currency
euro on the balance sheet cut-off date on the basis of the functional currency concept. The conversion was
in accordance with the modified closing rate method.
The exchange rates for the translation of currencies that are not part of the European Monetary Union
changed as follows:
Middle rate as of the balance Average rate of exchangesheet date
Foreign currency per € Jun. 30, 2010 Dec. 31, 2009 6M 2010 6M 2009
US dollar 1.2271 1.4406 1.3285 1.3322
Czech crown 25.6910 26.4730 25.7340 27.1518
With effect as of January 1, 2010, Tailleur & Topp GmbH acquired the outstanding 34.5 % of the shares in
Alltrans Exportverpackung GmbH for a purchase price of € 350 thousand. In the consolidated financial
statements, this produced additional goodwill in the amount of € 281 thousand.
In respect of further comments on the sales, we refer to the segment reporting.
The basic earnings per share are calculated in accordance with IAS 33 as a quotient from the Group result
due to the shareholders of D.Logistics AG and the average number of shares in circulation during the pe-
riod under review. Newly issued shares are to be taken into consideration pro rata temporis for the period
in which they are in circulation.
Income in € thousand Apr. 1, 2010 – Apr. 1, 2009 – Jan. 1, 2010 – Jan. 1, 2009 –Jun. 30, 2010 Jun. 30, 2009 Jun. 30, 2010 Jun. 30, 2009
Result attributable to the holders
of D.Logistics AG common stock
939
16
1,566
139
Shares outstanding figures in units
Weighted average number of shares 43,773,655 43,772,824 43,773,655 43,962,845
Earnings per share figures in €
Basic and diluted earnings per share,
based on the profit attributable to holders of
D.Logistics AG common stock
0.021
0.000
0.036
0.003
Currency Translation
Acquisitions and Sales
01 Sales
02 Earnings per Share
015Notes to the Consolidated Interim Financial Statements Consolidated Interim Financial Statements

There was no change in the subscribed capital and in the capital reserves in the first six months of 2010.
In accordance with the resolution passed by the Annual General Meeting on June 22, 2010, the
Company has been authorized to purchase up to 4,377,365 of its own shares in the period from
June 22, 2010 to June 21, 2015; this corresponds to approx. 10 % of the share capital as of June 2010.
The cash flow statement shows the origin and appropriation of the money flows in the first six months of
the fiscal years 2009 and 2010. It is of key significance for an assessment of the financial position of the
D.Logistics Group.
The cash funds shown in the cash flow statement correspond to the balance sheet item “Cash and
cash equivalents”.
The net cash provided by operating activities has been adjusted for changes to the scope of consoli-
dation and in the first six months of 2010 amounted to € 7,845 thousand.
The outflow of funds from investing activities amounted to € 327 thousand and includes interest re-
ceived as well as the cash flows from the acquisition and sale of property, plant and equipment and the
purchase of minority interests.
The outflow of funds from financing activities amounting to € 4,569 thousand mainly reflects the
balance of funds borrowed and repaid under the current operating resources financing, the scheduled
repayments of noncurrent financing liabilities as well as interest paid.
The cash and cash equivalents balance increased by € 2,949 thousand in the first six months.
No dividend was distributed in the first six months of 2010.
There were no significant changes in the contingencies in relation to December 31, 2009.
There were no significant events after the balance sheet date.
03 Equity
04 Cash Flow Statement
Dividend
Contingencies
Significant Events after the Balance Sheet Date
016 Consolidated Interim Financial Statements Notes to the Consolidated Interim Financial Statements
The segment reporting is prepared in accordance with the provisions of IFRS 8 (Operating Segments).
For the purpose of corporate management, the business fields of D.Logistics AG are organized in ac-
cordance with its products and services. The D.Logistics Group has the following segments for which
reporting requirements apply.
The Industrial Goods Packaging segment performs specialist logistics activities for manufacturers
of capital and investment goods, such as packaging design, the production of special packaging, export
packaging logistics, long-term packaging and the management of major logistics projects.
The Consumer Goods Packaging segment comprises logistics services for the consumer goods in-
dustry. The activities consolidated under this segment include the design and production of packaging,
primary packaging, secondary packaging (display construction), warehouse planning and management,
distribution logistics, transport coordination, document management and value-added services.
The Warehouse Logistics division comprises logistics services such as warehouse planning and man-
agement, assembling, spare-parts logistics, just-in-time logistics and value-added services.
The holding company covers the Group’s administrative activities and, in addition to Group manage-
ment functions, includes support functions such as key account management and corporate communica-
tions.
The operating result for the business units is separately monitored by the management in order to
make decisions on the allocation of resources and to determine the units’ performance. The segments’
development is mainly measured with reference to the operating result. As the D.Logistics Group has
a decentralized organizational structure, financial expenses and income and income taxes can be allo-
cated to the individual business segments.
The D.Logistics Group mainly operates in Germany, Italy, Belgium, parts of Eastern Europe and the
USA. Accordingly, for the secondary reporting format a distinction between Germany, Rest of Europe
and USA / Rest of the World has been opted for.
The prices charged between the business segments are determined on the basis of standard market
conditions between unrelated parties.
Segment Information
017Notes to the Consolidated Interim Financial Statements Consolidated Interim Financial Statements
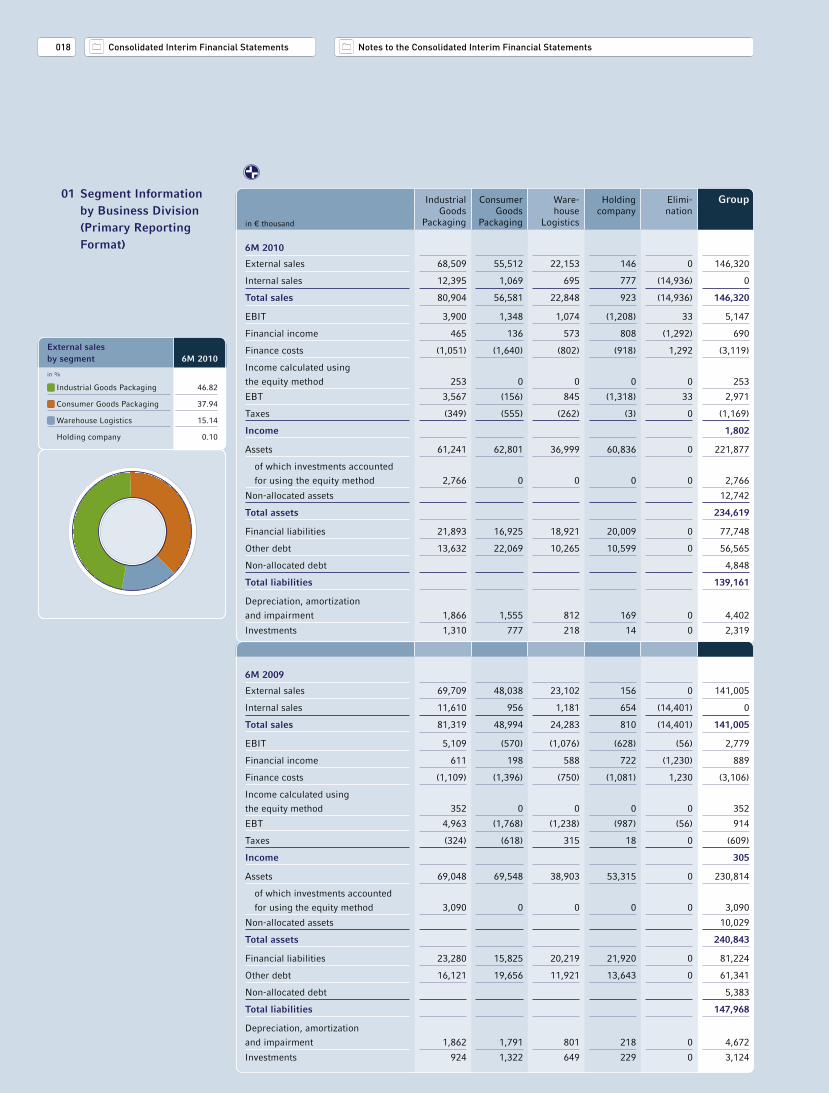
Industrial Consumer Ware- Holding Elimi- GroupGoods Goods house company nation
in € thousand Packaging Packaging Logistics
6M 2010
External sales 68,509 55,512 22,153 146 0 146,320
Internal sales 12,395 1,069 695 777 (14,936) 0
Total sales 80,904 56,581 22,848 923 (14,936) 146,320
EBIT 3,900 1,348 1,074 (1,208) 33 5,147
Financial income 465 136 573 808 (1,292) 690
Finance costs (1,051) (1,640) (802) (918) 1,292 (3,119)
Income calculated using
the equity method
253
0
0
0
0
253
EBT 3,567 (156) 845 (1,318) 33 2,971
Taxes (349) (555) (262) (3) 0 (1,169)
Income 1,802
Assets 61,241 62,801 36,999 60,836 0 221,877
of which investments accounted
for using the equity method
2,766
0
0
0
0
2,766
Non-allocated assets 12,742
Total assets 234,619
Financial liabilities 21,893 16,925 18,921 20,009 0 77,748
Other debt 13,632 22,069 10,265 10,599 0 56,565
Non-allocated debt 4,848
Total liabilities 139,161
Depreciation, amortization
and impairment
1,866
1,555
812
169
0
4,402
Investments 1,310 777 218 14 0 2,319
6M 2009
External sales 69,709 48,038 23,102 156 0 141,005
Internal sales 11,610 956 1,181 654 (14,401) 0
Total sales 81,319 48,994 24,283 810 (14,401) 141,005
EBIT 5,109 (570) (1,076) (628) (56) 2,779
Financial income 611 198 588 722 (1,230) 889
Finance costs (1,109) (1,396) (750) (1,081) 1,230 (3,106)
Income calculated using
the equity method
352
0
0
0
0
352
EBT 4,963 (1,768) (1,238) (987) (56) 914
Taxes (324) (618) 315 18 0 (609)
Income 305
Assets 69,048 69,548 38,903 53,315 0 230,814
of which investments accounted
for using the equity method
3,090
0
0
0
0
3,090
Non-allocated assets 10,029
Total assets 240,843
Financial liabilities 23,280 15,825 20,219 21,920 0 81,224
Other debt 16,121 19,656 11,921 13,643 0 61,341
Non-allocated debt 5,383
Total liabilities 147,968
Depreciation, amortization
and impairment
1,862
1,791
801
218
0
4,672
Investments 924 1,322 649 229 0 3,124
01 Segment Information by Business Division (Primary Reporting Format)
External salesby segment 6M 2010
in %
Industrial Goods Packaging 46.82
Consumer Goods Packaging 37.94
Warehouse Logistics 15.14
Holding company 0.10
018 Consolidated Interim Financial Statements Notes to the Consolidated Interim Financial Statements

Germany Rest USA / Rest Holding Elimi- Group of Europe of the company nation
in € thousand World
6M 2010
External sales 78,503 40,632 27,039 146 0 146,320
Internal sales 11,037 3,122 0 777 (14,936) 0
Total sales 89,540 43,754 27,039 923 (14,936) 146,320
Assets 64,271 62,151 34,619 60,836 0 221,877
6M 2009
External sales 81,588 39,798 19,463 156 0 141,005
Internal sales 11,708 2,039 0 654 (14,401) 0
Total sales 93,296 41,837 19,463 810 (14,401) 141,005
Assets 72,739 60,636 44,124 53,315 0 230,814
01 Segment Information by Region (Secondary Reporting Format)
The following table shows the breakdown of goodwill by segment:
Industrial Goods Consumer Goods Warehouse Totalin € thousand Packaging Packaging Logistics
Carrying amount as of Dec. 31, 2009 52,884 4,377 7,203 64,464
Additions 281 0 0 281
Currency translation adjustments 5 0 0 5
Carrying amount as of Jun. 30, 2010 53,170 4,377 7,203 64,750
Goodwill by Segment
External salesby region 6M 2010
in %
Germany 53.75
Rest of Europe 27.77
USA / Rest of the World 18.48
019Notes to the Consolidated Interim Financial Statements Consolidated Interim Financial Statements

Supplementary Disclosures
There were no changes to the members of the Executive Board in the first six months of fiscal year 2010.
Dr. Friedrich resigned from his position as chairman of the Supervisory Board effective as of the end of
the Annual General Meeting held on June 22, 2010. This Annual General Meeting newly elected Mr. Georg
Melzer who is now the new Supervisory Board chairman.
On June 30, 2010, the Executive Board held 23,183,832 no-par value shares. The options held by the
Executive Board as of the end of the year have expired.
The members of the Supervisory Board do not hold either shares or options to purchase shares in
D.Logistics AG.
The securities holdings are as follows:
No-par value No-par value Options at Options atshares at shares at Jun. 30, 2010 Dec. 31, 2009
in € thousand Jun. 30, 2010 Dec. 31, 2009
Executive Board
Andreas Bargende 58,000 58,000 0 50,000
Tammo Fey 15,000 15,000 0 43,750
Detlef W. Hübner 23,110,832 23,110,832 0 0
Total 23,183,832 23,183,832 0 93,750
Mr. Andreas Bargende holds some of his shares indirectly through ALDAMA GmbH, Mainz. Mr. Detlef
W. Hübner holds most of his shares indirectly through Lion’s Place GmbH, Hofheim am Taunus.
Transactions of the organs involving financial instruments of D.Logistics AG are notified promptly in
accordance with the statutory regulations. An overview of transactions can be found on the website
of D.Logistics AG (www.dlogistics.com) in the “Investor & Public Relations” area under the heading
“The share”.
With regard to the transactions with related parties, there was no significant change in relation to the
previous annual financial statements.
“To the best of our knowledge, and in accordance with the applicable reporting principles for interim
financial reporting, the interim consolidated financial statements give a true and fair view of the assets,
liabilities, financial position and profit or loss of the Group, and the interim management report of the
Group includes a fair review of the development and performance of the business and the position of the
Group, together with a description of the principal opportunities and risks associated with the expected
development of the Group for the remaining months of the financial year.”
Andreas Bargende Tammo Fey Detlef W. Hübner
Composition of the Executive Board and the Supervisory Board
Securities Held by the Organs
Directors’ Dealings
Relationships with Related Parties
Responsibility Statement by the Management
020 Consolidated Interim Financial Statements Notes to the Consolidated Interim Financial Statements

Additional Information
Financial Calendar April 7, 2010 Publication of Annual Report 2009 May 12, 2010 Interim Report I / 2010 June 22, 2010 Annual General MeetingAugust 12, 2010 Interim Report II / 2010November 11, 2010 Interim Report III / 2010
Key to Symbols Basis of Preparation
Scope of Consolidation
Consolidated Income Statement Disclosures
Consolidated Balance Sheet Disclosures
Consolidated Cash Flow Statement Disclosures
Other Disclosures
Segment Information
Supplementary Disclosures
Contact / ImprintContact:D.Logistics AGRainer MonethaHead of Investor & Public RelationsJohannes-Gutenberg-Strasse 3 – 5D - 65719 Hofheim (Wallau)Telephone: + 49 (61 22) 50 -12 38E-mail: [email protected]
Publisher: D.Logistics AG
Concept and design: FIRST RABBIT GmbH, Cologne