replication in capital intensive industries
TRANSCRIPT

1
Replication as a strategy in capital
intensive industries
Melvin Jones
97060608
A research project submitted to the Gordon Institute of Business
Science, University of Pretoria, in partial fulfilment of the
requirements for the degree of Master of Business Administration.
13 November 2008
Contact Details
Mobile Number: +27 83 399 7670
Email: [email protected] or [email protected]
©© UUnniivveerrssiittyy ooff PPrreettoorriiaa

i
Abstract
Researchers describing replication strategies have proposed theoretical constructs
that are positively associated with successful replication. In a rigorous quantitative
exploration of replication in capital intensive industries, this study is the first of its
kind and seeks to prove the applicability of the theoretical frameworks.
Responses to questionnaires sent to petrochemical refining sites, coupled with an
independent performance metric (the Solomon Associates Comparative
Performance Assessment Index) were used to model the impact of replication
practices on site performance. This model is used to show that firms attempting to
centrally define an Arrow Core suffer a performance penalty. Furthermore, the
model shows that a clear differentiation between the phases of exploration and
exploitation is not a requirement for successful replication in capital intensive
industries.
The model helps to explain why barriers exist preventing the conceptualisation of
the core capabilities within capital intensive industries; why companies seeking to
locally control deleterious practices are negatively impacted compared to those
implementing centralised mechanisms; and why the effective use of a template
yields a performance advantage even in the absence of a well defined Arrow Core.
The analysis also suggests appropriate practices for managers seeking to expand
in capital intensive sectors.

ii
Declaration
I declare that this research project is my own work. It is submitted in partial
fulfilment of the requirements for the degree of Master of Business Administration
at the Gordon Institute of Business Science, University of Pretoria. It has not been
submitted before for any degree or examination in any other University. I further
declare that I have obtained the necessary authorisation and consent to carry out
this research.
Melvin Jones
13 November 2008
Acknowledgements
I would like to acknowledge Helena Barnard for assistance in directing this
research.

iii
Table of Contents
Abstract..................................................................................................................i Declaration............................................................................................................ ii Acknowledgements ............................................................................................... ii Table of Contents................................................................................................. iii 1. Introduction ....................................................................................................1
1.1. Background............................................................................................... 1
1.2. Problem statement.................................................................................... 3
1.3. Research aims.......................................................................................... 5
1.4. Research relevance.................................................................................. 5
1.5. Scope and limitations................................................................................ 6
2. Literature review ............................................................................................7
2.1. Resources-based view.............................................................................. 7
2.1.1. Characterising resources................................................................... 8
2.1.2. Uncertainty within the firm ................................................................. 9
2.1.3. Routines .......................................................................................... 10
2.2. Replication .............................................................................................. 11
2.2.1. Introduction...................................................................................... 13
2.2.2. Phases of replication ....................................................................... 16
2.2.3. Key concepts ................................................................................... 17
2.2.4. Model............................................................................................... 18
2.3. Pre-determinants for replication success ................................................ 20
2.3.1. Complexity ....................................................................................... 20
2.3.2. Environmental changes ................................................................... 21
2.3.3. Technological drivers....................................................................... 22
2.3.4. Knowledge management system drivers ......................................... 23
3. Research hypotheses ..................................................................................25
4. Research methodology ................................................................................28
4.1. Population of relevance .......................................................................... 28
4.2. Sample frame and sample ...................................................................... 28
4.3. Unit of analysis ....................................................................................... 29
4.4. Data collection instrument - design ......................................................... 29
4.5. Data collection ........................................................................................ 32

iv
4.6. Data analysis .......................................................................................... 33
4.7. Research limitations................................................................................ 37
5. Results and discussion ................................................................................38
5.1. Participant responses ............................................................................. 38
5.2. Data coding and scaling.......................................................................... 40
5.3. Correlation of dependent variables ......................................................... 45
5.4. Category variables .................................................................................. 48
5.4.1. Geographic location (variable x11) ................................................... 49
5.4.2. Change of ownership (variable x9)................................................... 52
5.5. Variable correlation analysis and clustering............................................ 54
5.5.1. Technology cluster (x1 cluster)......................................................... 56
5.5.2. Company size (x2): .......................................................................... 58
5.5.3. Template existence and practices (x3, x4 cluster) ............................ 60
5.5.4. Best practices and ERP (x7, x8 cluster)............................................ 61
5.5.5. “Under new management” cluster (x9) ............................................. 62
5.5.6. Remainder of combination variables................................................ 63
5.6. Regression variables .............................................................................. 64
5.7. Regression analysis................................................................................ 67
5.7.1. Regression analysis of y1................................................................. 67
5.7.2. Regression analysis of y2................................................................. 70
5.8. Hypothesis testing................................................................................... 73
5.8.1. Hypothesis 1 (Exploration)............................................................... 73
5.8.2. Hypothesis 2 (Exploitation) .............................................................. 77
6. Conclusions .................................................................................................80
6.1. Exploration.............................................................................................. 82
6.2. Exploitation ............................................................................................. 85
6.3. Recommendations .................................................................................. 88
6.4. Future research ...................................................................................... 90
7. Consistency matrix.......................................................................................93
8. References ..................................................................................................95
Appendix 1: Questionnaire.....................................................................................I Appendix 2: Complete regression results y1 .........................................................II Appendix 3: Complete regression results y2 ........................................................III

1
1. Introduction
1.1. Background
Despite the increasing prevalence of replication as a method for company
expansion, the subject has not been popular amongst researchers (Winter &
Szulanski, 2001). This is despite the fact that replication forms the basis of several
successful expansion strategies, leading to the popularisation of the “MacDonald’s
approach”.
Replication is also a common expansion method within the industrial and
manufacturing sector, where companies role out technology and significant capital
infrastructure across multiple sites. While replication of technology and tacit assets
is relatively easily understood, the role of the intangible assets in successfully
operating that technology is poorly understood (King, 2007).
There is significant evidence that the differences in the intangible assets between
companies within the petrochemical sector significantly affect performance and
profitability (Bloch & Hernu, 2007, King, 2007). This has been shown through the
measurement of wide variations in profitability between sites with access to similar
levels of modern technology. In addition, there exists a weak correlation between
performance and the physical factors of size, age and geographic location of these
operating sites (Bloch & Hernu, 2007).

2
Research has indicated that a firm’s performance is strongly dependent on the
build-up of knowledge within the firm (Spender & Grant, 1996). While considerable
attention has been given to knowledge management and the ability or mechanism
of the organisation to learn, few academics consider the implication that
organisations therefore carry “knowledge” in their own right (Kogut & Zander,
1992). This introduces a differentiation between the codified or captured business
processes surrounding the company’s technology, and the tacit know-how which
exists within a company and therefore allows for successful operation (Kogut &
Zander, 1992).
While the usage of central organisational knowledge in the replication of
standardised business processes has been postulated (Winter & Szulanski, 2001)
and qualitatively shown (Szulanski & Jensen, 2004) to be a successful approach,
variation in response to unique local conditions is inevitable (Jensen, 2007a). At
the unit level, significant variations exist in the business processes of firms
implementing a replication strategy. This implies that firms need to expressly
manage the implications of variation within the model identified for exploitation
(Jensen, 2007a).
Given that replication is more complex than apparent on face value (Rivkin, 2000),
the benefit of variation on replicated processes that are underpinned by poorly
understood interactions must be balanced against uniformity (Winter, Szulanski,
Ringov and Jensen, 2007). Empirical evidence from the study of a United States
franchising firm (in the service sector) indicates the superiority of precise

3
replication strategy that seeks to minimise variation at a local unit level (Winter et.
al., 2007). When interactions are not well understood, or even recognised to be
present, the potential benefits of prudent local adaptation and continuous
improvement are negated by the negative impact of deviation from the recipe
provided in a larger system (Jensen, 2007b).
This is supported by research into the penalties incurred by companies attempting
to imitate competitor’s superior performance, which shows that even small errors
can lead to large performance penalties (Rivkin, 2000).
1.2. Problem statement
Companies active in the service and consumer industries are generally aware of
the concepts of replication, and what elements of their business generate their
unique differentiation. Evidence from companies like MacDonald’s and Starbucks
indicate how specific routines and human capital are successfully replicated across
multiple sites (Winter & Szulanski, 2001). This shows a realisation that there is
benefit from the replication of company knowledge that goes beyond the replication
of products or technology, specifically given the strategic advantage gained from
this difficult to imitate company asset (Szulanski & Jensen, 2004; Rivkin, 2000).
The benefit of the explicit re-utilisation of knowledge and successful business
processes within capital intensive engineering industries has been explored (Hicks,
Culley, Allen and Mullineux, 2002). However, the focus of these studies has tended
to be around the design and replication of the capital intensive technology, rather

4
than the replication of the business processes required to operate that technology
(Hicks et. al., 2002).
While this may be justified given the positive impact of technology adoption on
refinery survival (Chen, 2002) and the evidence that large petrochemical sites are
more responsive at adopting technology (Chen, 2005), recent benchmarking
studies show strong evidence of non-technology related influences (Bloch & Hernu,
2007).
Wide variations in performance, measured as return on Investment (ROI), exist
between refineries (Bloch & Hernu, 2007). This is true between sites within a
company, between sites of similar physical description (size, age and geographic
location), and between sites employing similar technologies (Bloch & Hernu, 2007).
This indicates that site practices and business processes, as well as site culture,
have a significant effect on site performance (Bloch & Hernu, 2007), over and
above the impact of technology adoption (Chen, 2005).
In short, the benefits of a business process replication strategy within the capital
intensive industry of petroleum refining have not been appreciated, exploited or
adequately proven as a desirable and successful strategy.

5
1.3. Research aims
Until recently the research direction of company replication has been relatively
poorly explored (Winter & Szulanski, 2001). Recent studies into the success of
replicating organisational routines (Szulanski & Jensen, 2004) and the empirical
evidence of uniformity of replication within the service sector (Winter et. al., 2007;
Jensen, 2007a; Jensen, 2007b) show the success that controlled replication can
achieve within the service sector.
This research aims to test the applicability of replication theory within capital
intensive industries. The research will show the effect that formal replication has on
the success of different manufacturing sites, specifically focusing on the replication
of business processes and intangible knowledge assets. The research will make
use of inter and intra company performance data, as well as information about
company replication practices to arrive at a conclusion of the role of intangible
asset replication.
1.4. Research relevance
Globally the demand for resources has been rapidly expanding, driven largely by
high growth in the large emerging economies of Brazil, Russia, India and China
(BRIC) (The Economist, 2008a).
The petroleum refining industry is an excellent proxy for capital intensive industries,
as it exhibits many of the characteristics that are common in this sector. Capital

6
investment for the past number of years has been sluggish (The Economist,
2008b), due to factors such as high capital requirements, mismatch between
availability and market requirements and high demand for engineering skills.
However, the balancing effect of supply and demand has created an increase in
the spending within this sector, as well as having a dampening effect on demand
(The Economist, 2008b).
With the South African context, the government has targeted an aggressive
economic expansion plan, laid out in the Accelerated and Shared Growth Initiative
for South Africa (AsgiSA) (The Presidency of RSA, 2006). AsgiSA targets the
capital intensive industries such as chemicals and beneficiation for future growth.
In this climate of high demand for resources, companies in capital intensive
industries like mining, manufacturing, beneficiation and refining are looking to
expand. While speculation regarding global recession and economic turmoil
following the financial crisis exist, demand from the developing BRIC economies
will create a floor to falling commodity prices (The Economist, 2008c). This
suggests that expanding capacity within capital intensive industries remains
topical, both locally and internationally.
1.5. Scope and limitations
The research is focused on replication practices within the global capital intensive
manufacturing industry. The petroleum refining sector is used as a proxy to study
applicability of replication within capital intensive industry.

7
2. Literature review
The source of firms’ competitive advantage, specifically as an input to strategic
direction, has been intensively studied over the last three decades (Teece, Pisano
& Shuen, 1997). During this time, various models have been proposed regarding
how to identify relative advantage between firms. Teece et. al. (1997) suggest a
clustering of these into three strategic paradigms. These clusters are used to
introduce three main logical groupings of the source of competitive advantage. The
first two concepts could be further grouped into a market based view of
determining competitive position and profitability, versus the resource view
assumed in the third cluster (Teece, et. al., 1997).
2.1. Resources-based view
The cornerstone of a resource-based view on competitive advantage lies in a belief
that the source of advantage lies in the tacit and difficult to imitate resources of the
firm, rather than in the explicit technology (Teece, et. al., 1997). This resource-
based view is in line with Zander and Kogut’s (1995) definition of the firm as “a
repository of social knowledge, where competitive sets of capabilities are replicated
over time while subjected to imitation”.
Studies find that the profitability differences between firms operating within an
industry are larger than the differences that exist between industries (Rumelt,
1991). This evidence would suggest that the effect of capital outlay on new
technology, as well as the effect of market forces, is generally smaller than the
effect of firm-specific factors on profitability (Teece, et. al., 1997). This has been

8
shown to be true within petroleum refining, where large discrepancies in
performance are evident between sites of similar physical description (Bloch &
Hernu, 2007).
2.1.1. Characterising resources
Several different researchers have introduced concepts which can be used in
different situations to characterise the resources which provide a firm its
competitive capabilities (Rogers, 1980; Winter, 1987; Zander & Kogut, 1995).
Each of these researchers used a subtly different model to describe the aspects of
the firm’s resources, and then applied that model to characterise the ease of
transfer and imitation of the firm’s key resources. Figure 1-1 summarises the key
concepts from each of these researchers.
Figure 1 - 1: Characterising capabilities using the RBV

9
2.1.2. Uncertainty within the firm
The elements within the frameworks presented in figure 1-1 explicitly allow for firm
capabilities which cannot be easily characterised. Becker and Knudsen (2005)
argue that all firms exist with several sources that introduce uncertainty:
• The environment in which the business operates (external)
• The effect of decisions on the firm (internal and external)
• The effect of the firms actions and responses (internal and external)
Understanding these uncertainties gives a basis with which they can potentially be
managed and more fully understood (Becker & Knudsen, 2005). Uncertainly can
be classified into 4 broad categories (Becker & Knudsen, 2005):
• Certain: The outcomes of any decision or set of circumstances can be fully
understood, and the end result is known.
• Probabilistic: Outcomes can measured for risk and likelihood, and the
possible outcomes are exactly known. This allows for a mathematical
analysis of options.
• Uncertain: Outcomes are based on subjective judgement, ie not all
probabilities are know. Decision making is improved by more analysis and
investigation, as a more accurate characterisation of options is made.
• Pervasive uncertainty: Outcomes cannot be objectively or subjectively
understood, and additional analysis of underlying data does not improve
decision making. Given the finite nature of firm resources, additional effort
10
expended on analysing pervasively uncertain situations will decrease to total
firm performance.
By economising on limited cognitive resources within the firm, routines preserve
decision making and information processing capabilities. By formalising repetitive
and frequent actions, these resources can be guided in the face of uncertainty
(Becker, 2004).
2.1.3. Routines
Nelson and Winter (1982) first introduced the concept of using routines as a unit of
analysis in the measurement of economic and organisational behaviour (Becker,
2004). Since then, this sub-field within the greater RBV subject matter has been
actively researched (Becker, 2004).
Becker (2004) avoids attempting to define a routine, opting rather to utilise
elements from other researchers to fully characterise what makes a routine. In
addition, through an extensive review of the literature, Becker (2004) maps the
effects routines have on organisations. Figure 1-2 shows the eight characteristics
of routines, as well as the six main effects routines have on organisations.

11
Figure 1 - 2: Routines: their characterisation and organisational effects
2.2. Replication
Replication as a theory base should be viewed as contributing to the resource-
based view of organisational capabilities (Jensen, 2007b), specifically building on
the research into routines as mechanism for describing the capabilities of the firm.
Figure 1-3 shows a schematic representation of the literature applicable to this
research project. In the figure, the block is scaled by number of academic citations
(an indication of its contribution to the RBV research field). The colour indicates the
relative age of the research, with bright green being very recent gradually fading to
grey as the date of publication recedes.

12
Figure 1 - 3: Treemap of the Resource Based View literature
The schematic is intended to show how relatively immature the research into
replication is when compared and placed within the subfield of routines, within the
larger field of RBV literature.
While the reliance on a relatively small number of primary researchers may seem
excessive (Winter, Szulanski, Rivkin and Jensen), they are all affiliated to top
universities, and have published in the pre-eminent business research journals
(Organisation Science, Strategic Management Journal and Harvard Business
Review).
2.2.1. Introduction
Replication is a phenomenon or process whereby organisations create and operate
a large number of individual sites, producing products or performing similar
services (Winter & Szulanski, 2001). It involves the redeployment and transfer of
company resources from one economic setting to another (Teece, et. al., 1997).
Replication has been occurring to the extent that this form of business is now one
of the dominant organisational models (Winter & Szulanski, 2001). The ability for
the parent company to re-utilise local success in a complex activity to capture
profits on a larger scale is the main driver behind this approach (Szulanski &
Winter, 2002).

14
Despite the appeal for grand scale replication, evidenced by whole industries
attempting replication in some form, the majority of attempts to replicate local
excellence fail (Szulanski & Winter, 2002). In the presence of such popularity, it is
surprising that replication as an organisational model has been largely neglected
by theorists (Winter & Szulanski, 2001).
Over the last decade, a combination of theory development and empirical evidence
has started to shed light on the factors necessary for successful replication, as well
as potential pitfalls (Jensen, 2007b; Winter et. al., 2007; Szulanski & Winter, 2002;
Winter & Szulanski, 2001; Rivkin, 2001; Rivkin, 2000).
One of the central tenants in business is to create a defensible position where the
company can sustain and enhance its competitive advantage (Porter, 1980a). This
allows the company to sustain returns above average market levels (Porter,
1980a). In defending such a position, replication can be a double edged sword.
Replication as a viable strategy arises largely due to the company’s ability to
exploit new opportunities faster than its competitors, due to the ability to transfer
knowledge of individuals throughout the organisation (Kogut & Zander, 1992). This
can be contrasted to the requirement for new companies to invent the knowledge
and business processes, particularly in an environment where the key success
factors may be poorly understood (King, 2007).

15
The success factors to exploit a replication strategy closely resemble the factors
which lower the barriers to imitating that success (Zander & Kogut, 1995).
Balancing the ability to successfully replicate with a defence against imitation in the
presence of pressures to exploit a temporal opportunity increases the complexity of
successful replication (Szulanski & Jensen, 2004; Rivkin, 2001).
Replication of company knowledge, tacit and explicit, is a key success factor in the
replication of technology, i.e. the replication of the technology in the absence of the
supporting processes does not automatically deliver value (Kogut & Zander, 1992).
Given the evidence that companies lack the ability to develop new competencies
quickly (Teece, et. al., 1997), exploiting a strategic advantage in the short run
requires that firms understand how to mobilise knowledge assets quickly.
Replication theory presents a basis for achieving this (Szulanski & Jensen, 2004),
backed by empirical evidence that the absence of a formal replication strategy
significantly decreases chances for success (Jensen, 2007b; Winter et. al., 2007;
Szulanski & Jensen, 2004).
While it may be tempting to think that replication is restricted to greenfield
investments, this would show an appreciation of only a portion of the theoretical
construct (Winter & Szulanski, 2001). Using replication theory to design the role-
out of best practices into existing or acquired brownfield sites increases the
probability of a successful implementation. Thus the application of replication

16
theory is consistent between greenfield and brownfield sites (Szulanski & Jensen,
2004; Winter & Szulanski, 2001).
2.2.2. Phases of replication
Replication is argued to occur in two distinct phases, namely exploration and
exploitation (Winter & Szulanski, 2001). Given that urgency in response to the
threat of imitation is usually associated with a replication strategy, these two
distinct phases may not be distinct in time (Winter & Szulanski, 2001).
During the exploration phase, companies are replicating their business model, but
are learning more about what elements are key success factors for the business.
After the first few replications, companies are able to compare between different
sites. At this point, the expansion or replication strategy can move to phase two,
where the company exploits a well defined and frozen model to replicate. In many
cases, this freezing of the business may occur before the exploration has delivered
the optimum solution (Winter & Szulanski, 2001).
Part of understanding the nature of this two phase approach is the understanding
that replication is a dynamic and non-steady state process. Companies are
continually adjusting the model with which they replicate their processes. It is also
important to understand the key differences between true replication and a faux
replication strategy. As opposed to developing the organisational traits, and
ensuring a broad transferral of knowledge, best practices and technology, faux

17
replication uses local adoption and adaptation processes to establish the new site
(Winter & Szulanski, 2001).
There is therefore an always present tension in replication – on the one hand, it is
important to allow for enough exploration to define the optimal mode to replicate.
On the other hand, it is necessary to fix the model and not constantly introduce
variation.
2.2.3. Key concepts
One of the core concepts in replication theory is the usage or existence of a
template. The original definition of a template is: the existing routine or example
that serves as a point of departure for replication (Winter & Szulanski, 2001).
Research has shown that replication is more likely to succeed when a template
exists (Szulanski & Jensen, 2004). The template refers to the requirement for a
working model of the desired business. Companies are able to replicate working
examples by allowing observation of the practices in operation. It is possible to
differentiate between physical examples, where the template is an actual site, and
hybrid or mix and match templates where information and documentation from
site(s) provide the guidance (Winter & Szulanski, 2001).
A similar concept, introduced by Barley and Tolbert, 1997, is the concept of a
script. A script can be defined as a recurrent set of activities and patterns of

18
interaction between actors in an institutional setting. These behaviours serve to
maintain the structure within the organisation.
Existing within any organisation are positive contributors to success, but also non-
value adding processes and activities. The degree to which the company
understands the relationship between the results and actions taken to achieve
those results determines the degree to which key contributors can be identified.
The ideal set of positive contributors is termed the Arrow Core. This is the
composite of all knowledge and processes required for the replicator to
successfully implement the particular business model (Winter & Szulanski, 2001).
The very nature of business predicates that the Arrow Core can never be fully
defined, and always remains partially untenable. However, through repeated
replication, comparison between successive instances allows the template to be
refined, and the Arrow Core to be more completely described. (Winter & Szulanski,
2001)
2.2.4. Model
Winter and Szulanski, 2001, introduce an iterative replication process. At the core
of the process is the definition of the Arrow Core, from the observation of a
predefined template. Figure 1-4 schematically represents the replication process.

19
Figure 1 - 4: Iterative arrow core and template procees (Winter & Szulanski, 2001)
An alternative to the above model is the concept of direct replication with no
feedback or modification between successive replicas. The choice of model
depends on the trade-off between precision/optimisation and speed of execution.
This trade off is known as the replication dilemma (Winter & Szulanski, 2001).
By balancing between the lost opportunity from tweaking different elements within
the business model and the ability to carefully control all elements within the
business, one effectively sets the speed of execution. However, with exact
replication, several negative or superfluous elements within the business get
carried over between successive replicas.

20
2.3. Pre-determinants for replication success
2.3.1. Complexity
The complexity of a business strategy is largely dependent on the degree to which
levels of unpredictability exist within the business process. This leads to causal
ambiguity in the understanding of the drivers of business success (King, 2007).
Complex business strategies are more difficult to copy, but also hamstring firms
from being agile to changing external conditions.
Complex internal business models necessitate arriving at local rather than global
optima. This internal tension between heuristics and optimisation provides the key
to the barrier to external firms replicating the successful business model (Rivkin,
2000). High levels of complexity ensure that the solution of the global optimum is
intractable.
These high levels of internal complexity and uncertainty inherently mean there are
tacit success factors which cannot be codified. While it is exactly this complexity
which protects a firm from external copying, it makes replication of the business
model equally difficult. The idiosyncratic nature and scarcity of key resources, as
well as a tendency to underplay or under appreciate the role of these key
resources, further complicates replication (Winter & Szulanski, 2001). Further
complexity is introduced when the companies are operating across borders,
specifically when the unique relationship between headquarters and subsidiaries is
a strong determinant of replication success (O’Donnell, 2000).

21
Firms should also realise that even relatively minor modifications in major
replication generally encounter larger than expected difficulties. This is due to
causal ambiguity and the skewed distribution of key knowledge. In circumventing
this complexity firms need to take note of the stickiness of key knowledge transfer
within the organisation. This stickiness can be significantly reduced through the
existence and access to a template (Szulanski & Jansen, 2001). This free access
to a template gives the replicator significant advantage over the competition (see
previous section for description regarding the definition and usage of a template).
In a follow-up to the 2000 study, Rivkin (2001) shows that there is a complexity
band within which the replicator enjoys maximum advantage over potential
imitators. When the complexity is below a finite limit, imitation is trivial, and the
threat of competitors is high. When the complexity exceeds a threshold, the
complexity becomes so great that the replicator looes any advantage. There is thus
a desirable level of moderate to high complexity which lowers internal barriers for
replication and raises barriers to imitation.
2.3.2. Environmental changes
In many cases, internal business processes and manufacturing success are
dependent on the way in which the business interfaces with suppliers and
customers (O’Donnell, 2000). When these cannot be replicated or supplied in a
new environment, it may be necessary to attempt importing or duplicating the
original conditions in which success was achieved. In this case it can be argued

22
that changing portions of the environment in order to ensure business success is
key (Florida & Kenney, 2000: 291). Achieving success in new environments
introduces complexity when considering the interaction between bureaucratic
controls and local autonomy (O’Donnell, 2000).
Replicators may also be forced to change other ingrained environmental factors or
work conditions, like labour relations and employee contracts. In order to
successfully create elements of social culture and team based responses,
unionisation and worker conditions are key variables in how effectively non-codified
technology can be transferred (Florida & Kenney, 2000: 295). This duplication or
importing of environmental conditions is created by the need for symmetry between
inter and intra company work practices (Florida & Kenney, 2000: 295).
2.3.3. Technological drivers
Several macro economic trends have influenced the development and adoption of
new refining technologies. Three of the most important trends are (Chen, 2005):
• Global changes in available crude oil quality, as many oil fields become
depleted.
• Continuous adoption of more stringent environmental and quality
specifications by regulators.
• Global changes in the demand for product mixes, with a significant swing
towards middle distillate products (diesel).

23
While the above factors drive technology adoption and change across the industry,
distinct differences exist in the adoption between individual refinery sites (both inter
and intra firm) (Chen, 2005). These differences flow from the “least cost” strategy
of operating multiple and geographically dispersed refineries, minimising outbound
transportation costs by servicing local consumers. Factors such as inter-refinery
competition and local market effects therefore have a large impact on relative
technology adoption (Chen, 2005).
By using the technological complexity index developed by Nelson (1976) as an
indication of how contemporary the technology within a site is, Chen (2005) is able
to show that large scale technology adoption and modernisation is required to keep
refineries in business. More detailed methods of analysing the effect of technology
on the profitability of a refinery site are available (Liu, Yu, Fan & Bao, 2006).
However, the findings from Chen (2005) indicate a gradual trend of mass
technology modernisation across all operating sites, necessitated by micro and
macro economic trends.
2.3.4. Knowledge management system drivers
Modern information and communication technology enables global manufacturing
businesses to benefit through improved operations, by supporting knowledge
sharing and knowledge management within those global enterprises (Liu & Young,
2006). Tools such as Product Lifecycle Management (PLM) and Enterprise
Resource Planning (ERP) are examples of knowledge based systems which
provide significant support to global decision making (Liu & Young, 2006).

24
These systems form the basis of the codified company knowledge (Zander &
Kogut, 1995), and inter-company differences in the extent and success with which
these systems are deployed affects the sustainability of their competitive
advantage (Hicks, Culley, Allen & Mullineux, 2002). The successful deployment of
these types of systems enables companies to rapidly role out previously captured
procedures and company knowledge. This allows a better understanding of the
structure and relationship between knowledge elements within the business,
improving global decision making (Liu & Young, 2006).

25
3. Research hypotheses
Winter and Szulanski (2001) propose the usage of a template and the concept of
the Arrow Core as central elements of successful replication. This is consistent
with the concept that replication and continuous improvement is difficult in
scenarios with high levels of tacit knowledge, which would indicate a poor
understanding of the underlying processes (Teece, et. al., 1997). In addition, the
successive phases of exploration and exploitation can be used to characterise
replication efforts (Winter & Szulanski, 2001).
More recently, studies by Winter et. al. (2007) and Jensen (2007b) have shown
empirically that even small variations and local adaptations detract from the
potential benefits of a replication strategy.
Given the evidence of the effects that both formal and tacit knowledge have on the
performance of petroleum refineries (Bloch & Hernu, 2007), it is reasonable to
postulate that replication theory is an appropriate strategy in this industry. The
research will specifically test for the presence of Winter & Szulanski’s (2001)
central constructs in the petroleum refining industry. This will be used as a proxy to
generalise findings for capital intensive industries.
Previous studies into the methods and applicability of replication have all been
qualitative case studies or model-based simulations. While these give insight into

26
the mechanisms of replication, they do not quantitatively test replication theories.
This study directly measured the way in which replication was conducted, and
shows the performance impact of replicating. In doing so, it is the first study of its
kind.
The specific research hypotheses that are proposed are divided into a
characterisation of the exploration (Hypothesis 1) and exploitation (Hypothesis 2)
phases of replication. The hypotheses proposed are:
Hypothesis 1 (Exploration): Successful replication is correlated with the
development or conceptualisation of the Arrow core (Winter & Szulanski, 2001).
H1a: Successful replication is correlated with the definition of core capabilities at a
centre or focal part of the organisation (Kogut & Zander, 1992).
H1b: Successful replication is correlated with the explicit definition of the valued
features of the final product/service that are non-negotiable for each the
organisation as a whole (Winter & Szulanski, 2001).
H1c: Successful replication is correlated with the identification of the procedures
involved in the local production of the valued features (Winter & Szulanski, 2001).
H1d: Successful replication is correlated with the conscious identification and
elimination of information and business processes that are deleterious (Winter &
Szulanski, 2001).

27
Hypothesis 2 (Exploitation): Successful replication is correlated with the effective
use of a template (Winter & Szulanski, 2001).
H2a: Successful replication is correlated with accurate and exact implementation of
a set of business processes (Winter et. al., 2007; Winter & Szulanski, 2001).
H2b: Successful replication is correlated with the control of variation in the local
adaptation of the template (Jensen, 2007b).
H2c: Successful replication is correlated with the controlled exploration and
adaptation in sites where a close replica of the template is in place and operating.

28
4. Research methodology
4.1. Population of relevance
The research targeted capital intensive industries to extend the body of replication
knowledge and test its applicability outside the retail and service sectors. Capital
intensive industries are those that are characterised by a high investment in assets
relative to sales or profits generated from those assets (Firer, Ross, Westerfield &
Jordan, 2004: 93). As such, the target population can be defined as all capital
intensive industries (Zikmund, 2003:373).
Given the current boom in demand for resources and industrial production
capacity, the relevance of replication as a strategy in capital intensive industries is
a contemporary problem (The Economist, 2008b).
4.2. Sample frame and sample
Solomon Associate provides independent global benchmarking and consulting
services to energy industries. Through their independent Comparative
Performance Analysis (CPA), they are able to gauge the relative performance of
petroleum refineries (Solomon associates, 2008). The CPA is a consistent and
uniformed benchmarking assessment, which minimises the effect of size,
complexity and location on the performance index. This creates a multi-
dimensional measure of comparative performance between refining sites (Solomon
associates, 2008).

29
This independent objective measure allows for a correlation between performance
and the elements of replication strategy to be determined. The sampling frame can
be defined as the portion of the working population which can be practically dealt
with (Zikmund, 2003: 373). Given the availability of an objective measurement, the
petroleum refineries that participate in Solomon’s Benchmarking (85% of global
capacity) were selected (Solomon Associates, 2008). This formed the basis of the
decision to use refining as the representative sample for capital intensive industry.
Information was sampled particularly from the following global petroleum refinery
companies.
• Sasol – 1 site
• Petronas – 3 sites
• Chevron – 12 sites
• Total – 27 sites
• BP – 17 sites
• Shell – 38 sites
• ExxonMobil – 58 sites
• ConnocoPhillips – 12 sites
4.3. Unit of analysis
The unit of analysis will be single production sites within each of the companies
within the sample.
4.4. Data collection instrument - design
Two types of data were collected, both using the electronic survey software service
of Survey Monkey. Firstly, data about the objective measurement, i.e. the
Solomon’s CPA, was collected to give an indication of the absolute performance of
the various sites. The questionnaire asks participants to indicate the performance

30
of their site based on the categories which Solomon define, namely pace-setter,
first quartile, second quartile etc. Solomon Associates were also directly
approached to contribute to the success of the study, but declined to participate.
In addition to the unbiased CPA measure, respondents were asked to indicate their
perception regarding the performance of their site. This biased indicator of
performance was used as a second dependent variable. This biased indicator
captures managerial perceptions, over an above the objective measurement. This
is necessary since these perceptions are often a significant driver in the decision
making process (Seal, Garrison & Noreen, 2006).
Secondly, data regarding the replication practices within sites was gathered. As
introduced in the literature survey, all previous studies into replication have been
qualitative (Zander & Kogut, 1995, Szulanski & Jensen, 2004). This qualitative
research has generated theories regarding replication, but these have never been
tested. The questionnaire was designed based on the elements of previous
research, and transitions from theory generation into theory testing.
Key concepts of simplicity, avoiding loaded questions, avoiding ambiguity and local
layout were adhered to (Zikmund, 2003: 336). Questions were created to directly
test the various aspects proposed by the hypotheses. The questionnaire is divided
into three main sections, namely:

31
• Introduction of survey and demographic questions
• Questions regarding the definition, existence and general practices
regarding the template site
• Testing implementation and control of the Arrow Core, as well as practices
for controlled variations.
By dividing the questionnaire into distinct sections, it was possible to collect,
analyse and include partially completed responses. This, coupled with the two
dependent performance variables, improved the significance and rigour of the data
analysis.
Once the questionnaire had been drafted and reviewed to the satisfaction of the
primary researchers, it was sent for review to a leading contemporary in the field of
replication (Dr. Robert Jensen received his PhD from Wharton, and has been
widely published in top journals like Organisation Science and Strategic
Management Journal). His response was used to improve the quality and coverage
of the questionnaire, and specifically to remove some ambiguities regarding the
underlying elements being tested.
The updated questionnaire was sent to a group of five industry managers as a pre-
test. This pre-test ensured that the purpose of the study was being clearly
communicated in the introduction, and that all questions were unambiguous and

32
easily interpreted. Final adjustments to the questionnaire were made based on the
feedback received from this group.
A copy of the questionnaire is included in Appendix 1.
4.5. Data collection
Data was collected via electronic questionnaires (Survey Monkey). As mentioned,
the population sampled was refineries that participate in the Solomon Associates
CPA. This represents 85% of total global refining capacity (Solomon Associates,
2008).
Within this total pool, two different solicitation techniques were used to collect the
data. The researchers had direct access to senior management within a subset of
the large, Western manufacturing companies. These companies were directly
approached and asked to participate in the study. As such, questionnaires could be
target to specific individuals within these companies.
In addition to these “solicited” questionnaires, “unsolicited” requests were sent to
the other operating companies within the population. Since the responses were
kept anonymous, the effect of respondent bias based on the differences in the
manner of introduction cannot be eliminated. The effect from this bias was not
anticipated to affect the results of the study.

33
In both instances, the site production manager was targeted to complete the
survey, but responses from other senior managers were expected. This
discrepancy between respondents was not expected to affect the quality of the
results.
In the case of both the groups, an initial introduction and opportunity to opt out was
given a few days before sending out the survey for completion. Three follow-up
reminders were sent to each participant, in an attempt to maximise the opportunity
and likelihood to receive a good response (Fowler, 2001). This method of repeated
requests was also seen as a partial mitigation to the potential unavailability of the
collection tool (Survey Monkey). This was only partially successful, and complaints
about the survey being unavailable were received.
4.6. Data analysis
The data from the questionnaire was characterised into 12 independent variables
representing the sub-elements within the main hypotheses. The responses
gathered from the questions were transformed from the total of 28 questions into
these 12 variables.
The composite variables are identified in table 4-1, with a cross reference to the
questions in the questionnaire. The details of the transforms, creating these
variables from the 28 questions, are presented in table 4-2.

34
Table 4 - 1: Description of variables
Variable # Variable description Questionnaire
x1 Effective site age (as indication of technology) Q1.2, Q1.4
x2 Company size Q1.3,
x3 Existence of a template site Q2.2
x4 Degree of implementation of precise template practices Q2.4, Q2.5, Q2.6, Q2.7,
x5 Degree of local variation and adaptation of template practice Q2.8, Q2.9, Q2.10, Q3.7, Q3.3
x6 Active elimination of deleterious practices Q3.4
x7 Template practices replication methods Q2.3, Q3.5, Q3.6,
x8 Degree of controlled adaptation at template site Q3.9, Q3.10
x8a Degree of controlled adaptation at template site Q3.11
x9 External introduction of replication strategy (category variable) Q2.11, Q2.12,
x10 Degree of variation control mechanisms Q3.1, Q3.2, Q3.12
x11 Geographic influences (category variable) Q1-1
y1 Site Performance Estimate (biased) Q2.1
y2 Solomon’s Comparative Performance Analysis Ranking (unbiased) Q3.8
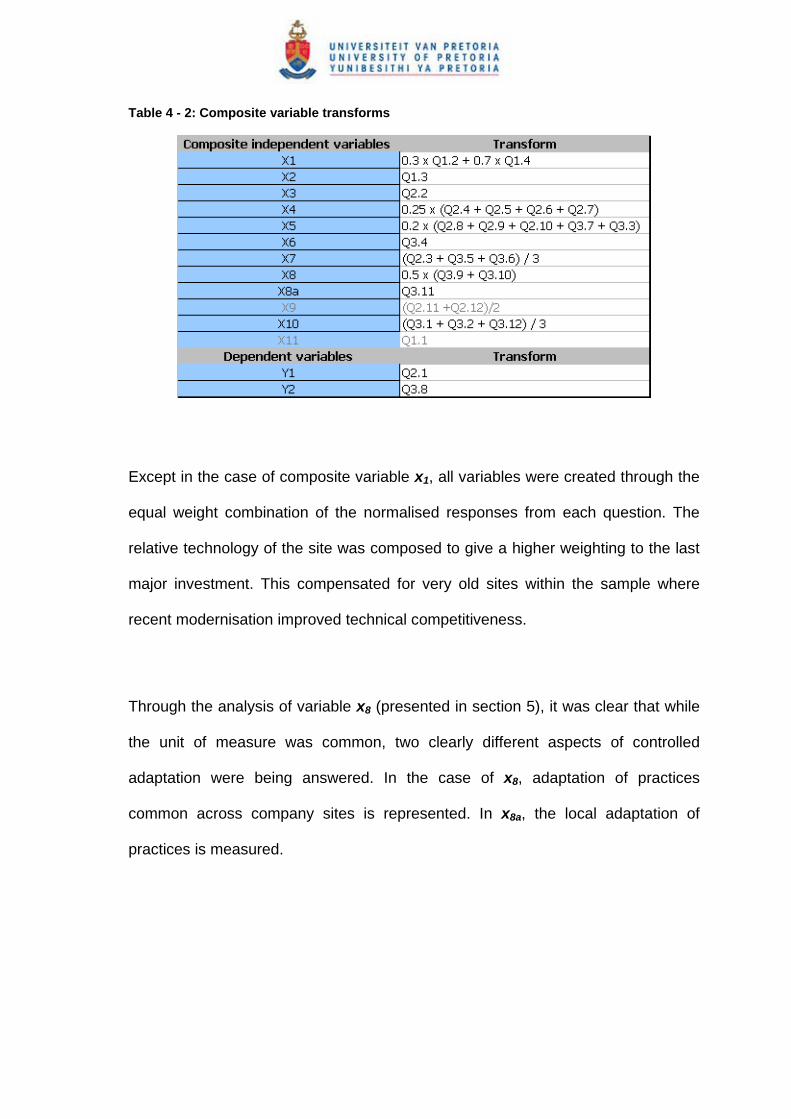
Table 4 - 2: Composite variable transforms
Except in the case of composite variable x1, all variables were created through the
equal weight combination of the normalised responses from each question. The
relative technology of the site was composed to give a higher weighting to the last
major investment. This compensated for very old sites within the sample where
recent modernisation improved technical competitiveness.
Through the analysis of variable x8 (presented in section 5), it was clear that while
the unit of measure was common, two clearly different aspects of controlled
adaptation were being answered. In the case of x8, adaptation of practices
common across company sites is represented. In x8a, the local adaptation of
practices is measured.
36
In order to test the Hypotheses set forward, a model between the independent
variables in table 4-2 and the dependent variables y1 (biased estimate) and y2
(CPA – unbiased estimate determined by Solomon Associates) was built. The
variables greyed out in table 4-1 and table 4-2 were used as category variables,
and were not included in the model.
Multiple regression was conducted to characterise the relationship between the
independent variables and the dependent variables (Albright, Winston & Zappe,
2006: 564). Given the findings from Jensen (2007a) in a preliminary empirical
classification of replication data in the services sector, there existed a reasonable
expectation of the applicability of linearity between the inputs and outputs.
Due to the unknown extent of the application of replication and template practices
within this industry, assumptions about the underlying population distributions
could not be made. The possible non-fulfilment of normality assumptions requires
the use of robust, distribution-free procedures (Kendall & Stewart, 1967: 465).
Since non-normal distributions can cause traditional least-squares approaches to
incorrectly weight observations (especially if there are outliers), these approaches
require extensive analysis of residuals and model results. Robust techniques
dramatically reduce the level of effort required in this analysis, through the robust
treatment of outliers (Kendall & Stewart, 1967: 465).

37
Given the uncertainty regarding the underlying population distribution, Huber’s
method of robust maximum likelihood estimation is widely used to perform the
robust multi-variable regression, and hence is chosen for the regression analysis
(Arslan, Edlund & Ekblom, 2001: 64)
4.7. Research limitations
Petroleum refining was chosen as a proxy for capital intensive industries. This was
done due to the availability of the independent variable of the Solomon Associates
refinery CPA (Solomon Associates, 2008).
While Solomon Associates do generate a CPA for a broader classification of
manufacturing sites in the energy sector, other industries were excluded from this
survey (Solomon Associates, 2008). This was done since:
• The characterisation of chemical companies involves a more complex and
varied mix of technologies and end products. This would increase the
complexity of correcting for technology effects on company performance.
• The coverage of the CPA measure as a percentage of total chemical, power
generation and pipeline industries is significantly smaller than in refining.

38
5. Results and discussion
5.1. Participant responses
The questionnaire (Appendix 1) was designed with three separate sections. This
design ensured that if respondents were unable to complete a questionnaire (time
constraint, willingness or ability), a partial response could be gathered. By placing
two index or dependent variables in different places within the questionnaire, it was
possible to complete a partial multiple regression with a larger sample set. The
questionnaire response rate is shown in figure 5 - 1.
Figure 5 - 1: Questionnaire completion
Questionnaire response rate
29
31
33
35
37
39
41
43
1.1
1.2
1.3
1.4
2.1
2.2
2.3
2.4
2.5
2.6
2.7
2.8
2.9
2.10
2.11
2.12 3.1
3.2
3.3
3.4
3.5
3.6
3.7
3.8
3.9
3.10
3.11
3.12
Question
# of
resp
onde
nts
42 out of 168 respondents returned a response. Although this is somewhat low in
absolute terms, it represents an acceptable response rate of 25%. Response rates
to survey questionnaires vary widely depending on the survey type, as well as the
39
setting (Dillman, 2007: 4). There is a general recognition that electronic surveys
receive a lower response rate, with rates as low as 5% not being uncommon.
Response rates of above 20% are considered relatively good when using an
electronic medium (Couper, Baker, Bethlehem, Clark, Martin & O’Reilly, 1998:
401).
From figure 5 -1 it is clear that roughly 10% of participants declined to complete
each subsequent portion of the total questionnaire. The dependent performance
questions (y1 and y2) were positioned separated on page 2 and 3 of the
questionnaire (Q2.1 and Q3.8).
The highly competitive nature of the petrochemical industry has led to
organisations being sceptical about sharing information outside of their
organisation. Despite the assurance of participant anonymity, it is reasonable to
assume that participants may have been reluctant to share performance
information (biased or unbiased) about their site or company.
Sampling error and uncertainty decrease as the size of the sample increases
(Albright et. al., 2006: 407). In determining an adequate sample, it is necessary to
consider the degrees of freedom. When the total degrees of freedom is larger than
30, the sample is said to adequately approximated the population for the

40
distribution of the population parameters to be considered normally distributed
(Albright, et. al., 2006: 425).
The degrees of freedom (df.) for a multivariable problem are given by equation 5-1:
1−−= kndf Equation 5 - 1
where n is the number of data points and k is the number of variables in the
multivariable regression problem. In table 4-1, 10 independent composite variables
were constructed from the information in the questionnaire (for use in the model).
Given that only 31 respondents completed the entire questionnaire, the df. is equal
to 20, significantly less than the threshold of 30.
By using only a subsection of the total data (ie. data received up till end of section
2 of the questionnaire), it is possible to redefine a more selective set of composite
variables. This would not allow for the testing of all Hypotheses set out in Section
3, but would meet the requirements of equation 5-1. This approach is more fully
explored in the regression analysis.
5.2. Data coding and scaling
In order to statistically analyse the response captured by the questionnaires, a
code was developed to translate the data into a numeric format. Figure 5-2 shows
the overview of how each question was coded.

41
Figure 5 - 2: Question code tables
42
Elements which are important to note within the coding table:
• Where a practice was found to be totally lacking, and should thus have no
influence on the statistical and regression analysis, that variable was coded
to zero.
• Within the variables captured within the tables in figure 5-2, the second line
indicates the units of the variable. Composite variables (e.g. x1 = Q1.2 &
Q1.4) have identical units of measure, ensuring consistency within the
regression analysis.
• The scale was applied to the range of question responses, and used to
generate a unitary scale for each question.
By dividing the individual response by the maximum value within the scale, the
response set was normalised to a unitary scale. The descriptive statistics for each
question are shown in table 5-1.

43
Table 5 - 1: Descriptive statistics of question responses
Rigorous tests for the normality of each variable, as well as the statistical
confidence intervals for the population descriptors, will be shown and discussed
under the section on regression. The elements which are important to note from
table 5-1 are:
• The data is rich, with substantial variability in the mean and median (see
figure .5–3).
• The standard errors are low, which is to be expected given the relative
adequacy of the sample size (for the estimation of the population
descriptors).

44
• The data appears relatively non-normal, with significant differences between
the mean and the median. In addition, the measures of Kurtosis and
Skewness indicate that the variables are not normally distributed.
Figure 5-3 shows the mean, maximum and minimum information from table 5-1. In
this figure, the mean is indicated by the red dot, and the extremities of the lines
indicate the minimum and maximum respectively.
Figure 5 - 3: Variability within the data set
Data variability
0
0.1
0.2
0.3
0.4
0.5
0.6
0.7
0.8
0.9
1
1.1 1.2 1.3 1.4 2.1 2.2 2.3 2.4 2.5 2.6 2.7 2.8 2.9 2.10 2.11 2.12 3.1 3.2 3.3 3.4 3.5 3.6 3.7 3.8 3.9 3.10 3.11 3.12
Question
Res
pons
e

45
5.3. Correlation of dependent variables
In Section 4, two dependent performance variables were defined, namely:
• y1: Perceived level of site performance (biased dependent variable)
• y2: Solomon Comparative Performance Assessment Index (unbiased
dependent variable)
By evaluating the co-linearity of these two variables, it is possible to determine
whether the two variables are identically describing the same measure and
underlying trend (Albright, et. al., 2006: 639). Figure 5-4 shows a scatter diagram
of y1 versus y2, with an indication of the low level of co-linearity.
Figure 5 - 4: Scatter plot and linear regression result
Y1/Y2 Scatter y = 0.2719x + 0.4105R2 = 0.0732
0
0.1
0.2
0.3
0.4
0.5
0.6
0.7
0.8
0.9
1
0 0.1 0.2 0.3 0.4 0.5 0.6 0.7 0.8 0.9 1
Y1
Y2

46
Since the variables have been normalised, perfectly co-linear variables would be
expected to have a high R2 (indication of goodness of fit).
The test for co-linearity indicates that significantly divergent or different site
performance elements are captured by the two different variables. Possible
reasons for these differences could be:
• Respondent bias: respondents may be inclined to overstate the
performance of their own sites. This is partially confirmed by evaluating the
distribution of respondents to Q2.1 (y1), shown below in figure 5-5. The
response shows that 92% of sites within the sample perform above an
average performance level, and that the sample has a mean of 70% (table
5-1). This is clearly highly improbable.
When compared to the distribution of y2, shown in figure 5-6, the average
lies close to the expected value, falling within the second quartile measure.
The distribution still fails to meet the expected uniform distribution indicated
by the red line. A possible explanation of this is offered under the section
evaluating the effects of geographic location.
• Relative normalisation of y1 versus y2: Solomon Associates use measures
of refinery size, technology and age to normalise the site performance index
to reflect only elements of performance which are affected by the manner in
which the site is operated. It is unlikely that respondents would be either

47
able or inclined to attempt to apply such normalisation to their estimate of
relative site performance.
• Objective nature of y2: Given the objectivity of an external measurement,
from a body like Solomon Associates, it is reasonable to assume that as an
absolute measure of performance it is more likely to capture true site
performance.
Figure 5 - 5: Distribution of responses to Q2.1 (“biased” site performance
Histogram of Q2.1
0.0% 5.0% 10.0% 15.0% 20.0% 25.0% 30.0%
123456789
10
Perfo
rman
ce (i
ndex
)
Percentage (%)
Figure 5-5 shows the upwardly shifted average, potentially an indication of
respondent bias.

48
Figure 5 - 6: Distribution of responses to Q3.8 (“unbiased” site performance)
Histogram of Q3.8
0.0% 10.0% 20.0% 30.0% 40.0% 50.0% 60.0%
Pace setter
1st quartile
2nd quartile
3rd quartile
4th quartile
Per
form
ance
(ind
ex)
Percentage (%)
Figure 5-6 shows the unexpected non-uniform distribution of the Solomon CPA,
with the mean located close to the expected value, potentially enforcing the value
of the independent “unbiased” performance indicator.
5.4. Category variables
Within the questionnaire (Appendix 1) two clearly distinctive categorisation
variables were included. These were the geographic location (variable x11) and the
site ownership change (variable x9 questions. The purpose of these two variables
was to:
• test for clear geographic influences or differences
• test for the external implementation of replication strategies on existing sites

49
5.4.1. Geographic location (variable x11)
Table 5-2 shows the location of the sites that participated in the data collection.
Table 5 - 2: Actual versus potential number of respondents
From table 5-2, as well as figure 5-7 below, it is clear that the majority of responses
were received from North America and Europe. While these areas do represent the
majority of the world’s refining capacity (55%), they represent a combined total of
81% of the total sample population.
Figure 5 – 7: Graphic representation of geographic response
Site location and response rate
010203040506070
NorthAmerica
SouthAmerica
Europe Africa MiddleEast
Asia Australia
Geographic region
# of
site
s
# potential sites# respondents

50
The high concentration of North American and European respondents skews the
results. This may affect the global generalisability of the findings and conclusions.
One way to control for this skewness within the data would be to group the data
into separate categories.
There are several elements which contributed to the low response rate outside
North America and Europe:
• The method used to responses to the questionnaires differed between the
two groupings defined in the methodology section. The multinational refining
companies were approached directly, and requested to participate in the
survey. In contrast, the penetration into sites not directly owned by these
companies was much lower.
• Researchers have found Asia (the region with the third most refineries) as
having the largest concentration of “outer-circle” (people who speak a
language as a foreign rather than a second language) English speakers in
the world (Bolton, 2008). This relatively low level of English proficiency
serves as a natural barrier to completing the English questionnaire.
• The lower response rates from developing countries has been extensively
studied, and as such the result is not unexpected (Hoskisson, Eden, Lau &
Wright, 2000).

51
Given the low response rate outside North America and Europe, the controls for
geographic region are removed. In order to illustrate the effect of removing this
control, the clustering of Western versus non-Western responses are shown in the
parallel plot in figure 5-8.
Each line represents a single sites response across each of the questions. The
lines in black show the non-Western cluster, with question 1 coded as Western =
1, non Western = 0. The lines in cyan represent the remainder of the sample.
Figure 5 - 8: Variability of Western versus Non-Western responses

52
From figure 5-8 several conclusions can be reached:
• There is no systematic pattern evident in the non-Western respondents
• The behaviour of the non-Western respondents does not appear more or
less variable than the larger sample.
Given the limited total sample size, coupled with the lack of clear clustering of data
according to the geographic location, it is not possible to draw any conclusions
regarding the effect of location on replication practices.
5.4.2. Change of ownership (variable x9)
59% of the sites within the sample have undergone a change in the main operating
company for that site at some point in the last 10 years. Ideally one would want to
test for differences in the operational success of these “under new management”
sites.
Figure 5-9 shows the cluster analysis of the sites which have undergone a change
in management. As in figure 5-8, each line represents a single sites response
across each of the questions. The lines in black show the cluster of sites which are
“under new management”. The lines in cyan represent the remainder of the
sample.

53
Figure 5 - 9: Sites which have undergone a change in management in the last 10 years
There are three trends that visually emerge which differentiate the responses of
the one cluster from the other:
• Question 16 (Q2.12): This is directly related to the impact of the change
which was implemented by the new company. This would obviously not be
applicable to sites which have not undergone a change, thereby polarising
the responses to Question 16.
• Questions 8 & 9 (Q2.4 & Q2.5): Both these questions belong to the analysis
variable (defined in table 4-1) x4. This variable is capturing the
implementation of template practices. The lack of intermediary responses
within this cluster would warrant further analysis.

54
• Question 23 & 24 (Q3.6 & Q3.7): These questions belong to two separate
analysis variables, namely x5 and x7. The first deals with the template site
practices, and the second with replication methods. Both concepts are
central to what is being tested, specifically in trying to determine how new
management may affect the operating practices of the site. The differences
within these variables would need to be further analysed for the implications
and statistical relevance.
The above analysis indicates that there may be value in attempting to statistically
describe and model the two categories separately. This would enable the
comparison of the application of replication theory in sites “under new
management”. Given the small total sample, which would be further compromised
by splitting the data into two separate clusters, the independent analysis of these
categories was not done.
5.5. Variable correlation analysis and clustering
In table 4-1 the mapping of the questions to the analysis variables was presented.
This mapping was necessary to show which questions were attempting to capture
the different facets of the same underlying phenomenon.
In table 5-3 the correlation matrix of all the question responses is shown. The
original mapping from table 4-1 has been shown in parallel to the question

55
numbers. Within the body of the matrix, clusters with a correlation coefficient of
higher than 0.5 were highlighted in cyan.
The highlighted blocks form an informal cluster analysis, giving indication of a
significant correlation between the responses to the questions highlighted. The
purpose of this test is two-fold:
• To test for the expected correlation between questions belonging to the
same analysis variable.
• To test for any unexpected correlation between questions and analysis
variables.
Table 5 - 3: Correlation matrix of question responses individual

56
By evaluating the results presented in table 5-3, several patterns emerge within the
data.
5.5.1. Technology cluster (x1 cluster)
One of the main research questions being analysed regards the source of
performance advantage between different refining sites. One of the largest
potential sources of performance advantage would come from differences in the
technology deployed within these sites.
Liu, Yu, Xu, Fan and Bao (2007) showed that while the specific type of technology
deployed within the industry is relatively generic, there have been significant
advances since the early 1900’s. This would suggest that the age of the site, as
well as when the site last under went a major technology investment, would serve
as a good proxy for that sites technology.
The significant negative correlation between the age of the site and when last it
under went a major turnaround (Q1-2 & Q1-4), highlighted in the correlation
analysis, is shown visually in figure 5-10.

57
Figure 5 - 10: Commissioning date compared to last major refurbishement
Technology cluster
0%
10%
20%
30%
40%
50%
60%
70%
Pre1965
1965-70
1970-75
1975-80
1980-85
1985-90
1990-95
1995-00
2000-05
Post2005
Period
Perc
enta
geCommissionedRefurbished
This significant inverse relationship should be expected. As the site ages,
management will invest increasing sums of money to ensure the site remains
competitive. Chen (2005) shows the positive correlation between refinery
investment and demand-side factors, which would support the expectation of high
investment over the last 10 years (The Economist, 2008b).
In section 5-3, the possibility of site age and relative technology influencing the
respondent’s view of relative site performance was introduced. This concept is
tested in figure 5-11. In order to create a vector describing the site’s relative
technology, the composite variable x1 was created from the combination of Q1.2

58
and Q1.4 (in a 30/70 ratio), weighting the effect of recent investment more heavily
than the original site age.
Figure 5 - 11: Effect of technology on performance vectors
Technology versus performance
R2 = 0.0201
R2 = 0.1953
0
0.2
0.4
0.6
0.8
1
0 0.2 0.4 0.6 0.8 1Relative technology
Perf
orm
ance
Y1Y2
The concern raised in the section 5-3 about the objectivity of respondents in the
face of relative technology differences can be rejected. Figure 5-11 shows a
negligible relationship between the technology variable x1 and both performance
variables (though the “unbiased” CPA metric is more influenced).
5.5.2. Company size (x2):
Chen (2005) highlights the different opinions amongst researchers regarding the
size of the company on the performance of individual sites. The x2 cluster from
table 5-3, shows three strong relationships:
• A relationship between company size and technology (x1). By performing
the transform introduced in section 5.5.1, a strong positive relationship

59
between company size and relative technology is found. This is shown in
figure 5-12.
Figure 5 - 12: Investment trend by large companies
Technology versus Company size
y = 0.7604x + 0.1071R2 = 0.4149
0
0.2
0.4
0.6
0.8
1
0 0.1 0.2 0.3 0.4 0.5 0.6 0.7 0.8 0.9 1Relative technology
Com
pany
siz
e
• A strong and consistently positive relationship across the entire x4 cluster.
This cluster is an indication of the template practices which are employed by
a company. The positive correlation would suggest that larger companies
have more sophisticated practices, consistent with those of template
deployment.
• A relationship with cluster x8, which also indicate elements of template
practices. The positive correlation would suggest that larger companies
have more sophisticated practices, consistent with those of template
deployment.
From the strong relationship shown in this section, one would expect that the x2
cluster will feature as a rich variable in the regression analysis.

60
5.5.3. Template existence and practices (x3, x4 cluster)
The x3 (existence of a template site) variable could potentially have been classified
within the data analysis as another category variable. The presence of one or more
template sites within the company of the respondent, could be used to exclude
sites without a template from a portion of the analysis. 50% of respondents
indicated no best practice sites within their organisations, which would halve the
available sample for portions of the analysis.
Figure 5-13 shows the way respondents interpreted the questions regarding the
template sites.
Figure 5 - 13: Respondent interpretation

61
The coding of Q2.2 is given in figure 5-2, and shows that a response of 0 indicates
no template site. Through all the subsequent questions the respondents were
asked to indicate the way in which best practices where shared from this template
site. In these questions, an appropriate response given a negative response to
Q2.2 would be “No template site”, coded as 0 for all subsequent questions.
Figure 5-13 shows that respondents chose options other than “No template site”,
despite the initial indication. This could be interpreted in several ways, but for this
analysis this has taken to mean the respondents have recognised that there are
appropriate sharing mechanisms for site best practices within their organisations.
As such, x3 is not used as a category variable.
The strong correlation between all the elements of x4 (precision of template
implementation) indicates that the cluster is testing a common underlying
phenomenon. All four questions grouped within this cluster attempt to measure the
precision or sophistication of how the template sites practices are implemented
and communicated. An equal weighting transform is applied to Q2.4-Q2.7 to create
the composite variable x4.
5.5.4. Best practices and ERP (x7, x8 cluster)
The variables x7 and x8 are indicative of how the company best practices were
captured, as well as how thoroughly this was codified in an ERP (enterprise
resource planning) system.
62
Question Q2.3 was formulated to capture what practices are utilised by companies
to share best practices with their sites (Jensen, 2008). This portion of x7
(replication methods) has a very high positive correlation with the combination
variables x4 and x8.. The position within the questionnaire, as well as the low
correlation with other elements of x7, indicates that this variable may be combined
with the remainder of x4. However, based on the combination of correlations with
the remainder of x7, as well as the other inter-correlations within this variable, there
is evidence that there is unique variability captured by this variable.
Within x8 two substantially different pieces of information have been captured.
Q3.9 and Q3.10 indicate elements of template implementation, where as Q3.11
highlights the positive aspects of local adaptation. The differences in the
information that is captured by the different variables can be seen from the
different behaviour in the correlation matrix, figure 5-3. The very low correlation of
Q3.11 to the remainder of x8 (and indeed the whole x4) indicates that this variable
is capturing unique elements of site behaviour not included in the other data. As
such, whereas Q3.9 and Q3.10 are uniformly weighted to form the suggested
(table 4-1) combination variable x8, Q3.11 will be analysed separately as variable
x8a.
5.5.5. “Under new management” cluster (x9)
A detailed discussion regarding this cluster was made in section 5.4.2. This
combination variable was removed from the regression analysis.

63
5.5.6. Remainder of combination variables
Due to the lack of strong correlation with any of the other variables, the set of
combination variables x5, x6, and x10 have not yet been covered in the discussion.
Within combination variable x5 (local adaptation) the correlations between the
different components are moderate. This would indicate that each question brings
a portion of the underlying data to the picture, but is not totally unrelated to the
larger combination variable. This, combined with the limited sample size, motivates
for a uniformed combination of the questions into this variable.
Combination variable x6 (deleterious practice elimination) has moderate correlation
with several of the other variables, often just below the 0.5 threshold. The
elimination of deleterious practices has been established as a key part of
successful replication, and as such is retained for further analysis.
Within combination variable x10 (control mechanisms) the correlations between the
different components are moderate. This would indicate that each question brings
a portion of the underlying data to the picture, but is not totally unrelated to the
larger combination variable. This, combined with the limited sample size, motivates
for a uniformed combination of the questions into this variable.

64
5.6. Regression variables
In section 5.5, analysis was shown which motivates the selection of transformed
variables for inclusion in the regression analysis. In table 5-5 the transforms are
presented.
Table 5 - 4: Definition of regression variables
Since the variables have been transformed, the main descriptive statistics from
table 5-1 are given again.

65
Table 5 - 5: Descriptive statistics of regression variables
The analysis of these values, coupled with the visualisation of the variability
(shown in figure 5-14), shows that the total variability and randomness of the
transformed variables remains high.
Figure 5 - 14: Variability of combination variables
Data variability
0.000.100.200.300.400.500.600.700.800.901.00
X7 X1 X2 X3 X4 X5 X6 X8 X8a X10 Y1 Y2Question
Res
pons
e

66
The correlation analysis is repeated for the combination variables in table 5-6. The
conclusions reached in the detailed analysis in section 5-5 remain largely
unchanged. The presence of multicolinearity between the independent variables is
not unexpected, given the natural relationship between the different replication and
template practices.
In addition to the correlation coefficients, the variance inflation factor (VIF) factor is
given. This gives an indication of the increase in the standard error due to the
introduction of that variable, and shows the effect of correlation within the variable
set on the accuracy of the model. For large samples, a VIF of smaller than 10 is
required, and for small sample a VIF smaller than 5 (Maindonald & Braun, 2007:
206). Based on the VIF’s, no variable is disqualified from the regression.
Table 5 - 6: Correlation analysis of regression variables

67
5.7. Regression analysis
In section 5-3, the validity of the relative performance variable y1 (biased estimator)
was investigated. The conclusion reached was that the skewed distribution, as well
as the negligible correlation with the objective performance measure y2 (unbiased
estimator), introduced concerns regarding the usefulness of y1 as a performance
index for the site. Several potential reasons for this lack of uniform distribution and
correlated response were offered in that discussion.
Before finally rejecting y1 as a useful dependent index for the testing of the
hypotheses, the results of the multivariable analysis are presented and discussed.
5.7.1. Regression analysis of y1
The transformed composite variables shown in table 5-4 were used as inputs to
model the variability in y1.The summary results from the robust regression of y1 are
shown in table 5-7.

68
Table 5 - 7: Multivariable linear regression results for y1
From table 5-7 the questionable usability of y1 as a dependent performance
variable becomes clear:
• The coefficient of determination (R2) shows that the independent variables
can explain 45% of the total variation in y1. However, when taken in
conjunction with the adjusted coefficient, which accounts for the small total
sample size, this value decreases to 18%. This low goodness of fit is shown
visually in figure 5-15.
• The relatively small result from the partial F-test (smaller than 3), coupled
with the poor probability level (greater than 5%), indicate a poor regression
result (Albright, et. al., 2006).
• Only 1 of the independent variables is shown to have any statistically
significantly descriptive power (x7 – template replication methods). This

69
corroborates the finding noted from the difference between the R2 and the
adjusted R2, which indicates that the additional independent variables
addition to the accuracy of the prediction is close to random.
Figure 5 - 15: Reconstruction of Y1
Reconstructed Dependent variable (Y1)
0.20.30.40.50.60.70.80.9
1
1 3 5 7 9 11 13 15 17 19 21 23 25 27 29 31Data point
Val
ue
Y1Estimated Y1
Figure 5-15 shows how the estimate closely approximates the mean of y1 with
minimal variability around this mean. The estimate fails to correctly capture several
of the peaks in the data.
Appendix 2 shows the full results of the regression analysis. Specific note should
be taken of the normality of all the residuals. In all cases, using the robust
regression, the residuals of y1 were found to be non-normal.
The attempt to use y1 with the larger partial sample, in order to generate a higher
confidence regression result, was attempted. Given that variable x1 to x4 are

70
composed exclusively from questions in the first two questionnaire sections, 36
respondents could be used to generate a partial regression result. The results from
this regression were poorer than that achieved with a larger variable set (but
smaller sample), with an R2 of 0.35.
Based on this analysis y1 was not used to test the hypotheses defined in section 3.
5.7.2. Regression analysis of y2
The theoretical superiority of y2 as a “non-biased” indicator of the performance of
the site are due to:
• Independent nature of the performance analysis removes respondent and
site bias from the CPA index.
• The CPA index has been corrected for the influences of age, geographic
location and technology.
• While respondents may be inclined to overstate their Solomon index, this
effect was partially discounted through insurances of respondent anonymity.
In addition, the analysis in section 5-3 show that this variable is statistically
well behaved.
As with y1, the transformed composite variables shown defined table 5-4 were
used as independent regression variables. Table 5-8 shows the summary results
from the regression analysis.

71
Table 5 - 8: Multivariable linear regression results for y2
The aspects which brought the validity of y1 into question are not applicable to the
regression results of y2. Rather, from table 5-8 the following is clear:
• The coefficient of determination shows that the independent variables
account for 64% of the variation within y2. When this is adjusted to account
for the small sample size, a significant portion of the variability is still
described (45%).
• The results of the partial F-test show an acceptably high (greater than 3)
value, with a probability smaller than 5% (Albright, et. al., 2006). This
indicates that variables within the model add significantly to the improved
regression result.
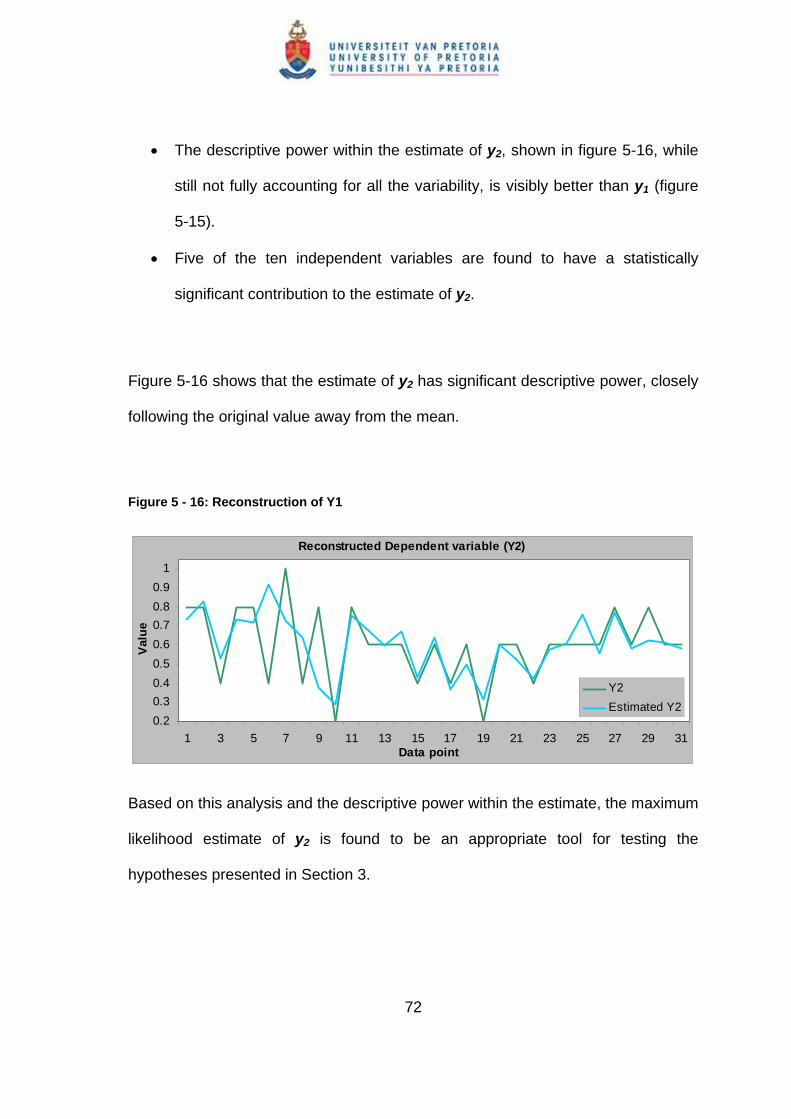
72
• The descriptive power within the estimate of y2, shown in figure 5-16, while
still not fully accounting for all the variability, is visibly better than y1 (figure
5-15).
• Five of the ten independent variables are found to have a statistically
significant contribution to the estimate of y2.
Figure 5-16 shows that the estimate of y2 has significant descriptive power, closely
following the original value away from the mean.
Figure 5 - 16: Reconstruction of Y1
Reconstructed Dependent variable (Y2)
0.20.30.40.50.60.70.80.9
1
1 3 5 7 9 11 13 15 17 19 21 23 25 27 29 31Data point
Valu
e
Y2Estimated Y2
Based on this analysis and the descriptive power within the estimate, the maximum
likelihood estimate of y2 is found to be an appropriate tool for testing the
hypotheses presented in Section 3.

73
Appendix 3 shows the full results of the regression analysis. Specific note should
be taken of the normality of all the residuals. In all cases, using the robust
regression, the residuals of y2 were found to be normal.
Equation 5-2 shows the form of the final estimate ( 2y) ) of y2.
108876543212 62.035.013.048.035.022.055.033.038.039.062.0 xxxxxxxxxxy a +−−+−++−−−=)
Equation 5 - 2
5.8. Hypothesis testing
In section 3, two hypotheses were proposed.
5.8.1. Hypothesis 1 (Exploration)
Hypothesis 1 contends that successful replication is correlated with the
development or conceptualisation of the Arrow Core (Winter & Szulanski, 2001).
For the purpose of the analysis, the measure of success was defined by the
Solomon Comparative Performance Assessment, CPA, captured in variable y2.
In order to determine the validity of this hypothesis, four sub-hypotheses were
proposed. Each sub-hypothesis was directly tested through one of the composite
variables defined in table 5-4. The null sub-hypotheses are defined in table 5-9.

74
Table 5 - 9: Results of the test for hypothesis 1
From table 5-9, the null hypothesis for the sub-hypotheses H1a, H1b and H1d can be rejected. Sub-hypothesis H1c was
not rejected. This partial result for hypothesis 1 shows that while there are significant relationships, the hypothesis
regarding exploration cannot be accepted in its entirety.
In addition to the rejection of the sub-hypotheses, the sign of the regression coefficient is also important in determining the
validity of the hypothesis. This is because the hypothesis was stated for the non-zero case, rather than for the strictly
positive case. From table 5-8, it can be seen that the coefficients x3 and x6 are negative, while x4 and x5 are positive.
Therefore, in addition to H1c, the null hypotheses for H1a and H1d can not be rejected.
75
From this analysis, the following statements can be made regarding the
development of the arrow core within the Petrochemical Refining Industry:
• The definition of a template or focal site has a significantly negative effect
on the individual site performances (evidenced from the negative regression
coefficient, as well as the high confidence determined for the regression
coefficient).
• The definition of a common set of practices that are non-negotiable for all
sites has a strongly positive effect on individual site performances
(evidenced from the significantly positive regression coefficient, as well as
the high confidence determined for the regression coefficient)..
• No conclusion can be reached regarding the importance of the identification
of unique local practices to the success of individual sites (evidenced from
low confidence determined for the regression coefficient).
• The conscious identification and removal of deleterious practices has a
significantly negative effect on the individual sites performance (evidenced
from the negative regression coefficient, as well as the high confidence
determined for the regression coefficient).
While the lack of conclusion regarding H1c is unfortunate, the counter-intuitive
conclusions regarding H1a and H1d require further analysis and exploration.
Potential explanations that could be investigated include:

76
• The relative immaturity of the concept of a template site within this industry.
This may result in a temporary negative performance effect which will
reverse over time.
• Inappropriate weightings, translations or apportionment within the various
transformations. This was tested through applying different codes and
transforms to x3 and x6. These trials did not change the sign of the
coefficients, or affect the conclusions which were reached from the
regression analysis.
• Only a single respondent indicated the usage of a single template site,
where the rest indicated either no template or multiple template sites, which
is noteworthy to the result of H1a. This lack of this practice within the
industry is highly significant.
• The majority (58%) of respondents to Q3.4, which is the sole independent
input into determining the result for testing H1d, indicated that local rather
than central processes were responsible for the removal of negative
practices. This would result in those sites deviating further from the defined
template practices, especially when the reason behind practices defined as
part of the template are not understood. This effect was not adequately
captured in the questionnaire.
The acceptance of only H1c within the greater definition of Hypothesis 1 can be
interpreted in several ways. For the purpose of this study, it is assumed that the
conclusions regarding the company specific definition of an arrow core, template

77
site and the associate practices do not affect the tests regarding the
implementation of those company best practices.
5.8.2. Hypothesis 2 (Exploitation)
Hypothesis 2 contends that successful replication is correlated with the effective
use of a template (Winter & Szulanski, 2001). For the purpose of the analysis, the
measure of success was defined by the Solomon Comparative Performance
Assessment, CPA, captured in variable y2.
In order to determine the validity of this hypothesis, three sub-hypotheses were
proposed. Each sub-hypothesis was directly tested through one of the composite
variables defined in table 5-4. The null sub-hypotheses are defined in table 5-10.
From table 5-10, the null hypotheses for sub-hypotheses H2a and H2b can be
rejected. Sub-hypothesis H2c was not rejected. This partial result for hypothesis 2
shows that while there are significant relationships, but that the hypothesis
regarding exploitation cannot be accepted in its entirety.

78
Table 5 - 10: Results of the test for hypothesis 2
In addition to the rejection of the sub-hypotheses, the sign of the regression coefficient is also important in determining the
validity of the hypothesis. This is because the hypothesis was stated for the non-zero case, rather than for the strictly
positive case. From table 5-8, it can be seen that the coefficients x8 and x8a are negative, while x7 and x10 are positive.
This does not affect the rejection of H2a and H2b, and does not change the result for H2c.
From this analysis, the following statements can be made regarding the exploitation of template practices within the
Petrochemical Refining Industry:

79
• The accurate and exact implementation of a defined set of business
processes has a strongly positively effect on the performance of individual
sites (evidenced from the significantly positive regression coefficient, as
well as the high confidence determined for the regression coefficient).
• The control of local adaptation and variation of the template practices
has a strongly positive effect on the performance of individual sites
(evidenced from the significantly positive regression coefficient, as well as
the high confidence determined for the regression coefficient).
• No conclusion can be reached regarding the importance of controlling
exploration and adaptation at either the template site, or at a close
replica (evidenced from the low confidence determined for the regression
coefficient).
Within the construct of hypothesis 2, the concepts captured in H2a and H2b
regarding the effective exploitation of template site practices strongly correlate
with positive site performance. While no conclusion could be reached regarding
H2c, it is reasonable to accept hypothesis 2.

80
6. Conclusions
Despite the recent change in the world’s economic climate, many of the large
emerging economies are in a position where their growth and continued demand
will place a floor under commodity prices (Economist, 2008c). Coupled with
aggressive infrastructure investment plans in South Africa (The Presidency,
2006), methodologies for successful expansion in capital intensive industries will
remain topical both locally and internationally.
Given the increased prevalence of replication in global expansion strategies
(Winter & Szulanski, 2001), the applicability of this path to achieving growth
within capital intensive companies needs to be evaluated.
While the replication of technology and tacit assets are relatively common in
capital intensive businesses, the role of the intangible assets in successfully
operating that technology has been neglected (King, 2007). This is despite
significant evidence that the differences in the tacit knowledge assets between
companies within the petrochemical sector significantly affect performance and
profitability (Bloch & Hernu, 2007, King, 2007).

81
The re-use of central organisational knowledge through the replication of
standardised business processes has been postulated (Winter & Szulanski,
2001) and qualitatively shown (Szulanski & Jensen, 2004) to be a successful
approach. However, no quantitative studies have been published to prove the
value of replication above a more lassez faire expansion strategy.
The lack of academic evidence has not stopped global companies realising the
benefit to be gained from the replication of company knowledge, and taking
strategic advantage from difficult to imitate tacit company asset (Szulanski &
Jensen, 2004; Rivkin, 2000).
In order to show the benefits of a business process replication strategy within the
capital intensive industry of petroleum refining, two theoretical constructs were
tested:
• Exploration: evaluating whether successful companies have developed
and conceptualised the Arrow Core, as defined by Winter and Szulanski
(2001).
• Exploitation: evaluating whether successful companies have used the
concept of a template in order to replicate aspects of the Arrow Core
(Winter & Szulanski, 2001).

82
Inter and intra company data from the petroleum refining sector was used to
model the presence of the above constructs, and formally test the hypotheses
proposed regarding replication. While several sub-hypotheses were shown to be
valid, the main hypotheses regarding the prevalence and applicability of
replication in capital intensive industries were rejected.
6.1. Exploration
In their theoretical treatment of replication, Winter and Szulanski (2001) propose
that the definition of an Arrow Core forms a key element in successful replication
within a company. The Arrow Core represents the ideal set of positive
contributors which a company uses to produce its product.
The test for the presence of the Arrow Core was formulated as a composite of
four sub hypotheses, each testing for an element of the Arrow Core. This
analysis clearly showed that successful replication was only correlated with
aspects of the Arrow Core, and not with the entire theoretical construct. Two of
the four characteristics of the Arrow Core were found to have a negative impact
on the success of replication.
H1a: Successful replication is correlated with the definition of core capabilities at
a centre or focal part of the organisation. In the regression analysis the aspects
of central definition of the positive contributors was found to have a negative

83
impact on the success of replication. This would suggest that companies actively
attempting to create or define the Arrow Core at a focal part of the organisation
perform less well than companies allowing the development of best practices at
local sites.
While the source of this negative impact could be temporary, pointing to the
immaturity of replication theory within this industry, this seems unlikely. A more
acceptable conclusion is that the impact of operating complex technology
currently requires high levels of local autonomy and expertise. Companies
attempting to centrally define all the positive contributors are simply unable to do
so.
This conclusion is in line with Rivkin’s (2001) findings, showing that under very
complex conditions the effort required to define the Arrow Core are so high that it
negates the advantages from doing so.
H1b: Successful replication is correlated with the explicit definition of the valued
features of the final product/service that re non-negotiable for each site. This was
shown to be valid for capital intensive industries. A clear performance advantage
was found within sites where a common set of practices regarding the final
product was deployed and non-negotiable across the entire organisation.

84
This shows that while the definition of a complete set of positively contributing
capabilities at the focal point of the organisation has a negative impact on
performance, the deployment of a set of common practices across all sites does
positively impact performance. This would indicate that the company wide
definition and roll-out of best practices, originating at multiple sites and not
concentrated at a focal point, positively impacts performance.
H1c: Successful replication is correlated with the identification of the procedures
involved in the local production of the valued features. Winter and Szulanski
(2001) postulate that successful replication involves actively identifying unique
local processes that have positive interactions with the Arrow Core. No
conclusion was reached from the analysis regarding the validity of this statement.
H1d: Successful replication is correlated with the conscious identification and
elimination of information and business processes that are deleterious. The
analysis conducted found that there was a significant negative performance
impact at sites using this practice. In the discussion regarding this phenomenon,
it was noted that across the entire sample, all examples of deleterious process
identification and removal were locally driven and controlled by the individual
sites.

85
By definition, high levels of causal ambiguity (like those present in complex
manufacturing companies) make understanding the interactions between the
consequences and the initiating causes. Given the efforts to centrally define and
roll-out best practices and the local attempts to remove deleterious practices, the
opportunity for local agents to be acting under conditions of incomplete
information or imperfect understanding are real. This could lead to the two parties
acting at cross purposes, and to the removal of potentially positive interactions.
The lack of evidence of the complete implementation of the Arrow Core could
suggest that the requirement for a formal and central definition of the Arrow Core
is not a pre-requisite for successful replication within capital intensive industries.
However, the recognition and definition of the valued product features which are
non-negotiable within the entire organisation are a pre-requisite. Undue effort to
centrally define all aspects of the Arrow Core has been shown to have a negative
impact on performance within Capital Intensive industries.
6.2. Exploitation
Once companies are comfortable with the extent of the definition of the Arrow
Core, a single site with the most complete deployment of the Arrow Core is used
as the template for replication. This freezing of the template marks the end of the
exploration phase, and signals recognition that the effort spent in defining and
partially perfecting the Arrow Core should now be exploited. The decision to
freeze the template is determined by the trade off between speed and precision.

86
The use of a template to replicate the positive elements captured in the Arrow
Core was proposed to be a key element in successful replication strategies
(Winter & Szulanski, 2001). In order to test this, three sub hypotheses were used
to determine the applicability of templates in capital intensive industries. Within
this composite hypothesis, two of the three hypotheses were found to be true,
and no conclusion could be reached regarding the third.
H2a: Successful replication is correlated with accurate and exact implementation
of a set of business processes. While the central definition of a complete set of
complimentary practices was found to be absent (hypotheses H1a), the exact
implementation of a set of business processes was found to have a strongly
positive performance impact.
This is in no way contradictory, giving indication of the use of replication in the
absence of a complete definition of the Arrow Core. Sites which attempted to
exactly implement practices which had been shown to be successful at other
sites within the organisation were more successful.
This would indicate that while the replicators access to the template in a complex
industry does not allow the definition or formalisation of the Arrow Core, this

87
access does bring advantage to sites attempting to exactly replicate a successful
practice.
H2b: Successful replication is correlated with the control of variation in the local
adaptation of the template. This was shown to be valid in the regression model
and subsequent analysis. In contrast to hypothesis H1a, this result showed that a
system initiated across the organisation to control local variation and adaptation
of template site practices was a successful strategy.
This conclusion is in line with the findings regarding H1d, which showed that local
attempts to remove deleterious practices were unsuccessful. This would suggest
that certain practices and positive interactions are only clear on the
organisational level, and cannot be controlled for locally.
H2c: Successful replication is correlated with the controlled exploration and
adaptation in sites where a close replica of the template is in place and operating.
No conclusion could be reached regarding this sub hypothesis. Exploitation is the
phase where best practices and knowledge gained at the expense of the
organisation, are leveraged for greater profits.

88
The intention of testing for H2c was to determine how continuous feedback and
improvement is accounted for by the entire organisation. Controlled exploration at
the template site was postulated to be a mechanism for capturing this learning. A
lack of clear conclusion indicates that this may not be the dominant form for
continuous improvement across organisations, and that a level of local autonomy
may have a stronger role to play. However, no conclusion, positive or negative,
could be reached.
From the modelling and analysis of the effective use of a template site, the two
central sub hypotheses were found to hold. The lack of conclusion regarding H2c
does not detract from the findings that the usage of a template in replicating
business practices yields a clear performance advantage to sites using this
practice.
6.3. Recommendations
This analysis of replication practices within petroleum refining has yielded several
useful conclusions generalisable to capital intensive industry as a whole. As the
first quantitative study of replication, it was possible to test the validity of the
theoretical constructs presented in the literature. While aspects of the theory are
not applicable in this industry, the framework presented an excellent platform
from which to reach strong conclusions and make recommendations. The

89
following recommendations could be presented to decision makers and
managers in capital intensive industries.
Companies seeking to expand through a replication strategy should be wary of
attempting to completely centralise a definition of all positive interactions (an
Arrow Core). Indications are that the complexity in capital intensive industries
could hamstring this effort, leading to a situation where the effort required in the
exploration and definition of the interaction exceeds the gains to be had during
the exploitation of those practices.
While the attempt to centrally define all positive contributors is not advisable, this
does not preclude the requirement to share best practices between sites. The
evidence from the study shows that local repositories of best practices are
advantageous to the performance of the individual sites. Coupled with the use of
these sites as templates and opportunities for experiential learning, companies
can leverage best practices across the organisation.
The best practices gathered from these sites need to be treated as non-
negotiable within the individual sites. By enforcing adherence to certain practices,
and explicitly controlling for deviation or variation from the template sites
practices, companies gain a performance advantage. Managers are advised to

90
implement a central programme to define best practices across the individual
sites. Those sites should then be used as templates for the roll-out of that
practice across the whole organisation, while ensuring that variations or
deviations are minimised.
While local autonomy may be important to allow for the development of best
practices, certain company initiatives need to be centrally administered and
controlled. By allowing sites to locally control for deleterious practices, the
opportunity to remove potentially positive interactions arises – especially where
those practices may have been identified across the whole organisation. This
was shown to be true in the analysis. Managers are advised to carefully consider
which practices are non-negotiable for sites, thereby preventing decision making
in the presence of local causal ambiguity.
6.4. Future research
As the first quantitative study or replication, this report has found many of the
central arguments within the theoretical constructs regarding replication to be of
questionable applicability to capital intensive industries. However, since a single
industry was used as a proxy, and the total sample size was relatively small,
these findings need to be verified.
91
Throughout the analysis, the effect of company size (x2) was used as an input
into the analysis. However, no conclusions were reached regarding the impact of
company size on the applicability of replication theory. It seems reasonable to
postulate that there exists some threshold below which companies are too small
to gain significant advantage from replication. This effect should be investigated.
Capital intensive industries are characterised by relatively slow expansions, with
lead times for equipment, as well as capital requirements, often necessitating five
to ten year periods between successive iterations. Under these conditions,
perfection would have a stronger weight than speed of replication. This could
skew analysis into replication in this industry, and should be explored.
Another element which was continuously included, but which yielded no
conclusions, regards the effect of technology and site age (x1) on performance.
Previous studies (Bloch & Hernu, 2007) have shown that significant performance
differences can be found over and above those introduced by technology. Since
the dependent variable (y2) that formed the basis of most conclusions has been
corrected for technology, no conclusions regarding this aspect could be reached.
Given the large impact of technology on performance (Chen, 2005), further
analysis on this aspect is warranted.
y

92
Further investigate the impact of local procedures on the positive performance of
individual sites within the organisation needs to be done. While care was taken in
this study to control for multi co linearity, there may be commonalities between
locally and centrally defined practices. Future research could be conducted to
further investigate this aspect, and tease out the unique performance differences.
One aspect of the theoretical construct which is only partially defined and could
be more completely stated and investigated regards the differences between
local and central controls. In the examination of H1a and H1d, the opportunity for
the removal of potentially positive interactions was identified. Since local agents
act to remove deleterious practices which the focal part of the organisation may
either have introduced or assumed to be in play, introduced the opportunity for
counter productive interventions.
This incomplete control over the implementation of the Arrow Core between local
and central agents could skew conclusions regarding the necessity of the Arrow
Core in replication strategies. By specifically measuring only eliminations that
form part of the Arrow Core definition, it may be possible to more completely test
the applicability of the Arrow Core in capital intensive industries.
While this study yielded rich conclusions, more study in this field is needed.

93
7. Consistency matrix
Table 7-1 shows the consistency matrix for the research project.
Title: Replication as a strategy in capital intensive industries.
Table 7 - 1: Consistency matrix
Hypotheses Literature review Instrument Analysis
Hypothesis 1 (Exploration):
Successful replication is correlated with the development or conceptualisation of the Arrow core
Winter & Szulanski (2001)
x3, x4, x5 & x6 Multiple linear regression between questionnaire variables and y1 & y2.
H1a: Successful replication is correlated with the definition of core capabilities at a centre or focal part of the organisation
Kogut & Zander (1992) x3 Multiple linear regression between questionnaire variables and y1 & y2.
H1b: Successful replication is correlated with the explicit definition of the valued features of the final product/service that are non-negotiable for each individual site.
Winter & Szulanski (2001)
x4 Multiple linear regression between questionnaire variables and y1 & y2.
H1c: Successful replication is correlated with the identification of the procedures involved in the local production of the valued features.
Winter & Szulanski (2001)
x5 Multiple linear regression between questionnaire variables and y1 & y2.
H1d: Successful replication is correlated with the conscious identification and elimination of information and business processes that are deleterious.
Winter & Szulanski, 2001 x6 Multiple linear regression between questionnaire variables and y1 & y2.

94
Hypothesis 2 (Exploitation):
Successful replication is correlated with the effective use of a template.
Winter & Szulanski (2001)
x7, x10, x8 & x8a Multiple linear regression between questionnaire variables and y1 & y2.
H2a: Successful replication is correlated with accurate and exact implementation of a set of business processes.
Winter et. al. (2007)
Winter & Szulanski (2001)
x7 Multiple linear regression between questionnaire variables and y1 & y2.
H2b: Successful replication is correlated with the control of variation in the local adaptation of the template.
Jensen, 2007b x10 Multiple linear regression between questionnaire variables and y1 & y2.
H2c: Successful replication is correlated with the controlled exploration and adaptation in sites where a close replica of the template is in place and operating.
Winter & Szulanski (2001)
x8 & x8a Multiple linear regression between questionnaire variables and y1 & y2.

95
8. References
Albright, S. C., Winston, W. L. and Zappe, C. (2008) Data Analysis and Decision
Making with Microsoft Excel, Mason, Thompson, USA.
Arslan, O., Edlund, O. and Ekblom, H. (2001) Algorithms to Compute CM and s-
Estimates for Regression, in R. Dutter, P. Filzmoser, U. Gather & P. Rousseeuw
(eds.) Developments in Robust Statistics. Heidelberg: Physica-Verlag.
Barley, S. R. and Tolbert, P. S. (1997) Instituitionalization and Structuration:
Studying the Links between Action and Institution. Organization Studies. 18 (1),
93 – 117.
Becker, M. C. and Knudsen, T. (2005) The Role of Routines in Reducing
Pervasive Uncertainty. Journal of Business Research 58 (2005), 746 – 757.
Becker, M. C. (2004) Organizational Routines: A Review of the Literature.
Industrial and Corporate Change 13 (4), 643 – 677.
Bloch, H. P. and Hernu, M. (2007) Performance Benchmarking Update:
Expectations and Reality. Hydrocarbon Processing. Dec 2007, 87 – 90.

96
Bolton, K. (2008) English in Asia, Asian Englishes, and the Issues of Proficiency,
English Today, 24, 3-12.
Chen, M. Y. (2002) Survival Duration of Plants: Evidence from the US Petroleum
Refining Industry. International Journal of Industrial Organization, 20, 517 – 555.
Chen, M. Y. (2005) Technology Adoption in Response to Changes in Market
Conditions: Evidence from the US Petroleum Refining Industry. Economics of
Innovation and New Technology, 14 (8), 735 – 756.
Couper, M., Baker, R. P., Bethlehem, J., Clark, C. Z. F., Martin, J. and O’Reilly, J.
M. (1998) Computer Assisted Survey Information Collection, New York, Willey-
IEEE.
Dillman, D. A. (2007) Mail and Internet Surveys: The Tailored Design Method,
Second Edition, 2007 Update, New York, Willey-IEEE.
Firer, C., Ross, S. A., Westerfield, R. W. and Jordan, B. D. (2004) Fundamentals
of Corporate Finance – 3rd South African Edition. New York: McGraw Hill.

97
Florida, R. and Kenny, M. (2000) Transfer and Replication of Organizational
Capabilities: Japanese Transplant Organizations in the United States, in Dosi,
Nelson and Winter (eds.). Nature and Dynamics of Organisational Capabilities
London: Oxford City Press.
Fowler, F. J. (2001) Survey Research Methods, Thousands Oaks, SAGE.
Hicks, B. J., Culley, S. J., Allen, R. D. and Mullineux, G. (2002) A Framework for
the Requirements of Capturing, Storing and Reusing Information and Knowledge
in Engineering Design. International Journal of Information Management, 22
(2002), 263 – 280.
Hoskisson, R. E., Eden, L., Lau, C. M. and Wright, M. (2000) Strategy in
Emerging Economies. Academy of Management Journal, 43 (2), 249 – 267.
Kendall, M. G. and Stewart, A. (1967) The Advanced Theory of Statistics,
Volume 2: Inference and Relationships, 2nd Edition. London: Butler and Tanner
Ltd.

98
King, A. W. (2007) Disentangling Interfirm and Intrafirm Causal Ambiguity and
Sustainable Competitive Advantage. Academy of Management Review. 32 (1),
156 – 178.
Kogut, B. and Zander, U. (1992) Knowledge of the Firm, Combinative
Capabilities, and the Replication of Technology. Organization Science. 3 (3), 383
– 397.
Jensen, R. J. (2007a) Variation Through Replication: The Extent and Sources of
Variance when Replicating Organisational Routines. Academy of Management
Proceedings, 2007, 1-6.
Jensen, R. J. (2007b) Replication and Adaptation: The Effect of Adaptation
Degree and Timing on the Performance of Replicated Routines. Academy of
Management Proceedings, 2007, 1-6.
Jensen, R. J. ([email protected]), 12 July 2008. Re: Survey on Replication
Process: attachment Reference and Persuasion.doc. Email to M. Jones and H.
Barnard ([email protected] and [email protected]).

99
Lippman, S. A. and Rumelt, R. P. (1982) Uncertain Imitability: An Analysis of
Interfirm Differences in Efficiency under Competition. The Bell Journal of
Economics, 13 (2), 418 – 438.
Liu, S. and Young, R. I. M. (2007) An Exploration of Key Information Models and
their Relationships in Global Manufacturing Decision Support. Proceedings of
IMechE, 221 (b), 711 – 724.
Liu, H., Yu, J., Xu, J., Fan, Y. and Bao, X. (2007) Identification of Key Oil Refining
Technologies for China National Petroleum Co. (CNPC). Journal of Energy
Policy, 35 (2007), 2635 – 2647.
Maindonald, J. M. and Bruan, J. (2007) Data Analysis and Graphics using R: An
Example Based Approach, London, Cambridge University Press.
Nelson, R. R. and Winter, S. G. (1982) An Evolutionary Theory of Economic
Change. Boston: Harvard University Press.
O’Donnel, S. W. (2000) Managing Foreign Subsidiaries: Agents of Headquarters,
or an Interdependent Network. Strategic Management Journal, 21, 525 – 548.
100
Porter, M. E. (1980) Industry Structure and Competitive Strategy: Keys to
Profitability. Financial Analysts Journal, 36 (4), 30 – 41.
Rivkin, J. (2000) Imitation of Complex Strategies. Management Science. 46 (6),
824 – 844.
Rivkin, J. W. (2001) Reproducing Knowledge: Replication without Imitation at
Moderate Complexity. Organizational Science, 12 (3), 274 – 293.
Rogers, E. (1980) Diffusion of innovations, New York, Free Press.
Seal, W., Garrison, R. H. and Noreen, E. W. (2006) Management Accounting 2nd
Edition, New York, McGraw-Hill.
Solomon Associates (2008) http://www.solomononline.com/company/index.asp
[Accessed 1 June 2008].
Spender, J. C. and Grant, R. M. (1996) Knowledge and the Firm: Overview.
Strategic Management Journal, 17 (Winter Special Issue), 5 – 9.

101
Szulanski, G. and Jensen, R. J. (2004) Overcoming Stickiness: An Empirical
Investigation of the Role of the Template in the Replication of Organizational
Routines. Managerial and Decision Economics. 25, 347 – 363.
Szulanski, G. and Winter, S. (2002) Getting it Right the Second Time. Harvard
Business Review, Jan 2002, 62 – 69.
Teece, D. J., Pisano, G. and Shuen, A. (1997) Dynamic Capabilities and
Strategic Management. Strategic Management Journal, 18 (7), 509 – 533.
The Economist (2008a) Another BRIC in the Wall. The Economist, Apr 21 2008,
http://www.economist.com/finance/displaystory.cfm?story_id=11075147
[Accessed 31 May 2008].
The Economist (2008b) Double, Double Oil and Trouble. The Economist, May 29
2008, http://www.economist.com/finance/displaystory.cfm?story_id=11453090
[Accessed 31 May 2008]

102
The Economist (2008c) The Financial Crisis: Into the Storm. The Economist,
October 23 2008
http://www.economist.com/opinion/displaystory.cfm?story_id=12471135
[Accessed 9 November 2008].
The Presidency of the Republic of South Africa (2006) Accelerated and Shared
Growth Initiative – South Africa (ASGISA) – A Summary.
http://www.info.gov.za/asgisa [3 July, 2007].
Winter, S. G. (1987) Knowledge and Competence as Strategic Assets, in David
Teece (Ed.), The Competitive Challenge – Strategies for Industrial Innovation
and Renewal, Cambridge, Ballinger.
Winter, S. G. and Szulanski, G. (2001) Replication as Strategy. Organisation
Science. 12 (6), 730 – 743.
Winter, S. G., Szulanski, G., Ringov, D. and Jensen, R. J. (2007) Reproducing
Knowledge: Inaccurate Replication and Failure in Franchise Organisations.
Academy of Management Proceedings, 2007, 1-6.

103
Zander, U. and Kogut, B. (1995) Knowledge and the Speed of the Transfer and
Imitation of Organizational Capabilities: An Empirical Test. Organisation Science.
6 (1), 76 – 92.
Zikmund, W. G. (2003) Business Research Methods, Ohio, Thomson Learning.

I
Appendix 1: Questionnaire

Page 1
Replication survey: Survey 1Replication survey: Survey 1Replication survey: Survey 1Replication survey: Survey 1
Given the current global demand for resources and energy, many operating companies are pursuing rapid expansion. Refining companies are no exception, and the question about how to successfully expand is thus particularly relevant.
In order to extract maximum value from it's operating expertise, companies can seek to operate multiple similar sites. Duplicating knowledge and best practices between different locations is known as replication.
While replication has been shown to be applicable in retail and service sectors, there is no evidence for it's applicability to technology industries (like refining).
This research intends to test the success of replication where technology choice and capital infrastructure have a significant impact on success.
The information collected is entirely anonymous. Your name, company or site will not be collected or stored. By completing this survey you indicate voluntary participation in this research, and grant permission for the response to be used in future research.
If you have any concerns, please contact me.
Melvin JonesEmail: [email protected]: +27 83 399 7670
The survey should take no longer than 10 - 15 minutes to complete, and is only 3 pages in length.
INTRODUCTORY QUESTIONS
1. Where is your site located?
2. In which five year period was the site first commissioned?
1. Replication as a Strategy in Capital Intensive Industries
*
*
North America
nmlkj
South America
nmlkj
Europe
nmlkj
Africa
nmlkj
Middle East
nmlkj
Asia
nmlkj
Australia
nmlkj
Pre 1965
nmlkj
1965-70
nmlkj
1970-75
nmlkj
1975-80
nmlkj
1980-85
nmlkj
1985-90
nmlkj
1990-95
nmlkj
1995-00
nmlkj
2000-05
nmlkj
Post 2005
nmlkj

Page 2
Replication survey: Survey 1Replication survey: Survey 1Replication survey: Survey 1Replication survey: Survey 13. How many refining sites does your company operate?
4. When last did your site undergo a major refurbishment (greater than $500k)?
1. With 1 being poorly and 10 being the best, how would you compare your sites production performance against others within the industry?
2. Does your organisation have a template site on which organisational structure and operating practices for all other sites are based?
3. How do the best practices from this template site get shared with your site? (please check all applicable options)
4. To what extent is your site's orgnisational structure identical to the template site?
*
*
2. Company practices
*
*
*
*
Less than 5
nmlkj
Less than 10
nmlkj
Less than 20
nmlkj
Less than 50
nmlkj
More than 50
nmlkj
Pre 1965
nmlkj
1965-70
nmlkj
1970-75
nmlkj
1975-80
nmlkj
1980-85
nmlkj
1985-90
nmlkj
1990-95
nmlkj
1995-00
nmlkj
2000-05
nmlkj
Post 2005
nmlkj
Never
nmlkj
Yes - single best practice template site
nmlkj
Yes - multiple best practice sites
nmlkj
No
nmlkj
No template site
gfedc
Experiential exposure of site personnel at COE
gfedc
Training/implementation by COE personnel at my site
gfedc
Documented procedures
gfedc
Updated business processes
gfedc
Newsletters, presentations, videos and reports
gfedc
Adhoc communication (email etc)
gfedc
Workshops and central training efforts
gfedc
Project and start-up teams deployed from COE
gfedc
Conferences
gfedc
Informal networks and site visits
gfedc
Identical/Is the template site
nmlkj
Very similar
nmlkj
Similar
nmlkj
Dissimilar
nmlkj
Totally different
nmlkj
Not applicable - no template site
nmlkj

Page 3
Replication survey: Survey 1Replication survey: Survey 1Replication survey: Survey 1Replication survey: Survey 15. To what extent do you believe the local operating practices differ from those of the template site?
6. To what extent do you believe the local culture differs from that at the template site?
7. To what extent are the physical layouts of the productive work spaces similar to that of the template site (eg, workshops, control rooms, laboratories etc)?
8. What percentage of your sites operating procedures were designed or significantly adapted by local site personnel?
9. What percentage of your site's Process and Occupational Safety practices were designed or significantly adapted by local site personnel?
10. To what extent do you believe your sites operation is different from others within your organisation (due to issues like local work force and location)?
*
*
*
*
*
*
Not applicable - no template site
nmlkj
Totally different
nmlkj
Signifcantly different
nmlkj
Moderately different
nmlkj
Significantly similar
nmlkj
Identical/Is the template site
nmlkj
Not applicable - no tempate site
nmlkj
Totally different
nmlkj
Significantly different
nmlkj
Moderately different
nmlkj
Significantly similar
nmlkj
Identical/Is the template site
nmlkj
Identical/Is the template site
nmlkj
Very similar
nmlkj
Similar
nmlkj
Dissimilar
nmlkj
Totally different
nmlkj
Not applicable - no template site
nmlkj
None
nmlkj
0 - 25%
nmlkj
25% - 50%
nmlkj
50% - 75%
nmlkj
75% - 100%
nmlkj
All
nmlkj
None
nmlkj
0 - 25%
nmlkj
25% - 50%
nmlkj
50% - 75%
nmlkj
75% - 100%
nmlkj
All
nmlkj
Unique/single site company
nmlkj
Totally different
nmlkj
Significantly different
nmlkj
Moderately different
nmlkj
Significantly similar
nmlkj
Identical
nmlkj

Page 4
Replication survey: Survey 1Replication survey: Survey 1Replication survey: Survey 1Replication survey: Survey 111. Has the main operating company of the site changed in the last 10 years?
12. To what extent did the current operating company change existing business processes (eg Production Procedures, Saftey Processes, Planning etc)?
This is the final page of questions.
1. How tightly is adherence to corporate business processes and procedures controlled by headquarters?
2. How frequently are checks for variations in corporate work processes performed?
3. To what extent do you utilise site specific metrics (as opposed to company specified metrics) to determine performance?
4. Does your company have a formal process for identifying and removing procedures that are obsolete or suboptimum?
*
3. Site practices
*
*
*
*
Yes
nmlkj
No
nmlkj
Extensively
nmlkj
Significantly
nmlkj
Moderately
nmlkj
Not significantly
nmlkj
Not at all
nmlkj
No site adaptation allowed
nmlkj
Some site adaptation allowed
nmlkj
Moderate site adaptation allowed
nmlkj
High level of site adaptation allowed
nmlkj
Extensive site adaptation allowed
nmlkj
Continuously
nmlkj
Monthly
nmlkj
Quarter or six monthly
nmlkj
Annually
nmlkj
Every 2 years
nmlkj
Every 3 years
nmlkj
Every 4 years
nmlkj
Less than every 4 years
nmlkj
Never
nmlkj
Not at all
nmlkj
To some extent
nmlkj
To a moderate extent
nmlkj
To a large extent
nmlkj
Very dependent on site speciific metrics
nmlkj
Yes - controlled by headquarters
nmlkj
Yes - controlled locally
nmlkj
No
nmlkj

Page 5
Replication survey: Survey 1Replication survey: Survey 1Replication survey: Survey 1Replication survey: Survey 15. How were the company best practices and business process captured?
6. Which of the following best describes your organisations deployment of Enterprise Resource Planning (ERP-eg. SAP)?
7. To what extent does your site control the business processes in your ERP system independently from headquarters?
8. Please indicate your site's relative position in the latest Solomon Associates Comparative Performance Analysis, CPA (index).
9. To what extent do you believe the application of the template site practices has resulted in improved site performance?
10. How many of your company's improvements are piloted at a template site before being implemented at local sites?
*
*
*
*
*
*
Developed at a non-production Centre of Excellence
nmlkj
Developed at a production Centre of Excellence (site)
nmlkj
Once-off collaborative effort between sites
nmlkj
Itterative collaborative effort between sites, ie sharing of best practices
nmlkj
Single global instance
nmlkj
Multiple instances on business unit level
nmlkj
Multiple instances per geographical region
nmlkj
Multiple instances on per site level
nmlkj
Multiple instances within sites
nmlkj
We do not use an ERP system
nmlkj
All changes controlled locally
nmlkj
Most changes controlled locally
nmlkj
Some changes controlled locally
nmlkj
No changes controlled locally
nmlkj
We do not use an ERP system
nmlkj
Pace setter
nmlkj
1st quartile
nmlkj
2nd quartile
nmlkj
3rd quartile
nmlkj
4th quartile
nmlkj
Very significantly
nmlkj
Significantly
nmlkj
Moderately
nmlkj
Not significantly
nmlkj
Not at all
nmlkj
Not applicable - no template site
nmlkj
All improvements
nmlkj
Most improvments
nmlkj
Some improvements
nmlkj
Few improvements
nmlkj
None
nmlkj
Not applicable - no template site
nmlkj

Page 6
Replication survey: Survey 1Replication survey: Survey 1Replication survey: Survey 1Replication survey: Survey 111. To what extent do you believe the practices unique to your site positively affect operational performance?
12. How would you rate the success of your companies ability to roll out best practices?
Thank you for taking the time to complete this survey. Should you wish to receive a copy of the final report, please enter your email address below.
The contents of the survey will only be distributed in an aggregate and interpreted format, and the contents of the preceeding questions will not be stored with your contact details.
1. Email details
*
*
4. Contact details
You have completed the survey.
Extremely high
nmlkj
High
nmlkj
Moderate
nmlkj
Low
nmlkj
Very low
nmlkj
Extremely successful
nmlkj
Very successful
nmlkj
Moderately successful
nmlkj
Unsuccessful
nmlkj
Very unsuccessful
nmlkj

II
Appendix 2 – Complete regression results for y1 Robust Multiple Regression Using Huber's Method (C=1.345) Page/Date/Time 1 2008/11/01 08:15:27 PM Database Dependent Y1 Run Summary Section Parameter Value Parameter Value Dependent Variable Y1 Rows Processed 31 Number Ind. Variables 10 Rows Filtered Out 0 Weight Variable None Rows with X's Missing 0 R2 0.4533 Rows with Weight Missing 0 Adj R2 0.1800 Rows with Y Missing 0 Coefficient of Variation 0.2384 Rows Used in Estimation 31 Mean Square Error 2.770068E-02 Sum of Weights 30.897 Square Root of MSE 0.1664352 Completion Status Normal Completion Ave Abs Pct Error 18.211 Descriptive Statistics Section Standard Variable Count Mean Deviation Minimum Maximum Q7 31 0.6217273 0.2058281 0.2166667 1 X1 31 0.664945 0.1690108 0.15 0.97 X10 31 0.5500556 0.1361983 0.2833333 0.85 X2 31 0.6129463 0.199568 0.2 1 X3 31 0.498332 0.4991375 0 1 X4 31 0.4593344 0.346263 0 1 X5 31 0.6071205 0.1232117 0.27 0.95 X6 31 0.3236568 0.2746775 0 1 X8 31 0.4025694 0.300315 0 0.8 X8a 31 0.6258925 0.1436763 0.2 1 Y1 31 0.6980978 0.1837931 0.3 1

Robust Multiple Regression Using Huber's Method (C=1.345) Page/Date/Time 2 2008/11/01 08:15:27 PM Database Dependent Y1 Regression Equation Section Regression Standard T-Value Reject Power Independent Coefficient Error to test Prob H0 at of Test Variable b(i) Sb(i) H0:B(i)=0 Level 5%? at 5% Intercept 0.9935 0.2827 3.515 0.0022 Yes 0.9164 Q7 0.4396 0.2092 2.102 0.0485 Yes 0.5161 X1 -0.3854 0.3230 -1.193 0.2467 No 0.2061 X10 0.0920 0.2575 0.357 0.7245 No 0.0634 X2 -0.3031 0.2886 -1.050 0.3061 No 0.1702 X3 -0.1176 0.1042 -1.128 0.2728 No 0.1890 X4 0.2107 0.2086 1.010 0.3246 No 0.1609 X5 0.0377 0.2738 0.138 0.8918 No 0.0520 X6 0.0907 0.1788 0.507 0.6176 No 0.0771 X8 -0.2079 0.1746 -1.191 0.2477 No 0.2054 X8a -0.2942 0.2510 -1.172 0.2550 No 0.2005 Estimated Model .993539152999632+ .439595027779099*Q7-.385385159044152*X1+ 9.20292205037931E-02*X10-.303068225525569*X2-.117554694755018*X3+ .210677562730758*X4+ 3.77211212019242E-02*X5+ .090687093002767*X6-.207871228638699*X8-.294150561429137*X8a Regression Coefficient Section Independent Regression Standard Lower Upper Standardized Variable Coefficient Error 95% C.L. 95% C.L. Coefficient Intercept 0.9935 0.2827 0.4039 1.5832 0.0000 Q7 0.4396 0.2092 0.0033 0.8759 0.4923 X1 -0.3854 0.3230 -1.0591 0.2883 -0.3544 X10 0.0920 0.2575 -0.4451 0.6292 0.0682 X2 -0.3031 0.2886 -0.9050 0.2989 -0.3291 X3 -0.1176 0.1042 -0.3350 0.0999 -0.3193 X4 0.2107 0.2086 -0.2245 0.6458 0.3969 X5 0.0377 0.2738 -0.5335 0.6090 0.0253 X6 0.0907 0.1788 -0.2824 0.4637 0.1355 X8 -0.2079 0.1746 -0.5720 0.1563 -0.3397 X8a -0.2942 0.2510 -0.8177 0.2294 -0.2299 Note: The T-Value used to calculate these confidence limits was 2.086.

Robust Multiple Regression Using Huber's Method (C=1.345) Page/Date/Time 3 2008/11/01 08:15:27 PM Database Dependent Y1 Robust Regression Coefficients Section Robust Max % Change Robust Robust Robust Robust Iteration in any Beta B(0) B(1) B(2) B(3) 0 100.000 0.9859 0.4393 -0.3767 0.0883 1 13.408 0.9947 0.4396 -0.3867 0.0926 2 1.995 0.9935 0.4396 -0.3853 0.0920 3 0.064 0.9935 0.4396 -0.3854 0.0920 4 0.002 0.9935 0.4396 -0.3854 0.0920 5 0.000 0.9935 0.4396 -0.3854 0.0920 6 0.000 0.9935 0.4396 -0.3854 0.0920 7 0.000 0.9935 0.4396 -0.3854 0.0920 8 0.000 0.9935 0.4396 -0.3854 0.0920 9 0.000 0.9935 0.4396 -0.3854 0.0920 10 0.000 0.9935 0.4396 -0.3854 0.0920 Robust Percentiles of Residuals Section Iter. Max % Change ----------------------- Percentiles of Absolute Residuals ----------------------- No. in any Beta 25th 50th 75th 100th 0 100.000 0.044 0.107 0.165 0.310 1 13.408 0.045 0.108 0.167 0.318 2 1.995 0.045 0.108 0.167 0.317 3 0.064 0.045 0.108 0.167 0.317 4 0.002 0.045 0.108 0.167 0.317 5 0.000 0.045 0.108 0.167 0.317 6 0.000 0.045 0.108 0.167 0.317 7 0.000 0.045 0.108 0.167 0.317 8 0.000 0.045 0.108 0.167 0.317 9 0.000 0.045 0.108 0.167 0.317 10 0.000 0.045 0.108 0.167 0.317 Analysis of Variance Section Sum of Mean Prob Power Source DF R2 Squares Square F-Ratio Level (5%) Intercept 1 15.05733 15.05733 Model 10 0.4533 0.459383 0.0459383 1.658 0.1610 0.5979 Error 20 0.5467 0.5540136 2.770068E-02 Total(Adjusted) 30 1.0000 1.013397 3.377989E-02

Robust Multiple Regression Using Huber's Method (C=1.345) Page/Date/Time 4 2008/11/01 08:15:27 PM Database Dependent Y1 Analysis of Variance Detail Section Model Sum of Mean Prob Power Term DF R2 Squares Square F-Ratio Level (5%) Intercept 1 15.05733 15.05733 Model 10 0.4533 0.459383 0.0459383 1.658 0.1610 0.5979 Q7 1 0.1207 0.1223558 0.1223558 4.417 0.0485 0.5161 X1 1 0.0389 3.944362E-02 3.944362E-02 1.424 0.2467 0.2061 X10 1 0.0035 3.538159E-03 3.538159E-03 0.128 0.7245 0.0634 X2 1 0.0302 3.055535E-02 3.055535E-02 1.103 0.3061 0.1702 X3 1 0.0348 3.522337E-02 3.522337E-02 1.272 0.2728 0.1890 X4 1 0.0279 0.0282535 0.0282535 1.020 0.3246 0.1609 X5 1 0.0005 5.255807E-04 5.255807E-04 0.019 0.8918 0.0520 X6 1 0.0070 7.122589E-03 7.122589E-03 0.257 0.6176 0.0771 X8 1 0.0388 0.039276 0.039276 1.418 0.2477 0.2054 X8a 1 0.0375 0.0380478 0.0380478 1.374 0.2550 0.2005 Error 20 0.5467 0.5540136 2.770068E-02 Total(Adjusted) 30 1.0000 1.013397 3.377989E-02 Bootstrap Section ------------ Estimation Results ------------ | ------------ Bootstrap Confidence Limits ---------------- Parameter Estimate | Conf. Level Lower Upper Intercept Original Value 0.9935 | 0.9000 0.2712 1.8448 Bootstrap Mean 0.9997 | 0.9500 0.1438 2.0753 Bias (BM - OV) 0.0062 | 0.9900 -0.3072 2.7250 Bias Corrected 0.9874 Standard Error 0.4964 B(Q7) Original Value 0.4396 | 0.9000 -0.2139 0.9182 Bootstrap Mean 0.5211 | 0.9500 -0.3945 1.0268 Bias (BM - OV) 0.0815 | 0.9900 -0.8055 1.2831 Bias Corrected 0.3581 Standard Error 0.3595 B(X1) Original Value -0.3854 | 0.9000 -1.3037 0.9550 Bootstrap Mean -0.4824 | 0.9500 -1.4993 1.2257 Bias (BM - OV) -0.0970 | 0.9900 -2.2329 1.7964 Bias Corrected -0.2884 Standard Error 0.6986 B(X10) Original Value 0.0920 | 0.9000 -0.6300 0.9121 Bootstrap Mean 0.0582 | 0.9500 -0.8245 1.0966 Bias (BM - OV) -0.0339 | 0.9900 -1.1541 1.4692 Bias Corrected 0.1259 Standard Error 0.4763 B(X2) Original Value -0.3031 | 0.9000 -1.1787 0.4229 Bootstrap Mean -0.2354 | 0.9500 -1.4083 0.6034 Bias (BM - OV) 0.0677 | 0.9900 -2.0039 1.1580 Bias Corrected -0.3708 Standard Error 0.5038

Robust Multiple Regression Using Huber's Method (C=1.345) Page/Date/Time 5 2008/11/01 08:19:11 PM Database Dependent Y1 Bootstrap Section ------------ Estimation Results ------------ | ------------ Bootstrap Confidence Limits ---------------- Parameter Estimate | Conf. Level Lower Upper B(X3) Original Value -0.1176 | 0.9000 -0.3321 0.2052 Bootstrap Mean -0.1508 | 0.9500 -0.4171 0.2937 Bias (BM - OV) -0.0332 | 0.9900 -0.6608 0.4699 Bias Corrected -0.0843 Standard Error 0.1725 B(X4) Original Value 0.2107 | 0.9000 -0.3145 0.7456 Bootstrap Mean 0.2280 | 0.9500 -0.4355 0.8746 Bias (BM - OV) 0.0174 | 0.9900 -0.7924 1.2309 Bias Corrected 0.1933 Standard Error 0.3336 B(X5) Original Value 0.0377 | 0.9000 -0.8758 0.6785 Bootstrap Mean 0.0775 | 0.9500 -1.1683 0.9361 Bias (BM - OV) 0.0397 | 0.9900 -1.7982 1.4154 Bias Corrected -0.0020 Standard Error 0.4862 B(X6) Original Value 0.0907 | 0.9000 -0.4763 0.5832 Bootstrap Mean 0.0647 | 0.9500 -0.5995 0.6821 Bias (BM - OV) -0.0260 | 0.9900 -0.8693 0.8363 Bias Corrected 0.1167 Standard Error 0.3213 B(X8) Original Value -0.2079 | 0.9000 -0.7960 0.2803 Bootstrap Mean -0.1883 | 0.9500 -0.9283 0.3936 Bias (BM - OV) 0.0196 | 0.9900 -1.3265 0.6891 Bias Corrected -0.2275 Standard Error 0.3425 B(X8a) Original Value -0.2942 | 0.9000 -1.0308 0.4660 Bootstrap Mean -0.3395 | 0.9500 -1.3048 0.6306 Bias (BM - OV) -0.0453 | 0.9900 -2.0267 1.0405 Bias Corrected -0.2488 Standard Error 0.4712 Sampling Method = Observation, Confidence Limit Type = Reflection, Number of Samples = 3000.
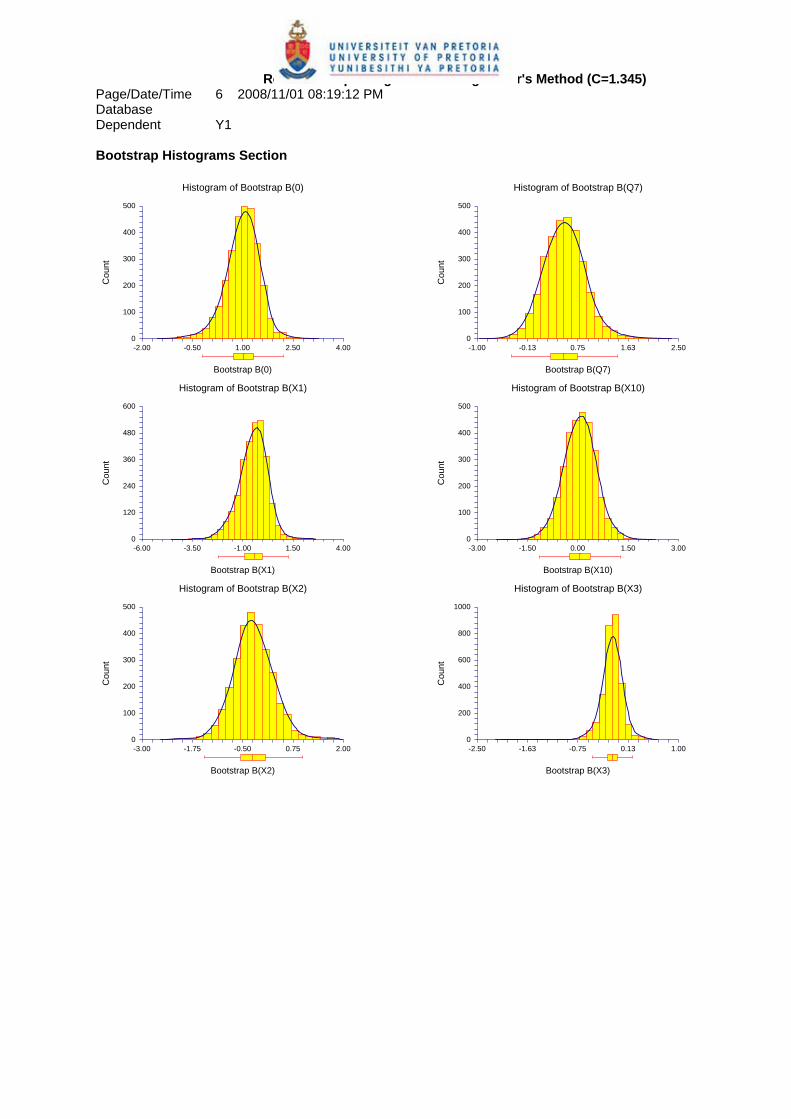
Robust Multiple Regression Using Huber's Method (C=1.345) Page/Date/Time 6 2008/11/01 08:19:12 PM Database Dependent Y1 Bootstrap Histograms Section
0
100
200
300
400
500
-2.00 -0.50 1.00 2.50 4.00
Histogram of Bootstrap B(0)
Bootstrap B(0)
Cou
nt
0
100
200
300
400
500
-1.00 -0.13 0.75 1.63 2.50
Histogram of Bootstrap B(Q7)
Bootstrap B(Q7)
Cou
nt
0
120
240
360
480
600
-6.00 -3.50 -1.00 1.50 4.00
Histogram of Bootstrap B(X1)
Bootstrap B(X1)
Cou
nt
0
100
200
300
400
500
-3.00 -1.50 0.00 1.50 3.00
Histogram of Bootstrap B(X10)
Bootstrap B(X10)
Cou
nt
0
100
200
300
400
500
-3.00 -1.75 -0.50 0.75 2.00
Histogram of Bootstrap B(X2)
Bootstrap B(X2)
Cou
nt
0
200
400
600
800
1000
-2.50 -1.63 -0.75 0.13 1.00
Histogram of Bootstrap B(X3)
Bootstrap B(X3)
Cou
nt
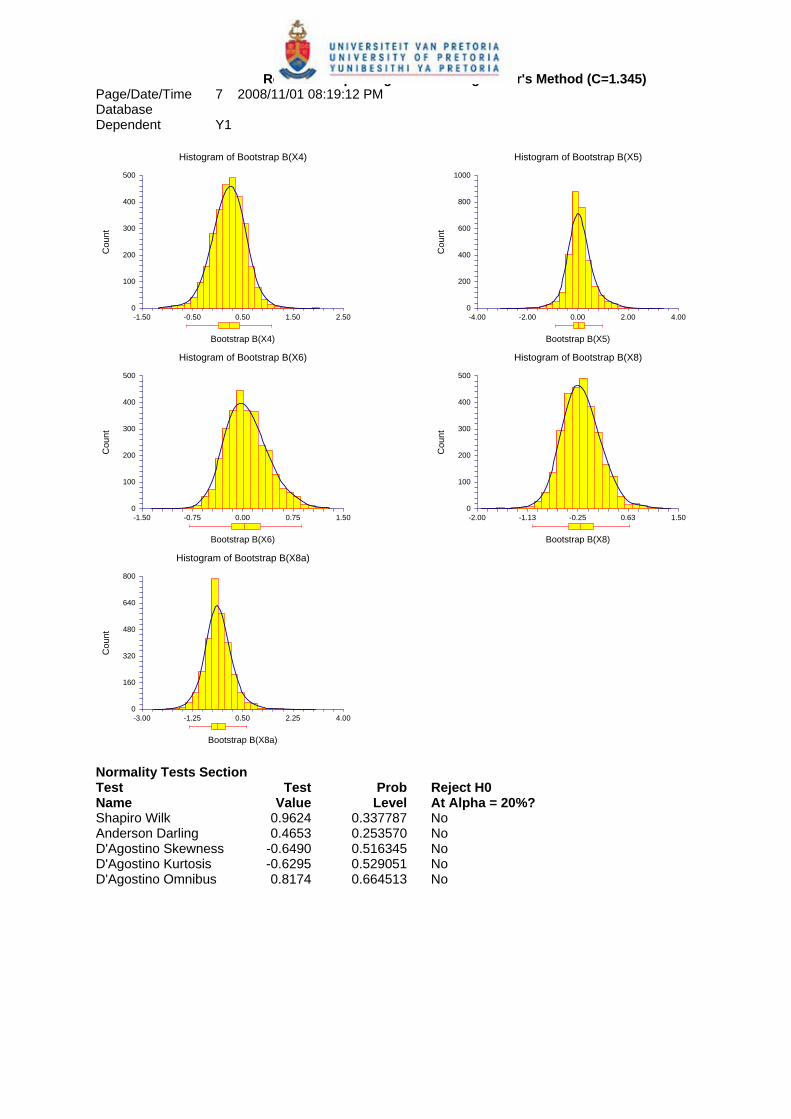
Robust Multiple Regression Using Huber's Method (C=1.345) Page/Date/Time 7 2008/11/01 08:19:12 PM Database Dependent Y1
0
100
200
300
400
500
-1.50 -0.50 0.50 1.50 2.50
Histogram of Bootstrap B(X4)
Bootstrap B(X4)
Cou
nt
0
200
400
600
800
1000
-4.00 -2.00 0.00 2.00 4.00
Histogram of Bootstrap B(X5)
Bootstrap B(X5)
Cou
nt
0
100
200
300
400
500
-1.50 -0.75 0.00 0.75 1.50
Histogram of Bootstrap B(X6)
Bootstrap B(X6)
Cou
nt
0
100
200
300
400
500
-2.00 -1.13 -0.25 0.63 1.50
Histogram of Bootstrap B(X8)
Bootstrap B(X8)
Cou
nt
0
160
320
480
640
800
-3.00 -1.25 0.50 2.25 4.00
Histogram of Bootstrap B(X8a)
Bootstrap B(X8a)
Cou
nt
Normality Tests Section Test Test Prob Reject H0 Name Value Level At Alpha = 20%? Shapiro Wilk 0.9624 0.337787 No Anderson Darling 0.4653 0.253570 No D'Agostino Skewness -0.6490 0.516345 No D'Agostino Kurtosis -0.6295 0.529051 No D'Agostino Omnibus 0.8174 0.664513 No

Robust Multiple Regression Using Huber's Method (C=1.345) Page/Date/Time 8 2008/11/01 08:19:12 PM Database Dependent Y1 Robust Residuals and Weights Absolute Actual Predicted Percent Robust Row Y1 Y1 Residual Error Weight 1 0.400 0.386 0.014 3.414 1.0000 2 1.000 0.840 0.160 15.986 1.0000 3 0.900 0.792 0.108 11.985 1.0000 4 1.000 0.825 0.175 17.522 1.0000 5 0.900 0.969 -0.069 7.674 1.0000 6 0.600 0.787 -0.187 31.117 1.0000 7 0.600 0.833 -0.233 38.765 1.0000 8 0.800 0.665 0.135 16.865 1.0000 9 0.500 0.535 -0.035 6.931 1.0000 10 0.500 0.627 -0.127 25.437 1.0000 11 0.800 0.831 -0.031 3.874 1.0000 12 0.600 0.759 -0.159 26.467 1.0000 13 0.700 0.777 -0.077 10.940 1.0000 14 0.800 0.689 0.111 13.922 1.0000 15 0.400 0.567 -0.167 41.673 1.0000 16 0.700 0.578 0.122 17.455 1.0000 17 0.500 0.538 -0.038 7.666 1.0000 18 0.600 0.663 -0.063 10.503 1.0000 19 0.800 0.589 0.211 26.398 1.0000 20 0.700 0.736 -0.036 5.174 1.0000 21 0.800 0.664 0.136 17.006 1.0000 22 0.500 0.547 -0.047 9.484 1.0000 23 0.800 0.705 0.095 11.818 1.0000 24 0.300 0.617 -0.317 105.621 0.8969 25 0.800 0.802 -0.002 0.295 1.0000 26 0.600 0.645 -0.045 7.443 1.0000 27 0.900 0.820 0.080 8.865 1.0000 28 0.600 0.635 -0.035 5.863 1.0000 29 1.000 0.781 0.219 21.947 1.0000 30 0.700 0.804 -0.104 14.861 1.0000 31 0.800 0.627 0.173 21.569 1.0000

Robust Multiple Regression Using Huber's Method (C=1.345) Page/Date/Time 9 2008/11/01 08:19:12 PM Database Dependent Y1 Predicted Values with Confidence Limits of Means Standard 95% Lower 95% Upper Actual Predicted Error of Conf. Limit Conf. Limit Row Y1 Y1 Predicted of Mean of Mean 1 0.400 0.386 0.146 0.082 0.691 2 1.000 0.840 0.102 0.627 1.053 3 0.900 0.792 0.087 0.611 0.974 4 1.000 0.825 0.078 0.662 0.988 5 0.900 0.969 0.102 0.756 1.182 6 0.600 0.787 0.090 0.599 0.975 7 0.600 0.833 0.117 0.589 1.076 8 0.800 0.665 0.102 0.453 0.877 9 0.500 0.535 0.082 0.364 0.706 10 0.500 0.627 0.110 0.399 0.856 11 0.800 0.831 0.147 0.525 1.137 12 0.600 0.759 0.079 0.595 0.923 13 0.700 0.777 0.084 0.602 0.951 14 0.800 0.689 0.083 0.516 0.861 15 0.400 0.567 0.106 0.346 0.788 16 0.700 0.578 0.117 0.333 0.823 17 0.500 0.538 0.080 0.371 0.706 18 0.600 0.663 0.079 0.499 0.827 19 0.800 0.589 0.108 0.363 0.815 20 0.700 0.736 0.081 0.568 0.904 21 0.800 0.664 0.107 0.440 0.888 22 0.500 0.547 0.120 0.297 0.798 23 0.800 0.705 0.122 0.450 0.961 24 0.300 0.617 0.073 0.465 0.769 25 0.800 0.802 0.101 0.591 1.013 26 0.600 0.645 0.101 0.433 0.856 27 0.900 0.820 0.097 0.617 1.023 28 0.600 0.635 0.073 0.484 0.786 29 1.000 0.781 0.067 0.640 0.921 30 0.700 0.804 0.094 0.609 0.999 31 0.800 0.627 0.077 0.467 0.788

Robust Multiple Regression Using Huber's Method (C=1.345) Page/Date/Time 10 2008/11/01 08:19:12 PM Database Dependent Y1 Residual Report Absolute Sqrt(MSE) Actual Predicted Percent Without Row Y1 Y1 Residual Error This Row 1 0.400 0.386 0.014 3.414 0.171 2 1.000 0.840 0.160 15.986 0.164 3 0.900 0.792 0.108 11.985 0.168 4 1.000 0.825 0.175 17.522 0.165 5 0.900 0.969 -0.069 7.674 0.170 6 0.600 0.787 -0.187 31.117 0.163 7 0.600 0.833 -0.233 38.765 0.153 8 0.800 0.665 0.135 16.865 0.166 9 0.500 0.535 -0.035 6.931 0.171 10 0.500 0.627 -0.127 25.437 0.166 11 0.800 0.831 -0.031 3.874 0.170 12 0.600 0.759 -0.159 26.467 0.166 13 0.700 0.777 -0.077 10.940 0.170 14 0.800 0.689 0.111 13.922 0.168 15 0.400 0.567 -0.167 41.673 0.163 16 0.700 0.578 0.122 17.455 0.166 17 0.500 0.538 -0.038 7.666 0.170 18 0.600 0.663 -0.063 10.503 0.170 19 0.800 0.589 0.211 26.398 0.158 20 0.700 0.736 -0.036 5.174 0.170 21 0.800 0.664 0.136 17.006 0.166 22 0.500 0.547 -0.047 9.484 0.170 23 0.800 0.705 0.095 11.818 0.168 24 0.300 0.617 -0.317 105.621 0.153 25 0.800 0.802 -0.002 0.295 0.171 26 0.600 0.645 -0.045 7.443 0.170 27 0.900 0.820 0.080 8.865 0.169 28 0.600 0.635 -0.035 5.863 0.171 29 1.000 0.781 0.219 21.947 0.162 30 0.700 0.804 -0.104 14.861 0.168 31 0.800 0.627 0.173 21.569 0.165

Robust Multiple Regression Using Huber's Method (C=1.345) Page/Date/Time 11 2008/11/01 08:19:12 PM Database Dependent Y1 Regression Diagnostics Section Standardized Hat Row Residual RStudent Diagonal Cook's D Dffits CovRatio 1 0.1706 0.1664 0.7686 0.0088 0.3032 7.4767 2 1.2168 1.2325 0.3769 0.0814 0.9585 1.2108 3 0.7601 0.7518 0.2731 0.0197 0.4608 1.7518 4 1.1928 1.2063 0.2209 0.0367 0.6424 1.0022 5 -0.5260 -0.5162 0.3775 0.0153 -0.4020 2.4230 6 -1.3344 -1.3627 0.2933 0.0672 -0.8778 0.8920 7 -1.9596 -2.1248 0.4914 0.3373 -2.0886 0.3313 8 1.0234 1.0247 0.3726 0.0565 0.7896 1.5506 9 -0.2393 -0.2336 0.2429 0.0017 -0.1323 2.2500 10 -1.0155 -1.0163 0.4337 0.0718 -0.8894 1.7342 11 -0.3928 -0.3843 0.7753 0.0484 -0.7139 7.1853 12 -1.0822 -1.0871 0.2226 0.0305 -0.5817 1.1645 13 -0.5325 -0.5227 0.2534 0.0087 -0.3045 2.0125 14 0.7713 0.7632 0.2473 0.0178 0.4375 1.6756 15 -1.2981 -1.3221 0.4047 0.1041 -1.0901 1.1216 16 1.0349 1.0368 0.4967 0.0961 1.0300 1.9069 17 -0.2629 -0.2567 0.2327 0.0019 -0.1414 2.2056 18 -0.4298 -0.4208 0.2238 0.0048 -0.2259 2.0452 19 1.6700 1.7547 0.4227 0.1857 1.5015 0.5837 20 -0.2487 -0.2428 0.2342 0.0017 -0.1343 2.2190 21 1.0689 1.0729 0.4152 0.0737 0.9040 1.5740 22 -0.4110 -0.4023 0.5195 0.0166 -0.4183 3.3329 23 0.8390 0.8326 0.5417 0.0756 0.9051 2.5863 24 -2.1184 -2.3103 0.1923 0.0871 -1.1274 0.1838 25 -0.0178 -0.0174 0.3690 0.0000 -0.0133 2.7856 26 -0.3385 -0.3308 0.3715 0.0062 -0.2544 2.6260 27 0.5908 0.5810 0.3418 0.0165 0.4186 2.2006 28 -0.2348 -0.2292 0.1898 0.0012 -0.1109 2.1051 29 1.4418 1.4846 0.1636 0.0370 0.6565 0.6285 30 -0.7563 -0.7479 0.3170 0.0241 -0.5095 1.8706 31 1.1697 1.1812 0.2144 0.0340 0.6171 1.0264 Plots Section
0.0
2.5
5.0
7.5
10.0
-0.4 -0.2 -0.1 0.1 0.3
Histogram of Residuals of Y1
Residuals of Y1
Cou
nt
-0.4
-0.2
-0.1
0.1
0.3
-3.0 -1.5 0.0 1.5 3.0
Normal Probability Plot of Residuals of Y1
Expected Normals
Res
idua
ls o
f Y1

Robust Multiple Regression Using Huber's Method (C=1.345) Page/Date/Time 12 2008/11/01 08:19:12 PM Database Dependent Y1
-0.4
-0.2
-0.1
0.1
0.3
0.0 8.8 17.5 26.3 35.0
Residuals of Y1 vs Row
Row
Res
idua
ls o
f Y1
-0.4
-0.2
-0.1
0.1
0.3
0.2 0.4 0.6 0.8 1.0
Residuals of Y1 vs Q7
Q7
Res
idua
ls o
f Y1
-0.4
-0.2
-0.1
0.1
0.3
0.0 0.3 0.5 0.8 1.0
Residuals of Y1 vs X1
X1
Res
idua
ls o
f Y1
-0.4
-0.2
-0.1
0.1
0.3
0.2 0.4 0.6 0.7 0.9
Residuals of Y1 vs X10
X10
Res
idua
ls o
f Y1
-0.4
-0.2
-0.1
0.1
0.3
0.2 0.4 0.6 0.8 1.0
Residuals of Y1 vs X2
X2
Res
idua
ls o
f Y1
-0.4
-0.2
-0.1
0.1
0.3
0.0 0.3 0.5 0.8 1.0
Residuals of Y1 vs X3
X3
Res
idua
ls o
f Y1

Robust Multiple Regression Using Huber's Method (C=1.345) Page/Date/Time 13 2008/11/01 08:19:12 PM Database Dependent Y1
-0.4
-0.2
-0.1
0.1
0.3
0.0 0.3 0.5 0.8 1.0
Residuals of Y1 vs X4
X4
Res
idua
ls o
f Y1
-0.4
-0.2
-0.1
0.1
0.3
0.2 0.4 0.6 0.8 1.0
Residuals of Y1 vs X5
X5
Res
idua
ls o
f Y1
-0.4
-0.2
-0.1
0.1
0.3
0.0 0.3 0.5 0.8 1.0
Residuals of Y1 vs X6
X6
Res
idua
ls o
f Y1
-0.4
-0.2
-0.1
0.1
0.3
0.0 0.2 0.4 0.6 0.8
Residuals of Y1 vs X8
X8
Res
idua
ls o
f Y1
-0.4
-0.2
-0.1
0.1
0.3
0.2 0.4 0.6 0.8 1.0
Residuals of Y1 vs X8a
X8a
Res
idua
ls o
f Y1

Appendix 3 – Complete regression results for y2 Robust Multiple Regression Using Huber's Method (C=1.345) Page/Date/Time 1 2008/11/01 08:19:12 PM Database Dependent Y2 Run Summary Section Parameter Value Parameter Value Dependent Variable Y2 Rows Processed 31 Number Ind. Variables 10 Rows Filtered Out 0 Weight Variable None Rows with X's Missing 0 R2 0.6361 Rows with Weight Missing 0 Adj R2 0.4541 Rows with Y Missing 0 Coefficient of Variation 0.2108 Rows Used in Estimation 31 Mean Square Error 0.0156805 Sum of Weights 27.982 Square Root of MSE 0.1252218 Completion Status Normal Completion Ave Abs Pct Error 19.151 Descriptive Statistics Section Standard Variable Count Mean Deviation Minimum Maximum Q7 31 0.6112133 0.1972833 0.2166667 1 X1 31 0.6627376 0.1665655 0.15 0.97 X10 31 0.5426248 0.1299677 0.2833333 0.85 X2 31 0.5987173 0.189185 0.2 1 X3 31 0.5021641 0.4789621 0 1 X4 31 0.446523 0.333736 0 1 X5 31 0.6114705 0.1202205 0.27 0.95 X6 31 0.3170029 0.2660373 0 1 X8 31 0.3973076 0.2853476 0 0.8 X8a 31 0.6252089 0.1418096 0.2 1 Y2 31 0.5939626 0.1694816 0.2 1

Robust Multiple Regression Using Huber's Method (C=1.345) Page/Date/Time 2 2008/11/01 08:19:12 PM Database Dependent Y2 Regression Equation Section Regression Standard T-Value Reject Power Independent Coefficient Error to test Prob H0 at of Test Variable b(i) Sb(i) H0:B(i)=0 Level 5%? at 5% Intercept 0.6182 0.2220 2.785 0.0114 Yes 0.7547 Q7 0.4778 0.1810 2.640 0.0157 Yes 0.7095 X1 -0.3887 0.2742 -1.417 0.1717 No 0.2714 X10 0.6197 0.2047 3.027 0.0067 Yes 0.8209 X2 -0.3760 0.2364 -1.591 0.1274 No 0.3283 X3 -0.3262 0.0869 -3.754 0.0012 Yes 0.9461 X4 0.5470 0.1629 3.358 0.0031 Yes 0.8911 X5 0.2153 0.2157 0.998 0.3302 No 0.1582 X6 -0.3466 0.1420 -2.440 0.0241 Yes 0.6412 X8 -0.1280 0.1387 -0.923 0.3670 No 0.1422 X8a -0.3536 0.1920 -1.842 0.0804 No 0.4182 Estimated Model .618157891280308+ .477763184217771*Q7-.38869143293018*X1+ .619678583966632*X10-.376007109798185*X2-.326230471123455*X3+ .547043679702225*X4+ .215267674116516*X5-.34658067735888*X6-.128002123806395*X8-.353632153878581*X8a Regression Coefficient Section Independent Regression Standard Lower Upper Standardized Variable Coefficient Error 95% C.L. 95% C.L. Coefficient Intercept 0.6182 0.2220 0.1551 1.0812 0.0000 Q7 0.4778 0.1810 0.1003 0.8552 0.5561 X1 -0.3887 0.2742 -0.9607 0.1833 -0.3820 X10 0.6197 0.2047 0.1926 1.0467 0.4752 X2 -0.3760 0.2364 -0.8691 0.1171 -0.4197 X3 -0.3262 0.0869 -0.5075 -0.1450 -0.9219 X4 0.5470 0.1629 0.2072 0.8869 1.0772 X5 0.2153 0.2157 -0.2347 0.6652 0.1527 X6 -0.3466 0.1420 -0.6429 -0.0503 -0.5440 X8 -0.1280 0.1387 -0.4173 0.1613 -0.2155 X8a -0.3536 0.1920 -0.7542 0.0469 -0.2959 Note: The T-Value used to calculate these confidence limits was 2.086.

Robust Multiple Regression Using Huber's Method (C=1.345) Page/Date/Time 3 2008/11/01 08:19:12 PM Database Dependent Y2 Robust Regression Coefficients Section Robust Max % Change Robust Robust Robust Robust Iteration in any Beta B(0) B(1) B(2) B(3) 0 100.000 0.7887 0.3233 -0.4543 0.4502 1 188.135 0.7318 0.3959 -0.4282 0.5435 2 70.831 0.6807 0.4335 -0.4121 0.5910 3 12.025 0.6532 0.4508 -0.3987 0.6049 4 13.342 0.6352 0.4613 -0.3898 0.6154 5 4.145 0.6260 0.4684 -0.3865 0.6189 6 2.182 0.6217 0.4724 -0.3861 0.6201 7 0.601 0.6200 0.4748 -0.3869 0.6200 8 0.367 0.6190 0.4763 -0.3877 0.6199 9 0.207 0.6185 0.4772 -0.3883 0.6197 10 0.127 0.6182 0.4777 -0.3887 0.6196 Robust Percentiles of Residuals Section Iter. Max % Change ----------------------- Percentiles of Absolute Residuals ----------------------- No. in any Beta 25th 50th 75th 100th 0 100.000 0.030 0.080 0.167 0.382 1 188.135 0.016 0.069 0.143 0.466 2 70.831 0.020 0.070 0.142 0.495 3 12.025 0.021 0.068 0.134 0.502 4 13.342 0.023 0.068 0.125 0.510 5 4.145 0.023 0.067 0.120 0.514 6 2.182 0.023 0.068 0.117 0.516 7 0.601 0.023 0.068 0.116 0.517 8 0.367 0.023 0.068 0.116 0.517 9 0.207 0.023 0.068 0.116 0.517 10 0.127 0.023 0.068 0.116 0.517 Analysis of Variance Section Sum of Mean Prob Power Source DF R2 Squares Square F-Ratio Level (5%) Intercept 1 9.871952 9.871952 Model 10 0.6361 0.548111 5.481109E-02 3.495 0.0083 0.9358 Error 20 0.3639 0.31361 0.0156805 Total(Adjusted) 30 1.0000 0.8617209 2.872403E-02

Robust Multiple Regression Using Huber's Method (C=1.345) Page/Date/Time 4 2008/11/01 08:19:12 PM Database Dependent Y2 Analysis of Variance Detail Section Model Sum of Mean Prob Power Term DF R2 Squares Square F-Ratio Level (5%) Intercept 1 9.871952 9.871952 Model 10 0.6361 0.548111 5.481109E-02 3.495 0.0083 0.9358 Q7 1 0.1268 0.1093028 0.1093028 6.971 0.0157 0.7095 X1 1 0.0366 0.0315058 0.0315058 2.009 0.1717 0.2714 X10 1 0.1667 0.1436621 0.1436621 9.162 0.0067 0.8209 X2 1 0.0460 3.967503E-02 3.967503E-02 2.530 0.1274 0.3283 X3 1 0.2565 0.2209885 0.2209885 14.093 0.0012 0.9461 X4 1 0.2051 0.1767788 0.1767788 11.274 0.0031 0.8911 X5 1 0.0181 1.561631E-02 1.561631E-02 0.996 0.3302 0.1582 X6 1 0.1083 9.335541E-02 9.335541E-02 5.954 0.0241 0.6412 X8 1 0.0155 1.335917E-02 1.335917E-02 0.852 0.3670 0.1422 X8a 1 0.0617 5.318409E-02 5.318409E-02 3.392 0.0804 0.4182 Error 20 0.3639 0.31361 0.0156805 Total(Adjusted) 30 1.0000 0.8617209 2.872403E-02 Bootstrap Section ------------ Estimation Results ------------ | ------------ Bootstrap Confidence Limits ---------------- Parameter Estimate | Conf. Level Lower Upper Intercept Original Value 0.6182 | 0.9000 -0.3949 1.1121 Bootstrap Mean 0.7865 | 0.9500 -0.6199 1.2441 Bias (BM - OV) 0.1683 | 0.9900 -1.1550 1.6409 Bias Corrected 0.4498 Standard Error 0.4752 B(Q7) Original Value 0.4778 | 0.9000 -0.1108 1.2587 Bootstrap Mean 0.4012 | 0.9500 -0.2314 1.4259 Bias (BM - OV) -0.0766 | 0.9900 -0.7635 1.8128 Bias Corrected 0.5543 Standard Error 0.4301 B(X1) Original Value -0.3887 | 0.9000 -1.3032 0.5186 Bootstrap Mean -0.4696 | 0.9500 -1.5387 0.7156 Bias (BM - OV) -0.0809 | 0.9900 -2.2402 1.3974 Bias Corrected -0.3078 Standard Error 0.5936 B(X10) Original Value 0.6197 | 0.9000 0.2358 1.8239 Bootstrap Mean 0.3651 | 0.9500 0.0697 1.9895 Bias (BM - OV) -0.2546 | 0.9900 -0.3488 2.3265 Bias Corrected 0.8742 Standard Error 0.4948 B(X2) Original Value -0.3760 | 0.9000 -1.3085 0.3142 Bootstrap Mean -0.2779 | 0.9500 -1.4811 0.4814 Bias (BM - OV) 0.0982 | 0.9900 -1.8376 1.0633 Bias Corrected -0.4742 Standard Error 0.5036

Robust Multiple Regression Using Huber's Method (C=1.345) Page/Date/Time 5 2008/11/01 08:22:56 PM Database Dependent Y2 Bootstrap Section ------------ Estimation Results ------------ | ------------ Bootstrap Confidence Limits ---------------- Parameter Estimate | Conf. Level Lower Upper B(X3) Original Value -0.3262 | 0.9000 -0.7087 -0.0872 Bootstrap Mean -0.2517 | 0.9500 -0.7630 -0.0293 Bias (BM - OV) 0.0746 | 0.9900 -0.9211 0.1640 Bias Corrected -0.4008 Standard Error 0.1960 B(X4) Original Value 0.5470 | 0.9000 0.2422 1.4356 Bootstrap Mean 0.3415 | 0.9500 0.1237 1.5615 Bias (BM - OV) -0.2055 | 0.9900 -0.1900 1.9686 Bias Corrected 0.7526 Standard Error 0.3792 B(X5) Original Value 0.2153 | 0.9000 -0.3859 1.4102 Bootstrap Mean 0.0750 | 0.9500 -0.6309 1.8141 Bias (BM - OV) -0.1403 | 0.9900 -1.2691 2.6467 Bias Corrected 0.3555 Standard Error 0.5790 B(X6) Original Value -0.3466 | 0.9000 -0.9173 -0.0598 Bootstrap Mean -0.2267 | 0.9500 -1.0369 0.0249 Bias (BM - OV) 0.1198 | 0.9900 -1.3061 0.2769 Bias Corrected -0.4664 Standard Error 0.2717 B(X8) Original Value -0.1280 | 0.9000 -0.9773 0.0772 Bootstrap Mean 0.0475 | 0.9500 -1.1626 0.1460 Bias (BM - OV) 0.1755 | 0.9900 -1.6143 0.3809 Bias Corrected -0.3035 Standard Error 0.3460 B(X8a) Original Value -0.3536 | 0.9000 -1.3293 0.2179 Bootstrap Mean -0.2837 | 0.9500 -1.6005 0.4134 Bias (BM - OV) 0.0699 | 0.9900 -2.1982 0.8735 Bias Corrected -0.4235 Standard Error 0.4810 Sampling Method = Observation, Confidence Limit Type = Reflection, Number of Samples = 3000.

Robust Multiple Regression Using Huber's Method (C=1.345) Page/Date/Time 6 2008/11/01 08:22:57 PM Database Dependent Y2 Bootstrap Histograms Section
0
160
320
480
640
800
-3.00 -1.25 0.50 2.25 4.00
Histogram of Bootstrap B(0)
Bootstrap B(0)
Cou
nt
0
100
200
300
400
500
-2.00 -0.75 0.50 1.75 3.00
Histogram of Bootstrap B(Q7)
Bootstrap B(Q7)
Cou
nt
0
120
240
360
480
600
-4.00 -2.00 0.00 2.00 4.00
Histogram of Bootstrap B(X1)
Bootstrap B(X1)
Cou
nt
0
100
200
300
400
500
-2.00 -0.75 0.50 1.75 3.00
Histogram of Bootstrap B(X10)
Bootstrap B(X10)
Cou
nt
0
160
320
480
640
800
-6.00 -4.00 -2.00 0.00 2.00
Histogram of Bootstrap B(X2)
Bootstrap B(X2)
Cou
nt
0
100
200
300
400
500
-1.50 -0.88 -0.25 0.38 1.00
Histogram of Bootstrap B(X3)
Bootstrap B(X3)
Cou
nt
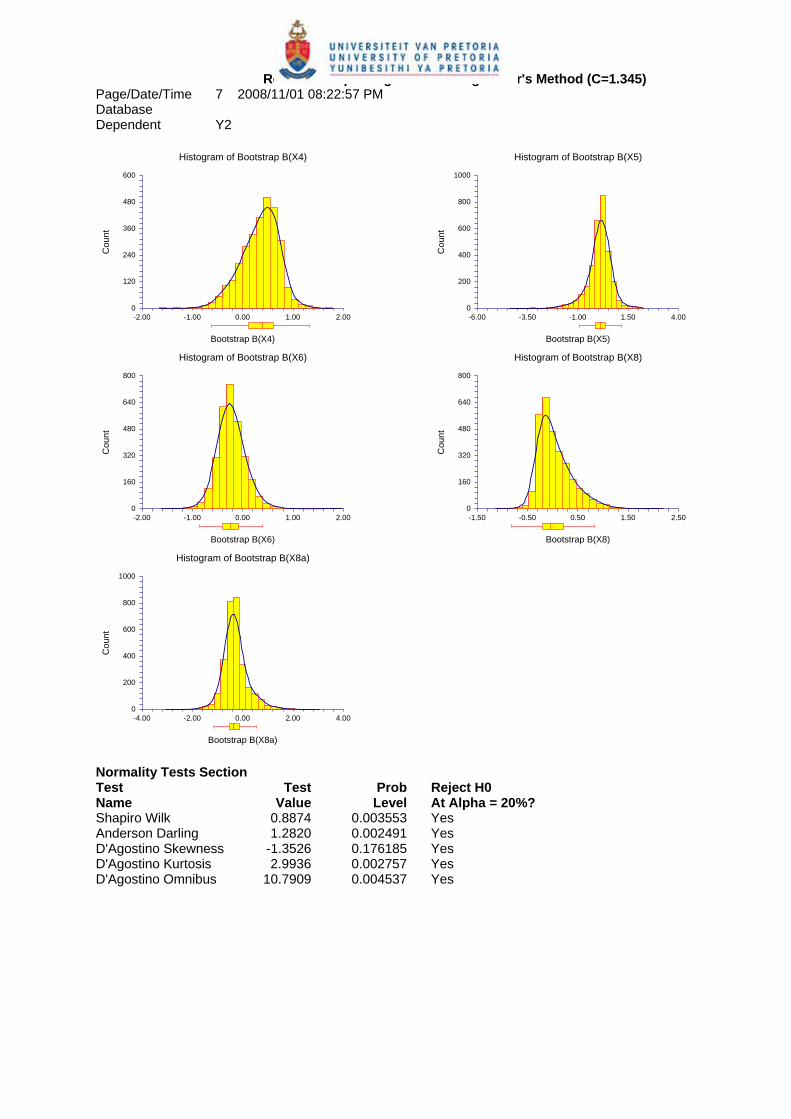
Robust Multiple Regression Using Huber's Method (C=1.345) Page/Date/Time 7 2008/11/01 08:22:57 PM Database Dependent Y2
0
120
240
360
480
600
-2.00 -1.00 0.00 1.00 2.00
Histogram of Bootstrap B(X4)
Bootstrap B(X4)
Cou
nt
0
200
400
600
800
1000
-6.00 -3.50 -1.00 1.50 4.00
Histogram of Bootstrap B(X5)
Bootstrap B(X5)
Cou
nt
0
160
320
480
640
800
-2.00 -1.00 0.00 1.00 2.00
Histogram of Bootstrap B(X6)
Bootstrap B(X6)
Cou
nt
0
160
320
480
640
800
-1.50 -0.50 0.50 1.50 2.50
Histogram of Bootstrap B(X8)
Bootstrap B(X8)
Cou
nt
0
200
400
600
800
1000
-4.00 -2.00 0.00 2.00 4.00
Histogram of Bootstrap B(X8a)
Bootstrap B(X8a)
Cou
nt
Normality Tests Section Test Test Prob Reject H0 Name Value Level At Alpha = 20%? Shapiro Wilk 0.8874 0.003553 Yes Anderson Darling 1.2820 0.002491 Yes D'Agostino Skewness -1.3526 0.176185 Yes D'Agostino Kurtosis 2.9936 0.002757 Yes D'Agostino Omnibus 10.7909 0.004537 Yes

Robust Multiple Regression Using Huber's Method (C=1.345) Page/Date/Time 8 2008/11/01 08:22:57 PM Database Dependent Y2 Robust Residuals and Weights Absolute Actual Predicted Percent Robust Row Y2 Y2 Residual Error Weight 1 0.800 0.730 0.070 8.741 1.0000 2 0.800 0.829 -0.029 3.624 1.0000 3 0.400 0.527 -0.127 31.674 0.9849 4 0.800 0.731 0.069 8.661 1.0000 5 0.800 0.717 0.083 10.371 1.0000 6 0.400 0.917 -0.517 129.353 0.2414 7 1.000 0.725 0.275 27.510 0.4533 8 0.400 0.637 -0.237 59.301 0.5270 9 0.800 0.381 0.419 52.382 0.2981 10 0.200 0.288 -0.088 44.127 1.0000 11 0.800 0.754 0.046 5.795 1.0000 12 0.600 0.675 -0.075 12.569 1.0000 13 0.600 0.595 0.005 0.902 1.0000 14 0.600 0.668 -0.068 11.339 1.0000 15 0.400 0.426 -0.026 6.542 1.0000 16 0.600 0.641 -0.041 6.868 1.0000 17 0.400 0.367 0.033 8.131 1.0000 18 0.600 0.501 0.099 16.489 1.0000 19 0.200 0.316 -0.116 57.802 1.0000 20 0.600 0.602 -0.002 0.281 1.0000 21 0.600 0.526 0.074 12.378 1.0000 22 0.400 0.422 -0.022 5.394 1.0000 23 0.600 0.577 0.023 3.890 1.0000 24 0.600 0.603 -0.003 0.560 1.0000 25 0.600 0.762 -0.162 26.939 0.7738 26 0.600 0.558 0.042 6.927 1.0000 27 0.800 0.768 0.032 3.973 1.0000 28 0.600 0.583 0.017 2.814 1.0000 29 0.800 0.623 0.177 22.154 0.7039 30 0.600 0.617 -0.017 2.893 1.0000 31 0.600 0.580 0.020 3.297 1.0000

Robust Multiple Regression Using Huber's Method (C=1.345) Page/Date/Time 9 2008/11/01 08:22:57 PM Database Dependent Y2 Predicted Values with Confidence Limits of Means Standard 95% Lower 95% Upper Actual Predicted Error of Conf. Limit Conf. Limit Row Y2 Y2 Predicted of Mean of Mean 1 0.800 0.730 0.114 0.493 0.968 2 0.800 0.829 0.079 0.665 0.993 3 0.400 0.527 0.067 0.388 0.666 4 0.800 0.731 0.061 0.603 0.859 5 0.800 0.717 0.079 0.553 0.881 6 0.400 0.917 0.038 0.838 0.997 7 1.000 0.725 0.073 0.573 0.877 8 0.400 0.637 0.066 0.500 0.774 9 0.800 0.381 0.038 0.303 0.459 10 0.200 0.288 0.086 0.108 0.468 11 0.800 0.754 0.113 0.517 0.990 12 0.600 0.675 0.060 0.550 0.801 13 0.600 0.595 0.065 0.458 0.731 14 0.600 0.668 0.064 0.535 0.801 15 0.400 0.426 0.084 0.252 0.601 16 0.600 0.641 0.089 0.456 0.826 17 0.400 0.367 0.065 0.233 0.502 18 0.600 0.501 0.063 0.370 0.632 19 0.200 0.316 0.087 0.135 0.496 20 0.600 0.602 0.062 0.473 0.730 21 0.600 0.526 0.083 0.352 0.699 22 0.400 0.422 0.093 0.228 0.615 23 0.600 0.577 0.095 0.378 0.775 24 0.600 0.603 0.059 0.480 0.727 25 0.600 0.762 0.072 0.611 0.913 26 0.600 0.558 0.081 0.389 0.728 27 0.800 0.768 0.077 0.608 0.929 28 0.600 0.583 0.055 0.469 0.697 29 0.800 0.623 0.045 0.529 0.717 30 0.600 0.617 0.073 0.465 0.770 31 0.600 0.580 0.060 0.455 0.706

Robust Multiple Regression Using Huber's Method (C=1.345) Page/Date/Time 10 2008/11/01 08:22:57 PM Database Dependent Y2 Residual Report Absolute Sqrt(MSE) Actual Predicted Percent Without Row Y2 Y2 Residual Error This Row 1 0.800 0.730 0.070 8.741 0.123 2 0.800 0.829 -0.029 3.624 0.128 3 0.400 0.527 -0.127 31.674 0.124 4 0.800 0.731 0.069 8.661 0.127 5 0.800 0.717 0.083 10.371 0.126 6 0.400 0.917 -0.517 129.353 0.113 7 1.000 0.725 0.275 27.510 0.117 8 0.400 0.637 -0.237 59.301 0.120 9 0.800 0.381 0.419 52.382 0.116 10 0.200 0.288 -0.088 44.127 0.125 11 0.800 0.754 0.046 5.795 0.126 12 0.600 0.675 -0.075 12.569 0.127 13 0.600 0.595 0.005 0.902 0.128 14 0.600 0.668 -0.068 11.339 0.127 15 0.400 0.426 -0.026 6.542 0.128 16 0.600 0.641 -0.041 6.868 0.128 17 0.400 0.367 0.033 8.131 0.128 18 0.600 0.501 0.099 16.489 0.126 19 0.200 0.316 -0.116 57.802 0.123 20 0.600 0.602 -0.002 0.281 0.128 21 0.600 0.526 0.074 12.378 0.126 22 0.400 0.422 -0.022 5.394 0.128 23 0.600 0.577 0.023 3.890 0.128 24 0.600 0.603 -0.003 0.560 0.128 25 0.600 0.762 -0.162 26.939 0.122 26 0.600 0.558 0.042 6.927 0.128 27 0.800 0.768 0.032 3.973 0.128 28 0.600 0.583 0.017 2.814 0.128 29 0.800 0.623 0.177 22.154 0.123 30 0.600 0.617 -0.017 2.893 0.128 31 0.600 0.580 0.020 3.297 0.128
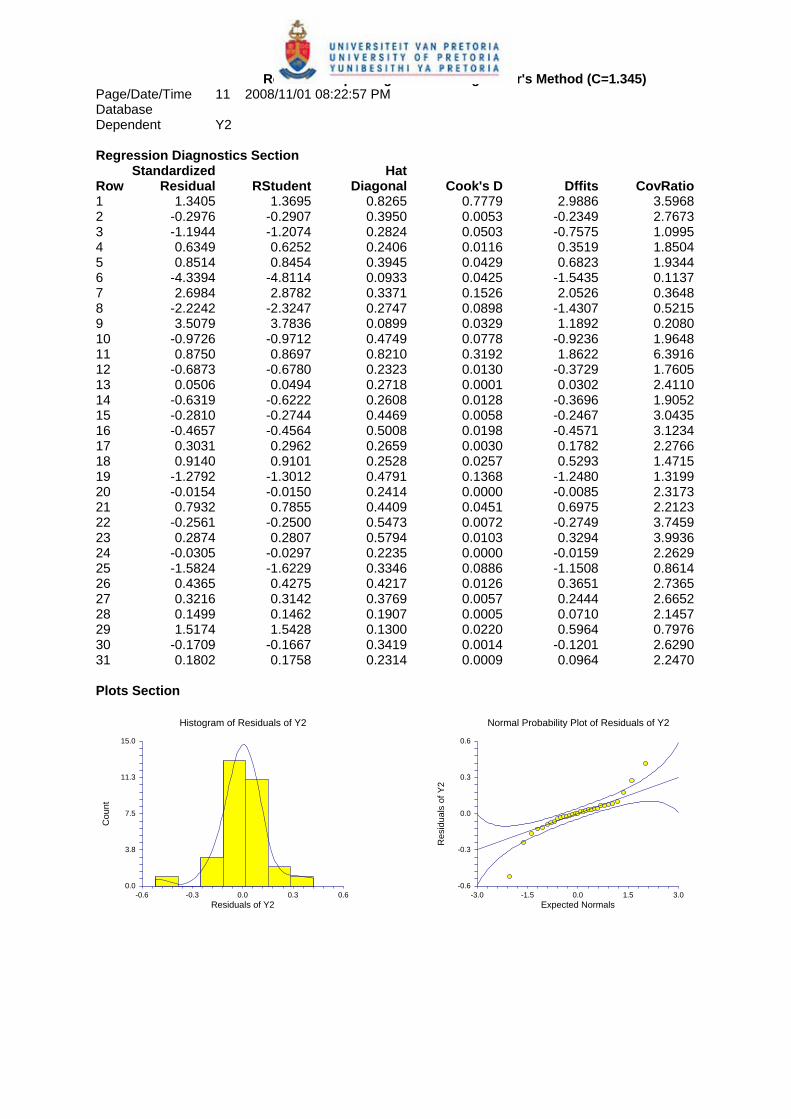
Robust Multiple Regression Using Huber's Method (C=1.345) Page/Date/Time 11 2008/11/01 08:22:57 PM Database Dependent Y2 Regression Diagnostics Section Standardized Hat Row Residual RStudent Diagonal Cook's D Dffits CovRatio 1 1.3405 1.3695 0.8265 0.7779 2.9886 3.5968 2 -0.2976 -0.2907 0.3950 0.0053 -0.2349 2.7673 3 -1.1944 -1.2074 0.2824 0.0503 -0.7575 1.0995 4 0.6349 0.6252 0.2406 0.0116 0.3519 1.8504 5 0.8514 0.8454 0.3945 0.0429 0.6823 1.9344 6 -4.3394 -4.8114 0.0933 0.0425 -1.5435 0.1137 7 2.6984 2.8782 0.3371 0.1526 2.0526 0.3648 8 -2.2242 -2.3247 0.2747 0.0898 -1.4307 0.5215 9 3.5079 3.7836 0.0899 0.0329 1.1892 0.2080 10 -0.9726 -0.9712 0.4749 0.0778 -0.9236 1.9648 11 0.8750 0.8697 0.8210 0.3192 1.8622 6.3916 12 -0.6873 -0.6780 0.2323 0.0130 -0.3729 1.7605 13 0.0506 0.0494 0.2718 0.0001 0.0302 2.4110 14 -0.6319 -0.6222 0.2608 0.0128 -0.3696 1.9052 15 -0.2810 -0.2744 0.4469 0.0058 -0.2467 3.0435 16 -0.4657 -0.4564 0.5008 0.0198 -0.4571 3.1234 17 0.3031 0.2962 0.2659 0.0030 0.1782 2.2766 18 0.9140 0.9101 0.2528 0.0257 0.5293 1.4715 19 -1.2792 -1.3012 0.4791 0.1368 -1.2480 1.3199 20 -0.0154 -0.0150 0.2414 0.0000 -0.0085 2.3173 21 0.7932 0.7855 0.4409 0.0451 0.6975 2.2123 22 -0.2561 -0.2500 0.5473 0.0072 -0.2749 3.7459 23 0.2874 0.2807 0.5794 0.0103 0.3294 3.9936 24 -0.0305 -0.0297 0.2235 0.0000 -0.0159 2.2629 25 -1.5824 -1.6229 0.3346 0.0886 -1.1508 0.8614 26 0.4365 0.4275 0.4217 0.0126 0.3651 2.7365 27 0.3216 0.3142 0.3769 0.0057 0.2444 2.6652 28 0.1499 0.1462 0.1907 0.0005 0.0710 2.1457 29 1.5174 1.5428 0.1300 0.0220 0.5964 0.7976 30 -0.1709 -0.1667 0.3419 0.0014 -0.1201 2.6290 31 0.1802 0.1758 0.2314 0.0009 0.0964 2.2470 Plots Section
0.0
3.8
7.5
11.3
15.0
-0.6 -0.3 0.0 0.3 0.6
Histogram of Residuals of Y2
Residuals of Y2
Cou
nt
-0.6
-0.3
0.0
0.3
0.6
-3.0 -1.5 0.0 1.5 3.0
Normal Probability Plot of Residuals of Y2
Expected Normals
Res
idua
ls o
f Y2

Robust Multiple Regression Using Huber's Method (C=1.345) Page/Date/Time 12 2008/11/01 08:22:57 PM Database Dependent Y2
-0.6
-0.3
0.0
0.3
0.6
0.0 8.8 17.5 26.3 35.0
Residuals of Y2 vs Row
Row
Res
idua
ls o
f Y2
-0.6
-0.3
0.0
0.3
0.6
0.2 0.4 0.6 0.8 1.0
Residuals of Y2 vs Q7
Q7
Res
idua
ls o
f Y2
-0.6
-0.3
0.0
0.3
0.6
0.0 0.3 0.5 0.8 1.0
Residuals of Y2 vs X1
X1
Res
idua
ls o
f Y2
-0.6
-0.3
0.0
0.3
0.6
0.2 0.4 0.6 0.7 0.9
Residuals of Y2 vs X10
X10
Res
idua
ls o
f Y2
-0.6
-0.3
0.0
0.3
0.6
0.2 0.4 0.6 0.8 1.0
Residuals of Y2 vs X2
X2
Res
idua
ls o
f Y2
-0.6
-0.3
0.0
0.3
0.6
0.0 0.3 0.5 0.8 1.0
Residuals of Y2 vs X3
X3
Res
idua
ls o
f Y2

Robust Multiple Regression Using Huber's Method (C=1.345) Page/Date/Time 13 2008/11/01 08:22:57 PM Database Dependent Y2
-0.6
-0.3
0.0
0.3
0.6
0.0 0.3 0.5 0.8 1.0
Residuals of Y2 vs X4
X4
Res
idua
ls o
f Y2
-0.6
-0.3
0.0
0.3
0.6
0.2 0.4 0.6 0.8 1.0
Residuals of Y2 vs X5
X5
Res
idua
ls o
f Y2
-0.6
-0.3
0.0
0.3
0.6
0.0 0.3 0.5 0.8 1.0
Residuals of Y2 vs X6
X6
Res
idua
ls o
f Y2
-0.6
-0.3
0.0
0.3
0.6
0.0 0.2 0.4 0.6 0.8
Residuals of Y2 vs X8
X8
Res
idua
ls o
f Y2
-0.6
-0.3
0.0
0.3
0.6
0.2 0.4 0.6 0.8 1.0
Residuals of Y2 vs X8a
X8a
Res
idua
ls o
f Y2