replicating the rwandan success story: an evaluation of
TRANSCRIPT

Journal of Alternative Perspectives in the Social Sciences (2018) Volume 9 No 3,303-315
303
Replicating the Rwandan Success Story: An Evaluation of Millennium Development Goal 3 and Strategies for Achieving Sustainable Development Goal 5 in Nigeria
Emeka C. Iloh (PhD), African Heritage Institution, Enugu, Nigeria Queeneth Ekeocha, African Heritage Institution, Enugu, Nigeria Anthony C. Ugwu (PhD), Department of Political Science, Federal University, Lafia
Abstract: This paper evaluates the extent to which Nigeria achieved Goal 3 of the Millennium
Development Goals (gender parity in the political process) between 1999 and 2015 and drawing from the
Rwandan success story, suggests strategies for the achievement of this parity (as contained in Goal 5 of the
Sustainable Development Goals) from 2015 to 2030. It also examined other countries that recorded success
in this area under the MDG regime. Relying mainly on qualitative method and documentary evidence,
predicated on the social dominance theory, the paper posits that the age-long patriarchal system in Nigeria
sustains and reinforces the structural exclusion of women from electoral politics, hence the country’s failure
to achieve MDG 3. This patriarchal system ensures that there is no parity between the sexes in the political
process. This is despite the fact that women constitute more than 50% of the population but yet, comprise
less than 10% of Nigeria’s legislature. This paper, therefore, submits that for Nigeria to achieve the 2030
Agenda on gender parity in the political process, it should move beyond mere policy rehearsals and
advocacy and take concrete steps such as instituting a quota system in its electoral laws, as Rwanda has
done. Where necessary, tables were used for more elucidation.
Keywords: Gender equality, Millennium Development Goals, quota system, Sustainable Development
Goals, women representation.
1. Introduction
Millennium Development Goals (MDGs) are the eight international development goals that were
established following the Millennium Summit of the United Nations in 2000. The Summit was the largest
gathering of world leaders as at the time it was held, between September 6th and September 8th, 2000, at the
United Nations headquarters in New York, United States. The purpose of the summit was to discuss the role
of the United Nations at the turn of the 21st century. At the meeting, world leaders ratified the United Nations
Millennium Declaration, from which the MDGs were derived (Global Policy Forum, 2006). All the 189
United Nations member states at that time and at least 23 international organizations committed to help
achieve the MDGs by 2015. The eight goals that form the MDGs include: eradication of extreme poverty
and hunger; achievement of universal primary education; promotion of gender equality and empowering
women; reduction of child mortality; improvement of maternal health; combating of HIV/AIDS, malaria
and other diseases; ensuring environmental sustainability; and developing a global partnership for
development. These eight goals were supported by 18 quantified and time-bound targets and 48 indicators.
The goals focus on the efforts of the world community on achieving significant, measurable improvements

Emeka C. Iloh (PhD), Queeneth Ekeocha, & Anthony C. Ugwu (PhD)
304
in peoples’ lives by the year 2015. They established targets and yardsticks for measuring results – not just
for developing countries but for the rich countries that help to fund development programmes, and for the
multilateral institutions that help countries implement them.
The target set for the achievement of the MDGs was 2015. For this reason, a further process was,
therefore, needed to sustain development goals beyond 2015. Thus, on September 25th, 2015, the 193
member states of the United Nations General Assembly again adopted the 2030 Development Agenda titled
‘Transforming Our World: The 2030 Agenda for Sustainable Development’, otherwise known as the
Sustainable Development Goals (SDGs). The SDGs are an intergovernmental set of aspirations with 17
goals and 169 targets. The goals are contained in Paragraph 54 of the United Nations Resolution A/RES/70/1
of 25th September, 2015 (United Nations, 2015a). The Resolution is a broader intergovernmental agreement
that, while acting as the Post-2015 Development Agenda (successor to the MDGs), builds on the Principles
agreed upon under Resolution A/RES/66/288, popularly known as ‘The Future We Want’ (United Nations,
2012).
Earlier on July 19th, 2014, the UN General Assembly’s Open Working Group (OWG) on Sustainable
Development Goals had forwarded a proposal for the SDGs to the Assembly. The proposal covered a broad
range of sustainable development issues. On December 5th, 2014, the UN General Assembly accepted the
Secretary General’s Synthesis Report which stated that the agenda for the Post-2015 SDGs process would
be based on the OWG proposals (United Nations, 2014). The intergovernmental negotiations on the Post-
2015 Development Agenda began in January 2015 and ended in August 2015. Following the negotiations,
a final document was adopted at the United Nations Sustainable Development Summit, from September
25th to 27th, 2015, in New York, United States (UNDP, 2015).
Goal 3 of the MDGs and Goal 5 of the SDGs are concerned with achieving gender equality. Empowering
women and promoting gender equality, especially in the political process, has been a long time agitation by
the female gender. Conferences have been held on this, resulting in decisions and resolutions that aim to
achieve gender parity. Governments have also been urged to use the quota system to ensure that a certain
percentage of appointed and electable positions are reserved for women. Many advocacy groups have also
championed this cause at several fora. It is, therefore, little wonder that when the UN General Assembly
adopted the MDGs in September 2000, Goal 3 was dedicated to promoting gender equality and empowering
women. Among other targets, national governments were encouraged to ensure that the proportion of seats
held by women in national parliaments equalled that of men by 2015, when the MDGs were expected to
have been achieved. While many countries made tremendous progress in this regard, others, including
Nigeria, lagged behind.
SDGs aim to build on these achievements by ensuring that there is an end to the discrimination against
women in all aspects of life. Most importantly, it aims to bridge the disparity in the proportion of seats held
by both sexes in national parliaments, where it still exists, and sustain the parity, where it has been achieved.
Consequently, Goal 5 was dedicated to achieving gender equality and empowering all women and girls. The
goal is aimed at sustaining the progress made in the past fifteen years under the MDGs regime, as well as
encouraging countries that are yet to launch themselves into the global trend to do so.

Replicating the Rwandan Success Story: An Evaluation of Millennium Development Goal 3 and Strategies for
Achieving Sustainable Development Goal 5 in Nigeria
305
Although MDG3 and SDG5 are concerned with promoting/achieving gender equality and empowering
women and girls generally, this paper deals with the aspects of the goals that are dedicated to promoting
gender parity in the legislature for both sexes. The paper, therefore, evaluates the extent to which Nigeria
achieved MDG3 (gender parity in the political process) between 2000 and 2015 and suggests strategies for
achieving SDG5, based on the Rwandan model. It submits that for Nigeria to achieve the 2030 Agenda on
gender parity in the political process, it should move beyond mere policy rehearsals and advocacy and take
concrete steps such as instituting a quota system in its electoral laws.
Theoretical Perspective
This study is anchored on the Social Dominance Theory. It is a theory of inter-group relations that
focuses on the maintenance and stability of group-based social hierarchies. According to the theory, group-
based inequalities are maintained through three primary inter-group behaviours – institutional
discrimination, aggregated individual discrimination, and behavioural asymmetry. The theory proposes that
widely shared cultural ideologies, that is, legitimizing myths, provide the moral and intellectual justification
for these intergroup behaviours. The theory was first formulated by Sidanius and Pratto (1999) in their book,
Social Dominance: An Intergroup Theory of Social Hierarchy and Oppression.
The theory begins with the observation that human social groups tend to be organized according to
group-based social hierarchies in societies. These hierarchies have a trimorphic (3-form) structure based on
(1) age (adults have more power and higher status than children); (2) gender (men have more power and
higher status than women); and (3) arbitrary-set, which are group-based hierarchies that are culturally
defined and do not necessarily exist in all societies. However, this study is interested in the gender-based
hierarchy.
It proceeds from the understanding that human social hierarchies consist of a hegemonic group at the
top and negative reference groups at the bottom. More powerful social/political roles are increasingly likely
to be occupied by a hegemonic group member (for example, an older male). Males are more dominant than
females, and they possess more political power (the iron law of andrarchy), meaning that most high-status
positions are held by males.
The key propositions of the social dominance theory include:
1.Individuals are stratified by age, sex, and group. Group identification is based on ethnicity, religion,
nationality etc.
2.Human social hierarchy consists of a hegemonic group at the top and negative reference groups at the
bottom.
3.As role gets more powerful, the probability it is occupied by a hegemonic group increases (Law of
increasing proportion).
4.Racism, sexism, nationalism and classism are all manifestations of this same principle of social
hierarchy.

Emeka C. Iloh (PhD), Queeneth Ekeocha, & Anthony C. Ugwu (PhD)
306
Consistent with this theory, the Nigerian political system is stratified into different group-based social
hierarchies, gender-based social hierarchy being one of them. As a patriarchal society, males are more
dominant than females in Nigeria, and they have higher social dominance orientation. They, therefore,
endorse hierarchy-enhancing ideologies which contribute to greater levels of group-based inequality,
relegating females to the background. Through the system of patriarchy, obstacles have been placed on the
path of the women who aspire to positions of authority or try to compete with the male opposite for power.
Men generally have greater power than women in both the public and private spheres, and to maintain this
power, they create boundaries and obstacles for women, thus making it harder for females to have equal
access to power.
Social dominance theory, therefore, explains the reason Nigeria is not making progress in attaining
political parity between both sexes. Women in Nigeria are still regarded as second class citizens, and as
such, should be playing second fiddle roles. In some parts of the country, women who venture into politics
are seen as cultural deviants. Where they are not frowned at, there is no genuine effort to encourage them
by their male counterparts. In addition, the political system itself is skewed against them. For instance, major
decision-making organs of most political parties in Nigeria are mostly populated by males, leaving the
females to their statutory positions of women leaders. In such cases, they normally do not have a ‘voice’
when major decisions regarding sharing of political offices are taken. In line with the theory, therefore, as
long as patriarchy is entrenched in the Nigerian political system, and as long as men have high levels of
social dominance orientation, it will be difficult to achieve gender equality in the Nigerian political system,
without constitutional guarantee for it. This is why government’s effort at addressing this anomaly is at best,
cosmetic, because there is no genuine commitment on the part of government, or the political system, to put
in place structures and institutions that will ensure this equality is achieved, as has been done in some other
countries that have achieved parity.
2. Nigeria and MDG 3: An Evaluation
Nigeria’s latest democratic journey started in 1999, a year before the introduction of the MDGs. The
level of participation of women in politics in Nigeria before that period has been documented in earlier
studies (see Iloh and Alumona, 2009; Edeh and Iloh, 2011). Therefore, this section analyzes the level of
female representation in Nigeria’s national parliament – The National Assembly – between 1999 and 2015,
with a view to finding out the extent to which the country achieved that aspect of Goal 3 of the MDGs.
Nigeria has held five general elections between 1999 and 2015: 1999, 2003, 2007, 2011, and 2015. Each
of these elections included elections into the National Assembly, which has two chambers – The Senate and
the House of Representatives. Constitutionally, each of the 36 federating states is expected to elect and send
three senators to the Senate, with one senator coming from Abuja, the federal capital, thereby bringing the
total number of senators to 109. On the other hand, there are 360 members of the House of Representatives
unevenly distributed among the 36 federating states and the federal capital, based on population.
However, unlike in Rwanda where there is a constitutionally-guaranteed quota system in favour of
women, these 469 seats in Nigeria’s National Assembly are thrown open to be competed for by both sexes
on equal basis. In other words, there is no special consideration, or structures put in place in Nigeria’s
electoral laws, to ensure a minimum percentage of female representation in politics generally, and in the
National Assembly in particular. The only bias in favour of women in Nigerian politics is the tendency of
Replicating the Rwandan Success Story: An Evaluation of Millennium Development Goal 3 and Strategies for
Achieving Sustainable Development Goal 5 in Nigeria
307
most political parties to issue nomination forms at no cost to female contestants under their political
platforms (Iloh & Alumona, 2009; Edeh & Iloh, 2011). However, even this is not guaranteed as there is no
law backing it.
The point being made here is that women who have been elected into Nigeria’s National Assembly did
so, on the strength of their political prowess, not as a beneficiary of any constitutional quota system, or any
other structure put in place to advance or ensure a fair representation of the female gender in the Assembly.
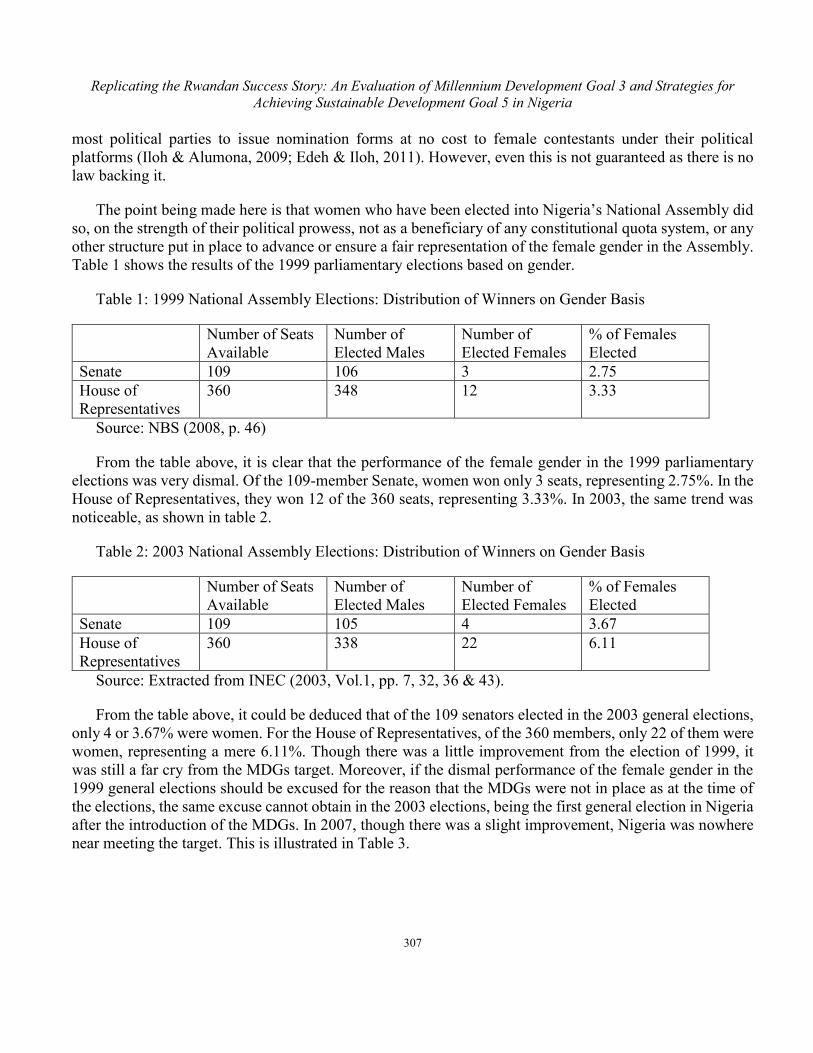
Table 1 shows the results of the 1999 parliamentary elections based on gender.
Table 1: 1999 National Assembly Elections: Distribution of Winners on Gender Basis
Number of Seats
Available
Number of
Elected Males
Number of
Elected Females
% of Females
Elected
Senate 109 106 3 2.75
House of
Representatives
360 348 12 3.33
Source: NBS (2008, p. 46)
From the table above, it is clear that the performance of the female gender in the 1999 parliamentary
elections was very dismal. Of the 109-member Senate, women won only 3 seats, representing 2.75%. In the
House of Representatives, they won 12 of the 360 seats, representing 3.33%. In 2003, the same trend was
noticeable, as shown in table 2.
Table 2: 2003 National Assembly Elections: Distribution of Winners on Gender Basis
Number of Seats
Available
Number of
Elected Males
Number of
Elected Females
% of Females
Elected
Senate 109 105 4 3.67
House of
Representatives
360 338 22 6.11
Source: Extracted from INEC (2003, Vol.1, pp. 7, 32, 36 & 43).
From the table above, it could be deduced that of the 109 senators elected in the 2003 general elections,
only 4 or 3.67% were women. For the House of Representatives, of the 360 members, only 22 of them were
women, representing a mere 6.11%. Though there was a little improvement from the election of 1999, it
was still a far cry from the MDGs target. Moreover, if the dismal performance of the female gender in the
1999 general elections should be excused for the reason that the MDGs were not in place as at the time of
the elections, the same excuse cannot obtain in the 2003 elections, being the first general election in Nigeria
after the introduction of the MDGs. In 2007, though there was a slight improvement, Nigeria was nowhere
near meeting the target. This is illustrated in Table 3.

Emeka C. Iloh (PhD), Queeneth Ekeocha, & Anthony C. Ugwu (PhD)
308
Table 3: 2007 National Assembly Elections: Distribution of Winners on Gender Basis
Number of Seats
Available
Number of Males
Elected
Number of
Females Elected
% of Females
Elected
Senate 109 100 9 8.26
House of
Representatives
360 334 26 7.22
Source: Extracted from INEC (2007, pp. 33-39)
In 2007, the number of women elected into the Senate increased from 4 to 9, representing 4.59%
increase. For the House of Representatives, the number increased from 22 in 2003 to 26 in 2007,
representing a paltry 1.11%. Table 4 depicts that of 2011 Elections.
Table 4: 2011 National Assembly Elections: Distribution of Winners on Gender Basis
Number of Seats
Available
Number of Males
Elected
Number of
Females Elected
% of Females
Elected
Senate 109 101 8 7.34
House of
Representatives
360 338 22 6.11
Source: INEC (2011: Annex X111(d)
From the table above, it is obvious that the little progress achieved in 2007 was reversed in the 2011
general elections. Female representation in the Senate dropped from 9 to 8, representing 0.92% decrease. It
was the same for the House of Representatives which also dropped from 26 in 2007 to 22 in 2011,
representing 1.11% decrease.
Table 5: 2015 National Assembly Elections: Distribution of Winners on Gender Basis
Number of Seats
Available
Number of Males
Elected
Number of
Females Elected
% of Females
Elected
Senate 109 103 6 5.50
House of
Representatives
360 345 15 4.17
Source: INEC (2015, pp. 209-212)
In the 2015 general elections, female representation in the National Assembly further depreciated. In
the Senate, the number of women senators dropped further from 8 to 6, representing 1.84% decrease. In the
House of Representatives, the number also dropped further from 22 to 15, representing 1.94% decrease.
2015 was the year set by the United Nations for all countries to achieve the MDGs, Goal 3 inclusive. At
the end of the 15-year MDGs period, women occupied only 21 of the 469 seats in Nigeria’s National
Assembly. This is a mere 4.47%, a far cry from the 50% target set by Goal 3 of the MDGs. Therefore,
Nigeria did not achieve this aspect of Goal 3 of the Millennium Development Goals.

Replicating the Rwandan Success Story: An Evaluation of Millennium Development Goal 3 and Strategies for
Achieving Sustainable Development Goal 5 in Nigeria
309
Tables 6 and 7 depict the summary of the number and percentage of female representation both in the
Senate and House of Representatives from 1999 to 2015.
Table 6: Distribution of Seats in the Senate by Gender, 1999-2015
Years
1999 2003 2007 2011 2015
No. % No. % No. % No. % No. %
Male 106 97.25 105 96.33 100 91.74 101 92.66 103 94.50
Female 3 2.75 4 3.67 9 8.26 8 7.34 6 5.50
Total 109 100 109 100 109 100 109 100 109 100
Source: Developed by the researchers with data from Tables 1-5
Table 7: Distribution of Seats in the House of Representatives by Gender, 1999-2015
Years
1999 2003 2007 2011 2015
No. % No. % No. % No. % No. %
Male 348 96.67 338 93.89 334 92.78 338 93.89 345 95.83
Female 12 3.33 22 6.11 26 7.22 22 6.11 15 4.17
Total 360 100 360 100 360 100 360 100 360 100
Source: Developed by the researchers with data from Tables 1-5
MDGs and Gender Equality in Political Processes: A Global Perspective
The Millennium Development Goals Report 2015 states that women have gained ground in
parliamentary representation in nearly 90% of the 174 countries with data over the past two decades. The
average proportion of women in parliament has nearly doubled during the same period. Yet, only one in
five members is a woman (United Nations, 2015b). The Report also notes that despite continuous progress,
the world still has a long way to go towards equal gender representation in public decision-making.
According to the Report, in the developed regions of the world, as at 2000, proportion of seats held by
women in single or lower houses of national parliaments was 16%. By 2015, it has increased to 26%. For
developing regions, it was 12% in 2000 and 21% in 2015. Globally, it was 14% in 2000 and 22% in 2015.
These are captured in Table 8.
Table 8: Proportion of Seats held by Women in Single or Lower Houses of National Parliament across
Regions (%)
Regions 2000 2015
Oceania 3.6 4.4
Western Asia 4 12
Southern Asia 7 18
South-Eastern Asia 12 18

Emeka C. Iloh (PhD), Queeneth Ekeocha, & Anthony C. Ugwu (PhD)
310
Caucasus and Central Asia 7 18
Eastern Asia 20 22
Sub-Saharan Africa 13 23
Northern Africa 4 25
Latin America and the Caribbean 15 27
All Developed Regions 16 26
Source: Extracted from The Millennium Development Goals Report (2015, p. 31)
From the table above, it is evident that tremendous progress was made across regions in the share of
seats held by women in national parliaments between 2000 and 2015, though parity remains a distant goal.
At the beginning of the millennium in 2000 when MDGs came into effect, countries in Oceania had 3.6%
of women representation in national parliaments, but by 2015, it had increased to 4.4%. For Western Asian
countries, it was 4% in 2000, and by 2015, it had increased to 12%. In Southern Asia, the share of seats
occupied by women in national parliaments was 7% in 2000, but in 2015, it was 18%. In South-Eastern
Asia, it was 12% in 2000 and 18% in 2015. For the Caucasus and Central Asia, the proportion of women in
national parliaments was 7% in 2000, and by 2015, it had risen to 18%. In Eastern Asia, it was 20% in 2000
and 22% in 2015. Coming home to Sub-Saharan Africa, it was 13% in 2000, and 23% in 2015. However,
the highest progress was recorded in Northern Africa which had 4% in 2000, and by 2015, it had increased
to 25%. This is remarkable given the fact that North Africa is a major part of the Arab and Islamic world
where constraints to women involvement in public life are prevalent, owing to the Islamic faith. For Latin
America and the Caribbean, it was 15% in 2000 and 27% in 2015.
Though the statistics above indicate that there has been huge progress over the fifteen-year period, Goal
3 of the MDGs was far from being achieved. According to The Millennium Development Goals Report
2015, since 1995, when the Beijing Platform for Action on women’s empowerment was adopted, the global
average proportion of women in parliament has nearly doubled, growing from 11% in 1995 to 22% in
January 2015 (United Nations, 2015b). The Report further states that the number of single or lower houses
of parliament where women occupy more than 30% of the seats has increased from 5 to 42, while those
with more than 40% have jumped from 1 to 13. In January 2015, there were four countries with more than
50% of parliamentary seats held by women, and in Rwanda, women hold more than 60% of such posts.
However, The World Bank data differ slightly as it holds that only Rwanda (64%) and Bolivia (53%) have
more than 50% women representation in national parliaments by 2015 (The World Bank, 2015). The MDGs
Report further notes that by 1995, Europe dominated the top 10 spots in world rankings of women in
parliament. But as of January 2015, 4 of the 10 countries are in Sub-Saharan Africa, while Latin America,
Europe and North America shared the remaining 6 in the top 10. The number of male-only parliaments has
also dropped from 10 to 5. Table 9 shows the top ten countries with the highest number of women in national
parliaments.
Table 9: Top 10 Countries with the Highest Percentage of Women in National Parliaments by 2015
S/N Country Region % of Women
1 Rwanda Sub-Saharan Africa 64
2 Bolivia Latin America and the Caribbean 53
3 Cuba Latin America and the Caribbean 49

Replicating the Rwandan Success Story: An Evaluation of Millennium Development Goal 3 and Strategies for
Achieving Sustainable Development Goal 5 in Nigeria
311
4 Seychelles Sub-Saharan Africa 44
5 Sweden Europe 44
6 Senegal Sub-Saharan Africa 43
7 Ecuador Latin America and the Caribbean 42
8 Finland Europe 42
9 Mexico North America 42
10 South Africa Sub-Saharan Africa 42
Source: Extracted from World Bank (2015, p. 1)
From the foregoing analyses, it is very clear that globally, a lot of changes had occurred within the
fifteen-year MDGs period. The Rwandan experience is particularly novel.
3. Rwanda’s Experience with Female Representation in Parliament: Lessons for Nigeria
In Rwanda, which has the highest percentage of women representation in national parliaments globally,
women participation in politics has always been taken seriously. As early as 1961 when the country got her
independence from Belgium, Rwandan women were fully enfranchised and were granted the right to stand
for elections. In fact, the first female parliamentarian in Rwanda began serving in 1965 (Powley, 2005).
Moreover, before the civil war in the early 1990s and the genocide in 1994, Rwanda had achieved up to
18% of women representation in parliament. Between 1994 and 2003, during the nine-year period of post-
genocide transitional government, women’s representation in parliament (by appointment) reached 25.7%.
But it was the first post-genocide parliamentary elections of October 2003 that saw women achieve nearly
50% representation (Powley, 2005). For the factors responsible for this rise, Powley (2005) noted that it
was a result of the adoption of a new gender-sensitive constitution which enabled a constitutional guarantee,
a quota system, innovative electoral structures, and the activities of the organized women’s movements.
A female member of the Rwandan parliament has argued that women in Rwanda do not just restrict
themselves to the quota allocated to them, but make extra efforts to surpass it. According to her:
In Rwanda, 24 of the 80 seats in the Chamber of Deputies are reserved for women. The quota system is
just a push, the rest comes naturally…We have made female representation in parliament a political priority
and we put in place systems to ensure we achieved gender equality…. Today, you wouldn’t find a single
Rwandan – man or woman – who disputes that the influence and leadership of women has been essential to
Rwanda’s social and economic progress. The proof of this is in the overwhelming public election of women
to our parliament. Our constitutional quota only provides that 24 of the 80 seats in the Chamber of Deputies
be reserved for women, but the electorate has consistently voted for more women (Kantengwa, 2013, pp. 1-
4).
So in Rwanda, the consciousness has been there. Though the introduction of the MDGs in 2000 helped
to propel this, the Rwandan society long before 2000 had taken necessary measures to ensure that gender
equality in the political process was achieved.

Emeka C. Iloh (PhD), Queeneth Ekeocha, & Anthony C. Ugwu (PhD)
312
As noted above, historical trajectories played key and significant roles in Rwanda’s female political
breakthrough. Key female military officers and women organizations played an influential role in the post-
genocide government. In the aftermath of the genocide, women’s associations regrouped with their diasporic
communities which had fled the country during the conflict. These women’s associations played an active
role in the reintegration of these people. Grabham (2016) noted that 70 percent of the population of post-
genocidal Rwanda was women and the Rwandan Patriotic Front led by General Paul Kagame identified that
these women would have a huge say on how the country would recover. It was at this point that women
began to have a voice in Rwandan politics which led to their designing of policies that explicitly created
opportunities for women. These opportunities were constitutionalized in 2003 as civil rights of women.
In addition, the Rwandan government acknowledged women as a ‘social category’ and recognized
gender inequality as a social and development issue which led to the formulation of laws designed to expand
women’s autonomy. Thus, the legal quota system that both appoints and supports high-level female officials
for participation was implemented by the Rwandan government as a mechanism for women political
representation. The dividends of these actions warranted an African Gender Award to the President (Paul
Kagame) in 2007 and an International Women Parliament Award for the country in 2013. Hence, Rwanda
is lauded as a world leader in women’s political participation with international accolades for the past two
decades. The Rwanda’s Chamber of Deputies is one of only two chambers worldwide in which women
outnumber men. Rwanda leads the global field with 64%, compared with a global average of 23%. Since,
2013, women occupy 61.3% (Chamber of Deputies) and 38.5% (Senate) respectively (Turianskyi & Chisiza,
2017). But before the genocide in 1994, the Rwandan women had never had more than 18 seats in the
parliaments.
4. Achieving SDG 5 in Nigeria: Going the Rwandan Way
It is obvious that Nigeria failed to achieve Goal 3 of the MDGs. This is largely because of lack of
commitment by the political elite to go beyond mere rhetoric to foster and implement concrete plans towards
achieving gender parity in politics, especially in parliamentary representation. In order to ensure that gender
equality is achieved under the SDGs regime, the introduction of the quota system in Nigeria’s constitution
and electoral laws is inevitable. Dahlerup (2005) has noted that quotas increase and safeguard women’s
presence in parliaments and are now being introduced all over the world. Nigeria cannot be left out. In
parliamentary representation, quotas for women entail that women must constitute a certain number or
percentage of the members of the parliament. They are aimed at increasing women’s representation in the
legislature, backed by law. According to Dahlerup (2005, p. 141):
Gender quotas draw legitimacy from the discourse of exclusion, according to which the main reasons
for women’s under-representation are the exclusionary practices of the political parties and the political
institutions at large. Quotas place the burden of candidate recruitment not on the individual woman, but on
those who control the recruitment process, first and foremost the political parties. Quotas force those who
nominate and select to start recruiting women and give women a chance which they do not have today in
most parts of the world.
Dahlerup distinguished between two most common types of electoral gender quotas: candidate quotas
and reserved seats. Candidate quotas specify the minimum percentage of candidates for election that must
be women, and apply to political parties’ lists of candidates for election. In most cases, such quotas are laid
Replicating the Rwandan Success Story: An Evaluation of Millennium Development Goal 3 and Strategies for
Achieving Sustainable Development Goal 5 in Nigeria
313
down in the constitution, in electoral laws, or in political party laws. This kind of quota forces all political
parties to recruit the required percentage of women. On the other hand, reserved seats set aside a certain
number of seats for women among representatives in a legislature, specified either in the constitution or by
legislation. This is the kind of quota in use in Uganda where 56 seats are reserved for women in the country’s
legislature; in Rwanda where 30% of the parliamentary seats are reserved for women according to the
constitution (though the number elected has always surpassed this percentage); and in Tanzania where 20%
of the seats are reserved for women and allocated to the political parties in proportion to the number of
parliamentary seats won in an election. Nigeria can learn from these experiences.
It is this quota system, as observed above, that Rwanda introduced to ensure that parity was achieved in
electoral politics, especially in parliament. The institutionalization of women politics in Rwanda was
guaranteed by the 2003 Rwanda’s constitution. The text of the constitution declares that women should
occupy 30% of all governmental ‘decision-making bodies’ positions while the Chamber of Deputies has 24
reserved seats for women. Women in Rwanda have since surpassed this constitutionally-guaranteed quota.
Aside constitutional guarantee, women groups in Rwanda are not relenting in their agitation for more
political inclusion of the female gender. Thus, institutional mechanisms have been vital for the advancement
of women in Rwanda including the National Women’s Council, Gender Monitoring Office and Rwanda
Women’s Parliamentary Forum (FFRP). These organizations are tasked with the responsibility of ensuring
that women’s interests are represented in the constitution at the national level.
Instead of moving from one policy framework to other, what Nigeria needs to do is to borrow a leaf
from Rwanda and enact quota laws that shall guarantee a certain percentage of seats to the female gender.
No amount of advocacies and conferences can achieve this without concrete actions. Even the United
Nations admits that progress has been better in countries that established quota systems through legislation
than where the proportion of women depended on voluntary decisions by political parties, and was much
worse in countries that had no quota policy (Igbuzor, 2008).
In Latin America and the Caribbean countries, for instance, affirmative measures (quota laws), which
are designed to foster greater equality in the distribution of elective and representative positions have been
implemented since 1991. Since that year, fourteen countries in the region enacted these kinds of laws to
promote greater women’s participation in legislative bodies. Most of these countries in Latin America
reserved between 20% and 40% of the seats in parliament to women, and in some cases, more than that
percentage are elected. In Europe, countries like France, Belgium, Macedonia, Bosnia and Herzegovina etc
allocated between 30% and 50% of their parliamentary seats to women using the quota system. In Africa
also, apart from Rwanda, countries such as Tanzania, Uganda and Eritrea allocated between 20% and 30%
to women, as noted above. As in the case of Rwanda, the quota system is only the needed push, as women
in parliament constitute more than 50% of the Chamber of Deputies. This trend makes it clear that the
progress achieved has not been the result of countries implementing the abstract indicator defined in the
context of the MDGs, or by mere policy formulation, but has been mainly due to the efforts of women’s
movements to have regulatory frameworks set up that are geared towards promoting equity in political
representation through quota systems. Though these laws have not always been a guarantee that gender
equality in the political process will be achieved, nevertheless, they constitute the first step in the struggle
to establish parity.

Emeka C. Iloh (PhD), Queeneth Ekeocha, & Anthony C. Ugwu (PhD)
314
In the light of experiences and progress across the regions and countries of the world that use the quota
system, especially in Rwanda, it is evident that there is need for a paradigm shift in order to achieve political
equality between men and women in Nigeria, and that paradigm shift is quota system. This is the surest way
to achieve Goal 5 of the 2030 Agenda: the Sustainable Development Goals.
5. Conclusion
The study evaluated the extent of the country’s achievement of Goal 3 of the MDGs and mapped out
strategies for achieving SDG5, using the quota system as was done in Rwanda. Specifically, the study
examined how other countries that have made tremendous progress towards achieving gender equality in
political processes were able to get to where they are. It also assessed the parliamentary elections conducted
in Nigeria between 1999 and 2015 (the era of the MDGs), and found out that Nigeria was no where near the
achievement of Goal 3 of the MDGs.
Using the social dominance theory as the theoretical framework, the study submited that the major
obstacle to active women participation in Nigeria is the patriarchal system that is fully entrenched in the
society. Women are still seen as second class citizens, and as such, they should play second fiddle roles.
The study, therefore, noted that mere advocacies and conferences are not enough to achieve parity for both
sexes in the political process. The solution requires a more concrete action. It, therefore, proposed that the
quota system, which should guarantee a certain number or percentage of seats in the National Assembly for
the female gender, should be introduced into Nigeria’s electoral laws. Rwanda and other countries that have
made progress in achieving gender parity in political processes adopted this mechanism.
References
Dahlerup, D. (2005). Increasing women’s political representation: New trends in gender quotas, in
International Institute for Democracy and Electoral Assistance (International IDEA) Women in
parliament: Beyond numbers. Stockholm: International IDEA. Retrieved from
www.idea.int/publications/wip2/upload/4._Increasing_Women’s_Political_Representation.pdf.
Edeh, H.C., & Iloh, E.C. (2011). women and electoral politics in Nigeria: The Obasanjo years, 1999-2007,
in T. Wuam et al (Eds.) Obasanjo second era: 1999 – 2007. Abuja, Nigeria: Aboki Publishers.
Ejumudo, K.B.O. (2013). Gender equality and women empowerment in Nigeria: The desirability and
inevitability of a pragmatic approach. Developing Country Studies, 3(4), 59-66.
Global Policy Forum (2006). The millennium summit and its follow-up. Retrieved from
www.globalpolicy.org/un-reform/un-reform-initiatives/millennium-summit-and-its-followup-9-2.html.
Grabham, J. (2016). A mokoro seminar. Retrieved from http://mokoro.co.uk/impact-rwandan-womens-
political-leadership-democracy-development-rwanda/.
Igbuzor, O. (2008). Promoting gender equality for sustainable development using the national gender policy.
Retrieved from www.gamji.com/article6000/NEWS7860.htm.
Iloh, E.C., & Alumona, I.M. (2009). Electoral process and gender discrimination in Nigeria: A case study
of 2003 and 2007 general elections. Journal of Sustainable Development in Africa, 10(4), 113-128.
Independent National Electoral Commission (INEC) (2015). 2015 general elections report. Abuja, Nigeria:
INEC.
Replicating the Rwandan Success Story: An Evaluation of Millennium Development Goal 3 and Strategies for
Achieving Sustainable Development Goal 5 in Nigeria
315
Independent National Electoral Commission (2011). Report on the 2011 general elections. Abuja, Nigeria:
INEC.
Independent National Electoral Commission (2007). Preliminary results of the 2007 general elections.
Abuja, Nigeria: INEC.
Independent National Electoral Commission (2003). Compendium of results of the 2003 general elections,
Vol.1: Presidential and national assembly elections. Abuja, Nigeria: INEC.
Kantengwa, J. (2013). Why Rwanda has the most female politicians in the world. Retrieved from
www.leftfootforward.org/2013/09/rwanda-has-the-most-female-politicians.
National Bureau of Statistics (NBS) (2008). Statistical report on women and men in Nigeria, volume one.
Abuja, Nigeria. NBS.
Powley, E. (2005). Rwanda: Women hold up half the parliament, in International Institute for Democracy
and Electoral Assistance (International IDEA), Women in parliament: beyond numbers. Stockholm:
International IDEA. Retrieved from www.idea.int/publications/wip2/upload/Rwanda.pdf.
Sidanius, J., & Pratto, F. (1999). Social dominance: An intergroup theory of social hierarchy and
oppression. Cambridge: Cambridge University Press.
The World Bank (2015). Proportion of seats held by women in national parliaments (%). Retrieved from
www.data-worldbank.org/indicator/SG.GEN.PARL.ZS.
Turianskyi, Y. & Chisiza, M. (2017). Lessons from Rwanda: Female political representation and women’s
rights. South African Institute of International Affairs (SAIIA) Occasional paper 253, March 2017.
United Nations (2015a). Transforming our world: The 2030 agenda for sustainable development. Resolution
adopted by the General Assembly on 25th September, 2015. Retrieved from
www.un.org/ga/search/view_doc.asp?symbol=A/RES/70/11&Lang=E.
United Nations (2015b). Millennium development goals report 2015. New York: United Nations.
United Nations (2014). The road to dignity 2030: Ending poverty, transforming all lives and protecting the
planet. Synthesis report of the Secretary-General on the post-2015 sustainable development agenda.
Retrieved from www.daccess-ods.un.org/TMP/9771885.27584076.html.
United Nations (2012). The future we want. Resolution adopted by the General Assembly on 27th July,
2012. Retrieved from www.un.org/ga/search/view_doc.asp?symbol=A/RES/66/288&Lang=E.
United Nations Development Programme (UNDP) (2015). World leaders adopt sustainable development
goals. Retrieved from
www.undp.org/content/undp/en/home/presscenter/pressreleases/2015/09/24/undp-welcomes-adoption-
of-sustainable-development-goals-by-world-leaders.html