replacers in the production of reduced fat washed
TRANSCRIPT

Page 1/21
Evaluation of ultra�ltrated dairy by-products as fatreplacers in the production of reduced fat washedcurd cheeseAna Raquel Borges
Polytechnic of CoimbraArona Figueiroa Pires
Polytechnic of CoimbraNatalí Garcia Marnotes
Polytechnic of CoimbraDavid Gama Gomes
Polytechnic of CoimbraMarta Fernandes Henriques
Polytechnic of CoimbraCarlos Dias Pereira ( [email protected] )
Instituto Politecnico de Coimbra https://orcid.org/0000-0003-1705-2301
Research
Keywords: Whey, Buttermilk, Second cheese whey, Ultra�ltration, Reduced-fat cheese
Posted Date: April 14th, 2020
DOI: https://doi.org/10.21203/rs.3.rs-19081/v1
License: This work is licensed under a Creative Commons Attribution 4.0 International License. Read Full License

Page 2/21
AbstractIn the present study different dairy by-products were used as ingredients in the production of reduced-fat(RF) washed curd cheeses. Whey, buttermilk and sheep’s second cheese whey, previously concentrated yultra�ltration (UF), were used envisaging the improvement of texture and �avour of the RF cheeses. UFconcentration, is a technique that can be easily available to small scale dairy plants, allowing for therecovery of those dairy by-products. Conventional full-fat (FF) cheeses presented more than 45% fat (d/b)while RF cheeses presented values in the range 20-30%, being in most cases classi�ed as low-fat cheesesaccording to national standards. The ratio protein in dry matter/fat in dry matter was lower than 1 in FFcheeses and in the range 1.8-2.7 in RF cheeses. The paste of FF cheeses presented a more pronouncedyellow colour at the 60th and 90th days of ripening, indicating that fat plays a major role regarding thisparameter. The different by-products showed different performances when added to milk used in theproduction of cheeses. After the 60th day of ripening, FF cheeses and RF cheeses with added buttermilkpresented lower values for the hardness of the paste (5.0-7.5 N) when compared to the remainingcheeses. At the end of ripening, chewiness of the paste was also signi�cantly lower in these cheeses. RFcheeses with 5% incorporation of UF concentrated buttermilk presented the best results both concerningtexture and sensory evaluation. This fact can be related to the speci�c composition of buttermilk, namelyto its richness in phospholipids.
IntroductionCharacteristics of reduced-fat (RF) and low-fat cheeses (LF)
The �rm texture observed in RF and LF cheeses is one of the major problems resulting from fat reduction(Rogers et al. 2009). Cheese structure can be described as a continuous protein network interrupted bydispersed fat globules which originate weak points in the protein network. As reported by Zalazar et al.(2002) and McCarthy et al. (2016), in RF/LF cheeses the para-casein network becomes denser, originatingthe development of a �rm and rubbery texture that does not break down during mastication.
Fat also plays an important role in the development of �avour and appearance of cheese. Banks (2004),indicates that the loss of �avour in RF/LF cheeses results from the lack of precursors from the fat, thelack of fat as a solvent for �avour compounds, or to differences in the physical structure of RF/LFcheeses that inhibit certain enzymatic reactions which are essential for the formation of �avourcompounds. Drake et al. 2010, report that �avour differences observed between FF and RF Cheddarcheeses are not solely due to differences in the cheese matrix and �avour release, but also to differencesin ripening biochemistry, which lead to an imbalance of many �avour-contributing compounds.
Despite the signi�cant advances in understanding the biochemical and physicochemical characteristicsof RF and LF cheeses and the introduction of technological developments, there is still a need to evaluatesolutions with the potential to improve the �avour, texture and sensory properties such cheeses.
Strategies to improve the characteristics of RF/LF cheeses

Page 3/21
The general approaches that have been used to improve RF or LF cheese texture involve decreasingprotein concentration, promoting greater hydrolysis of proteins, or creating a bigger �ller phase in order tolimit the density of the para-casein network (Rogers et al. 2010). These strategies can be divided in threecategories: (i) manipulation of process parameters to enhance moisture level; (ii) starter culture selectionand use of adjunct cultures (i.e. non-starter lactic acid bacteria); (iii) use of stabilizers and fat mimetics toimprove cheese texture (Mistry 2001).
The process parameters can be modi�ed in order to increase water retention in the curd, which in�uencestexture properties. This can be achieved by using lower coagulation temperatures, by increasing curdgrain size, by lowering curd scalding temperatures or by increasing the surface area of fat globulesthrough milk homogenization (Banks 2004; Mayta-Hancco et al. 2019).
The use of exopolysaccharide (EPS) producing starter cultures can also improve the texturalcharacteristics of LF cheeses by changing the microstructure and proteolysis (Di Cagno et al. 2014) andhas the potential to improve the �avour (Oluk et al. 2014a,b).
The use of fat replacers, alone or in combination with the manipulation of process parameters, is perhapsthe most promising alternative to improve the sensory properties of RF/LF cheeses. These ingredients arewater-soluble compounds used to replace the functional characteristics of fat. They improve texture andyield (Koca & Metin 2004), as well as the sensory and functional properties, by binding water and byproviding a sense of lubricity and creaminess. Polysaccharides (PS) and whey proteins (WP) are the fatreplacers most commonly used.
Lashkari & Khosrowshahi (2014), tested the effects of incorporating guar and arabic gums in milk withvarious fat contents on the chemical and rheological properties of Iranian white cheese. Diamantino et al.2014 report that waxy maize starch used as a fat replacer increased the moisture content and the waterholding capacity, improving the overall quality of RF cheeses. Wydrych et al. (2015), report that partialreplacement of milk fat with inulin increased meltability, density, cohesiveness and viscosity, while itdecreased hardness and adhesiveness of acid casein processed cheeses. Wang et al. (2016) indicate thatthe addition of carrageenans improved the textural and rheological properties of LF cheeses byincreasing moisture in non-fat substance (MNFS). Palatnik & Herrera (2017) compared cheesescontaining agave fructans with FF and RF samples without fructans and demonstrated the texturing roleof the carbohydrates. Dai et al. (2018), report that konjac glucomanan ca be a potential fat replacer to beused in Mozzarella. Sharma Kanal et al. (2018) report that the addition of alginate signi�cantly improvedthe textural, microstructural and colour properties of LF Cheddar cheeses. Li et al. (2019), tested waxy ricestarch, sodium carboxymethyl cellulose (CMC) and glutamine transaminase (TG) as texturizers andcrosslinking agents in Mozzarella.
Native WP can be aggregated to obtain colloidal microparticulated whey protein (MWP). MWP is formedby mixtures of native whey proteins and protein aggregates. These particles can be manufactured indiameters ranging from 0.1 to 100 µm (Torres et al. 2016; Zhang et al. 2016). Their ability to enhance

Page 4/21
creaminess is based on a “ball bearing mechanism” originally reported by Cheftel & Dumay (1993) andcon�rmed by Liu et al. (2016).
According to Henriques et al. (2018), several aspects have to be considered when using WP asingredients in cheese production: (i) the importance of WP denaturation, which allows for theircontribution to the protein matrix of the cheese; (ii) the increased water-holding capacity of cheese curds;(iii) the lower acidi�cation of the cheeses as a result of the higher buffering capacity of WP; (iv) theoccurrence of differences in �avour of the modi�ed products, which tend to be more pronounced overripening.
When using WP as a fat replacer in cheese it is recommended a low ratio of native/denatured WP toensure its function as inert �ller. Hinrichs (2001) reports that particle size should be in the range 1-10 µmin order to avoid disturbance of the para-casein network. However, other authors refer that higher particlesizes (20-100 µm) do not impart negative effects to cheese properties, namely taste, �avour orconsistency (Frusch & Kokx 2008; Giroux et al. 2018).
Whey proteins and MWP are commercially available as powders. However, small and medium-scalecheese plants can concentrate whey by ultra�ltration and, after appropriate treatments, use the liquidwhey concentrates in cheese production. The same methodology can be applied to other dairy by-products, envisaging their in-plant valorization.
In the present work, three liquid by-products of the dairy industry, namely buttermilk, whey and secondcheese whey (the whey resulting from the production of whey cheese), all previously concentrated byultra�ltration (UF), were tested as ingredients in the production of experimental RF/LF cheeses.
Materials And MethodsThree types of reduced-fat cheese with different dairy by-products as ingredients were compared withconventional full-fat cheese (FF) and reduced-fat cheese (RF). The tested fat replacers were, buttermilk(CB), whey (CW) and sheep´s second cheese whey (CS). Second cheese whey or Sorelho is the by-productresulting from the manufacture of Requeijão, the Portuguese whey cheese. All the by-products werepreviously concentrated by ultra�ltration (UF) with a volumetric concentration factor of ca. 15(VCF=VFeed/VRetentate). The �ve cheese products were coded as: i) conventional full-fat cheese (FF); ii)reduced-fat cheese (RF); iii) reduced-fat cheese with concentrated buttermilk (RF+CB); iv) reduced-fatcheese with concentrated whey (RF+CW) and; v) reduced-fat cheese with concentrated sheep’s secondcheese whey (RF+CS).
UF concentrates were obtained using the procedure reported by Henriques et al. (2013) with smalladjustments, namely the ultra�ltration process temperature (40-45 ºC) and the smaller membrane cut-off(10 kDa). In the case of CW, after concentration, the retentate was submitted to thermal denaturation (90ºC for 20 min) prior to homogenization at 10 MPa, in a homogenizer Rannie™ model Blue Top (Denmark),being kept frozen (-25 ºC) until the moment of use. Buttermilk and Sorelho were concentrated by UF using

Page 5/21
the same conditions and pasteurized at 75 ºC for 5 min, being kept frozen at -25 ºC prior to theirincorporation into the milk.
The bovine milk (Quinta da Cioga, Portugal) was delivered to the dairy pilot plant at Escola SuperiorAgrária de Coimbra (ESAC). Part of the milk was skimmed in a Westfalia™ type ADB centrifuge (Germany)and standardised to 3.5% (v/v) of fat (for the production of FF cheese) and to 1.5% (v/v) of fat (for theproduction of reduced-fat cheeses). At this stage, according to the different batches to be produced, thefat replacers (5% v/v) were added. Each batch was made up of 40 L.
Milk pasteurization took place at 74±1 °C for 30 s in Pasilac Therm™ (France) plate and frame heatexchanger. After temperature stabilization (29.5±0.5 °C), 0.2 mL.L-1 CaCl2 solution (51% w/v) (supplied by
Tecnilac, Portugal), starter culture (Mesó�lo Plus Starter, Enzilab, Portugal) (10 mg.L-1, containingLactococcus lactis subsp. lactis, Lactococcus lactis subsp. cremoris and Streptococcus thermophilus),KNO3 (25 mg.L-1) and 20 mg.L-1 animal rennet (> 92 g/100 g chimosin, supplied by Tecnilac, Portugal)were added to the milk formulations and mixed thoroughly. The coagulation of the mixtures wasperformed for approximately 45 min at 30±1 ºC. When coagulation was completed, grids were used to cutthe curd into small pieces (2 cm3), in order to promote whey drainage. After drainage of half of the whey,the same amount of salted hot water (1% w/v salt, 30 ºC) was added to the curd and the mixture wasthoroughly agitated prior to the �nal whey drainage. The recovered curd was then moulded into plasticmoulds before being pressed and stored in a refrigerated chamber at 8-9 ºC, for 24 h. After this period,cheeses, weighing approximately 250 g were immersed in a brine solution (18-20 ºBaumé) for 1.5 h and�nally transferred to the ripening chamber (10±2 ºC) being kept there for 90 days.
The chemical composition of cheeses, colour, texture, pH and titratable acidity were assessed on the 1st,30th, 60th and 90th days of ripening. Each physicochemical parameter was evaluated in triplicate.
Cheese moisture was determined by drying the cheese sample in an oven at 105 ºC for 24 h according toAOAC method 248.12 (1997). Dried samples were tested for ash content in a mu�e furnace at 550 °C for4 h (AOAC 935.42, 1997).
The fat content was determined using the Van Gulik method (ISO 3433, 2008). Cheese protein wasdetermined by multiplying the total nitrogen content of the samples, obtained using the Kjeldahlprocedure (AOAC 920.132, 1997), by a factor of 6.38.
The pH was measured directly in cheeses, using a pH meter (PHM61 Laboratory pH Meter, Denmark)equipped with a probe for reading solids and the titratable acidity was expressed as g of lactic acid/100 gcheese (AOAC 920.124, 1997).
According to the physicochemical composition of each cheese sample, moisture in non-fat substance(MNFS) and fat in dry matter (FDM) were calculated.

Page 6/21
Colour was expressed by the individual three coordinates of CIEL*a*b* system using a Chroma MinoltaCR-200B colorimeter (Japan). For each cheese type, three readings for colour were performed on the rindand on the paste of two cheeses (n=6).
Cheese hardness (N), adhesiveness (g.s), chewiness and cohesiveness were determined by means oftexture pro�le analysis (TPA) using a Stable Micro Systems Texture Analyzer (model TA.XT ExpressEnhanced, Stable Micro Systems LTD, UK). The cylindrical test probe used for the test was TA-24 (1/4"diameter, acrylic, 35 mm tall) under a pre-test speed of 1.0 mm/s and the test speed of 2 mm/s. while fortexture. Three penetrations were performed on the surface (without rind) of two cheese samples (n=6).
Non-trained members of staff and students performed sensory analysis, at the 30th, 60th and 90th days ofripening. Each of the sensory evaluation tests involved 30 members which, individually, expressed theirconsent. The tests involved evaluation of the cheese samples according to the following parameters:external and sliced aspect, aroma, taste and texture. Overall impression was also evaluated through aranking test. Each cheese category was coded and the tasters were asked to evaluate both the visual andgustatory aspects using a 1-9 scale (1=dislike extremely; 2=dislike very much; 3=dislike moderately;4=dislike slightly; 5=neither like nor dislike; 6=like slightly; 7=like moderately; 8=like very much; 9=likeextremely).
One-way ANOVA tests, included in StatSoft Statistica 8.0, were performed to compare the means of thephysicochemical properties of the cheeses and attributes used for the sensorial evaluation. The TukeyHSD post-hoc test, with a 95% con�dence level was applied to assess differences between treatments.
Results And DiscussionTable 1 presents the composition of the different ingredients added as fat replacers to the 1.5% (v/v) fatmilk batches. Signi�cant differences were observed in the protein, fat and ash contents of thoseproducts. Concentrated buttermilk presented the lower level of protein, while CS presented the highestvalue. The lowest fat content was observed in CS. CB and CW presented similar dry matter values, whileCS showed a signi�cantly lower content.
Table 1. Proximal composition of the different ingredients used for cheese production.
DRY MATTER ± PROTEIN ± FAT ± ASH ±
CB 13.78a 0.42 3.65a 0.07 1.41a 0.01 0.75a 0.09
CW 13.19a 0.68 5.49b 0.04 2.81b 0.01 0.92b 0.03
CS 10.35b 0.14 6.56c 0.05 0.41c 0.01 0.54c 0.02
CB: UF concentrated buttermilk; CW: UF concentrated whey; CS: UF concentrated sheep’s second cheesewhey. Means within the same column with different superscripts are signi�cantly different (p< 0.05).
Page 7/21
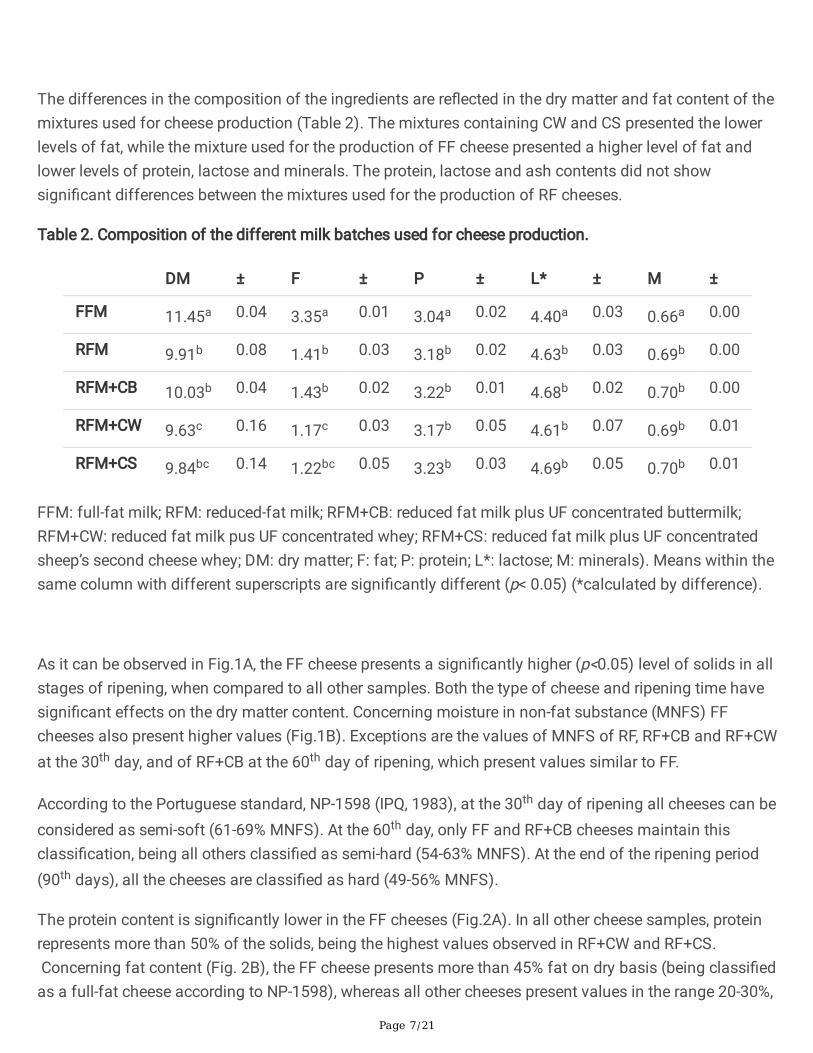
The differences in the composition of the ingredients are re�ected in the dry matter and fat content of themixtures used for cheese production (Table 2). The mixtures containing CW and CS presented the lowerlevels of fat, while the mixture used for the production of FF cheese presented a higher level of fat andlower levels of protein, lactose and minerals. The protein, lactose and ash contents did not showsigni�cant differences between the mixtures used for the production of RF cheeses.
Table 2. Composition of the different milk batches used for cheese production.
DM ± F ± P ± L* ± M ±
FFM 11.45a 0.04 3.35a 0.01 3.04a 0.02 4.40a 0.03 0.66a 0.00
RFM 9.91b 0.08 1.41b 0.03 3.18b 0.02 4.63b 0.03 0.69b 0.00
RFM+CB 10.03b 0.04 1.43b 0.02 3.22b 0.01 4.68b 0.02 0.70b 0.00
RFM+CW 9.63c 0.16 1.17c 0.03 3.17b 0.05 4.61b 0.07 0.69b 0.01
RFM+CS 9.84bc 0.14 1.22bc 0.05 3.23b 0.03 4.69b 0.05 0.70b 0.01
FFM: full-fat milk; RFM: reduced-fat milk; RFM+CB: reduced fat milk plus UF concentrated buttermilk;RFM+CW: reduced fat milk pus UF concentrated whey; RFM+CS: reduced fat milk plus UF concentratedsheep’s second cheese whey; DM: dry matter; F: fat; P: protein; L*: lactose; M: minerals). Means within thesame column with different superscripts are signi�cantly different (p< 0.05) (*calculated by difference).
As it can be observed in Fig.1A, the FF cheese presents a signi�cantly higher (p<0.05) level of solids in allstages of ripening, when compared to all other samples. Both the type of cheese and ripening time havesigni�cant effects on the dry matter content. Concerning moisture in non-fat substance (MNFS) FFcheeses also present higher values (Fig.1B). Exceptions are the values of MNFS of RF, RF+CB and RF+CWat the 30th day, and of RF+CB at the 60th day of ripening, which present values similar to FF.
According to the Portuguese standard, NP-1598 (IPQ, 1983), at the 30th day of ripening all cheeses can beconsidered as semi-soft (61-69% MNFS). At the 60th day, only FF and RF+CB cheeses maintain thisclassi�cation, being all others classi�ed as semi-hard (54-63% MNFS). At the end of the ripening period(90th days), all the cheeses are classi�ed as hard (49-56% MNFS).
The protein content is signi�cantly lower in the FF cheeses (Fig.2A). In all other cheese samples, proteinrepresents more than 50% of the solids, being the highest values observed in RF+CW and RF+CS. Concerning fat content (Fig. 2B), the FF cheese presents more than 45% fat on dry basis (being classi�edas a full-fat cheese according to NP-1598), whereas all other cheeses present values in the range 20-30%,

Page 8/21
being, in most cases, classi�ed as low-fat (10-25% dry basis). However, in the cases of RF at the 1st, 60th
and 90th days of ripening, RF+CB at the 1st and 60th days of ripening and of RF+CW at the end ofripening, the cheeses can be classi�ed as half-fat according to NP-1598 (25-45% dry basis).
The ratio protein in dry matter/fat in dry matter (Pdm/Fdm) (Fig. 3A) shows clear differences between FFand RF cheese samples. This value is lower than 1 in the FF cheese, whereas in the case of the remainingsamples is in the range 1.8-2.7, being the highest values observed in RF+CS. Although CS presentssigni�cantly higher protein content when compared to CB or CW, the mixtures used for cheese productiondid not show signi�cant differences regarding this parameter. Hence, the protein content of CS cannotjustify, on its own, this occurrence. Second cheese whey normally presents a high proportion of denaturedwhey protein aggregates resulting from the drastic heat treatment (ca. 90 ºC 10 min) to which whey issubmitted during the production of whey cheeses. The better retention of such aggregates in the cheesecurd, as compared to native proteins, may explain the higher protein content of RF+CS and, to someextent, of RF+CW (in which protein was also denatured). With regard to the ratio protein in drymatter/moisture (Pdm/M), the maximum value attained by the FF cheeses is around 1.15, at the end ofthe ripening period, whereas in the case of the reduced fat cheeses is in the range 1.2-1.4 (Fig. 3B). Highervalues of Pdm/Fdm and of Pdm/M are expected to promote a harder texture, associated to lower sensoryscores of the reduced-fat cheeses. RF+CB cheeses present ratios of Pdm/M lower than 1.0, both at the30th and 60th days of ripening, with values slightly higher than those of the FF cheese. This fact hadpositive repercussions on the textural and sensory properties of these cheeses.
On the �rst day of ripening, the pH values of the cheeses are in the order of 5.5-5.9, being signi�cantlylower (p<0.05) in the case of RF+CW and signi�cantly higher in the case of RF+CS (ca. 5.9) (Fig. 4A).After the 30th day of ripening, the values decreased to 5.0 in the case of FF and RF, being signi�cantlyhigher in the cases of cheeses with added fat replacers (ca. 5.2). After this moment, the pH increasedsteadily until the end of ripening, being the increase more pronounced in the case of cheeses with addedfat replacers. RF+CS cheeses showed higher pH values at the 60th day of ripening, being signi�cantlyhigher at the 90th day. The titratable acidity (TA) shows the inverse tendency (Fig. 4B). The highest valueswere observed for FF and RF cheeses at the 60th and 90th days of ripening. Overall, the reduced-fatcheeses containing fat replacers presented lower TA values, being the lowest values observed for RF+CWin all stages of ripening.
Concerning the colour parameters of the cheeses (Fig. 5), the luminosity (L*) of the rind of RF+CWcheeses is signi�cantly lower at the �rst day of ripening. At the 30th day, the L* value of the rind issigni�cantly higher in RF and RF+CB when compared to all other samples. After the 60th day of ripeningall the reduced-fat cheeses show signi�cantly lower L* values when compared to FF, being the cheeseswith added fat replacers clearly darker when compared to FF an RF. The luminosity of the paste showed a

Page 9/21
tendency to increase between the 30th and the 60th day, exception made to the case of RF+CS. At the endof the ripening period all cheeses showed signi�cantly lower L* values when compared to the initialvalues, indicating the darkening of the paste. By the end of ripening, all the reduced-fat cheeses showedsigni�cantly lower L* values of the paste, being the paste of RF+CW and RF+CS signi�cantly darker thanthe ones of RF and RF+CB. Thus, it appears that both those fat replacers signi�cantly impaired the colourof the paste of cheeses. Concerning the a* parameter of the rind, the initial values were very similar,re�ecting the white colour of the products, but shifted towards the green colour (ca. -3.5) after 30 days.Then, these values increased until the 60th day, being the increase more pronounced in RF and RF+CB. Bythe end of ripening the a* values of the rind decreased again in all reduced-fat cheeses, with the exceptionof RF+CW. At the end of ripening RF+CS showed a signi�cantly lower a* value. The a* values of the pastewere very similar until the 30th day, then decreased at the 60th day and �nally increased slightly at the endof the ripening period. This increase was more pronounced in RF+CW and RF+CS. The FF cheesepresented signi�cantly lower a* values at the 60th and 90th days of the ripening period. From the 1st to the30th days of ripening, the b* value of the rind shifted from 0 to values around 20 in the case of the FFcheese, while in the cheeses with fat replacers, at the 30th day, the b* values were in the order of 15-17.This evolution indicates the shift from white to yellow. Then, the b* values were maintained, or slightlyreduced, until the end of ripening. The same pattern was observed with the b* value of the paste.However, the change only was evident from the 60th day onwards. The paste of the FF cheese presenteda more pronounced (p<0.05) yellow colour at the 60th and 90th days of ripening, indicating that fat has asigni�cant impact on this parameter. RF+CW and RF+CS presented signi�cantly lower values of b* at the60th and 90th days of ripening.
With regard to the texture (Fig. 6), hardness values show signi�cant differences (p<0.05) at the 30th dayof ripening, presenting RF+CW and RF+CS higher values. From the 60th to the 90th day of ripening, asharp increase of the hardness values was observed in the cases of RF, RF+CW and RF+CS, while RF+CBshowed values similar to those of FF cheese. FF and RF+CB maintained values of hardness in the orderof 5.0-7.5 N all over ripening. In the case of adhesiveness, RF+CW and RF+CS also present signi�cantlylower values by the end of the ripening period, whereas RF+CB presented the highest values. In all casesthis parameter signi�cantly decreased between the 60th and the 90th day of ripening. At the end ofripening, chewiness values are signi�cantly higher in RF, RF+CW and RF+CS being the values of RF+CBsimilar to those of FF. It is evident that after the 60th day of ripening, with the exception of RF+CB, all thereduced-fat cheeses show clear differences in texture when compared to FF cheeses. Concerning theseparameters, it can be considered that the use of liquid buttermilk was the best option for the replacementof fat, since RF+CB cheeses are very similar to FF cheeses. Diamantino et al. 2014 reported that fatreduction increased the hardness of Minas fresh cheeses, promoting a denser microstructure and lessproteolysis. Henriques et al. 2018, report values of the order of 3.6 N for the hardness of RF cheeses withaddition of 10 (v/v) liquid whey protein concentrates (LWPC) plus 0.25-0.5% (m/v) Simplesse™, while

Page 10/21
conventional RF cheeses showed values in the order of 8 N. The cheeses with addition of LWPC producedby those authors also presented signi�cantly higher levels of MNFS, when compared to conventional RFcheeses. Kavas et al. (2014) report that cheese fracturability, cohesiveness and hardness increased withdecreasing fat, while elasticity and adhesiveness decreased. They also report that cheese lightness andred and yellow indexes decreased with decreasing fat content.
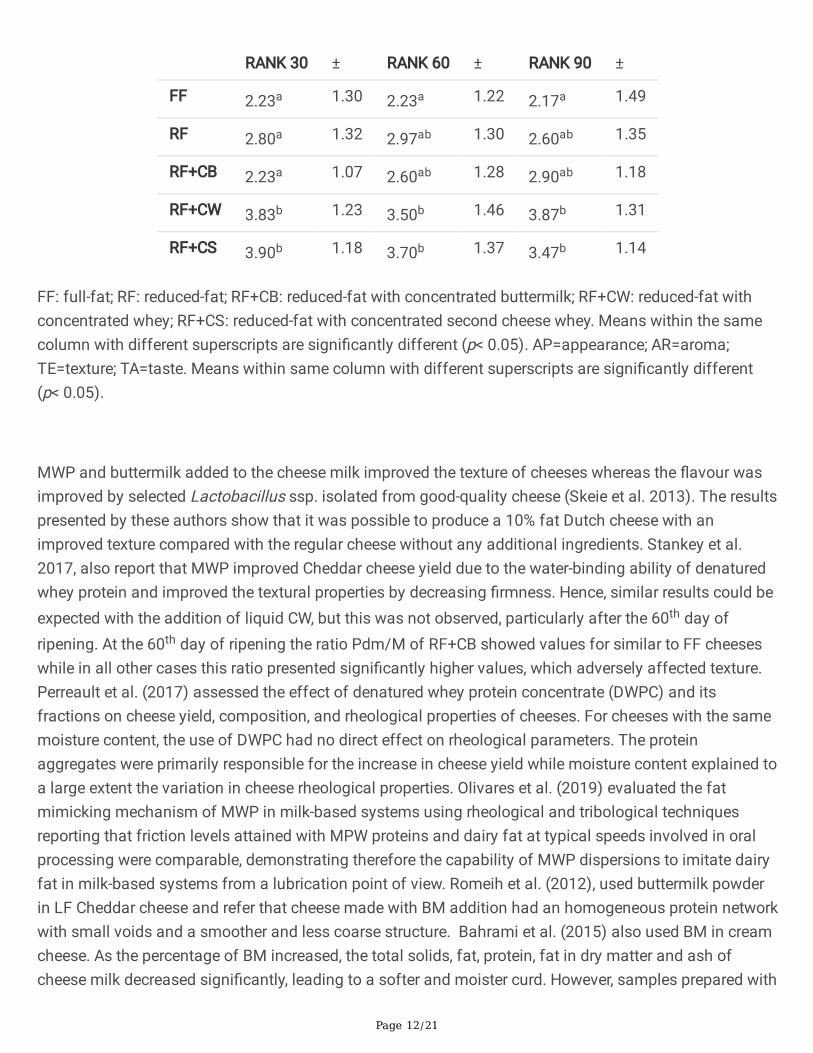
The sensory evaluation results are depicted in tables 3 and 4. At the 30th day of ripening no differencesbetween cheeses could be detected, regarding their appearance. RF+CW and RF+CS cheeses obtainedsigni�cantly lower scores for texture and taste. This fact is also re�ected by the lower ranking obtained byboth samples (Table 4). At the 60th day of ripening the defects in texture and taste of RF+CW were notevident, while RF+CS showed signi�cantly lower scores for these parameters. However, at the end of theripening period RF+CW presented signi�cantly lower scores for appearance, texture and taste. The FFcheese presented the highest scores for aroma and taste at the 60th day of ripening and for appearanceand taste at the end of the ripening period. RF+CB presents similar results to the FF cheeses in all stagesof ripening. It has to be highlighted that, until the 60th day of ripening, for several sensory parameters,RF+CB cheeses obtained the highest scores, although not signi�cantly different from the ones obtainedby FF cheeses.
Table 3. Sensory evaluation of the cheese samples at the 30th, 60th and 90th days of ripening.

Page 11/21
AP 30 ± AR 30 ± TE 30 ± TA 30 ±
FF 7.00a 1.17 6.63ab 1.85 7.03a 1.22 7.23a 1.63
RF 7.10a 1.71 6.63ab 1.56 6.67ab 1.73 6.57ab 1.83
RF+CB 7.50a 1.17 6.87a 1.38 7.33a 1.49 7.27a 1.26
RF+CW 6.80a 1.65 6.00ab 1.60 5.77b 1.45 5.73b 1.98
RF+CS 6.63a 1.50 5.73b 1.48 5.57b 1.65 5.57b 1.94
AP 60 ± AR 60 ± TE 60 ± TA 60 ±
FF 7.53a 1.20 7.23a 1.10 7.53ab 1.20 7.50a 1.28
RF 7.30a 0.95 6.70a 1.42 7.40ab 1.35 7.27ab 1.55
RF+CB 7.53a 0.94 7.03a 1.19 7.67a 1.18 7.10ab 1.27
RF+CW 7.23a 1.04 6.77a 1.38 7.00ab 1.39 6.90ab 1.32
RF+CS 7.20a 1.19 6.60 a 1.48 6.63b 1.73 6.43b 1.89
AP 90 ± AR 90 ± TE 90 ± TA 90 ±
FF 7.77a 1.28 7.13a 1.61 7.37a 1.69 7.50a 1.59
RF 7.40ab 1.04 6.70a 1.58 6.90ab 1.54 6.93ab 1.53
RF+CB 7.43ab 0.94 6.90a 1.40 6.97ab 1.63 7.00ab 1.51
RF+CW 5.93b 1.66 6.17a 2.02 6.00b 1.82 6.33b 1.63
RF+CS 6.77ab 1.36 6.10a 1.90 6.63ab 1.52 6.63ab 1.52
AP=appearance; AR=aroma; TE=texture; TA=taste. (FF) full-fat; (RF) reduced-fat; RF+CB: reduced-fat withconcentrated buttermilk; RF+CW: reduced-fat with concentrated whey; RF+CS: reduced-fat withconcentrated second cheese whey. Means within the same column with different superscripts aresigni�cantly different (p< 0.05).
Table 4. Ranking of the cheese samples at the different periods of ripening. Lower values indicate higherpositioning in the ranking.
Page 12/21
RANK 30 ± RANK 60 ± RANK 90 ±
FF 2.23a 1.30 2.23a 1.22 2.17a 1.49
RF 2.80a 1.32 2.97ab 1.30 2.60ab 1.35
RF+CB 2.23a 1.07 2.60ab 1.28 2.90ab 1.18
RF+CW 3.83b 1.23 3.50b 1.46 3.87b 1.31
RF+CS 3.90b 1.18 3.70b 1.37 3.47b 1.14
FF: full-fat; RF: reduced-fat; RF+CB: reduced-fat with concentrated buttermilk; RF+CW: reduced-fat withconcentrated whey; RF+CS: reduced-fat with concentrated second cheese whey. Means within the samecolumn with different superscripts are signi�cantly different (p< 0.05). AP=appearance; AR=aroma;TE=texture; TA=taste. Means within same column with different superscripts are signi�cantly different(p< 0.05).
MWP and buttermilk added to the cheese milk improved the texture of cheeses whereas the �avour wasimproved by selected Lactobacillus ssp. isolated from good-quality cheese (Skeie et al. 2013). The resultspresented by these authors show that it was possible to produce a 10% fat Dutch cheese with animproved texture compared with the regular cheese without any additional ingredients. Stankey et al.2017, also report that MWP improved Cheddar cheese yield due to the water-binding ability of denaturedwhey protein and improved the textural properties by decreasing �rmness. Hence, similar results could beexpected with the addition of liquid CW, but this was not observed, particularly after the 60th day ofripening. At the 60th day of ripening the ratio Pdm/M of RF+CB showed values for similar to FF cheeseswhile in all other cases this ratio presented signi�cantly higher values, which adversely affected texture.Perreault et al. (2017) assessed the effect of denatured whey protein concentrate (DWPC) and itsfractions on cheese yield, composition, and rheological properties of cheeses. For cheeses with the samemoisture content, the use of DWPC had no direct effect on rheological parameters. The proteinaggregates were primarily responsible for the increase in cheese yield while moisture content explained toa large extent the variation in cheese rheological properties. Olivares et al. (2019) evaluated the fatmimicking mechanism of MWP in milk-based systems using rheological and tribological techniquesreporting that friction levels attained with MPW proteins and dairy fat at typical speeds involved in oralprocessing were comparable, demonstrating therefore the capability of MWP dispersions to imitate dairyfat in milk-based systems from a lubrication point of view. Romeih et al. (2012), used buttermilk powderin LF Cheddar cheese and refer that cheese made with BM addition had an homogeneous protein networkwith small voids and a smoother and less coarse structure. Bahrami et al. (2015) also used BM in creamcheese. As the percentage of BM increased, the total solids, fat, protein, fat in dry matter and ash ofcheese milk decreased signi�cantly, leading to a softer and moister curd. However, samples prepared with

Page 13/21
more than 25% BM were not acceptable to the taste panel. Hickey et al. (2017), evaluated the effect ofBM powder addition post-curd formation, or liquid BM addition to cheese milk, on the characteristics ofCheddar-style cheese. Addition of 10% buttermilk powder resulted in higher phospholipid content,moisture, pH and salt levels, and lower fat in dry matter. BM addition also originated a more porouscheese microstructure with higher fat globule coalescence and increased free fat, while increasedmoisture and decreased protein, fat and pH levels. Hickey et al. (2018), report that liquid BM addition tocheese milk resulted in a softer cheese compared to other cheeses, while BM powder addition had noin�uence on cheese �rmness compared to the control cheese. However, signi�cant differences in sensorypro�les associated with off-�avour were also observed with the addition of liquid BM to cheese milk.Addition of 10% BM powder to cheese curds resulted in cheese comparable to the control Cheddar withsimilar structural and sensory characteristics, although with differences in overall cheese �avour. In thecase of our products no adverse effects resulted from the addition of BM to cheese milk.
ConclusionThe reduction of fat in cheeses often affects negatively their sensory properties. Therefore, severalapproaches are normally used to minimize those negative effects. In the present study, UF concentratedliquid buttermilk, whey protein concentrate and sheep’s second cheese whey were used for the purpose.From the results obtained, it is evident that UF concentrated liquid buttermilk improved signi�cantly theproperties of RF/LF cheeses, which showed good overall sensory assessment and compared well to FFcheeses. It is recommended that further work should compare the fat replacing properties of suchproducts, both in the liquid and dry form. Optimization of mixtures of such by-products should alsodeserve further research.
AbbreviationsBM: buttermilk; CB: concentrated buttermilk; CW: concentrated whey; CS: concentrated second cheesewhey; DWPC: denatured whey protein concentrate; FF: full-fat; LF: low-fat; LWPC: liquid whey proteinconcentrates; MWP microparticulated whey protein; MNFS: moisture in non-fat substance; RF: reduced-fat; UF: ultra�ltration.
DeclarationsAcknowledgements: The authors are gratefull to Adélia Vaz, Lurdes Pires and Jorge Arede for their help inthe production of cheeses in pilot plant.
Availability of data and materials: all data generated or analyzed during this study are included in thispublished article and can be provided by the corresponding uthor upon request.
Ethics approval: not applicable; informed consent to participate in sensory tests was provided to panelmembers.

Page 14/21
Consent for publication: not applicable.
Competing interests: the authors declare that they have no competing interests.
Authors’ contributions: ARB, AFP, NGM, DG conducted the study (UF concentration of dairy by-products,cheese production, preparation and analysis of samples); CDP supervised the experiments, analyzed thedata, and drafted the manuscript; MFH reviewed and edited the article. All authors read and approved the�nal manuscript.
Funding: this research was funded by by national funds through the ministry of Agriculture and RuralDevelopment and co-�nanced by the European Agricultural Fund for Rural Development (EAFRD), throughthe partnership agreement Portugal2020-PDR, under the project PDR2020-101-030768: LACTIES-Inovação, Ecoe�ciência e Segurança em PME´s do Sector dos Lacticínios; and through FCT-Foundationfor Science and Technology-project UID/AMB/00681/2019.
ReferencesAOAC (1997) O�cial methods of analysis of Association of O�cial Analytical Chemists. 16th ed. VolumeII. 33 Dairy Products USA.
Bahrami M, Ahmadi D, Beigmohammadi F, Hosseini F (2015) Mixing sweet cream buttermilk with wholemilk to produce cream cheese. Irish J. Agric. & Food Res. 54 (2):73-78. https://doi.org/10.1515/ijafr-2015-0008
Banks JM (2004) The technology of low-fat cheese manufacture. Int. J. Dairy Tech. 57:199-208.
Cheftel J C & Dumay E (1993) Microcoagulation of proteins for development of creaminess. FoodReviews Int. 9:473-502.
Dai S, Jiang F, Corke H and Shah N P (2018) Physicochemical and textural properties of mozzarellacheese made with konjac glucomannan as a fat replacer. Food Res. Int. 107:691-699.https://doi.org/10.1016/j.foodres.2018.02.069
Diamantino V R, Beraldo F A, Sunakozawa T N, Lúcia A and Penna B (2014) Effect of octenylsuccinylated waxy starch as a fat mimetic on texture, microstructure and physicochemical properties ofMinas fresh cheese. LWT-Food Sci. and Tech. 56:356-362. https://doi.org/10.1016/j.lwt.2013.12.001
Di Cagno R, De Pasquale I, De Angelis M, Buchin S, Rizzello C G and Gobbetti M (2014) Use ofmicroparticulate whey protein concentrate, exopolysaccharide-producing Streptococus thermophiles, andadjunct cultures for making low-fat Italian Caciotta-type cheese. J. Dairy Sci. 97:72-84.http://dx.doi.org/10.3168/jds.2013-7078
Drake M A, Miracle R E and Mcmahon D J (2010) Impact of fat reduction on �avour and �avourchemistry of Cheddar cheeses. J. Dairy Sci. 93:5069-5081. https://doi.org/10.3168/jds.2010-3346

Page 15/21
Frusch JAH & Kokx JJMP (2008) Cheese with added whey protein agglomerates. European PatentApplication. EP1917861 A1.
Giroux H J, Veilllete N, Britten M (2018) Use of denatured whey protein in the production of artisanalcheeses from cow, goat and sheep milk. Small Rum. Res. 161:34-42.https://doi.org/10.1016/j.smallrumres.2018.02.006
Henriques M, Gomes D, Brennan K, Skryplonek K, Fonseca C, Pereira C (2018) The use of whey proteinsas fat replacers for the production of reduced fat cheeses. In: Marta Henriques, Carlos Pereira (Eds.).Cheese Production, Consumption and Health Bene�ts. Nova Science Publishers. New York. ISBN: 978-1-53612-841-3
Hickey C D, Diehl BWK, Nuzzo M, Millqvist-Feurby A, Wilkinson MG, Sheehan JJ (2017) In�uence ofbuttermilk powder or buttermilk addition on phospholipid content, chemical and bio-chemicalcomposition and bacterial viability in Cheddar style cheese. Food Res. Int. 102:748-758.https://doi.org/10.1016/j.foodres.2017.09.067
Hickey C D, O’Sullivan M G, Davis J, Scholz D, Kilcawley K N, Wilkinson M G, Sheehan J J (2018) Theeffect of buttermilk or buttermilk powder addition on functionality, textural, sensory and volatilecharacteristics of Cheddar-style cheese. Food Research International, 103: 468-477.
https://doi.org/10.1016/j.foodres.2017.09.081
ISO 3433, (2008) Cheese-Determination of fat content-Van Gulik method. International Organization forStandardization (ISO).
Koca N & Metin M (2004) Textural, melting and sensory properties of low-fat fresh kashar cheesesproduced by using fat replacers. Int. Dairy J. 14:365-373. https://doi.org/10.1016/j.idairyj.2003.08.006
IPQ-Portuguese Institute of Quality (1983) NP-1598. Cheese De�nition, classi�cation, packaging andmarking. Lisbon, Portugal.
Lashkari H & Khosrowshahi A (2014) Chemical composition and rheology of low-fat Iranian white cheeseincorporated with guar gum and gum arabic as fat replacers. J. Food Sci. Tech. 51:2584-2591.https://doi.org/10.1007/s13197-012-0768-y
Li H, Liu Y, Sun Y, Li H and Yu J (2019) Properties of polysaccharides and glutamine transaminase usedin mozzarella cheese as texturizer and crosslinking agents. LWT-Food Sci. Tech. 99:411-416.https://doi.org/10.1016/j.lwt.2018.10.011
Liu K, Stieger M, van der Linden E and van de Velde F (2016) Effect of microparticulated whey protein onsensory properties of liquid and semi-solid model foods. Food Hydrocol. 60:186-198.https://doi.org/10.1016/j.foodhyd.2016.03.036

Page 16/21
Mistry V V (2001) Low fat cheese technology. Int. Dairy J. 11:413-422. https://doi.org/10.1016/S0958-6946(01)00077-2
McCarthy C M, Wilkinson M G, Kelly P M and Guinee T P (2016) Effect of salt and fat reduction onproteolysis, rheology and cooking properties of Cheddar cheese. Int. Dairy J. 56:74-86.https://doi.org/10.1016/j.idairyj.2016.01.001
Olivares M L, Shahrivar K, de Vicente J (2019) Soft lubrication characteristics of microparticulated wheyproteins used as fat replacers in dairy systems. J. Food Eng. 245:157-165.https://doi.org/10.1016/j.jfoodeng.2018.10.015
Oluk A C, Güven M and Hayaloglu A A (2014) Proteolysis texture and microstructure of low-fat Tulumcheese affected by exopolysaccharide-producing cultures during ripening. Int. J. Food Sci. Tech. 49:435-443. https://doi.org/10.1111/ijfs.12320
Oluk A C, Güven M and Hayaloglu A A (2014) In�uence of exopolysaccharide-producing cultures on thevolatile pro�le and sensory quality of low-fat Tulum cheese. Int. J. Dairy Tech. 67:265-276.https://doi.org/10.1111/1471-0307.12118
Palatnik D R, Herrera P A, Rinaldoni A N, Basurto R O and Campderrós M E (2017) Development ofreduced-fat cheeses with the addition of Agave fructans. Int. J. Dairy Tech. 70:212-219.https://doi.org/10.1111/1471-0307.12334
Perreault V, Rémillard N, Chabot D, Morin P, Pouliot Y, Britten M (2017) Effect of denatured whey proteinconcentrate and its fractions on cheese composition and rheological properties. J. Dairy Sci. 10(7):5139-5152. https://doi.org/10.3168/jds.2016-12473
Rogers N R, Drake M A, Daubert C R, Mcmahon D J, Bletsch T K and Foegeding E A (2009) The effect ofaging on low-fat, reduced-fat, and full-fat Cheddar cheese texture. J. Dairy Sci. 92:4756-4772.https://doi.org/10.3168/jds.2009-2156
Rogers N R, McMahon D J, Daubert C R, Berry T K and Foegeding E A (2010) Rheological properties andmicrostructure of Cheddar cheese made with different fat contents. J. Dairy Sci. 93:4565-4576.https://doi.org/10.3168/jds.2010-3494
Romeih E A, Moe K M, Skeie S (2012) The in�uence of fat globule membrane material on themicrostructure of low-fat Cheddar cheese. Int. Dairy J. 26 (1):66-72.https://doi.org/10.1016/j.idairyj.2012.03.008
Sharma Khanal B K, Bhandari B, Prakash S, Liu D, Zhou P and Bansal N (2018) Modifying textural andmicrostructural properties of low fat Cheddar cheese using sodium alginate. Food Hydrocol. 83:97-108.https://doi.org/10.1016/j.foodhyd.2018.03.015

Page 17/21
Skeie S, Alseth GM, Østlie H, Abrahamsen R K, Johansen A G, Øyaas J (2013) Improvement of the qualityof low-fat cheese using a two-step strategy. Int. Dairy J. 33 (2):153-162.https://doi.org/10.1016/j.idairyj.2013.04.003
Torres I C, Mutaf G, Larsen F H and Ipsen R (2016) Effect of hydration of microparticulated whey proteiningredients on their gelling behaviour in a non-fat milk system. J. Food Eng. 184:31-37.http://dx.doi.org/10.1016/j.jfoodeng.2016.03.018
Zhang Z, Arrighi V, Campbell L and Lonchamp J (2016) Properties of partially denatured whey proteinproducts: Formation and characterisation of structure. Food Hydrocol. 52:95-105.https://doi.org/10.1016/j.foodhyd.2015.06.009
Zalazar C A, Zalazar C S, Bernal S, Bertola N, Bevilacqua A and Zraitzky N (2002) Effect of moisture leveland fat replacer on physico-chemical, rheological and sensory properties of low fat soft cheeses. Int.Dairy J. 12:45-50. http://dx.doi.org/10.1016/j.jfoodeng.2016.03.018
Wang F, Tong Q, Luo J, Xu Y and Ren F (2016) Effect of carrageenan on physicochemical and functionalproperties of low-fat Colby cheese. J. Food Sci. 81:1949-1955. https://doi.org/10.1111/1750-3841.13369
Wydrych J, Gawron A and Jeli T (2015) The effect of fat replacement by inulin on the physicochemicalproperties and microstructure of acid casein processed cheese analogues with added whey proteinpolymers. Food Hydrocol. 44:1-11. https://doi.org/10.1016/j.foodhyd.2014.08.022
Figures
Figure 1
Dry matter (A) and moisture in non-fat substance (MNFS) (B) of tested cheeses over ripening.

Page 18/21
Figure 2
Protein in dry matter (A) and fat in dry matter (FDM) (B) of tested cheeses over ripening.
Figure 3
Ratio protein in dry matter/fat in dry matter (Pdm/Fdm) (A) and protein in dry matter/moisture (Pdm/M)(B) of tested cheeses over ripening.

Page 19/21
Figure 4
(A) pH and (B) titratable acidity (TA) of tested cheeses over ripening.

Page 20/21
Figure 5
Colour parameters of the rind (A) and of the paste (B) of tested cheeses over ripening.

Page 21/21
Figure 6
Texture parameters of the tested cheeses over ripening. (A) Hardness; (B) Adhesivenness; (C) Chewinness;(D) Cohesivenness.