repeated, selection-driven genome reduction of accessory
TRANSCRIPT

Repeated, Selection-Driven Genome Reduction ofAccessory Genes in Experimental PopulationsMing-Chun Lee1¤, Christopher J. Marx1,2*
1 Department of Organismic and Evolutionary Biology, Harvard University, Cambridge, Massachusetts, United States of America, 2 Faculty of Arts and Sciences Center for
Systems Biology, Harvard University, Cambridge, Massachusetts, United States of America
Abstract
Genome reduction has been observed in many bacterial lineages that have adapted to specialized environments. Theextreme genome degradation seen for obligate pathogens and symbionts appears to be dominated by genetic drift. Incontrast, for free-living organisms with reduced genomes, the dominant force is proposed to be direct selection for smaller,streamlined genomes. Most variation in gene content for these free-living species is of ‘‘accessory’’ genes, which arecommonly gained as large chromosomal islands that are adaptive for specialized traits such as pathogenicity. It is generallyunclear, however, whether the process of accessory gene loss is largely driven by drift or selection. Here we demonstratethat selection for gene loss, and not a shortened genome, per se, drove massive, rapid reduction of accessory genes. In just1,500 generations of experimental evolution, 80% of populations of Methylobacterium extorquens AM1 experienced nearlyparallel deletions removing up to 10% of the genome from a megaplasmid present in this strain. The absence of thesedeletion events in a mutation accumulation experiment suggested that selection, rather than drift, has dominated theprocess. Reconstructing these deletions confirmed that they were beneficial in their selective regimes, but led to decreasedperformance in alternative environments. These results indicate that selection can be crucial in eliminating unnecessarygenes during the early stages of adaptation to a specialized environment.
Citation: Lee M-C, Marx CJ (2012) Repeated, Selection-Driven Genome Reduction of Accessory Genes in Experimental Populations. PLoS Genet 8(5): e1002651.doi:10.1371/journal.pgen.1002651
Editor: Nancy A. Moran, Yale University, United States of America
Received November 3, 2011; Accepted February 28, 2012; Published May 10, 2012
Copyright: ! 2012 Lee, Marx. This is an open-access article distributed under the terms of the Creative Commons Attribution License, which permits unrestricteduse, distribution, and reproduction in any medium, provided the original author and source are credited.
Funding: This work was funded by a grant from the NSF (DEB-0845893). The funders had no role in study design, data collection and analysis, decision topublish, or preparation of the manuscript.
Competing Interests: The authors have declared that no competing interests exist.
* E-mail: [email protected]
¤ Current address: Department of Biochemistry, The University of Hong Kong, Pokfulam, Hong Kong
Introduction
Bacterial genomes have the potential to rapidly change their sizeand content as a result of various mechanisms such as deletion,duplication and horizontal gene transfer. The net expansion orcontraction at the genome scale is thus a function of both the rate atwhich these events occur and the subsequent filters imposed bynatural selection and/or genetic drift [1,2]. Although most bacterialgenomes have remained relatively constant in size due to anapparent overall balance of these forces [3], distinct strains within aspecies can differ remarkably in gene content [4]. This finding hasled to categorizing the genome into the core and accessory (orauxiliary) components, the former being present in nearly allmembers, and the latter being present in only a subset of strains [5].
The population biology and selective environment of microbeseach contribute to the tempo and mode of genomic change. Ofprimary importance is the effective population size (Ne) of a species,as this influences the efficacy of selection versus drift. Repeatedbottlenecks, such as those experienced by intracellular endosym-bionts (which also participate in little, if any horizontal genetransfer), result in tremendous rates of sequence change andineffective selection to maintain functions required for host-independent lifestyle. This often leads to loss of many genes thatare essential for the free-living microbes and massive genomeshrinkage (ex: 77% in the intracellular symbiont of aphids, Buchneraaphidicola and genomes as small as Hodgkinia cicadicola (144 kb))
[2,6–9]. On the other hand, simply living on a restricted set ofresources in a relatively constant environment can also result inreduced genomes despite very large Ne, such as observed for theplankton Prochlorococcus and Pelagibacter [10,11]. For these it hasbeen suggested that the major force driving genome reduction isstreamlining, defined as when ‘‘selection acts to reduce genomesize because of the metabolic burden of replicating DNA with noadaptive value’’ [11]. In addition to DNA synthesis, deletions alsoeliminate producing the RNA molecules and proteins encoded bythat region.
Beyond external factors, the genomic structure of microbes andmechanisms of gene gain and loss make it possible for large regionsto come and go in single events. Accessory genes are dispropor-tionately found on extrachromosomal replicons that are subject topotential loss. Alternatively, even when present on the mainchromosome accessory genes are often found as discrete genomicislands disrupting an otherwise syntenic chromosome betweenstrains in a species. This can result in gains or losses via variousmechanisms such as homologous or site-specific recombinationand phage integration/excision [12], resulting in punctuatedlarge-scale gene content changes. Large-scale reductions ofaccessory genomes via these events may be a critical mechanismin early stages of genome shrinkage.
Although either drift or selection could contribute to genomereduction observed in nature, we lack direct evidence todistinguish between the lack of purifying selection to maintain
PLoS Genetics | www.plosgenetics.org 1 May 2012 | Volume 8 | Issue 5 | e1002651

the genes lost versus positive selection for their loss. Genomicanalyses of chronic infections, such as Pseudomonas aeruginosa incystic fibrosis patients, have repeatedly observed large deletions[13–15]. This rapid loss of genomic islands could simply be due tohigh rates of recombination and drift (or hitchhiking). Alterna-tively, the instability of the accessory genome could be due toselection, either for reduced genome length (i.e., streamlining) orbeneficial gene loss, such as has been shown for Shigella flexneri, afacultative intracellular pathogen of primates [16].
Laboratory-evolved populations of bacteria present the uniqueopportunity to address the forces involved in genome reductionunder selective regimes that tilt the relative efficacy of selectionversus drift. ‘Mutation accumulation’ experiments purposefully usesingle-colony bottlenecks at each transfer to maximize drift [17].In contrast, the more typical experimental evolution regimesmaintain an Ne often in the millions, allowing selection todominate [18,19]. To date, genome reductions found in theabove experiments have tended to be modest (up to 4% of thegenome in mutation accumulation experiments, and 1% in largerpopulations). The DNA loss rates observed have been low (,2 bpper generation), and the regions lost have largely been inconsistentacross lineages. With the exception of small (1.6–7 kb) deletions inthe ribose gene cluster of Escherichia coli [20], none of these genomereductions have been tested for their fitness effects. As such, itremains unclear whether these observed genome reductionsimparted an advantage in the selective environment, whetherfitness effects scale with the length of DNA removed, and/orwhether such events generate tradeoffs across other environments.
Here, we used experimental evolution to investigate the role oflarge-scale deletions in adaptation and specialization. We evolvedpopulations of the a-proteobacterium Methylobacterium extorquensAM1, a member of the dominant genera found on leaf surfaces[21,22]. Like other bacteria that utilize single-carbon (C1)compounds (e.g., methanol) as growth substrates, M. extorquensAM1 has also specialized to grow on a very limited array of multi-C compounds (e.g., succinate), and has been a model for exploringrapid metabolic specialization during adaptation [22]. Across 32populations evolved for 1500 generations in one of four differentnutrient regimes we found 80% of these deleted the same genomicregion that encompasses up to 10% of the genome. Byreconstructing these deletions under the ancestral genetic back-ground we have demonstrated that they rose in frequency due toselection; however, the advantage gained was not a generic effect
of shortening genome length, but was specific to the region lostand imparted an advantage (or disadvantage) that depended uponthe environment.
Results/Discussion
Adaptation of populations and identification of massive,parallel deletions
In order to examine the potential role of large-scale deletions inadaptation of M. extorquens AM1 we analyzed genome contentfrom replicate evolved populations. Eight parallel populationswere grown at a large Ne (,2.56108) in each of four differentnutrient regimes (32 populations in total): methanol, succinate,mixture of methanol and succinate, or alternating betweenmethanol and succinate. After 1500 generations, the evolvedpopulations increased fitness in their selective environments by 15to 37% compared to their wild-type ancestor (Figure S1). Asreported previously [22], a couple of these strains were actually lessfit than the ancestor, which likely represent genotypes that existdue to frequency-dependent interactions such as cross-feeding. Forcomparison, we also maintained 10 lineages on solid medium for1500 generations that we transferred through single-cell bottle-necks to maximize the strength of drift.
To determine the extent to which large-scale deletions contrib-uted to adaptation, we used comparative genomic hybridization(CGH) to uncover chromosomal changes in 44 isolates from the 32evolved populations (Table S1). Like many bacteria, the 6.9 Mbgenome of M. extorquens AM1 has multiple replicons of varying sizes(5.5 Mb chromosome, 1.3 Mb megaplasmid present at one copyper chromosome, and 3 plasmids between 25–44 kb presentbetween 1–3 copies per chromosome) [23], a total of 23 distinctdeletions were identified, some of which in more than one lineage(Table S2). Over 91% of the deletion events were due tohomologous recombination between matching sequence regions,and of these, 86% were between co-directional pairs of one of the142 insertion sequences (ISs) present in the genome of M. extorquensAM1 [23]. Most notable were the extensive, repeated changes to themegaplasmid: 36 of the 44 isolates screened by CGH containeddeletions spanning a single region that ranged from 23 kb to 641 kb(Figure 1A). The largest of these deletions removed 24.7% of theaccessory genes (unique to M. extorquens AM1 versus strain DM4)[23] and 2.7% of shared, core genes. This represents the largestparallel losses observed during laboratory adaptation thus far.Previous experiments either observed an occasional large deletion(200 kb) [17] or repeated loss of small regions (,7 kb) [20].Applying a PCR-based screen to 56 additional isolates revealed 51more with deletions in this region (Table S1). Despite this overallparallelism, the precise borders of these deletions were somewhatdifferent. We broadly classified these into three classes of deletiontypes (DT1, 2, and 3; Figure 1A). A DT1 event with bordersprecisely at a co-directional pair of ISs had been independentlyidentified by genome re-sequencing of a methanol-evolved isolatefrom a population initiated with a different starting genotype [24].These deletion types were present at significantly differentproportions across the four nutrient regimes (Figure 1B). Moreover,since distinct subtypes of deletions coexisted in some populations atchanging frequencies (Figure 1B and Text S1), the larger deletionsmay have occurred stepwise, as proposed for similar events in thegenomes of B. aphidicola strains [25].
Large-scale deletions were beneficial in the selectiveenvironments they arose
The observed parallelism across replicates could be due to eitheran unusually high rate of occurrence and/or a selective advantage
Author Summary
Many free-living bacteria are known to commonly loselarge portions of their genomes, but it is unclear whatevolutionary forces drive these changes. Is this due torandom loss in small populations, as is thought to be thecase for the extreme genome degradation of intracellularsymbionts, or due to selection? And if it is beneficial, is itdirectly caused by replicating a shorter genome oradvantageous loss of the genes themselves? We uncov-ered that most replicate populations of Methylobacteriumextorquens AM1 evolved in the laboratory for 1,500generations lost nearly 10% of their genome. Throughreconstructing these deletions, we demonstrated thatthese losses were indeed beneficial, but the advantagedid not scale with length of genome lost, and were evendeleterious in alternative environments. These findingssuggest that the initial stages of genome shrinkage maybe driven by selection, ultimately leading to a morestreamlined, specialized organism.
Selection for Genome Reduction during Adaptation
PLoS Genetics | www.plosgenetics.org 2 May 2012 | Volume 8 | Issue 5 | e1002651

Figure 1. Parallel deletions on megaplasmid found in evolved isolates. (A) Deletions detected by CGH arrays. Each arc represents thedeleted region in an isolate with the color indicating the selective environment: pink, M (methanol); blue, S (succinate); purple, MS(methanol+succinate); green, M/S (alternating methanol/succinate). Observed deletion types (DT1, 2, and 3) were classified by PCR detectionusing 4 pairs of primers in region R1, R2, R3 or R4 (black bars from left to right) and are shown as the outside arcs with dashed lines indicating theranges of edges for subtypes. DT1a: all 4 pairs gave negative results (dark blue). DT1b: R1, R2, and R3 negative R4 positive (light blue). DT2: R1 and R2came back negative but R3 and R4 were positive (light green). DT3a: only one isolate had this deletion, which was detected by the arrays (brown).DT3b: R1, R2 and R4 came back positive but R3 was negative (not shown in Figure 1A). (Methods, Tables S1 and S3). Successive circles from inside tooutside: conserved region in M. extorquens DM4 and CM4 (dark grey), GC skew, predicted CDSs transcribed in the counterclockwise direction (blue),predicted CDSs in clockwise direction (red), GC% deviation, IS position (orange bar). (B) Frequency of deletion types in isolates from populations.Three or four isolates were obtained in each population (labeled columns sorted by number and type of deletions for clarity) and their deletion typeis indicated by color: DT1a, dark blue; DT1b, light blue; DT2, light green; DT3a, brown; DT3b, light brown.doi:10.1371/journal.pgen.1002651.g001
Selection for Genome Reduction during Adaptation
PLoS Genetics | www.plosgenetics.org 3 May 2012 | Volume 8 | Issue 5 | e1002651

conferred by the events themselves. For example, the paralleldeletions of regions of the ribose operon of glucose-evolved E. coliwere shown to partly depend upon a high rate of transposition andsubsequent recombination [20]. To address this possibility, weexamined the 10 populations transferred through single-colonybottlenecks for 1500 generations. None of the defined deletiontypes were detected by PCR, which is significantly unlikely to beobserved given the rate they appeared in the large Ne populations(P,0.0001) (Text S1).
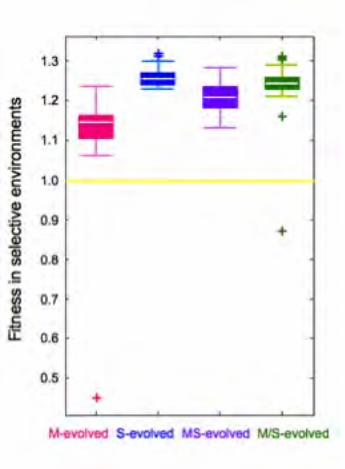
In order to directly test for a possible selective advantage ofthese deletions, we reconstructed deletions in the wild-typeancestor and tested whether these were individually beneficial intheir selective environments. We created four deletions thatrepresent the largest class found (engineered type 1, ET1), the halfof ET1 that was commonly lost (ET2), a small region, itself onlyobserved once, at the intersection of all identified deletions (ET3),and a fourth region (ET4) that, although never observed to be lostin the evolved populations, removed the alternative half of DT1and was equivalent in length to ET2 (both ,300 kb) (Figure 2A).With the exception of ET3 in the methanol/succinate switchingenvironment, all deletion types were individually beneficial in theselective environments that they were observed in, with up to a15% selective advantage for ET1 in succinate medium (Figure 2B).The nearly neutral fitness effect of ET3 indicated that thebeneficial effect was not due to removing this shared region.Interestingly, the fitness effect of ET1 was approximately the sameas expected from the two half deletions (ET2 and ET4), suggestingthat there is little epistasis between these two regions (Figure S2and Text S1).
The selective advantage of gene loss is not due to ashorter genome and leads to tradeoffs in alternativeenvironments
Two lines of evidence refuted the hypothesis that thephysiological basis of the fitness advantage of the large-scaledeletions was simply due to a shorter genome, and rathersuggested that loss of specific gene(s) was the primary benefit.The streamlining hypothesis that genome reduction is driven bymetabolic efficiency of a shorter genome would predict that: 1) themagnitude of benefit would scale with size of the deletion and 2)the benefit would be reasonably similar across multiple environ-ments. First, we found that selective advantage did not correlatewith deletion size. This is most clearly demonstrated by comparingET2 and ET4, which have equivalent lengths. These two ,300 kbdeletions exert quite different effects, whereas ET1 (which is twiceas large) and ET4 behaved quite similarly. Second, we found that,although the marginal benefits of ET2 and ET3 were relativelyconstant across different growth substrates, but the phenotype ofET1 and ET4 varied markedly. This included being a disadvan-tage during growth on methanol when transferred from succinate,which appears to be due to a longer transition time betweennutrients and decreased fitness during stationary phase onsuccinate (Figure 2C, 2D and Figure S3). This result is inconsistent with a recent report where no correlation betweengenome size and selection intensity was found across a variety ofnatural isolated bacteria [26]. The high prevalence of observingDT1 in populations evolved in succinate and the methanol-succinate mixture is in accord with the above phenotypes, butother factors such as epistatic interactions with previous mutations
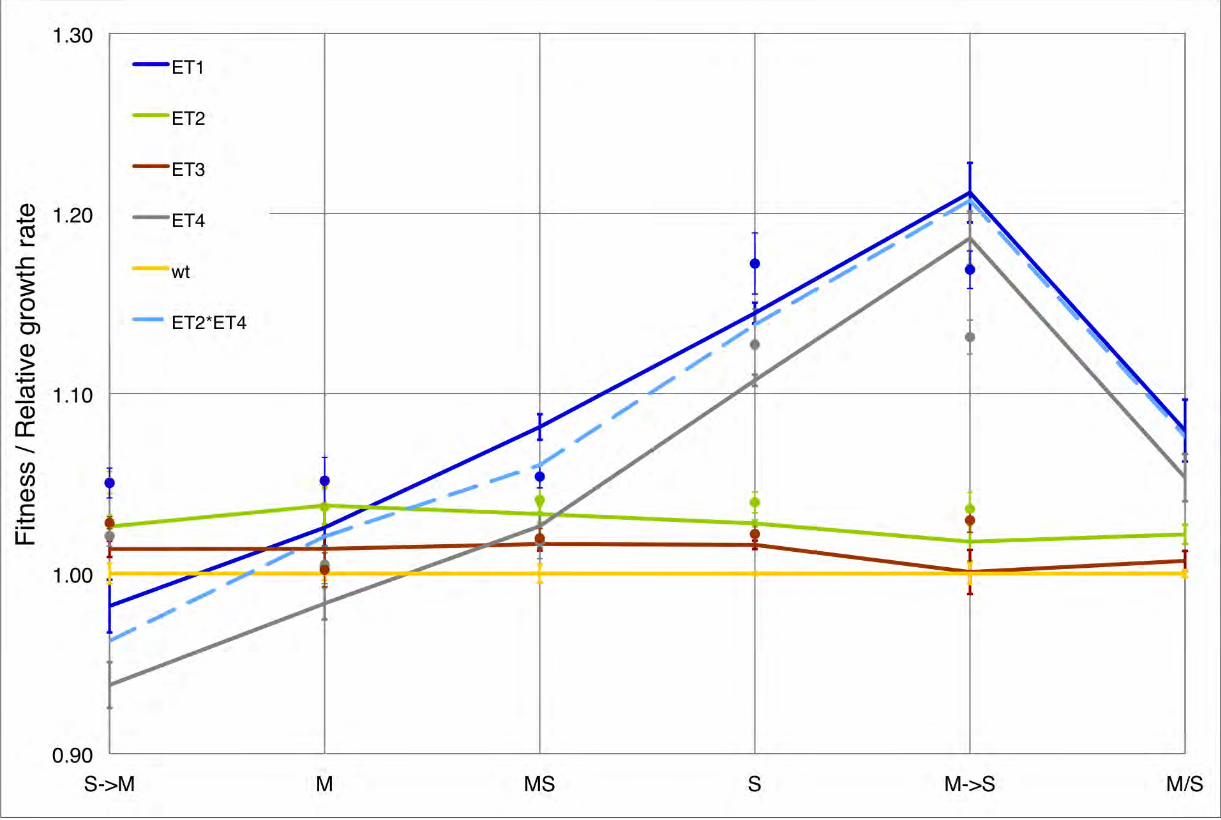
Figure 2. Phenotypes of deletion mutants. (A) Schematic view of engineered deletion mutants. Each arc represents the deleted region in themutant ET1 (dark blue), ET2 (green), ET3 (brown) and ET4 (grey). (B) Reaction norms of fitness for deletion mutants and wild type in 4 selectiveenvironments: M, S, MS, M/S, and each half-environment of M/S (MRS and SRM). (C) Transition time from S to M. (D) Fitness cost at stationary phaseestimated as the fitness drop from hour 28 to hour 48. (E–G) Succinate-grown cultures with the following treatments: E, ampicillin (12.5 mg/mL); F,arsenate (30 mM); G, 36uC. Relative growth rate or final OD600 (optical density) was calculated as the ratio of with and without treatment. Error barsrepresent 95% confidence intervals and significant differences from wild-type are indicated by *(P,0.05).doi:10.1371/journal.pgen.1002651.g002
Selection for Genome Reduction during Adaptation
PLoS Genetics | www.plosgenetics.org 4 May 2012 | Volume 8 | Issue 5 | e1002651
may account for the surprisingly high frequencies of DT1 inmethanol and low frequency in methanol/succinate switchingenvironments. Given that the various deletions appeared (abovethe limit of detection) in the second half of this 1500 generationexperiment, other mutations would have already been present thatmay alter the selective effect of these losses (Text S1).
Although the large-scale deletions from the megaplasmid of M.extorquens AM1 were beneficial in the laboratory environment,further tradeoffs suggest that loss of this region would haveconsequences in natural environments. Unlike regular plasmids,megaplasmids and minichromosomes (or ‘chromids’) are long-term replicons residing in more than 10% of bacterial genomesacross markedly different life styles [27]. The GC%, codingdensity and the percentage of repeat region of the megaplasmid inAM1 are compatible with the main chromosome but very differentfrom the other 3 small plasmids present in this genome, indicatingits long-term existence in this strain. We first examined thepotential functions of the megaplasmid by COG analysis, whichshowed an overrepresentation of genes related to metabolicfunctions in deleted regions (X2 test, P,0.0001, Figure S4). Thisis consistent with the observation of other reduced genomes [7].Furthermore, the predicted functions of the genes encoded withinthe deleted regions were consistent with a lack of essentiality due toduplicate copies of potentially essential genes on the mainchromosome. Indeed, with a fairly liberal definition of homology(minLrap$0.8; maxLrap$0; identity$60%) there are 159 geneson the megaplasmid that have the homologs on the mainchromosome. As 113 of these are found in DT1, a significantoverrepresentation relative to the rest of the megaplasmid (X2 test,P,0.0001), and all regions with synteny with the chromosome forten or more genes are located in the deleted region, some of thebenefit may have come from removing these possible redundan-cies. On the other hand, many genes putatively involved in stressresponses would have been lost (Table S5). We therefore tested thedeletion types across a panel of stresses, revealing that ET1 andET4 had decreased resistance to ampicillin and arsenate (Figure 2Eand 2F), and increased growth at the upper end of the temperaturerange of M. extorquens AM1 (Figure 2G). The loss of two sigmafactors (Figure S5) and genes shown to be involved in leaf surfacecolonization [28] by these deletions lends further support thatsome of these genes contributed to the ecology of this strain.
ConclusionsThese data have provided a rare opportunity to demonstrate
that selection for gene loss contributed to the repeated, large-scaleremoval of accessory functions from adapting genomes. Theselection regime we applied was a seasonal environment of growthand starvation, but since only one or two supplied resources and allother environmental factors were held constant, this renderedmany functions unnecessary. It is quite common for plasmidsbearing antibiotic resistance genes or toxins to be lost when thesefunctions go unrewarded; however, this process differs substan-tially what is described here in terms of the scale of genomechange, the presence of genes that would be essential if it were notfor a duplicate copy, as well as the mechanism of loss (unfaithfulsegregation vs. homologous recombination).
Given that so many genes were lost in these deletion events,future work will be required to pin down whether few or manygenes contribute to the observed phenotypes and by how much.Numerous stress response genes were lost in these events, and ithas been in multiple cases that there can be tradeoffs betweengrowth capacity and stress response in environments ranging fromchemostats [29] to long-term stationary phase [30]. Similarly, thedeletions that sped growth on most substrates led to an impaired
capacity to deal with nutrient switches, starvation, and the toxiceffects of an antibiotic and a toxic metal. Although these large-scale losses were successful due to the benefit they conferred in theflask, it is quite likely that they would impart tradeoffs incomponents of the natural environment inhabited by Methylobac-terium.
Selection-driven loss of accessory genes can rapidly limit theniche of a given lineage, resulting in restricted lifestyle andlowering both Ne and access to horizontal gene transfer with othermembers of the species. Indeed, aspects of our laboratoryconditions and starting strain - a sudden restriction in nichebreadth and now unnecessary accessory functions present incontiguous islands - commonly occurs in natural environments,such as the establishment of chronic infections by opportunisticpathogens where analogous deletion events have been identified[13–15]. Smaller, more isolated populations in which purifyingselection for previously useful functions is absent can lead tofurther genome reductions as drift becomes increasingly relevant.Thus, although in other scenarios bottlenecks leading to loss offunctions via drift could initiate specialization, our resultsemphasize the potential for selection-driven, large-scale deletionsof unnecessary genes as a route towards a limited niche and thebeginning of a path leading to further genome changes.
Materials and Methods
Experimental evolution populationsThis paper examines isolates from 32 populations that were
founded from two nearly isogenic strains of wild-type Methylobac-terium extorquens AM1, CM501 and CM502, which have pink andwhite colony color, respectively [31]. These populations evolved infour different environments each with 8 replicates (odd numbersfounded by CM501; even by CM502): methanol (M, 15 mM, ‘A’populations), succinate (S, 3.5 mM, ‘B’ populations), a mixture(MS) of methanol (7.5 mM) and succinate (1.75 mM) (‘C’populations), and alternating (M/S) between methanol (15 mM)and succinate (3.5 mM) (‘D’ populations). The general selectiveregime, minimal medium and culturing conditions utilized weredescribed previously along with the initial examination of thedynamics of adaptation and specialization of the A and Bpopulations [22]. The C and D populations were evolved in thesame conditions except for the mixed or alternating substrateconditions. Briefly, populations were grown in 9.6 mL of mediumand cultured at 30uC in 50 mL flasks with 225 rpm shaking. Serialtransfers were performed every 48 hours using 1/64 dilutions (i.e.,6 generations) with a population size at the end of each cycle of,26109. Three or four evolved isolates were obtained fromgeneration 1500 of each population with preference for differentcolony morphologies, where apparent. From each population, oneor two isolate(s) were chosen to test in genomic microarrayanalysis, and the remaining colonies were screened for deletionsvia PCR (Table S1).
Mutation accumulation systemTen mutation accumulation lines were founded by CM501 and
prorogated at 30uC on solid media comprised of half nutrient agarand half ‘hypho’ agar containing succinate (7.5 mM finalconcentration) [31] to allow rapid colony formation. For eachlineage, every 3.5 days the last colony on the streak line was pickedas a random sample and streaked on a new plate. The populationexpanded from one cell to approximately 106 cells in a colony eachpassage, representing ,20 generations, and was repeated 75 times(,1,500 generations).
Selection for Genome Reduction during Adaptation
PLoS Genetics | www.plosgenetics.org 5 May 2012 | Volume 8 | Issue 5 | e1002651
Deletion detection via comparative genomichybridization (CGH)
DNA isolation was performed using the Wizard Genomic DNAPurification Kit (Promega, Madison, WI) following the manufac-turer’s protocol. Deletions in evolved strains were identified usingcomparative genomic hybridization arrays performed by MOgeneInc. (St. Louis, MO), a certified Agilent service provider. Thecustom arrays spotted with the ancestor genome were designed,printed, and probed as described [32]. Without the necessity todetect quantitative signals, each sample was labeled with eitherCy3 or Cy5 and hybridized once with a sample labeled with theother dye. In total, 25 hybridizations were done for 45 samples (44evolved strains and the ancestor), including three controlexperiments (Table S2).
Deletion confirmation by PCR and sequencingTo confirm each deletion, one primer outside (p1 & p4) and
inside (p2 & p3) that region was designed for each side. Thedeletion was confirmed if fragment was amplified by p1 & p4 butno product was amplified by p1 & p2 or p3 & p4. For fragmentsshorter than 1 kb, exact junctions were verified via sequencing.Products longer than 1 kb were analyzed via restriction digests tocompare with the predicted patterns from the genome sequence.All confirmed deletions were consistent with array results. Theprecise junctions of all deletions on the main chromosome wereidentified except two of the deletions in CM1055 and CM1820due to the presence of multiple repeat elements around theirflanking regions. For the deletions on the megaplasmid, we onlyfocused on the parallel pattern of the deletions and did not confirmeach various subtype with their slightly different endpoints.
For detecting deletions in isolates not screened via CGH, wedesigned 4 pairs of primers to amplify regions across DT1, eachwith upstream and downstream pairs (Table S3). We classifiedisolates into 4 major types based on the PCR results (DT1 with 2subtypes): DT1a (negative results from all), DT1b (negative resultfrom R1, R2, and R3 and positive result from R4), DT2 (negativeresult from R1&R2 and positive result from R3&R4), DT4(positive result from R1&R2 and negative result from R3&R4; notfound in any population), and no deletion (positive results fromall). The deletion in CM1194 was categorized as DT3a based onthe array data; the deletion in CM1182 was categorized as DT3bbased on the negative result from R3 but positive results from theother 3.
Construction of deletion mutantsAllelic exchange plasmids for generating deletion mutants were
constructed based on pCM433, a sacB-based suicide vector [31].PCR products of regions upstream and downstream of eachdeletion were amplified and consecutively cloned into pCM433 togenerate pML4, pML5, pML7 and pML9 (Table S4). In order toreduce false-positives, a second selection marker, kan, with loxPexcision sites amplified from pCM184 [33] was introduced intoeach of the plasmids between the upstream and downstreamregions to generate pML10, pML11, pML12 and pML13,respectively (Table S4). Each of these donor plasmids was thenintroduced into the wide type strain (CM501) via triparentalconjugations as previously described [31]. Single-crossoverrecombinants were selected with tetracycline (Tet, 10 mg mL21)and then double-crossover recombinants were selected withkanamycin (Kan, 50 mg mL21) and sucrose (5% wt/vol.). Foreach deletion type, we saved three independent clones through thecloning steps. These were each confirmed by PCR to contain thecorrect deletion and all three were tested for a consistent
phenotype. The kan marker was then excised by cre recombinaseas before [33] to generate the desired unmarked deletion mutants(Table S1).
Growth and fitness assaysWe performed the growth and fitness assays following a
previously described procedure [22] with a few modifications.Briefly, three replicate cultures of each strain were inoculated andacclimated in minimal medium supplemented with carbonsources in 48-well plates (Corning, Lowell, MA) at 30uC,650 rpm, 1 mm orbit and a total volume of 640 mL in eachwell. Growth curves were then obtained by following the changein OD600 (Victor2 plate reader, Perkin Elmer, Waltham, MA).The transition time between growth phases observed duringgrowth on MS (M:S = 7:1) was estimated as before [34]. Growthrates and regression lines for each phase were calculated (Phase I:y = a1+b1x; Phase II: y = a2+b2x), the OD600 at the time oftransition (ODt) was determined as the average of two OD600
values with the minimum change during the transition phase, andthe effective transition time was obtained as the differencebetween the two time values (x1, x2) where the estimatedregression lines were equal to ODt.
Fitness of each strain was measured as before [22] by competingeach evolved or constructed strain against a fluorescently labeledancestor (CM1179) strain in 48-well plates with initial volumetricratio of 1:1. Due to the small fitness changes for certain strains,competition assays were run for 4 cycles of growth (i.e., 8 days).The ratio of non-fluorescent cells in mixed populations wasmeasured by passing population samples before (R0) and after 4cycles of competition growth (R4) through a BD LSR II flowcytometer (BD Biosciences, San Jose, CA). Fitness values (W) werecalculated by following equation:
W~lnR4:644
R0
! "#ln
1{R4ð Þ:644
1{R0
! "
To estimate the fitness cost on succinate during stationary phase,cultures were also sampled at hour 28 (early stationary phase),such that the fitness cost was estimated as the difference in fitnessvalues calculated between hours 0 to 28 vs. 0 to 48 (using 9replicates per strain).
General stress response assaysDisc diffusion assays were done to test for sensitivity on
formaldehyde, SDS, peroxide, a trace metal mix, salt, arsenateand amplicillin. Bacteria were grown to stationary phase(OD600,1.5) in regular hypho medium supplied with 36succinate (10.5 mM) . Five mL of this culture was mixed with60 mL of 42uC pre-warmed soft agar (0.75%, with 15 mMsuccinate), and 5 mL of this mixture was poured onto hypho agarplates with 15 mM succinate. Disks were placed at the center ofthe plates and aliquots (5 mL) of formaldehyde (37%), SDS (10%),peroxide (30%), a trace metal mix (10006) (Delaney et al.unpublished), NaCl (1 M), sodium arsenate (10% w/v) oramplicillin (100 mg/mL) were added on the filter discs. Diametersof growth inhibition were measured after 4 days.
Exponential-phase cells growing on succinate (OD600,0.5)were used in heat shock and UV resistance assays. Cells weretransferred to 55uC for 15 min for heat shock or exposed to312 nm UV light for 15 min for UV resistance assays. Suspensionswere then diluted and plated onto hypho agar containing 15 mMsuccinate, and colonies were counted after 4 days of 30uCincubation.
Selection for Genome Reduction during Adaptation
PLoS Genetics | www.plosgenetics.org 6 May 2012 | Volume 8 | Issue 5 | e1002651

Additionally, succinate-grown cultures were tested in liquidmedium with the following treatments: formaldehyde (1–5 mM),SDS (1021–1025%), peroxide (1021–1025%), trace metal mix (2–206), salt (5–500 mM), ampicillin (12.5–50 mg/mL), sodiumarsenate (20–50 mM), UV exposure prior to growth (1–20 min),or heat stress during growth (32–36uC). Final OD600 or relativegrowth rates were calculated as the ratio of treatment to control.
Supporting Information
Figure S1 Average fitness increase of evolved populations intheir selective environments. The boxplot shows the mean andvariation of 25 isolates in each environment. Average fitnessincreases are 14.5%, 26.0%, 20.7%, 24.8% for A (M), B (S), C(MS) and D (M/S) populations, respectively. As reportedpreviously [22], a couple of these strains were actually less fitthan the ancestor, which likely represent genotypes that exist dueto frequency-dependent interactions such as cross-feeding.(TIF)
Figure S2 Relative growth rates and additive effects in fitnessvalues of ET2 and ET4 in various environments. Dots representthe relative growth rates of mutants in all 5 environments,calculated as the ratio to the wild-type. Error bars represent 95%confidence intervals. Similar patterns were found as in fitnessvalues except in SRM and MRS where the fitness of ET1 andET4 change significantly but the growth rates remain the same,when compared to the corresponding environment (M and S,respectively). The light blue dash line represents the product offitness values for ET2 and ET4, which is not significantly differentfrom the fitness values of ET1 in all environments. The resultindicates ‘non-epistatic’ interaction between ET2 and ET4; theproportional effect of ET2 and ET4 is unchanged when presenttogether in ET1.(TIF)
Figure S3 Viable counts of selected deletion mutants in 4environments (M, S, MRS, SRM). All mutants and wild typehave similar viable counts even after 96 hours. Less than 15%drop of viable counts was observed for all mutants.(TIF)
Figure S4 Functional analysis of DT1 versus undeleted regionon the megaplsmid. The number of ORFs for each major
functional category was calculated based on COG classification.There are substantially more metabolic related genes in DT1region than the undeleted region.(TIF)
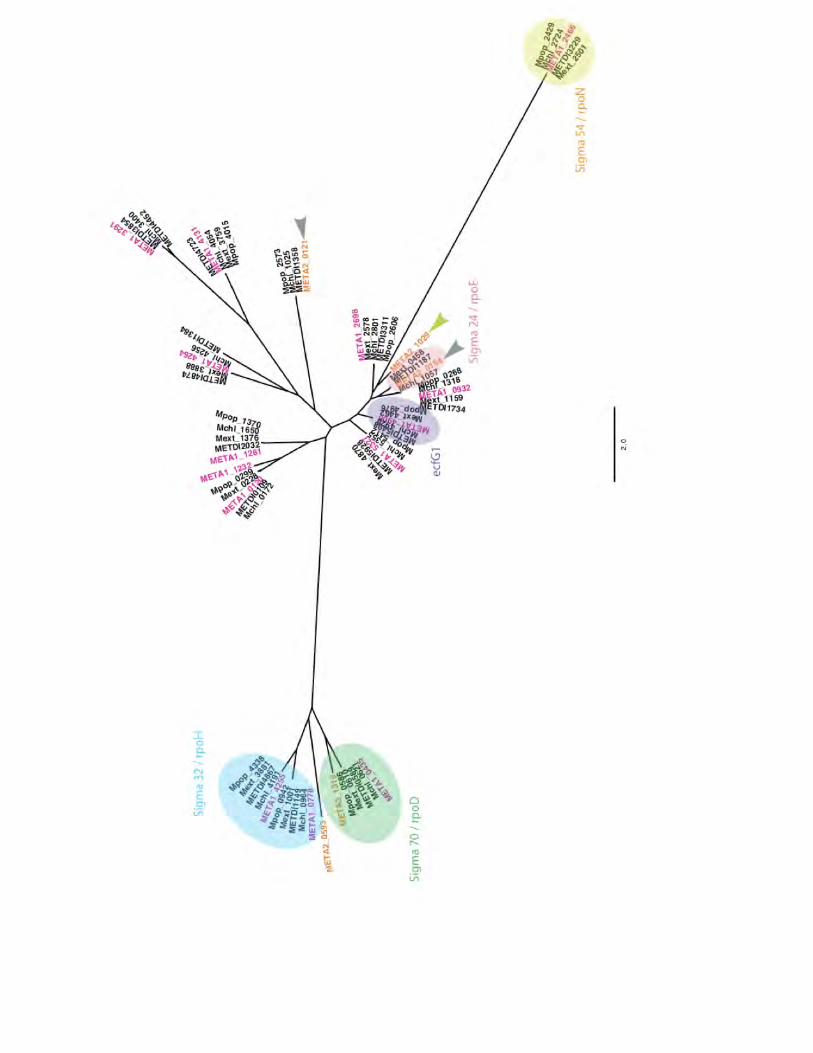
Figure S5 Phylogeny of sigma factors in M. extorquens AM1(META1, pink text; META2, orange text) and closely relatedstrains: M. extorquens DM4 (METDI), CM4 (Mchl), PA1 (Mext), M.populi BJ001 (Mpop). Five groups of sigma factors are coloredbased on the annotation. Arrows indicate the sigma factors whichlocate in the region of ET2 (green) and ET4 (grey). META2_0154(ECF type) and META2_0121 (sigma 24) are conserved in all M.extorquens strains, suggesting a potential function of those two sigmafactors.(TIF)
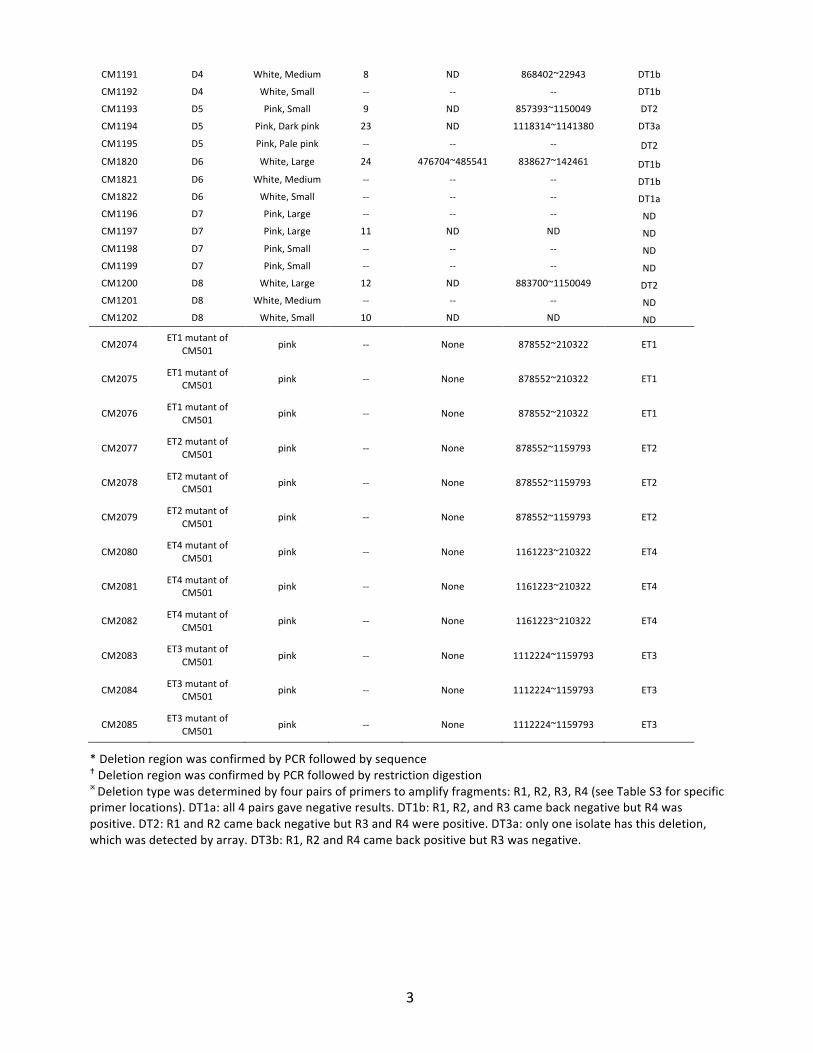
Table S1 Methylobacterium strains used in the study.(DOCX)
Table S2 Deletions detected by CGH arrays.(DOCX)
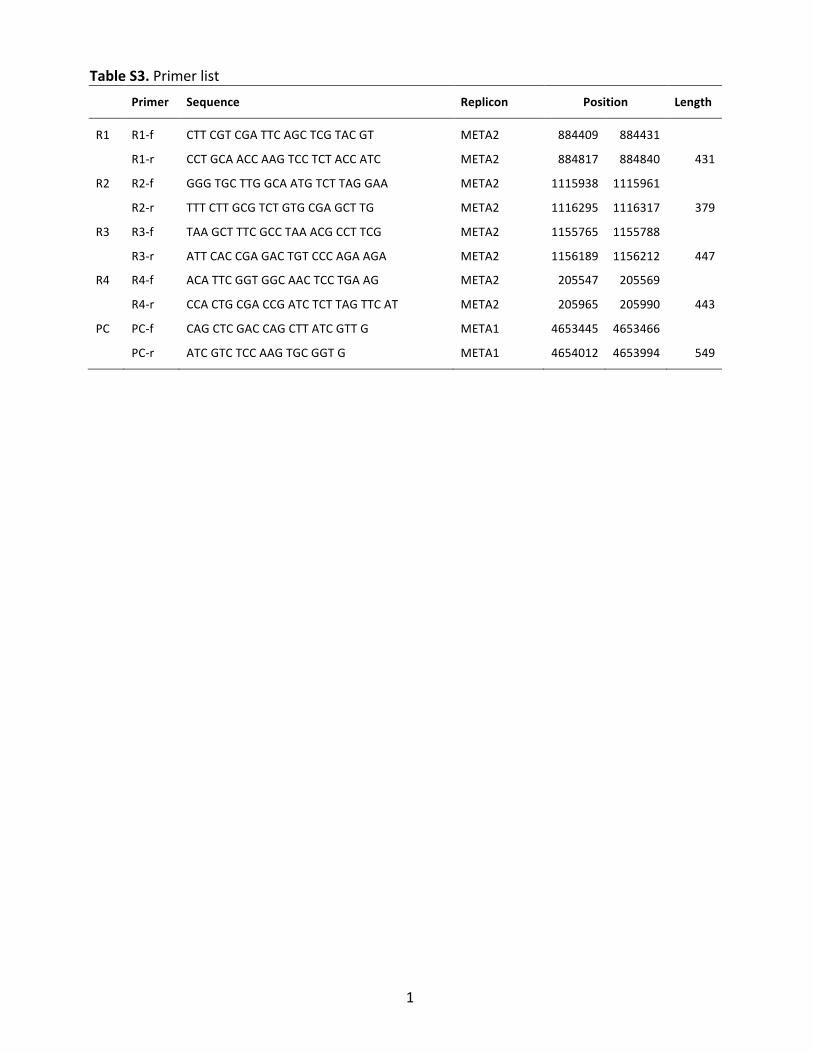
Table S3 Primer list.(DOCX)
Table S4 Plasmid list.(DOCX)
Table S5 Functional gene list within deletion region.(DOCX)
Text S1(DOCX)
Acknowledgments
We thank members of the Marx lab, Colleen Cavanaugh, Vanja Klepac-Ceraj, and Chin-Horng Kuo for discussions and comments on themanuscript and Shaukat Rangwala for exemplary service while handlingour CGH arrays.
Author Contributions
Conceived and designed the experiments: M-CL CJM. Performed theexperiments: M-CL CJM. Analyzed the data: M-CL CJM. Contributedreagents/materials/analysis tools: M-CL CJM. Wrote the paper: M-CLCJM.
References
1. Kuo C, Moran NA, Ochman H (2009) The consequences of genetic drift forbacterial genome complexity. Genome Res 19: 1450–1454.
2. Lynch M (2006) Streamlining and simplification of microbial genomearchitecture. Annu Rev Microbiol 60: 327–349.
3. Lawrence JG, Ochman H (1998) Molecular archaeology of the Escherichia coligenome. Proc Natl Acad Sci USA 95: 9413–9417.
4. Welch RA, Burland V, Plunkett G, Redford P, Roesch P, et al. (2002) Extensivemosaic structure revealed by the complete genome sequence of uropathogenicEscherichia coli. Proc Natl Acad Sci USA 99: 17020–17024.
5. Lan R, Reeves PR (2000) Intraspecies variation in bacterial genomes: the needfor a species genome concept. Trends Microbiol 8: 396–401.
6. Moran NA, Mira A (2001) The process of genome shrinkage in the obligatesymbiont Buchnera aphidicola. Genome Biol 2: research0054.
7. Moran NA (2002) Microbial minimalism: Genome reduction in bacterialpathogens. Cell 108: 583–586.
8. Ochman H, Moran NA (2001) Genes lost and genes found: evolution ofbacterial pathogenesis and symbiosis. Science 292: 1096–1099.
9. McCutcheon JP, Moran NA (2011) Extreme genome reduction in symbioticbacteria. Nat Rev Microbiol 10: 13–26.
10. Dufresne A, Garczarek L, Partensky F (2005) Accelerated evolution associatedwith genome reduction in a free-living prokaryote. Genome Biol 6: R14.
11. Giovannoni SJ, Tripp HJ, Givan S, Podar M, Vergin KL, et al. (2005) Genomestreamlining in a cosmopolitan oceanic bacterium. Science 309: 1242–1245.
12. Frost LS, Leplae R, Summers AO, Toussaint A (2005) Mobile genetic elements:the agents of open source evolution. Nat Rev Microbiol 3: 722–732.
13. Cramer N, Klockgether J, Wrasman K, Schmidt M, Davenport CF, et al. (2011)Microevolution of the major common Pseudomonas aeruginosa clones C and PA14in cystic fibrosis lungs. Environ Microbiol 13: 1690–1704.
14. Ernst RK, D’Argenio DA, Ichikawa JK, Bangera MG, Selgrade S, et al. (2003)Genome mosaicism is conserved but not unique in Pseudomonas aeruginosa isolatesfrom the airways of young children with cystic fibrosis. Environ Microbiol 5:1341–1349.
15. Smith EE, Buckley DG, Wu Z, Saenphimmachak C, Hoffman LR, et al. (2006)Genetic adaptation by Pseudomonas aeruginosa to the airways of cystic fibrosispatients. Proc Natl Acad Sci USA 103: 8487–8492.
16. Maurelli AT, Fernandez RE, Bloch CA, Rode CK, Fasano A (1998) ‘‘Blackholes’’ and bacterial pathogenicity: a large genomic deletion that enhances thevirulence of Shigella spp. and enteroinvasive Escherichia coli. Proc Natl Acad SciUSA 95: 3943–3948.
17. Nilsson A, Koskiniemi S, Eriksson S, Kugelberg E, Hinton J, et al. (2005)Bacterial genome size reduction by experimental evolution. Proc Natl Acad SciUSA 102: 12112–12116.
Selection for Genome Reduction during Adaptation
PLoS Genetics | www.plosgenetics.org 7 May 2012 | Volume 8 | Issue 5 | e1002651
18. Barrick JE, Yu DS, Yoon SH, Jeong H, Oh TK, et al. (2009) Genome evolutionand adaptation in a long-term experiment with Escherichia coli. Nature 461:1243–1247.
19. Zhong S, Khodursky A, Dykhuizen DE, Dean AM (2004) Evolutionarygenomics of ecological specialization. Proc Natl Acad Sci USA 101:11719–11724.
20. Cooper VS, Schneider D, Blot M, Lenski RE (2001) Mechanisms causing rapidand parallel losses of ribose catabolism in evolving populations of Escherichia coliB. J Bacteriol 183: 2834–2841.
21. Delmotte N, Knief C, Chaffron S, Innerebner G, Roschitzki B, et al. (2009)Community proteogenomics reveals insights into the physiology of phyllospherebacteria. Proc Natl Acad Sci USA 106: 16428–16433.
22. Lee M-C, Chou H-H, Marx CJ (2009) Asymmetric, bimodal trade-offs duringadaptation of Methylobacterium to distinct growth substrates. Evolution 63:2816–2830.
23. Vuilleumier S, Chistoserdova L, Lee M-C, Bringel F, Lajus A, et al. (2009)Methylobacterium genome sequences: a reference blueprint to investigate microbialmetabolism of c1 compounds from natural and industrial sources. PLoS ONE 4:e5584.
24. Chou H-H, Chiu H-C, Delaney NF, Segre D, Marx CJ (2011) Diminishingreturns epistasis among beneficial mutations decelerates adaptation. Science332: 1190–1192.
25. Moran NA, McLaughlin HJ, Sorek R (2009) The dynamics and time scale ofongoing genomic erosion in symbiotic bacteria. Science 323: 379–382.
26. Novichkov PS, Wolf YI, Dubchak I, Koonin EV (2009) Trends in prokaryoticevolution revealed by comparison of closely related bacterial and archaealgenomes. J Bacteriol 191: 65–73.
27. Harrison PW, Lower RPJ, Kim NKD, Young JPW (2010) Introducing thebacterial ‘chromid’: not a chromosome, not a plasmid. Trends Microbiol 18:141–148.
28. Gourion B, Rossignol M, Vorholt JA (2006) A proteomic study ofMethylobacterium extorquens reveals a response regulator essential for epiphyticgrowth. Proc Natl Acad Sci USA 103: 13186–13191.
29. Notley-McRobb L, King T, Ferenci T (2002) rpoS mutations and loss of generalstress resistance in Escherichia coli populations as a consequence of conflictbetween competing stress responses. J Bacteriol 184: 806–811.
30. Finkel SE (2006) Long-term survival during stationary phase: evolution and theGASP phenotype. Nat Rev Microbiol 4: 113–120.
31. Marx C (2008) Development of a broad-host-range sacB-based vector forunmarked allelic exchange. BMC Res Notes 1: 1.
32. Okubo Y, Skovran E, Guo X, Sivam D, Lidstrom ME (2007) Implementation ofmicroarrays for Methylobacterium extorquens AM1. Omics 11: 325–340.
33. Marx CJ, Lidstrom ME (2002) Broad-host-range cre-lox system for antibioticmarker recycling in gram-negative bacteria. Biotechniques 33: 1062–1067.
34. Vasi F, Travisano M, Lenski RE (1994) Long-term experimental evolution inEscherichia coli. II. Changes in life-history traits during adaptation to a seasonalenvironment. Am Nat 144: 432–456.
Selection for Genome Reduction during Adaptation
PLoS Genetics | www.plosgenetics.org 8 May 2012 | Volume 8 | Issue 5 | e1002651


1
Table&S1."Methylobacterium"strains"used"in"the"study"
Strain" Source"Colony"
Morphology"
Hybridization"
pair"
Deletion"region"
Chromosome"
(META1)"
Deletion"region"
Megaplasmid"
(META2)"
Big"deletion"type"
determined"by"
PCR!"
CM501" Ancestor" Pink" 3,4,25" None" None" KK"
CM502" Ancestor" White" KK" None" None" KK"
CM1203" CM501,"ΔhprA" Pink" 1" None" None" KK"
CM1027" A1" Pink,"Large" KK" KK" KK" DT1a"
CM1028" A1" Pink,"Medium" 13"3908875~3921127
*"
822917~844898"
881288~206285""
DT1a"
CM1029" A1" Pink,"Small" KK" KK" KK" DT1a"
CM1030" A2" White,"Large" 21" ND" 881288~206285"" DT1a"
CM1031" A2" White,"Medium" KK" KK" KK" DT1a"
CM1032" A2" White,"Small" 14" ND" 838627~211269" DT1a"
CM1033" A3" Pink,"Large" KK" KK" KK" DT1a"
CM1034" A3" Pink,"Medium" 15"3894244~3955912
*"ND" ND"
CM1035" A3" Pink,"Small" KK" KK" KK" ND"
CM1036" A4" White,"Large" 16" ND" 857393~168962" DT1b"
CM1037" A4" White,"Medium" KK" KK" KK" DT1b"
CM1038" A4" White,"Small" KK" KK" KK" DT1b"
CM1039" A5" Pink,"Large" KK" KK" KK" ND"
CM1040" A5" Pink,"Small" KK" KK" KK" ND"
CM1041" A5" Pink,"Dark"pink" 22" ND" 855329~211852"" DT1a"
CM1042" A5" Pink,"Pale"pink" 17" ND" ND" ND"
CM1043" A6" White,"Large" 18" ND" 881288~206285"" DT1a"
CM1044" A6" White,"Medium" 2" ND"281915~306778*"
881288~206285""
DT1a"
CM1045" A6" White,"Small" KK" KK" KK" DT1a"
CM1046" A7" Pink,"Large" 19" ND" ND" ND"
CM1047" A7" Pink,"Medium" KK" KK" KK" DT1a"
CM1048" A7" Pink,"Small" KK" KK" KK" DT1a"
CM1049" A8" White,"Large" KK" KK" KK" ND"
CM1050" A8" White,"Medium" 20" ND" 826162~205962" DT1a"
CM1051" A8" White,"Small" KK" KK" KK" DT1a"
CM1086" B1" Pink,"Large" KK" KK" KK" DT1a"
CM1087" B1" Pink,"Small" 13"3894244~3955912
*"881288~206285
""
DT1a"
CM1088" B1" Pink,"Pale"pink" KK" KK" KK" DT1a"
CM1089" B2" White,"Large" KK" KK" KK" DT1a"
CM1090" B2" White,"Medium" 14" ND" 881288~206285"" DT1a"
CM1091" B2" White,"Small" KK" KK" KK" DT1a"
CM1092" B3" Pink,"Large" KK" KK" KK" DT1a"
CM1093" B3" Pink,"Medium" KK" KK" KK" DT1a"
CM1094" B3" Pink,"Small" 15" ND" 881288~206285"" DT1a"
CM1095" B4" White,"Large" 16"4133302~4147632
*"855329~211852
""
DT1a"
CM1096" B4" White,"Medium" KK" KK" KK" DT1a"
CM1097" B4" White,"Small" 2"
4133302~4147632
*"
3894244~3955912
*"
855329~211852""
DT1a"
CM1098" B5" Pink,"Small" 17"4133303~4155430
*"855329~211852
""
DT1a"
CM1099" B5" Pink,"Dark"pink" 21" 3894244~3955912 855329~211852"" DT1a"

2
*"4133303~4155430
*"CM1100" B5" Pink,"Pale"pink" KK" KK" KK" DT1a"CM1104" B6" White,"Large" 22" ND" 881288~206285"" DT1a"CM1105" B6" White,"Medium" 18" ND" 881288~206285"" DT1a"CM1106" B6" White,"Small" KK" KK" KK" DT1a"CM1107" B6" White,"Small" KK" KK" KK" DT1a"CM1101" B7" Pink,"Large" KK" KK" KK" DT2"CM1102" B7" Pink,"Medium" KK" KK" KK" DT2"CM1103" B7" Pink,"Small" 19" ND" 883700~70551" DT1b"CM1108" B8" White,"Large" KK" KK" KK" DT1b"CM1109" B8" White,"Medium" 20" ND" 855329~211852"" DT1a"CM1110" B8" White,"Small" KK" KK" KK" DT1a"CM1052" C1" Pink,"Large" KK" KK" KK" DT2"CM1053" C1" Pink,"Medium" 23" ND" 883700~1150049" DT2"
CM1054" C1" Pink,"Small" 3,5"
2877651~2907157""
3894244~3955912*"
881288~206285""
DT1a"CM1055" C2" White,"Large" 6" 63646~80725" 881288~206285"" DT1a"CM1056" C2" White,"Large" KK" KK" KK" DT1a"CM1057" C2" White,"Small" KK" KK" KK" DT1a"CM1058" C2" White,"Small" KK" KK" KK" DT1a"CM1059" C3" Pink,"Large" KK" KK" KK" DT1a"CM1060" C3" Pink,"Medium" 7" ND" 881288~206285"" DT1a"CM1061" C3" Pink,"Small" KK" KK" KK" DT1a"CM1062" C4" White,"Large" 24" ND" 881288~206285"" DT1a"CM1063" C4" White,"Medium" 8" ND" 881288~206285"" DT1a"CM1064" C4" White,"Small" KK" KK" KK" DT1a"CM1065" C5" Pink,"Small" KK" KK" KK" DT1a"CM1066" C5" Pink,"Dark"pink" 9" ND" 881288~206285"" DT1a"CM1067" C5" Pink,"Pale"pink" KK" KK" KK" DT1a"
CM1068" C6" White,"Large" 10" 3894244~3955912*" 881288~206285"" DT1a"
CM1069" C6" White,"Medium" KK" KK" KK" DT1a"CM1070" C6" White,"Small" KK" KK" KK" DT1a"CM1071" C7" Pink,"Large" KK" KK" KK" DT1a"
CM1072" C7" Pink,"Medium" 11" 4133299~4160613*" 881288~206285"" DT1a"
CM1073" C7" Pink,"Small" 25" ND" 881288~206285"" DT1a"
CM1074" C8" White,"Large" 12"3894244~3955912
*" 826162~205962" DT1a"CM1075" C8" White,"Medium" KK" KK" KK" DT1a"CM1076" C8" White,"Small" KK" KK" KK" DT1a"CM1181" D1" Pink,"Large" 4,5" ND" ND" ND"
CM1182" D1" Pink,"Medium" KK" KK" KK" DT3b"CM1183" D1" Pink,"Small" KK" KK" KK" DT2"CM1184" D2" White,"Large" KK" KK" KK" DT2"CM1185" D2" White,"Large" KK" KK" KK" DT2"
CM1186" D2" White,"Small" 6" ND" 303859~318885"838627~1150049" DT2"
CM1187" D3" Pink,"Large" KK" KK" KK" DT1b"
CM1188" D3" Pink,"Medium" 7" ND" ND" ND"
CM1189" D3" Pink,"Small" 1" ND" ND" ND"
CM1190" D4" White,"Large" KK" KK" KK" DT2"
3
CM1191" D4" White,"Medium" 8" ND" 868402~22943" DT1b"
CM1192" D4" White,"Small" KK" KK" KK" DT1b"
CM1193" D5" Pink,"Small" 9" ND" 857393~1150049" DT2"
CM1194" D5" Pink,"Dark"pink" 23" ND" 1118314~1141380" DT3a"
CM1195" D5" Pink,"Pale"pink" KK" KK" KK" DT2"
CM1820" D6" White,"Large" 24" 476704~485541" 838627~142461" DT1b"
CM1821" D6" White,"Medium" KK" KK" KK" DT1b"
CM1822" D6" White,"Small" KK" KK" KK" DT1a"
CM1196" D7" Pink,"Large" KK" KK" KK" ND"
CM1197" D7" Pink,"Large" 11" ND" ND" ND"
CM1198" D7" Pink,"Small" KK" KK" KK" ND"
CM1199" D7" Pink,"Small" KK" KK" KK" ND"
CM1200" D8" White,"Large" 12" ND" 883700~1150049" DT2"
CM1201" D8" White,"Medium" KK" KK" KK" ND"
CM1202" D8" White,"Small" 10" ND" ND" ND"
CM2074"ET1"mutant"of"
CM501"pink" KK" None" 878552~210322" ET1"
CM2075"ET1"mutant"of"
CM501"pink" KK" None" 878552~210322" ET1"
CM2076"ET1"mutant"of"
CM501"pink" KK" None" 878552~210322" ET1"
CM2077"ET2"mutant"of"
CM501"pink" KK" None" 878552~1159793" ET2"
CM2078"ET2"mutant"of"
CM501"pink" KK" None" 878552~1159793" ET2"
CM2079"ET2"mutant"of"
CM501"pink" KK" None" 878552~1159793" ET2"
CM2080"ET4"mutant"of"
CM501"pink" KK" None" 1161223~210322" ET4"
CM2081"ET4"mutant"of"
CM501"pink" KK" None" 1161223~210322" ET4"
CM2082"ET4"mutant"of"
CM501"pink" KK" None" 1161223~210322" ET4"
CM2083"ET3"mutant"of"
CM501"pink" KK" None" 1112224~1159793" ET3"
CM2084"ET3"mutant"of"
CM501"pink" KK" None" 1112224~1159793" ET3"
CM2085"ET3"mutant"of"
CM501"pink" KK" None" 1112224~1159793" ET3"
*"Deletion"region"was"confirmed"by"PCR"followed"by"sequence""""Deletion"region"was"confirmed"by"PCR"followed"by"restriction"digestion"!"Deletion"type"was"determined"by"four"pairs"of"primers"to"amplify"fragments:"R1,"R2,"R3,"R4"(see"Table"S3"for"specific"primer"locations)."DT1a:"all"4"pairs"gave"negative"results."DT1b:"R1,"R2,"and"R3"came"back"negative"but"R4"was"positive."DT2:"R1"and"R2"came"back"negative"but"R3"and"R4"were"positive."DT3a:"only"one"isolate"has"this"deletion,"which"was"detected"by"array."DT3b:"R1,"R2"and"R4"came"back"positive"but"R3"was"negative."
"

1
Table&S2."Deletions"detected"by"CGH"arrays"
Replicon& Region& Length& Strain& Adjacent&IS!&
META1" 63646~80725" 17079" CM1055" ""
META1" 476704~485541" 8837" CM1820" ""
META1" 2877651~2907157" 29506" CM1054" ISMex15*2"
META1" 3894244~3955912" 61668" CM1034,"CM1087,"CM1054,"CM1068,"CM1074,"CM1099" Repeat*2"
META1" 3908875~3921127" 12252" CM1028" ISMex16*0"
META1" 4133302~4147632" 14330" CM1095§B4,"CM1097§B4" ISMex4*1"
META1" 4133303~4155430" 22127" CM1098§B5,"CM1099§B5" ISMex4*1"
META1" 4133299~4160613" 27314" CM1072" ISMex4*1"
META2" 281915~306778" 24863" CM1044" ISMex16*0"
META2" 303859~318885" 15026" CM1186" ISMex8*2"
META2" 826162~205962" 641260" CM1050,"CM1074" ISMex9*2"
META2" 838627~1150049" 311422" CM1186" ISMex5/ISMex10"*2"
META2" 838627~142461" 565294" CM1820" ISMex5/ISMex10"*1"
META2" 838627~211269" 634102" CM1032" ISMex5*2"
META2" 822917~844898" 21981" CM1028" ISMex9*1"
META2" 855329~211852" 617983"CM1041,"CM1095§B4,"CM1097§B4,"CM1098§B5,"CM1099§B5,"CM1109"
ISMex5*2"
META2" 857393~1150049" 292656" CM1193" ISMex5*1"
META2" 857393~168962" 573029" CM1036" ISMex5*1"
META2" 868402~22943" 416001" CM1191" ""
META2" 881288~206285" 586457"
CM1028,"CM1030,"CM1043§A6,"CM1044§A6,"CM1054,"CM1055,"CM1060,"CM1062§C4,"CM1063§C4,"CM1066,"CM1068,"CM1072§C7,"CM1073§C7,"CM1087,"CM1090,"CM1094,"CM1104§B6,"CM1105§B6"
ISMex3*2"
META2" 883700~1150049" 266349" CM1053,"CM1200" ISMex3*1"
META2" 883700~70551" 448311" CM1103" ISMex3*1"
META2" 1118314~1141380" 23068" CM1194" """!"Numbers"after"*"represent"the"IS"copy"number"in"the"ancestral"genome."Ex:"ISMex16*0"means"the"deletion"was"mediated"by"two"newly"inserted"ISMex16.""""No"IS"was"found"around"the"deletion"but"we"have"not"ruled"out"the"possibility"that"the"deletion"is"mediated"by"newly"inserted"IS"elements."§"Identical"deletions"detected"in"isolates"from"the"same"population"were"counted"as"single"event."In"total,"46"deletion"events"were"detected."Letters"after"§"indicate"the"population"number."
1
Table&S3."Primer"list"& Primer& Sequence& Replicon& Position& Length&
R1" R1,f" CTT"CGT"CGA"TTC"AGC"TCG"TAC"GT" META2" 884409" 884431" "
" R1,r" CCT"GCA"ACC"AAG"TCC"TCT"ACC"ATC" META2" 884817" 884840" 431"
R2" R2,f" GGG"TGC"TTG"GCA"ATG"TCT"TAG"GAA"" META2" 1115938" 1115961" "
" R2,r" TTT"CTT"GCG"TCT"GTG"CGA"GCT"TG" META2" 1116295" 1116317" 379"
R3" R3,f" TAA"GCT"TTC"GCC"TAA"ACG"CCT"TCG"" META2" 1155765" 1155788" "
" R3,r" ATT"CAC"CGA"GAC"TGT"CCC"AGA"AGA" META2" 1156189" 1156212" 447"
R4" R4,f" ACA"TTC"GGT"GGC"AAC"TCC"TGA"AG" META2" 205547" 205569" "
" R4,r" CCA"CTG"CGA"CCG"ATC"TCT"TAG"TTC"AT" META2" 205965" 205990" 443"
PC" PC,f" CAG"CTC"GAC"CAG"CTT"ATC"GTT"G" META1" 4653445" 4653466" "
" PC,r" ATC"GTC"TCC"AAG"TGC"GGT"G" META1" 4654012" 4653994" 549"
"

1
"
Table&S4."Plasmid"list"
Plasmid& Description&
pCM184" Broad3host"range"cre3lox"allelic"exch,"*AmpR,"KanR,"TetR""
pCM433" Broad3host3range"sacB3based"allelic"exchange"vector,"AmpR,"ChlR,"TetR"
pML3" pCM433"with"META2_877176~878552,"AmpR,"ChlR,"TetR"
pML4" pML3"with"META2_210322~211783,"AmpR,"ChlR,"TetR"
pML5" pML3"with"META2_1159793~1161223,"AmpR,"ChlR,"TetR"
pML6" pCM433"with"META2_210322~211783,"AmpR,"ChlR,"TetR"
pML7" pML6"with"META2_1159793~1161223,"AmpR,"ChlR,"TetR"
pML8" pCM433"with"META2_1110807~1112224,"AmpR,"ChlR,"TetR"
pML9" pML8"with"META2_1159793~1161223,"AmpR,"ChlR,"TetR"
pML10" pML4"with"loxP)Kan)loxP,"AmpR,"ChlR,"TetR,"KanR"
pML11" pML5"with"loxP)Kan)loxP,"AmpR,"ChlR,"TetR,"KanR"
pML12" pML7"with"loxP)Kan)loxP,"AmpR,"ChlR,"TetR,"KanR"
pML13" pML9"with"loxP)Kan)loxP,"AmpR,"ChlR,"TetR,"KanR"
*"Amp"(ampicillin),"Chl"(chloramphenicol),"Kan"(kanamycin),"Tet"(tetracycline)""""
1
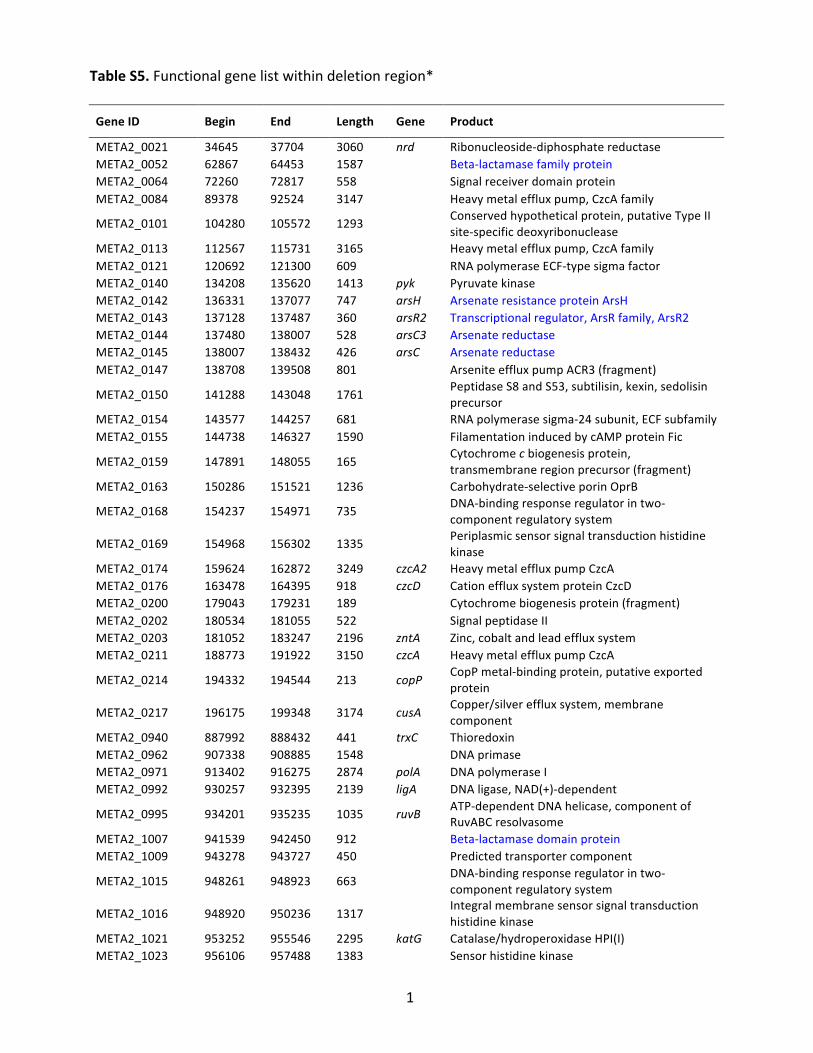
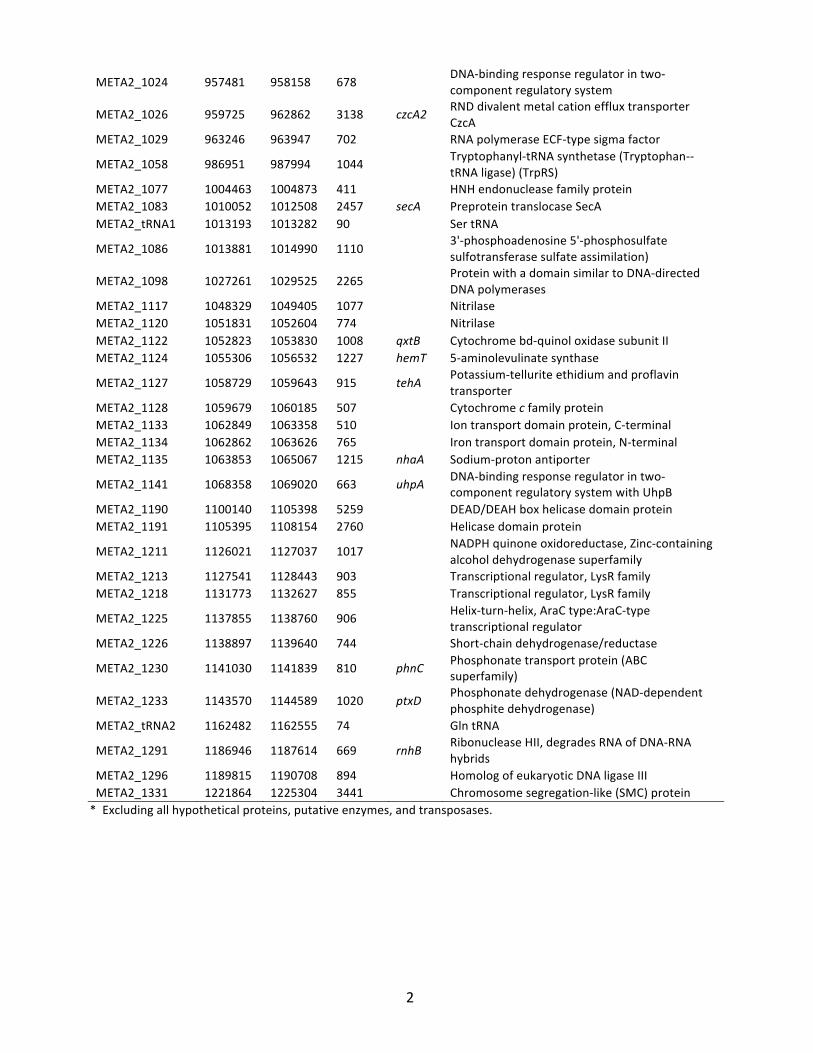
Table&S5."Functional"gene"list"within"deletion"region*""Gene&ID& Begin& End& Length& Gene& Product&
META2_0021" 34645" 37704" 3060" nrd$ RibonucleosideBdiphosphate"reductase"META2_0052" 62867" 64453" 1587" " BetaBlactamase"family"protein"META2_0064" 72260" 72817" 558" " Signal"receiver"domain"protein"META2_0084" 89378" 92524" 3147" " Heavy"metal"efflux"pump,"CzcA"family"
META2_0101" 104280" 105572" 1293" " Conserved"hypothetical"protein,"putative"Type"II"siteBspecific"deoxyribonuclease"
META2_0113" 112567" 115731" 3165" " Heavy"metal"efflux"pump,"CzcA"family"META2_0121" 120692" 121300" 609" " RNA"polymerase"ECFBtype"sigma"factor"META2_0140" 134208" 135620" 1413" pyk$ Pyruvate"kinase"META2_0142" 136331" 137077" 747" arsH$ Arsenate"resistance"protein"ArsH"META2_0143" 137128" 137487" 360" arsR2$ Transcriptional"regulator,"ArsR"family,"ArsR2"META2_0144" 137480" 138007" 528" arsC3$ Arsenate"reductase"META2_0145" 138007" 138432" 426" arsC$ Arsenate"reductase"META2_0147" 138708" 139508" 801" $ Arsenite"efflux"pump"ACR3"(fragment)"
META2_0150" 141288" 143048" 1761" $ Peptidase"S8"and"S53,"subtilisin,"kexin,"sedolisin"precursor"
META2_0154" 143577" 144257" 681" $ RNA"polymerase"sigmaB24"subunit,"ECF"subfamily"META2_0155" 144738" 146327" 1590" $ Filamentation"induced"by"cAMP"protein"Fic"
META2_0159" 147891" 148055" 165" $ Cytochrome"c"biogenesis"protein,"transmembrane"region"precursor"(fragment)"
META2_0163" 150286" 151521" 1236" $ CarbohydrateBselective"porin"OprB"
META2_0168" 154237" 154971" 735" $ DNABbinding"response"regulator"in"twoBcomponent"regulatory"system"
META2_0169" 154968" 156302" 1335" $ Periplasmic"sensor"signal"transduction"histidine"kinase"
META2_0174" 159624" 162872" 3249" czcA2$ Heavy"metal"efflux"pump"CzcA"META2_0176" 163478" 164395" 918" czcD$ Cation"efflux"system"protein"CzcD"META2_0200" 179043" 179231" 189" $ Cytochrome"biogenesis"protein"(fragment)"META2_0202" 180534" 181055" 522" $ Signal"peptidase"II"META2_0203" 181052" 183247" 2196" zntA$ Zinc,"cobalt"and"lead"efflux"system"META2_0211" 188773" 191922" 3150" czcA$ Heavy"metal"efflux"pump"CzcA"
META2_0214" 194332" 194544" 213" copP$ CopP"metalBbinding"protein,"putative"exported"protein"
META2_0217" 196175" 199348" 3174" cusA$ Copper/silver"efflux"system,"membrane"component"
META2_0940" 887992" 888432" 441" trxC$ Thioredoxin"META2_0962" 907338" 908885" 1548" $ DNA"primase"META2_0971" 913402" 916275" 2874" polA$ DNA"polymerase"I"META2_0992" 930257" 932395" 2139" ligA$ DNA"ligase,"NAD(+)Bdependent"
META2_0995" 934201" 935235" 1035" ruvB$ ATPBdependent"DNA"helicase,"component"of"RuvABC"resolvasome"
META2_1007" 941539" 942450" 912" $ BetaBlactamase"domain"protein"META2_1009" 943278" 943727" 450" $ Predicted"transporter"component"
META2_1015" 948261" 948923" 663" $ DNABbinding"response"regulator"in"twoBcomponent"regulatory"system"
META2_1016" 948920" 950236" 1317" $ Integral"membrane"sensor"signal"transduction"histidine"kinase"
META2_1021" 953252" 955546" 2295" katG$ Catalase/hydroperoxidase"HPI(I)"META2_1023" 956106" 957488" 1383" $ Sensor"histidine"kinase"
2
META2_1024" 957481" 958158" 678" $ DNABbinding"response"regulator"in"twoBcomponent"regulatory"system"
META2_1026" 959725" 962862" 3138" czcA2$ RND"divalent"metal"cation"efflux"transporter"CzcA"
META2_1029" 963246" 963947" 702" $ RNA"polymerase"ECFBtype"sigma"factor"
META2_1058" 986951" 987994" 1044" $ TryptophanylBtRNA"synthetase"(TryptophanBBtRNA"ligase)"(TrpRS)"
META2_1077" 1004463" 1004873" 411" $ HNH"endonuclease"family"protein"META2_1083" 1010052" 1012508" 2457" secA$ Preprotein"translocase"SecA"META2_tRNA1" 1013193" 1013282" 90" $ Ser"tRNA"
META2_1086" 1013881" 1014990" 1110" $ 3'Bphosphoadenosine"5'Bphosphosulfate"sulfotransferase"sulfate"assimilation)"
META2_1098" 1027261" 1029525" 2265" $ Protein"with"a"domain"similar"to"DNABdirected"DNA"polymerases"
META2_1117" 1048329" 1049405" 1077" $ Nitrilase"META2_1120" 1051831" 1052604" 774" $ Nitrilase"META2_1122" 1052823" 1053830" 1008" qxtB$ Cytochrome"bdBquinol"oxidase"subunit"II"META2_1124" 1055306" 1056532" 1227" hemT$ 5Baminolevulinate"synthase"
META2_1127" 1058729" 1059643" 915" tehA$ PotassiumBtellurite"ethidium"and"proflavin"transporter"
META2_1128" 1059679" 1060185" 507" $ Cytochrome"c"family"protein"META2_1133" 1062849" 1063358" 510" $ Ion"transport"domain"protein,"CBterminal"META2_1134" 1062862" 1063626" 765" $ Iron"transport"domain"protein,"NBterminal"META2_1135" 1063853" 1065067" 1215" nhaA$ SodiumBproton"antiporter"
META2_1141" 1068358" 1069020" 663" uhpA$ DNABbinding"response"regulator"in"twoBcomponent"regulatory"system"with"UhpB"
META2_1190" 1100140" 1105398" 5259" $ DEAD/DEAH"box"helicase"domain"protein"META2_1191" 1105395" 1108154" 2760" $ Helicase"domain"protein"
META2_1211" 1126021" 1127037" 1017" $ NADPH"quinone"oxidoreductase,"ZincBcontaining"alcohol"dehydrogenase"superfamily"
META2_1213" 1127541" 1128443" 903" $ Transcriptional"regulator,"LysR"family"META2_1218" 1131773" 1132627" 855" $ Transcriptional"regulator,"LysR"family"
META2_1225" 1137855" 1138760" 906" $ HelixBturnBhelix,"AraC"type:AraCBtype"transcriptional"regulator"
META2_1226" 1138897" 1139640" 744" $ ShortBchain"dehydrogenase/reductase"
META2_1230" 1141030" 1141839" 810" phnC$ Phosphonate"transport"protein"(ABC"superfamily)"
META2_1233" 1143570" 1144589" 1020" ptxD$ Phosphonate"dehydrogenase"(NADBdependent"phosphite"dehydrogenase)"
META2_tRNA2" 1162482" 1162555" 74" $ Gln"tRNA"
META2_1291" 1186946" 1187614" 669" rnhB$ Ribonuclease"HII,"degrades"RNA"of"DNABRNA"hybrids"
META2_1296" 1189815" 1190708" 894" $ Homolog"of"eukaryotic"DNA"ligase"III"META2_1331" 1221864" 1225304" 3441" $ Chromosome"segregationBlike"(SMC)"protein"*""Excluding"all"hypothetical"proteins,"putative"enzymes,"and"transposases.""

1
Repeated,( selection/driven( genome( reduction( of( accessory( genome( in(
experimental(populations
"
Ming'Chun"Lee,1"&"Christopher"J."Marx1,2,*"
Supporting"Information"
"
Text"S1
2
Adaptation(in(selective(environments(at(generation(1500"
Three"or"four"strains"were"isolated"from"each"population"at"generation"1500"and"their"fitness"was"
tested"against"the"fluorescent'labeled"ancestor"as"described"in"Materials"and"Methods."The"
average"fitness"of"each"environment"was"calculated"and"shown"in"Figure"S1."Overall,"the"average"
fitness"of"evolved"populations"increased"by"15%"to"37%"in"their"respective"selective"environments,"
indicating"the"adaptation"has"occurred"in"those"populations."
"
Deletion(dynamics(
By"applying"the"PCR"technique"as"described"in"methods"to"the"whole"population"samples"at"
different"time"points,"we"found"DT1"fixed"in"4"populations"(B2,"B3,"B5,"B6)"before"generation"900"
and"in"an"additional"9"populations"(A1,"B1,"B4,"C3'C8)"before"generation"1500."We"also"screened"a"
limited"number"of"available"isolates"from"B"populations"at"generation"480,"540,"and"720"(each"
with"~8"isolates),"and"found"no"isolate"from"generation"480"and"540"had"a"deletion."However,"at"
generation"720,"over"30%"of"the"isolates"already"had"DT1."Interestingly,"over"50%"of"the"B"isolates"
had"DT2"at"this"time"point,"but"DT1"was"present"at"generation"1500."The"results"suggest"either"DT1"
happened"in"a"stepwise"fashion,"or"there"might"have"been"multiple"genotypes"in"the"population"
and"the"multiple"DT"lineages"coexisted"due"to"clonal"interference.""
"
Fitness(effect(and(growth(rate(of(deletion(mutants(
To"examine"the"phenotypic"effects"of"these"deletions,"we"reconstructed"four"types"of"compatible"
deletion"mutants"(ET1,"2,"3"and"4)"(Figure"2A)"under"the"ancestral"background"by"allelic"exchange"
using"sacB"and"cre'lox"systems"(1,"2),"which"let"us"eliminate"the"confounding"effects"of"other"
mutations"which"occurred"along"the"evolutionary"experiment."Figure"2B"shows"the"fitness"effects"
of"each"of"the"deletion"types"across"the"4"environments:"M,"S,"MS,"and"M/S"(the"average"of"M!S"
&"S!M)."The"simplest"results"were"from"ET2"where"the"fitness"is"slightly"beneficial"with"significant"
fitness"increase"of"2"to"4"%"in"all"environments"(P,<"0.0001)"except"in"M!S"where"significance"is"
marginal"(P"="0.0603)"and"from"ET3"where"the"fitness"is"nearly"neutral"with"increases"of"0"to"1%"in"
all"environments"(P"range"from"0.01"to"0.0001),"indicating"ET2"and"ET3"are"generically"either"
slightly"beneficial"or"neutral"across"all"environments"in"the"ancestral"background."We"hypothesize,"

3
however,"that"they"may"be"beneficial"in"later"backgrounds"due"to"epistasis."On"the"other"hand,"we"
found"strong"environmental"specific"fitness"effects"from"ET1"and"ET4"(Figure"2B)."In"single"
substrate"environments,"substantial"fitness"increases"on"S"were"found"both"from"ET1"(W"="1.145,"P"
<"0.0001)"and"ET4"(W="1.107%,"P"<"0.0001),"while"the"fitness"effects"on"M"were"rather"mild"(ET1:"
W"="1.026,"P"="0.0002;"ET4:"W"="0.984,"P"="0.0027)"and"ET4"is"actually"deleterious"when"growing"in"
M'only"environment."In"the"combined'nutrient"environments"(MS"and"M/S),"we"found"the"fitness"
of"ET1"and"ET4"were"consistent"with"the"null"expectation"of"being"close"to"the"average"of"the"
fitness"values"from"the"two"single'substrate"environments"(Figure"2B).""However,"in"the"
alternating"environment,"there"was"a"substantial"fitness"decrease"on"M"when"transferring"from"S"
(~4%,"P"<"0.0001),"but"an"increased"fitness"on"S"when"transferring"from"M"(~7%,,P"<"0.0001),"
relative"to"the"single"substrate"environments"(Figure"2A)."This"suggested"a"substantial"effect"of"the"
transition"between"nutrients"in"both"ET1"and"ET4."Furthermore,"we"found"the"product"of"fitness"
values"from"ET2"and"ET4"is"very"close"to"the"fitness"of"ET1"across"all"environments"(Figure"S2),"
indicating"no"deviance"in"epistasis"from"independence,"such"that"the"transition"effect"stems"from"
ET4."This"result"further"supports"the"hypothesis"that"the"region"of"ET4"was"important"for"nutrient"
switching."
To"get"a"better"understanding"of"the"underlying"causes"of"the"fitness"changes"when"switching"
environments,"we"performed"growth"analyses"of"the"engineered"deletion"mutants."The"results"
revealed"a"clear"discrepancy"between"the"growth"rate"and"fitness"values"for"ET1"and"ET4"(Figure"
S2)."In"both"cases"we"found"the"relative"growth"rates"of"ET1"and"ET4"on"either"substrate"was"
indistinguishable"whether"the"previous"growth"cycle"was"on"M"or"S,"indicating"growth"rate"was"not"
the"reason"for"the"fitness"changes."Due"to"the"limitation"on"sensitivity"of"measuring"OD600"at"the"
low"initial"values,"tracking"lag"phase"itself"was"fairly"inaccurate"and"did"not"allow"observation"of"
significant"differences"in"the"duration"of"the"lag"phases"between"wild"type"and"mutants."However,"
taking"the"advantage"of"the"natural"diauxic"growth"observed"when"M.,extorquens"AM1"switches"
from"S"to"M,"we"uncovered"a"significantly"longer"transition"time"from"S"to"M"both"in"ET1"and"ET4"
(ET1:"P"="0.0008;"ET4:"P"="0.0078)"(Figure"2C),"which"strongly"supports"the"hypothesis"of"fitness"
effect"of"these"deletions"on"nutrient"switching."In"addition,"ET1"and"ET4"also"exhibited"a"
significantly"higher"fitness"cost"during"stationary"phase"(P"<"0.0001)"(Figure"2D).""

4
The"long"transition"from"S"to"M"explains"the"fitness"drop,"and"the"fitness"cost"at"stationary"phase"
might"explain"the"fitness"difference"between"S"and"M!S"in"view"of"the"fact"that"M!S"culture"
experiences"shorter"stationary"phase"due"to"longer"lag"phase"when"switching"substrates."
However,"this"disadvantage"during"stationary"phase"was"not"due"to"the"survival"rate"when"
growing"alone."The"viable"count"did"not"change"appreciably"(less"than"15%)"even"after"96"hours"
for"all"strains"(Figure"S3)."Alternatively,"this"disadvantage"appeared"to"be"due"to"a"small"degree"of"
differential"cryptic"growth"during"stationary"phase."
"
Gene(content(
Of"the"606"coding"sequences"in"the"region"of"DT1,"415"are"annotated"as"conserved/hypothetical"
proteins"without"further"informative"functions."The"major"groups"of"the"remaining"191"genes"
include"genes"associated"with"mobile"elements,"regulatory"domains,"and"stress"responses"(Table"
S5)."Comparative"genomics"analysis"with"two"closely"related"Methylobacterium,extorquens"strains"
DM4"(NC_012988)"(3)"and"CM4"(NC_011757)"also"revealed"that"most"of"the"genes"of"the"
megaplasmid"are"unique"to"AM1."The"only"region"shared"with"the"other"strains"of"the"species"is"a"
region"around"the"end"of"DT1"(Figure"1A)"that"is"present"on"the"chromosome"of"strain"DM4"and"
CM4,"suggesting"the"potential"importance"of"this"region."Interestingly,"we"found"two"beta'
lactamase"family"proteins"related"to"ampicillin"resistance"and"one"operon"related"to"arsenate"
resistance"located"on"the"region"of"DT1,"although"both"of"them"have"other"homologs"on"the"main"
chromosome."Moreover,"there"are"5"sigma"factors"on"the"megaplasmid"and"3"of"them"are"in"the"
region"of"DT1."We"further"performed"phylogenetic"analysis"of"those"sigma"factors"along"with"other"
sigma"factors"in"the"closely"related"Methylobacterium"strains"and"found"two"of"them"do"not"have"
any"homolog"in"the"main"chromosome"but"are"conserved"in"other"Methylobacterium,strains"
(Figure"S5)."One"of"those"two"sigma"factors"is"a"homolog"of"σ24"(or"RpoE)"and"the"other"is"an"ECF"
type"sigma"factor,"which"are"associated"with"heat"and"stress"resistance"(4)."Additionally,"we"also"
found"5"genes"in"the"region"of"DT1"to"be"induced"during"phyllosphere"colonization"(5),"suggesting"
a"potential"tradeoffs"in"the"ability"to"associate"with"plants"due"to"this"deletion"type."These"
analyses"also"revealed"a"potential"replication"origin"in"the"region"just"upstream"of"DT1,"possibly"
explaining"why"the"boundary"of"the"genome"reduction"did"not"extend"farther."
"

5
Stress(responses(
Although"our"data"clearly"indicate"a"selective"advantage"of"these"deletions"under"their"respective"
selective"conditions,"we"were"interested"in"extending"our"phenotypic"analysis"to"investigate"the"
possibility"of"further"tradeoffs"in"alternative"environments"(i.e.,"antagonistic"pleiotropy)."Our"
analysis"of"the"gene"content"lost"in"the"deletions,"particularly"the"ET4"region,"pointed"to"the"
possibility"of"altered"stress"responses."Consistent"with"the"finding"of"two"beta'lactamase"family"
proteins"and"one"operon"related"to"arsenate"resistance"locating"on"the"region"of"ET4"(both"of"
them"have"other"homolog"genes"on"the"main"chromosome),"we"found"that"the"sensitivity"of"ET1"
and"ET4"increased"significantly"in"media"with"either"ampicillin"(12.5"µg/mL)"(Figure"2E)"or"arsenate"
(30mM)"(Figure"2F)."Finding"genes"with"possible"involvement"in"heat"shock"(σ32"homolog"and"
protein"folding/degradation"functions)"led"us"to"hypothesize"deletions"of"the"ET4"region"would"
lead"to"increased"sensitivity"to"high"temperatures."Surprisingly,"we"found"the"opposite:"a"
significant"improvement"on"growth"rate"at"36"°C"from"ET1"and"ET4"(Figure"2G)"but"the"cause"of"
this"improvement"is"still"unknown."Other"general"stresses"tested"that"failed"to"reveal"differences"
compared"to"wild'type"included:"formaldehyde,"SDS,"peroxide,"metal"mix,"salt,"heat"shock"or"UV"
treatments,"as"well"as"all"disc"diffusion"assays."Still,"the"decrease"of"antibiotic"and"heavy"metal"
resistance"in"liquid"medium"indicated"a"tradeoff"of"this"genome"reduction.""
"
Lack(of(epistasis(between(ET2(and(ET4(
All"phenotypes"tested"for"ET1"and"ET4"were"qualitatively"the"same,"other"than"slight"differences"in"
the"magnitude"of"effect."This"small"difference"appears"to"be"easily"accounted"for"by"including"the"
phenotypic"effect"of"the"other"half"of"the"large"ET1"deletion:"ET2."Thus,"although"the"ET1"
phenotype"is"largely"due"to"the"ET4"region,"the"ET1"phenotype"could"be"accounted"for"by"
considering"each"half'deletion"to"maintain"the"proportional"effect"on"phenotype"that"was"
observed"when"present"alone."The"fact"that"we"never"found"deletions"similar"to"ET4"in"the"
naturally"evolved"populations"and"the"rare"occurrence"of"DT1"in"M/S"environment,"and"the"fitness"
cost"during"the"S!M"switch"raise"suggests"that"a"gene"(or"genes)"within"this"region"contributes"to"
nutrient"switching."Furthermore,"the"fact"ET4"was"never"found"in"populations"despite"sometimes"
being"strongly"beneficial"(e.g.,"10%"on"S)"could"be"due"to"epistatic"interactions"with"other"

6
mutations"that"had"already"occurred"within"those"lines"that"either"reduced"or"eliminated"this"
selective"advantage."
"
Mutation(accumulation(
We"compared"our"findings"from"the"evolved"populations"to"those"from"a"series"of"10"mutation"
accumulation"populations"of"the"identical"M.,extorquens"AM1"transferred"through"single'colony"
bottlenecks"for"1500"generations."From"a"total"of"10"x"1,500"="15,000"generations"across"the"
populations,"no"deletions"of"any"type"in"the"region"of"DT1"were"observed."On"the"other"hand,"the"
net"rate"we"observed"across"the"large"Ne"populations"is"at"least"11.55"per"15,000"generations"(37"
PCR'detectable"deletions"across"32"x"1,500"="48,000"generations"assuming"the"deletions"did"not"
occur"until"exactly"1500"generations)."The"P'value"of"0"events"in"15,"000"generation"under"the"
Poisson"distribution"of"this"net"rate"would"be"less"than"0.0001"by"applying"the"following"formula:"
","where"λ=11.55,"and"k=0."
The"actual"difference"is"even"greater,"given"that"the"mutations"occurred"prior"to"1500"generations"
in"order"to"have"been"observed"by"then."These"data"indicate"that"the"observed"parallelism"here"
was"due"primarily,"if"not"exclusively,"to"selection."
"
((
7
References(
1." Marx"CJ"&"Lidstrom"ME"(2002)"Broad'host'range"cre'lox"system"for"antibiotic"marker"recycling"in"gram'negative"bacteria."Biotechniques"33(5):1062'1067."
2." Marx"C"(2008)"Development"of"a"broad'host'range"sacB'based"vector"for"unmarked"allelic"exchange."BMC,Res,Notes"1(1):1."
3." Vuilleumier"S,,et,al."(2009)"Methylobacterium"genome"sequences:"a"reference"blueprint"to"investigate"microbial"metabolism"of"c1"compounds"from"natural"and"industrial"sources."PLoS,ONE"4(5):e5584."
4." Hiratsu"K,"Amemura"M,"Nashimoto"H,"Shinagawa"H,"&"Makino"K"(1995)"The"rpoE"gene"of"Escherichia,coli,"which"encodes"sigma"E,"is"essential"for"bacterial"growth"at"high"temperature."J,Bacteriol"177(10):2918'2922."
5." Gourion"B,"Rossignol"M,"&"Vorholt"JA"(2006)"A"proteomic"study"of"Methylobacterium,extorquens"reveals"a"response"regulator"essential"for"epiphytic"growth."Proc,Natl,Acad,Sci,USA"103(35):13186'13191."
""