repair, evaluation, maintenance, and rehabilitation ...dtic.mil/dtic/tr/fulltext/u2/a234566.pdf ·...
TRANSCRIPT
REPAIR, EVALUATION, MAINTENANCE, AND
REHABILITATION RESEARCH PROGRAM
AD-A234 566 TECHNICAL REPORT REMR-GT-15
PLASTIC CONCRETE CUTOFF WALLSFOR EARTH DAMS
by
Thomas W. Kahl, Joseph L Kauschinger, Edward B. Perry
Geotechnical Laboratory
DEPARTMENT OF THE ARMYWaterways Experiment Station, Corps of Engineers
3909 Halls Ferry Road, Vicksburg, Mississippi 39180-6199
-P- 3, 1991
C
March 1991
Final Report
Approved For Public Release; Distrlbution Unlimited
pPrepared for DEPARTMENT OF THE ARMYUS Army Corps of Engineers
Washington, DC 20314-1000
91 4 *2-0 9

The following two letters used as part of the number designating technical reports of research published under the Repair,Evaluation, Maintenance, and Rehabilitation (REMR) Research Program identify the problem area under which the reportwas prepared:
Problem Area Problem Area
CS Concrete and Steel Structures EM Electrical and Mechanical
GT Geotechnical El Environmental Impacts
HY Hydraulics OM Operations Management
CO Coastal
Destroy this report when no longer needed. Do not returnit to the originator.
The findings in this report are not to be construed as an officialDepartment of the Army position unless so designated
by other authorized documents.
The contents of this report are not to be used foradvertising, publication, or promotional purposes.Citation of trade names does not constitute anofficial endorsement or approval of the use of such
commercial products.
COVER PHOTOS:
TOP - Placing plastic concrete in triaxial mold.
MIDDLE - Plastic concrete test specimen.
BOTTOM - Triaxial compression test chamber.
Form AppOvedREPORT DOCUMENTATION PAGE 0MB No. 0704-0188
COllecion Of information. enuigsgetosfr.ddgUe udn oWsigo eadquarterServices.Ogretorae Infor.monOperatinsan Aporb. 5215 eferson
1. AGENCY USE ONLY (Leave blank) 12. REPORT DATE 993 REPORT TYPE AND DATES COVERED
I March 1991 -TFinal report4. TITLE AND SUBTITLE S. FUNDING'NUMBERS
Plastic Concrete Cutoff Walls for Earth Dams
6. AUTHOR(S)Thomas W. KahlJoseph L. Kauschinger WU 32310Edward B. Perry
7. PERFORMING ORGANIZATION NAME(S) AND ADORESS(ES) B. PERFORMING ORGANIZATIONREPOUT NUMBER
US Army Engineer Waterways Experiment StationGeotechnical Laboratory Technical Report3909 Halls Ferry Road, Vicksburg, MS 39180-6199 REMR-GT-15
9. SPONSORING/MONITORING AGENCY NAME(S) AND ADDRESS(ES) 10. SPONSORINGIMONITORINGAGENCY REPORT NUMBER
US Army Corps of Engineers, Washington, DC 20314-1000
11. SUPPLEMENTARY NOTES
A report of the Geotechnical problem area of the Repair, Evaluation, Mainte-nance, and Rehabilitation (REMR) Research Program. Available from NationalTechnical Information Service, 5285 Port Royal Road, Springfield, VA 22161.
12a. DISTRIBUTION I AVAILABILITY STATEMENT 12b. DISTRIBUTION CODE
Approved for Public Release, Distribution Unlimited
13. ABSTRACT (Maximum 200 worOd)
Remedial seepage control of earth dams is a critical problem. A con-crete cutoff wall may be used as a remedial measure in some situations. Sincethe wall in its simplest structural form is a rigid diaphragm, deformations ofearth embankment due to increase in reservoir level or seismic activity couldcause its rupture which would greatly decrease the flow efficiency of thecutoff wall and jeopardize the safety of the dam.
In response to this dilemma, engineers in Europe, Asia, and SouthAmerica have used plastic concrete, which has deformation characteristicssimilar to the earth dam, to construct cutoff walls. Plastic concrete con-
sists of aggregate, cement, water, and bentonite clay mixed at a high water-cement ratio to produce a ductile material. Geotechnical engineers in theUnited States have been reluctant to specify the use of plastic concrete
(Continued)
14. SUBJECT TERMS 15. NUMBER OF PAGES186
Cutoff wall Ductile behavior Plastic concrete 16. PRICE CODE
Diaphragm wall Earth dam Remedial seepage control17. SECURITY CLASSIFICATION 18. SECURITY CLASSIFICATION 19. SECURITY CLASSIFICATION 20. LIMITATION OF ABSTRACT
OF REPORT OF THIS PAGE OF ABSTRACT
Unclassified Unclassified UnclassifiedNSN 7540-01-28O.5500 Standard Form 298 (Rev 2-89)

13. (Concluded).
for cutoff walls due to limited documentation of field performance of existing cutoffwalls and lack of laboratory test data on plastic concrete under test conditions whichapproximate field behavior.
This research was conducted to quantify the stress-strain-strength behavior andpermeability of plastic concrete, and to develop design data for specifying plastic con-crete for use in a diaphragm cutoff wall for an earth dam. The results of this researchindicate that the addition of bentonite clay to conventional concrete significantlyincreases the ductility and plastic deformation of the concrete while simultaneouslyreducing its shear strength. The permeability of plastic concrete was found to be thesame or less than conventional concrete, and it decreased significantly with consolida-tion. A design method is given for determining the mix design of a plastic concretecutoff wall based upon the unconfined compressive strength and/or modulus of the embank-ment soil.
PREFACE
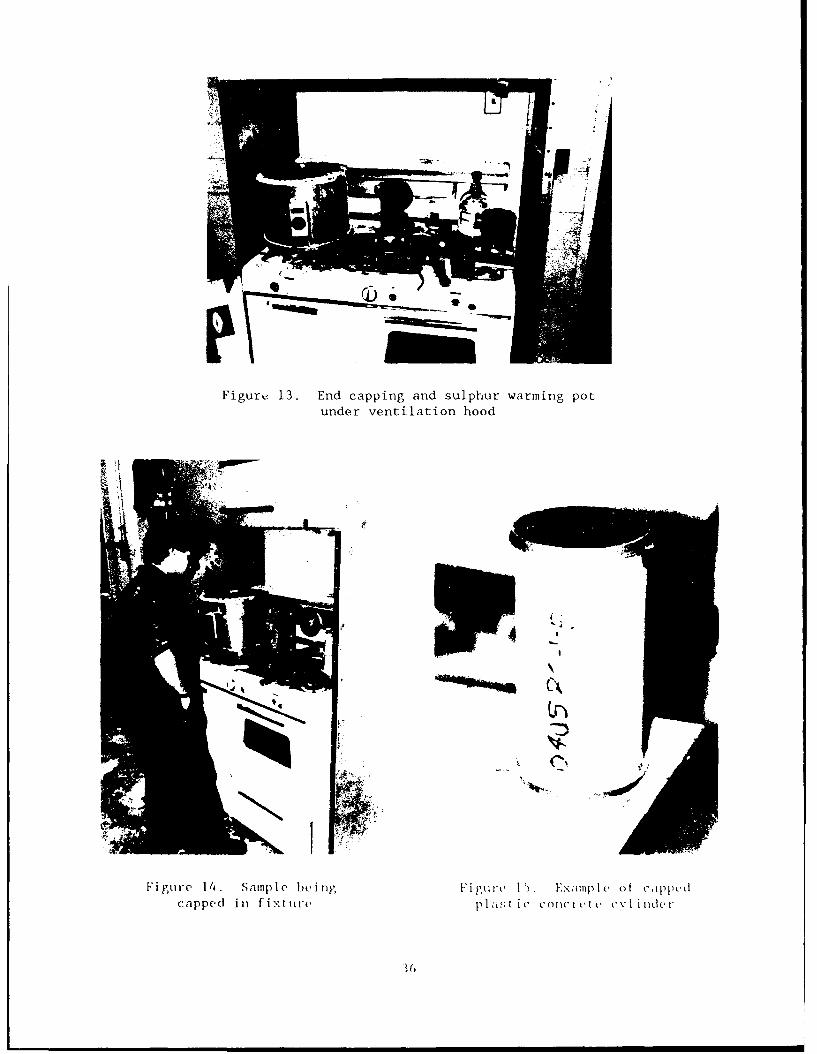
The work described in this report was authorized by Headquarters, US
Army Corps of Engineers (HQUSACE), as part of the Geotechnical (Soil) Problem
Area of the Repair, Evaluation, Maintenance, and Rehabilitation (REMR)
Research Program from October 1987 to November 1989. The work was performed
under Work Unit 32310, "Remedial Cutoff and Control Methods for Adverse Seep-
age Conditions in Embankment Dams and Soil Foundations," for which
Dr. Edward P Perry was the Principal Investigator. Mr. Arthur H. Walz,
HQUSACE, was the REMR Technical Monitor for this work.
Mr. Jesse A. Pfeiffer, Jr. (CERD-C) was the REMR Coordinator at the
Directorate of Research and Development, HQUSACE; Mr. James E. Crews (CECW-OM)
and Dr. Tony C. Liu (CECW-EG) served as the REMR Overview Committee;
Mr. William F. McCleese (CEWES-SC-A), US Army Engineer Waterways Experiment
Station (WES) was the REMR Program Manager. Mr. Gene P. Hale, Soil and Rock
Mechanics Division (S&RMD), Geotechnical Laboratory (GL), was the Problem Area
Leader.
This report was prepared by Mr. Thomas W. Kahl, former graduate student
at Tufts University working as a contract student to WES, and presently with
GEI Consultants, Inc., Winchester, MA; Dr. Joseph L. Kauschinger, former
Assistant Professor of Civil Engineering at Tufts University working under the
Intergovernment Personnel Act to WES, and presently Technical Director, Ground
Engineering Services, Hooksett, NH; and Dr. Perry, S&RMD, WES. General
supervision was provided by Dr. Don C. Banks, Chief, S&RMD, and D,. William F.
Marcuson III, Chief, GL. Senior technical reviewer of this report was
Dr. Paul F. Hadala, Assistant Chief, GL. Ms. Odell F. Alle.. Visual Produc-
tion Center, Information Technology Laboratory, edited tht report.
COL Larry B. Fulton, EN, was Commander and Director of WES during the
preparation and publication of this report. Dr. Robert W. Whalin was
Technical Director.
J ALif leat on~
UINSP&CTEO
44
o PTLah I t 1!r%@
V b til -A V 7
1L

CONTENTS
Page
PREFACE ................................................................ 1
CONVERSION FACTORS, NON-SI TO SI (METRIC)UNITS OF MEASUREAENT ..................................................... 4
PART I: INTRODUCTION ................................................... .5
Purpose .............................................................. 5Scope of Work ........................................................ 6
PART II: LITERATURE REVIEW ............................................. 10
General Observations of Recent Plastic Concrete Research ......... 10Major Plastic Concrete Research Programs ............................ 13Plastic Concrete Cutoff Wall Field Case Studies .................... 17
PART III: LABORATORY TESTING TECHNIQUE .................................. 24
Materials ............................................................ 24General Concrete Fabrication Procedure .............................. 25Unconfined Compression Test Procedure ............................... 31Brazilian Splitting Tensile Test Procedure ......................... 41Flexural Beam Test Procedure ........................................ 42Erodability Test Procedure .......................................... 43Triaxial Testing Equipment .......................................... 46Q Test Procedure ..................................................... 53CIUC Test Sample Setup and Consolidation Procedure ............... 55Permeability Test Procedure ......................................... 62CIUC Shear Test ...................................................... 66
PART IV: UNCONFINED TEST RESULTS ....................................... 67
Unconfined Compression Test Data Analysis ........................... 67Results of Unconfined Compression Test Series ...................... 70Error Analysis of Unconfined Compression Tests ..................... 73Conclusions from Unconfined Compression Tests ...................... 74Results of Other Unconfined Tests ................................... 75
PART V- TRIAXIAL AND PERMEABILITY TEST RESULTS ....................... 78
Results of CIUC Tests ............................................... 79Results of Unconsolidated Undrained Compression Tests ............ 81Results of Permeability Tests ....................................... 83
PART VI: ANALYSIS AND DISCUSSION ....................................... 85
Relationship of Unconfined Compressive Strength and SplittingTensile Strength to Cement Factor and Water-Cement Ratio ....... 85
Relationship of Elastic Modulus and Strain at Failure toUnconfined Compressive Strength ................................... 91
Relationship Between Unconfined Compressive Strength andSplitting Tensile Strength ........................................ 92
Effect of Curing Age and Bentonite Content on UnconfinedCompressive Strength .............................................. 93
Effect of Consolidation on Cement Factor and Water-CementRatio .............................................................. 95
2

Page
Effect of Bentonite Content on Pore Pressure Generation and
Stress Path ........................................................ 96
Relationship Between Triaxial Stress-Strain-StrengthBehavior and Unconfined Stress-Strain-Strength Behavior ........ 103
Comparison of a CIUC Test and a Q Test Having the Same CementFactor, Bentonite Content, and Water-Cement Ratio Tested
at the Same Age ................................................... 107
Influence of Bentonite Content, Confining Stress, Consolidation,and Age on Triaxial Stress-Strain-Strength Behavior of
Plastic Concrete .................................................. 108
Permeability of Plastic Concrete ................................... 113
PART VII: SUMMARY AND RECOMMENDATIONS .................................. 115
Summary ............................................................. 115Recommendations ..................................................... 116
REFERENCES ............................................................. 118
APPENDIX A: DETAILED TEST DATA FROM COLBUN MAIN DAM LABORATORY
PROGRAM AND MUD MOUNTAIN DAM LABORATORY PROGRAM ........... Al
APPENDIX B: CHEMICAL ANALYSIS OF CEMENT AND BENTONITE FINE ANDCOARSE AGGREGATE GRAIN SIZE DISTRIBUTION AND BATCH
DESIGN EXAMPLE ............................................... Bl
APPENDIX C: CALIBRATIONS OF RIEHLE TESTING MACHINE AND 1,000 LB
BEAM BALANCE SCALE ........................................... Cl
APPENDIX D: SUMMARY TABLES OF UNCONFINED COMPRESSION TESTS
(PHASES I AND II), BRAZILIAN TENSILE TESTS
(PHASES I AND II), AND FLEXURAL BEAM TESTS ................ Dl
APPENDIX E: PHASE II CIUC, Q, AND UC STRESS-STRAIN CURVES
BY BATCH ..................................................... El
APPENDIX F: SUMMARY TABLES OF PERMEABILITY TESTS ........................ Fl
3

CONVERSION FACTORS, NON-SI TO SI (METRIC)
UNITS OF MEASUREMENT
Non-SI units of measurement used in this report can be converted to SI
(metric) units as follows:
Multiply By To Obtain
cubic feet 0.02831685 cubic metres
cubic yards 0.7645549 cubic metres
Fahrenheit degrees 5/9 Celsius degrees or Kelvins*
feet 0.3048 Metres
gallons (US dry) 0.004404884 cubic decimetres
gallons (US liquid) 3.785412 cubic decimetres
inches 2.54 centimetres
kips (force) per square 6.894757 megapascalsinch
pounds (force) per square 6.894757 kilopascals
inch
pounds (mass) 0.4535924 kilograms
pounds (mass) per cubic 16.01846 kilograms per cubic metresfoot
pounds (mass) per cubic 0.5932764 kilograms per cubic metresyard
square inches 6.4515999 square centimetres
* To obtain Celsius (C) temperature readings from Fahrenheit (F) readings,
use the following formula: C - (5/9)(F - 32). To obtain Kelvin (K) read-ings, use K - (5/9)(F - 32) + 273.15.
4

PLASTIC CONCRETE CUTOFF WALLS FOR EARTH DAMS
PART I: INTRODUCTION
Purpose
1. This research program was to evaluate the mechanical properties of
plastic concrete for use as a remedial diaphragm cutoff wall material in earth
dams to control seepage. Many of the earth dams in the United States were
constructed during the Depression Era of the 1930's and immediately after
World War II. Today, many of these dams are over 50 years old, and a few have
severe leakage problems due to the erosion of core material. The potential
catastrophic failure of one of these dams due to piping creates a need for
effective and practical remedial seepage control solutions. One solution is
to install a deep, relatively thin concrete diaphragm wall along the axis of
an earth dam using the slurry trench method. This type of cutoff is usually
quite effective in controlling seepage. Examples of this type have been done
at Clemson Lower Diversion Dam, Mud Mountain Dam, Navajo Dam, and Fontenelle
Dam. Problems can arise, however, when conventional concrete is used as a
cutoff trench backfill material because of its inherent brittleness. Deforma-
tions of earth embankments due to fluctuations in impounded reservoir levels
or seismic activity can cause concrete cutoffs to develop cracks. New leakage
problems may then develop through these cracks, producing an inefficient
cutoff.
2. In response to this dilemma, engineers in Europe, Asia, and South
America have used plastic concrete to construct cutoff walls which have defor-
mation characteristics similar to dam embankment soils. Plastic concrete
consists of aggregate, cement, water, and bentonite clay mixed at high water-
cement ratios to produce a material more ductile than conventional structural
concrete. Geotechnical engineers in the United States, however, have been
reluctant to specify the use of plastic concrete for cutoff walls due to the
limited and/or poorly documented field performance data for plastic concrete
cutoffs. Thus, this research was conducted to quantify factors which influ-
ence the stress-strain-strength behavior and permeability of plastic concrete,
and to develop design data for specifying plastic concrete.
5

Scope of Work
3. This research program was conducted in two phases. Phase I
consisted of evaluating the unconfined compression, tensile, and flexural
behavior of plastic concrete as a function of cement and bentonite content
versus age. The data was used to supplement and replicate previous testing
done by the North Pacific Division of the US Army Corps of Engineers (NPDEN)
and to provide a data base for selection of mix designs for Phase II triaxial
testing. In addition, the data from the unconfined compression tests were
used to develop a design procedure for relating cement factor and water-cement
ratio to compressive strength and Young's modulus.
4. All the mix designs tested in this research program were propor-
tioned to produce 8-in.* slump concrete, as required for tremie placement in a
slurry trench. In addition, the recommended tremie concrete fine/coarse
aggregate ratio (by weight) of approximately one was used for all batches
(Tamaro 1988). For ease of comparison with NPDEN data, the following batch
design parameters were adopted to quantify all mix constituents (see para-
graph 46 for definitions of these parameters):
a. Cement factor equals pounds of cement plus bentonite per cubicyard of plastic concrete.
b. Percent bentonite equals percentage of cement factor, by weight,which is bentonite.
c. Water-cement ratio is the ratio of water to cement plus benton-ite, by weight.
5. Given these parameters, the required weights of the fine and coarse
aggregate per cubic yard of concrete can be back calculated by volume. This
method has the advantage of describing the mix design of a given batch with
only three parameters, eliminating the need to include all batch constituents
in the analysis.
6. The scope of Phase I tests was as follows:
251 unconfined compression (UC) testcement factors 230 to 450 lb/cu ydbentonite contents of 0, 10, 20, 40, and 60 percentages of 3 to 660 days
45 splitting tensile (Brazilian) testscement factors 240 to 360 lb/cu yd
* A table of factors for converting non-SI units of measurement to SI
(metric) units is presented on page 4.
6

bentonite contents of 0, 20, and 60 percentages of 3 to 90 days
6 flexural beam tests
2 erodability tests (high velocity pinhole type)
7. Phase II was conducted to examine the influence of consolidation and
horizontal confinement on the stress-strain characteristics, strength
behavior, and permeability of plastic concrete to simulate the stress and
drainage conditions plastic concrete would be subjected to at the bottom of a
tremie placement in a deep trench. Plastic concrete cutoff walls for remedial
seepage control are constructed in panels through the embankment (and founda-
tion if required) and keyed into an aquiclude. During excavation, the panel
is filled with a bentonite slurry which penetrates the adjacent soil and forms
a filter cake on the sides of the excavation (kfilter cake = 10-1 to l0-
g cm/sec depending on the depth within the cutoff trench and the thickness of
the filter cake (EM 1110-2-1901, Figure 9-9)). At the completion of the exca-
vation, plastic concrete with a 8-in. slump is tremied into the excavation,
from the bottom upward, displacing the bentonite slurry to form the panel. As
the surface of the tremie plastic concrete rises, it may remove the filter
cake from the sides of the excavation. However, the relatively low permea-
bility of the adjacent soil, which was penetrated with bentonite slurry, will
prevent the free (unabsorbed) water in the plastic concrete panel from drain-
ing laterally. The water will be free to migrate upward through the plastic
concrete. The plastic concrete begins to set as soon as it is placed in the
excavation with stiffening occurring from the bottom of the panel upward. The
set of the panel will occur within a few hours, generally less than I day
(retarding admixtures can be used to prolong the set). Consolidation of the
plastic concrete panel under the vertical stress imposed by the weight of the
overlying plastic concrete (some of this stress will be taken by arching if
the sides of the excavation move laterally) will be completed in a matter of
days, the exact time depending on the depth of the plastic concrete cutoff
wall. After consolidation, the permeability of the plastic concrete will be
kplastic concrete - 10-8 to 10-9 cm/sec (measured in this study). The plastic
concrete will continue to cure and gain strength following consolidation. Due
to the low permeability of the plastic concrete, very lictle migration of
water will occur within the plastic concrete cutoff wall after consolidation.
7

8. The laboratory stress-strain characteristics and strength behavior,
permeability, and erodability Fhould be obtained under test conditions which
approximate, as closely as possible, those which exist in the field. It was
not feasible (for this study) to form, consolidate, and test tensile strength
samples (Brazilian and Flexural Beam Test) and erodability samples (pinhole
type test) under conditions which would duplicate those existing in the field.
However, for permeability and compressive strength testing, this was feasible,
and plastic concrete specimens were formed in the triaxial chamber after
mixing, isotropically consolidated in the triaxial chamber with ertical
drainage, and cured in the triaxipl chamber under effective confining pres-
sures typical for existing cutoff walls (50 to 300 psi). Permeability tests
were conducted in the triaxial device during the curing phase (once gas gener-
ation within the sample had ceased). Following the permeability test, the
pore water pressure in the sample was given time to equalize, and the sample
was sheared under undrained conditions. In addition to the consolidated-
isotropic undrained compression (CIUC) triaxial tests described above, uncon-
solidated-undrained triaxial compression (Q) tests were conducted to determine
the effects of consolidation on the stress-strain characteristics and strength
behavior of plastic concrete (previous investigators had suggested that the
effects of consolidation could be simulated by forming a Q test sample at the
cement factor and water-content ratio a CIUC test sample would have at the end
of consolidation). Unconfined compression tests were conducted to correlate
with the more time-consuming and expensive CIUC tests.
9. The scope of Phase II tests was as follows:
20 CIUC Tests6-in.-diam 12-in.-high sample sizecement factor of 300 lb/cu ydbentonite contents of 0, 20, and 40 percenteffective confining pressures of 50, 100, 200, and 300 psiages of 3, 7, and 14 dayspermeability tests
20 Q Tests6-in.-diam 12-in.-high sample sizecement factor of 300 lb/cu ydbentonite contents of 0, 20, and 40 percenttotal confining pressures of 50. 100, 200, and 300 psiages of 3, 7, and 14 days
8

10. As a control, two unconfined compression tests and a splitting
tensile test were performed on the same material molded for each pair of CIUC
and Q tests. The UC companion tests were used to ensure:
a. Repeatability with a batch, i.e. to ensure uniform mixing of
constituents.
b. Consistency with Phase I UC results for the same batch design
and age.
c. Comparability of Phase I UC tests and Phase II triaxial testsfor development of design procedure.
9

PART II: LITERATURE REVIEW
11. Although plastic concrete has been used to produce cutoff walls
with greater ductility than conventional concrete, relatively little published
research has been done to develop a comprehensive design procedure. This is
because most previous plastic concrete research was done by contractors and is
therefore proprietary. In addition, most previous plastic concrete research
programs were conducted in conjunction with dam construction and were
generally limited in scope and site specific.
12. Part II contains a comparison and summary of major published works
on plastic concrete since 1968. General observations on the scope and types
of tests performed in the body of literature are presented first. A summary
of each test program is then presented containing relevant mix design, stress-
strain-strength data, and conclusions. Finally, performance data for con-
structed plastic concrete cutoff walls are presented.
General Observations of Recent Plastic Concrete Research
13. Table 1 was constructed in order to compare mix designs and scopes
of work of various test programs. Different methods of describing plastic
concrete batch designs are used throughout the literature. To make compari-
sons of mix design possible, all of the mix design parameters of the research
programs listed in Table 1 were converted to cement factor, percentage ben-
tonite, and water-cement ratio as previously defined. In addition, all the
reported confining stresses were converted into units of pounds per square
inch.
14. For each test program listed in Table i, mix design parameters
percentage bentonite, cement factor, and water-cement ratio are presented
first along with slump and fine-coarse aggregate ratio. The scope of each
testing program is then summarized according to the type of tests performed,
number of tests performed, curing ages tested, and, if applicable, the range
of confining stresses examined.
15. The body of work lacks critical data necessary to evaluate the
range of behavior possible in plastic concrete for design in a cutoff wall.
The most glaring deficiency is the lack of CIUC testing. CIUC tests are
10

En
0 Ln0r 0
C-4 0
0 j-4 C- n-l4 0
00-4 IA W
4- 44- u o bo bo.
4- 0 .4w C
41-4o sfo w a 00' F. A ,0 0 0 C4)
54 4 -4 Cnen4u
w 4d CL 41
0- 0) ' Q- - 1i40 41 10
[-44 4-U
-4 ,4 )
u 14141
,4 00 b 0 CY 0" %0~
0 0jU1Z4 -4 f 'A0 51. 4 4
c.J ** JJ-4-4U, IA. 0) 004
to cli In4 "
1o 0) 41 ~ 41 41014- .A E. I,,4 1 AJn 1-
0~ r-. -- O0 0'9.~4>' -4 - .40 ' A) 0 ~4) 0 4
41 4 4"~ 04 14 r- I.0~~ 04U 0 4 U
14 ~ ~ ~ ~ ~ ~ $ 001 41 1 4C)1 L4444 s
.Z-' .. W- 12 0'- 00 to -
,4 cq %D, C14 4 4 1 14e ~ )-4U 4 C.

essential to understanding the behavior of plastic concrete in a deep tremie
placement. None of the test programs listed in Table 1 prior to the Mud Moun-
tain Dam (MMD) test program consolidated wet (8-in. slump) plastic concrete
under constant confining pressure.
16. A second deficiency shown in Table 1 is the lack of any high pres-
sure triaxial testing. Although several test programs included Q tests, the
maximum total confining stress evaluated, with the exception of the MMD tests
program, was 71 psi. The stress is inadequate to simulate the high confining
stresses present at the bottom of remedial cutoff wall during a tremie place-
ment. Typically, a remedial cutoff is placed through both embankment and
foundation soil and can be up to 400 ft deep. During a tremie placement, the
stress an element of concrete is subjected to is a function of the head of wet
concrete above that element. Since pressure in a fluid equals the unit weight
of the fluid times the depth of the fluid, the pressure exerted by wet con-
crete (unit weight approximately equal to 140 lb/cu ft) can be approximated as
1 ft concrete equals 1 psi. Therefore, in order to correctly simulate the
possible range of in-situ cutoff wall confinement stress, confining stresses
up to 300 to 400 psi must be examined.
17. Many of the prior research programs listed in Table 1 lack suffi-
cient scope to design with any measure of confidence. Few long-term (more
than 1 year) tests were performed to establish the effects of curing age on
the stress-strain-strength behavior of plastic concrete. Most of the programs
tested only one specimen at a given age and mix design. Thus, there is no way
to gage the accuracy of the results of a particular test. Also limited are
the ranges of cement and bentonite contents evaluated. There is a lack of
control mixes with no bentonite to use as a basis for evaluating the influence
of the addition of bentonite on stress-strain-strength behavior.
18. In addition, many of the problems with the existing literature
discussed in this section are compounded by poorly documented testing pro-
cedures. In particular, it was difficult to ascertain, for some test pro-
grams, the exact type and number of triaxial tests that were performed due to
the proprietary nature of these prior research programs.
12

Major Plastic Concrete Research Programs
19. This section contains summaries of each of the major plastic con-
crete research programs listed in Table 1. Some of the programs described
consisted of laboratory testing only. Other programs were conducted to
develop mix designs for specific earth dam cutoff walls. In addition, some of
the programs also examined the influence of adding other materials to
concrete.
Comparison of grout mixes andplastic concrete presented atthe 9th conference of the ICSMFE*
20. This research program (Habib 1977) consisted of comparing the
triaxial stress-strain-strength and permeability characteristics of grouts and
a plastic concrete for use as a cutoff wall material. The grout mix design
consisted of cement, clay, and water mixed at a ratio of 20:13:67 (percent by
weight). The plastic concrete mix design examined was:
Cement factor 409 lb/cu ydPercent bentonite 63%Water-cement ratio 1.7Fine-coarse aggregate ratio 1.0Slump 6 in.
21. The stress-strain curves of unconfined and triaxial tests performed
on this mix are shown in Figure 1. Figure 1 shows that the deviator stress at
failure increases with confining stress. The permeability of both the grout
mix and plastic concrete mix was to range between 0.5 and 2.1 *10-6 cm/sec.
Other major conclusions were:
a. Plastic concrete has significantly greater strain at failurethan grout.
b. Coarser aggregate reduces the strain at failure of plasticconcrete.
c. The permeability of grout and plastic concrete are of the sameorder of magnitude.
d. Recommended applications:
(1) Grouts--shallow or temporary cutoffs, excavationprotection.
* ICSMFE - International Conference on Soil Mechanics and Foundation
Engineering.
13

a-a3 (kPa) a 03= 300 kPa
V "..001W.'awo03= 100 kPa.. _ _ ...400
- ...w ..- I /
200
E3 AV/V or e1(%)no1 I- I I I iI I I .5 I
10 1 1.5
Figure 1. Influence of confining stress on the stress-strain behavior of plastic concrete (Habib 1977)
(2) Plastic concrete--deep cutoffs, high dams, in seismiczones.
Colbun Dam research program
22. This research program (Woodward-Clyde Consultants 1981) evaluated
the six plastic concrete mix designs for use in the Colbun Main Dam cutoff
wall (paragraph 34). The proportions of these mix designs are summarized in
Appendix A, Table Al. The mix designs were essentially mortar mixes made up
of water, bentonite, cement, silty clay, and sand (sand plus silty clay equals
65 percent). These constituents reflected the types of materials readily
available for use at the Colbun site.
23. The laboratory testing program consisted of UC tests, triaxial
permeability tests, and CICU tests. A summary of these tests is presented in
Appendix A, Tables A2 and A3. The results in Tables A2 and A3 indicate that
peak deviator stress, strain at failure, and modulus of elasticity increase
with increases in confining stress. It does not appear, however, that the
triaxial samples listed in Tables A2 and A3 as "CIUC" tests were consolidated
wet (i.e. consolidated in triaxial chamber immediately after mixing the
plastic concrete). The published procedure (Woodward-Clyde Consultants 1981)
states that the CIUC samples were consolidated after curing in cylinder molds
for 7 to 10 days. The results of constant head permeability tests on the mix
14

designs in Table Al are summarized in Tables A4 through A6. The permeability
of the mix designs tested was 4-40 *10-8. Other major conclusions were:
a. Permeability is independent of gradient and no significantpiping occurred at gradients up to 280.
b. The shear strength and initial tangent modulus increase as thewater-cement ratio decreases and as the effective consolidationstress increases.
C. Strain at failure increases as consolidation stress increases.
Design procedure presented inInternational conference on large dams
24. This report summarizes the criteria and design philosophy that
should be used in plastic concrete diaphragm construction (Fenoux 1985).
These include:
a. Permeability should be approximately 10-7 to 10-8 cm/sec.
b. Deformability should be values of Young's modulus 4 to 5 timesgreater than surrounding soil that is acceptable for straincompatibility between surrounding soil and diaphragm wall. Inaddition, plastic concrete should have a high strain at failure(greater than 1 percent).
c. Plastic concrete should have as low a compressive strength aspossible, but strong enough to support the weight of thediaphragm wall, support earth pressures at depth, and resisterosion and hydraulic fracturing.
d. Plastic concrete should be able to resist loss of integrity dueto piping and chemical attack.
e. Plastic concrete should meet workability requirements of tremieplacement.
25. In addition general guidelines are given for developing plastic
concrete batch designs, and graphs of triaxial, unconfined and permeability
testing are presented. However, the report does not include a generalized
design procedure relating mix parameters to strength and modulus data over a
large range.
Bucknell University research program
26. This research program (Evans. Stahl, and Drooff 1987) was conducted
to evaluate plastic concrete as a cutoff wall material for sealing landfills.
Permeability and shear tests were performed on samples from nine different mix
designs of plastic concrete. Table 2 summarizes each mix design and its
corresponding permeability, shear strength, and strain at failure. Six of
these batches contained either fly ash or bottom ash in addition to the
15

Table 2
Summary of Batches Designs and Corresponding Shear Strength
and Strain Data from Bucknell University Research
Program (Evans 1987)
N Proortion Plastic Concrete Nfi% No,
01i i-EO 1 2 2
Bentonite 4.1 4.2 41 4.1 4.1 4.1 4.1 4A1 40
Content (%)Fine 41.6 41.6 41.6 41 4 41.5 41.3 41.5 41.1 404
Aggregate(%)Coarse 33 2 29. 1 24.9 29.0 29.! 29.9 29.0 28.8 83
Aggregate(%)Cement 4.1 8.3 12.4 6.6 4.1 2.5 6.6 4.1 24
Content (%)Bottom Ash 0 0 0 0 0 0 1.7 4.1 5 7
Content (%)Fly Ash 0 0 0 1.7 4.1 5.7 0 0 0
Content (%)Bentonite 0.24 025 0 24 0.24 0.24 0 24 0.24 0.23 021
W,'ater ratioCement 0.24 049 073 0.38 024 0.14 0.39 0.23 0 1--
1'ater ratio
Propert0H draulhc 3.5 1 I 0.5 08 1 20 3.2 18 1-
Conducti' ity (Xt0"' Cm 'sec IShear 400 338 3427 1455 1214 903 1110 545 _t
Strength (kPa)Axial Strain 20 37 10.0 55 9.8 5 4 12.2 168 96
at failure (%)
standard plastic concrete constituents. For the conditions tested (see
Table 2), the major conclusions were:
a. The permeability of plastic concrete ranged between 10-7 and
10-8 cm/sec.
b. The permeability of plastic concrete is at least an order of
magnitude lower than for cement bentonite (about 10-6 cm/sec,
see Tamaro 1988).
c. The permeability of plastic concrete decreases slightly withtime.
d. Plastic concrete may offer greater resistance to contaminant
attack than either soil bentonite or cement-bentonite.
Mud Mountain Dam
(MMD) research program
27. This research program was conducted in conjunction with the reha-
bilitation of MMD by the United States Army Corps of Engineers. MMD is a
425-ft high earth and rockfill flood control dam located on the White River
near Enumclaw, WA. In 1982 piezometric studies conducted at the deepest point
16

of the center of the dam's clay core showed that the water level within the
core responded very quickly to changes in elevation of the impounded reser-
voir. These observations suggested zones of deterioration within the core.
Subsequent borings confirmed zones of soft and loose material having the
potential to allow excessive seepage (Peck 1986). The Corps then conducted a
research program to evaluate the possibility of installing a plastic concrete
diaphragm cutoff wall in the core as a seepage barrier. Table A7 in Appen-
dix A contains a summary of the plastic concrete mix designs examined and the
results of unconfined compression, flexural beam, Q, pressure, and erodability
tests (US Army Engineer Division, North Pacific 1987). The pressure tests
were nonstandard tests conducted in lieu of CIUC tests to evaluate the influ-
ence of consolidation on the stress-strain-strength behavior of plastic con-
crete. Wet samples were formed in open ended steel cylinders, and pressure
was applied to the samples with a hydraulic loading device. Water was allowed
to drain from the samples through vertical slots in the steel cylinder. When
drainage ended (25 to 45 min), the pressure was removed, and the samples were
cured under atmospheric pressure and later tested in a triaxial chamber.
28. Important general conclusions from the tests series are:
a. Unconfined compressive strength, flexural strength, and elasticmodulus decrease dramatically with the addition of bentonite.
b. Strain at failure increases dramatically with the addition ofbentonite.
c. Maximum deviator stress and elastic modulus increase withconfinement.
d. Maximum deviator stress increases with consolidation.
Plastic Concrete Cutoff Wall Field Case Studies
29. Several plastic concrete diaphragm walls have already been
installed in earth dams, both as remedial seepage control measures and as
foundation cutoffs in new dams. This section contains five representative
case studies presented in chronological order. Mix designs and, where pos-
sible, measurements of the hydraulic effectiveness of the cutoff are included
in the discussions.
Balderhead Dam
30. Balderhead Dam (Bennie and Partners 1968), completed in 1965, is a
48-m high earth embankment dam located on the Balder River in Yorkshire
17

England. The shell is crushed shale and the central core is composed of com-
pacted boulder clay. The core is connected to the foundation bedrock by a
conventional concrete cutoff. A profile of the dam is shown in Figure 2.
-a.1mom oseervoi, lvel 3 .23 - -
Cwshod flawoe flifO,
- . . . . . . ..... .-. *
Figur e Proefil fBleha a
-:-
(Binnie and Partners 1968)
31. Severe leakage problems developed in 1966-67 during the first
reservoir impounding. When silty seepage water was observed downstream of the
dam and 2.5-in deep swallow-holes opened along its crest, it was concluded that
the leakage was due to extensive and continuing erosion of the clay core. The
remedial solution adopted consisted of grouting the entire core and installing
a plastic concrete diaphragm wall in the most damaged core zone. Plastic
concrete was chosen because it would prevent cracking of diaphragm wall due to
any additional future embankment settlements (dam was only 2 years old), and
it was felt that grouting alone could not ensure an impermeable cutoff.
32. The final diaphragm wall was 200 m long, 43 m deep, and 0.6 m
thick. The mix design used was as follows:
Cement factor 400 lb/cu ydPercent bentonite 18 %Water-cement ratio 1.7Fine-coarse aggregate ratio 1.0
Subsequent studies showed seepage through the core was reduced from 60 2/sec
to 5 I/sec.
Convento Viejo Dam
33. Convento Viejo Dam (Alvarez and Mahave 1982) is a 38-m high earth
embankment dam located on the Tinguiririca River in Chile's central valley
18

constructed in 1977. Figure 3 shows an upstream elevation view of the dam.
The original design called for a 14-m deep compacted clay cutoff to be
installed beneath the embankment to control underseepage. During construction
of the cutoff, however, it was discovered that underseepage occurred to a
depth of 57 m. To remedy this, a continuous plastic concrete cutoff was
installed to bedrock in front of the clay cutoff. The mix design used was as
follows:
Cement factor 320 lb/cu ydPercent bentonite 55 %Water-cement ratio 1.7Fine-coarse aggregate ratio 1.0
Subsequent pump test have determined seepage across the dam to be 29.1 I/sec,
and the hydraulic efficiency of the plastic concrete cutoff to be
93.5 percent.
Z23 m
270260 LEGEND
240 (1) CREST230 (2) WORKING PLATFORM
(3) ROCK(4) COMPACTED CLAY CORE3 20 (5) DIAPHRAGM CUTOFF WALL
200
Figure 3. Elevation of Convento Viejo Dam (Hankour 1979)
Colbun Main Dam
34. The Colbun Dam (Noguera 1985) is a 116-m high zoned earth-gravel
filled dam constructed in 1984 as part of Chile's Colbun-Machicura hydro-
electric project. Figure 4 shows plan and section views of the dam. A 68-m
deep plastic concrete cutoff wall was installed during construction through
pervious alluvium to connect the core to bedrock. Plastic concrete was chosen
to prevent the cutoff from cracking due to embankment settlement and potential
seismic activity. An extensive laboratory testing program was conducted to
19

N 12 30~$
.1 /,N
" 0 .. ."- , ' ' , / / B
PLAN OF DAM
PLAN DU 8kA'-GE
COUPE - B
LEGEND
(1) CLAY CORE(2) FILTER ZONE(3) EARTH-GRAVEL FILL(4) CONCRETE CUTOFF CAP(5) PLASTIC CONCRETE CUTOFF WALL(6) BEDROCK(8) PERVIOUS ALLUVIUM
Figure 4. Plan and section of Colbun Main Dam (Pablo
and Cruz 1985)
20

select the best mix design to meet these criteria (see paragraph 22). The mix
design selected was as follows:
Cement factor 150 lb/cu ydPercent bentonite 20 %Water-cement ratio 4.5Fine-coarse aggregate ratio 1.0Slump 6-8 in.
35. Figure 5 shows unconfined stress-strain data from plastic concrete
samples taken during construction of the cutoff. Comparison of triaxial test
results to post-construction measurements indicate that the plastic concrete
cutoff and foundation alluvium have similar deformation characteristics
(Table 3).
Verney Dam
36. The Verney Dam (Tardieu and Costaz 1987) is a 42-m high earth
embankment dam on the Eau D'Olle constructed in 1982 that creates the down-
stream reservoir for the pump/turbine station at Grand-Maison, France. A
profile of the dam is shown in Figure 6. A 50-m deep plastic concrete dia-
phragm wall was installed in the foundation alluvium along the ustream toe as
part of a waterproofing system that also included an asphalt coating on the
upstream face. Gaps were left in the cutoff to allow for natural recharge of
the downstream aquifer. The mix design used was as follows:
Cement factor 277 lb/cu ydPercent bentonite 71 %Water-cement ratio 1.9Fine-coarse aggregate ratio 1.5
37. Stress-strain curves from triaxial tests on samples of the mix
design are shown in Figure 7. Figure 7 indicates that peak deviator stress,
elastic modulus, and strain at failure all increase with increases in
confining stress. The permeability of the mix design is about 1*10-9 cm/sec,
measured in the laboratory.
Mud Mountain Dam (MMD)
38. MMD (US Army Engineer Division, North Pacific 1987) is a 425-ft
high earth and rockfill flood control dam located on the White River in
Enumclaw, WA. The United States Army Corps of Engineers considered installing
a plastic concrete diaphragm wall in the core as part of a remedial seepage
control program (see Paragraph 27). Instead, a conventional concrete cutoff
was installed.
21

90 DAYSa Kg/cm2 28 DAYS
32 a Kg/cm2
32 16 3
28 22 12 1
24 1 08 2
20 0314
16 200 0.2 0.4 0.6 0.8
123 a gc AYS8 2
0 C 0rL 30 0.2 0.4 0.6 0.8 0 0.2 0.4 0.6 0.8
Figure 5. Unconfined compression tests on samplestaken during construction of Golbun Main Dam
(Noguera 1985)
Table 3
Comparison of the Behavior of Golbun Main Damt Plastic
Concrete Diaphrag-m Wall with the Behavior of
Foundation Soil Prior to Impoundiny- of
Reservoir (Noguera 1985)
1)iaphrurn m cutoff wall
Triaisial ts au'in situ-
fI ailtire 4 415 1 31-0 60t "'0V I adiiire 579 kg/crn'1- 7 S I" 2,8(0) kg/L.ni' E 3,200-5,s00 kg crn'
mI i h, 4ii1 k g. Cin
F outndati on all iivi urns
Triaxial test "Valuie% in situ"
I ll(Ire 4,17 W 0. 20 0. IN) "'aI I allure 501 kr' crnI 7S Oo 920 km utiF 2,000-5,M(E kg'cn'
initial 3 , g CttI,
22

loin
* S CAPPING BEAM C BLANKET DRAIN:...
* .' DAPHRAGM WELL t.
loom, FLUVIO - MORAINIC ALLUVIUM '
* .. S' * of S. * ,
TYPICAL SECTIONFigure 6. Profile of Verney Dam (Tardieu 1987)
o1a(MP*) St)- 174 Ps
4
So li~e Ps BLOCK 13
4f,
6 BX I
0 ( *(%)
23

PART III: LABORATORY TESTING TECHNIQUE
39. Throughout the research program, established American Society for
Testing and Materials (ASTM) standards were used wherever possible to ensure
quality and consistency. However, difficulties encountered when trying to
consolidate wet 8-in. slump plastic concrete for the CIUC tests required the
development of some nonstandard procedures. In the following sections the
procedure for each type of tests performed in the research is described, and
where applicable, references to ASTM standards are given. In addition, where
nonstandard test procedures are described, any related ASTM standards are
referenced. Descriptions of the materials used to make the plastic concrete
specimens are presented first. A summary of the general fabrication and
curing procedure used to make the unconfined compression, splitting tensile,
flexural beam, and Q test specimens is then presented followed by descriptions
and summaries of unconfined compression, splitting tensile, and flexural beam
test equipment and procedures. Finally, descriptions of Q, CIUC, and perme-
ability test equipment and procedures are presented.
Materials
40. The choice of materials was driven by two main considerations:
a. Results of testing program had possible application in design
of the Mud Mountain Dam cutoff wall. Therefore, materialshould match as closely as possible those used by NPDEN fortheir preliminary plastic concrete test program. A comparison
between the grain size curves of the NPDEN aggregate and grainsize curves of the aggregates used in this research program isshown in Appendix B, Table Bl. Table Bl shows that there is no
significant difference between the groups of aggregates.
b. Materials should represent types commonly available throughoutmost of the United States.
Descriptions of the actual materials used are discussed below.
Cement
41. Ironclad brand type I portland cement was used throughout the test
program. Chemical analysis performed by the US Army Engineer Waterways Exper-
iment Station (WES) confirmed that this cement conformed to ASTM designation
C-150 (Appendix B, Table B2). For batch design, the specific gravity of
solids (G_) was taken as 3.15.
24
Bentonite
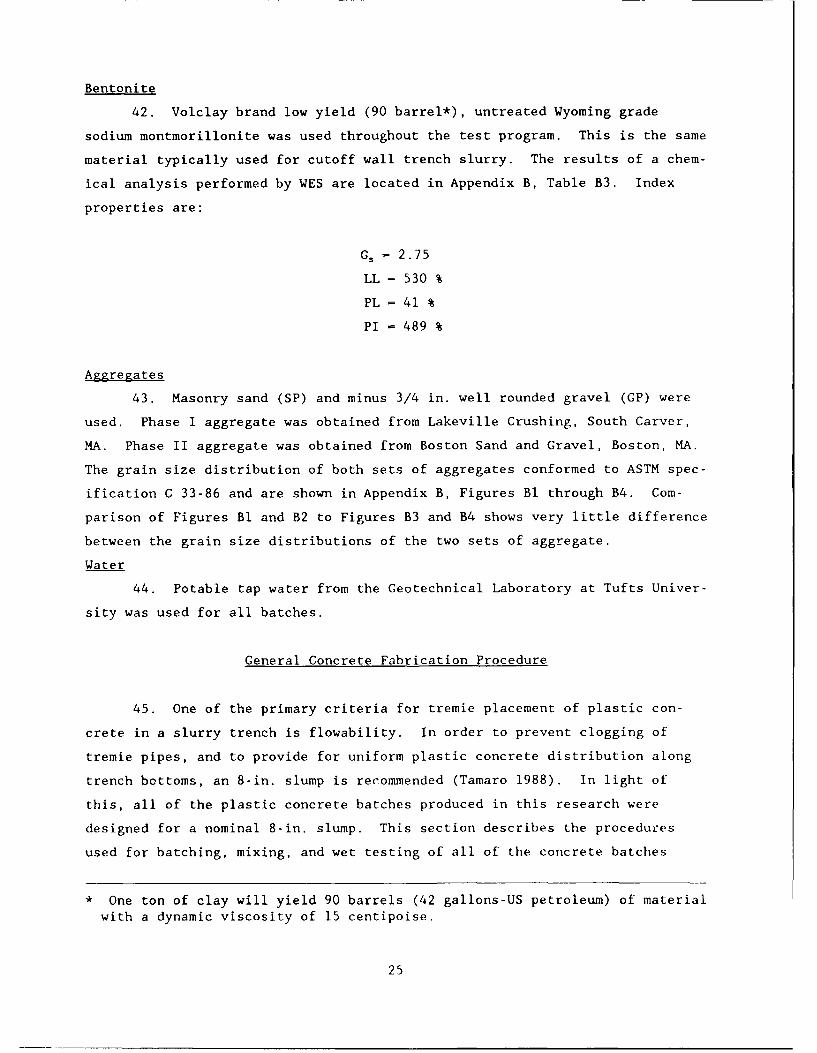
42. Volclay brand low yield (90 barrel*), untreated Wyoming grade
sodium montmorillonite was used throughout the test program. This is the same
material typically used for cutoff wall trench slurry. The results of a chem-
ical analysis performed by WES are located in Appendix B, Table B3. Index
properties are:
G, = 2.75
LL = 530 %
PL = 41 %
PI 489 %
Aggregates
43. Masonry sand (SP) and minus 3/4 in. well rounded gravel (GP) were
used. Phase I aggregate was obtained from Lakeville Crushing, South Carver,
MA. Phase II aggregate was obtained from Boston Sand and Gravel, Boston, MA.
The grain size distribution of both sets of aggregates conformed to ASTM spec-
ification C 33-86 and are shown in Appendix B, Figures Bl through B4. Com-
parison of Figures BI and B2 to Figures B3 and B4 shows very little difference
between the grain size distributions of the two sets of aggregate.
Water
44. Potable tap water from the Geotechnical Laboratory at Tufts Univer-
sity was used for all batches.
General Concrete Fabrication Procedure
45. One of the primary criteria for tremie placement of plastic con-
crete in a slurry trench is flowability. In order to prevent clogging of
tremie pipes, and to provide for uniform plastic concrete distribution along
trench bottoms, an 8-in. slump is recommended (Tamaro 1988). In light of
this, all of the plastic concrete batches produced in this research were
designed for a nominal 8-in. slump. This section describes the procedures
used for batching, mixing, and wet testing of all of the concrete batches
* One ton of clay will yield 90 barrels (42 gallons-US petroleum) of material
with a dynamic viscosity of 15 centipoise.
25

produced in this research program. The fabrication and curing procedures for
conventional test cylinders and flexural beams are also included.
Batch design
46. All batches were proportioned by the absolute volume method
described in ACI Standard 211.1-81 (CRD-C 99-82). Consistent with this
method, the following batch proportion parameters were used to describe the
plastic concrete batches:
Cement factor - The cement factor was defined as the total amount,by weight, of cement and bentonite in a cubic yard of plasticconcrete:
cement factor - (weight cement + weight bentonite) percubic yard
Bentonite content - Percentage of cement factor, by weight, whichis bentonite. The bentonite content is calculated using the fol-lowing equation:
bentonite content, % = weight of bentonite * 100cement factor
Water-cement ratio - The weight equivalency method was used todescribe the amount of water in a batch:
water-cement ratio - weight of waterweight of cement + bentonite
Coarse-fine aggregate ratio - In order to produce tremie plasticconcrete (Tamaro 1988), the ratio by weight of fine to coarseaggregate (ratio of sand to gravel) for all batches was approxi-mately 1.1. In addition, since the sand and gravel used both hadmeasured specific gravities of 2.65, the coarse to fine ratio byvolume was also 1.
47. For a given cement factor and percent bentonite, a water-cement
ratio was estimated from previous experience that would produce an 8-in.
slump. The actual weights and volumes of cement, bentonite, and water
required to produce a cubic yard of concrete were then calculated. The
required volume of fine and coarse aggregate was then taken as the difference
between a cubic yard and the sum of the volumes of cement, bentonite, and
water. The weight of fine and coarse aggregate was then back calculated from
26

their volumes. The weights of all the constituents were then corrected for
hygroscopic moisture content and scaled to produce the desired batch volume.
After the batch was made, the cement factor and water-cement ratio were cor-
rected for any additional water added during mixing (see Paragraph 48). An
illustrative batch design example can be found in Appendix B, Table B4.
Plastic concrete mixing procedure
48. All plastic concrete batches were mixed at 25 revolutions/min in a
stone brand six cubic foot power concrete mixer. The procedure which was
generally followed corresponded to ASTM specification C 192-81, para-
graph 6.1.2 (CRD-C 10-81). The modified procedure used is a follows:
a. Water content tests were performed on cement, bentonite, sandand gravel to determine hygroscopic moisture. Figure 8 showstypical quantities of materials used for water content test.
b. The bentonite and the cement were mixed together dry in a 5-galbucket.
c. Approximately one-half of the sand, gravel, and water wereadded to the mixer and mixed for approximately 15 sec.
d. Approximately one-half of the cement-bentonite mix was added tothe turning mixer.
e. The remaining sand, gravel, and cement-bentonite mix was addedto the turning mixer, along with enough of the remaining waterto produce an 8-in. slump upon visual inspection.
f. Batches containing bentonite tended to "stiffen" in the mixerover time as the bentonite absorbed water. To counter this,the remaining water and, if necessary, additional water wasadded approximately every 10 min to maintain an 8 -in. slump.Additional water was added until the mix no longer "stiffened,"generally about 45 min.
g. Total mix time was approximately 10 min for batches with 0 per-cent bentonite and 45 min for batches with 10 to 60 percentbentonite.
49. An attempt was made to premix the bentonite and water in a bucket
to form a slurry, as is commonly done in slurry trench field operations. This
was unsuccessful due to balling of the bentonite. A special colloidal mixer
would have been necessary to overcome this problem, but was deemed beyond the
scope of this project. Therefore, the bentonite was dry mixed with the cement
before being added to the mixer (as described above) to help ensure uniformity
of the mix. In addition, the water content required for pumpable slurry is
approximately twice the liquid limit, or 100 percent for the bentonite used in
this research program. Based on estimated water-cement ratios, the use of
27
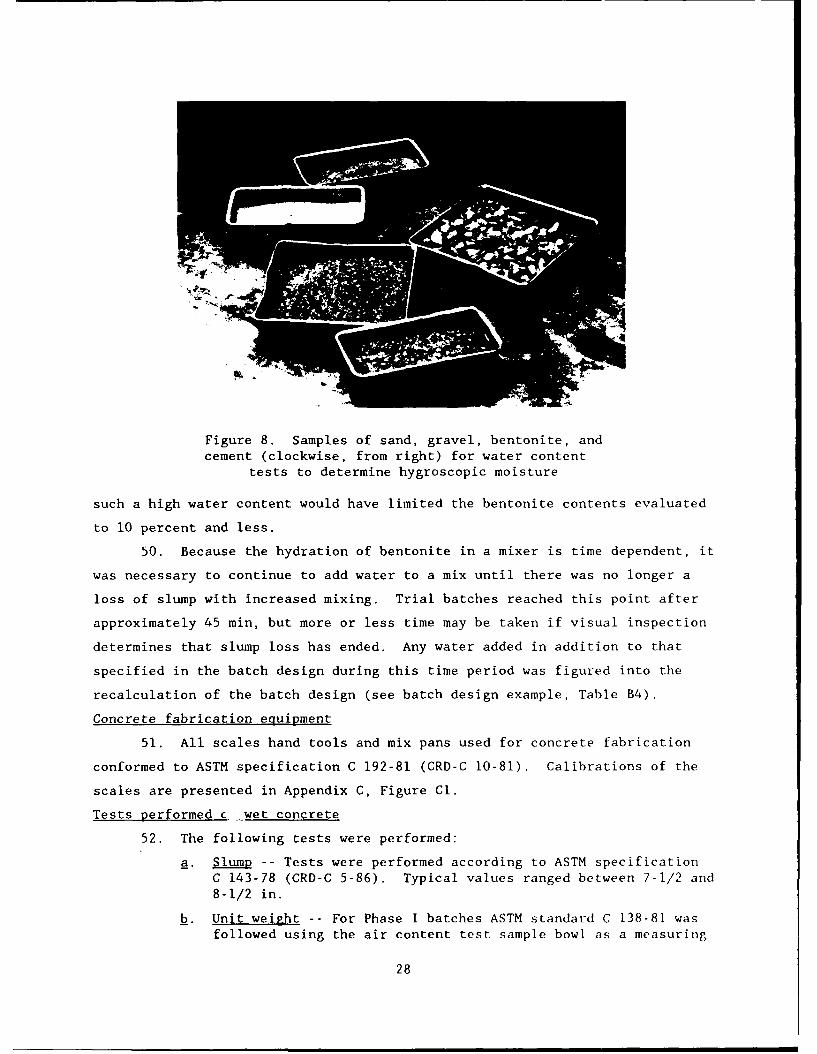
Figure 8. Samples of sand, gravel, bentonite, andcement (clockwise, from right) for water content
tests to determine hygroscopic moisture
such a high water content would have limited the bentonite contents evaluated
to 10 percent and less.
50. Because the hydration of bentonite in a mixer is time dependent, it
was necessary to continue to add water to a mix until there was no longer a
loss of slump with increased mixing. Trial batches reached this point after
approximately 45 min, but more or less time may be taken if visual inspection
determines that slump loss has ended. Any water added in addition to that
specified in the batch design during this time period was figured into the
recalculation of the batch design (see batch design example, Table B4).
Concrete fabrication equipment
51. All scales hand tools and mix pans used for concrete fabrication
conformed to ASTM specification C 192-81 (CRD-C 10-81). Calibrations of the
scales are presented in Appendix C, Figure Cl.
Tests performed c wet concrete
52. The following tests were performed:
a. SlumR -- Tests were performed according to ASTM specificationC 143-78 (CRD-C 5-86). Typical values ranged between 7-1/2 and8-1/2 in.
b. Unit weight -- For Phase I batches ASTM standard C 138-81 wasfollowed using the air content test sample bowl as a measuring
28

container. For Phase II batches, the actual concrete cylinderspecimens were used as measuring containers. This methodallowed for multiple independent unit weight calculations (asmany calculations as specimens formed), and therefore provideda measure of batch consistency. Typical values ranged between125 and 145 lb/cu ft. Unit weight decreases with increasingbentonite content because water comprises a larger fraction oftotal batch weight as bentonite content increases.
c. Air content -- Air content tests conformed to ASTM specifica-tion C 231-82 (CRD-C 41-84) for a type B air content meter.Typical air content values ranged between 0.2 percent and2 percent.
d. Water content -- Oven-dry water content tests were performed onwet concrete to develop a correlation between calculated watercontent and oven dry water content. Calculated water contentis the ratio of weight of water to combined weight of othermaterials (cement, bentonite, and aggregate) used to form thebatch. Oven dry water content tests were performed in accor-dance with ASTM standard D 2216 for soils. Typical values ofoven dry water content ranged between 8 percent and 22 percentand the ratio of oven-dry to calculated water content rangedfrom 0.53 to 0.92 and averaged 0.74. This ratio can be usedfor field quality control to estimate the wet water content oftremie concrete from a sample taken from the top opening of thetremie pipe.
e.pH -- The pH of wet concrete was determined for some Phase IIbatches with quantitative pH paper to ensure the proper suspen-sion of bentonite in the mix. Typical values ranged between 11and 12 (pH range for suspension of bentonite = 9.5 to 12)(Sliwinski and Fleming 1975).
f. Temperature -- Temperature measurement of wet concrete con-formed to ASTM specification C 1064-88 (CRD-C 3-87). Tempera-ture was usually measured by inserting a thermometer into theconcrete mound left by a slump test. Typical values rangedbetween 64 and 700 F.
Fabrication of conventionalplastic concrete test cylinders
53. The formation of 6- by 12-in. cylindrical tests specimens for all
unconfined compression, splitting tensile, and unconsolidated undrained com-
pression (Q) tests conformed to ASTM C 192-81 (CRD-C 10-81). Specimens were
formed using standard 6-in. diam by 12-in. high molds in three layers of
approximately 4 in. thick. Each layer was rodded 25 to 30 times and vibrated
by hand to ensure proper consolidation. Figure 9 shows test cylinders being
formed.
29

Figure 9. Six in. by twelve in. plasticconcrete cylinders being formed
54. Initially, cylinder molds made of plastic were used to form all
specimens in Phase I. However, scarification problems were encountered when
extracting the first high bentonite content (BEN = 40 and 60 percent) speci-
mens from the plastic molds after the recommended ASTM period of 2 days.
Thereafter, ASTM approved peel-off wax coated cardboard cylinder molds were
used for all high bentonite specimens formed in Phase I. Due to general ease
of use and better specimen quality, it was subsequently decided to use the
cardboard molds exclusively for all Phase II specimens.
Fabrication of flexural beam specimens
55. All flexural beam specimens were formed in 6-in.-wide by 6-in.-high
by 24-in.-long rectangular steel molds in accordance with ASTM specifica-
tion C 192-81 (CRD-C 10-81).
30
Curing of concrete test specimens
56. All plastic concrete test specimens were cured in either a wet room
or cure box environment. Figures 10 and 11 show specimens in the wet room and
cure box, respectively. The wet room lacked temperature control, but humidity
control was provided by an air/water mist system. During Phase I testing,
specimens from the same batches were stored in both locations to evaluate
their performance. Comparison of unconfined compression test results showed
that curing location had no effect on the mechanical properties of the cylin-
ders, as shown in Figure 12. Each data point represents cylinders of the same
age and batch composition.
57. Monitoring of both locations over 60 days produced the following
performance criteria:
a. Wet room:
Temperature range: 62 - 720 F(measured with min-max thermometer)
Humidity: >95%
(measured with wet-dry bulb thermometer)
Free water: often observed on surfaceof specimens
b. Cure box:
Temperature range: 68 - 720 FHumidity: >95%Free water: some observed
These criteria conform to ASTM specification C 192-81 (CRD-C 10-81) except for
temperature range (73 +/- 30 F). In addition, all specimens were stripped
from their molds 20 to 48 hr after fabrication, as required by ASTM C 192-81.
Unconfined Compression Test Procedure
58. Twenty-one batches of plastic concrete were formed for unconfined
compression testing during Phase I. A summary of the nominal mix design for
each batch is presented in Table 4. For most batches, fifteen 6- by 12-in.
cylinders were formed and broken in groups of three at nominal ages of 3, 7,
28, 90, and 365 or more days. Three cylinders were tested at each age to
ensure statistical accuracy, as recommended in ASTM designation C 192-81. In
31

Figure 10. Six in. by twelve in. plastic concretecylinders curing in wet room
Figure 11. Six in. by twelve in.plastic concrete cylinders curing
in CIre box

2 0 0 0 . ....... i. i. ...........................
0..1750
E00X 1500 0
1250
C
10000
7500I-) 0L
Eo 500
c) 250-
0 250 500 750 1000 1250 1500 1750 2000Ultimate Compressive Strength, Cure Box, psi
Figure 12. Ultimate compressive strength of samplescured in the wet room versus ultimate compressive
strength of samples cured in the cure box
addition, two companion unconfined compressions were performed for each of the
20 CIUC batch designs tested in Phase II.
59. For all of the 291 unconfined compression tests performed in both
phases, continuous load and deformation readings were recorded in order to
evaluate the stress, strain, and strength characteristics of each specimen. A
compilation of the data is presented in Appendix D, Table Dl and will be dis-
cussed more fully in Part IV. All tests were performed using ASTM C 39-86
(CRD-C 14-87) and ASTM C 469-83 (CRD-C 19-87) as guidelines, but some
procedure and equipment modifications were made as noted. All tests were
performed at a deformation rate of 0.05 in./min +/- 0.005 in./min.
Measurement of uncon-fined compression test samples
60. After curing in either the cure box or wet room for a specified
amount of time, samples were removed and examined for signs of damage. Speci-
mens too damaged to cap were discarded. Typically, the high bentonite content
(BEN - 40%, 60%) specimens were most likely to be damaged during mold
33

Table 4
Summary of Nominal Batch Designs for Phase I Unconfined Compression Tests
Nominal Cement Percent Nominal Water/Batch ID* Factor, lb/cu yd Bentonite Cementq-Bentonite
060387-1 300 0 0.8
060487-1 300 20 1.4
060587-1 300 20 2.0
061087-1 300 40 1.6
061287-1 300 60 2.6
061687-1 400 0 1.0
061887-1 400 20 1.2
061887-2 400 40 2.0
062387-1 400 60 2.0
071387-1 250 0 1.0
071487-1 250 20 1.6
072187-1 250 40 2.2
072787-1 250 60 2.2
102387-1 290 0 1.4
102687-1 290 20 1.8
110387-1 240 10 1.9
110387-2 280 10 1.8
110387-3 320 10 1.6
111087-1 360 10 1.4
111387-1 330 0 1.2
111387-2 260 20 2.1
* Batches listed in chronological order of fabrication. Batch ID - date of
fabrication.
34
stripping and handling because of their low strength. Any loose aggregate on
the sample ends was removed.
61. The length and the diameter of samples were measured as follows:
a. Length: All Phase I samples were measured with a 12-in.vernier, precise to +/- 0.0005 in. All Phase II samples wereplaced vertically on a piece of plate glass and measured with a24-in. machine scale, precise to +/- 0.008 in.
b. Diameter: All Phase I samples were measured at top, middle,and bottom with a 6-in. micrometer, precise to +/- 0.0005 in.All Phase II samples were measured at top, middle, and bottomwith a double carpenters scale, precise to +/- 0.008 in.
End capping of uncon-fined compression samples
62. Test specimens were capped with sulfur capping compound in order to
assure the planeness and perpendicularity required by ASTM specification
C 39-86 (CRD-C 14-87). The sulfur compound used has a rated strength of
14,000 psi. The capping procedure was performed in accordance with ASTM
specification C 617-85b (CRD-C 29-86). The end capping fixture used and an
example of a capped cylinder are shown in Figures 13, 14, and 15.
63. In an attempt to make end capping quicker and eliminate exposure to
toxic sulphur fumes, some Phase I specimens were tested with a neoprene
capping system developed by the New York Department of Transportation (Amsler
and Grygill 1977). The neoprene system proved unsatisfactory for low strength
samples because of spalling of sample ends during compression due to shear
stresses developed at the neoprene-specimen interface. The spalling caused
reduction in area and, in turn, lower loads at failure than a comparable
sulfur-capped specimen. In addition, the samples tested with neoprene end
caps failed by vertical splitting, rather than the diagonal cracking typical
of specimens with sulphur end caps.
64. Twenty Phase I specimens were tested with the neoprene capping
system before its use was discontinued. These tests are identified in the
unconfined test summary (Table DI) by the designation NEOP in the "strain"
column. In order to use the data from these tests in the general analysis of
the unconfined compression tests, a correction procedure was developed and is
described in Paragraph 148.
35
a T
Figure 13. End capping and sulphur warming potunder ventilation hood
Fi gure 1s. Samnple bei ng Figi 1 . Exa~mple of cappcdc:appedI ill Fixture1 p1;. ;tc C(onlcrete 'c'l ilidel-
3"

Measurement of axial loadfor unconfined compression tests
65. All unconfined compression tests were performed with a constant
rate of deformation Riehle Model FS-300 testing machine. This machine has a
screw-driven loading platen with a minimum deformation rate of 0.04 in./min
and a maximum load capacity of 300,000 lb. Loads are measured internally with
a beam-type reaction system and displayed on a large analog dial gage. The
dial gage has six loading ranges:
Range, lb Precision, lb
0-3,000 50-15,000 250-30,000 500-63,000 1000-150,000 2500-300,000 500
66. Figures 16 and 17 show the Riehle testing machine and a close up of
its load head crushing a 6- by 12-in. sample. Calibrations of the Riehle
testing machine are located in Appendix C, Figures C2 and C3.
67. Loads were read manually by the operator of the Riehle testing
machine and hand recorded. Corresponding deflections were read manually by an
assistant from a dial gage attached to the test specimen and hand recorded.
Accurate reading of peak loads was ensured by a dial pointer follower. In
order to develop complete stress-strain curves, deflection readings were taken
at least six loads prior to peak load and, in most cases, at least two loads
after peak.
Measurement of deflectionfor unconfined compression tests
68. During Phase I, strain was initially calculated from the gross
deflection of the load head of the testing machine as measured by a dial gage
rigidly mounted to the loading platform. This gage had a precision of
+/- 0.0005 in. Midway through Phase 1, a compressometer conforming to ASTM
specification C 469-83 (CRD-C 19-87) was purchased for measurement of
deflection. The gage mounted on the compressometer had a precision of
+/-0.0005 in. Schematic diagrams of the gross deflection system and com-
pressometer are shown in Figures 18 and 19.
69. Subsequent Phase I tests were performed using both the gross
deflection method and the compressometer method to establish the
37

Figure 16. Riehle testing machine and general
testing equipment setup
Figure 17. Load head of Riehle testing machinecrushing 6- by 12-in. sample (no deflection
measurement shown)
38

P
LOAD HEAD
NOTE: G - 12 in.
SPECIMENSPECIMEN DIAL GAGE (A)
Figure 18. Schematic diagram of gross deflection system
P
NOTE: G = 8in. LOAD HEAD= (A/2)/G
PIVOT
COMPRESSOMETER 41(
SPECIMEN PV DIAL GAGE (A)
FIXED
77 7777777 //77Figure 19. Schematic diagram of compressometer system
39

relationship between the two. For a given batch design and age, three samples
were typically broken to ensure statistical confidence. Two of these samples
were tested using the gross deflection method, and one sample was tested using
the compressometer. If less than three cylinders were available for a given
batch design and age, at least one test was performed using the
compressometer.
70. A comparison of the strain at failure of specimens of the same age
and batch design calculated with gross deflection and compressometer data is
shown in Figure 20. Figure 20 shows that the scatter in strain at failure
data is greater than any difference caused by the different deflection mea-
surement systems. Only the compressometer was used to measure the deflections
of unconfined compression tests performed in Phase II.
0.006 . . .. .
0 1S0.0040
. 0
00o Oi 0
c0.002 000 0
U0
O
0.002 0 oOI
0.000 0.002 0.004 0.006Ultimate Strain, Compresometer, in./in.
Figure 20. Ultimate strain measured withcompressometer versus ultimate strain
measured by gross deflection
Post-failure water contenttests on unconfined compression tests
71. Post-failure water content tests were conducted on some unconfined
compression tests to evaluate the relationship between water content at mixing
and water content after curing. This was done as part of a separate, concur-
rent research program and is not part of the scope of this study.
40

72. After compression testing, one cylinder from each test group of the
same age and batch design was broken into pieces less than 1 in. in size, and
a water content was performed on pieces taken from the core. Standard oven-
dry soils testing water content test procedure (ASTM D 2216) was used.
Brazilian Splitting Tensile Test Procedure
73. Brazilian splitting tensile tests were performed on 45 specimens
from six batches of plastic concrete to evaluate the effect of bentonite con-
tent, cement factor, and age on splitting tensile strength. The nominal mix
designs and test ages for each batch area listed in Table 5. The results of
the tests are discussed in Paragraph 114. In addition, one companion
Brazilian splitting tensile test was performed for each of the 20 CIUC tests
performed in Phase II.
74. All splitting tensile tests were performed in accordance with ASTM
specification C 496-85 (CRD-C 77-85). All tests were performed with the
Riehle testing machine at a deformation rate of 0.05 in./min +/-
0.005 in./min.
Table 5
Summary of Nominal Batch Design for Phase I Splitting Tensile Test
(Brazilian) and Flexural Beam Test
Nominal Cement Percent Nominal Water/Batch ID* Factor, lb/cu yd Bentonite Cement+Bentonite
053088-1 250 0 1.5
060288-1 340 0 1.2
060288-2 260 20 2.0
061988-1 340 20 1.7
062288-1 260 60 2.4
062288-2 340 60 2.3
* Batches listed in chronological order of fabrication. Batch ID = date of
fabrication.
Measurement of Braziliansplitting tensile test specimen
75. After the specified curing time, test samples were examined,
cleaned, and measured as described in Paragraph 60. Two diametrical lines in
41
the same plane were then drawn across both sample ends to use as guides to
align the specimen with the test apparatus.
Positioning of Braziliansplitting tensile test specimen
76. A 1-in. wide by 1/8-in, high by 12-in. long plywood strip was
placed across the lower bearing block. The test cylinder was then placed
horizontally on the plywood strip so that the lines marked on the ends of the
cylinder were vertical and centered over the plywood strip. A second plywood
strip was then placed lengthwise across the top of the cylinder and centered
on the lines marked on the ends of the cylinder. A supplementary bearing bar,
as described in ASTM specification C 496-85, was then placed on top of the
upper plywood strip. The load head was then brought into contact with the
supplementary bearing bar.
Measurement of load forBrazilian splitting tensile test
77. The peak load was read manually by the operator of the Riehle
testing machine from the dial pointer follower and hand recorded. Splitting
tensile strengths were then calculated as described in ASTM standard C 496-85.
Post-test water content tests were performed as described in Paragraph 71.
Flexural Beam Tcst Procedure
78. One 6-in. wide by 6-in. high by 24-in. long flexural beam was cast
in a steel mold for each preliminary Brazilian tensile test batch and tested
in single-point simply supported flexure at an age of 28 days, in accordance
with ASTM specification C 293-79 (CRD-C 17-80). All tests were performed with
the Riehle testing machine at a deformation rate of 0.05 in./min. +/-
0.005 in./min.
Measurement of flexural test sample
79. After curing, the length, width at center, and thickness at center
were measured to a precision of +/- 0.008 in. Post test measurements of the
width and thickness of the beam at the point of rupture were taken and, if
different from the initial measurements, recorded for use in calculation of
the modulus of rupture.
80. The span length was then calculated using the equation:
42

L - 3D
where
L - Span length
D - Beam thickness
Support point marks were then drawn on the beam at distances of L/2 from the
beam center line. A line was also drawn at the center line to locate the
single center point load.
Positioning of flexural test
sample and measurement of load
81. Test beams were placed on the simple supports such that each sup-
port was lined up with a span mark on the beam, and the center point load
block was lined up with the center line of the beam and the center line of the
load head. Beams were then loaded and the peak load was manually recorded by
the testing machine operator. Modulus of rupture was then calculated as
described in ASTM standard C 293-79.
Erodability Test Procedure
82. Two tests were performed to measure the resistance of plastic con-
crete to erosion by seepage through cracks. Both tests were performed accord-
ing to a nonstandard procedure originally developed by the NPDEN W.O.
No. 87-C-329 for their preliminary plastic concrete testing program. Crack
conditions were simulated by casting a 3/16-in. hole through each sample and
flowing water through it at a velocity of 17 ft/sec. One test had a bentonite
content of 0 percent and the other had a bentonite content of 60 percent.
Both tests had cement factors of 300 lb/cu yd, and erosion measurements were
taken continuously between ages 3 and 8 days with a No. 200 sieve.
Description of mold used
to cast erodability specimens
83. Erodability test specimens were formed using a modified 6- by
12-in. cardboard cylinder mold (Figure 21). Modification procedures were as
follows:
a. A 1/4-in. Swagelok bulkhead fitting (inside diameter:
3/16 in.) was installed in a hole drilled in the center of themetal bottom of the cardboard mold. Buna O-rings were used to
seal the joint.
43

3/16 A. DLtA*ETER ALtAAM ROD
1/4 ff. SWAGELOK PIPE THREADFITTNG SET IN TAPPED HOL.E I
CENTERING PLA TE
I I. WIDE ALLWMM'CENTERING PLATE*
SETS IN SLOTS7- IN CARDBOARD MOLD
6 .DAMTRB12I.HIHSADRCADORDCLNDRML
NUT
i m A . S W G E L O B U K H E A A w v m w B T T O
12in erosio testl STANDARD
4AD4R YLNE ~

b. A 1/4-in. Swagelok pipe thread fitting was installed in a holedrilled in a I- by 8- by 1/4-in. piece of aluminum.
c. The piece of aluminum with the pipe thread fitting was theninstalled into 1/4-in, slots cut into opposite sides near thetop of the mold. The piece of aluminum was adjusted until bothfittings were on the same axis.
d. A 3/16-in. aluminum rod was then inserted through bothfittings. The rod was coated with vacuum grease to help sealthe bottom fitting and make later removal of the rod easier.
Sample set-up anderodibility measurement
84. A schematic diagram of the general erosion test setup is shown in
Figure 22. The sample setup for testing procedures was as follows:
a. The modified cylinder was filled with wet concrete using thesame procedure as for unconfined compression cylinders as dis-cussed in Paragraph 53. Care was taken so as not to cover thethreads of the top fitting.
1/4 IN. PLASTIC TUBING
FROM TAP --
SAMPLE
NO. 200 SIEVE
WIRE MESH
MILK CRATE
-. FLOOR
GRATE/ 7,S.777.777
SUMP DRAIN
Figure 22. Schematic diagram of general erosion test setup
45

b. The cylinder was allowed to cure in the open laboratory, forfear that moving the specimen might cause excessive cracking,To prevent drying of the specimen, the mold was left on so thatthe entire curing period and the top would keep moist. Thealuminum rod was gently rotated periodically to prevent it fromadhering to the concrete.
C. At the required age, the mold was stripped and the aluminum rodremoved. A 1/4-in.-diam hose carrying city water at 75 psi wasthen attached to the top fitting and a No. 200 sieve was placedbeneath the bottom fitting.
d. The water was turned on and flow rate calculated.
e. The No. 200 sieve was periodically checked for eroded material.If significant material was observed, the test was stopped andthe material weighed.
f. The test was continued until it was determined that there wasnot change in the erosion rate.
Triaxial Testing Equipment
85. Most of the equipment used in the triaxial test program was stan-
dard soils testing equipment. Some pieces of equipment, however, were special
made for this test program.
Triaxial cell and accessories
86. The following contains a listing of equipment used in the tests.
a. Triaxial cell. Two Geotest brand model S5050 high pressuretriaxial cells were used to perform all tests. A photographand schematic diagram of one of the triaxial cells are shown inFigures 23 and 24. Extensive modification was done to thecontrol valve system in order to make it simpler to operate andto accommodate pressure transducers. A schematic representa-tion of the final valve scheme is included in Figure 24. Alldeflection measurements were corrected for the machine deflec-tion of the triaxial cells. Critical features of the cellsare:
Standard sample size 6-by 12-in. cylinderMaximum cell pressure 400 psiMaximum axial load 85,000 lb/ftPiston bearing low friction teflon
sleeveDrainage platens dual-outlet flush
through top cap and
pedestalValve control positive on-off brass
Whitey ball valves
46

Figure 23. Geotest triaxial cell
Deflection measurement 0.0001-in. dial gagerigidly mounted topiston
b. Porous stones. A number of 6-in.-diam 1/8-in.-thick bronzestones were used (corundum stones were used in early tests butcould not withstand the high stresses).
c. Filter paper. Standard 6-in.-diam medium filter paper was used
for all tests.
d. Membranes. 6-in.-diam, 18-in.-long, 0.025-in.-thick latexrubber membranes were used for all tests. For most tests, twomembranes were used (double membranes) with a layer of vacuumgrease between them to reduce any membrane leakage.
e. Sealing rings. 5-1/4-in.-diam, 3/16-in.-thick buna rubber
O-rings were used to seal membranes against top cap andpedestal.
f. Sealing grease. Dow Corning brand high vacuum grease was usedto help seal all O-ring joints, membrane top cap/pedestal con-nections, and double membranes.
g. CIUC sample mold (consolidometer). A 6-in.-diam (inside)14-in.-long aluminum split-mold which attaches to pedestal wasused to facilitate the forming of wet concrete samples insidethe membrane. The device was made from stock aluminum tube cutin halves axially and machined inside to fit over membrane when
47

TEFLON BEARING SLEEVE
1/8e PLASTIC TUBING -C
GORINGS
FILTER PAPERHOOD POROUS STONE
SAMPLE
o'--- MEMBRANE
POROUS STONEPEDESTAL "
FILTER PAPER--- GRINGS
CLAMPING RINGN
S- -PORE PRESSURE TRANSDUCER
TOP CAP VALVES BASE PEDEST VALVES
CELL PRESSURE TRANSDUCER CELL FLUID VALVE
Figure 24. Schematic diagram on Geotest triaxial chamber with 6- by 12-in.
sample inside
48

mounted on the pedestal. Halves were held together during
tests by standard duct tape. Swagelok fittings were attachedto each half to permit application of vacuum to hold the mem-
brane to inner wall during sample formation.
h. Pore pressure transducers. Validyne brand model DPI5 variable
reluctance differential pressure transducers were used to mea-
sure cell pressure and head difference during permeability
testing for all CIUC tests. Voltage output was read by a
multimeter. Transducers were calibrated, on average, every
other test using a Refinery Supply Company model 35260-4 dead
weight tester. The dead weight tester was calibrated annually.
Triaxial back pressure and
consolidation fluid control
87. For all CIUC triaxial tests, back pressure consolidation was
controlled by a Brainard-Kilman pressure control panel. A photograph and
schematic diagram of the panel are shown in Figures 25 and 26. During con-
solidation, two accumulators were used for each triaxial cell, one controlling
the top cap and the other controlling the pedestal. Each accumulator consists
of 25 ml graduated pipette, precise to +/- 0.05 ml, and a 100 m (approxi-
mately) ungraduated annulus. The annulus and pipette can be used to measure
volume change either alone or together, depending on flow requirements and
order of precision required.
OWN 1 .
Figure 25. Two Bra inard- Ki Iman panel boards
49

I-- Pressure Positions --1 2 3
R e dout 1 12 8 - J R 0Section ' ofg c q orc 0r 1 1'eg .3I Reunto R egulator 2 Regulator 3
reo .
PanelControl
Section supply press
AQ
masterregulator
Tank dac D i press.Control both both bothSection of M ip.anuli pj anul. P
"fi ,dra in n I~., 2 id,=,E off off offdeird 2o 5 drain h2o 1rnh2odan
nq h2o 0drain
in drat 0 o
Figure 26. Schematic diagram ofBrainard-Kilman panel board
50

88. Back pressure for each accumulator was independently controlled by
a Fairchild bleeding regulator. Maximum allowable back pressure was 200 psi.
Back pressure for CIUC test program was provided by an air compressor
operating at 120 psi delivery pressure. Back pressure was measured in two
ways:
a. Panel board mounted transducer attached to bleeding regulators.
b. Pressure transducer mounted on cell pedestal drainage port(s).
89. All fluid used for application of back pressure and permeability
testing was de-aired tap water stored under vacuum.
Triaxial cell pressure control
90. For all CIUC and Q tests, cell pressure was applied using a gas
pressure over water system. Gas pressure was supplied by high pressure
(2,300 psi) nitrogen bottle fitted with a two-stage, non-bleeding union
carbide regulator rated at 3,000 psi. The gas-water interface was located in
a high pressure stainless steel reservoir, as shown in Figures 27 and 28.
4
Figure 27. High pressure stainlesssteel reservoirs containing cell
pressure glass-water interface
51

-.*TE-GAS PRESSUREFROM NITROGENGAS BOTTLES
ON/OFF 1/4 IN.WHITNEY BALL VALVE
1/4 IN. PLASTIC TUBING STAINLESS STEEL HIGHTO OBSERVE WATER PRESSURE RESERVOIRLEVEL IN RESERVOIR
GAS-WATER INTERFACE
ON/OFF 114 IN.
WHITNEY BALL VALVE
-WATER LINE FROMTAP TO FILL
TRIAXLL CELLAND PRESSURE
RESERVOIR
TO TRIAXIAL CELLFLUID VALVE
Figure 28. Schematic diagram of
stainless steel reservoir con-taining cell pressure gas-water
interface
52

Cell pressure was measured continually using a pore pressure transducer
mounted on the triaxial cell pedestal. The observed drift over 7 days at
400 psi cell pressure was +/- 5 psi.
0 Test Procedure
91. Based on the unconfined strength and modulus data collected in
Phase I, it was decided that triaxial tests would be performed on mix designs
with a cement factor of 300 lb/cu yd and bentonite contents of 0, 20, and
40 percent. Effective confining pressures of 50, 100, 200, and 300 psi were
chosen in order to simulate the range of horizontal confinement an element of
concrete would be subjected under various depths of wet concrete after a
tremie placement. Because of time limits, the curing ages evaluated were
limited to 3, 7, and 14 days. Table 5 shows the bentonite content, age and
effective confinement of the Q and CIUC tests conducted.
Table 5
Test Schedule for CIUC and 0 Test Groups by Batch Design,
Age and Effective Consolidation Stress
Batch IDPercent Age Effective Consolidation Stress, psi
Bentonite Days 50 100 200 300
3 -- 080288 091488 *
0 7 -- 030189 * *14 -- 102688 * *
3 082688 080588 091088 --
20 7 -- 081088 082388 090188
14 -- -- -- 111688
3 091588 090988 091888 10148840 7 -- 083188 -- 092888
14 -- 102888 -- 100688
022289
Note: All batches have nominal cement factor of 300 lb/cu yd.* Tests could not be performed because sample strength was beyond the
capacity of the triaxial cell piston (85,000 ib).
92. The Q test procedure described in Paragraphs 93 through 97 was
developed according to the procedure outlined in ASTM specification
53
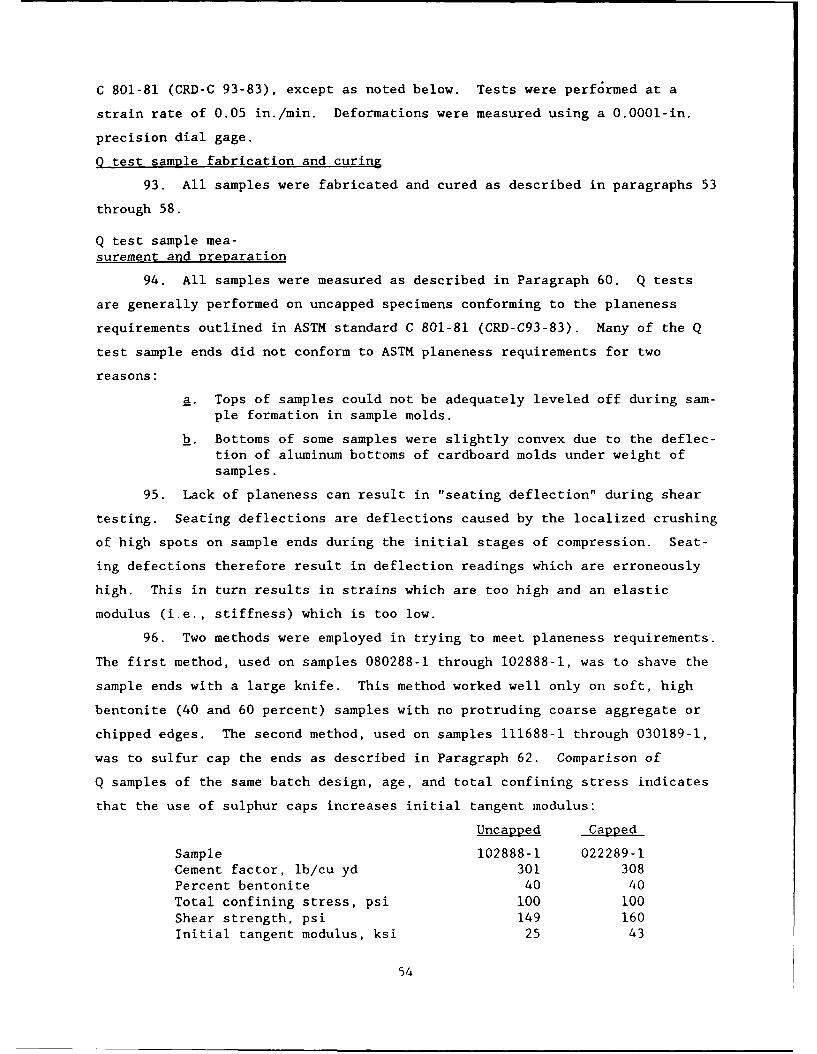
C 801-81 (CRD-C 93-83), except as noted below. Tests were performed at a
strain rate of 0.05 in./min. Deformations were measured using a 0.0001-in.
precision dial gage.
0 test sample fabrication and curing
93. All samples were fabricated and cured as described in paragraphs 53
through 58.
Q test sample mea-surement and preparation
94. All samples were measured as described in Paragraph 60. Q tests
are generally performed on uncapped specimens conforming to the planeness
requirements outlined in ASTM standard C 801-81 (CRD-C93-83). Many of the Q
test sample ends did not conform to ASTM planeness requirements for two
reasons:
a. Tops of samples could not be adequately leveled off during sam-ple formation in sample molds.
b. Bottoms of some samples were slightly convex due to the deflec-tion of aluminum bottoms of cardboard molds under weight ofsamples.
95. Lack of planeness can result in "seating deflection" during shear
testing. Seating deflections are deflections caused by the localized crushing
of high spots on sample ends during the initial stages of compression. Seat-
ing defections therefore result in deflection readings which are erroneously
high. This in turn results in strains which are too high and an elastic
modulus (i.e., stiffness) which is too low.
96. Two methods were employed in trying to meet planeness requirements.
The first method, used on samples 080288-1 through 102888-1, was to shave the
sample ends with a large knife. This method worked well only on soft, high
bentonite (40 and 60 percent) samples with no protruding coarse aggregate or
chipped edges. The second method, used on samples 111688-1 through 030189-1,
was to sulfur cap the ends as described in Paragraph 62. Comparison of
Q samples of the same batch design, age, and total confining stress indicates
that the use of sulphur caps increases initial tangent modulus:
Uncapped Capped
Sample 102888-1 022289-1Cement factor, lb/cu yd 301 308Percent bentonite 40 40Total confining stress, psi 100 100Shear strength, psi 149 160Initial tangent modulus, ksi 25 43
54

The problem of seating deflections during Q tests is examined in greater
detail in Paragraph 143.
0 shear test procedure
97. The following procedures were used for all Q tests:
a. A double membrane was placed over the Q test sample. The sam-ple was then positioned on the triaxial cell base, and themembrane ends were sealed to the sides of the pedestal and topcapped with O-rings and vacuum grease.
b. The cell hood was placed over the sample and attached to thebase with a clamping collar. Care was taken not to crimp thetop cap water lines. The piston was then seated against thetop cap and locked into place.
C. The cell was filled with tap water via the stainless steelreservoir bottle and cell pressure hose. The cell hood bleedvalve was kept open during filling to purge all air from cell.
d. The cell pressure transducer was attached to the cell base andpurged of air. The triaxial cell was then positioned under theload head of the Riehle testing machine, and a brass loadingblock was placed on top of the piston. This loading blockprevented the piston from stamping the testing machine loadhead during loading.
e. The cell pressure was applied and the pedestal valve was openedmomentarily to check for leaks across the membrane. If nosignificant leaks (more than a few drops of water) wereobserved, the load head was brought into contact with theloading block and the piston was unlocked. The deflection dialgage was then adjusted on the piston to provide maximum travel.
f. A loading scale was chosen based on prior testing experience.Shear testing was begun and load and deformation readings weretaken often enough to develop a complete stress-strain curve.As many post-peak load and deformation readings as possiblewere taken. The deflection dial gage was reset on the pistonas necessary.
g. After completion of shear testing, the Q test specimen wasremoved from the cell and its height and diameter measured andrecorded. The specimen was then marked with its batch numberand stored in the wet room.
CIUC Test Sample Setup and Consolidation Procedure
98. CIUC tests were performed to simulate the behavior of plastic con-
crete in a cutoff wall following tremie placement. The CIUC test procedure
for soils outlined in Appendix X of EM 1110-2-1906 (Headquarters, Department
of the Army 1986) was used as a guideline for developing the procedure
described below. In order to form a 6-in.-diam by 12-in.-high test specimen
55

from wet 8-in. slump concrete, it was necessary to partially consolidate the
specimen under a vacuum in a split mold prior to full consolidation in a
triaxial chamber. Granular, cohesionless soils are often consolidated in a
similar manner. The following procedure was developed by trial and error on
preliminary batches made during May, June, and July 1988. Subsequent refine-
ments in procedure made during Phase II testing are also included here. Nota-
tions are made, when relevant, explaining why and when each refinement was
done.
Setup of CIUC sam-ple formation apparatus
99. All CIUC samples were formed wet directly on the triaxial pedestal
inside a double membrane supported by a split mold consolidometer. This sec-
tion describes the setup of the double membrane and consolidometer.
a. Prior to the placement of the membrane and consolidometer onthe triaxial pedestal, the pedestal and top cap drainage line-porous stone-filter paper systems were presaturated via panelboard accumulators to help ensure constant saturation duringconsolidation. The saturation of the porous stones was main-tained by sealing the porous stones to the top cap with plasticwrap and O-rings. An example of this setup is shown inFigure 29.
b. The double membrane was constructed by placing one membraneinside another and sealing them together with enough vacuLngrease such that they behaved like a single membrane. Thethickness of the double membrane was then measured andrecorded.
c. The double membrane was attached to the triaxial pedestal withfour O-rings and vacuum grease.
d. The split mold was put together with two strips of duct tapewrapped around three times about 3 in. from the top and bottomof the mold. Strips of duct tape were then placed on each seamto seal the mold for subsequent application of vacuum insidesplit mold (to hold the double membrane against the inside wallof the split mold consolidometer).
e. The consolidometer was mounted on the pedestal over the doublemembrane such that it was supported by the pile of four pedes-tal O-rings. The top of the membrane was then pulled tightlyover the top of the consolidometer and vacuum applied to pullthe membrane against the inside wall of the consolidometer.This was done to ensure uniform sample diameter. An example ofthis setup is shown in Figure 30.
56

Figure 29. Presaturation of pedestal and top capporous stones and filter paper
5/
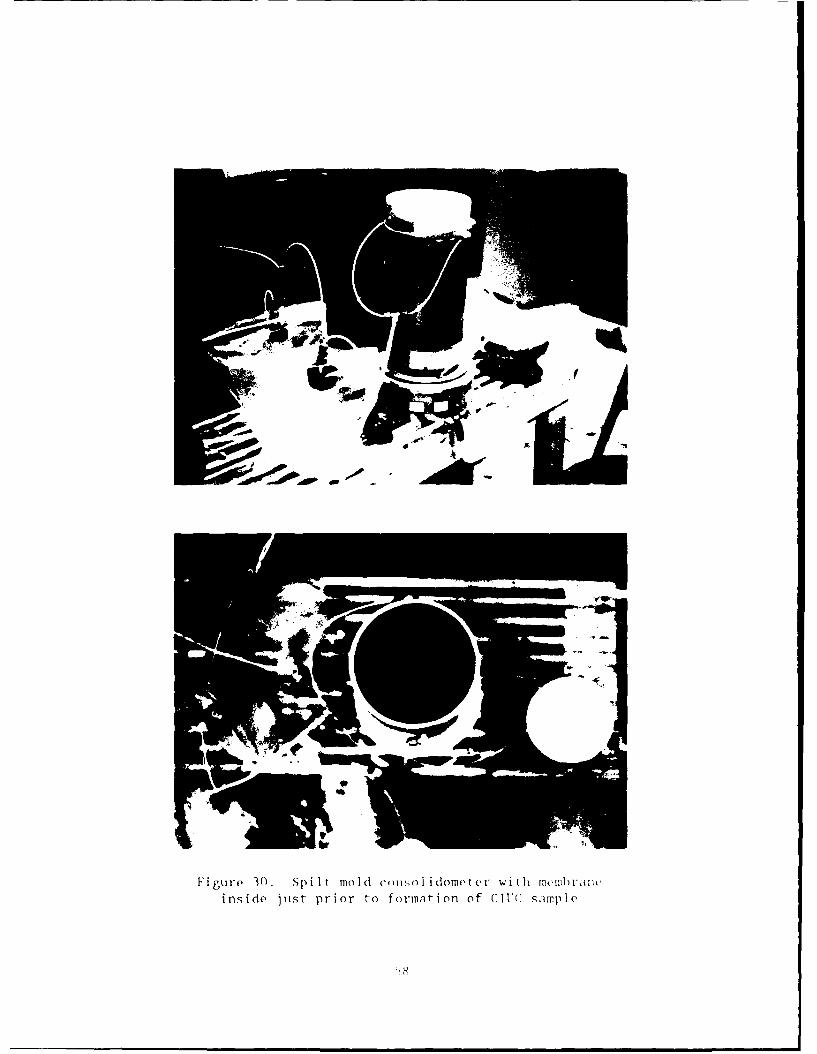
Figure 30. Spil1t mold (1cmsol idomot er with mcwhiraliinside just prior to formaI.tionI Of CIUC -,,-MPI(
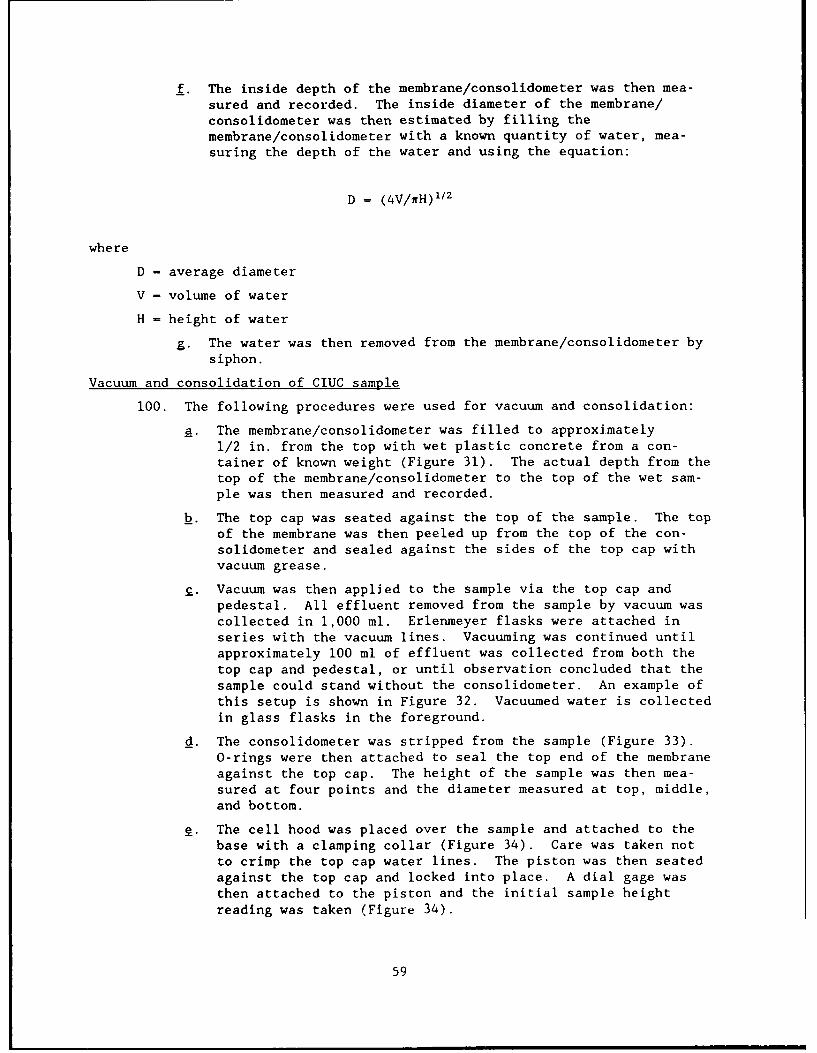
f. The inside depth of the membrane/consolidometer was then mea-sured and recorded. The inside diameter of the membrane/consolidometer was then estimated by filling themembrane/consolidometer with a known quantity of water, mea-suring the depth of the water and using the equation:
D = (4V/ifH)1 /2
where
D = average diameter
V - volume of water
H = height of water
g. The water was then removed from the membrane/consolidometer bysiphon.
Vacuum and consolidation of CIUC sample
100. The following procedures were used for vacuum and consolidation:
a. The membrane/consolidometer was filled to approximately1/2 in. from the top with wet plastic concrete from a con-tainer of known weight (Figure 31). The actual depth from thetop of the membrane/consolidometer to the top of the wet sam-ple was then measured and recorded.
b. The top cap was seated against the top of the sample. The topof the membrane was then peeled up from the top of the con-solidometer and sealed against the sides of the top cap withvacuum grease.
c. Vacuum was then applied to the sample via the top cap andpedestal. All effluent removed from the sample by vacuum wascollected in 1,000 ml. Erlenmeyer flasks were attached inseries with the vacuum lines. Vacuuming was continued untilapproximately 100 ml of effluent was collected from both thetop cap and pedestal, or until observation concluded that thesample could stand without the consolidometer. An example ofthis setup is shown in Figure 32. Vacuumed water is collectedin glass flasks in the foreground.
d. The consolidometer was stripped from the sample (Figure 33).O-rings were then attached to seal the top end of the membraneagainst the top cap. The height of the sample was then mea-sured at four points and the diameter measured at top, middle,and bottom.
e. The cell hood was placed over the sample and attached to thebase with a clamping collar (Figure 34). Care was taken notto crimp the top cap water lines. The piston was then seatedagainst the top cap and locked into place. A dial gage wasthen attached to the piston and the initial sample heightreading was taken (Figure 34).
59
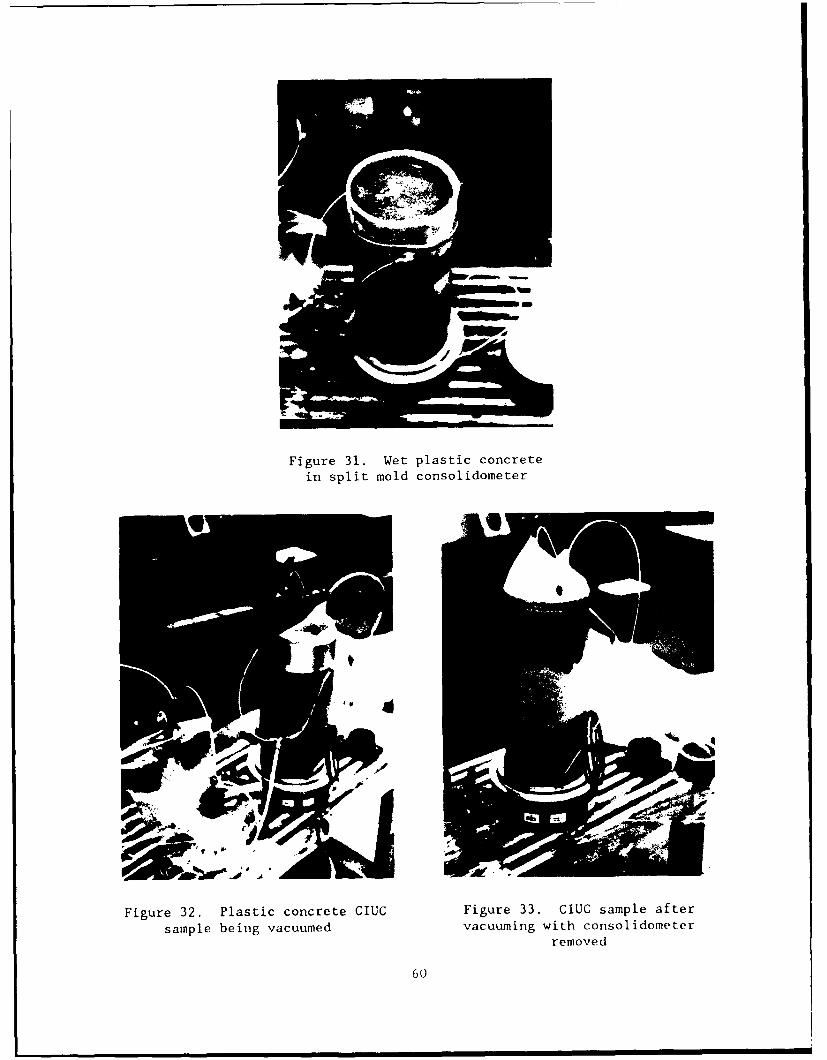
°%M
Figure 31. Wet plastic concrete
in split mold consolidometer
Figure 32. Plastic concrete CIUC Figure 33. CIUC sample after
sample being vacuumed vacuuming with consolidometerremoved
60
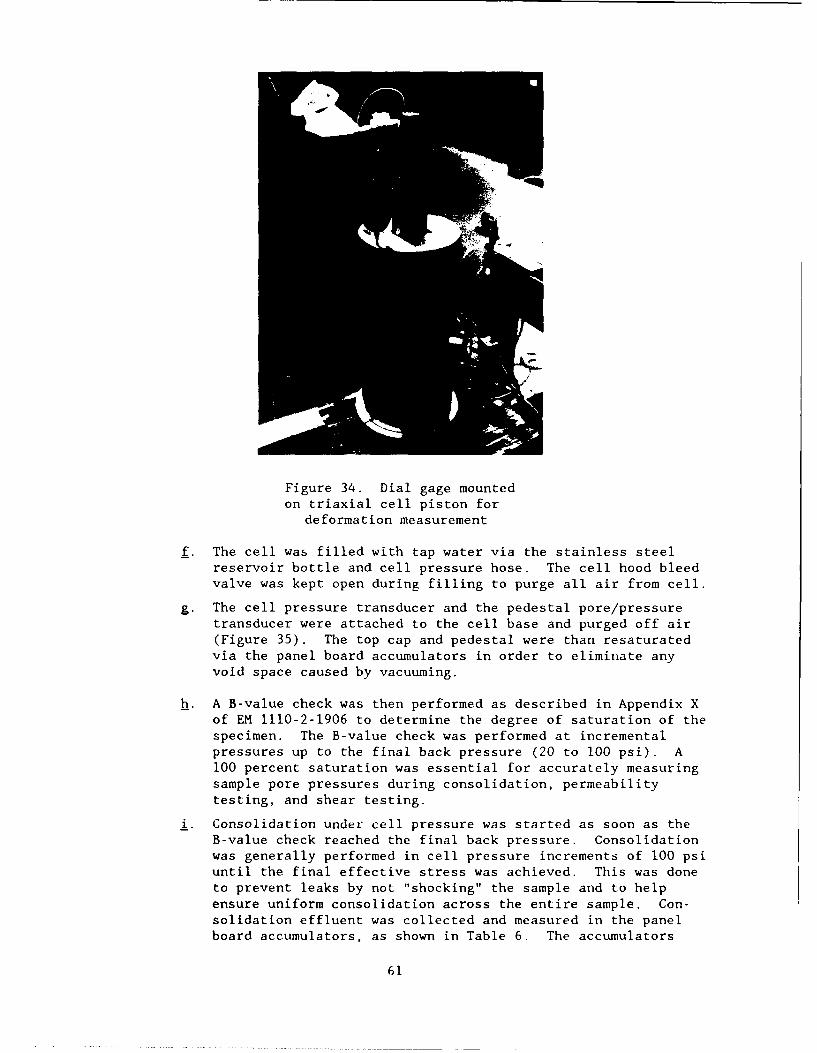
.01
Figure 34. Dial gage mountedon triaxial cell piston for
deformation measurement
f. The cell was filled with tap water via the stainless steelreservoir bottle and cell pressure hose. The cell hood bleedvalve was kept open during filling to purge all air from cell.
g. The cell pressure transducer and the pedestal pore/pressuretransducer were attached to the cell base and purged off air(Figure 35). The top cap and pedestal were than resaturatedvia the panel board accumulators in order to eliminate anyvoid space caused by vacuuming.
h. A B-value check was then performed as described in Appendix Xof EM 1110-2-1906 to determine the degree of saturation of thespecimen. The B-value check was performed at incrementalpressures up to the final back pressure (20 to 100 psi). A100 percent saturation was essential for accurately measuringsample pore pressures during consolidation, permeabilitytesting, and shear testing.
i. Consolidation under cell pressure was started as soon as theB-value check reached the final back pressure. Consolidationwas generally performed in cell pressure increments of 100 psiuntil the final effective stress was achieved. This was doneto prevent leaks by not "shocking" the sample and to helpensure uniform consolidation across the entire sample. Con-solidation effluent was collected and measured in the panelboard accumulators, as shown in Table 6. The accumulators
61

Figure 35. Close-up of pore pressuretransducer setup
were drained and resent as necessary. Figure 36 shows a typi-cal consolidation curve, plotted as change in volume versussquare root of time.
Permeability Test Procedure
101. Since the primary measure of the effectiveness of a concrete cut-
off wall is its ability to impede the flow of water, it was essential that the
permeability of plastic concrete be measured. Therefore, constant-head perme-
ability tests were conducted on CIUC samples during triaxial curing. Gener-
ally, permeability tests were started approximately 48 hr after the start of
consolidation. This was done to ensure that consolidation was finished and
that there was no leakage across the membrane. Permeability tests were
started earlier on some three-day samples. This is no longer recommended,
however, because sample gas generation during early curing causes inaccurate
flow readings. Table 7 summarizes the CIUC tests for which permeability tests
were performed.
102. The actual procedure used for all tests was developed using "The
Permeability Test With Back Pressure" procedure outlined in EM 1110-2-1906 as
62
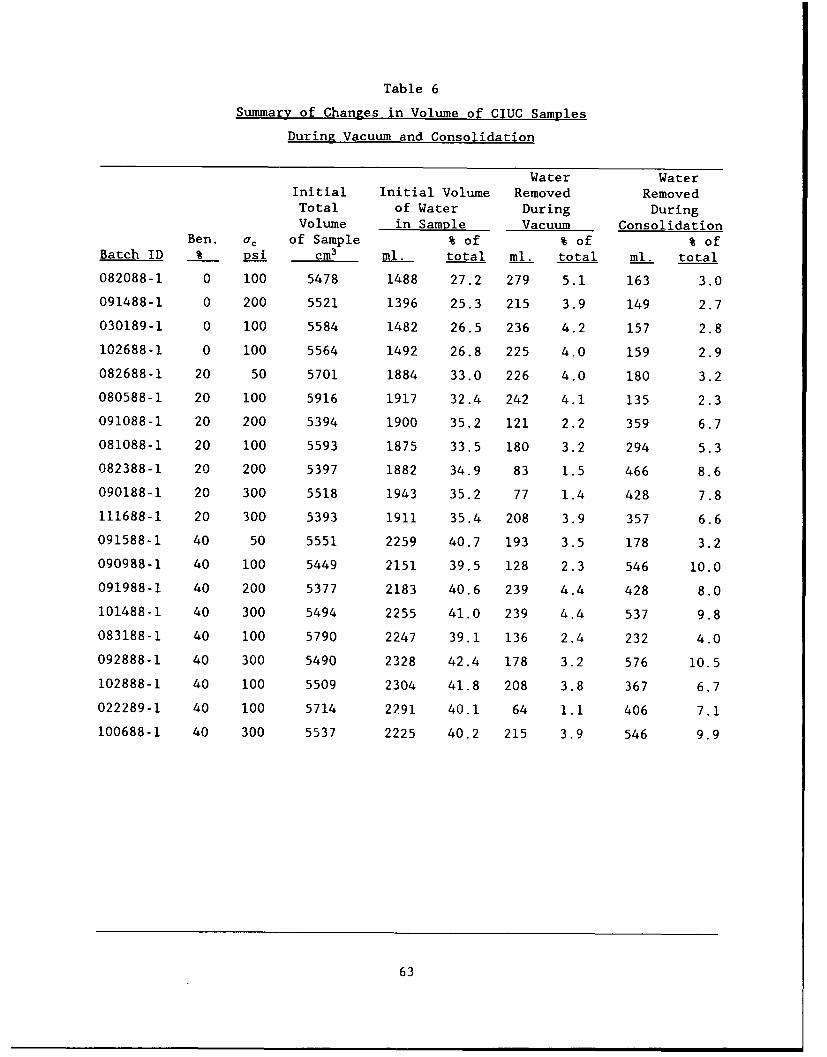
Table 6
Summary of Changes in Volume of CIUC Samples
During Vacuum and Consolidation
Water WaterInitial Initial Volume Removed RemovedTotal of Water During DuringVolume in Sample Vacuum Consolidation
Ben. cc of Sample % of % of % ofBatch ID % P..-j cm3 ml. total ml. total ml. total
082088-1 0 100 5478 1488 27.2 279 5.1 163 3.0
091488-1 0 200 5521 1396 25.3 215 3.9 149 2.7
030189-1 0 100 5584 1482 26.5 236 4.2 157 2.8
102688-1 0 100 5564 1492 26.8 225 4.0 159 2.9
082688-1 20 50 5701 1884 33.0 226 4.0 180 3.2
080588-1 20 100 5916 1917 32.4 242 4.1 135 2.3
091088-1 20 200 5394 1900 35.2 121 2.2 359 6.7
081088-1 20 100 5593 1875 33.5 180 3.2 294 5.3
082388-1 20 200 5397 1882 34.9 83 1.5 466 8.6
090188-1 20 300 5518 1943 35.2 77 1.4 428 7.8
111688-1 20 300 5393 1911 35.4 208 3.9 357 6.6
091588-1 40 50 5551 2259 40.7 193 3.5 178 3.2
090988-1 40 100 5449 2151 39.5 128 2.3 546 10.0
091988-1 40 200 5377 2183 40.6 239 4.4 428 8.0
101488-1 40 300 5494 2255 41.0 239 4.4 537 9.8
083188-1 40 100 5790 2247 39.1 136 2.4 232 4.0
092888-1 40 300 5490 2328 42.4 178 3.2 576 10.5
102888-1 40 100 5509 2304 41.8 208 3.8 367 6.7
022289-1 40 100 5714 2291 40.1 64 1.1 406 7.1
100688-1 40 300 5537 2225 40.2 215 3.9 546 9.9
63

0 _
CL
-100*SAMPLE ID: 100688-1
.10CEMENT FACTOR: 300 LB/CU YD.15
LiBENTONITE: 40%-200
250 -C
0w -300
> -350z
-400
-55 0
1.0 L
0 5 10 15 20 25 30 31SOUARE ROOT OF TIMIE. F'
Figure 36. Typical volume change versus square root oftime curve for consolidation phase of GIUG test
Table 7
Summary of CIUG Samples for which Permeability Tests were Performed
Percent Age Effective Confining
Batch ID- Bentonite Days Stress, psi
080288-1 0 3 100
091488-1 0 3 200
030189-1 0 7 100
102688-1 0 14 100
080588-1 20 3 100
091088-1 20 3 200
081088-1 20 8 100
082388-1 20 7 200
090988-1 40 3 100
101488-1 40 3 300
092888-1 40 7 300
102888-1 40 14 100
64

a guide. Using this procedure, permeability was determined using Darcy's law
for flow of through soil:
q = kiA (1)
where
q rate of flow of water through soil with cross-section A
k = coefficient of permeability
i =hydraulic gradient
rearranging
k = q (2)iA
by definition
q (3)q=- t
and
i = h2 - h (4)L
where
Q = quantity of water flowing through cross-section A in time t
h2 - h, = difference in head across sample
L = length of flow path through sample, i.e., the height of thesample after consolidation
In addition, the following assumptions can be made for a specimen tested in a
triaxial cell:
h 2 -h = 2 - P- (5)YW
where
P- P1 = the difference in pressure across the sample
j,= unit weight of water
Combining equation yields
65

k = QLy (6)tA(P, - P,)
103. Since L , A , and 7w are known constants only time, flow and
pressure difference need to be measured during testing. The pressure differ-
ence was established by reducing the back pressure on the top cap. Flow
through the sample was then measured by periodically reading the water level
in the pedestal accumulator and recording the corresponding time. Approxi-
mately 12 hr prior to shear testing, the permeability test was stopped, and
the top cap back pressure was returned to the original back pressure to allow
the pore pressure within the sample time to equalize.
GIUC Shear Test
104. All CIUC shear tests were performed with the Riehle testing
machine at a deformation rate of 0.05 in./min. Deformation readings were read
from a 0.0001 in. precision dial gage attached to the piston. The actual
procedures used for all tests were as follows:
a. The triaxial cell was positioned under the load head of Riehletesting machine and a brass loading block was placed on top ofthe piston. This loading block prevented the piston fromindenting the test machine load head during loading.
b. The load head of the testing machine was brought into contactwith the loading block and the piston was unlocked. Thechange in height of the sample due to consolidation was mea-sured by loading the piston until it reestablished contactwith the top cap, and then taking a dial reading. The differ-ence between this dial reading and the initial dial readingtaken in Paragraph 100 was the change in height due to consol-idation. The deflection dial gage was then adjusted on thepiston to provide maximum travel.
c. A loading scale was chosen based on prior testing experience.Shear testing was begun and load and deformation readings weretaken often enough to develop a complete stress-strain curve.As many post-peak load and deformation readings as possiblewere taken. The deflection dial gage was reset on the pistonas necessary. In addition, pore pressure readings were takenfor samples 080288-1 and 022289-1.
d. After completion of shear testing, the test specimen wasremoved from the cell and its height and diameter measured andrecorded. The specimen was then marked with its batch numberand stored in the wet room.
66

PART IV: UNCONFINED TEST RESULTS
105. Part IV contains summaries of the results of all unconfined com-
pression tests, splitting tensile tests, flexural beam tests, and erosion
tests. The scope of the test programs was as follows:
a. Phase I Unconfined Tests
251 UC testscement factors 230 to 450 lb/cu yd.bentonite contents of 0, 10, 20, 40, and 60 percent.
ages of 3 to 660 days.
b. Phase II (Triaxial Companion) Unconfined Compression Tests
39 UC testscement factor 300 lb/cu yd.
bentonite contents of 0, 20, and 40 percent.ages of 3, 7, and 14, days.
c. Phase I Splitting Tensile Tests
45 splitting tensile (Brazilian) testscement factors 240 to 360 lb/cu yd.
bentonite contents of 0, 20, and 60 percent.
ages of 3, 7, 28, and 90 days.
d. Phase II (Triaxial Companion) Splitting Tensile Tests
20 splitting tensile (Brazilian) testscement factor 300 lb/cu yd.bentonite contents of 0, 20, and 40 percent.ages 3, 7, and 14 days.
e. Other Phase I Tests
6 flexural beam tests
2 erodability tests
106. Summary tables of each test program are presented in Appendix D
and discussed in the paragraphs below. The cement factors and water-cement
ratios for all of the plastic concrete batches presented in each test series
summary table are corrected for actual batch composition as described in Para-
graph 62 and in the batch design example, Appendix B, Table B3.
Unconfined Compression Test Data Analysis
107. Load and deflection measurements were taken for all unconfined
compression tests and used to construct stress-strain curves. Figure 37 shows
the general form of a stress-strain curve and definitions of ultimate
67
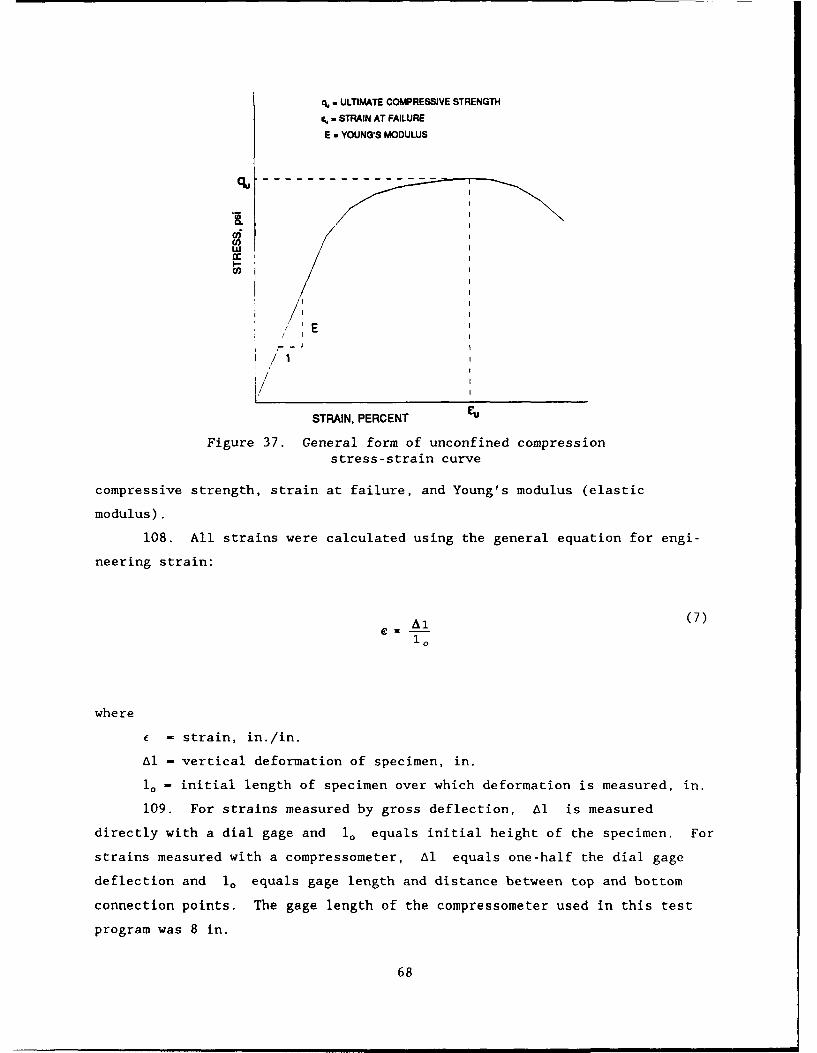
- ULTIMATE COMPRESSIVE STRENGTH
- STRAIN AT FAILURE
E - YOUNG'S MODULUS
°-- -
/,)
E E
,/1i//
STRAIN, PERCENT
Figure 37. General form of unconfined compressionstress-strain curve
compressive strength, strain at failure, and Young's modulus (elastic
modulus).
108. All strains were calculated using the general equation for engi-
neering strain:
Al (7)
where
- strain, in./in.
Al - vertical deformation of specimen, in.
1. - initial length of specimen over which deformation is measured, in.
109. For strains measured by gross deflection, Al is measured
directly with a dial gage and 1. equals initial height of the specimen. For
strains measured with a compressometer, Al equals one-half the dial gage
deflection and 1, equals gage length and distance between top and bottom
connection points. The gage length of the compressometer used in this test
program was 8 in.
68

110. Stress was calculated by dividing load by specimen cross-sectional
area, corrected for strain:
(8)A,/ (I-e)
where
a - stress, psi
P = load, lb
A- initial cross-sectional area of specimen, sq in.
4= strain at load P, in./in.
and
ultimate compressive strength = ama,= qu
111. Young's modulus is defined as the slope of a line tangent to the
initial linear segment of the stress-strain curve. Young's modulus for this
test program was calculated using:
E (9)eb -C
a
where
ab - maximum stress on the linear portion of the stress-strain curve,psi
a. - minimum stress on the linear portion of the stress-strain curve,psi
Lb - maximum strain on the linear portion of the stress-strain curve,psi
La - minimum strain on the linear portion of the stress-strain curve,psi
Young's modulus is reported in Table Dl in units of thousands of pounds per
square inch.
112. Specimens tested using neoprene end caps are identified in
Table DI under the "strain" heading by the designation "neop". The ultimate
compressive strength reported in Table DI for tests using neoprene caps are
uncorrected values. For specimens with ultimate strengths less than 3,000 psi
69

the use of neoprene end caps results in lower ultimate stresses when compared
to specimens tested with sulphur end caps. This lowering of ultimate
strengths is the result of the reduction of cross-sectional area caused by
spalling of specimen ends. Spalling is caused by shear stresses developed at
the neoprene-specimen interface caused by the deformation of the neoprene.
The failure mode for all neoprene-capped tests was vertical splitting while
diagonal failure occurred with the specimens with sulphur end caps. In order
to include ultimate strengths from neoprene-capped specimens in analyses in
Part VI, a plot was developed to correct ultimate strength to sulphur-capped
values. The plot and its use are described in Paragraph 148.
113. No elastic modulus and ultimate strain values for specimens tested
with neoprene end caps are included in Table Dl. These values are inaccurate
because they include the deformation of the neoprene end caps. A correction
procedure for elastic modulus and ultimate strain could not be developed
because the deformation of the neoprene end caps could not be measured sepa-
rately. No ultimate strain and elastic modulus data from neoprene-capped
samples were used in any analyses.
Results of Unconfined Compression Test Series
114. The ultimate compressive strength (qu), ultimate strain (Cu),
elastic modulus (E), age, and batch design parameters for each Phase I uncon-
fined compression test specimen are compiled by batch in Table Dl. In addi-
tion, Table Dl lists the curing location and deflection measurement system
used for each specimen. In order to examine the relationship of cement factor
bentonite content and water-cement ratio to unconfined compressive strength
and elastic moduli, Figures 38, 39, and 40 were constructed.
115. Figure 38 shows the relationship between cement factor and water-
cement ratio for bentonite contents of 0, 10, 20, 40, and 60 percent and 8 in.
wet slump. The straight lines fitted to the data sets for each bentonite
content are parallel and show that, for a given bentonite content, a decrease
in cement factor requires an increase in water-cement ratio to maintain an
8-in. slump.
116. Figure 39 shows the relationship between unconfined compressive
strength and water-cement ratio for all curing ages and bentonite contents.
70

460-........
44 Slump= 8 +/- I in.
420- cxxxx 0% bentonite0 00000 10% bentonite
v400- AAAA 20% bentonite>1 - 00 4059 bentonite
U40 3800 605.... bentonite
360- 0100t340- 60%
320- 0C
E 300 8AU8
280 0
00260- A A
240 0 0
220-, r-- .4 ~0.8 1 .0 1 .2 14 1.6 1.8 20O 2.2 2.4 2.6 2.8 3.0 3.2
Water-cement ratio. w/c
Figure 38. Cement factor versus water-cement ratio and
bentonite content
00000 0% bentonite00000 10% bentonite
0 -&a 20% bentoniteaL 1000- a. 10% 00000 40% bentonite
- 4 02esee 60% bentonite
V.0
0%)8
0)> 10000
440
C
C01)C
D 60%
10- 1 T rTT 7 TV- r--rT- r r r--- --- r
081 01 21 41 61 8 20 2.? 2 42 62 8 303 2Witer (-enwerj tr', W ',
Figure 39. Unconfined compressive strength versus water-cement ratio for all bentonite contents
71

Each data point corresponds to one test specimen. Boxes are drawn around
groups of data points with the same bentonite contents. Figure 39 shows that
unconfined compressive strength decreases with the addition of bentonite for
the 8-in. slump mixture.
117. Figure 40 shows the relationship between unconfined compressive
strength and elastic (Young's) modulus for all ages and bentonite contents.
Separate regression lines are drawn through data points with elastic moduli
calculated from strain values obtained with both the compressometer and by
gross deflection. Figure 40 shows that elastic modulus increases with
increasing unconfined compressive strength. The influence of bentonite on
elastic modulus is expressed indirectly by the influence of bentonite on
unconfined compressive strength. For example, a low unconfined compressive
strength corresponding to a high bentonite content obtained from Figure 39
corresponds to a low elastic modulus in Figure 40.
/00000 CA bentonite / 000o0 10% bentonite /
&a&&& 20% bentonite /o 00QOO0000 40% bentonite /
.1000 0oo 60% bentonite /o
- /
C /
/4 C
gross deflection /U.X&
0) 0
0. /', t( /
E 100 7'0
0)compressometerCC/0C-)
C
1 10 100 1000Unconfined Elastic Modulus, ksi
Figure 40. Unconfined compressive strengthversus unconfined elastic modulus for all
bentonite contents
118. The ultimate compressive strength (q.), ultimate strain (C.),
elastic modulus (E), age, and batch design parameters for each Phase II
unconfined compression test specimen are compiled by batch in Table D2. Two
72

tests were performed for each Phase II batch. Complete stress-strain curves
for each test are shown by batch in Appendix E. The Phase II unconfined com-
pression tests were performed as companion tests to the CIUC and Q tests to
ensure repeatability within a batch (i.e. that batch constituents were uni-
formly mixed). This was important because the estimates of initial propor-
tions of batch constituents in CIUC samples were based on the assumption that
constituents were uniformly mixed throughout the batch. In addition, the
Phase II unconfined compression tests were performed to ensure that batches
with the same cement factor and bentonite content (but which were formed at
different times) were the same. Statistical analysis of the unconfined com-
pressive strengths reported in Table D2 shows that the average standard devia-
tion of unconfined compressive strength within batches is 1.7 percent with a
maximum standard deviation of 6.1 percent for batch 080288-1. The standard
deviations of unconfined compressive strengths between batches of the same
bentonite content and age are less than 5 percent, except between batches
080288-1 and 091488-1 which have a standard deviation of 30 percent.
Error Analysis of Unconfined Compression Tests
119. In order to ensure statistical accuracy, most of Phase I batches
were proportioned to provide three test cylinders for every test age. Some
batches, however, had only one or two cylinders available at a given age, as
shown in Table Dl. This lack of cylinders was caused by three factors:
a. Batch yields were smaller than designed, leaving fewer cylin-der for high curing age tests.
b. Tests were performed on a batch at more curing ages thaninitially planned.
c. Test cylinders were damaged during capping or curing and sub-sequently discarded.
120. The actual average standard deviations of unconfined compression
tests within test groups (specimens from the same batch tested at the same
age) from test group averages are as follows:
a. Total number of batches, Phase I 22
(1) range of bentonite contents 0-60 %
(2) range of cement factors 230 to 450 lb/cu yd
(3) ages 3 to 660 days
b. Total number of test specimens 251
73

(1) strain measured by gross deflection 160
(2) strain measured by compressometer 71
(3) neoprene end caps used 20
c. Total number of test specimen groups (I to 1003 specimens from the same batch tested at same age)
d. Number of test specimen groups with only 13one test specimen
e. Average standard deviation of ultimate 4 % +/- 3 %compressive strength within test specimengroups containing more than one specimen
f. Number of test specimen groups with standard 4deviations from test group average greater than 10%
g. Maximum standard deviation within a test 14 %specimen group
The above analysis indicates that the values of unconfined compressive
strength obtained in Phase I testing are accurate.
121. The actual degree of accuracy of any given test group is also
dependent on the precision to which the stress-strain-strength parameters (q.,
E, and cu) can be calculated. The precision of each parameter depends on the
combined precision of the measured values each parameter is dependent upon
(see Paragraphs 107-113). The following is a summary of the precision of
E , and e. as a function of reading error during testing:
Load Corresponding Precision, +/-Range Bentonite qu E Cukips percent psi ksi percent
3-5 60 0.6 0.8 0.0043
5-10 40 2.0 2.8 0.0043
10-20 20 4.1 10.1 0.0041
20-50 10 9.9 35.5 0.0041
50-75 0 16.4 33.9 0.0041
Conclusions from Unconfined Compression Tests
122. This section summaries the general effects of bentonite content,
cement factor, and age on unconfined plastic concrete behavior and batch char-
acteristics as observed in Tables DI and D2 and in Figures 38, 39, and 40.
The effects of each parameter are listed in order of relative influence.
74

a. Ultimate compresssive strength (q,.) and elastic modulus (E)
(1) qu and E decrease with increasing bentonite content(Figures 39 and 40).
(2) qu and E increase with increasing cement factor (Fig-ures 38, 39, and 40).
(3) q, and E increase with curing age (Tables Dl and D2).
b. Strain at failure (c)
(1) e. increases with increasing bentonite content(Tables D1 and D2).
(2) c,, decreases with curing age (Tables Dl and D2).
(3) e. decreases slightly with increasing cement factor(Tables DI and D2).
c. Water-cement ratio (resulting in 8 in. slump)
(1) Water cement ratio increases with increasing bentonitecontent (Figure 38).
(2) Water cement decreases with increasing cement factor(Figure 38).
d. Air content of wet concrete
Air content decreases with increasing bentonite content(Table Dl).
Results of Other Unconfined Tests
123. This section contains summaries of splitting tensile tests
(Phases I and II), flexural beam tests, and erosion tests.
Brazilian splittingtensile test series
124. Brazilian splitting tensile tests were performed on 45 specimens
from six batches of plastic concrete to evaluate the effect of bentonite con-
tent, cement factor, and age on splitting tensile strength. Batches with
nominal cement factors of 250 and 350 lb/cu yd and bentonite contents of 0,
20, and 60 percent were chosen in order to bracket the preliminary unconfined
compression series data as well as possible with a minimum number of tests.
125. A summary of the batch design and tensile strength of all Phase I
test specimens is contained in Table D3. Most specimens were tested at
nominal ages of 3, 7, 28, and 90 days. All specimens from the 60 percent
bentonite, 250 lb/cu yd batch (062288-1), were too weak to test correctly and
75
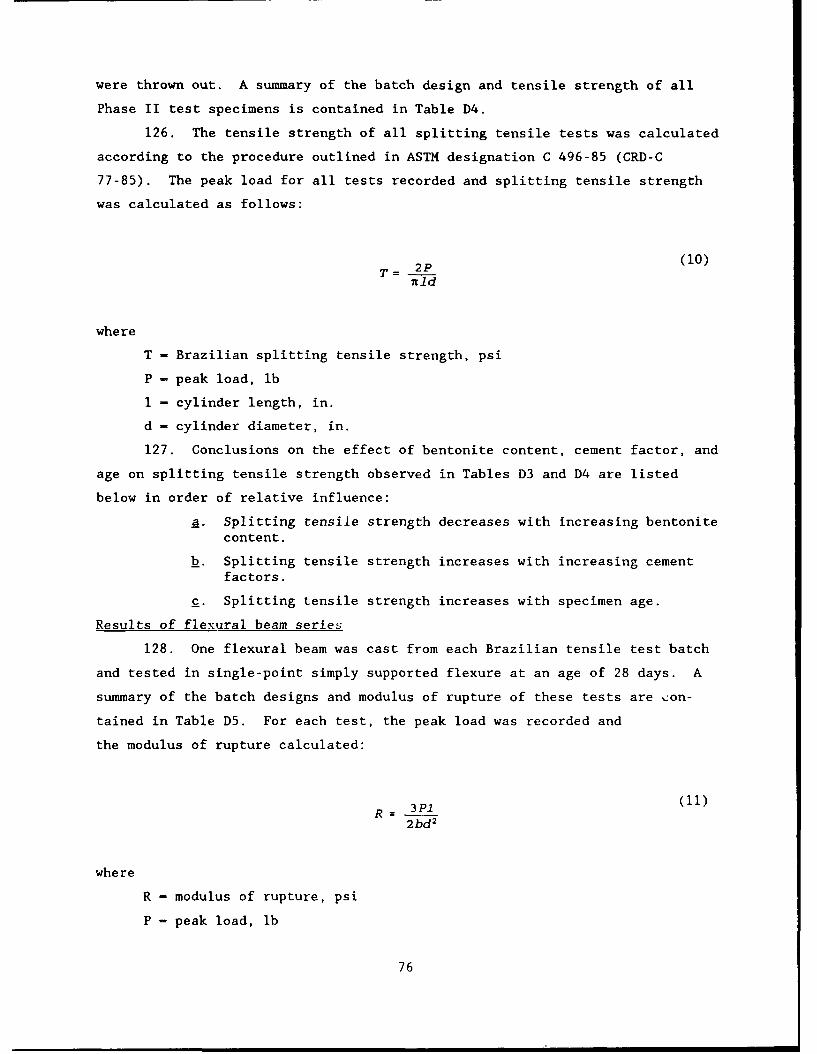
were thrown out. A summary of the batch design and tensile strength of all
Phase II test specimens is contained in Table D4.
126. The tensile strength of all splitting tensile tests was calculated
according to the procedure outlined in ASTM designation C 496-85 (CRD-C
77-85). The peak load for all tests recorded and splitting tensile strength
was calculated as follows:
T -2P (10)
7tId
where
T - Brazilian splitting tensile strength, psi
P - peak load, lb
1 - cylinder length, in.
d - cylinder diameter, in.
127. Conclusions on the effect of bentonite content, cement factor, and
age on splitting tensile strength observed in Tables D3 and D4 are listed
below in order of relative influence:
a. Splitting tensile strength decreases with increasing bentonitecontent.
b. Splitting tensile strength increases with increasing cementfactors.
. Splitting tensile strength increases with specimen age.
Results of flexural beam series
128. One flexural beam was cast from each Brazilian tensile test batch
and tested in single-point simply supported flexure at an age of 28 days. A
summary of the batch designs and modulus of rupture of these tests are con-
tained in Table D5. For each test, the peak load was recorded and
the modulus of rupture calculated:
R =3P12bd
2
where
R - modulus of rupture, psi
P - peak load, lb
76
1 - length of beam span, in.
b - width of beam at point of rupture, in.
d - depth of beam at point of rupture, in.
129. Conclusions observed in Table D5 from these tests are similar to
those of the unconfined compression and brazilian tensile series:
a. Modulus of rupture decreases with increasing bentonitecontent.
b. Modulus of rupture increases with increasing cement factor.
Results of erosion test series
130. Two tests were performed to measure the resistance of plastic
concrete to erosion by seepage through cracks. Crack conditions were simu-
lated by casting a 3/16-in. hole through each sample and flowing water through
it at a velocity of 17 ft/sec. One test had a bentonite content of 0 percent
and the other had a bentonite content of 60 percent. Both tests had cement
factors of 300 lb/cu yd and were tested continuously between ages 3 and
8 days.
131. For all practical purposes, the tests showed that neither specimen
was susceptible to piping. The 0 percent bentonite batch showed no signs of
erosion over the 5-day test period. The 60 percent batch lost material at an
average approximate rate of 0.05 percent of initial sample weight per day.
This number is a rough estimate, however, because the amounts of material
eroded on some days were too small (<0.1 grams) to measure precisely on the
scale used (precise to 0.1 gram). More erosion tests need to be conducted on
plastic concrete before any definitive conclusions can be drawn.
77

PART V: TRIAXIAL AND PERMEABILITY TEST RESULTS
132. Plastic concrete mixes with cement factors of 300 lb/cu yd and
bentonite contents of 20 and 40 percent in addition to a 0 percent bentonite
control mix were tested in triaxial compression to evaluate the influence of
bentonite content, confinement and age on stress-strain characteristics,
undrained shear strength, and permeability. Due to time considerations, it
was decided that samples would be tested at 3, 7, and 14 days age. Table 5
shows the 20 different permutations of bentonite content, age, and confinement
examined. In addition, one long-term CIUC (batch ID is 031889-1, bentonite
content is 20 percent, effective confining stress is 100 psi, and curing age
is 58 days) test was performed but finished too late to incorporate into this
report. The results of CIUC test 031889-1 are usEd only in the discussion of
pore pressure generated during shear presented in Paragraph 163.
133. For each combination of bentonite content, age, and confinement,
five specir.ens were tested:
a. I CIUC test.
b. 1 Q test.
C. 2 UC tests.
d. 1 T test.
134. In addition continuous constant heed permeability tests were con-
ducted on the CIUC samples listed in Table 7 to evaluate the influence of
consolidation and bentonite content on permeability.
135. The UC tests were performed as a control to evaluate the material
consistency within and betweet, batches with the same bentonite content. A
summary of the UC tests is presented in Table D2 and discussed in Para-
graph 114. Ideally, CIUC tests of the same bentonite content and age but
different confining stresses would have been cast simultaneously from the same
batch into three triaxial chambers and tested as a group. This would have
eliminated any variables resulting from variations between batches. In prac-
tice, however, thi- procedure was unworkable for two main reasons:
a. Only two triaxial chambers and control panels were available
for use.
b. Setup of a single CIUC test typically took 8 hr. The forma-
tfon of multiple CIUC samples simultaneously would have
required more personnel than were available.
78

136. Companion UC tests were also done to determine if correlations
could be developed between CIUC, Q, and UC shear strength. In addition, com-
panion Brazilian splitting tensile tests were performed to determine if a
correlation could be developed between unconfined compression and splitting
tensile strength. A summary of the results of the companion splitting tensile
tests is presented in Table D4 and discussed in Paragraph 123.
Results of CIUC Tests
137. A summary of all CIUC stress-strength data is presented in
Table 8. Graphical definitions of shear strength, strain at failure, and
elastic modulus for CIUC tests are shown in Figure 41. Shear strength (Su) is
defined from a Mohr's circle diagram as one-half of the peak deviator stress
(principal axial stress, a,, mijius the confining stress, U3). Strain at fail-
ure (cn) is defined as the strain corresponding to the peak deviator stress
(a1-a3)u. Elastic modulus (E) is defined as the slope of the linear portion
of the deviator stress-strain curve. Individual stress-strain curves for each
CIUC test are presented by batch in Appendix E. All strain data were cor-
rected for the machine deflection of the triaxial cells. Pore pressure read-
ings were taken for three tests, 080288-1, 022289-1, and 031889-1 and are
presented in Paragraph 163 along with corresponding A values. The cement
factors and water-cement ratios and unit weights listed in Table 8 were cor-
rected for water removed during consolidation, as summarized in Table 6.
138. Preliminary comparisons of CIUC to companion UC stress-strain-
strength parameters summarized in Table D2 indicate that the shear strength,
elastic modulus, and strain at failure of plastic concrete all increase with
consolidation and confinement. Comparison of CIUC tests in Table 8 of the
same age and effective confining stress but different bentonite contents indi-
cates that CIUC strain at failure increases dramatically with the addition of
bentonite. Similarly, CIUC elastic modulus decreases with the addition of
bentonite. This suggests that the use of plastic concrete would greatly
increase the ductility of a diaphragm cutoff wall, particularly at great
depths.
79

w1 0000 0000 0 0 a,0
0 - 44 O r*.i c'J C1 Ln ea4 a f eJ.4 .4 OO
ON 0 Y 0 % 0' 04C r M, .4 -4 -4 M, C-4j V) 4o c -4 .- 4 ,-4 0
4J-
-) I
Q U V)00D n000000 0 0
04
-4 u
w . -"- 0 0 0 0 0 0 0 0 0 0 0 0 0 0 0
W4. 0 41
r. 0)
14 14 C
4U40
4-4 40)-)0 41 4] -. 4
xU C l 0141 0000000000000000000 140 r- 4wr-m
0. o0 1.) 01, Ln ID CUD n t;)- " ) 0,) ciU-44- -4'4 '4 ' 4 -r-C4 - 4- - 4- -4 C2 - -4'J -4W 4
-40 ".4
1 1 1 1.0 1 " 1 0.
00-14O 40 D- 4 40 40 -4 - -4 ~ ~ r C )( 00 -4 4 10 bo C 41 w0
4J.. -4 - 14 144
4.) 4.J1 if
0+ b -4 'A cc
NN. .. -... N. 4J 3t 0 E
r". 4) mr- 4J ."4
.41 41 -OO .0 u- r- m-
b -o I r 4--44 - -4-4.-4.- -4.I-4 4 4 -4 0100 4 J4 0m
C00 -Q- C U -4 4
(A (D V) .-I w- > ~- 4
00 00 00 0000CV0 C 04 0. -iwa '0 04 " -:3
Li~ 41) C0
rI c 0 4J M " e -.
r-0 nr nM0 40I00r n0 DIr D0 0 14C to I4W U8 L,r. 4~ 11 J Cs 00 b~j 44 114 D1Dr Dk U OQ a
CU 01 0 ) C 4.) 1400 1 E 0 0 4- 1
co4 cy m 0~~~/ coc h oc - 7 (,400 0(, '
80
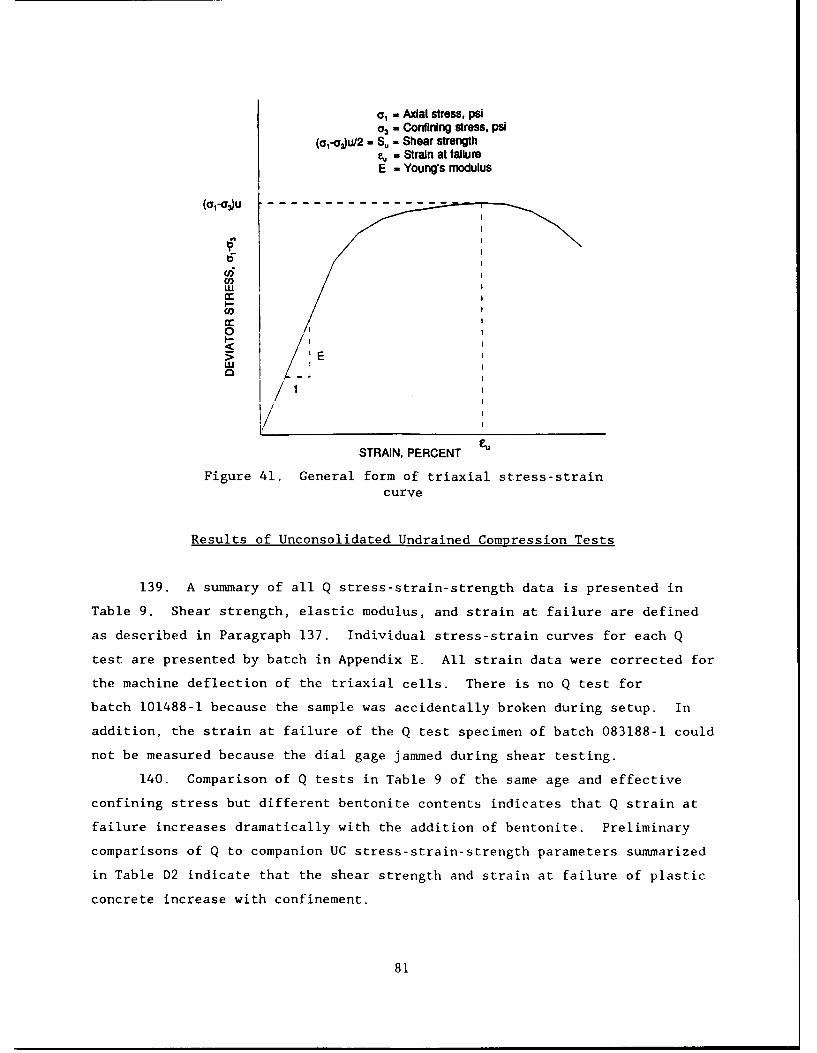
, W Axial stress, psi03 - Confining stress, psi
(a,-q/2 - S, - Shear strengthe -Strain at falureE - Young's modulus
w
I-I
I)
o
/
STRAIN, PERCENT
Figure 41. General form of triaxial stress-straincurve
Results of Unconsolidated Undrained Compression Tests
139. A summary of all Q stress-strain-strength data is presented in
Table 9. Shear strength, elastic modulus, and strain at failure are defined
as described in Paragraph 137. Individual stress-strain curves for each Q
test are presented by batch in Appendix E. All strain data were corrected for
the machine deflection of the triaxial cells. There is no Q test for
batch 101488-1 because the sample was accidentally broken during setup. In
addition, the strain at failure of the Q test specimen of batch 083188-1 could
not be measured because the dial gage jammed during shear testing.
140. Comparison of Q tests in Table 9 of the same age and effective
confining stress but different bentonite contents indicates that Q strain at
failure increases dramatically with the addition of bentonite. Preliminary
comparisons of Q to companion UC stress-strain-strength parameters summarized
in Table D2 indicate that the shear strength and strain at failure of plastic
concrete increase with confinement.
81

r4 Cn 00 %o Co r- I Lr) r- )%C A' -4 0 C14 0 In C
U) In 42
L4n4 112 0 0c c - r0"a'oo '0r00 -00 ul L C'0~ 04"D%. 1 0\004a' ma'a00 ls '100 D00
0.) 4I -4'J 4 4 - 4 4 J 14 r- r ,-4 -4-r C C
-4 ~ ~ ~ '- 4) 4r4r4-
41)04 4.344 '0 t- C4OMC -4 C - r- .- 4 V .D M 0 It y C)0 a'D2-4 r* n % 4 1 o n - - - % ) I %
r,) bO) Ul -4C4MC1 n0 n 4- 40- 4-
2-4 0 4) ,-,- 0UJ *- m UY )C)) >C mC >0
En V.fU)0
444E 1-1 0
0. 4- '4 % lCJC 0r C4 00C-4 0 04 C 'J4M-.?L "C MUr'.,,4
0 I .4 4-4 4) m) "42) mc e mCd4w 4 4--- r4 - - 4 -4-4--44 4 r4 - 4- -4-4 C:- -4
r-4 4 . -4 (.3
a\ ul W.4- 14)4). 40l-.40 4) 2
4) E--4 0
co14 1 4 - 40 400 - 4 r40 1r40 4)~ -4 .4 ) 4)44~~~~~~- -4C 0r 0 00 4.
C4141)- 0 c
Ic 0 ~ Ul tI f Dm m0 NC\m-4 -4-- j - mc -4 40 ho -4 0 41
4)0 0. 4)ca-4"tX-C9-4 4 .) 4.3o
+ - - P0000 000 0000 000 00 4-) ~ 0. v2
bo 4 4 r4 4 - ( ) -4--4 C-a. 41
41-l1 -4 x -U.- r0. ca -4 -
co 0J E -040 ~~I4. 0 4 C14& 0W
ooU0 0 0 CO co o o c 0 4-bO co ) CL 4
04. .. .44 44 4 440 2- -'- ) r i -4 -40A 4) 2-i -3 bO 0 )& 4.3 4
00 E - 4). 4) cz)
4)4- co 14 ) Q..r
41 w .4 - .Qr. 0 > C n4r ", N0t ' n no w >04 _(
" -:3 -r\ o.4-0mC mmoo0ooC c\c )obU 0U 00 ( C4 000000M4C04.-400'-40-4 (14 t- I e l)MCJCIe ~l4 d- -
Wcol w . w l82

141. However, all Q elastic modulus values listed in Table 9 are less
than corresponding UC elastic modulus values listed in Table D2. This sug-
gests that elastic modulus, and hence, material stiffness decrease with con-
finement, a conclusion not consistent with the results of the CIUC test
series. Concrete subjected to confining stress should become stiffer. The
most likely cause of this anomaly is lack of planeness of Q test specimen
ends. Seating deflections probably occurred in the early stages of compres-
sion due to crushiiug of high points on specimen ends. These seating deflec-
tions resulted in higher than actual strains, and thus lower than actual
elastic moduli. The Q test strain and failure values were probably influenced
very little by any seating deflection. Most of the strain at failure occurs
during plastic deformation, at almost constant load, long after sample seating
during elastic deformation. These broad zones of plastic deformation are
shown in the Q test stress-strain curves in Appendix E.
142. An attempt was made to eliminate seating deflections by sulfur
capping Q test specimen ends, as described in Paragraph 94. Q test specimens
111688-1, 022289-1, and 030189-1 were sulfur capped. Comparison of the
stress-strain curves of Q specimens 022289-1 and 102888-1 (same batch design,
confining stress, and age of 022289-1 capped; 102888-1 uncapped) shows that
sulfur capping increased elastic modulus from 25 to 43 ksi or by 72 percent.
However, the Q elastic modulus of 022289-1 is still significantly less than
its companion UC elastic modulus (43 ksi compared to 207 ksi or 79 percent
less). This suggests that seating deflection problems still existed between
the sulfur caps and the pedestal and top cap of the triaxial chamber. Thus,
the Q elastic moduli values listed in Table 9 are probably incorrect and
should not be used for design. The Q strain at failure values listed in
Table 9 are probably nearly correct; however, they should not be used for
anything except rough approximation until the Q tests are reproduced and the
seating deflection problems solved.
Results of Permeability Tests
143. A summary of the CIUC batches on which permeability tests were
performed is presented in Table 7. A complete compilation of all permeability
tests is located in Appendix F. Table 8 lists the lowest 24 hr average
permeability for each CIUC test on which a permeability test was performed.
83

Permeability values were calculated using the following equation, which is
derived from Darcy's law for flow through soil:
K = QLYw (12)tA(P 2 - PI)
where
k - coefficient of permeability
Q - quantity of water flowing through cross-section A in time t
L - length of flow path through sample
7, - unit weight of water
P2P1 = the difference in pressure across the sample
144. Permeability tests were attempted on all but the following
samples:
a. 111688-1
b. 091588-1
c. 091988-1
d. 083188-1
e. 100688-1
f. 022288-1
145. In addition, permeability tests on samples 082688-1 and 090188-1
failed because of gas generation and/or leaks. Gas was generated within all
samples during curing, a by-product of the reaction of cement. Gas pushed out
of specimens formed bubbles in outflow lines and accumulators. Flow readings
from outflow accumulators were therefore inaccurate and could not be used to
check flow readings from inflow accumulators. All of the permeability values
contained in Appendix F and Table 8 were calculated from flows read from
inflow accumulators. Preliminary comparison of the 24 hr minimum permeabili-
ties listed in Table 8 indicates that permeability decreases with increasing
confining pressure and age. No definite trend can be observed as to the
influence of bentonite content on permeability.
84

PART VI: ANALYSIS AND DISCUSSION
146. Part VI analyzes factors influencing the stress-strain-strength
behavior and permeability of plastic concrete. The graphs and equations pre-
sented herein were developed to be used in a design procedure for plastic con-
crete cutoff walls. Particular emphasis is placed on quantifying the
relationship between mix composition and stress-strain-strength behavior in
order to minimize or eliminate the trial and error approach to mix design
commonly used today.
147. The guiding philosophy behind the analyses was to correlate com-
plex and time-consuming (expensive) triaxial tests to simple and quick (less
expensive) unconfined tests. This allows designers to estimate triaxial
stress-strain-strength parameters from unconfined stress-strain-strength data.
In addition, unconfined behavior is examined at ages up to 660 days, a much
longer time frame than typical project test programs allow.
Relationship of Unconfined Compressive Strength andSplitting Tensile Strength to Cement Factor and
Water-Cement Ratio
148. Figures 42, 43, and 44 are companion plots for selecting a plastic
concrete batch design (cement factor, water-cement ratio, and percent
bentonite) which will produce a certain unconfined compressive strength and
splitting tensile strength at a particular age. For a given cement factor and
bentonite content, there is a unique water-cement ratio which will produce an
8 in. slump plastic concrete. Figure 42 shows cement factor as a function of
water-cement ratio and bentonite content. Figure 42 was initially developed
from the Phase I unconfined compression test series data (Figure 38) and was
subsequently used to specify batch designs for the preliminary splitting ten-
sile test series and the triaxial test series. In addition, Figure 43 can be
used in conjunction with Figure 40 to specify unconfined elastic modulus.
149. Figure 43 shows unconfined compressive strength as a function of
water-cement ratio, bentonite content, and age. Figure 43 was developed from
Figure 39 by visual-fitting of data of equal curing age for each bentonite
content. Because Figure 43 is difficult to read, blow-ups of each bentonite
content are presented in Figures 44 to 48. These figures allow more precise
85

4 6 0 . ... .. . .. .. ... ... ... ... .. . .. .... ... . ..
440 Slump= 8 /-1 in.
420-
lo 400-40%
u380 20%0_0% 10%360-
0260S340-
0
-. 320-Q)
E 300-U
280-
260-
240-
2200.8 1.0 1.2 1.4 1.6 .8 20 2.2 2.4 2.6 2.8 3.0 3.2
Wter-cement Ratio. W/C
Figure 42. Cement factor versus water-cement ratio andbentonite content
365 +
2810%
.1000- 7
3* 28 365+
0%+
V)
(I)
L100-
0 1
Q) ~40% 9
C
c 60%
10 '' ' T1T-T 1111 * I * I
0-8 1 .0 ;121T 141 f1.16 1.8 2.0 2.2 2.4' 2.6' 2.8' 3.0 3.2Water-cement ratio, w/c
Figure 43. Unconfined compressive strength versus water-cement ratio for all bentonite contents with lines being
isobars of curing age
86

I*T
Bentonite= N%
0 28
C
4)1000 7
(0
0)0.E
C
0.8 1.0 1.2 1.4 1.6 1.8Water-cement ratio, W/C
Filgure 44. Unconfined compressive strength versus water-cement ratio for 0 percent bentonite content with lines
being isobars of curing age
2-
Bentonite= 10%Slump= 8 in.
In
~ioo
0
10 I- T--r--
1a
Wae cmntrto /
Fiue4.UcnieCopesiesrnt esswtr
ceen rai oa0pretbnoiecnetwt ie
benUsbaso urn g
487

Bentonite= 20%6- Slump= 8 in.
365
a-
C
U0)
D)
0 0 Vi -
1 .E. . . . . .0ae-e etrto /
Fiue4. UcnieUopesiesrnt esswtr
ceetrtofr2 ecn bnoiecnetwt ieben sbaso)urn g
C-
C2
1 I , I I
1.C. . . . .Wae-eetFto /
1 4 1 6 1um 8 in2. 24
8

2 1 1
Bentonite= 60%Slump= 8 in.
O)
365t
09
c0
U
C
0 95
0
2.2 2.4 2.6 28 3.0 3.2
Water-cernent ratio, W/C
Figure 48. Unconfined compressive strength versus water-
cement ratio for 60 percent bentonite content with lines
being isobars of curing age
values of unconfined compressive strength and water-cement ratio to be
obtained. Figure 49 similarly presents splitting tensile strength as a func-
tion of water-cement ratio, bentonite content, and age. Figure 49 is incom-
plete, however, because of the limited number of tensile batch designs and
curing ages.
150. A designer who needs plastic concrete of a certain unconfined
compressive strength and/or modulus at a certain age can enter Figures 43
to 49 and Figure 40 to obtain a corresponding water-cement ratio and bentonite
content, and then enter Figure 42 to obtain the corresponding cement factor.
For example, a designer has measured the unconfined elastic modulus of a pro-
posed compacted embankment soil as 200 ksi (using a compressometer to measure
deflection) and wants to specify a plastic concrete cutoff wall of matching
long-term stiffness. Figure 40 yields a corresponding unconfined compressive
strength of 210 psi. Figure 43 then shows a choice exists at 210 psi between
10 and 20 percent bentonite mixes at curing ages of 3 days, and a 40 percent
bentonite mix at a curing age of 365+ days. Since the criterion is long-term
stiffness, the designer chooses the 40 percent bentonite mix. The designer
89
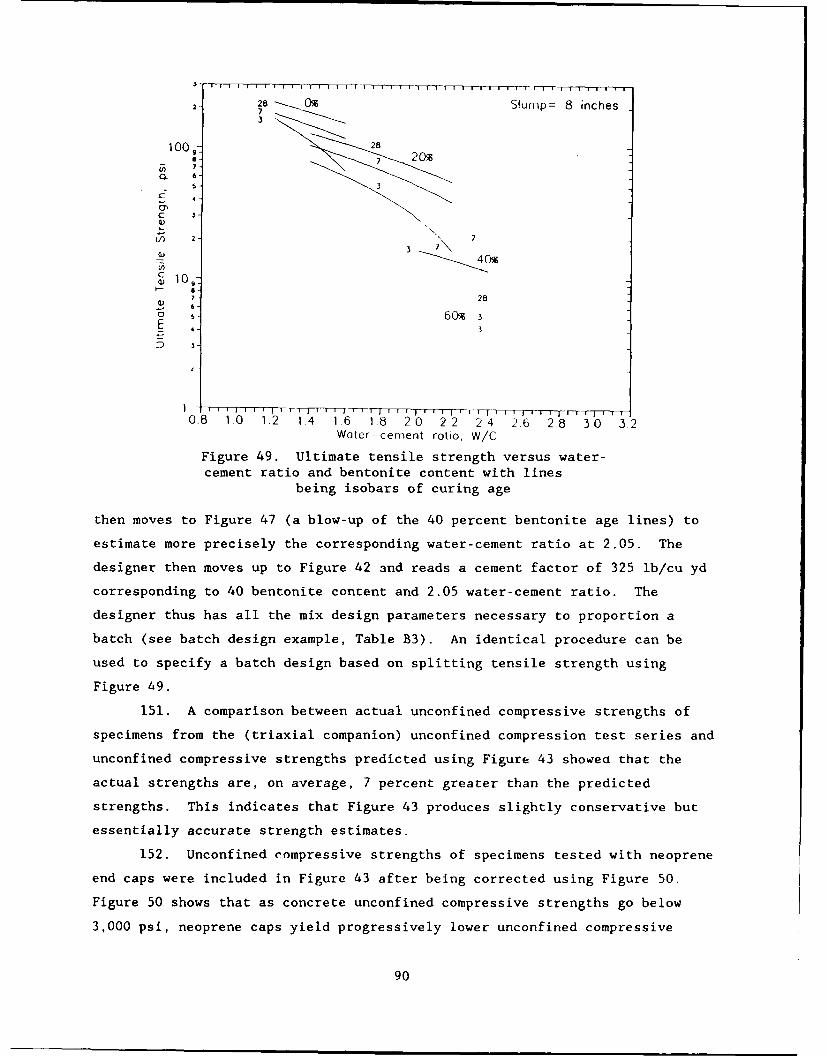
2 28 0 Slump= 8 inches73
S-
100- 28
Q. 6
C 3
4 -
1) 2 1
e 60%
0.8 1 . .8 2 0 2 2 52 , , . .
cement ratio and bentonite content with linesbeing isobars of curing age
then moves to Figure 47 (a blow-up of the 40 percent bentonite age lines) to
estimate more precisely the corresponding water-cement ratio at 2.05. The
designer then moves up to Figure 42 and reads a cement factor of 325 ib/cu yd
corresponding to 40 bentonite content and 2.05 water-cement ratio. The
designer thus has all the mix design parameters necessary to proportion a
batch (see batch design example, Table B3). An identical procedure can be
used to specify a batch design based on splitting tensile strength using
Figure 49.
151. A comparison between actual unconfined compressive strengths of
specimens from the (triaxial companion) unconfined compression test series and
unconfined compressive strengths predicted using Figure 43 showed that the
actual strengths are, on average, 7 percent greater than the predicted
strengths. This indicates that Figure 43 produces slightly conservative but
essentially accurate strength estimates.
152. Unconfined compressive strengths of specimens tested with neoprene
end caps were included in Figure 43 after being corrected using Figure 50.
Figure 50 shows that as concrete unconfined compressive strengths go below
3,000 psi, neoprene caps yield progressively lower unconfined compressive
90

50-
4o
3cI
S20
C
o
_ 10 ~y=_48.53e -° 1 5
0
I00C 2000 3000Unconfined Ultimate Stress, neoprene cops
Figure 50. Unconfined compressive strength correctioncurve for neoprene end caps
strengths than sulphur caps for the same specimen. An example of how
Figure 50 was used is as follows:
qu with neoprene caps - 1,000 psi
entering Figure 50 yields percent greater of unconfined compressivestrength with sulphur caps of 10 percent.
qu, sulphur caps = 1. lOqu, neoprene caps
Relationship of Elastic Modulus and Strain at Failureto Unconfined Compressive Strength
153. A comprehensive design procedure requires that estimates of uncon-
fined elastic modulus and strain at failure be calculated. In addition to
Figure 40, regression analysis was performed cn the normalized parameter E/qu
versus bentonite content and time to characterize the relationship between
elastic modulus and unconfined compressive strength. No coirelation was
91

observed between E/qu and bentonite content. This suggests that the addi-
tion of bentonite has an equal effect on both unconfined elastic modulus and
unconfined compressive strength. However, E/qu as a function of age yielded
the following relationship:
_----- 4 00logtA + 1,000 (13)
qu
where
E¢ p= elastic modulus, psi, calculated from strains measured with acompressometer at age tA
tA - concrete age, days
qu= unconfined compressive strength, psi at age tA
154. Equatirn 13 can be used in conjunction with Figure 49 irnstead of,
or as a check on, Figure 40 to estimate the elastic modulus corresponding to a
specified unconfined compressive strength or to obtain an estimate of uncon-
fined confined compressive strength corresponding to a specified elastic
modulus.
155. The _elationship of unconfined compressive strength to strain at
failure was examined using values of ultimate secant modulus, qu/eu , where
cu was me-aured with a compressometer. Figure 51 shows ultimate secant
modulus as a function of sample age and bentonite content with regression
lines drawn for each bentonite content. Figure 51 indicates that strain at
failure decreases more slowly with age for increasing bentonite ccntents.
Figure 51 can be used in conjunction with Figure 49 to obtain an escimate of
strain at failure for a specified unconfined compressive strength. Estimates
obtained using Figure 43, however, must be viewed with caution because of the
high degree of scatter ot qu/eu L-a, as shown in Figure 51, particularly
for 0 and 10 percent bentonite contents.
Relationship between Unconfined Compressive Strengthand Splitting Tensile Strength
156. Splitting tensile tests were includeJ as part of the triaxial
companion unconfined tests in an effort to develop a simpler relationship
between unconfined compressive strengtI, and splitting tensile strength than
92

15001400 QgQQQ 0 bentonite Slump= 8 in.
oQ.SL::P 10% bentonite1300 4A&" 20% bentonite
0 40% bentoniteS1200 Otamt 60% bentonite
1100
1000u900
8000
: 700
g 6000U0
2 400 0 1M 0- o
300 o5 200 - 2o
200 0
~~ 60
Age, days
Figure 51. Ultimate secant modulus, qu/cu , versuscuring age and bentonite content with all strains (eu)
measured with compressometer
offered by Figures 43 and 49. Figure 52 shows normalized values of splitting
tensile strength (T) divided by unconfined shear strength (Su or US, = qu/2)
for each Phase II test plotted against unconfined shear strength.
157. From Figure 52 it appears that T/US is about constant at 0.26 and
is independent of bentonite content and age. This allows a designer to elimi-
nate the use of Figure 49 to obtain an estimate of tensile strength corres-
ponding to a given unconfined shear strength. The use of T/US is limited,
however, because it was developed only from data with cement factor equaling
300 lb/cu yd and ages 3 to 14 days. Further study must be conducted before
this equation can hold for the full range of cement factors and ages contained
in Figure 43.
Effect of Curing Age and Bentonite Content onUnconfined Compressive Strength
158. Figure 53 shows a plot of unconfined compressive strength as a
function of curing age and bentonite content. Regression lines are drawn for
93

1.00 ... . . . .
0.9 Slump= 8 in.
0.90 Cement Factor= 300 pcy
.S 0.60C0Cu 050
-E 0.40C
0 0~0.30 @ 0 T/US- 0,26
nr 'C00
.0.2000
L'. 10
C.0 100 zoo 303 430 503C C
Unconifined Smear Strengtn, ps'
Figure 52. Splitting tensile strength/unconfined shearstrength versus unconfined shear strength
1600- 1 . .1 .- ,,'" ),, .
1 500 Note: All data points corrected to Cement Factor- 50 bs/yd 3
AMl data points ore averages of 1 -4 tests
_1400 0
cL 1300
or1200 00'0
QC 10007
S900-
ID 800 0
v) 700P0 109%
"L600E00
UO500 A 0
-o 40020C 300
3O 00 - 40__ __ _ _ __ _ _ __ _ _
C
D100- 60%
0-27'6'9" S9 2 31 4 567,8,91 2 3 54 I 5 769
1 10 100 1000Curing Age, days
Figure 53. Unconfined compressive strength, q,,versus curing age and bentonite content
94

each bentonite content. All the data points shown are averages of 1
to 4 tests and were corrected to a cement factor of 300 lb/cu yd using Fig-
ure 43. The equations for the regression lines are as follows:
qu, 01 - 278*log(age) + 580
qu,1oz - 95.6*log(age) + 340
qu,20Z - 45.6*log(age) + 280 (14)
q., 40- 40.0*log(age) + 100
q.,602 26.1*log(age) + 0
where q is in units of pounds per square inch and age is in units of days.
The percent increase in unconfined compressive strength between ages of
3 and 600 days for each bentonite content are:
PercentIncrease
Bentonite in qu ,Content 3-600 days
0% 90%10% 58%20% 36%,to% 85%60% 300%
159. Figure 53 shows that the addition of bentonite to concrete
decreases the rate of increase in unconfined compressive strength with curing
age. No clear trend, however, is evident in the percent increase in uncon-
fined compressive strength between ages of 3 and 600 days. Figure 53 does
indicate that mix designs with 60 percent bentonite develop long-term uncon-
fined compressive strength much more slowly than mix designs with bentonite
contents of 0 to 40 percent.
Effect of Consolidation on Cement Factorand Water-Cement Ratio
160. For all CIUC tests the amount of water removed during consolida-
tion was carefully measured in order to better understand the influence of
consolidation on the stress-strain-strength behavior of plastic concrete.
Table 6 summarizes the amount of water removed during consolidation for each
CIUC test. The cement factor and water-cement ratio of a CIUC sample are
defined as:
95
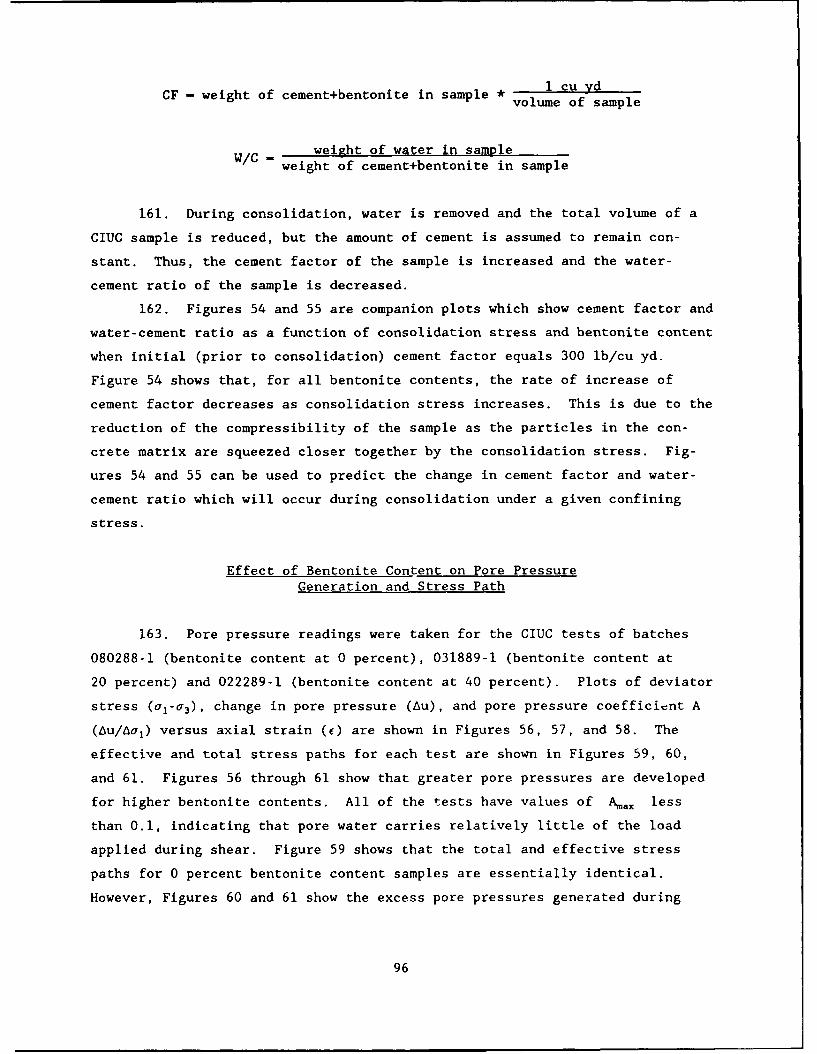
1 cu vdCF - weight of cement+bentonite in sample * volu o
avolume of sample
W/C - weight of water in sampleweight of cement+bentonite in sample
161. During consolidation, water is removed and the total volume of a
CIUC sample is reduced, but the amount of cement is assumed to remain con-
stant. Thus, the cement factor of the sample is increased and the water-
cement ratio of the sample is decreased.
162. Figures 54 and 55 are companion plots which show cement factor and
water-cement ratio as a function of consolidation stress and bentonite content
when initial (prior to consolidation) cement factor equals 300 lb/cu yd.
Figure 54 shows that, for all bentonite contents, the rate of increase of
cement factor decreases as consolidation stress increases. This is due to the
reduction of the compressibility of the sample as the particles in the con-
crete matrix are squeezed closer together by the consolidation stress. Fig-
ures 54 and 55 can be used to predict the change in cement factor and water-
cement ratio which will occur during consolidation under a given confining
stress.
Effect of Bentonite Content on Pore PressureGeneration and Stress Path
163. Pore pressure readings were taken for the CIUC tests of batches
080288-1 (bentonite content at 0 percent), 031889-1 (bentonite content at
20 percent) and 022289-1 (bentonite content at 40 percent). Plots of deviator
stress (al-a 3), change in pore pressure (Au), and pore pressure coefficient A
(Au/Aal) versus axial strain (c) are shown in Figures 56, 57, and 58. The
effective and total stress paths for each test are shown in Figures 59, 60,
and 61. Figures 56 through 61 show that greater pore pressures are developed
for higher bentonite contents. All of the tests have values of Ama, less
than 0.1, indicating that pore water carries relatively little of the load
applied during shear. Figure 59 shows that the total and effective stress
paths for 0 percent bentonite content samples are essentially identical.
However, Figures 60 and 61 show the excess pore pressures generated during
96
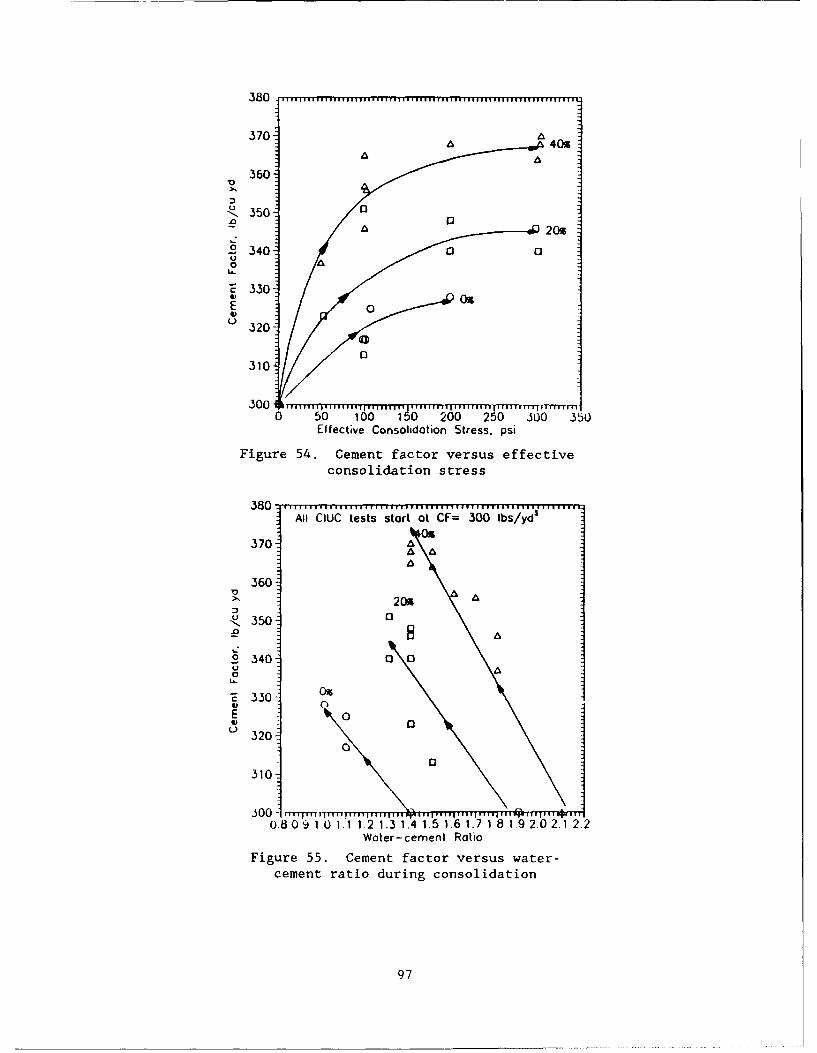
380.
370
360
J:ul 350
2340 010
ZE 330E0
320
310
0 50 100 1 50 200 250 .300 350Effective Consolidation Stress, psi
Figure 54. Cement factor versus effectiveconsolidation stress
380.........................All CIuC tests start at CF= 300 lbs/yd'
Ox3707A
360
20S350
.2340 a 0U
00Z 330- 0
E0
320
310
300 .T---r1~mTr-T-Jo. 80.9. 1.0U 1. 1 1. 2 1.3 1.4 1.5 1.6 1.7 1 81.9 2.0 2.1 2.2
Water-cement Ratio
Figure 55. Cement factor versus water-cement ratio during consolidation
97
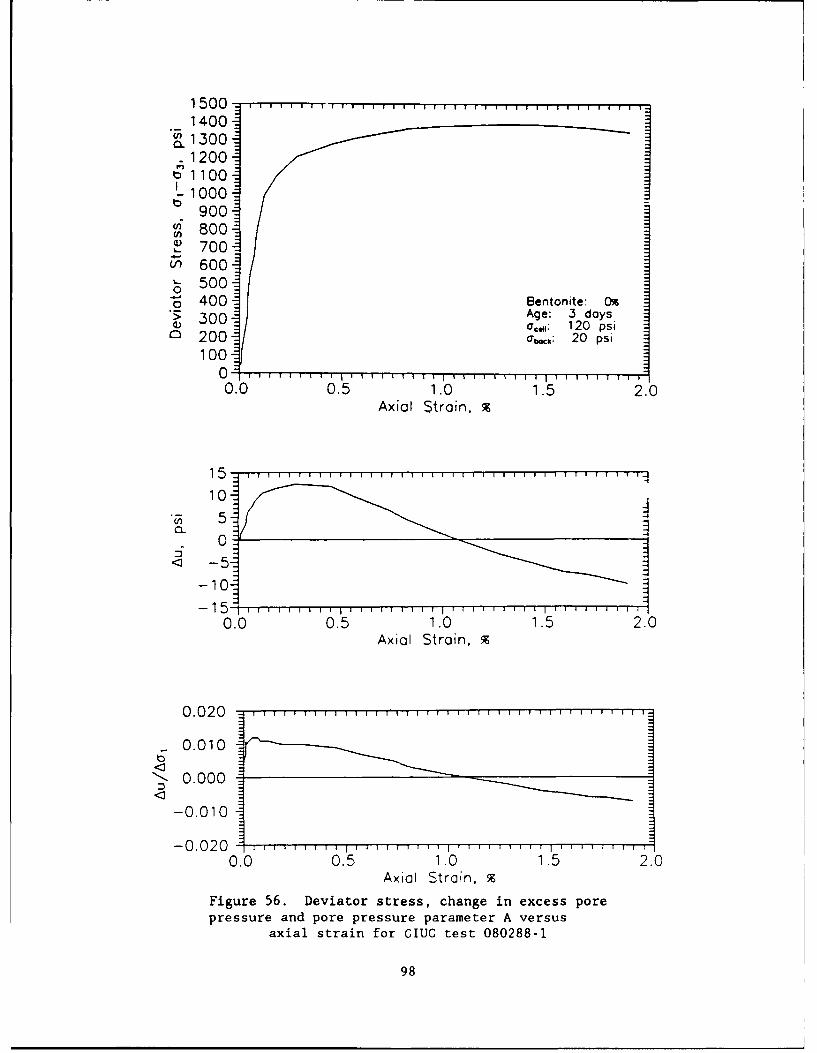
1500 .. .. .. .. .
1400
in1300
1200I
cn 800=S700
C/) 6001.- 5000c) 4001 Bentonite: 0%
~ 3QQAge: 3 days300 CCOII 120 psi
o 200 abk: 20 psi100
000.5 1.01.20Axial Strain,
10
( 5
-10
000.5 1.01.20Axial Strain,
0.0 10
'.0.000
- 0.0 10
000.5 1 .0 1.52.Axial Strain,
Figure 56. Deviator stress, change in excess porepressure and pore pressure parameter A versus
axial strain for CIUG test 080288-1
98

1 5 0 0 ... .. .........l....ll l llf lll l ll l |I l ll l l ll l ll l l ll l ll l
1400a 1300
1200C1100
-1000- 900
80009700
Ln 600500400 Bentonite: 20%
3 00 Age: 58 daysr. 1: 200 psi
r 200 r-"k: 100 psi
100
0.0 0.5 1.0 1.5 2.0 2.5 3.0 3.5 4.0Axial Strain, %
25
0
0.0 0.5 1.0 1.5 2.0 2.5 3.0 3.5 4.0
Axial Strain, %
0 . 1 0 ., .................................................... . . ...... ....... .
0.05
-0.00
-0.05- . ,I
0.0 0.5 1.0 1.5 2.0 2.5 3.0 3.5 4.0Axial Strain, %
Figure 57. Deviator stress, change in excess porepressure and pore pressure parameter A versus
axial strain for CIUC test 031889-1
99

1 0 0 0 1 1 1 11 11111t 7I I MI I I rr to it 1 11 I i I II I I if III, I I I I III I I III ." i
S900
800
I700
600
in 500
0I 4000 .300
.2 Bentonite: 40S> 200 Age: 14 days
C) O',,': 200 psi100 ab.Ck: 100 psi
0.0 2.0 4.0 6.0 8.0 10.0 12.0 14.0 16.0Axial Strain,
40-~i20-
0.0 2.0 4.0 6.0 80 100 12.0 140 60Axial Strain,
0.10 -TT__TrT~T .
0.06
<~ -0.02
-0.06
0.0 2.0 4.0 6.0 8.0 10.0 12.0 14.0 16.0Axial Strain, %
Figure 58. Deviator stress, change in excess porepressure and pore pressure parameter A versus
axial strain for GIUC test 022289-1
100

1000-
Batch: 080288-1 acau= 120 psi900- Bentonite: 0% awx 20 PSI -j
Age: 3 days Auh4~x= 12.5 psi.
800Aq~x 0.01
700
6005
- ~effective stress p(a t hlto 500-
400
300-
200 otal stress patr'
100
0 1CO 200'6 30040050'06070 300 900 1-000p= ac-,-a3/2
Figure 59. Total and effective stress paths for GIUGtest 080288-1
1000-
:Batch: 031889-1 aCELL= 200 psi900- Berntonite: 20% aa~zx= 100 psij
-Age: 58 days Auwm= -44 psiaoA,,.. -. 09
700
600C'J
t 500 total stress zath /
400-
300 ~."effective stress ,ctr'
200
100 /
0~0 160 2(03,0 ' 7 5060066 0 30 C00 00C
p= a,+j 5/'2
Figure 60. Total and effective stress paths for GIUGtest 031889-1
101

6OO
Batch: 022289-1 CELL= 200 psiBentonite: 405 aWK= 100 psiAge: 14 days tuv =46.8 psi
500 Am 0.08
400
C-4
300 Effective Stress Path
0II
200Total Stress Path
100
0 100 200 .00 400 500 600
p= ai+a3/2
Figure 61. Total and effective stress paths for CIUCtest 022289-1
shear for the 20 and 40 percent bentonite content samples are great enough to
cause significant differences between total and effective stress paths.
164. Figure 62 shows 14-day age failure envelopes for each bentonite
content. Each failure envelope was constructed from two points, a CIUC test
and its corresponding UC test. For the 0 percent failure envelope, the CIUC
data point is the effective failure point of test 102688-1. For the 20 and
40 percent failure envelopes, the CIUC data points are the effective failure
points of tests 031889-1 and 022289-1 (Figures 60 and 61). The values of
effective friction angle, 4 , from Figure 62 for bentonite contents of 0, 20,
and 40 percent are 65, 50, and 420, respectively. Because these friction
angles were developed from so few points they are only rough estimates. They
are presented only for use in obtaining preliminary approximations of CIUC
shear strength. More CIUC tests with pore pressure measurements are required
to better define plastic concrete friction angles.
165. Additional testing was planned to study the effect of strain rate
on pore pressure generation but was unable to be performed because the testing
102

2000 ................
Curing ages of tests: On- 14 days1800 20%- 58 days
40%- 14 days
1600
1400
2051200
C-, CIUC tests with pore 405J 1000 pressure m-jasurements
800 /,
- 2.o = 50 .
600 T"= 42°
400
200 uCompanionUC tests
0-
0 200 400 600 800 1000 1200 1400 1600 1800 2000p= aT+a3/2
Figure 62. Effective failure envelopes and frictionangles for 0, 20, and 40 percent bentonite
machine could not deflect at a rate significantly slower than the 0.05 in./min
deflection rate used for the tests described above.
Relationship Between Triaxial Stress-Strain-Strength Behaviorand Unconfined Stress-Strain-Strength Behavior
166. Large-scale triaxial tests on plastic concrete are complex and
time-consuming and therefore expensive. They may also be beyond the capabil-
ity of many soils laboratories to perform because of the specialized equipment
and high capacity testing machine required. Most laboratories, however, are
capable of performing standard unconfined compression tests. The above idea
was one of the reasons that the unconfined companion tests were preformed as
part of the triaxial test program.
167. Figure 63 shows a plot of CIUC shear strength (Table 8) normalized
with corresponding companion UC shear strength (Table D2, Su=qu/ 2 ) as a func-
tion of effective confining stress. Figure 63 is intended to be used as a
design aid to enable a designer to obtain an estimate of CIUC shear strength
from corresponding UC shear strength. The UC shear strength can come either
103
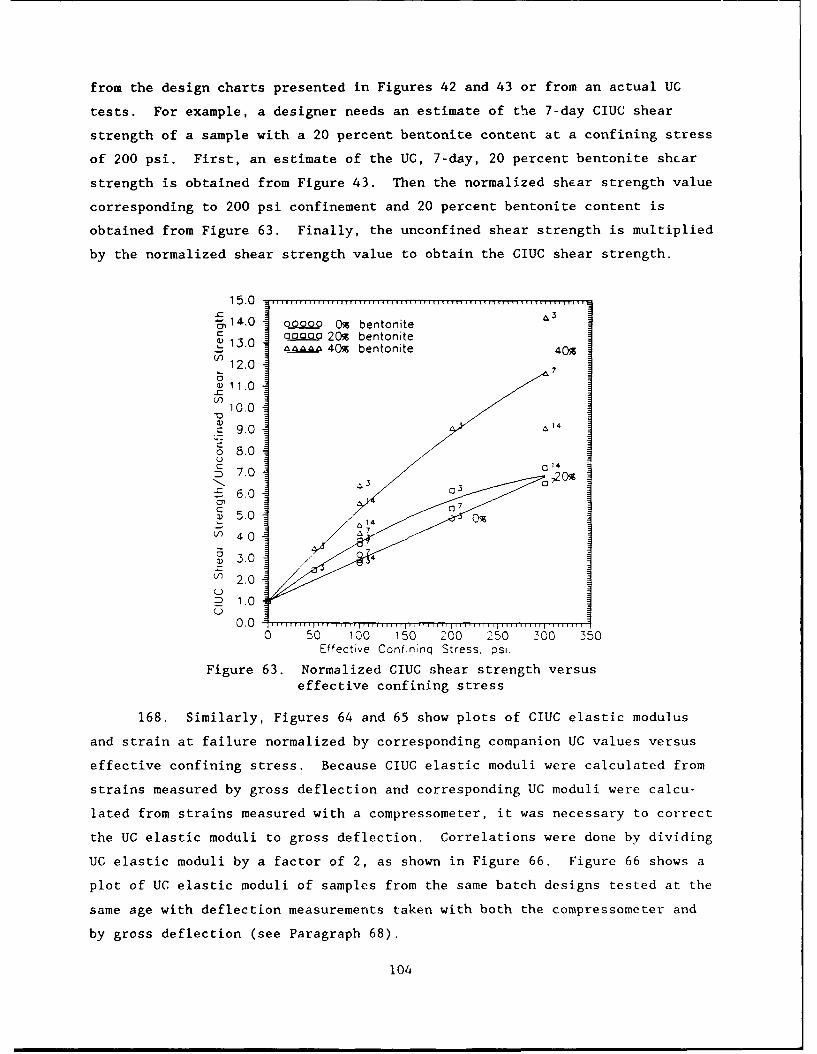
from the design charts presented in Figures 42 and 43 or from an actual UC
tests. For example, a designer needs an estimate of the 7-day CIUC shear
strength of a sample with a 20 percent bentonite content at a confining stress
of 200 psi. First, an estimate of the UC, 7-day, 20 percent bentonite shcar
strength is obtained from Figure 43. Then the normalized shear strength value
corresponding to 200 psi confinement and 20 percent bentonite content is
obtained from Figure 63. Finally, the unconfined shear strength is multiplied
by the normalized shear strength value to obtain the CIUC shear strength.
15.0 ... .IIIIIIIIIl5,14.0 O.ap 0% bentonite A
3
C -o P - -0 -0 2 0 % b e n t o n it e
13.0 ____ 40% bentonite 40X12.0
7
5 1 11. 0
10.0
A14C 9.0Co 8.0
Z) 7.0
6.0C7a! 5.0 140
S4.030 3.
2.0
21.00.0 250i 300~l, I I I I, , l i ' I l IT I l i l, I I I ,l I , I
0 50 500 50 200Y 350Effective Confininq Stress, psi.
Figure 63. Normalized CIUC shear strength versuseffective confining stress
168. Similarly, Figures 64 and 65 show plots of CIUC elastic modulus
and strain at failure normalized by corresponding companion UC values versus
effective confining stress. Because CIUC elastic moduli were calculated from
strains measured by gross deflection and corresponding UC moduli were calcu-
lated from strains measured with a compressometer, it was necessary to correct
the UC elastic moduli to gross deflection. Correlations were done by dividing
UC elastic moduli by a factor of 2, as shown in Figure 66. Figure 66 shows a
plot of UC elastic moduli of samples from the same batch designs tested at the
same age with deflection measurements taken with both the compressometer and
by gross deflection (see Paragraph 68).
104

00000o Ox bentonite0000OC0 20% bentonite 6
6.0 AAAAA 40% bentonite
5.0
OM 4.0 A 3 40
2.0$
1.07cA
0~ 50 101020 25 230N5
12.0 tt
~- 14.0
11.07
950 10 15 00% 0 5
17.0000 05 etne16.0A14030 20 etne5.0 4059 betoit
1 4.015 3.0 3.S 12.0
Q1.080
07.00 00 20 20 30 5
105

2500 . . . . . . . . . . . . . . . .
. 2000C
1500
V 1000.
0000
o 0 0
.2 500, 0
0-0
0 500 1000 1500 2000 2500Elastic Modulus. Cornpressometer, ksi.
Figure 66. Unconfined elastic modulus measured by grossdeflection versus unconfined elastic modulus measured
by compressometer
169. In addition, Figure 67 shows a plot of Q test shear strength nor-
malized by corresponding UC shear strength as a function of confining stress.
No normalized plots of Q test elastic moduli and Q strain at failure were
constructed because of the possible incorrectness of Q elastic moduli and Q
strain at failure, as described in Paragraph 139.
170. Figures 63 through 65 and 67 allow a designer to estimate the
stress-strain-strength behavior of plastic concrete over a wide range of
drainage and confinement conditions. It must be emphasized, however, that the
estimates obtained using Figures 63 through 65 and 66, particularly of elastic
modulus and strain at failure, are approximate due to the large degree of
scatter in the data. Actual stress-strain-strength values may vary markedly
from the predicted values and any design must take the variability of the
plots into account.
106

3 .5 0 .. .. . .. .. . ... . .. .. ... .. . ... ... . .... .. .. .. ... 1 , ,, , , ,, , ,, , ,, , , ,, ,
oQQQ 0% bentoniteEo3o 20% bentonite
3.00 a&&&& 40% bentoniteC o14
5 2.50 3 44.7
2.00
031.5 0
A7
1 00
o 0.50
0 .0 0 .. . . . . . . . . . . . . . . . . . .. . . . . . . . . . . . . . . . . .. . . . . , . . . . . , . . . . .
0 50 i00 '50 200 250 300 350Confining Stress, psi
Figure 67. Normalized Q shear strength versusconfining stress
Comparison of a CIUC Test and a 0 Test Having the SameCement Factor, Bentonite Content, and Water-Cement
Ratio Tested at the Same Age
171. Q test were included in the triaxial test program so that the
effect of consolidation on the stress-strain-strength behavior of plastic
concrete could be evaluated. As discussed in Paragraph 158, consolidation
increases a specimens cement factor and decreases its water-cement ratio.
Some researchers have suggested (US Army Engineer Division, North Pacific
1987) that the effects of consolidation can be simulated by forming a Q test
specimen at the cement factor and water-cement ratio and what a CIUC test
would have at the end of consolidation. Implicit within this statement is the
idea that the mechanical effect of consolidation, i.e., the squeezing together
of particles within the soil matrix, has no effect on stress-strain-strength
behavior.
172. To evaluate the validity of this claim, two Q specimens were
formed at the cement factor and water cement ratio of CIUC test 091488-1 and
tested in shear at the same age and confining pressure as 091488-1. The tests
compared as follows:
107
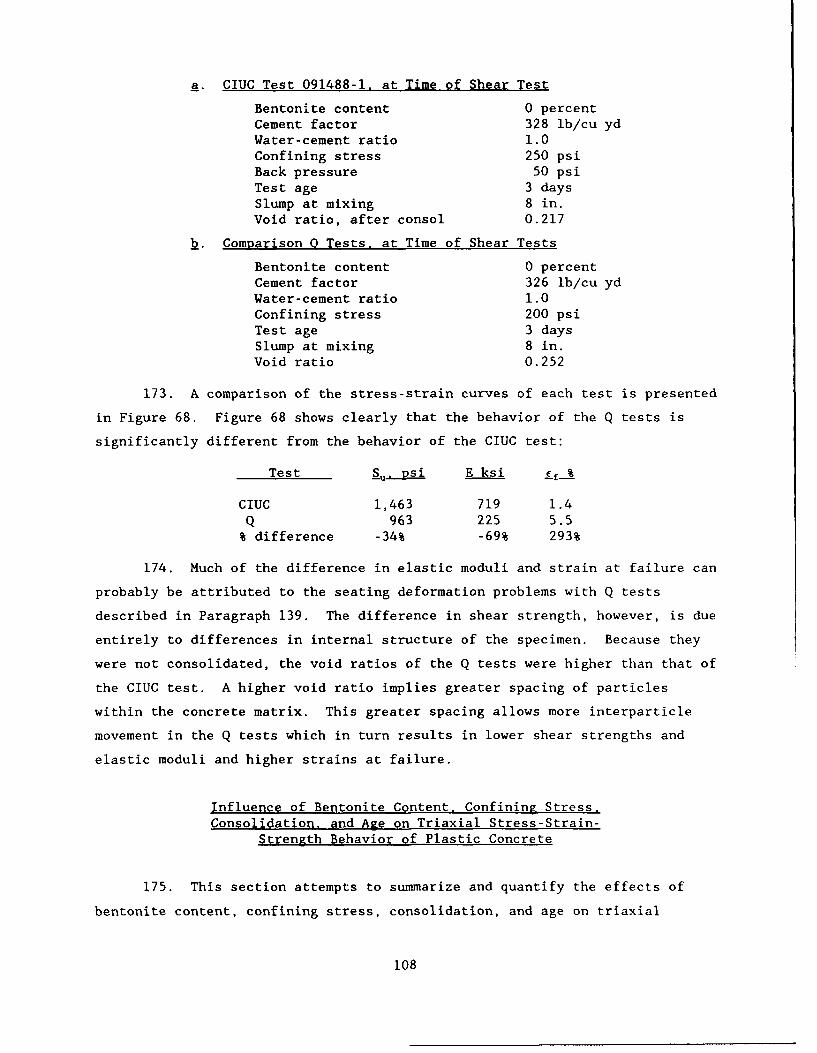
a. CIUC Test 091488-1. at Time of Shear Test
Bentonite content 0 percentCement factor 328 lb/cu ydWater-cement ratio 1.0Confining stress 250 psiBack pressure 50 psiTest age 3 daysSlump at mixing 8 in.Void ratio, after consol 0.217
b. Comparison 0 Tests, at Time of Shear Tests
Bentonite content 0 percentCement factor 326 lb/cu ydWater-cement ratio 1.0Confining stress 200 psiTest age 3 daysSlump at mixing 8 in.Void ratio 0.252
173. A comparison of the stress-strain curves of each test is presented
in Figure 68. Figure 68 shows clearly that the behavior of the Q tests is
significantly different from the behavior of the CIUC test:
Test Su _psi E ksi Ef_%
CIUC 1,463 719 1.4
Q 963 225 5.5% difference -34% -69% 293%
174. Much of the difference in elastic moduli and strain at failure can
probably be attributed to the seating deformation problems with Q tests
described in Paragraph 139. The difference in shear strength, however, is due
entirely to differences in internal structure of the specimen. Because they
were not consolidated, the void ratios of the Q tests were higher than that of
the CIUC test. A higher void ratio implies greater spacing of particles
within the concrete matrix. This greater spacing allows more interparticle
movement in the Q tests which in turn results in lower shear strengths and
elastic moduli and higher strains at failure.
Influence of Bentonite Content. Confining Stress,Consolidation, and Age on Triaxial Stress-Strain-
Strength Behavior of Plastic Concrete
175. This section attempts to summarize and quantify the effects of
bentonite content, confining stress, consolidation, and age on triaxial
108
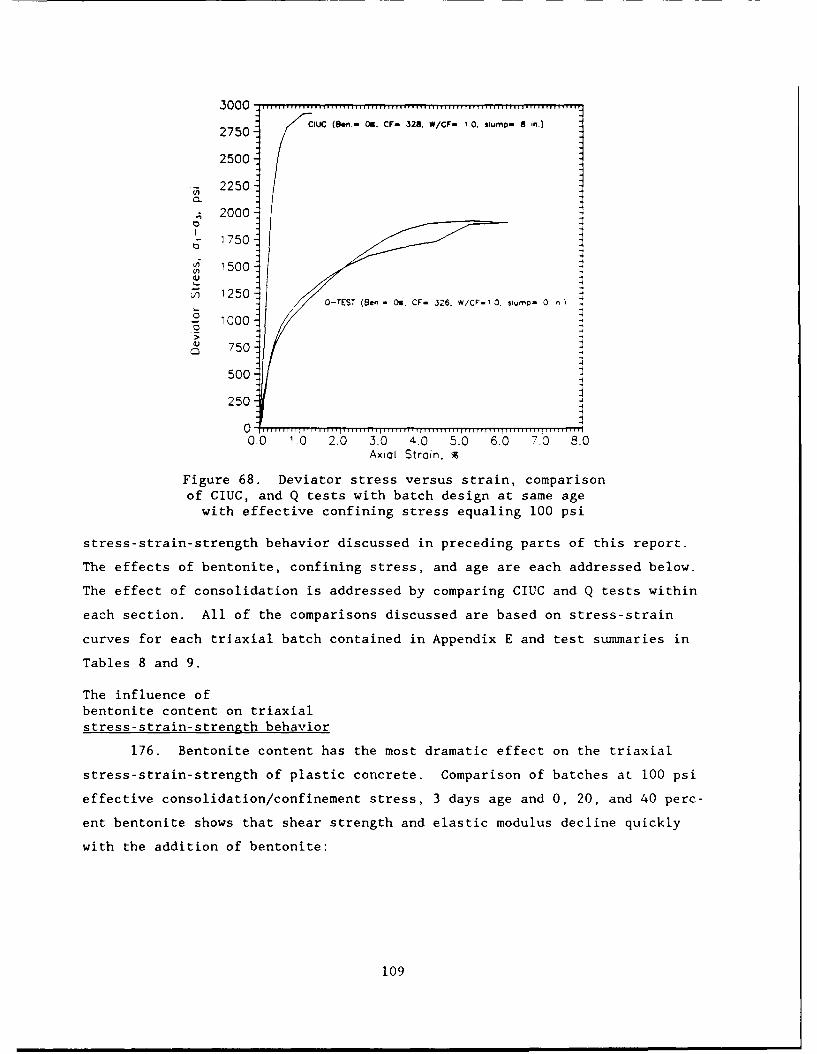
3 0 0 0 ....... .................. . .............. . ............ .......
2750 cuC (Son.- O. CF- 328. W/CF- 1 0. slump- 8 in.)
2500
2250
,2000
1750 1
to0
0 1500
q 1250 -a-TEST (Ben' On0. CF- 326. w/CF-I 0. siumQ=- 0 n -
0 1000
S 750 -
-4
500
250
0.0 1.0 2.0 3.0 4.0 5.0 6.0 7-0 8.0Axial Strain,
Figure 68. Deviator stress versus strain, comparison
of CIUC, and Q tests with batch design at same age
with effective confining stress equaling 100 psi
stress-strain-strength behavior discussed in preceding parts of this report.
The effects of bentonite, confining stress, and age are each addressed below.
The effect of consolidation is addressed by comparing CIUC and Q tests within
each section. All of the comparisons discussed are based on stress-strain
curves for each triaxial batch contained in Appendix E and test summaries in
Tables 8 and 9.
The influence ofbentonite content on triaxial
stress-strain-strength behavior
176. Bentonite content has the most dramatic effect on the triaxial
stress-strain-strength of plastic concrete. Comparison of batches at 100 psi
effective consolidation/confinement stress, 3 days age and 0, 20, and 40 perc-
ent bentonite shows that shear strength and elastic modulus decline quickly
with the addition of bentonite:
109

Bentonite S.. Rsipercent CIUC 0
0 695 45020 479 25440 351 146
From 0 to 20 percent bentonite, CIUC shear strength is reduced by 31 percent,
and from 20 to 40 percent bentonite, CIUC shear strength is reduced by 27 per-
cent. The effect of bentonite on the Q shear strength is more dramatic. From
0 to 20 percent bentonite, Q shear strength is reduced by 44 percent, and from
20 to 40 percent bentonite, Q shear strength is reduced by 43 percent. This
suggests that consolidation reduces the rate of loss of shear strength. The
cause of this phenomena is most likely the increase in cement factor and
reduction of water-cement ratio that accompanies consolidation.
177. The effect of bentonite content on triaxial elastic modulus and
strain of failure are much more difficult to quantify because of the high
variability of these parameters. Elastic modulus generally decreases with the
addition of bentonite in columns as written:
Bentonite E. ksi e_ percentpercent CIUC 0 CIUC
0 919 81 1.28 2.65
20 1,517 54 1.52 4.4740 215 14 3.37 13.85
The percent drop in elastic modulus between 0 and 40 percent bentonite content
is 77 percent for CIUC tests and 83 percent for Q tests. These decreases are
more dramatic than those of shear strength and indicate that the addition of
bentonite reduces stiffness more than it reduces shear strength. Strain at
failure generally increases with the addition of bentonite. This increase.
however, is much greater between 20 and 40 percent bentonite than between
0 and 20 percent bentonite. This indicates that a threshold exists somewhere
between 20 and 40 percent bentonite where the space between aggregate parti-
cles in the concrete matrix becomes great enough to allow particle movement.
In addition, the increase in strain at failure is greater for Q tests than for
CIUC tests, most probably because the Q tests have higher water-cement ratios
and lower cement factors. However, comparisons of Q elastic modulus and
strain at failure may be incorrect due to the seating deflection problems
discussed in Paragraph 139.
110

The influence of confin-ing stress on triaxialstress-strain-strength behavior
178. In general, shear strength, elastic modulus, and strain at failure
all increase with confinement. These increases with confinement are greater
with increasing bentonite content. A comparison between any batches at the
same age and confining stress shows that the ratios of CIUC shear strength and
Q shear strength to companion unconfined shear strength increase with increas-
ing bentonite content, as shown in Figures 63 and 67, respectively. This is
also true of the ratios CIUC elastic modulus and strain at failure to compan-
ion unconfined elastic modulus and strain at failure as shown in Figures 64
and 65, respectively. These trends suggest that confinement has a greater
effect on the looser matrices of higher bentonite mixes. The rate of increase
of shear strength, elastic modulus, and strain at failure decreases above
100 psi effective confining stress, particularly for Q tests. For CIUC tests,
this phenomena is the result of the reduced effects of consolidation on cement
factor, water-cement ratio, and void ratio as consolidation/confining stress
is increased (Paragraph 160). As consolidation stress is increased, incre-
mental gains in shear strength, elastic modulus, and strain at failure are
more a function of confinement than of changes in cement factor and water-
cement ratio. At a certain consolidation pressure, no additional consolida-
tion can occur because the particles in the concrete matrix cannot be pushed
any closer together. Gains in shear strength, elastic modulus, and strain at
failure at confining pressures above this point are only a function of
confinement.
The influence of age on tri-axial stress-strain-strength behavior
179. In general, shear strength and elastic modulus increase with age.
The magnitudes of these changes are larger between 3- and 7-days age than
between 7- and 14-days age. In addition, the magnitudes of the changes
decrease with increasing bentonite content. Strain at failure decrease with
age at 0 and 20 percent bentonite and increases with age at 40 percent
bentonite.
111

180. For CIUC tests at 100 psi effective confining stress:
SU, psi E, ksi fu, percentBentonite age. days age, days age, days
percent 3 7 14 3 7 14 3 7 14
0 695 1,285 1,460 919 739 949 1.28 0.65 0.83
20 479 606* -- 1,517 661* -- 1.52 0.90*
40 351 292 391** 215 228 236** 3.37 4.89 8.13**
* Age - 8 days.
** Average of two tests.
0 percent bentonite concrete experiences an 85 percent increase in shear
strength between 3- and 7-days age. In contrast, at the same effective con-
fining stress, 20 percent bentonite concrete experiences a 27 percent increase
in shear strength, and 40 percent bentonite concrete experiences a 17 percent
loss in shear strength between 3- and 7-days age. Strain at failure exhibits
similar behavior with age, except in reverse. For tests at 100 psi confining
stress between 3- and 7-days age, 0 percent bentonite concrete experiences a
49 percent reduction in strain at failure, and 20 percent bentonite concrete
experiences a 41 percent reduction in strain at failure. For 40 percent ben-
tonite concrete, strain at failure actually increases between 3- and 7-days
age and between 7- and 14-days age.
181. For the Q test, the patterns of behavior are the same as described
above; however, the magnitudes of the changes are much less. For Q tests at
100 psi effective confining stress:
S', psi E, ksi C", percentBentonite age, days age. days age, dayspercent 3 7 14 3 7 14 3 7 14
0 450 511 549 81 307 173 2.65 3.68 1.3920 254 271* -- 54 58* -- 4.87 4.73* --
40 146 140 155** 14 19 34** 13.85 -- 11.99**
* Age - 8 days.
** Average of two tests.
The increases in shear strength between 3- and 7-days age are 12 and 6 percent
for 0 and 20 percent bentonite concrete, respectively. The values of strain
at failure and elastic modulus of the Q tests are too variable to draw any
specific conclusions.
112
Permeability of Plastic Concrete
182. For plastic concrete to be an effective cutoff wall material, it
not only needs stress-strain-strength properties similar to the in situ soil,
but must also be at least as impervious as normal concrete. The permeability
of plastic concrete is the function of four criteria (Fenoux 1985):
a. Bentonite content. At a constant water-cement ratio, theaddition of bentonite to concrete can cause a decrease inpermeability by up to a factor of 10 by increasing the per-centage of platey fines in the particle matrix.
b. Water-cement ratio. Permeability increases as water-cementratio increases. This occurs because an increase in water-cement ratio increases the space between particles in theconcrete matrix.
c. Consolidation stress. Permeability decreases with increasingconsolidation stress. Increases in consolidation stressdecrease the space between particles in the concrete matrix.
d. A Permeability decreases with increasing age. This isprobably the result of tighter binding which occurs betweenparticles in the concrete matrix as cement cures with time.
183. Figure 69 shows a summary graph of all the permeability tests
contained in Appendix F as a function of age, confining stress, and bentonite
content. Figure 69 shows that permeability clearly decreases with age and
consolidation stress for all bentonite contents. Permeability decreases by a
factor of 10 for an increase in consolidation stress of 100 psi. Permeability
also decreases by a factor of 10 between 2- and 11-days age.
184. Bentonite content, however, does not appear to have much influence
on permeability. This is due to the opposing effects on bentonite content and
water-cement ratio. In order to maintain an 8 in. slump when bentonite is
added to concrete, it is necessary to increase water-cement ratio (see Para-
graph 148). It appears that any decrease in permeability due to the addition
of bentonite is negated by the corresponding increase in interparticle spacing
due to increased water-cement ratio. Of prime importance is that the addition
of bentonite to concrete does not increase permeability. A designer can
therefore assume that a plastic concrete cutoff is just as effective against
seepage as a normal concrete cutoff.
113

10~ *-0 0 0 0 0 2 0 % b e n .
AAAAA 40% ben.
C'=. 100 psi
0.00
'00100
0 1A 0 0
Age, days 0
Figure 69. Permeability versus curing age as a function ofbentonite content and confining stress
114

PART VII: SUMMARY AND RECOMMENDATIONS
185. Part VII summarizes the important findings of the research pro-
gram. In addition, recommendations for further study are discussed.
Summary
186. This research program has shown that the addition of bentonite
clay to conventional concrete significantly increases the ductility and plas-
tic deformation of the concrete while simultaneously reducing its shear
strength. This research has also shown that it is necessary to perform con-
solidated and unconsolidated triaxial tests in order to thoroughly understand
the stress-strain-strength and permeability behavior of plastic concrete under
confinement in a diaphragm cutoff wall. Particular attention should be paid
to simulating potential drainage conditions in the cutoff wall because of the
significantly greater shear strength and stiffness plastic concrete develops
when allowed to freely consolidate. The sections below list the specific
influences of bentonite content, age, confinement, and consolidation on the
stress-strain-strength behavior of plastic concrete.
Stress-strain-strength
behavior of plastic concrete
187. A summary of the stress-strain-strength behavior of plastic con-
crete is listed below:
a. Shear strength and elastic modulus decrease with increasing
bentonite content (Figures 39 and 40).
b. Strain at failure increases with increasing bentonite content
(Tables 8, 9, Dl, and D2).
C. Shear strength and elastic modulus increase with age (Para-
graph 151 and Figure 53).
d. Strain at failure decreases with age (Tables Dl and D2 and
Figure 61).
e. Shear strength, elastic modulus, and strain at failure
increase with confinement (Tables 8 and 9 and Figures 63, 64,65, and 67).
f. Shear strength and elastic modulus increase with consolidation
(Tables 8 and 9, Figures 63, 64, 65, and 67).
g. Strain at failure decreases with consolidation (Appendix E).
115

Permeability anderodibility of plastic concrete
188. Permeability and erodibility of plastic concrete are as following:
a. The permeability of plastic concrete at an age of 10 days isbetween 10-8 and 10-9 (Figure 69).
b. Permeability decreases with age (Figure 69).
C. Permeability decreases with consolidation (Figure 69).
d. Permeability does not decrease with increasing bentonite con-tent because of corresponding increases in water-cement ratio(Table 8 and Paragraph 180).
e. The permeability of plastic concrete is the same or less thanthe permeability of normal concrete (Table 8).
f. Unconfined plastic concrete specimens with bentonite contentsof 0 and 60 percent do not experience erosion failure at aseepage velocity of 17 ft/sec applied for 5 days(Paragraph 128).
Scope of plastic concrete design data
189. The following is a list of the scope of plastic concrete design
data:
a. Estimates of unconfined compressive strength, elastic modulus,and strain at failure and corresponding mix design can beobtained for 8 in. slump plastic concrete within these scopes:
(1) Cement factor 230 to 450 lb/cu yd
(2) Bentonite content 0 to 60 percent of cementfactor
(3) Concrete age 3 to 660 days
b. Estimates of consolidated shear strength, elastic modulusstrain at failure and friction angle, and unconsolidated shearstrength can be obtained for 8 in. slump plastic concretewithin these scopes:
(1) Cement factor 300 lb/cu yd
(2) Bentonite content 0 to 40 percent cement factor
(3) Effective consolidation/ 0 to 300 psiconfining stress
(4) Concrete age 0 to 660 days
Recommendations
190. Additional CIUC tests need to be performed in order to better
evaluate the effect of excess pore pressure generation on triaxial shear
strength and stress paths and to better define plastic concrete friction
116

angles. Additional CIUC tests should also be performed over a greater range
of cement factors to expand the scope of the design data. In addition, all of
the Q tests in this test program should be repeated to better evaluate Q elas-
tic modulus and strain at failure. Specific additional triaxial testing
should include the following:
a. Mix designs of 250 and 400 lb/cu yd.
b. More CIUC shear tests with pore pressure readings to evaluateCIUC stress paths and friction angles.
C. Triaxial shear tests at strain rates cf 0.005 in./min or lessto confirm independence of pore pressure generation fromstrain rate.
d. Long-term triaxial testing, i.e. 28 and 90 days, to confirmage independence of normalized CIUC and Q stress-strain-strength parameters.
e. Long-term permeability testing, i.e. 1 year or more, to obtaindesign permeability values.
191. In addition, a Phase III test program should be conducted to eval-
uate the behavior of plastic concrete under different loading and environ-
mental conditions. This program should include the following:
a. Creep testing to evaluate the long-term strain behavior ofplastic concrete under constant load.
b. Cyclic triaxial testing to simulate the changes in stress anearth dam cutoff wall might experience due to fluctuations inreservoir level.
C. Permeability tests with typical ground water pollutants toevaluate plastic concrete performance in an aggressive subsur-face environment.
d. Additional erosion tests should be conducted to quantify theerodibility of plastic concrete.
117

REFERENCES
Alvarez, L., and Mahave, G. 1982. "Convento Viejo's Plastic Concrete Cut-
off," Proceedings. Fourteenth International Conference on Large Dams.
pp 339-353.
Amsler, D. E., and Grygiel, J. S. 1977. "Capping Concrete Cylinders with
Neoprene Pads," Research Report No. 46, New York State Department of
Transportation, New York.
Binnie and Partners, Consulting Engineers. 1968. "Balderhead Dam," in housepublication.
Evans, J. C., Stahl, E. D., and Drooff, E. 1987. "Plastic Concrete CutoffWalls," Proceedings, Specialty Conference, Geotechnical Practice for Waste
Disposal, Geotechnical Division, American Society of Civil Engineers, Special
Publication 13, pp 462-472.
Fenoux, G. Y. 1985. "Filling Materials for Watertight Cutoff Walls,"
Fifteenth International Conference on Large Dams, Bulletin 51.
Habib, P. 1977. "Grout Mixes and Plastic Concretes for Impervious Cutoffs,"
Proceedings of the Ninth Conference of International Conference on Soil
Mechanics and Foundation Engineering pp 89-91.
Hankour, R. (Translator). 1979. "Interface Between a Dam and It's Abutments
and Foundations-Continuity of Sealing Works," Proceedings of Thirteenth Inter-national Conference on Large Dams, p 4.
Headquarters, Department of the Army. 1986. "Laboratory Soils Testing,"Engineer Manual EM 1110-2-1906, Washington, DC,
1986. "Seepage Analysis and Control for Dams," Engineer Manual
EM 1110-2-1901, Washington, DC.
Noguera, G. 1985. "Performance of Colbun Main Dam During Construction,"
Proceedings of Fifteenth International Conference on Large Dams, pp 1049-1059.
Pablo, L. M., and Cruz, A. 1985. "Performance of Colbun Main Dam During
Construction," Proceedings of Fifteenth International Conference on LargeDams, pp 1135-1151.
Peck, R. 1986. "Report on Seepage Control Measures," Mud Mountain Dam for
Seattle District, Corps of Engineers, pp 1-21.
Sliwinski, Z., and Fleming, W. C. K. 1975. "Practical Considerations Affect-ing the Construction of Diaphragm Walls," Proceedings of the Conference on
Diaphragm Walls and Anchorages, Institution of Civil Engineers, London,
pp 1-10.
Tamaro, G. 1988. "Plastic Concrete Cutoff Walls," Proceedings of REMRWorkshop on New Remedial Seepage Control Methods for Embankment-Dams and Soil
Foundations, US Army Engineer Waterways Experiment Station, Vicksburg, MS.
Tardieu, B., and Costaz, J. 1987. "Plastic Concrete Cutoff Wall," TechnicalLecture on Plastic Concrete for Slurry Walls, US Bureau of Reclamation.
118

US Army Engineer Division, North Pacific. 1987. "Report of Tests on PlasticConcrete," North Pacific Division, Corps of Engineers Memorandum W.ONo. 87-C-329.
Woodward-Clyde Consultants. 1981. "Data from Laboratory Testing Program,Colbun Main Dam," Clifton, NJ.
119

APPENDIX A: DETAILED TEST DATA FROM COLBUN MAIN DAM LABORATORY
PROGRAM AND MUD MOUNTAIN DAM LABORATORY PROGRAM

Table Al
Summary of Batch Designs for Colbun Main Dam Research
Program (Woodward-Clyde Consultants 1981)
First Phase Testing Program
The batches prepared, and their components and quantities used are as
follows:
Proposed Alternate AlternateComponents Mix Mix A Mix B
Water 500 ml 400 ml 500 ml
Bentonite* 20 gm 16 gm 20 gm
Cement 100 gm 100 gm 150 gm
Silty Clay** 600 gm 600 gm 600 gm
Concrete Sand* 600 gm 1.000 gm 800 gm
1,820 2,116 2,070
Second Phase Testing Program
This phase also consisted of preparing three different batches of plas-
tic concrete specimens. The batches were identified as Proposed Mix-AD, Mix
No. 1 and Mix No. 2. On each batch a permeability test and unconfined-
compression test (UC) were performed. In addition, on one batch (Mix No. 2),
two consolidated-isotropic-undrained compression (CIUC) tests were performed.
The batches prepared, and their components and quantities used are as
follows:
Proposed Mix MixComponents Mix - AD No. 1 No. 2
Water 500 ml 500 ml 600 ml (500)
Bentonite* 20 gm 30 gm 48 gm (40)
Cement 100 gm 50 gm 90 gm (75)
Silty clay** 600 gm 600 gm 720 gm (600)
Concrete sandt 600 gm 600 gm 720 gm (600)
* Bentonite sample No. 1 used.
** Silty clay Sample No. 1 used after oven-drying.t Concrete sand sample No. I used after oven-drying.
A3

0
E E0
0 0 ) 001C: 0." f
0)u0 II
0L. 0*0.
4) (~ 0' 0 cc 10'.0 '0 (N a,02t '1: -
I-''
oo 0 (N(N coN
- .0 .0 'D ID'. '0w 0~ ' C ' co'
00
W r
0o'0
4) L4m 0o
&N .0 !
0~
0
.00
21 E4)d
.00
w 40
'-A4
4) .. ... . . ...

0 cc 0C. - .1 0 .0 .
0 0 n -- ,Go O.*L 0. .
0
0 r0 00 ~ u u. .. 0 .
-0 0-1C 0bo bo l ., MO4X".- Nd1 - w 4-.1a
0 0 3t 0
(4 ( 0 0 0 0 In
0 C 0 0 ~
-~~0 .--.
0 4D -- - ' 0
cc.0~ r-- 0- ~0- 0 C C r-0
-. , - 0 m 0 .--. cc~ .1 r Go '
41 -. 4(N -((N -0 0.'0 V) 0n c)
u 4d '~- (A(N C~ 1
$4 (4 c , - ,
In, 01 a,-
04 .
CU -14 ID0
(4 .C( - C,4f 4( Go 4m. N
!. 0 00 4-- C'f 0 C-> - 0
00 co ~ 0,( 0, C0 ( 0r-
0
4)
.oA5
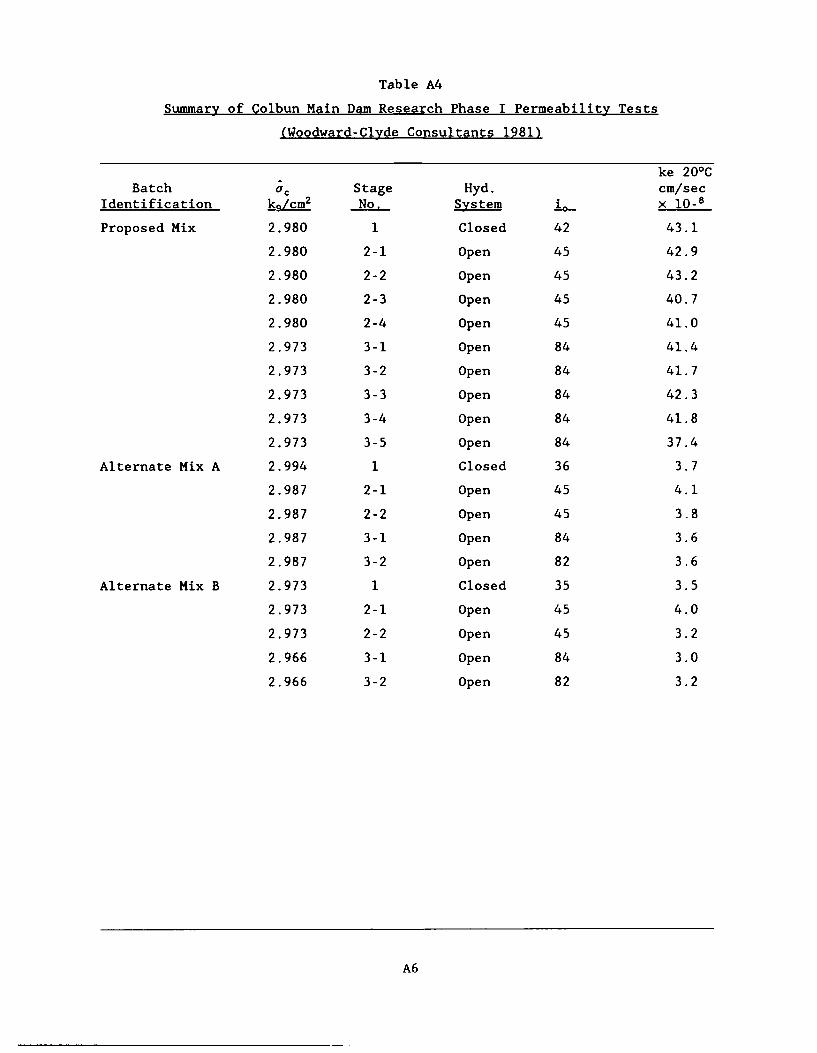
Table A4
Summary of Colbun Main Dam Research Phase I Permeability Tests
(Woodward-Clyde Consultants 1981)
ke 200C
Batch ac Stage Hyd. cm/secIdentification k/cm2 No. System II- x 108
Proposed Mix 2.980 1 Closed 42 43.1
2.980 2-1 Open 45 42.9
2.980 2-2 Open 45 43.2
2.980 2-3 Open 45 40.7
2.980 2-4 Open 45 41.0
2.973 3-1 Open 84 41.4
2.973 3-2 Open 84 41.7
2.973 3-3 Open 84 42.3
2.973 3-4 Open 84 41.8
2.973 3-5 Open 84 37.4
Alternate Mix A 2.994 1 Closed 36 3.7
2.987 2-1 Open 45 4.1
2.987 2-2 Open 45 3.8
2.987 3-1 Open 84 3.6
2.987 3-2 Open 82 3.6
Alternate Mix B 2.973 1 Closed 35 3.5
2.973 2-1 Open 45 4.0
2.973 2-2 Open 45 3.2
2.966 3-1 Open 84 3.0
2.966 3-2 Open 82 3.2
A6

Table A5
Summary of Colbun Main Dam Research Phase II Permeability Tests
(Woodward-Clyde Consultants 1981)
ke 20oCBatch ac Stage Hyd. cm/sec
Identification kg/cm2 No. System i,.- x 10-8
Proposed Mix AD 3.001 1 Closed 20 17.2
3.001 2-1 Open 100 17.8
3.001 2-2 Open 100 17.5
3.001 2-3 Open 100 17.8
2.994 3-1 Open 200 18.2
2.994 3-2 Open 200 18.1
2.994 3-3 Open 200 17.8
2.994 3-4 Open 200 18.2
Mix No. 1 2.994 1 Closed 24 17.4
2.987 2-1 Open 100 17.0
2.987 2-2 Open 100 17.3
2.987 2-3 Open 100 17.3
2.994 3-1 Open 200 17.4
2.994 3-2 Open 200 17.4
2.994 3-3 Open 200 17.2
2.994 3-4 Open 200 17.2
Mix No. 2 3.001 1 Closed 19 9.6
3.001 2-1 Open 100 9.4
3.001 2-2 Open 100 9.7
3.001 2-3 Open 100 9.9
3.001 3-1 Open 200 9.5
3.001 3-2 Open 200 9.8
3.001 3-3 Open 200 9.7
3.001 3-4 Open 200 9.6
A7

Table A6
Summary of Colbun Main Dam Research Phase III Permeability Tests
(Woodward-Clyde Consultants 1981)
ke 200C
Batch ac Stage Hyd. cm/secIdentification k/Lcm 2 No. System Io X 10-8 Remarks
Mix No. 2 2.99 1-1 Closed 20 7.32.99 2-1 Closed 40 7.22.99 3-1 Open 100 7.0 Initial
W/C - 5.56 2.99 3-2 Open 100 6.9 After overnight2.99 3-3 Open 100 7.1 After overnight2.99 4-1 Open 200 7.2 After overnight2.99 5-1 Open 282 7.9 At maximum io2.99 5-2 Open 281 7.5 At maximum i.2.99 5-3 Open 282 7.4 At maximum io
Mix No. 1 3.00 1-1 Closed 20 11.93.00 2-1 Closed 40 11.83.00 3-1 Open 100 12.1 Initial
W/C = 5.97 3.00 3-2 Open 100 11.7 After overnight3.00 4-1 Open 200 12.53.00 5-1 Open 282 13.5 At maximum io
Took specimen down and installed No. 4 screens3.07 1A-1 Closed 20 11.83.00 2A-l Open 100 11.83.00 3A-1 Open 200 12.23.00 4A-1 Open 282 13.6 Initial at maximum
io3.00 4A-2 Open 282 10.0 After 24 hr
Mix No. 3 3.00 1-1 Closed 20 12.92-1 Closed 40 12.93-1 Open 100 15.5 Initial
W/C - 6.4 3-2 Open 100 13.73-3 Open 100 13.5
3-4 Open 100 13.5 After overnight4-1 Open 200 14.15-1 Open 280 9.9 Initial5-2 Open 280 15.1 After overnight5-3 Open 280 16.0
A8

Table A7
Summary of Plastic Concrete Mix Designs and Tests
Mix NoNPDL No. A B C D
3097 3098 3099 3100(Control)
1. Mix CharacteristicsCement + Bentonite 300 + 0 180 + 120 120 + 180 60 + 240
(C + B),* lb/cu ydUnit water, lb/cu yd 354.2 535.1 682.6 1050.0W/(C + B) ratio, by weight 1.18 1.78 2.28 3.50
Sand content, percent 50.0 48.0 48.0 48.0
Slump, in. (measured) 7 1/2 8 8 8 1/4Air, percent (measured) 1.2 0.5 0.5 0.6
2. Stress - Strain TestsCompressive Strength.** psi
3-day 220 60 25 (15)t 5
7-day 370 80 35 (15) 528-day 790 120 70 (25) 1090-day 1,270 230 130 (60) 15
365-day
Tangent Modulus (Initial), Et x 103 psi3-day 251.5 48.8 27.1 (15.1) 1.6
7-day 569.5 51.2 38.5 (10.3) 2.528-day 854.5 126.5 44.6 (25.4) 3.8
90-day 1,235.0 275.6 115.9 (43.4) 5.4365-day
Secant Modulus, E5 x 103 psi (at ultimate load)3-day 124.0 9.8 3.3 (1.9) 0.47-day 226.1 15.4 5.6 (1.6) 0.6
28-day 446.1 34.7 12.4 (3.9) 1.290-day 702.7 84.5 31.6 (10.1) 2.2
365-day
Percent Strain at Ultimate Load3-day 0.18 0.58 0.72 (0.83) 1.48
7-day 0.16 0.47 0.58 (0.86) 0.9028-day 0.18 0.35 0.54 (0.68) 0.83
90-day 0.18 0.27 0.39 (0.59) 0.58
365-day
(Continued)
* Mixes were batched with laboratory processed dry-screened 3/4-in. MSA
aggregates from Corliss Ready-Mix Co. Pit, Enumclaw, Washington, AshGrove Types I and II cement, and National Brand Western Bentonite.
** On nominal 6 by 12-in. cylinders.
f Values in parentheses are results for cylinders moist cured at 50'F.
A9

Table A7 (Concluded)
Mix NoNPDL No. A B C D
3097 3098 3099 3100
(Control)
3. Flexural Tests %%,t
Flexural strength, psi 265 70 25 10
Young's modulus,E x 103 psi 295.7 102.6 41.2 20.7
4. Triaxial Tests, Maximum Deviator Stress, U1 - 3_PSi**, t
Confining pressure, a 3 psi50 -- 233.0 67.7 9.6100 -- 301.5 74.0 20.3200 -- 298.0 69.8 19.8
5. Presure Test **
Consolidation; percent -- 12.5 17.5 20.8in. -- 1.5 2.1 2.5
Weight loss, percent -- 7.9 11.0 16.2
Compressive strength, psi -- 620 300 15
Tangent modulus, Et x 103 psi -- 582.8 161.9 7.6
Secant modulus, E. x 103 psi -- 319.7 125.2 1.8
Percent strain at ultimate load -- 0.20 0.24 0.74
6. Erodibility, percent loss by weight**,t
Time, min24 -- 0.2 0.0 2.6
48 .-- -- 3.8
t On nominal 3 by 3-in. beams, third point loading with 9-in. span.At age 28 days.
A1O

APPENDIX B: CHEMICAL ANALYSIS OF CEMENT AND BENTONITE FINE AND
COARSE AGGREGATE GRAIN SIZE DISTRIBUTION
AND BATCH DESIGN EXAMPLE

Table BI
ComRarison of Grain Size Distribution of Tufts University
Aggregate to Grain Size Distribution of MUD Mountain
Dam Research Aggregate (NPSEN)
Percent Coarser By WeightSieve Mud Mountain Tufts Phase I Tufts Phase IISize Sand Gravel Sand Gravel Sand Gravel
3/4 in. -- 4 -- 6 8 7
1/2 in. -- 34 -- 34 14 29
3/8 in. -- 60 -- 60 -- 68
4 5 97 3 93 3 94
8 16 99 11 98 14 97
16 28 100 26 100 37 100
30 52 -- 56 -- 65 --
50 79 -- 86 -- 85 --
100 91 -- 96 -- 95 --
PAN 100 -- 100 -- 100 --
B3
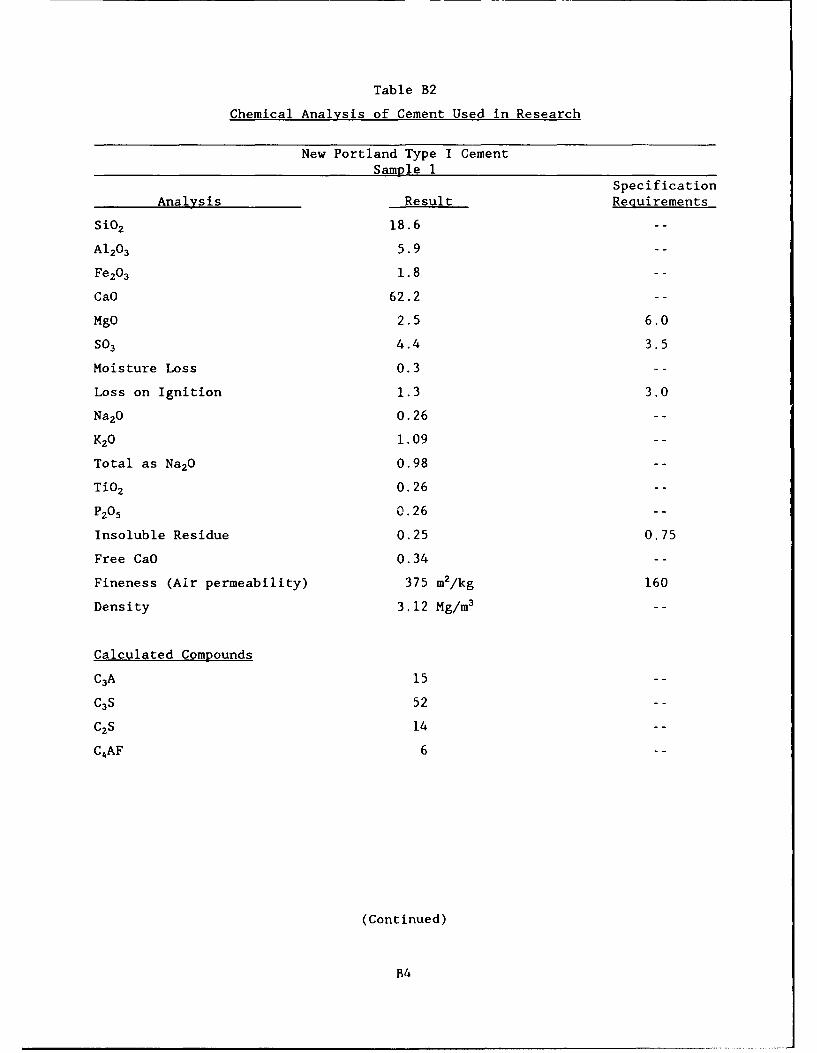
Table B2
Chemical Analysis of Cement Used in Research
New Portland Type I CementSample I
SpecificationAnalysis Result Requirements
Si0 2 18.6
A120 3 5.9
Fe203 1.8
CaO 62.2 --
MgO 2.5 6.0
SO3 4.4 3.5
Moisture Loss 0.3 --
Loss on Ignition 1.3 3.0
Na20 0.26 --
K20 1.09
Total as Na20 0.98
TiO2 0.26
P205 0.26 --
Insoluble Residue 0.25 0.75
Free CaO 0.34 --
Fineness (Air permeability) 375 m2/kg 160
Density 3.12 Mg/m3 --
Calculated Compounds
C3A 15
C3S 52
C2S 14
C4AF 6
(Continued)
B4

Table B2 (Concluded)
New Portland Type I CementSample 2
SpecificationAnalys is Result Reguirements
Si02 18.9
A1203 6.1
Fe203 1.9
CaO 63.2 -
MgO 2.6 6.0
SO3 3.8 3.5
Moisture Loss 0.7 -
Loss on Ignition 2.1 3.0
Na20 0.30 -
1K20 1.19
Total as Na2O 1.08
T'02 0.28
P205 0.25 -
Insoluble Residue 0.27 0.75
Free CaO 0.31 -
Fineness (Air permeability) 399 m2 /kg 160
Density 3.08 Mg/n 3 --
Calculated Compounds
C3A 15
C3S 55
C2S 13
C4AF 6
B5

Table B3
Chemical Analysis of Bentonite Used in Research
90 Barrel Bentonite
Sample 4Analys is Result
Si02 55.8
A120 3 16.2
Fe203 3.5
CaO 2.9
MgO 3.0
S03 0.1
Moisture Loss 9.8
Loss on Ignition 3.2
Na20 2.02
K20 0.61
Sulfide Sulfur as SO3 0.5
Free CaO 0.00
X-ray Diffraction Analysis:Present as clays: smectite, kaolinite, and clay-mica (illite, muscovite,
biotite)
Nonclays: quartz, calcite, and plagioclase-feldspar
B6

Table B4
Batch Design Example
Batches were proportioned according to the following procedure:
a. Cement factor, percent bentonite, and water cement ratio were chosen.
b. Dry weights of cement, bentonite, and sand and gravel were calculatedusing the absolute volume method for 1 cu yd of concrete.
C. Dry weights were corrected for hygroscopic moisture content using watercontent data from previous batches.
d. Corrected material weights were scaled for desired batch size.
e. After batches were made, material weights were corrected for any differ-ence in water added and for actual hygroscopic moisture of constituents.
f. Actual cement factor, bentonite content, and water-cement ratio were back
figured from final corrected weights.
The following is an illustrative example:
a. Selected and assumed batch parameters:
Cement factor: 300 lb/cu yd
Percent bentonite: 20 %
Water-cement ratio: 1.9 (from previous experience)
Batch yield: 1.4 cu ft
b. Gravity of solids values:
G. cement - 3.5
G. bentonite = 2.75
G. sand & gravel - 3.65
Unit weight water - 62.4
c. Water contents, from previous batches:
Cement - 0.05 %
Bentonite - 10.0%
Sand - 3.0 %
Gravel - 1.5 %
d. Dry unit weights are calculated:
(1) Weight of cement, bentonite, and water are calculated from defini-tions of batch parameters:
(Continued)
(Sheet 1 of 6)
B7

Table B4 (Continued)
Cement factor - (cement+bentonite) per cubic yard of concrete
Cement factor - 300 of which 20 percent is bentonite
therefore: cement - 240 lb
bentonite - 60 lb
Water-cement ratio - weight of water - 1.9
weight of cement+bentonite
therefore: weight of water = 1.9 (300)
= 570 lb
(2) The volumes of cement, bentonite, and water are calculated using thefollowing equation:
V. W (Bl)
where
W, - dry weight of material
G. - gravity of solids of material
1. - unit weight of water
therefore
Volume cement - 240 1.22 cu ft3.15 (62.4)
60Volume bentonite = = 0.35 cu ft2.75 (62.4)
570Volume water - 62. - 9.14 cu ft62.4
Total = 10.71 cu ft
(3) The remaining volume of the cubic yard is made up to equal volumes ofsand and gravel:
I cu yd - 27 cu ft
27 - 10.71 - 16.29 cu ft
16.29 _ 8.15 cu ft2
(Continued)
(Sheet 2 of 6)
B8

Table B4 (Continued)
(4) The dry weight of sand and gravel is then calculated using equationBI to solve for W.:
Ws - N 5 7w
therefore
Weight sand - (8.15)(2.65)(62.4) - 1,348 lb
Weight gravel - (8.15)2.65)(62.4) - 1,348 lb
Summary of dry weights (W5}:
Cement - 240
Bentonite - 60
Sand - 1,348
Gravel - 1,348
Water - 570
e. The dry weights are then corrected for hygroscopic moisture content:
Total weight - dry weight + weight of water
or
(B2)WT = +w
by definition
Water content, W -W
Ws
therefore
w.= w7W. (B3)
Substituting equation B3 into equation B2
(Continued)
(Sheet 3 of 6)
B9
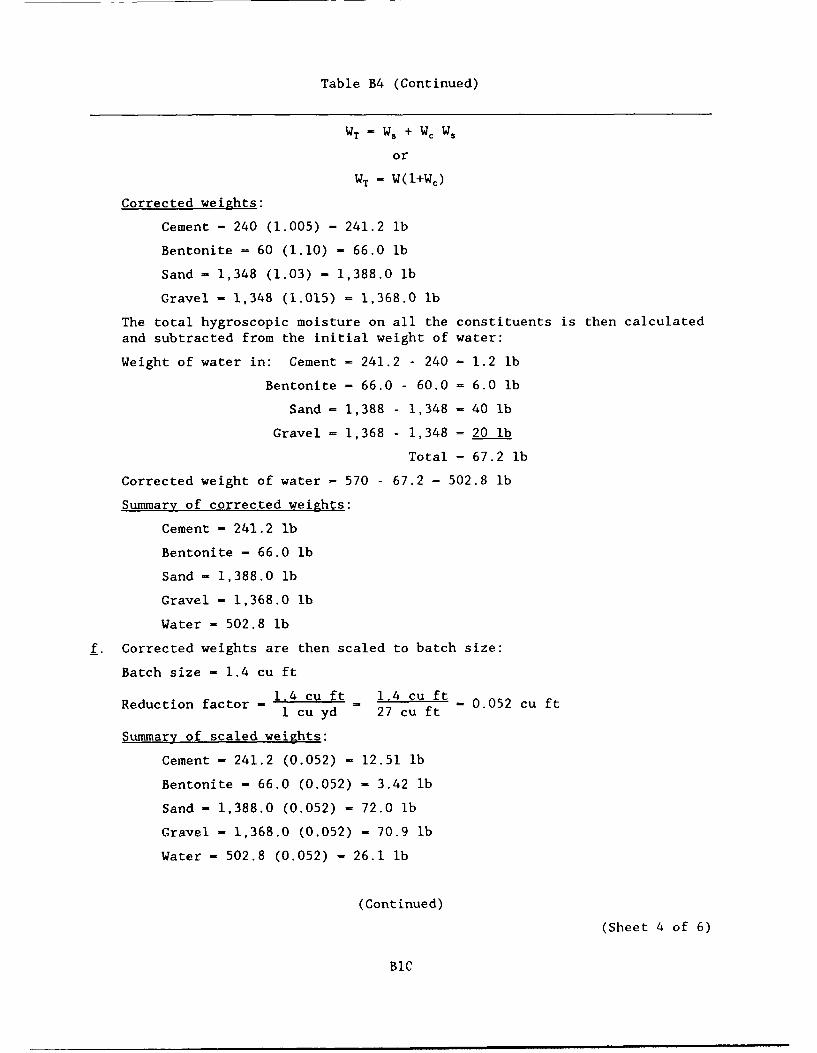
Table B4 (Continued)
WT - Wa + Wc Ws
or
WT = W(1+W,)
Corrected weights:
Cement - 240 (1.005) - 241.2 lb
Bentonite = 60 (1.10) - 66.0 lb
Sand - 1,348 (1.03) - 1,388.0 lb
Gravel - 1,348 (1.015) = 1,368.0 lb
The total hygroscopic moisture on all the constituents is then calculated
and subtracted from the initial weight of water:
Weight of water in: Cement - 241.2 - 240 = 1.2 lb
Bentonite = 66.0 - 60.0 = 6.0 lb
Sand = 1,388 - 1,348 - 40 lb
Gravel - 1,368 - 1,348 = 20 lb
Total = 67.2 lb
Corrected weight of water - 570 - 67.2 - 502.8 lb
Summary of corrected weights:
Cement - 241.2 lb
Bentonite - 66.0 lb
Sand - 1,388.0 lb
Gravel - 1,368.0 lb
Water - 502.8 lb
f. Corrected weights are then scaled to batch size:
Batch size - 1.4 cu ft
1.4 cu ft 1.4 cu ftReduction factor - 1 cu ft- 1. cu ft 0.052 cu ft1 cu yd =27 cu ft
Summary of scaled weights:
Cement - 241.2 (0.052) - 12.51 lb
Bentonite - 66.0 (0.052) - 3.42 lb
Sand - 1,388.0 (0.052) - 72.0 lb
Gravel - 1,368.0 (0.052) - 70.9 lb
Water - 502.8 (0.052) - 26.1 lb
(Continued)
(Sheet 4 of 6)
BlC

Table B4 (Continued)
These are the weights of materials that were actually added to the mixer.
g. After batch was made weights were corrected for any differernce in wateradded and for actual hygroscopic moisture content:
Suppose an additional 0.9 lb of water were needed to achievean 8-in. slump and that the following actual hygroscopicmoisture contents were calculated for the materials:
Actual Water Content, Wc
Cement - 0.3 %
Bentonite - 10.3 %
Sand - 1.9 %
Gravel - 0.8 %
Summary of Actual Weights Added
Total Weight of Weight of
Components Weight Solids, Ws Water, WwCement 12.51 12.46 0.05
Bentonite 3.42 3.05 0.37
Sand 72.0 70.63 1.37
Gravel 70.9 70.33 0.57
Water 27.0 -- 27.0
29.36 lb
h. The values of the dry weights are then calculated and actual cementfactor, bentonite content, and water-cement ratio back calculated.
Volumes were again calculated using equation Bl.
Weight VolumeComponents lb cu ft
Cement 12.46 0.063
Bentonite 3.05 0.018
Sand 70.63 0.427
Gravel 70.33 0.425
Water 29.36 0.471
Total 185.83 1.403
(Continued)
(Sheet 5 of 6)
BI1

Table B4 (Concluded)
185.83 lbTheoretical unit weight - 1.403 lft - 132.5 lb/cu ft
Cement factor - (12.46 + 3.05) (1.403 - 298 lb/cu yd
Bentonite content - 3.05 - 0.197 - 20 %(12.46 + 3.05)
Water-cement ratio - 29.36 - 1.893 - 1.89(12.46 + 3.05)
(Sheet 6 of 6)
BI2

LMO&M AS 8MM3O AD~ VWw
:Izz
oo
CD
a. 0U)i
o - 0
a)
200
of
m ow la
IB13
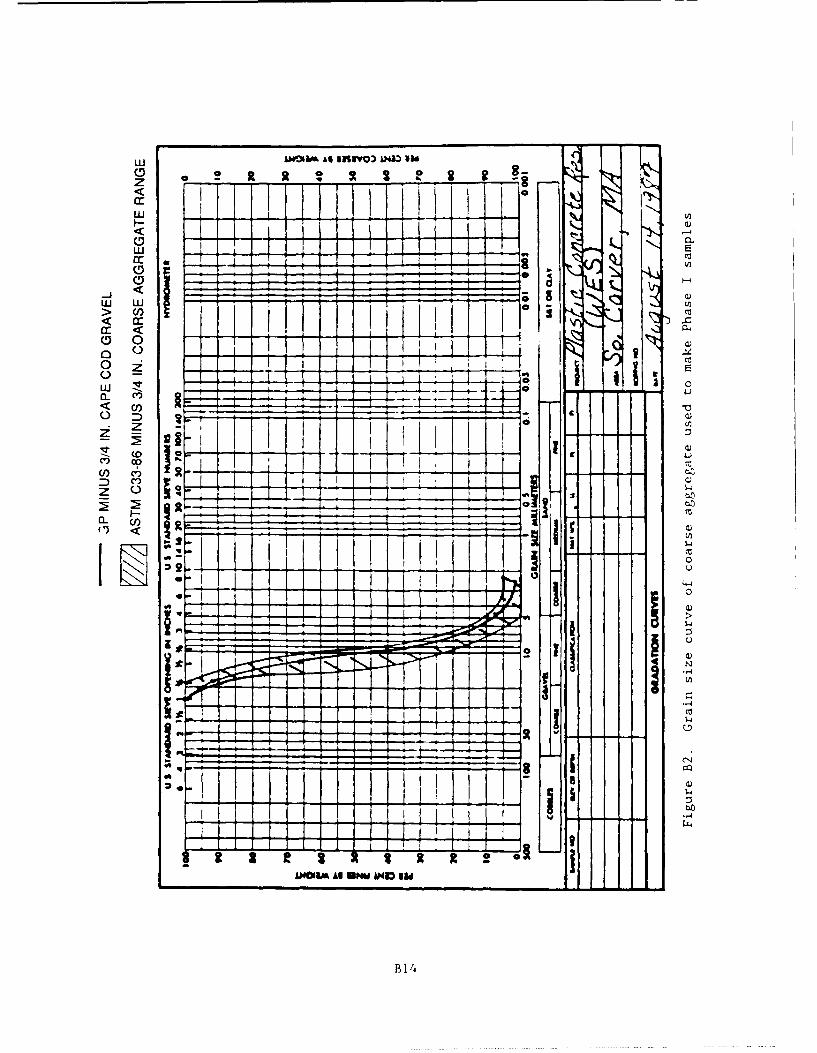
ZU -#IL AS- &DH
w _U L 2- -n-
> -a
0 00
co co L
D CO -
o :6OCD UO - -- - - -
< ~ I
I 0
-4- 1 0
*
s 3tLHW Al NaHDV
K: zRJ~B14

wL A"EuM All VISIV02 LHO aIM
0 0 0 -0
z X,
CL
'
z Ln
of ~C*)00Z-
<-cn,
0
ca
-4
&~IMO As amU AND lio - i
B15

WU AWgV4% At 1US#VOD 1041: li
0
< I w-t4CD -a
DD
> C)--i
~C/
00
-4~ 0
.00
"-4
B161

APPENDIX C: CALIBRATIONS OF RIEHLE TESTING MACHINE
AND 1,000 LB BEAM BALANCE SCALE
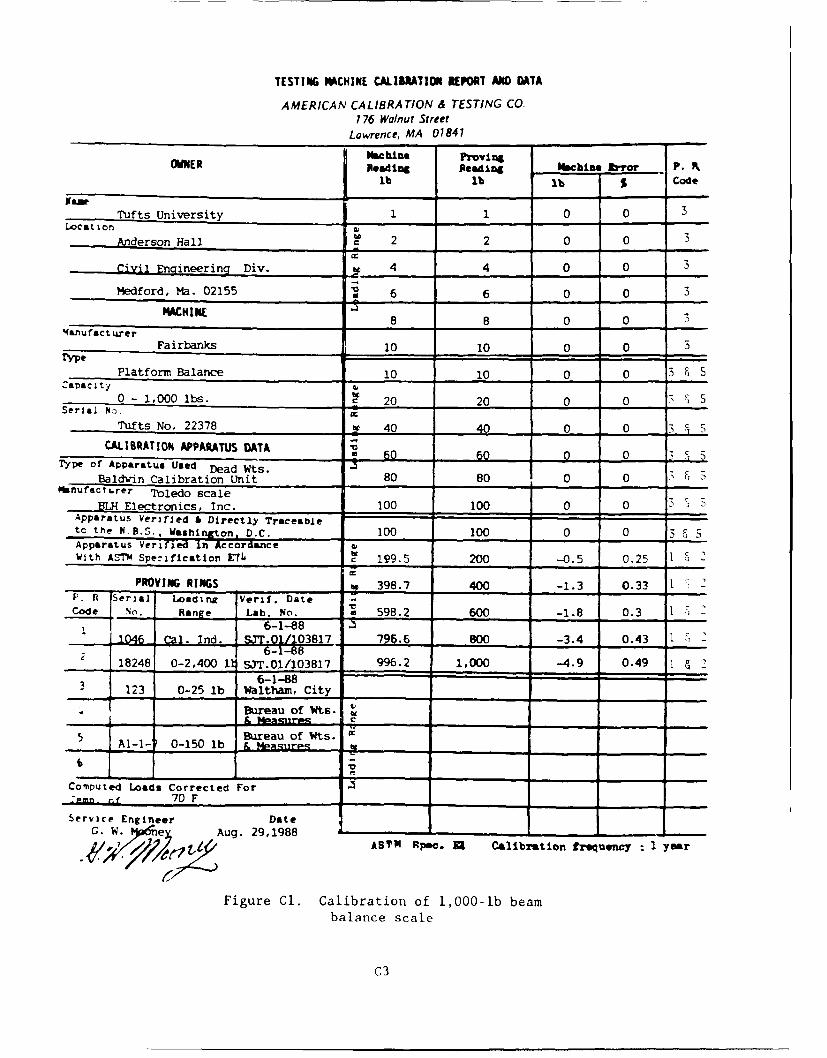
TESTING MACHINE CALIBRATION REPORT AND DATA
AMERICAN CALIBRATION & TESTING CO.176 Wolnut Street
Lawrence, MA 01841
Machine Povi jOMER Reading Readlng Mbchine trro- P. 1k,
lb lb l b Code
xam-Tufts University 1 1 0 0 3
Location
Anderson Hall C 2 2 0 0 3
Civil Engineering Div. w 4 4 0 0 3
Medford, Ma. 02155 6 6 0 0 3
MACHINE_ _ _ _ _ _ _ _ _ _8 8 0 034nufacturer
0 0
Fairbanks I0 10 0 0 3
Platform Balance 10 10 0 0 3 F 5Zapaclty _____
0 - 1,000 lbs. 20 20 0 0Serial No. 2 "
Tufts No. 22378 C 40 40 0 0
CALIBRATION APPARATUS DATA 00Tpe of Apparatus Used Dead Wts. 6
Baldwin Calibration Unit 80 80 0 0 7 SOMnufs'ct wrer Toledo scale
BLH Electronics, Inc. 100 100 0 0Apparatus VerifJed & Directly Traceableto the N.B.S., Washi on D.C. 100 100 0 0Apparatus Verifi in AcorL anceVlt ASW Se:Zialn Eh z -Wth AST Spezxticatlon FTL C 199.5 200 -0.5 0.25 1 .
PROVING RINGS to 398.7 400 -1.3 0.33 1 2P fl Serial Loading Verif. DateCode Nn. Range Lab. No. a 598.2 600 -1.8 0.3 1
1 6-1-881046 Cal. Ind. SJT.01/03817 796.6 800 -3.4 0.43 1 2
18248 0-2,400 i SJT.01/103817 996.2 1,000 -4.9 0.49 1 26-1-8 8
3 123 0-25 lb Waltham, City
Bureau of Wts.
Bureau of Wts. iiA1l-- 0-150 lb & m___q_ _ _
ComPuted Loads Corrected For:Pmn_ .f 70 F
Service Engineer DateG. W. 196e Aug. 29,1988--
ASTR Rpec. El Calibration frequency I year
Figure Cl. Calibration of 1,000-lb beambalance scale
C3

CrrtifiraIr of Urrifirntion
178 Walnut Street Lawrence, Mt, C1E41
lTbis iz to Ctrtifp Cbat the follou'ing deicribed
testing machine has been calibrated b) us and the loading
range ihoun be/cu-jound to be writkin a tolerance of.c
Mathiut Riehle, Universal Testing Machine, sin 77779(Ji6ki. rPV ad t Ii 6, nwmb,,)
Tufts University, Anderson Hall
Civil Engineering Division, Medford, MA 02155
Date of V'mfictdion May 21, 1987
Mchkle R zi Laid,. , hine ReniR, a4WdII 101
r)- ,0 30D - 3,02D lb 0 - 3CO,0D ib 30,C0 - ".:.-,
0 11 ,500 1 5,0,30 1b l
0 - 30,03 1b -,OOO - 30,0C3 ILb
0 - 60,OD: ib 6,000 - 60,0w lb _,,
0 - i_ ,07 1b _,030 - 150,009 l _
Method of verification and pertinent data is in accordance,.ith A.S.T.M. Spec. E4-79. The testing device(s) used fc,-this calibration have been certified by National StendarcsTesting Laboratory and are traceatle to the thaticnal Eurea-.of Standards, A.S.T.M. Spec. E74 Lat. No. C,- -- r--
7rans. Letter = 27-E:Serial No.(a) of teoltng device(s) used for calibraUon:
C21. Ind. 10 1 ?24 I : I 437965-27-86 5-2,-866 52-6 52-3,
Date (s) of certification
.Amrun U1ibruliun & ,rjtr. ..
C. V. PMCecry
Figure C2. Calibration of Riehle testing
machine, 1987 (Sheet I of 3)
C4

Americar Calibration & Testirn; Co.178 Walnut St.
Lawrence, MA 018JI
Mae hi no Provi riOWNER Reading Reading Nktbhie b ror P. KwI lb lb 2 Czde
UTfts University 299.0 3f'3 -! .0 C. 3 1 &2
Anderson hall u .7 ';0 1 & 2
Civil Enoineering Div. 1,201.6 1,200 .6 0." 1 & 2M4dford, Ma. 02155 ,C.I 1 & 2
11]P02.6 3,800 2.F l( 1 2
MInufacturr 2,404.1 2.400 4.' C.-7 I & 2
Tw Riehle :989.0 3.000 -. 1.0 0..37 1 & 3
Universal Testing Machine 1,490.0 1 ,500 -:0.' C..E7 1 & ICapaci t y •0 - 300,000 ibs. (6 ranges) €' 2,9E7 2,000 - 0.43 1 s 3
Serial N . .R-77779 C,3 6.00: -. 61 1 & 3
CALIBRATION APPARATUS DATA c 9,00 - _-&.p 6-_ 9.74 9M & 3Type of Apparatus Used
Baldwin Calibration Unit 1 2 ,90 6 12,003 -9 0.7g 1 & 3&.utact urer
EM Electronics, Inc.Apparatus Verified & Directly Traceable
1.9
to th~e ita-.' WastlgoD 2,9F7 3.031OX__ ____
Apparatus verifleditn 2Accordgce C. & 3With ASTM Specification E71 ' 5,9 6,0102 0.52 &
PROVING RINGS 1 I,944 12,000 -56 C.47 1 & 3P. n Serial LoadIne Verif. DateCode % Range Lab. No. -1.901 100 -9 C.5 I & 31 5-21-86 ."1046 Cal. Ind. SJ7.01 /103221 23.853 24,003 -147 .I I & 3
5-27-8'18248 0-2,400 lb SJ.01 /10322! 29,979 30.000 -21 0.0 i & 45-27-8b10234 0-24,000 1 SJT.01 /103221 5.994 6.000 -E 0. 1 & 3
40796 0-240,000 1 SJI.01 /10322. V 9,979 10.01,Y -21 C.21 1 & 3
__L__ " 9,907 20,00. -93 C.47 1 & 36 "-- 2-.966 30.000 -?4 C.:1 I & 5omputed LoakdX Corrected For
le.n .- f 70 F J ".. 54 40,003 -46 '.0I1 1 & 5Service Engineer Date 49.942 50,0:%- -5B 0.11 1 & 5.. 992 W.,MCI _ -8 0.03 I & 5
Mi1y 2;, 1997 '___________ ____
AS?" Spec. EA Cal1bratio- r:w -" I e
Figure C2. (Sheet 2 of 3)
(5

American Calibration & Testing Co.178 Walnut St.
Law.rence, MA 0181
OWK Reingeeading rc Irror P. Rlb lb 2b Code
Raw
Tufts University 1I,0C5 i',Oo- S 03 1 & 3Locat ion
Anderson hall 30,016 3o,000 !6 0.05 1 & 4
Civil Engineering Div. t 6C,052 60,000 V2 0. 0: TI & 4
Medford. Ma. 02155 7.S 90,07 ' O ' C.0.) I & 4
44Miufacturer 1ihe120,058 120,000 PI8C '*-7= ~~_ _ _ __Riehle 150,087 150,030 606 1 & 4
Universal Testing Machine 30,0:6 30,000 It, 0.S5 1 & 4saoa¢e-.L '
0 - 300,000 lb (6 ranges) = 4C,029 40,000 29 0.7 I & 4Serial n.
R-77779 8 80,]95 80,000 29? 0. I 1 & 4CALIBRATION APPARATUS DATA , 120,000 3 E 0.-5 T & 4
TYpe of Apparatus Uae
Baldwin Calibration Unit 160,333 160,000 333 0.2] 1 & 4Hanufacy 6rer .
BL Electronics, Inc. 2('0,554 200,000 Ezz C'.-- 1 & 4Apparatus Verified & Directly Traceableto the N.B.S., Washl on D.C.Apparatus Vetilied inAccord.aceWith ASTM Specification ErI2
PROVING RINGSP. R Serial Loadine Verif. Date -
Code Nn. Ran e Lab. No. _-
5-27-861046 Cal. Ind. SJ1.0] /103221
5-2;-852 18248 0-2,400 lb Si.-2 1-0822
5-21-8b10234 0-24,000 1 SJiT.01 /103221
5-21-Sb140796 0-240S000 1 SJT.O1 /103221
5
I - _ _ _ __ _ ---
omputed Loads Corrected Forrean- rJ 7n r
Service Engineer Date
May 2], 1957 A SW Spec. Al Caltrat o - fre:ue-cy : f;T
Figure C2. (Sheet 3 of 3)
C6
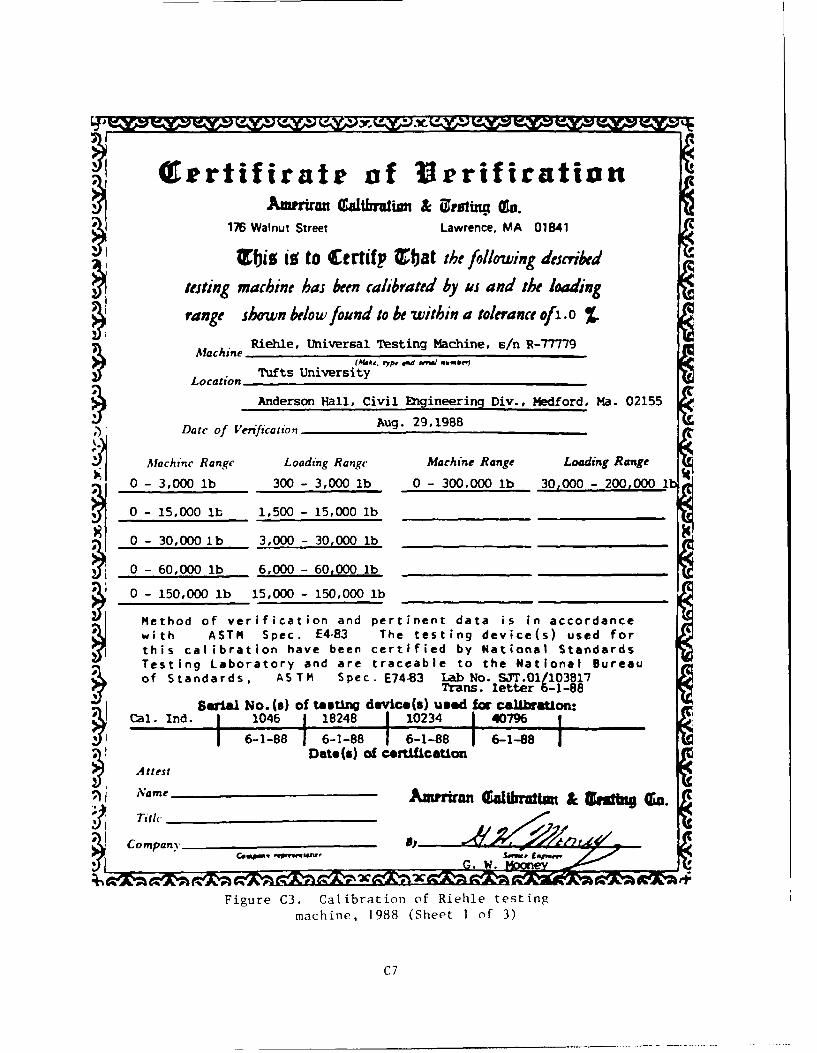
QCrtifirate of UrhrifirationAwma UaIhrujm & Ugrsiinz (Co.
176 Walnut Street Lawrence, MA 01841
Xbiz io to Ctrfifp Tbat the following describedesig machine has been calibrated by us and the, leading
range shown belo w found to be within a tolerance ofi .0 7
achzine Riehie, Universal Testing Machine, s/n R-77779
Location Tufts University ""dw
Anderson Hall, Civil Engineering Div., Medford, Ma. 02155
Date of Verification Aug. 29,1988
Machine Range Loading Range Machine Range Loading Range
S0 - 3,000 lb 300 - 3,000 lb 0 - 300,000 lb 30,000 - 200,000 1,
0 - 15,000 lb 1,500 -15,000 lb _________________
0 0-30,000 lb 3,000 -30,000 lb ______
0 - 60,000 lb 6,000 - 60,000 lb _________________
S0 - 150,000 lb 15,000 - 150,000 lb _________________
S Method of verification and pertinent data is in accordancewith ASTM Spec. E4-83 The testing device(s) used forthis calibration have been certified by National Standards
S Testing Laboratory and are traceable to the National Bureauof Standards, A S TM S pe c. E74-83 Lab No. S3'r.0110i3817
Serial No. (9) of testin d es(s) used for ca~iwation:'0 Cal. Ind. j 1046 j18248 110234 40796
Date($) of certificatio
Name A iran "iatua & utqn Qi.
Compan-s_
Figure C3. Calibration of Riehie testing
machine, 1988 (Sheet 1 of 3)
C7

TESTING MACHINE CALIBRATION REPORT AND DATA
AMERICAN CALIBRATION & TESTING CO.176 Walnut Street
Lawrence, MA 01841
Nochne Proving
OWNER Reading Reading Machine Zrror P. A,lb lb lb % Code
Tufts University 298.3 300 -1.7 0.57 1 & 2
Locat ionAnderson hall 596.7 600 -3.3 0.55 1 & 2
Civil Engineering Div. 1,196.4 1,200 -3.6 0.3 1 & 2
W4dford, Ma. 02155 a 1,793.8 1,800 -6.2 0.34 1 & 2
MACHINE 2,389.1 2,400 -10.9 0.45 1 & 2
Manufact urer
Riehle 2,985.0 3,000 -15 0.5 1 & 3Type_
Universal Testing Machine 1,490 1,500 -10 0.67 1 & 2Capacity 0.
0 - 300,000 lb (6 ranges) £ 2.982 3,000 -18 0.6 1 & 3Serial No).
R-77779 5,974 6,000 -26 0.43 1 & 3
CALIBRATION APPARATUS DATA 8,960 9,000 -40 0.44 l&3
Type of Apparatus UsedBaldwin Calibration Unit 11,942 12,000 -58 0.48 1 &
irnufactu rerB1L Electronics, Inc. 14,920 15,000 -80 0.53 1 &
Apparatus Verified & Directly Traceobleto the N.4.S., Washington, D.C. 2,995 3,000 -5 0.17 i & 3Apparatus Verrfie in Accordance
With ASr Specification El4 c 5,986 6,000 -14 0.23 I & 3
PROVING RINGS _ 11,966 12,000 -34 0.28 1 & 3P. RI Serial Loading Verif. Date -
Code %c. Range Lab. No. 0 17,953 18,000 -47 0.26 1 & 36-1-88
1 046 Cal. Ind. SJT.01/103817 23,931 24,000 -69 0.29 1 & 3
6-1-8818248 0-2,400 lb SJT.01/103817 29,973 30,000 -27 0.09 1 & .
6-1-883 10234 0-24,000 11SJT.01/103817 5F986 6,000 -14 0.23 1 & 3
6-1-88140796 0-240,000 1ISJT.01/103817 u 9,967 10,000 -33 0.33 1 S 3
_._ . 19,956 20,000 -44 0.22 1
6 -A V 963 30,000 -37 0.12 1 &Computed Loads Corrected For
o. f 70° 39,956 40,000 -44 0.11 1 5
Service Engineer Date L 59,948 50,000 -55 0.11 1 &
G. . oCTtv ug 2,188 ASIM Spot. El Calibration frequency 1yearAug. 29,1988 59,948 60,000 -52 0.11 1 &.-
Figure C3. (Sheet 2 of 3)
C8

TESTING MACHINE CALIBRATION REPORT AND DATA
AMERICAN CALIBRATION A TESTING CO.176 Walnut Street
Lawrence, MA 01841
mahne ProvingOWNER Reading Readlng mhine 2 P. P
lb lb 2b Code
NameTufts Unviersity 15,005 15,000 5 0.03 1 & 3
LocationAnderson Hall € 30,027 30,000 27 0.09 1 & 4
Civil Engineering Div. b 60,062 60,000 62 0.1 1 & 4Medford, Ma. 02155 __90,090 90,000 90 0.1 1 & 4
MACHINE 120,114 120,000 114 0.1 1 & 4
4anu fact urer
iehle 150,190 150,000 190 0.13 1 & 4Tye
Universal Testing Machine 30,027 30,000 27 0.09 1 & 4.apac ty
0-300,000 lb (6 ranges) 40,031 40,000 31 0.08 1 &Serial t4:.
R-77779 79,985 80,000 -15 0.02 I &
CALIBRATION APPARATUS DATA 119,864 120,000 -136 0.11 1 & 4
rype of Apparatus UsedBaldwin Calibration Unit 159,673 160,000 -327 0.2 1 &
knufact u rerBLH Electronics, inc. 199,721 200,000 -279 0.14 1 &4
Apparatus Verified & Directly Tracea-bletc the N.B.2., W s 1n on I .C.Apparatus Veiedh ci AT Fr neWith AS V Specification ET7L
PROVING RINGSP. R!erial Loading Vert. DateCode No. Range Lab. Nc,
6-1-881046 Cal. Ind. SJT.01/103817
6-1-8818248 0-2,400 lb SJT.01/103817
6-1-883 10234 0-24,000 11 SJT.01/103817
6-1-88140796 0-240,000 SJT.01/103817 __
5
6
-puted Loads Corrected For.emn 'n. 70 F
Service Engineer Date
G. W. momy Aug. 29,1988ASY'M SPee. Ul Calibration frequency =1 year
Figure C3. (Sheet 3 of 3)
C9

APPENDIX D: SUMMARY TABLES OF UNCONFINED COMPRESSION TESTS (PHASES IAND II), BRAZILIAN TENSILE TESTS (PHASES I AND II), AND
FLEXURAL BEAM TESTS

Table D1
Summary of Phase I Unconfined Compression Test Program
XIPL1AiIO1 Of ?ALI BIADIIGS
CF cement factor, pounds of cement+bentonite per cubic yard of concreteben percent of cement factor, by weight, which is bentoniteV/c ratio of water to cement+bentonite, by weightSL slup, inchesG wet unit weight, pounds per cubic foot (theoretical)%air air content of wet concrete, tage curing age in daysstorage storage location (vet room or cure box)strain type of strain measuring system (gross deflection, compressometer, neoprene end caps)water post-test oven dry water content, %qu ultimate unconfined compressive strength, psi (samples tested with neoprene end caps not corrected)I Young's modulus, kips (1000 pounds) per square inchen strain at go, inch per inchAVG average qu of test groups of more than one cylinder of same age and bitch designSTD standard deviation of test groups of more than one cylinder of same age and batch designITs SYD/AVG, %
Batch ID CF ben v/c SL G %air cylinder ID age storage strain water qu I eu AVG STO %SID
060387-1 266 0 1.43 7.25 142 0.5 060317-1-DS 5 cure bot gross - 603 206 0.0035 603060317-I-A 7 cure box gross - 674 129 0.0025 674060317-1-8 62 cure box gross - 774 432 0.0022 774060387-1-C 131 wet room gross 9.4 797 492 0.0025 797
Batch ID CY ben V/c SL G %air cylinder ID age storage strain water qu I en
060387-2 311 0 1.31 8.75 Il 0 060307-2-J 5 wet room gross - T60 382 0.0035 656 75 11%060387-2-L 5 wet room gross - 585 320 0.002906037-1-! 5 wet room gross - 623 251 0.0033060387-2-G 7 wet room gross - 691 603 0.0020 697 69 10%060317-2-N 7 wet root gross - 785 406 0.0029060317-2-D 7 cure box gross 616 60 0.0034060381-2-F 62 wet room gross 8.9 919 538 0.0023 891 28 3%060387-2-B 62 cure box gross 864 469 0.0028
Bitch ID CF hen V/c SL G %air cylinder ID age storage strain water qg I en
061687-1 413 0 0.91 7.75 142 1.8 061687-1-1 3 cure box gross 8.3 1379 586 0.0035 137901687-1-1 7 wet room gross 8.8 1716 954 0.0024 1722 133 8106107-1-L 7 wet room gross - 1536 1097 0.0020
(Continued)(Sheet I of 7)
D3

Table Dl (Continued)
061687-1-A 7 cure box gross 1842 966 00031061687-1-1 28 vet room neop 8 2169 2215 34 21061687-1-G 28 vet room neop 9.8 2225061687-1-J 28 vet room neop 22480610l7-1-1 52 wet room gross - 2105 1034 0.0027 2291 132 6%061687-1-1 52 wet room gross - 2385 984 0.0029061687-1-0 52 vet room gross - 2383 1114 0.0029061687-1 627 let room comp 8.3 2342 3120 0.0018 2371 67 3A061681-1-C 660 met room comp 0 2307 2914 0,0018061687-1-? 660 wet room comp 0 2464 3051 0.0017
Batch 10 C1 bee v/c SL G %air Cylinder 10 age storage strain water qn I en
071387-1 242 0 1.61 7.5 140 1.8 071387-1-A 3 core box neop - 328 312 11 4071387-1-0 3 wet room neop 9.2 309071387-1-P 3 wet room neop - 301071387-1-G 7 wet room gross 9.1 558 627 0,0018 555 3 01071387-1-1 7 wet room orols - 553 528 0.0021071387-1-i 30 wet room ,.uss - 783 533 0.0023 753 21 3%071387-1-1 20 wet r,4m gross 7.4 738 405 0.0024071387-1-8 30 core box gross - 737 459 0.0021071387-1-C 91 wet room gross 9.9 661 566 0.0023 661071387-1-H 633 wet room comp 0 780 1319 0.0016 767 13 21071387-1-1 600 wet room comp 8.6 754 1853 0.0010
Batch I C! ben v/c SL G lair cylinder ID age storage strain water qg I eu102387-1 269 0 1.6 8.75 140 102387-1-A 7 wet room comp 9.6 731 1207 0.0024 717 66 9%
102387-1-C 7 vet room comp 631 396 0.0033102387-1-B 7 wet room gross 9.7 790 707 0.0031102387-1-I 28 yet room cop 8.4 918 1428 0.0024 1003 61 6%102387-1-1 28 wet room gross - 1032 622 0.0031,02387-1-G 28 wet room gross - 1058 573 0.0029102387-1-J 55 wet room gross 10.2 763 440 0.0017 905 113 131102387-1- 55 wet room gross - 911 662 0.2024102387-1-N 55 wet room gross - 1040 578 0.0028102387-1-1 91 vet room cop - 891 848 0.003( 905 30 :0%102387-1-1 91 wet room gross - 1022 618 0.0028102387-1-L 91 yet room gross - 802 473 0.0030102387-1-F 498 wet room cop 8.1 943 063 0.0020 065 54 6%102387-1-1 540 wet room comp 0 796 2350 0,0019102317-I-Q 540 wet room comp 0 841 2313 0.0017102387-1-I 540 wet room comp 0 862 2131 0.0019
Batch ID Cl bee w/c SL G %air cylinder ID age storage srain water qo I eu
111387-1 321 0 1.26 7.75 142 - 111387-1-8 4 wet room gross 10.8 931 29A 0.0042 948 :6 A1111317-1-C 4 wet room gross 943 534 0.0028111387-1-A 4 wet room cOmP - 970 1031 0,0021111317-1-J 7 wet room gross 15.2 106S 618 0.0029 1094 47 4%11137-1-I ,wet room gross - 1160 676 0.029111317-1-L 7 wet room coop - 1057 1414 0.0020111387-1-P 2A wet room gross - 1329 506 0.1333 425 .7 st111317-1-1 28 wet room gross - 1540 917 0.0029111387-1-0 28 vet room comp - 1405 2171 0.0017111387-1-1 91 wet room comp 8.9 1492 2683 0.0011 1439 28 3A
(Continued)
(Sheet 2 of 7)
D4
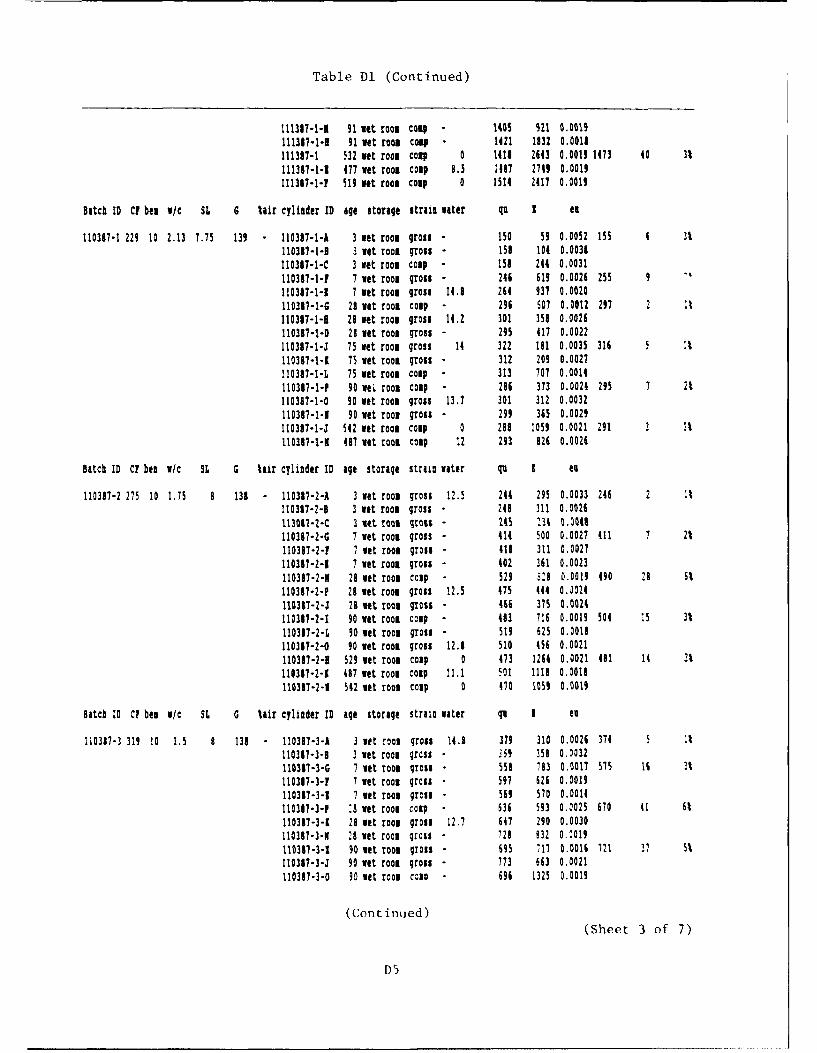
Table D1 (Continued)
111317-1-4 91 wet room cou 140S 921 0.0015111317-1-1 91 wet room coamp 1421 1832 0.0018111387-1 532 wet room coup 0 1413 2643 0.0015 1473 40 3%111387-1-1 477 wet room coamp 8.5 1187 2749 0.0019111387-1-1 519 wet room comp 0 1514 2417 0.0015
Batch ID CY bee vie SL G tair cylinder ID age storage strain water qi I es
110387-1 229 10 2.13 7.75 139 - 110387-1-A 3 wet room gross - 150 59 0.0052 155 3%110317-1-3 3 wet room gross - 158 104 0.0031110387-1-C 3 wet room camp - 158 244 0.0031110317-1-1 7 wet room gross - 240 619 0.0026 255 9110387-1-1 7 wet room gross 14.8 264 937 0.0020110387-1-G 28 wet room comp 296 507 0.0012 297 2 it110387-1-0 28 wet room gross 14.2 301 358 0.0026110387-1-D 28 wet room gross - 295 417 0.0022110387-1-J 75 wet room gross 14 322 181 0.0035 316 5 it110387-1-1 75 wet room gross - 312 209 0.0027110387-1-L 75 wet room camp - 313 707 0.0014110387-1-P 90 weL room cop - 286 373 0.0024 295 7 21110387-1-0 90 wet room gross 13.7 301 312 0.0032110387-1-1 90 wet room gross - 299 365 0.0029110387-1-J 542 wet room camp 0 288 1059 0.0021 291 3 1%110387-1-K 487 vet room camp 12 293 826 0.0026
Batch ID CF ben v/c 3L G %air cylinder ID age storage strain water qu I eu
110387-2 275 10 1.75 8 138 - 110387-2-A 3 wet room gross 12.5 244 295 0.0033 246 2 it110387-2-B 3 vet room gross - 248 311 0.0026113087-2-C 3 let root gross - 245 i34 t.5046110387-2-G 7 wet room gross - 414 500 0.0027 411 7 2t110387-2-F 7 wet room gross - 18 311 0.0027110387-2-1 7 wet room gross - 402 361 0.0023110387-2-N 28 wet room comp - 529 S20 0.001f 490 28 5%110387-2-P 28 wet room gross 12.5 475 444 O.024110387-2-J 28 wet room groft - 466 375 0.0024110387-2-I 90 wet room camp - 483 716 0.0019 504 15 31%110317-2-L 90 wet room groas - 519 625 0.0018110387-2-0 90 wet room gross 12.8 510 456 0.0021110387-2-H 529 wet room coup 0 473 1264 0.0021 481 14 3%110387-2-1 487 vet room comp 11.1 501 i11 0.0018110381-2-1 542 wet room coup 0 470 1059 0.0019
Batch ID CF ben vi/c SL G %air cylinder 10 age storage strain water qu I eu
110387-3 319 10 1.5 8 138 - 110387-3-A 3 wet room gross 14.1 379 310 0.0026 374 5 it110387-3-B 3 wet room ;rcss 359 358 0.0032110317-3-G 7 let room gross - 558 783 0.0017 575 16 3%110317-3-1 7 wet room gross - 597 626 0.0019110317-3-1 7 wet room grca - 569 570 0.0011110317-3-F :8 wet room comp 636 593 0.0025 670 41 61110387-3-1 28 wet room gross 12.7 647 290 0.0030110387-3-M 28 wet room grcst - 728 932 0.1019110311-3-1 90 wet room gross - 695 717 0.0016 121 37 5%110387-3-J 90 wet room gross - 773 663 0.0021110387-3-0 90 wet room coim - 696 1325 0,0019
(Continued)
(Sheet 3 of 7)
D5

Table Dl (Continued)
110317-3-H 487 wet room comp 10.4 711 1402 0.0015 635 87 14%110387-3-1 542 wet room coop 0 681 1404 0.0017110387-3-0 529 wet room coup 0 514 1239 0.0006
Blatch ID C! ben u/c SL G %air cylinder ID age storage strain water qu I ev
111087-1 353 10 1.4 7.25 138 - 111087-1-A 3 wet room gross 13.5 531 415 0.0034 552 19 3%111087-1-B 3 wet room gross 547 518 0.0030111087-1-C 3 wet room coop - 577 741 0.0028111087-1-! 7 wet room gross 14.3 '64 566 0.0029 790 26 3%111087-1-D 7 wet room comp - 916 702 0.0024111087-1-I 29 wet room coop - 978 1379 0.0017 962 16 2t111087-1-J 29 wet room gross 14.3 967 1070 0.0019111087-1-G 29 wet room gross - 941 932 0.0024111087-1-L 94 wet room copm 14.1 931 1289 0.0018 900 15 6%111007-1-1 94 wet room coop - 821 466 0.0021111087-1-H 94 wet room coop - 939 1153 0.0016111087-1 480 wet room coup 11.3 997 1552 0.0021 976 22 21111087-1-N 522 wet room coup 0 904 1671 0.0018111087-1-P 535 wet room coup 0 946 1681 0.0016
Batch ID C? ben v/c SL G %air cylinder ID age storage strain water qo I eu
060487-1 268 20 2.03 9.25 133 0.6 060487-1-A 4 cure box gross - 163 6o 0.0042 160 3 2%060487-1-D 4 cure box gross - 158 67 0.0043060487-1-B 33 cure box neop 12.9 215 214 1%060487-1-C 33 cure box neop - 213
Bitch ID CY ben v/c 3L G %air cylinder ID age storage strain water qu I eu
060587-1 300 20 2 9.25 130 0.2 060587-1-C 7 care box gross - 160 43 0.0053 159 1 2%060587-1-A 7 cure box gross -158 9 0.0055060587-1-D 32 wet room neop - 176 176060587-1-n 60 care box gross 16.5 171 82 0.0042 172 1 1%060587-1-1 60 care box gross - 172 82 0.0033060587-1-1 129 wet room gross 19.3 182 96 0.0040 182
Batch ID C! ben v/c SL G %air cylinder 10 age storage strain tter p I ea
061887-1 369 20 1.53 6.75 132 0.7 061887-1-G 4 wet room gross 13.8 361 199 0.0031 367 2 0%061887-1-0 4 wet room gross - 368 152 0.0032061887-1-1 7 wet room gross 14 441 257 0.0031 440 9 2%061837-1-1 7 wet room gross - 428 234 0.0031061087-1-1 7 wet room gross - 450 243 0.0032061887-1-3 29 wet room neop - 431 401 23 6%061187-1-0 28 wet room neop 13.8 396061117-1-1 28 wet room neop - 376061817-1-I 50 wet room gross - 533 264 0.0030 540 5 1%061117-1-1 50 wet room gross 12.7 545 420 0.0022061687-1-L 50 wet room gross - 542 363 0.0026061817-1 660 wet room comp 0 521 1096 0.0024 529 15 3%061867-1-4 559 wet room comp 0 512 1058 0.0013061817-1-? 655 wet room cop 13.4 540 1097 0.0011
Batch ID C! ben u/c SL G lair cylinder ID age storage strain water qp I et
(Continued)
(Sheet 4 of 7)
D6
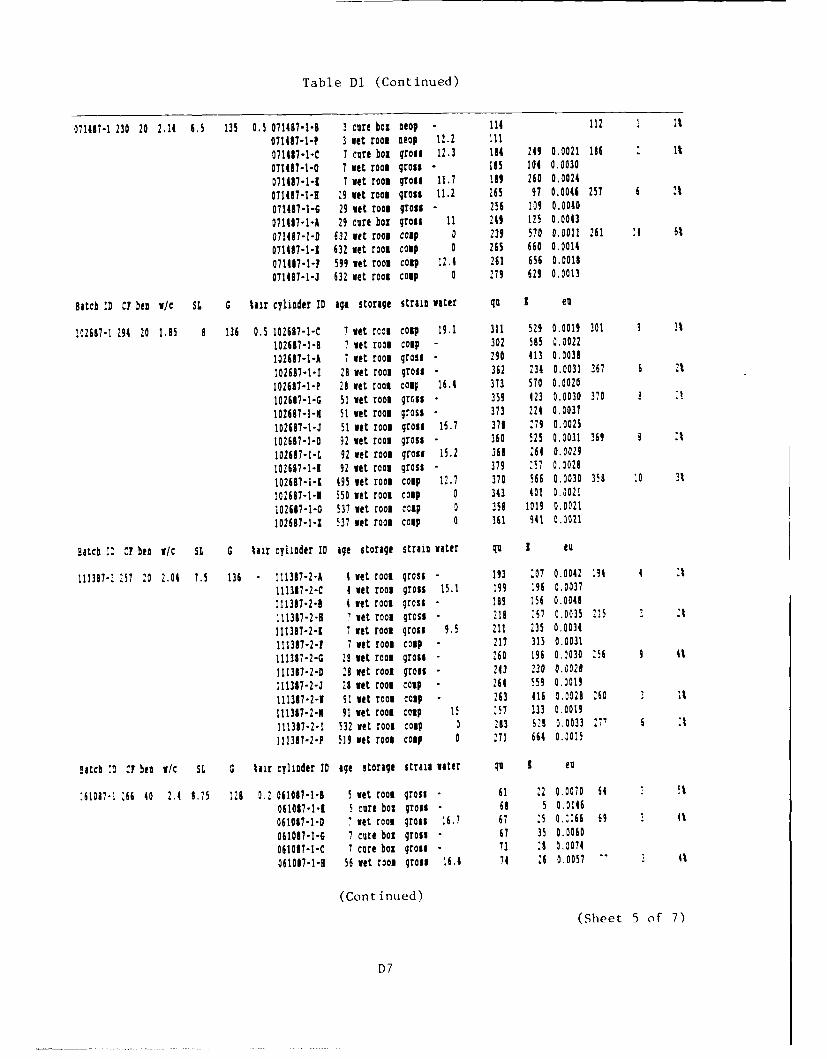
Table Dl (Continued)
071417-1 230 20 2.14 6.5 135 0.5 071487-1-B 3 cure box neop 114 112 1 1%
071487-1-P 3 vet root neop 12.2 I1'
071487-1-C 7 cure box gross 12.3 184 249 0.0021 136 2 1%
071487-1-0 7 vet room gross 185 104 0.0030
071187-1-1 7 wet room gross 11.7 189 260 0.0024
071487-1-H 19 vet room gross 11.2 265 97 0.0046 257 6 2
071487-1-G 29 vet room gross o 256 109 0.0040
071487-1-A 29 cure box gross 11 249 125 0.0043
071487-1-0 632 vet root coap 0 239 570 0.0011 261 24 61
071487-1-1 632 vet room comp 0 265 660 0.0014
071487-1-1 599 vet room comp 12.4 261 656 0.0018
071487-1-1 632 vet room coop 0 279 629 0.0013
Batch !D C! ben v/c SL G %air cylinder ID age storage stMain water go I en
102687-1 294 20 1.95 8 136 0.5 102687-1-C 7 vet root comp 19.1 311 529 0.0019 301 9 31
102687-1-B 7 wet room coop - 302 585 0.0022
102687-1-A 7 vet room gross - 290 413 0.0039
102687-1-I 28 vet room gross - 362 234 0.0031 367 6 2%
102687-1-P 28 vet room coom 16.4 373 570 0.0020
102617-1-G 51 wet room gross - 359 423 0.0030 370 a A
102687-1-K 51 vet room gross - 373 224 0.0037
102617-1-1 51 vet room gross 16.7 371 279 0.0025
102687-1-D 92 vet room gross - 360 525 0.0031 369 1
10267-1-L 92 vet root gross 15.2 368 264 0.0029
102687-1-1 92 vet room gross - 379 257 0.1028
102687-1-1 495 vet room comp 12.7 370 566 0.0030 358 0 3%
102687-1-1 550 vet root comp 0 343 401 0.021
I02687-1-0 537 vet room coop 0 358 1019 0.0021
102687-1-I 537 vet room comp 0 361 941 0.1021
Batch I ?F ben v/c SL G %air cylinder ID age storage strain water qo I eu
111387-i 257 20 2.04 7.5 136 - 111397-2-A 4 vet room gross - 193 :07 0.0042 94 4 3
111337-2-C 4 wet room gross 15.1 199 :96 0.0037
111387-2-B 4 wet room gross - 189 156 0.0048
111387-2-H 7 vet room gross - 218 267 0.0035 :i5 3%
111387-2-1 7 vet room gross 9.5 211 235 0.0034
111387-2-F 7 vet room coop - 217 315 0.0031
111387-2-G 28 wet root gross - 260 196 0.0030 56 9 4%
111387-2-0 28 vet root gross - 243 230 0.0028
111387-2-J 20 vet root comp - 264 559 0.0019
111387-2-1 91 vet room coop - 263 416 0.002 260 3 1%
111387-2-K 91 vet room comp 15 17 333 0.0019
111387-2-1 532 wet room comp 0 293 521 0.0033 27 6 3
111317-2-P 519 vet room comp 0 271 664 0.015
Batch :D C ben v/c SL G %air cylinder ID age storage strain water qo I eu
'61087-1 Z66 40 2.4 0.75 129 0.2 061087-1-8 5 wet room gross - 61 22 0.0070 64 2 5%
061017-1-1 5 cure box gross - 68 5 0.0116
061087-1-0 7 vet room gross 16.7 67 :5 0.066 69 Q%
061087-1-G 7 cure box gross - 67 35 0.0060
0610$7-1-C 7 care box gross - 73 28 0.0074
061017-1-H 56 wet room gross 16.4 74 26 0.0057 " 4%
(Continued)
(Sheet 5 of 7)
D7

Table Dl (Continued)
061017-1-3 56 cure box gross - 80 28 0.0070061017-1-L 124 wet room gross 19.4 05 31 0.0076 85
Batch ID CY hem v/c SL G tair cylinder 10 age storage strain wltr qv I ev
061887-2 446 40 1.56 8.5 125 0.3 061887-2-1 4 wet room gross - 125 34 0.0066 126 2 106187-2-D 4 wet room gross 21.3 126 H6 0.0071061187-2-L 7 wet room gross 19.6 175 79 0.0048 168 8 5%061887-2-1 7 wet room gross - 172 44 0.0071061887-2-6 7 wet room gross - 156 53 0.0057061807-2-1 28 wet room neop - 136 138 7 5%061887-2-C 28 wet room neop 17.5 148061887-2-B 28 wet room neop - 130061887-2-J 50 wet room gross 21.7 192 134 0.0030 200 6 31061087-2-N 50 wet room gross 206 104 0.0043061817-2-1 50 wet room gross - 203 116 0.0044061887-2-K 625 wet room comp 21.7 253 534 0.0025 253
Batch ID C1 ben v/c SL G %air cylinder ID age storage strain mater qu I eu
072187-1 244 40 2.35 7.25 131 0.5 072187-1-A 3 cure box gross - 77 37 0.0093 71 4 5%072187-1-0 3 let room gross - 69 42 0.0080072187-1-C 3 wet room gross 14.3 69 31 0.0101072187-1-K 7 cure box gross 13.3 96 32 0.0014 95 3 3%072187-1-0 7 wet room gross - 91 32 0.0071072187-1-L 7 wet room gross 13.9 98 35 0.0070072187-1-B 83 wet room gross 16.4 127 70 0.0068 127072187-1-1 592 Vi O0ON comp 17.2 139 263 0.0046 144 4 31072187-1-1 625 wet room coup 0 148 245 0.0062
Batch ID CY ben v/c SL G tair cylinder ID age storage strain water qu I tu
061287-1 321 60 2.23 7.75 122 0.8 061287-1-B 3 cure box gross 20.1 37 18 0.0091 35 3 at061287-1-1 3 wet room gross - 32 15 0.0117061287-1-A 7 cure box gross 22 45 12 0.0098 40 5 12061217-1-J 7 wet room gross - 35 11 0.0098061287-1-0 28 cure box neop 18.8 37 35 1 4%061287-1-1 28 wet room neop 20 350612187-1-KS 28 let room aeop - 33061287-1-c 54 wet room gross - 50 19 0.0085 50 1 21061287-1-B 54 wet root gross 20.5 49 16 0.0062061207-1-I 54 wet room gross - 51 26 0.0074061287-1-C 122 wet room gross 28.1 73 20 0.0094 73
Batch ID CF ben v/c SL G tair cylinder ID age storage strain water go I en
062387-1 323 60 2.95 8 106 1.2 062387-1-C 3 cure box gross 34.7 22 6 0.0095 20 1 5
062387-1-J 3 wet room gross 33.5 19 6 0.0078062387-1-G 3 wet room gross - 20 6 0.0103062317-1-0 28 wet room gross - 31 9 0.0073 29 2 Ft062317-1-K 21 wet room gross - 20 7 0.0071062317-1-I 15 wet room gross 34.8 29 7 0.0090 29 t062317-1-I 45 wet room gross - 29 6 0.0088062387-1-8 111 wet room gross 50.1 44 13 0.0100 43 1 3%062387-1-A II1 wet room gross 46.9 41 7 0.0111
(Continued)
(Sheet 6 of 7)
D8

Table Dl (Concluded)
Batch ID CI bet v/c SL G %air cylinder ID age storage strain voter ql I eu
072717-1 231 60 2.19 6.5 127 0.9 072787-1-1 3 cure box gross 17.4 25 6 0.0101 25 0 1%072717-1-I 3 let room gross - 25 7 0.0096072787-1-0 3 vet room gross 14.1 25 7 0.003072717-1-1 7 vat room gross - 25 13 0.0077 26072717-1-0 7 cure hot gross 17.9 26 9 0.00i4072717-1-1 7 vet room gross 16.7 28 13 0.0077072707-1-1 77 met room gross 22.2 53 13 0.0092 56 3 5%072787-1-C 77 vet room gross 21.1 59 12 0.0096072787-1-J 94 vet room gross - 52 35 0.0065 49 2 4%072787-1-1 94 let room gross 21.2 49 39 0.0053072787-1-1 94 vet room gross - 48 29 0.0067072717-1-9 586 vet room cop 21.5 85 147 0.0044 85
Total lumber of Test Groups 100
lumber of Test Groups Vith 13Only 1 Test
Average Standard Deviation 4% +/- 3%Within Test Groups With NoreThu 1 Test
Itbher of Test Groups With 4Standard Deviation )10%
KaImUl standard Deviation 14%lithin a Test Group
(Sheet 7 of 7)
D9

Table D2
Summary of Phase II Unconfined Compression Test Program
IIPLITIOI ON ?ABLI HEADIIGS
Cr cement factor, pounds of ceient~bentonite per cubic yard of concrete%BIN percent of cement factor, by weight, which is bentoniteAge curing age, daysSLUMP wet slup, inchesI/C ratio of water to cement+bentonite, by weightUnit Vt. theoretical unit weight, pounds per cqbic footqu ultimate compressive strength, psiI Young's modulus, kips (1000 pounds) per square inch (ksi)eu strain at qgo, I
sample I Sample 2
Test ID CF een Age SMUI V/C Unit Vt. qo I eu qu E eu
pcy days inches pcf psi. ksil. % psi. ksi. %
080288-1 290 0 3 8 1.5 144.6 442 642 0.33 391 975 0.28091488-1 302 0 3 7 1/2 1.4 146.5 793 - 759 1042 0.27030189-1 299 0 7 7 1.4 145.2 760 1627 0.19 717 1477 0.23102688-! 295 0 14 8 1.5 243.9 979 1750 0.15 945 188 0.16082688-1 304 20 3 8 1/2 1.8 133.4 282 467 0.32 :6 446 0.33080588-1 297 20 3 8 1.9 128.8 295 695 0.38 302 572 0.39091088-1 302 20 3 8 1.9 139.7 290 446 0.41 297 446 0.44081088-1 306 20 8 8 1/2 1.8 139.2 375 464 0.26 342 464 0.29082388-1 289 20 7 8 1/4 1.9 138.8 - 245 466 0.35090188-1 299 20 7 8 1/2 1.9 138.1 336 512 0.27 340 519 0.28111688-1 300 20 14 8 1.9 138.8 408 619 0.33 397 565 0.31091588-1 305 40 3 8 1/4 2.1 133.2 117 199 0.78 117 215 0.9090988-1 306 40 3 8 2.1 133.3 127 114 0.78 127 103 0.61091988-1 305 40 3 8 1/2 2.1 132.9 116 162 0.88 116 137 1.02101488-1 302 40 3 8 1/4 2.2 134.3 124 179 0.92 121 161 0.7083188-1 305 40 7 8 1/4 2.1 129.5 146 159 0.67 144 180 0.76092886-1 296 40 7 8 2.3 133. 134 241 0.64 128 255 0.73102880-1 301 40 14 8 1/2 2.2 135.0 152 209 0.66 150 214 0.74022289-1 308 40 14 7 1/2 2.1 132.9 155 190 0.72 153 223 0.4910088-1 300 40 14 8 2.2 129.7 157 277 0.73 164 279 0.77
D10

Table D3
Summary of Phase I Brazilian Splitting Tensile Test Program
c! Cement factor, pounds of cesentbentonite per cubic yardthen Bentonite content as percent of cement factor1/C! Ratio of vater to cement+bentonite, by weight?ensile strength From the equation:
?: 2F/ild
7: splitting tensile strength, psiP: peak load, lbs.
N"=: the number pi
1: cylinder length, inchesd: cylinder diameter, inches
Slup: 8 inches
test ID then age CF I/C length diameter Load tensilestrength
days lbs/cu. yd. in. in. lbs. psi
053088-1-C 0 3 261 1.56 12.136 6.016 8850 77053088-1-8 0 3 261 1.56 12.034 6.039 9050 79053088-1-A 0 3 261 1.56 12.074 6.022 9775 86053088-1-1 0 7 261 1.56 12.153 6.040 14550 126053088-1-9 0 7 261 1.56 11.987 6.048 14800 130D53088-1-J 0 7 261 1.56 11.987 6.037 16600 146053068-1-G 0 2s 261 1.56 12.020 6.000 17850 158053088-1-L 0 28 261 1.56 12,120 6.051 17100 148053088-1-F 0 28 261 1.56 11.980 6.051 19150 168053088-1-N 0 92 261 1.56 12.078 6.031 17700 155053088-1-K 0 92 261 1.56 12.094 6.047 17200 150053088-1-I 0 92 261 1.56 12.016 6.000 17500 155060288-1-8 0 7 346 1.18 12.104 6.029 23950 209060288-1-A 0 7 346 1.18 11.973 6.034 21650 191060288-1-! 0 7 346 1.18 11.903 6.040 19950 177060288-1-D 0 28 346 1.18 12,094 6.022 26200 229060288-1-J 0 28 346 1.18 11.938 6.042 26800 237060288-1-1 0 28 346 1.18 11.969 6.034 23750 209060288-2-3 20 7 255 2.22 12.093 6.042 5475 48060288- '-1 20 7 255 2.22 11.835 6,062 5125 45060288-2-N 20 7 255 2.22 12.094 6.058 4650 40060288-2-D 20 28 255 2.22 12.188 6.037 6050 52060288-2-3 20 28 255 2.22 12.250 6.064 5625 48060288-2-L 20 28 255 2.22 12.047 6.051 6725 59060288-2-8 20 92 255 2.22 12.156 6.036 5400 47060288-2-C 20 92 255 2.22 12.156 6.052 6275 54060288-2-G 20 92 255 2.22 12.125 6.063 6300 55061988-1-A 20 3 362 1.44 12,036 6.076 9600 84061988-1-8 20 3 362 1.44 12.073 6.057 7450 65061988-1-P 20 7 362 1.44 12.170 6.045 11250 97061988-1-L 20 7 362 1.44 12.120 6.044 11575 101
(Continued)
DI I

Table D3 (Concluded)
061988-1-1 20 7 362 1.44 12.100 6.060 13250 115061988-1-9 20 30 362 1.44 12.050 6.042 13875 I2061988-1-J 20 30 362 1.44 12.080 6.056 14900 130061980-1-0 20 30 362 1.44 12.000 6.052 13375 117062288-2-A 60 3 330 2.34 12.136 6.046 430 4062288-2-B 60 3 330 2.34 12.083 6.049 590 5062280-2-C 60 3 330 2.34 11.996 6.051 625 5062281-2-1 60 8 330 2.34 12.156 6.046 670 6062288-2-J 60 8 330 2.34 12.125 6.054 800 7062288-2-1 60 28 330 2.34 11.940 6.047 750 7062288-2-1 60 28 330 2.34 12.125 6.048 755 7062288-2-D 60 28 330 2.34 12.000 6.048 810 7062288-2-1 60 90 330 2.31 12.219 6.042 1020 3062288-2-J 60 90 330 2.34 12.094 6.047 900 a
D12

Table D4
Summary of Phase II Brazilian Splitting Tensile Test Results
IZPLAIATION 01 TABLI HEADIUGS
C1 cement factor, pounds of ceuent+bentonite per cubic yard of concrete%BIN percent of cement factor, by weight, which is bentoniteAge curing age, daysSLUNP vet slump, inchesV/C ratio of eater to ceaent~bentonite, by weightUnit Vt. theoretical unit veight, pounds per cubic foot7 splitting tensile strength, psiT/US splitting tensile strength divided by average unconfined shear strength (qu/2)
from sate batch and age
Test ID C! %Ben Age SLUK? V/C! Unit Vt. T T/US
pcy days inches pcf psi.
080288-1 290 0 3 8 1.5 144.6 56 0.27091488-1 302 0 3 7 1/2 1.4 146.5 123 0.32030189-1 299 0 7 7 1.4 145.2 88 0.24102688-1 295 0 14 8 1.5 143.9 127 0.26082686-1 304 20 3 8 1/2 1.8 133.4 42 0.30080588-1 297 20 3 8 1.9 128.8 39 0.26091088-1 302 20 3 8 1.9 139.7 35 0.24081088-1 306 20 8 8 1/2 1.8 139.2 55 0.31082388-1 289 20 7 8 1/4 1.9 138.8 46 0.26090188-1 299 20 7 8 1/2 1.9 138.1 46 0.28111688-1 300 20 14 8 1.9 138.8 45 0.22091588-1 305 40 3 8 1/4 2.1 133.2 13 0.23090988-1 306 40 3 8 2.1 133.3 19 0.30091988-1 305 40 3 8 1/2 2.1 132.9 14 0.25101488-1 302 40 3 8 1/4 2.2 134.3 14 0.23083188-1 305 40 7 8 1/4 2.1 129.5 17 0.23092888-1 296 40 7 8 2.3 133.6 20 0.31102888-1 301 40 14 8 1/2 2.2 135.0 17 0.22022289-1 308 40 14 7 1/2 2.1 132.9 19 0.24100688-1 300 40 14 8 2.2 129.7 22 0.27
DI 3

Table D5
Summary of Flexural Beam Test Program
Cy Ceent factor, lb. of cementbentointe per cubic yard of concrete%BII Bentonite content as a percent of cesent factorV/C Ratio of rater to ceuentbentonite, by veightmodulus of Rupture:
1:3P1/2bd^2
P: peak load, pounds1: length of beau, inchesb: vidtk of beas at point of rupture, inches (average 3 seasurementsd: depth of beau at point of rupture, inches (average 3 seasureuents
Average Load at modulus ofBatch ID BIN CF V/C Age vidth Depth Length Failure Rupture
% pcy days in. in. in. lbs. psi
060288-1 0 346 1.18 28 6.18 6.06 18.0 3100 369053088-1 0 261 1.56 28 6.09 6.00 18.0 2850 351061988-1 20 362 1.44 32 6.02 6.04 18.0 2175 267060288-2 20 255 2.22 28 6.08 6.15 18.0 1005 118062288-1 60 330 2.34 29 5.99 6.06 18.0 235 29060288-2 60 246 2.62 29 6.00 6.02 18.0 185 23
D14

APPENDIX E: PHASE II CIUC, Q, AND UC STRESS-STRAIN CURVES BY BATCH

3 2 5 0 -. ............ ............ ........... .Bentonite: 0%
3000- Age: 3 daysar~e,: 1 20 psi
2750- abCk: 20 psi
S2500
2250-
2000-
S1750-
1 500. cluc
o 1250
750
500uc
250
0.00 0.50 1 00 1.50 2.00 2.50 3.00 3.50 4-00 4.50 5.00Axial Strain, %
Deviator Stress vs. Axial StrainBatch: 080288- 1
3250- _ _ _ _ _ _ _ _ _ _ _ _ _ _ _ _ _ _ _ _
Bentonite: 0%3000--cu Age: 3 days
- OCol 250 psi2 750 Crbok: 50 psi
CL 25000 2250
2000-
S1750
0
o1250-
Vo 1000
750UC
500,-
250
0-0.00 0.50 1.00' 1.50 2.0062.50 3.00 3.50 4.00 4.50 5.00
Axial Strain, %
Deviator Stress vs. Axial Strain
Batch: 091488-1
E3

3250-Bentonite: 0%
3000- Age: 7 daysO'cel: 200 psi
2750 abac: 100 psi
'~2500-A ~ clucb
2250-
2000
1750-
1500-0
.21250-
o1000-0 (sulfur end cops)
750-
500-U
250
0.00 0.50 1.00 1.50 2.00 2.50 3.00 3.50 4.00 4.50 5.00Axial Strain, %
Deviator Stress vs. Axial Strain
Botch: 030189-1
3250 -Bentonite: '0
3000 Age: 14 daysCluc 20psi
2750- Crbk: 1 Opsi
S2500
2250-
2000C,,
S1750-
1500
.2 1250-
0 1000-- uC
750
500
250
0- ......... "I "' ' ' ~ " " I " ...... ..... .......... .... "....
0.00 0.50 1,00 1.50 2.00 2.50 3.00 3.50 4.00 4.50 5.00Axial Strain, %
Deviator Stress vs. Axial Strain
Batch: 102688-1
E4

2 7 5 0 -. . . . . . . . . . . . . . . . . . . . . . . . . . . . . .Bentoriite: 20%
2500 Age: 3 daysor,,: 70 psi
.6 2250 ao.,: 20 psi
C2000-
US1750
(I)
0
500
1250
250
0-0
0.0 2.0 4.0 6.0 8.0 10.0 1.Axial Strain. Z
Deviator Stress vs. Axial StrainBotch: 082688-1
2 7 5 0 . . . . . . . . . . . . . . . . . . . . . . . . . . .Bentonite: 20%
2500 Age: 3 days.acei0: 1 20 psiabk: 20 psi
7 2250
6 2000-
S1750-
~j1500-if)
8, 1250
> 1000-
750-
500-
0.0 20 4. 6. 80 10.0 12.0Axial Strain, %
Deviator Stress vs. Axial StrainBatch: 080588-1
E5

2750 Bentonite: o2500- Age: 3 days
- c rU . : 2 5 0 p s iu~ 2250O~k. 50
225
6 2000-
b 1750V)U)
~?1500 cu
01250
1000-
750
500-
250- uc
070.0 2,0 40 6.0 8.0 10.0 12.0
Axial Strain. %.Deviator Stress vs. Axial S5:-anBatch: 091088-1
2 7 5 0 . . . .. . . . . . . . . . . .v. . .Beitonite- 20%
2500 Age: 7 daysc", 1 20 psi
2250 (back: 20 psi
62000-
~'1750LO,
1 1500-
-125ED0-0 ~ uc
I 1000)
750 -
asoo 2
0.0 73 4.0) 0 80 100 C2Ax~il Strain, %
Deviator Stress vs. Axial SlrjinBatch 081088-1
E6

2 7 5 0 . .......... ......... ......... .......... .........Bentonite: 20%
2500- Age: 7 days- Cceii: 250 psi
.6 2250 aback: 50 psi
A~
&2000S1750-
S1 500-Cu
1250-0
> 1000-
750-
500-
250 uc
0.0 20 .0 60 80 1.0 20Axia; Strain. %
Deviator Stress vs. Axial StrainBatch: C82.388-1
2750-- Bentonite: 20%
2500 -Age: 7 days
-~'25 ceig,: .350 psi
12750
S1500-
1250-
> 1000-
750
500
250 u Lc
0.0 2.0 4.0 6.0 50 10. 12.0Axial Stronn. i
Deviator Stress vs~ Axial StrainBatcr 090188-1
E7

2 7 5 0 .. . . . . . . . . . . . . . . . . . . . . . . . . . .Bentonite: 2059
2500Age: 14 daysciuc c. 400 ps Icluc ak: 100 Psi
Cri 2250
tS 2000-
01750
)
a! 1500
c 0 (sulfur end cops)
> 1000C,
750-
UC
250
0.06 . 4.0 6.0 8.0 10.0 12.0Axial Strain %
Deviator Stress vs. Axial StrainBatch: 111688-1
1 6 0 0 - .. ............ ..............Bentonite: 40%
1500 Age: 3 days
1400 Ocell: 70 psi
u, 100 Yock: 20 psi
-1200
1100
S1000Lni -4
cn900
7()o600
500
300
2007130-
0 TT .. ......'"
00 _0 .4 C) '20 < 0 12 0 10 D 6Axri _Itrc n. +K
Devicor '-.tress vs. ':--,Strain
E8

1 6 0 0 -: ................... ........ 1 ..... ....
1500- Bentonite: 40%- Age: 3 days
1400 aw 120 psiCrbOk: 20 psi'
cn1300-
*1200
I1100-tD 1000
U'900-
07 800
o 00 cluc
.0 600
S500-
400-
300-
2 000
100 uc
0.0 2.0 .. 0 6-0 8.0 10.0 12.0 14'.0 ...16.0Axial Strain, %
Deviator Stress vs. Axial StrainBatch: 090988-1
1 600-Bentonite: 40%1500 Age: 3 days
1400- Cci 250 psi-ar 3 k: 50 psi
1300
1200
t 1 100
100
8 00700
6 00
5 00'
4 0030)
2 00
300 aC
0.0 2.0 4 0 60 8. 0 12.0 14.0 16.0Axial Strain, 5g
Deviator Stress vs. Axial Straintsatch: 091988-1
E9
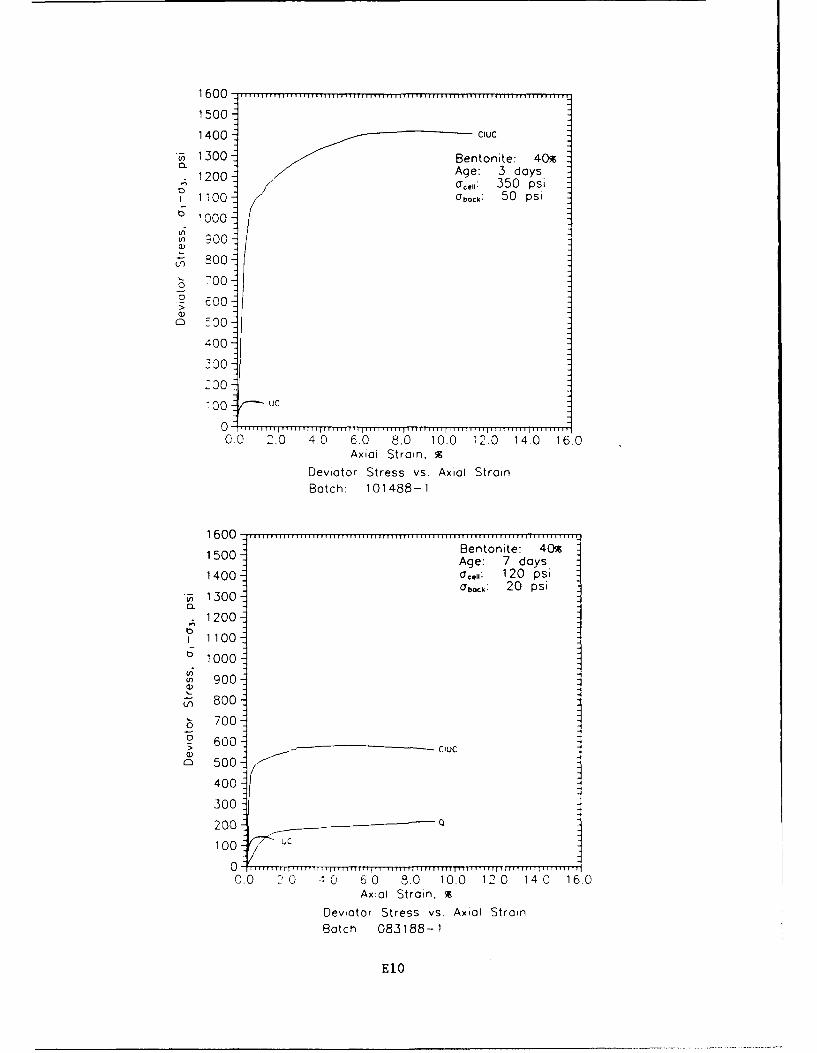
1 6 0 0 .. ................. .
1500
1400 CiUC
ji 1300Benton'te: 40%Age: 3' days1200- acl 350 psiab~.50 psi
'000U)
U' 00
U1 00
-'0
400
30
~00 - u
0-0.0 2.0 40 6.0 8.0 10.0 12.0 14.0 16.0
Axial Strain, %
Deviator Stress vs. Axial StrainBatch: 101488-1
16 0 0 -.. ...... .. .........1500Bentonite: 40%1500Age: 7 days
1400 arc.1: 120 psiCrbOCk: 20 psi
~13001200-
I1100-
t:1000
in 900-
(J800
o700-
.0 600_________ __
o500-
400-
300-
200Q
114010.0 20 4 6 0 8.0 10042 16.0Axial Strain.
Deviator Stress vs. Axial StrainBatch 083188-1
E10

1600- .........
1 500-
1400cluc
u1300Bento'nite: 40%
120Age: 7 days.1100- crel 350 psi
tD 10 0-UbOCk: 50 psi
V)900-
S800
o700-
0>~ 6007S500-
400-
z00 --
100 iJC
0.0 2.0 4.0 6.0 8.0 10.0 12.0 14.0 16.0Axial Strain, %
Deviator Stress vs. Axial StrainBotch: 092888-1
16 0 0 -.. ..... .... ........ .
150o0 Bentonite: 40%Age: 14 days
1400- ar. 11: 200 psiJbOCk: 1 00 psiS1300-
CI1200
I1100
b1000
S900'
S800 CU
S700-.0 600
0 500-
400
300 a
200-
100 uC
0 -. .. .. ...I.. .... ... .00 2.0 4.0 0 80 0.0 12.0 14.0 16.
Axial Strain, %Deviator Stress vs. Axial StrainBatch: 102888-1
Eli

1 6 0 0 ,. ,.... ,,,,....... ,..... ,. ,, ,,,..,..,.........,,.,,,,..........,.,,.,
1500 5- Bentonite: 40%Age: 14 days
1400- cel: 200 psi1300 Jbock: 100 Psi
(a.
1200
11001000-
S900LOO
-:D0 ________-______ ocucV) 0
co 520
=00 (sulfur end cops)
-_30/
UC
0.0 2.0 4.0 6.0 8.0 10.0 12.0 14.0 160Axial Strain, %
Deviator Stress vs. Axial Strain
Batch 022289-1
1 6 0 0 ........... ........................... .................1500 Bentonite: 40%
Age: 14 days1400 oc,,.: 400 psi
ciuc b 100 psiS1300 Oa
1200
1100o 1000 /
i~800S700-
. 600r 500
400 a
300200 '
100 Ur
1_00 8 O 4,? 0 £0 10.0 12.0 14.0 !.20 1 . 16.0
Axial Strain, %
Deviator Stress vs. Axial StrainBatch: 100688--l
E12
APPENDIX F: SUMMARY TABLES OF PERMEABILITY TESTS
(Project: Plastic Concrete ResearchWaterways Experiment Station)

Batch ID: 080288-1Cement Factor: 317 lbs./cu.yd.Bentonite: 0 %Fabrication Da 8/2/88
Specimen Dimensions:Height, ft.: 0.96Area, sq. cm.: 176.4
HeadElapsed Cell Gage Gage Diff. loss Grad. Flow Perm.
Date Time Time Press. Press. Press. Press. across across thrusec. psi. Ped. Top Cap psi. sample sample sample
psi. psi. ft ml. cm/sec
8/3/88 15:54 0 118 19.9 10.1 9.8 22.6 23.4 0.0813/88 16:04 600 119 19.9 10.1 9.8 22.6 23.4 3.9 1.6E-068/3/88 16:16 1320 119 19.9 10.1 9.8 22.6 23,4 3.4 1.2E-068/3/88 16:39 2700 119 19.9 10.1 9.8 22.6 23.4 5.4 9.5E-078/3/88 17:18 5040 119 19.9 10.1 9.8 22.6 23.4 7.9 8.2E-07
8/4/88 14:53 0 119 20 10 9.8 22.5 23.4 0.08/4/88 15:28 2100 119 20 10 9.6 22.2 23.0 1.9 2.1E-078/4/88 16:06 4380 119 20 10 9.5 22.0 22.8 2.1 2.3E-078/4/88 16:38 6300 119 19.9 9.9 9.5 21.9 22.7 1.6 2.OE-078/4/88 17:01 7680 119 20 9.9 9.5 21.9 22.7 1.1 1.9E-078/4/88 18:22 12540 119 19.9 9.9 9.4 21.6 22.4 3.4 1.7E-07
8/5/88 13:19 0 119 20 10 9.9 23.0 23.8 0.08/5/88 15:06 6420 120 19.9 9.8 10.0 23.0 23.8 1.6 5.7E-08
Batch ID: 091488-1Cement Factor: 328 lbs./cu.yd.Bentonite: 0 %Fabrication Dat 9/14/88In Pipette #: 5Out Pipette #: 6
Specimen Dimensions:Height, ft.: 0.98Area, sq. -.a.: 174.5
HeadElapsed Cell Gage Gage Diff. loss Grad. Flow Perm.
Date Time Time Press. Press. Press. Press. across across thrusec. psi. Ped. Top Cap psi. sample sample sample
psi. psi. ft ml. cm/sec
9/16/88 11:34 0 251 50 25 24 56.3 57.1 0.09/16/88 15:50 15360 250 50 25 25 57.7 58.6 0.8 5.1E-099/16/88 19:00 26760 250 50 25 25 57.7 58.6 0.6 5.2E-099/16/88 23:00 41160 250 50 25 25 57.7 58.6 1.0 6.8E-099/17/88 8:2U 74760 250 50 25 25 57.7 58.6 1.6 4.7E-099/17/88 16:59 105900 250 50 25 25 57.7 58.6 1.0 3.1E-099/17/88 17:05 106260 245 30 25 23 54.1 54.9 0.2 5.8E-08
F3

Batch ID: 030189-1Cement Factor: 325 lbs./cu.yd.Bentonite: 0 %Fabrica. Date: 3/1/89In Pipette #: 5Out Pipette #: 6
Specimen Dimensions:Height, ft.: 0.95Area, sq. cm.: 183.6
HeadElapsed Cell Gage Gage Diff. loss Grad. Flow Perm.
Date Time Time Press. Press. Press. Press. across across thrusec. psi. Ped. Top Cap psi. sample sample sample
psi. psi. ft ml. cm/sec
3/4/89 11:45 0 198 100 50 49.5 114.2 120.4 0.03/4/89 16:30 17100 200 99.7 49.9 48.8 112.5 118.6 4.8 1.3E-08
3/5/89 21:00 0 204 100 50 49.8 114.9 121.1 0.03/6/89 17:55 75300 203 100.3 50.2 49.1 113.3 119.4 12.6 7.6E-09
3/6/89 17:58 0 203 100.3 50.2 49.1 113.3 119.4 0.53/7/89 8:55 53820 202 100.5 50.4 49.1 113.2 119.3 6.6 5.6E-093/7,39 21:07 97740 205 100.4 50.4 49.0 113.2 119.3 4.1 4.2E-093/8/89 8:09 137460 203 100.5 50.4 48.9 112.8 118.9 3.8 4.4E-09
Batch ID: 102688-1Cement Factor: 317 lbs.Icu.yd.Bentonite: 0 %Fabrica. Date: 10/26/88
Specimen Dimensions:Height, ft.: 1.01Area, sq. cm.: 173.2
HeadElapsed Cell Gage Gage Diff. loss Grad. Flow Perm.
Date Time Time Press. Press. Press. Press. across across thrusec. psi. Ped. Top Cap psi. sample sample sample
psi. psi. ft ml. cmjsec
11/2/88 16:20 0 201 100 50 50 114.6 113.8 0.011/3/88 10:30 65400 200 100 50 50 115.3 114.6 2.2 1.7E-0911/4188 14:54 167640 201 100 50 50 115.8 115.0 3.1 1,5E-0911/6/88 15:03 340980 203 100 50 50 116.2 115.4 4.9 1.4E-09
F4

Batch ID: 080888-1Cement Factor: 313 lbs./cu.yd.Bentonite: 20 %Fabrication Dat 8/5/88
Specimen Dimensions:Height, ft.: 0.98Area, sq. cm.: 183.1
HeadElapsed Cell Gage Gage Diff. loss Grad. Flow Perm.
Date Time Time Press. Press. Press. Press. across across thrusec. psi. Ped. Top Cap psi. sample sample sample
psi. psi. ft ml. cm/sec
816/88 6:01 0 120 20 10 9.5 21.8 22.3 0.08/6/88 6:21 1200 120 20.1 10 9.5 21.9 22.4 0.1 2.OE-08
8/6/88 6:40 2340 120 20.1 10 9.5 21.9 22.4 0.1 2.1E-08
8/8/88 14:02 0 120 40 10 29.7 68.6 70.1 0.0
8/8/88 17:27 12300 120 39.8 10 29.6 68.4 69.9 1.1 7.0E-09
Batch ID: 091088-1Cement Factor: 348 lbs./cu.yd.Bentonite: 20 %Fabrica. Date: 9/10/88
Specimen Dimensions:Height, ft.: 0.96Area, sq. cm.: 167.8
HeadElapsed Cell Gage Gage Diff. loss Grad. Flow Perm.
Date Time Time Press. Press. Press. Press. across across thrusec. psi. Ped. Top Cap psi. sample sample sample
psi. psi. ft ml. cm/sec
9/12/88 11:52 0 251 50 25 24.2 55.8 57.9 0.0
9/12/88 14:27 9300 252 50 25 23.7 54.7 56.8 1.2 1.4E-08
9/12/88 15:32 13200 252 50 25 23.6 54.4 56.4 0.4 1.1E-08
9/12/88 23:41 42540 253 49.9 25 24.3 56.1 58.1 2.2 7.5E-09
9/13/88 10:08 80160 252 50 25 23.3 53.7 55.7 2.3 6.4E-09
9/13/88 20:15 116580 249 50 25 23.3 53.9 55.8 1.7 5.OE-09
F5

Batch ID: 081088-1Cement Factor: 351 lbs./cu.yd.Bentonite: 20 %Fabrication Dat 8/10/88
Specimen Dimensions:Height, ft.: 0.98Area, sq. cm.: 169.8
HeadElapsed Cell Gage Gage Diff. loss Grad. Flow Perm.
Date Time Time Press. Press. Press. Press. across across thrusec. psi. Ped. Top Cap psi. sample sample sample
psi. psi. ft ml. cm/sec
8/12/88 13:30 0 119 20.2 9.8 11.0 25.5 25.9 0.08112/88 14:45 4500 119 20.2 9.8 11.1 25.7 26.1 0.1 7.5E-098112/88 22:32 32520 119 20.1 9.8 11.0 25.5 25.9 1.5 1.2E-088/13/88 19:56 109560 119 20 9.6 11.0 25.4 25.8 2.8 8.3E-098/15/88 00:59 214140 119 20 9.6 11.0 25.3 25.8 1.7 3.7E-09
Batch ID: 082388-1Cement Factor: 340 lbs./cu.yd.Bentonite: 20 %Fabrication Dat 8/23/88
Specimen Dimensions:Height, ft.: 0.96Area, sq. cm.: 164.8
HeadElapsed Cell Gage Gage Diff. loss Grad. Flow Perm.
Date Time Time Press. Press. Press. Press. across across thrusec. psi. Ped. Top Cap psi. sample sample sample
psi. psi. ft ml. cm/sec
8/25/88 12:16 0 249 50.1 30 19.1 44.0 46.0 0.08/25/88 22:20 36240 248 50 30 19.0 43.8 45.8 3.3 1.2E-088/26/88 10:31 80100 249 50 29.9 19.0 43.8 45.8 3.0 9.1E-098/26/88 12:13 86220 249 49.9 20 28.9 66.7 69.7 0.6 8.5E-098/26/88 16:49 102780 249 49.7 20 29.2 67.4 70.5 1.9 9.9E-098/26/88 20:20 115440 250 49.7 19.9 28.4 65.6 68.6 7.18/27/88 19:16 198000 250 49.9 20 28.2 65.1 68.1 4.4 4.7E-098/28/88 18:35 281940 250 49.8 20 28.3 65.3 68.3 3.4 3.6E-098/29/88 16:43 361620 250 49.7 19.8 29.9 69.0 72.2 2.4 2.6E-098/30/88 10:30 425640 250 50 20 28.4 65.4 68.4 1.8 2.5E-09
F6

Batch ID: 090988-1Cement Factor: 365 lbs./cu.yd.Bentonite: 40 %Fabrica. Date: 9/9/88
Specimen Dimensions:Height, ft.: 0.95Area, sq. cm.: 165.1
HeadElapsed Cell Gage Gage Diff. loss Grad. Flow Perm.
Date Time Time Press. Press. Press. Press. across across thrusec. psi. Ped. Top Cap psi. sample sample sample
psi. psi. ft ml. cmlsec
9/11/88 10:25 0 121 19.9 10 9.7 22.4 23.6 0.09/11/88 14:26 14460 122 19.9 9.9 9.7 22.5 23.6 0.8 1.3E-089/11/88 15:40 18900 120 20 9.9 10.1 23.3 24.5 0.3 1.7E-08
9/11/88 15:45 0 120 20 10 10.0 23.1 24.3 0.09/11/88 20:13 16080 120 20 10 10.0 23.1 24.3 0.8 1.2E-08
Batch ID: 101488-1Cement Factor: 370 lbs./cu.yd.Bentonite: 40 %Fabrica. Date: 10/14/88
Specimen Dimensions:Height, ft.: 0.94Area, sq. cm.: 165.0
HeadElapsed Cell Gage Gage Diff. loss Grad. Flow Perm.
Date Time Time Press. Press. Press. Press. across across thrusec. psi. Ped. Top Cap psi. sample sample sample
psi. psi. ft ml. cm/sec
10/16/88 15:59 0 350 50 20 31.0 71.5 75.7 0.010/16/88 16.05 360 350 50 20 30.0 69.2 73.3 0.2 3.4E-0810/17/88 11:42 70980 354 50 20 30.8 71.1 75.3 12.5 1.4E-0810/17/88 17:18 91140 354 50 20 30.7 70.9 75.1 2.9 1.2E-08
F7

Batch ID: 092888-1Cement Factor: 364 lbs./cu.yd.Bentonite: 40 %Fabrica. Date: 9/28/88
Specimen Dimensions:Height, ft.: 0.95Area, sq. cm.: 164.1
HeadElapsed Cell Gage Gage Diff. loss Grad. Flow Perm.
Date Time Time Press. Press. Press. Press. across across thrusec. psi. Ped. Top Cap psi. sample sample sample
psi. psi. ft ml. cm/sec
1011188 20:57 0 340 50 24.9 25.1 57.9 61.1 0.010/3/88 17:18 159660 340 50 24.9 25.1 57.9 61.1 2.2 1.4E-09
10/3/88 17:37 0 349 50 25 25.0 57.7 60.9 0.010/4/88 10:07 59400 350 50 25.1 23.5 54.2 57.2 2.3 4.1E-0910/5/88 13:17 318000 350 49.8 25 23.4 54.1 57.0 2.3 9.5E-10
Batch ID: 102888Cement Factor: 357 lbs./cu.yd.Bentonite: 40 %Fabrica. Date: 10/28/88
Specimen Dimensions:Height, ft.: 0.96Area, sq. cm.: 168.9
HeadElapsed Cell Gage Gage Diff. loss Grad. Flow Perm.
Date Time Time Press. Press. Press. Press. across across thrusec. psi. Ped. Top Cap psi. sample sample sample
psi. psi. ft ml. cm/sec
11/2/88 16:08 0 199 100 50 50.0 115.3 119.9 0.011/3/88 10:30 66120 200 100 50 50.0 115.4 120.0 14.1 1.IE-0811/4/88 14:53 168300 199 100 50 49.9 115.2 119.8 20.5 9.9E-0911/6/88 14:40 340320 203 100 50 50.3 116.1 120.7 32.8 9.3E-09
11/6/88 15:00 0 200 100 50 49.4 114.0 118.6 0.011/7/88 14:28 84480 201 99.4 50.5 30.0 115.4 119.9 16.0 9.4E-09
11/7/88 14:54 0 200 100 50 50.6 116.8 121.4 0.011/7/88 18:38 13440 200 100 50 50.0 115.4 120.0 3.4 1.2E-0811/8/88 9:07 65580 200 100 50 50.0 115.4 120.0 10.0 9.5E-0911/8/88 16:55 93660 200 100 50 50.0 115.4 120.0 6.0 1.IE-08
F8