rep summry report - izf.net · cpar contract award evaluation report ... saari/sage accounting...
TRANSCRIPT
1CONTENTS LIST OF ACRONYMS AND ABREVIATIONS .................................................................. 2
INTRODUCTION.................................................................................................................... 5
Affirmation of the political will to complete sub-regional economic integration within the
UEMOA ................................................................................................................................. 6
Objectives of the Donors’ Conference on the Regional Economic Programme.................... 7
The process of preparation of documents for the conference ................................................ 7
I. THE WEST AFRICAN ECONOMIC AND MONETARY UNION: AN ON-GOING
SUB-REGIONAL ECONOMIC INTEGRATION PROCESS............................................ 9
1.1. Institutional framework of the Union.............................................................................. 9
1.2. Sub-regional economic integration policies of the UEMOA. ......................................... 9
1.3. Achievements of integration policies within the UEMOA ........................................... 10
II. THE REGIONAL ECONOMIC PROGRAMME: AN INNOVATIVE
PROGRAMME FOR SPEEDING UP THE UNION’s ECONOMIC INTEGRATION
PROCESS. .............................................................................................................................. 13
2.1. The major trends of the integration process .................................................................. 14
2.2. The Union’s development challenges. .......................................................................... 15
2.3. The UEMOA’s 2015 vision .......................................................................................... 16
2.4. The strategy of making the vision a reality. .................................................................. 16
2.5. 2006-2010 Regional Economic Programme. ................................................................ 18
2.6. Cost of the 2006-2010 Regional Economic Programme............................................... 19
2.7. Expected effects and impact of the execution of the REP. ........................................... 19
III. PARTNERSHIP BETWEEN THE UEMOA AND DONORS FOR THE
EXECUTION OF THE PROGRAMME. ............................................................................ 21
3.1. Resource mobilisation strategy for the financing of the programme ............................ 22
3.2. Mechanism of execution and monitoring/evaluation .................................................... 29
IV. POTENTIONAL RISKS ASSOCIATED WITH THE EXECUTION OF THE
PROGRAMME ...................................................................................................................... 37
CONCLUSION....................................................................................................................... 39
ANNEX 1 : DETAILED LIST OF REP PROJECTS FOR THE PERIOD 2006-2010 ... 40
ANNEX 2 : FINANCIAL PROGRAMMING OF THE RESOURCES OF THE REP... 46
ANNEX 3: RESULTS OF THE MACRO-ECONOMIC FRAMEWORK....................... 54
2
LIST OF ACRONYMS AND ABREVIATIONS
AARCEC Support for implementing the Regulations on Savings and Loans
Associations ABN Niger Basin Authority ACDI/CIDA Canadian International Development Agency ACE Central Asia Europe ACP Africa Caribbean and Pacific AEP East Asia and the Pacific AFD Agence Française de Développement AFRISTAT Sub-Saharan Africa Economic and Stastical observatory AGOA African Growth and Opportunity Act ALC Latin America and the Caribbean ALG Liptako Gourma Integrated Development Authority APD Public Development Assistance APE Economic Partnership Agreements AS Strategic are ASS Sub-Saharan Africa AVSEC Aviation Security Training BAD African Development Bank BCEAO Central Bank of West Africa States BEI European Investment Bank BIDC Ecowas Bank for Investment and Development BM World Bank BOAD West Africa Development Bank BRVM Regional Securities Stock Exchanges BTP Construction Industry CEDEAO Economic Community of West African States (Ecowas) CENTIF National Financial Information Processing Units CFA African Financial Community CFAA Review of Public Finance Management Evaluation CG Management Unit (MU) CILSS Inter-State Committee on Drought Control in the Sahel CIP Inter parliamentary Committee CNPE Comités Nationaux de Politique Economique COSCAP Cooperative Development of Operational Safety and Continuing
Air Worthiness Project CPAR Contract Award Evaluation Report CPP Conseil Parlementaire pour la Paix CREPMF Regional Council on Public Savings and Financial Markets CTRS Temporary Costs of Structural Reforms DDR Disarmament, Demobilisation and Reintegration DDU Single Customs Declaration PRSP Poverty Reduction Strategy Paper FAGACE African Fund for Guarantee and Eonomic-Cooperation FAIR Regional Integration Support Fund FAO Food and Agriculture Organisation FBCF Gross fixed capital formation FCFA CFA Franc FDC Fund for Development and cohesion FDI Institutional Development Fund
3FEGECE Mutual Aid and Loan Guarantee Fund of the Entente Council FMI International Monetary Fund (IMF) FOAI West African Investment Fund FRPC Poverty Reduction and Growth Facility FSA African Solidarity Fund GARI Guarantee Fund for Private Investments in Africa ICOR Incremental capital output rate IDA/AID International Development Association - World Bank IDE Direct Foreign investment IDH Human Development Index (HDI) IMF Micro Finance Institution INS National Statistics Institutes IST Sexually transmitted infections KWH Kilowat per hour LAB Fight against Laundering MAEP African Peer Review Mechanism MCA Millennium Challenge Account MIGA Multilateral Investment Guarantee Agency MOAN Middle East and North Africa NOPADA/NEPAD New Partnership for Africa’s Development NTIC New Information and Communication Technologies OACI International Civil Aviation Organisation OHADA Organisation for the Harmonisation of Business Laws in Africa OICV International Organisation of Securities Commission OMC World Trade Organisation ODM Millennium Development Goals OMVG River Gambia Development Organisation OMVS River Senegal Development Organisation OS Strategic objective (S.O) PACITR Community Programme of Action on Road Infrastructure and
Transport PARI Regional Integration Support Programme PARMEC Savings and Loans Associations Regulation Support Project PARSTAT Regional Statistics Support Programme PASMEC Programme of Support for Mutual Benefit Societies or Co-
operatives PAU UEMOA Agricultural Programme PCS Community Solidarity Levy PDM Partnership for Municipal Development PDMF UEMOA Financial Market Development Programme PER Regional Economic Programme (REP) PFR Low Income Country PGF Overall Productivity of Factors PIB Gross Domestic Product PIC Common Industrial Policy PIP Public Investment Programmes (PIP) PME Small and Medium Scale Enterprises PMI Small and Medium Scale Industries PPA Purchasing Power Parity PPTE Highly Indebted Poor Countries PRMP Regional Public Contract Reform Programme SAARI/SAGE Accounting Software SADAOC Foundation for Sustainable Food Security in West/Central Africa SCN National Accounting System (NAS)

4SDID Société Développement International Desjardins (Canada) SFD Decentralised Financial Systems SGI Management and Intermediation Company SIG Management Information System SIR Road Information System SM Multilateral Monitoring SMIG Minimum Guaranteed Salary SOAGA West African Assets Management Company SR Referral Structures SRP Poverty Reduction Strategy SYSCOA West African Accounting System TDP Protective Digressive Tax TEC Common External Tariff TIC Technologies de l’Information et de la Communication TICAD Tokyo International Conference of African Development TM Metric Ton TVA Value added tax UA African Union UE European Union UEMOA West African Economic and Monetary Union UMOA West African Monetary UnionWest African Monetary Union USA/EU United States Of America VA Value added WAPP West Africa Power Pool WDI World Development Indicators
5
INTRODUCTION
The growing integration of national economies has become a reality for all nations of the world. This reality, commonly referred to as globalisation, has structural characteristics which govern the development strategies of both developed and developing countries. Among factors which determine the force of these international economic developments, one can mention the growing importance of human and physical capital, intensification of competition among nations in order to attract productive investments, the increasing role of communication, including telecommunications and the gradual elimination of all impediments to free movement of knowledge, capital and goods and services. These structural characteristics of the global economy are manifest in several fields, particularly in the economic and social sectors. In the economic sector, the expansion of the market economy has modified the conditions of supply and demand of goods and services and significantly increased the volume of trade on the international markets. The flow of private direct foreign investments increased from roughly sixty (60) billion dollars in 2000 to two hundred and twenty-four (224) billion dollars in 2004. The annual increase in the volume of global trade in goods and services rose from 5% in 2003 to 10% in 20041. In the social sector, the deterioration of the living conditions of the populations has assumed alarming proportions in practically all developing countries during the nineteen nineties. This deterioration is mainly evident in the significant backwardness in terms of access to social infrastructure (education, health, potable water) and to economic infrastructure (transport, energy, telecommunications, finance). On the African continent, 44% of the population are poor because they live on less than a dollar a day. In the ECOWAS member countries, more than 50% of the populations are poor. The poverty rate in the West African Economic and Monetary Union (UEMOA) is roughly the same as the average rate for Africa, namely 45%. Consequently, poverty alleviation has been made a public policy. In fact, since the early 2000’s the improvement of the living conditions of the population has become the main and explicit objective of development. In this regard, the international consensus on poverty alleviation fixed at a world summit of the United Nations in September 2000 eight objectives described as the Millennium Development Goals (MDGs). In order to speed up the attainment of these goals, the international Community took initiatives to significantly reduce the indebtedness of some developing countries which implement virtuous public policies. Generally, the current economic changes have a profound impact on the development strategies of national economies. These strategies cannot be implemented without taking the mobility of factors of production (capital and labour) into consideration. Consequently, national economic performance and the economic performance of economic groupings will depend on the most stable factors of production, hence those that move with the least ease from one country to another and from one economic zone to another. These factors of production are infrastructure and, to a lesser extent, human capital. 1 IMF, International Monetary Fund, World Economic Outlook, September 2005. Page 2

6In addition to the efforts being made at national level, member States of the West African Economic and Monetary Union (UEMOA) have opted for a common strategy in order to capitalise on the synergy arising from national potential, to better promote the productive sector, derive benefits from the opportunities offered by the world economy and achieve a high standard of living for their citizens. The bedrock of this common strategy is the enhancement of the economic integration process initiated within the West African Economic and Monetary Union (UEMOA) since 1994. This common strategy of UEMOA member countries is in line with a continental and regional perspective. At continental level, the African Union initiated the New Partnership for Africa’s Development (NEPAD) which portrays itself as an innovative initiative, the major objectives of which are poverty alleviation and repositioning of the continent in the global economy. NEPAD’s priorities are good political and economic governance, sub-regional and regional integration, infrastructural development, education, health, agriculture and information and communication technologies, access of African products into international markets, etc. Convinced that regional and/or sub-regional integration is the first stage of harmonious entry into the global economy, the member States of ECOWAS and, especially UEMOA, which is currently the most advanced from of integration in the West African sub-region, are making considerable efforts in order to attain this objective.
Affirmation of the political will to complete sub-regional economic integration within the UEMOA In order to speed up and strengthen the construction of the UEMOA zone and ensure its rapid and sustained growth, the UEMOA Authority of Heads of State and Government on 10 January 2004 commuted the Union’s institutions to finalising and implementing the Regional Economic Programme (REP). The Authority, at its extraordinary session held on 11 October 2005 in Niamey reaffirmed the special importance it attached to the REP, the implementation of which should make it possible to speed up the emergence of an integrated dynamic and prosperous regional economic zone within which would be organised the efforts to adapt the economies to the demands of globalisation and improve the living conditions of the Union’s populations. The institutions responsible for implementing the REP are the UEMOA Commission, the Central Bank of West African States (BCEAO) and the West African Development Bank (BOAD). These institutions are working in synergy with the member States for the financing and execution of the projects identified. The institutional framework for the implementation of the REP is a Steering Committee2 made up of BCEAO, BOAD and the UEMOA Commission. This Steering Committee is backed by a REP Management Unit3 operating from the headquarters of the UEMOA Commission. The implementation of the REP requires inter alia, the mobilisation of significant financial resources. To this end, BOAD which was designated as the leader of
2 Decisions N°878 / 2004 / P.COM / UEMOA and N° 0965 / 2005 / P.COM / UEMAO 3 Decision N°879 / 2004 / P.COM / UEMOA
7donors financing the REP was given the mandate to organise a donors’ conference on the REP.
Objectives of the Donors’ Conference on the Regional Economic Programme Three major objectives were to be attained through the organisation of the donors’ conference, namely: - gathering of suggestions and proposals from development partners of the Union
concerning the Programme ; - obtaining the pledges of donors and mobilising the resources required for the
implementation of the Programme and, lastly ; - creating between the Union and its development partners a permanent framework
for the exchange of information, monitoring and evaluation of the Programme.
The process of preparation of documents for the conference The preparations towards the donors’ conference required the preparation of a basic dossier under the supervision of the Steering Committee. The preparation of the dossier was based on existing documents, particularly the initial REP which was adopted in May 2004 by the UEMOA Council of Ministers and the other documents, prepared by the various institutions of the Community. The concerns expressed by the populations and the Union’s development partners during joint educational missions were also taken into consideration. In addition to this summary report, the dossier includes a volume on socio-economic diagnosis, the Union’s vision and strategy for the next ten years (2006 – 2015) ; a volume on the 2006 – 2010 Action Programme underlying the proposed strategy ; a volume on macro-economic studies and the impact of the five-year programme and a volume on the profiles of projects forming part of the programme. In order to have an insight into the various determinants of the Union’s past development, its present state and its prospects; a four-stage approach was adopted: 1. Analysis of the past and present situation of the UEMOA zone: a retrospective analysis taking into consideration all the major developments which took place in the regional and global environment of the Union was conducted for the period 1994 – 2005. The analysis made it possible to note the progress made by the UEMOA, its strengths and potentialities as well as the major obstacles to the attainment of its objectives. 2. Formulation of a vision and the strategy of the UEMOA for the next ten years (2006 – 2015): based on the trends observed at the end of the retrospective analysis, two tentative scenarios for the long-term development of the Union were obtained. By comparing these possible development scenarios and the Union’s ambitions, the future vision which the UEMOA has fixed for itself was conceptualised and explained. The major stakes and challenges associated with this vision were first of all used as guide in mapping out the strategy which is presented in five strategic areas. Each strategic area was then broken down into several strategic objectives and lines of action.
83. Drawing up of a 2006 – 2010 five year programme of action: in drawing up the programme of action, all the projects included in the initial REP were examined first of all. This was followed by an examination of the list of all the projects having an integration-enhancing dimension which were planned or were being executed by regional and sub-regional organisations as well as in the countries of the Union. Special emphasis was put on coherence, complementariness and synergy to be developed with the policies, strategies and programmes of continental, regional and sub-regional organisations (AU, ECOWAS, ALG, and OMVS, etc.). Each project selected for the REP was summarily presented in project profile form. 4. Evaluation of the macro-economic impact of the 2006-2010 five-year programme: An analysis framework was used in order to evaluate the macro-economic impact of the Programme, particularly on the gross formation of fixed capital, economic growth, public finances as well as the realisation of the Millennium Development Goals. This analytical framework was based on a model which considers together investment, marginal productivity of capital, capital stock, and growth rate. The choice of the model was above all guided by the concern about handling a tool which was not too demanding in terms of data, given the significant constraints as far as the production of statistical information was concerned. In this regard, under standard assumptions, production depends on the stock of physical capital and on human capital. In this particular approach, investment is considered as an instrumental variable on which the players of economic policy can act. The permanent inventory method using annual data on capital expenditure for the period 1980-2004 was used in order to determine capital stock. Investment is understood in the sense of national accounting: gross fixed capital formation. The sequential and iterative approach in evaluating the effects and impact of the REP comprises the following six stages: (i) Determination of the capital stock based on permanent inventory; (ii) Impact of the REP on the capital stock; (iii) Determination of the rate of economic growth; (iv) Determination of the Gross Domestic Product (v) Breakdown of the GDP (Sources and Resource Application, Public Finances, Foreign Sector, Monetary Situation and (vi) Poverty situation (social indicators) Two macroeconomic scenarios showing the benefits expected from implementation or non-implementation of the REP are tested based on assumptions derived from the modalities for the provision of investment for the REP: a trends-related scenario and desirable scenario. After these stages, the basic provisional dossier for the donors’ conference, including the various components was fed back to National Economic Policy Commissions, the Private Sector, the Civil Society and Professional Organisations during national workshops, a regional workshop of experts and a meeting of sector Ministers. The main reason for organising feedback workshops was to lay the foundation for a better acceptance of the REP by all stakeholders in the process. This summary document highlights the major conclusions of the basic dossier for the donors’ conference. This is presented in three parts: the first part reports on the integration process within the UEMOA. The second outlines the innovative solution adopted by the Union’s decision-making bodies and the results expected in order to speed up the economic integration process in the West African sub-region and
9finally the third proposes a framework for partnership between the UEMOA and its development partners under the financing and implementation of the REP.
I. THE WEST AFRICAN ECONOMIC AND MONETARY UNION: AN ON-GOING SUB-REGIONAL ECONOMIC INTEGRATION PROCESS The process of integration of the UEMOA which was initiated in 1994 is governed by an institutional framework which regulates the drawing up and implementation of integration policies the evaluation of which indicates the noteworthy progress in the integration process.
1.1. Institutional framework of the Union The UEMOA is a grouping of eight countries4, with a population of roughly seventy-four (74) million inhabitants in 2004. The member States have decided to find common or concerted answers to present-day economic challenges. They adhere to common socio-economic objectives in order to derive more benefits from opportunities and face up to the threats arising from the changes in the international economic environment. The UEMOA has set itself the objective of fashioning a real common socio-economic zone. To this end, the UEMOA Commission, in collaboration with the two other Community Institutions (BCEAO, BOAD) and the member states is responsible for drawing up Acts supplementary to the Treaty, Regulations, Directives and Recommendations to be adopted by the decision-making bodies of the Union, namely, the Authority of Heads of States and Government and the Council of Ministers and for the implementation of these Acts. This is the institutional framework which is responsible for drawing up Community policies. The UEMOA countries are also members of the Economic Community of West African States (ECOWAS) which has fifteen (15) member States.
1.2. Sub-regional economic integration policies of the UEMOA. The UEMOA’s major projects for creating an attractive zone are : (i) the enhancing of good economic and political governance through the development of regional initiatives to foster peace, democracy and the creation afresh of an investment-friendly environment; (ii) enhancement of economic integration through the implementation of the Pact of convergence, stability, growth and solidarity backed by a multilateral monitoring mechanism and consolidation of the gains of the Customs Union; (iii) drawing up of the Community Investment Code; (iv) harmonisation of international taxation (standardisation of the Value Added Tax, 2001) (v) standardisation of the modalities for the privatisation of public enterprises and finally (vi) the implementation of sectoral policies.
4 Benin, Burkina Faso, Côte d’Ivoire, Guinea Bissau, Mali, Niger, Senegal and Togo.
101.3. Achievements of integration policies within the UEMOA After its first eleven years, the achievements of the UEMOA’s integration process are: - The integration of the political dimension into the economic mission of the UEMOA to ensure that the latter is henceforth capable of making its contribution in the area of prevention and management of conflicts afflicting the Union and to ensure that member States comply with democratic principles and the rule of law. - The adoption of the Common External Tariff by all the countries of the Union, which made it possible to increase intro-Community trade to an average annual rate of 12% between 1996 and 2003, the ultimate objective being at least 25%. The Union’s exports to third countries increased by 4% on the average annually over the period 1996-2001. - The rationalisation of the Value Added Tax which made it possible for the Union’s economies to embark on a clean departure from their heavy dependence on customs duties for the financing of their respective budgets. The harmonisation of the TVA rate at 18% and the widening of the tax base made the ratio of tax earnings to Gross Domestic Product increase from 14% in 2001 to 15% in 2005, the objective being at least 17%. - The application of the Pact of convergence, stability, growth and solidarity and multilateral monitoring since 2000 led to the definition of a set of convergence goals and eight macroeconomic criteria which the members must comply with. Significant progress was made as regards the management of the macroeconomic framework of the UEMOA member States: the Union recorded an average annual economic growth of 3.65% over the period 1994-2004. The sequential analysis of the growth profile makes it possible to establish the fact that the Union experienced sustained economic growth over the period 1994-1999, with an average annual rate of 4.8%, whereas over the 2000-2005 period, the economic growth rate was 2.6%. Be it production, prices, public finances, currency or the position vis-à-vis the outside world, the indicators remain generally turned to the proper direction, particularly during the 1994-1999 sub-period. This growth drive has slowed down since 2000 following the deterioration of the socio-political situation in some member countries of the Union. - In the industrial sector, the implementation of the Common Industrial Policy (CIP) has not yet made it possible for the firms in the sector to contribute more than 27% to the total Gross Domestic Product of the Union. The constraints which the Common Industrial Policy (CIP) should contribute to remove are still present: the environment provides very little initiatives; the institutional infrastructure is inefficient ; the quality of management and productivity of factors are still inadequate and inter-and-intra-industry relations are still weak within the Union. - In the agricultural sector, the Union’s agricultural policy has not yet made it possible to plug the cereals deficit in the Union. On the whole, the availability of grains makes it possible to cover only 2320 calories per person daily whereas the FAO norm is 2400 calories. Only four countries (Côte d’Ivoire, Benin, Togo and Guinea Bissau) currently exceed the FAO norm. Finally, the Union’s Agricultural Policy has not yet made it possible to assign and attain specific objectives of food and cash crop production.
11Despite the appreciable results recorded under the macroeconomic framework, the living conditions of the Union’s populations have not improved significantly; Even if the rhythm of economic growth improved between 1995 and 2004, the level of human development in Mali, Benin, Senegal and, to a lesser extent in Togo still remains insufficient to achieve a lasting reduction of the impact of poverty in the Union, which is 44% compared to the average rate of 45%. The public resources devoted to the development of human capital have not increased significantly. In 2002, health expenditure compared to Gross Domestic Product did not exceed 7%5 in any of the countries of the Union. Life expectancy at birth was 48 years as compared to 69 years for East Asia and the Pacific (EAP); out of 1000 live births, close to 100 babies die before their first birthday compared to 35 for EAP. More than 800 maternal deaths are recorded per 100 000 live births; the spread of the AIDS pandemic and malaria jeopardise growth and development in the member countries of the Union; more than 50% of the population does not have access to potable water in the rural areas; more than two thirds of the population live in countries which are experiencing or have experienced serious conflicts during the past five (5) years. In the area of education, public expenditure was on the average lower than 4% of the GDP of the Union in 2000 whereas it is close to 5% for the whole of Africa south of Sahara. The gross rate of primary school attendance varies between 35% in Burkina Faso and 92% in Togo, whereas at secondary school level, it varies between 10% in Burkina Faso and 39% in Togo. The economic infrastructure development policies in the Union focussed on transport, energy, information and communication technology and finance. With regard to transport infrastructure, the physical situation of road infrastructure did not change significantly compared to the situation observed in 2001 within the framework of the drawing up of the Community Action Programme on Infrastructure and Road Transport. The situation is still characterised by a network with a relatively low density (2.68 km per 1000 inhabitants) and is in an advanced stage of disrepair. In addition, there is a lack of physical continuity and there are disparities in the level of services along the Community roads, poor accessibility of rural areas to transport infrastructure and a lack of co-ordination in the management of the infrastructure. Besides, the conditions of optimum utilisation of the network have not yet been satisfied because of the disparity in the rules and practices relating to inter-state transport and transit within the Union. The total length of the railway network hardly attains 4000 kilometres of tracks, more than half of which is in advanced state of disrepair. This network is characterised by the low interconnection among the various urban centres and among production centres and agricultural produce/ industrial products trading centres. Air transport is characterised by the insufficiency of inter-state links following the failure of the Air Afrique airline company due to the non-compliance of much of airport technical infrastructure and installations with the norms as well as the disparity and inadequacy of national safety and security regulations. Maritime transport remains confronted with a number of constraints and weaknesses which hinder its competitiveness: weakness of harbour administrative 5 World Bank, World Development indicators. 2005

12services slowness of customs and transit services, insufficient harmonisation of customs regulations and procedures in the harbours of the Union, insufficient co-ordination with the other modes of transport. However, since 2001, the landlocked countries of the Union (Burkina Faso, Mali and Niger) have mapped out strategies to improve the transit of their goods through the harbours of the sub-region (Abidjan, Cotonou, Dakar, Lomé, Accra) in order not to depend solely on one corridor to have aces to the sea. One of the components of these strategies centres around the improvement of road and railway transport infrastructure. The energy situation of member States of the Union is characterised by a number of limiting factors, with the exception of a few specifities. The Union, on the one hand, is almost entirely dependent on the massive utilisation of biomass. Eighty percent (80%) of the energy used in the Union comes from firewood, charcoal and plant wastes. On the other hand, the high dependence on hydrocarbons is a heavy burden for the Union’s economies. The share of electricity in the Union’s energy consumption has remained relatively low, namely, roughly 5% and the rate of electrification is roughly 18%. This rate conceals a wide imbalance not only among the countries, but also between urban and rural areas. The cost of petroleum products and electricity remains very high for economic activity and for a population which is predominantly rural and poor. The utilisation of renewable forms of energy remains low (less than 0.1% in the Union’s energy balance sheet) despite the important potential in the Community territory. An almost total lack of energy planning at Community level and inadequacy of sub-regional co-operation are noticeable. The dynamism of the Information and Communication Technology (ICT increased as from 1995, especially with the advent of mobile telephony and the development of the Internet in the Union. Communication costs still remain high in the Union. In order to realise its telecommunications sector objectives, the UEMOA drew up in 2000 guidelines and a plan of action for the improvement of telecommunications in the territory of the Union in conformity with the second priority telecommunications programme of ECOWAS (INTELCOM II) which was adopted in 1998. Financial institutions in the Union are still characterised by the predominance of banking institutions which are subsidiaries of European banks and which are found in practically all the countries of the Union. The restructuring of the banking system in the Union made it possible to improve the system following the establishment of a Banking Commission responsible for ensuring that BCEAO directives are implemented properly. Nonetheless, new West African banking groups are being created, like ECOBANK, BOA and the Atlantic Group. Given the numerous constraints associated with the environment and the difficulty of access to financing which hinder the development of SME’s and SMI’s, a study on the promotion of the financing of SME’s in the Union commissioned by BOAD, made it possible to adopt a programme of action in order to assist SME’s and SMI’s to remove the impediments to their development, especially in the area of financing. Since the availability of financing does not match the demand for financing from the various economic agents in the Union, the monetary authorities received the mandate to ensure that alternative financing institutions were created. Thus, the system of decentralised financing developed in a unprecedented manner in the

13Union and the Union’s authorities decided to lay special emphasis on developing and regulating it. On the whole, an analysis of the Union’s situation on the eve of the donors’ conference shows that notable progress was made in strengthening the common market. However, some weaknesses persist, particularly, the difficulties facing the movement of persons and goods, with its implications in terms of access to economic and social infrastructure, the right of establishment and of harmonisation of the rendering of services. Thus, the factors of harmonisations which depend on sectoral policies and which foster the realisation of the common market (transport network, power supply services, dissemination of NICT, access to training, revitalising of agri-business lines, updating of firms) are yet to be developed. Once this is done, these policies will enter into their operational stage, particularly through the execution of the REP and the regional Poverty Reduction Strategy Paper (PRSP). With regard to transverse policies the implementation of which is determinant in transforming the customs union into a common market, thus consolidating the regional economic zone, a number of programmes are yet to be undertaken. This is the justification for the drawing up, adoption and imminent execution of the first five-year programme of the REP.
II. THE REGIONAL ECONOMIC PROGRAMME: AN INNOVATIVE PROGRAMME FOR SPEEDING UP THE UNION’s ECONOMIC INTEGRATION PROCESS. In drawing up and executing the REP, it is important to bear in mind that the UEMOA’s mission is to ensure the emergence of a region which is integrating gradually and selectively and which has groups of countries and sectors with dissimilar levels of development. Analytically, this implies that the Union cannot be aptly perceived as the sum of its member States nor simply as a juxtaposition of same. The basic principles on which the drawing up of the REP were based were on the one hand, stronger co-operation among the member States and, on the other hand, the development of a partnership with the national, regional and international private sectors. The regional strategy postulates that the speeding up of integration will yield economic results higher than those to be obtained from simply juxtaposing the individual performances of its member countries. The regional initiatives remain centred on public (utility) services which cannot be provided efficiently by each country on its own. The ultimate objective aimed at by the Union in implementing this strategy is the lasting improvement of the living conditions of the populations. Indeed UEMOA member countries are confronted with certain common structural constraints which justify the adoption of an integrated common approach in analysing them and in taking action. One of these major structural constraints is the shortfall in the level and quality of economic and social infrastructure. However, there are also marked differences in comparative advantages (coastal countries, landlocked countries), hence in economic potential (fishery resources, mineral resources, agricultural resources) of the member countries of the Union. Besides the development of infrastructure and the joint management of common resources, the States are also faced with other constraints associated mainly with the consolidation of economic and political good governance and the balanced development of Community territory.

14Taking these major characteristics into consideration, the speeding up of the integration process in the UEMOA zone became focussed on the strategic challenges of enhancement of good governance, development of physical and human capital and the modalities (Community strategies) of ensuring a better co-ordination of efforts in order to take up more effectively the challenges of growth, poverty alleviation and a better integration into the global economy. The human resources and the level and quality of infrastructure largely determine the optimum utilisation of an economy’s potential. Consequently, a national or regional development policy should focus on the enhancement of political stability and the accumulation and development of human and physical capital. Good political and economic governance makes it possible to enhance the actions likely to speed up growth and reduce poverty. In this regard, the organs of the Union should take action to foster politically stability (election and conflict monitoring) and jurisdictional stability and also improve economic governance, the investment climate and ensure the balanced development of Community territory.
Human capital has to do with the economic and social behaviour of individuals, especially the manner in which the sum total of their knowledge and aptitudes make it possible for them to increase their productivity and income and participate in the development process. The stages of the process of accumulation of human capital are the acquisition of knowledge and skills, improvement of access to health services and other basic social services.
Infrastructure is a factor of improvement of productive performance. It thus contributes towards growth through the enhancement of the economy’s supply of products and services. An analysis of the types of infrastructure makes it possible to define them according to two perspectives: - From the point of view of their function - Social infrastructure - : these are
goods and services which maintain and develop human capital (education, health, other basic social services, governance of public and private institutions).
- From the point of view of their finality – Economic infrastructure - : these are
mixed collective goods on which productive activity is based (Hansen 1965). From this definition, it is possible to distinguish: (i) transport infrastructure: roads, bridges, Airports, harbours which facilitate the movement of goods and persons; (ii) communication infrastructure: Information and Communication Technologies (NICT); (iii) water and power supply networks.
The drawing up of the REP called for the determining of the major trends of the Union’s integration process, the identification of the UEMOA’s developmental challenges and the formulation of a vision of the Union by 2015.
2.1. The major trends of the integration process A retrospective evaluation of the Union’s socio-economic situation over the period 1994-2005 showed the following major trends: - rapid population growth ; - low level of development infrastructure ; - low volume of investments ; - generally insufficient productivity of factors ;

15- specialisation based on primary products, the world prices of which are
unstable and tend to fall ; - upsurge of conflicts and insecurity in the Union. Should these major trends continue, the economies of the Union would not be able to realise the growth rates required in order to attain the Millennium Development Goals by 2015. Indeed, the simulations show that: with a rate of 4.68% on the average for the first five years, namely 2006-2010, the average growth rate of the Union will fall short of 6% by 2015 ; - per capita income will hardly increase over the period, from FCFA 279.000 in
2005 to FCFA 308 000 in 2010 and FCFA 357 400 in 2015 - the impact of poverty will reduce only very slightly, from 44% in 2004 to 39.0% in
2010 before attaining 35.5% in 2015 compared to the Millennium Development Goal of 22%.
- in the social sector, the gross school attendance rate would be 81.2%, far from
the universal school attendance expected by 2015 ; the adult illiteracy rate which was 62% in 2005 would decrease to 55.8% in 2010 and 52.0% in 2015. Infant mortality for its part will remain at a high level (85.2 per thousand) in 2015 ;
- on the whole, the human development index which is already low in the Union,
will change very little, from0.334 in 2005 to 0.357 in 2010. These development trends differ clearly from the socio-economic development challenges brought to the fore by the changes in the international environment, the advances made by the Union and the constraints confronting the Union’s integration process. The changes in the Union’s socio-economic situation over the 1994-2005 period are presented in detail in Volume I, entitled « Diagnosis, Vision and Strategy ».
2.2. The Union’s development challenges. The major challenges of the Union are the continuation of the realisation of an integrated economic and social zone through the consolidation of the efforts already made and the successful integration of the economies of member States of the Union in the globalisation process. The realisation of a socio-economic zone attractive to investments is subject to the promotion of good governance, the availability of economic and social infrastructure and good quality human resources. Integration into the global economy calls for a structural transformation of the economies by the fostering of good governance, massive investments and enhancement of Community and national policies base on: - the improvement of the competitiveness of the economies ; - Strong and lasting growth which reduce poverty.

162.3. The UEMOA’s 2015 vision Faced with these challenges, the Heads of State and Government, through a solemn declaration entitled "Instilling a new dynamism in the regional integration process » made in January 2004 in Niamey committed the Union to speeding up the realisation of a unified common market in order to have a dynamic and competitive regional economy which successfully integrates itself into the African and global economies. The 2015 vision which emanates from this solemn declaration may be expressed as follows: « Making UEMOA a unified and open space for the benefit of a population which shows solidarity » The emergence of such a large, open and competitive economic pole is evident in: - a political zone characterized by its performances in the areas good governance,
democracy and dissemination of the best practices in financial management ; - a more integrated economic zone with increased trade among the various
countries and the development of many partnership networks among firms ; - a more balanced regional zone, thanks to the promotion of the development of
the Community’s territory in the public policies of member States and the development of Community solidarity ;
- a dense network of productive, competitive export-oriented SME’s and SMI’s run by a set of dynamic and modern entrepreneurs ;
- a veritable multidisciplinary academic community ; - a significant reduction in poverty and inequalities among countries, regions and
populations.
2.4. The strategy of making the vision a reality. The realisation of the vision by 2015 is based on a regional strategy to speed up growth and reduce poverty in line with the Millennium Development Goals and on the principle of subsidiariness. It is also based on a unified and open economic zone capable of boosting competitiveness, attracting investments, hence speeding up economic diversification. The strategy is designed around five strategic areas which determine the direction to be followed in selecting and fixing strategic objectives in pursuance of which will be identified the activities to be carried out in the five-year rolling programmes. STRATEGIC AREA 1: Consolidating good governance and enhancing economic integration with the final objective of fostering good political and economic governance and enhancing integration through the consolidation of the exercise of multilateral monitoring and the achievements of the customs union. This are a comprises four strategic objectives. Strategic objective 1: Enhancement of political and economic governance: the aim under this objective is to establish in the Union a political and economic good governance framework which is a prerequisite for the enhancement of integration, securitisation of investments and the Union’s successful integration into the global economy. Strategic objective 2: Enhancement of economic integration: This is the major objective of the REP. The actions envisaged under this objective are aimed at boosting economic stability by ensuring a better organisation of the convergence of national budgetary policies in order to make them compatible with the common
17monetary policy. Strategic objective 3: Enhancement of the integration of factor markets: the actions envisaged are aimed at improving at Community level the conditions of access to factors of production and fostering their mobility. Emphasis was thus place on the execution of actions aimed at developing micro credit and ensuring land reform. Strategic objective 4: Development of Community solidarity: the actions envisaged are aimed at establishing a new form of solidarity and social cohesion in disadvantaged, less developed areas or areas with serious geographical and/or natural constraints. STRATEGIC AREA 2: Development of economic infrastructure. Given the central role of economic infrastructure in achieving integration, the modernisation of infrastructure was considered as the backbone of the 2006-2010 programmes. Economic infrastructure is an essential lever for a strong economic growth capable of reducing poverty. This area has only one strategic objective. Strategic objective: Rehabilitation and modernisation of economic infrastructure. The realisation of this objective is designed around five components which are dealt with in Volume II. STRATEGIC AREA 3: Establishment of an integrated productive mechanism with the following strategic objectives: Strategic objective 1: Restructuring and updating of firms and promotion of the financing of SME’s/SMI’s. Strategic objective 2: Development and processing of natural resources in order to alleviate poverty. This objective is underscored by two programmes one of which presents the actions opted for under the Cotton agenda while the other is devoted to issues relating to the securitisation of the production and management of shared resources. STRATEGIC AREA 4: Development of human resources. This includes two strategic objectives: Strategic objective 1: Development of the quantitative level of health services. Strategic objective 2: Development of higher education systems. STRATEGIC AREA 5: Establishment of a partnership for the mobilisation of resources, execution and monitoring/evaluation. This area comprises two objectives: Strategic objective 1: Mobilisation of resources for the financing of the programme. Strategic objective 2: Drawing up of mechanisms for the execution and monitoring/evaluation of the programme. The five (5) areas of the REP are presented in greater detail in Volume II entitled « 2006-2010 Programme of Action ».
18With the REP, the Union is laying the foundation for a new manner of organising production, the movement of factors of production, goods, services and capital within the region, based on explicit strategies and operational modalities in order to attain the major objectives envisaged. The new organisation also adopts a coherent approach compatible with the objectives and demands of NEPAD in the areas of good governance and macro-economic management.
2.5. 2006-2010 Regional Economic Programme. The REP is designed to represent the Heads of State’s vision of the Union’s economic integration in conformity with the spirit and letter of the UEMOA Treaty. It is aimed at the enhancement of regional integration through the strengthening of the productive sector and basic social services in order to ensure the emergence of a competitive regional economy which generates economic growth and which integrates itself into the global economy in a harmonious manner. The major aspects of the Union’s 2015 vision are presented in volume II entitled « 2006-2010 Programme of action ». The REP is designed around a set of integration-enhancing projects selected at regional level on the basis of their catalytic effect in attaining UEMOA’s growth and development objectives. The projects selected concern the following sectors: transport, energy, information and communication technology, human resources, agriculture, industry and good economic and political governance. Finally, the REP is implemented by means of a five-year rolling programme which is updated each year. To ensure a perfect coherence with the other neighbouring socio-economic zones, the strategic objectives in the 2006-2010 Regional Economic Programme were drawn up taking into consideration the sectoral policies already adopted by the Union’s decision-making bodies, the Regional Poverty Reduction Strategy Document, National Poverty Reduction Strategy Documents, ECOWAS programmes, particularly with regard to economic infrastructure, CILSS policies particularly with regard to rural development and the environment and the short term plan of action of the NEPAD. A plan of action was drawn up for each strategic objective (cf. Volume II). There are two main types of action: investment measures and projects capable of serving as a lever for the enhancement of regional integration. A rolling programme makes it possible to update the actions selected on an annual basis. Taking into account the possibilities of postponement offered by this rolling programme, a selective approach was adopted based on caution and realism in determining the absorption level and capacity of the financing to be mobilised. This approach led to the definition of the following selection criteria: - the integration-enhancing nature of the projects (application of the principle of
« subsidiariness ») ; - the impact of the projects on the strategic area, taking into consideration their
maturity status and their feasibility during the period of the programme ; - the non availability of all or part of the financing for the project.
19A total of 63 integration-enhancing projects were selected on the basis of these criteria. They form the first generation of REP projects in the target areas.
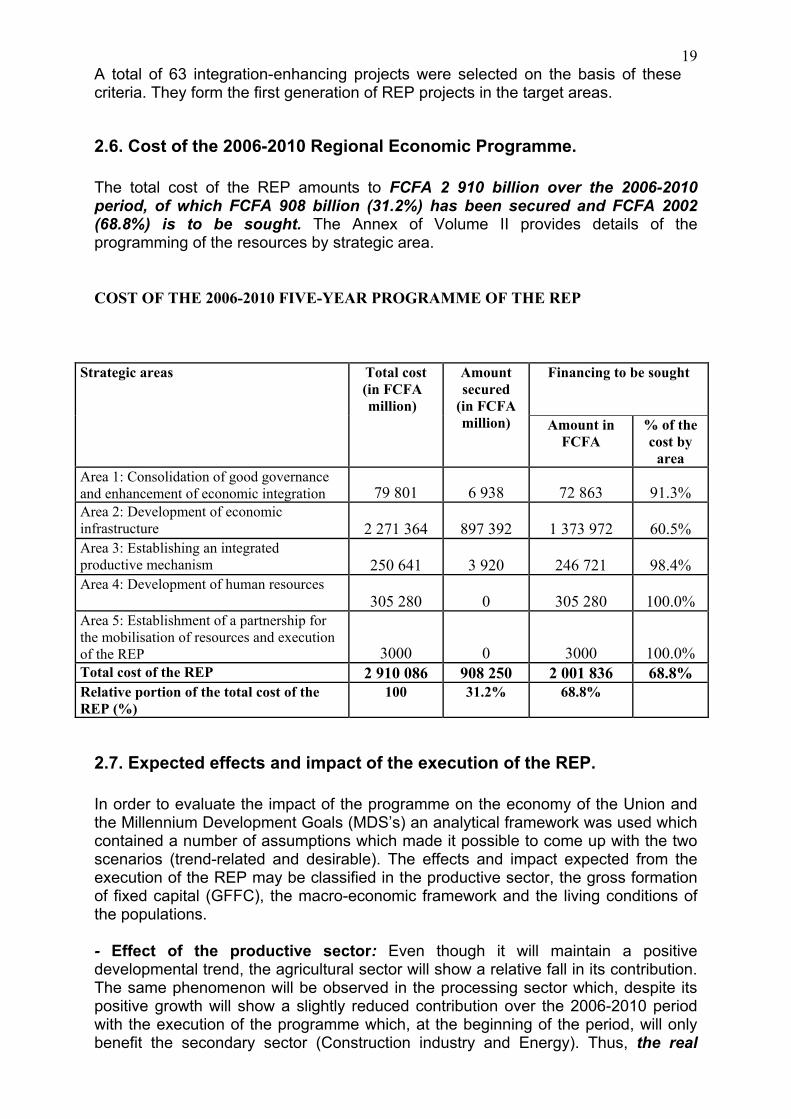
2.6. Cost of the 2006-2010 Regional Economic Programme. The total cost of the REP amounts to FCFA 2 910 billion over the 2006-2010 period, of which FCFA 908 billion (31.2%) has been secured and FCFA 2002 (68.8%) is to be sought. The Annex of Volume II provides details of the programming of the resources by strategic area.
COST OF THE 2006-2010 FIVE-YEAR PROGRAMME OF THE REP
Financing to be sought Strategic areas Total cost (in FCFA million)
Amount secured
(in FCFA million) Amount in
FCFA % of the cost by
area Area 1: Consolidation of good governance and enhancement of economic integration 79 801 6 938 72 863 91.3% Area 2: Development of economic infrastructure 2 271 364 897 392 1 373 972 60.5% Area 3: Establishing an integrated productive mechanism 250 641 3 920 246 721 98.4% Area 4: Development of human resources
305 280 0 305 280 100.0% Area 5: Establishment of a partnership for the mobilisation of resources and execution of the REP 3000 0 3000 100.0% Total cost of the REP 2 910 086 908 250 2 001 836 68.8% Relative portion of the total cost of the REP (%)
100 31.2% 68.8%
2.7. Expected effects and impact of the execution of the REP. In order to evaluate the impact of the programme on the economy of the Union and the Millennium Development Goals (MDS’s) an analytical framework was used which contained a number of assumptions which made it possible to come up with the two scenarios (trend-related and desirable). The effects and impact expected from the execution of the REP may be classified in the productive sector, the gross formation of fixed capital (GFFC), the macro-economic framework and the living conditions of the populations. - Effect of the productive sector: Even though it will maintain a positive developmental trend, the agricultural sector will show a relative fall in its contribution. The same phenomenon will be observed in the processing sector which, despite its positive growth will show a slightly reduced contribution over the 2006-2010 period with the execution of the programme which, at the beginning of the period, will only benefit the secondary sector (Construction industry and Energy). Thus, the real

20growth rates of the primary, secondary and tertiary sectors would be respectively 6%, 9% and 5% on the average between 2006 and 2010. - Effect on the gross formation of fixed capital (economic and social infrastructure) : the execution of the programme will result in an increase in the demand for public investments with a high gross fixed capital formation content within the context of gradually easing of the foreign debt burden of the countries backed by reforms, the member States would be in a position to restore their financing and debt capacities in order to embark on fresh investments. The investment rate, driven mainly by public investments, would increase from 15.1% in 2005 to 23.6% in 2010 in the case of the desirable scenario compared to 15.1% in 2005 and 14.6% in 2010 in the case of the trend related scenario. - Effect on the macro-economic framework: the realisation of the 2006-2010 programme of action of the REP would make it possible to record a gain in growth estimated at 1.2 percentage points per annum on the average, or an annual average of 4.68% without the REP and 5.86% with the REP over the 2006-2010 period. Through its contribution in terms of gross fixed capital formation (GFCF), the programme generates a regional effect which makes it possible to enhance the quality of economic performance in the member countries. Its impact will be actually felt only as from 2010, after investments and the expected improvement of the overall productivity of factors. The growth rate expected from the execution of the 2006-2010 five year-programme of action will increase from 3.6% in 2005 to 7.1% in 2010 compared to 3.6% in 2005 and 5.3% in 2010 in the case of the trend-related scenario (without the REP). The containment of public expenditure in an environment of compliance with the convergence criteria and of improvement in public revenue excluding grants would make it possible to expect a net improvement in the total balance excluding grants as a percentage of GDP, which would increase from -5% in 2005 to-1.4% in 2010. Fiscal pressure would increase by roughly one (1) percentage point from 16.6% in 2006, to 17.4% in 2010. The outstanding debt compared to the GDP will record a net improvement from 65% in 2005 to 39% in 2010. This satisfactory trend of the economy of the UEMOA zone is also reflected in a good performance of convergence indicators with the execution of the programme. Indeed, in terms of the first tier indicators, the basic budgetary balance without HIPC as a percentage of GDP for all UEMOA countries would increase from -0.4% in 2005 to 2.0% in 2010. However, with regard to the current foreign deficit excluding grants as a percentage of GDP, there will be a deterioration of the balance of trade and an improvement of the current balance as a percentage of GDP which would increase from -4.3% in 2005 to -1.0% in 2010. Likewise, the programme would have a positive impact on intra UEMOA trade which would increase from 12% in 2005 to 13 % in 2010. The inflation rate would be contained below 3% over the entire period of the programme. - Effect on the improvement of the living conditions of the populations : in terms of direct effects associated with the provision of the investments of the programme, the induced demand converted into activities would be equal to 53 817 direct jobs over the 2006-2010 period, or 10 763 jobs per annum on the average. This, thus REP is a programme that will generate indispensable income within the context of poverty alleviation.
21The REP would also have a positive indirect impact on poverty and on the living conditions of the populations, provided the social indicators are elastic compared to public social expenditure. In terms of the attainment of the Millennium Development Goals, particularly within the scope of the elimination of extreme poverty and hunger, a significant improvement in the level of poverty is expected in the Union based on the estimates made. The impact of poverty would decrease from 43.4% in 2005 to less than 31.4% in 2010, before attaining a level of 13.3% of poor people in the Union in 2015. The execution of the REP would thus reduce by more than half the impact of poverty over the 2006-2015 period, thus making it possible to attain one of the major objectives of the Millennium Development Goals. In the education sector, the gross school attendance rate expected fro the execution of the programme would increase from 73.0% in 2005 to 87.1% in 2010. The adult illiteracy rate would fall significantly from 62.0% in 2005 to 49.8% in 2010. The impact of the programme on the education of girls would then remain highly appreciable compared to the trend. The gross rate of education of girls would increase from 43% in 2005 to 50% in 2010, attaining a record level of parity in the first five years of execution of the REP. In the health sector, over the 2006-2010 period, the fall in the infant mortality rate will remain significant, decreasing from 103 per thousand in 2005 to 64.7 per thousand in 2010. Unfortunately, even at this rate, the objective will not be attained in 2015. The execution of the programme should make it possible to maintain the HIV/AIDS prevalence rate below 3% (4.3% in 2005 and 2.2% in 2010) as from 2010, compared to 4% in 2005 for the UEMOA as a whole without the REP. Life expectancy at birth would increase from 48 years in 2005 to 51.4 years in 2010. The detailed analysis of the direct and indirect effects expected from the execution of the REP is presented in Volume III entitled « Macro economic framework ». On the whole, the analysis shows that the REP is an important lever for the creation of positive externalities in favour of a strong and inclusive growth, of which the full measure of all the impacts will be known only in the long term. The REP portrays itself as a veritable instrument for the realisation of the vision of the UEMOA and an essential element with which to start implementing the NEPAD.
III. PARTNERSHIP BETWEEN THE UEMOA AND DONORS FOR THE EXECUTION OF THE PROGRAMME.
The Regional Economic Programme will remain a dead letter as long as the modalities for its execution and monitoring/evaluation are not included in a sufficiently operation intervention framework with clearly defined mechanisms. To this end, the execution of the REP should be guided by three principles: - Acceptance: the various players (member States, regional institutions, civil society, private sector, development partners) should accept the REP within the scope of an internalisation process. In particular, the member States, as the major beneficiaries, should assume full responsibility during the execution stage;
- participation : from the outset, all the players (regional institutions, member States, donors, private sector) were involved by means of widely publicised information and explanatory campaigns concerning the REP. They will also be called upon during the seeking of funds and at the time of execution of this programme in order to attain the objectives in the setting of which they were involved;

22
- transparency and efficiency : the mobilisation of the resources necessary for the financing of the REP calls for the definition of management norms which fall within the perspective of the enhancement of good governance which is the guarantee for increased mobilisation of resources. Indeed, foreign partners will not support the Union in executing the programme as long as they do not have the assurance that their financial resources are being managed and used in a transparent manner. The success of the REP also depends on the coherence which must exist between it and the programmes of the other regional organisations. The importance of ensuring coherence call on the one hand for the establishment of a global partnership framework with all donors which have a regional approach in order to co-ordinate assistance, and, on the other hand for the establishment of an operational mechanism for execution and monitoring/evaluation which involves all stakeholders in the programme (regional institutions, member States, development partners, private sector and civil society).
3.1. Resource mobilisation strategy for the financing of the programme The resource mobilisation strategy to be used for the financing of the REP comprises two components (internal resources and external resources); each tailored to the nature of the resources to be sought to match the applications envisaged as well as the potential sources of financing.
3.1.1. Internal resource mobilisation strategy UEMOA member States and their Community institutions adopted the fundamental principle of giving priority to the mobilisation of resources from the States and from the Institutions of the Union. The implementation of this principle will be the manifestation of the determination of UEMOA States and institutions and ECOWAS (EBID) to participate in the financing and public commercial projects with their own resources. The implementation of this principle should thus create a leverage effect for the mobilisation of additional external financial resources from the international Community and whip up private sector interest in the execution of the REP. It will further facilitate the acceptance of development partners and other donors to finance the programme. The internal resources to be mobilised will come from various sources including, in particular : i) the Union’s own budgetary resources (budget of the member States and the UEMOA Commission through the Regional Integration Support Fund (FAIR) ; ii) borrowed resources (BOAD and the regional financial and banking systems).
a. Budgetary resources of the States
Within the framework of their financial programming and in conformity with the inclusion of the projects of the REP in public investment programmes (PIP) approved within the scope of their current economic programmes, UEMOA member States utilise budgetary resources in national counterpart financing for which they are responsible. For any project to be included in the REP it must be included in the PIP.
23Upon examining the situation of the REP projects included in the PIP’s, it was found out that the budgetary resources necessary for financing them (counterpart funds to be provided by the States) from 2006 to 2010 amounted to roughly FCFA 350 billion. This amount is perfectly within the means of UEMOA member States and matches their financial programming for the coming years. In fact, according to the projections made in the semi-annual report on the execution of the Multilateral Surveillance of December 2005, the ratio of investments financed with internal resources to tax revenue was 22.4% on the average for the 2006-2010 period as compared to a percentage close to 18.5% recorded over the past five years. This projection corresponds, in terms of tax resources to be allocated to the investments to be made in the next five years, to an amount of roughly FCFA 2 800 billion.
b. The UEMOA Commission : FAIR The Regional Integration Assistance Fund (FAIR), the first structural fund established by the UEMOA Commission, is an instrument of solidarity meant essentially for the financing of the balanced development of the Community’s territory by contributing towards reducing regional disparities. The FAIR is replenished annually at the time of allocating Community Solidarity Levy resources (PCS) by the Council of Ministers of the Union and other resources mobilised by the Community from its development partners.
It is important to recall that through the Community Solidarity Levy mechanism established by Article 16 of Additional Act n° 04/96 of 10 May 1996 instituting transitional preferential trade tariff scheme in the Union and defining its method of financing, the UEMOA Commission has been mobilising internal resources meant for the financing of its activities and the activities of the other organs of the Union.
Out of concern to ensure sustainable financing for the integration process, mainly through own resources and also at the same time taking into consideration the available resources and the resources necessary to guarantee the execution of the programme of activities of the Union, the Authority of Heads of State and Government, by Additional Act n° 07/99 of 08 December 1999, raised from 0.50 to 1% the rate of the Community Solidarity Levy which is the Union’s only own resource since July 1996. In order to utilise its resources, the Regional Integration Support Fund (FAIR) draws up a five-or-three-year programme (updated each year) which is approved by the Council of Ministers. With regard to the financing of national projects included in its 2004-2006 programme of intervention, the resources of the FAIR are used to produce a leverage effect by subsidising interest payments in respect of loans and paying national counterpart funds of loans contracted by the States from BOAD. Through this mechanism of co-financing with partners, the FAIR will fully play its leverage effect role by boosting the capacities of donors, particularly, BOAD, and facilitating resource mobilisation.

24 In this regard, the FAIR is a receptacle for resources which match its interventions and which development partners could place at its disposal in order to boost the synergy henceforth existing between the FAIR, BOAD and the other donors.
c. BOAD BOAD, the financial arm of the UEMOA has in the course of its 33 years of activity acquired a real capacity for mobilising internal and external resources. In conformity with its strategic orientation, the Bank has gradually developed its activities by contributing towards the growth of the investment rate of the Union, diversifying of production and speeding up economic growth. BOAD finances the commercial and non-commercial sectors. In its financing transaction, the banking component of its activities is responsible for commercial sector transactions (the private sector in the strict sense and the public commercial sector) whereas its Fund for Development and Cohesion (FDC) which was established in July 2002 by the Bank’s decision-making bodies is the means whereby grants and concessional loans meant for the financing of non-commercial sector projects are mobilised. Considering the past achievements of the FDC and the other forms of financing made available each year to the non commercial sector and to economic infrastructure (between FCFA 50 and 60 billion), it could be expected that without taking into account the fresh resources which could be mobilised, funds amounting to at least FCFA 40 billion yearly would be made available for the execution of the REP, which would represent a total of FCFA 200 billion for the 2006-2010 programme. Such funds could help in executing 29% of non-commercial sector projects and 48% of commercial sector projects.
d. The regional banking and financial system The funds traditionally mobilised from the banking system could also be used for profitable projects for which such financing is appropriate. The UEMOA financial market for its part has a lot of liquidity the mobilisation of which is desirable for the execution of the REP. For productive projects or commercial infrastructure projects capable of generating recurrent income (toll roads, railways, airports, etc.), the resources of the regional financial market are an additional source of financing after financing by the banks and self-financing. The development of debenture loan activities by public commercial sector firms or private firms (particularly former public corporations which have been privatised) which is a current feature on the regional financial market is an encouraging illustration of the possibilities for mobilising resources on the market. Furthermore, like the EIB initiative with regard to the financing of European infrastructural projects, securitisation could be promoted by BOAD on the UEMOA regional financial market. This could give rise to opportunities for partnership between regional financial investors and foreign investors on the one hand and public/private sector partnership opportunities on the other hand. The development of other innovative instruments such as the creation of a financial mortgage market with the various tools and structures of financing (securitisation of

25assets, regional refinancing bank, etc …), is currently being examined within the framework of a Steering Committee (BOAD, CREMPF, BCEAO). The institution of such instruments will make it possible for the financial market to offer more financing possibilities to profitable projects. Finally, mention should be made of the important UEMOA Financial Market Development Project (FDMF) which is being executed and which has the ambition of improving, through foreign technical assistance, the regulatory framework and making the movement of goods in the Union freer by means of a line of credit meant for the financing of inter-State road infrastructure projects which are included in the REP. The UEMOA Financial Market Development Project also has a third innovative component for the UEMOA which concerns an offer of guarantee facilities. This new instrument combines the commercial and non-commercial risk guarantees offered by the IDA, MIGA and AFD. As such, it is a veritable strategic lever for the promotion of public/private sector partnership for the realisation of economic infrastructure in the Union. The objective of the whole project is thus to improve the efficiency of the regional financial market, to securitize investments made in the Union and attract direct foreign investments. It is therefore an important instrument of financing for the execution of the projects included in the REP. In the sub-region, several specialised guarantee funds are active and contribute towards the facilitation of the mobilisation of borrowed resources which are required for the financing of productive projects and commercial infrastructural projects. These are, in particular, the GARI Fund, FAGACE, FSA and FEGECE. These structures are appreciable instruments of financing because of the guarantees they offer for the mobilisation of the resources necessary for the execution of projects eligible for their assistance. They and the donors particularly BOAD, have developed a synergy of action. Besides these traditional guarantee instruments, a new set of guarantee products are being promoted within the UEMOA, within the framework of the above-mentioned facility.
3.1.2. External resource mobilisation strategy External resources are made up mainly of technical and financial assistance from bilateral and multilateral partners and from the international financial market. These are: grants and concessional and non-concessional borrowed resources.
a. The major determining factors of the strategy In addition to the priority given to internal resource, the mobilisation of external resources calls for a co-ordinated approach to donors by the institutions of the Union. To this end, UEMOA member States and their Community institutions have adopted an external resource mobilisation strategy for the financing of the REP which is based on three (03) simple fundamental principles. The choice of these principles is guided by the concern for coherence with on-going or planned economic reforms, economic integration objectives, the development of existing regional resource mobilisation mechanisms and development financing.

26It is also motivated by the need to offer development partners flexibility without prejudice to the efficiency and transparency necessary for the management of their financial co-operation with the member States and their Community institutions. The principles are the following: recourse to grants and concessional resources, the need for co-ordination of the regional resource mobilisation mechanism, the links between the REP and the programme of development partners
- Recourse to grants and concessional resources Recourse to grants and concessional resources is the preferred method of external financing in order to limit the foreign indebtedness of member States and take into consideration the constraints of sustainability of debt with which they are confronted. In fact, five of the eight UEMOA countries have attained the point of completion under the HIPC initiative. In order to enhance the sustainability of their debt, these countries are compelled to limit their indebtness, which makes it obligatory for them to have access only to grants or highly concessional resources.
- The need for coordination of the regional resource mobilisation mechanism
The UEMOA proposes to donors’ appropriate receptacles and financial intermediaries capable of ensuring good coordination in resource mobilisation and proper utilisation of these resources according to their nature. As such, the institutions of the Union have adopted for these receptacles a coordinated approach by developing a complementariness and synergy in their resource mobilisation and financing activities. The mechanisms of the BOAD Group (especially the FDC), the UEMOA Commission (FAIR) and member States’ structures are to be used. This approach which develops the existing national and regional mechanisms is dictated by the concern to offer donors, without prejudice to the requisite transparency and efficiency, the flexibility necessary for mobilising the various forms of financial assistance they plan to give to the Union for the execution of the REP. The donors would thus be able to position their financing in relation to the various receptacles offered to them by the Union. This approach will also make it possible to harmonise methods and ensure the coherence of the set objectives.
- The links between the REP and the programmes of development partners
In order to ensure greater efficiency, the establishment of operational links between the REP and the programmes of the various development partners will be promoted as the preferred method of cooperation of donors under the REP. This pre-supposes the establishment of partnerships which favour financing from several sources to several beneficiaries, like the UEMOA Financial Market Development Project (PDMF) of the UEMOA. In this connection, several partners contacted have already expressed their preparedness to take into consideration the strategic choices and the REP activities they plan to support when programming their future financial co-operation with the countries of the Union. Among the international financial institutions one can mention the World Bank, the European Commission, the African development Bank and among donor countries, these are France, the Kingdom of Belgium, Germany, the European Nordic Countries, Canada, Japan, China and India. UEMOA member States call on regional organisations like the European Union, international institutions which have

27instruments or regional finance funds meant for economic integration to utilise the existing UEMOA regional mechanisms as financial intermediaries for a portion of the resources of their programmes. These intermediaries will be used according to the nature of the resources and their capacity of mobilising the types of financing offered by the foreign partners.
b. Regional resource mobilisation mechanisms The above-mentioned fundamental principles determine the external resource mobilisation strategy. These principles should make it possible for development partners, within the framework of their financial co-operation with the member States, the UEMOA’s institutions and Community organs to organise to the best of their abilities the manner in which they provide their financial assistance to be mobilised for the financing of the REP. The mechanism existing at national and regional levels (BOAD Group and FAIR) are the natural channels for the mobilisation of resources for the execution of the REP.
With regard to regional mechanisms and in conformity with the respective specific objectives assigned to them by the Council of Ministers of the Union, the BOAD Group and the UEMOA Commission have appropriate mechanisms which serve as channels for the mobilisation and co-ordination of Public Development Aid (PDA) resources earmarked for the financing of the execution of various projects, including REP projects.
Special attention should be paid to the resources necessary for the financing of the REP, taking into consideration the synergy developed between the resource mobilisation and allocation mechanisms existing in the Union. To this end, the resources of the FAIR are used and will continue to be used as a leverage effect for the financing of the projects of the non-commercial sector, particularly by means of the subsidy of certain loans granted by BOAD and other donors and through the settlement of the counterpart funds payable by member States of the Union. This approach, which is used within the framework of the execution of the Minimum Programme of the FAIR, will be applied to the financing of the projects included both in the REP and in the Programme of Activities of the FAIR.
With specific regard to the BOAD Group which is the major regional financial tool of the UEMOA, it has in its basic texts and resources, the required capacity to carry out financial intermediation on a regional scale making it possible for it to mobilise both internal and external resources for the financing of the REP.
Indeed, with time, BOAD has acquired experience, know-how and expertise in financial intermediation (resource mobilisation and financing) and in the execution of projects particularly regional projects. It is a real engine of regional development which adds value to the efforts of member States of the Union in the fields of resource mobilisation and implementing of economic reforms and programmes. In view of this, BOAD was designated as the lead bank for the preparation of the donor’s conference on the REP.
The authorised capital of BOAD was doubled to FCFA 700 billion in July 2004 by a decision of the Council of Ministers of the Union. This decision mainly aims at enhancing the debt capacity and diversifying the shareholding structure of the institution with a view to ensuring an increase in the mobilisation of external resources. Following the establishment of the regional mechanism by the Articles of Association of the Bank, UEMOA member States guarantee, by means of its callable capital which increased from FCFA 200 billion to FCFA 512 billion, the loans taken by BOAD as part of its financial intermediation activities for the financing of investments in all UEMOA countries.
28 The credibility enjoyed by BOAD vis-à-vis its member States, local economic operators and external partners make the Bank a financial intermediary capable of attracting resources towards the economies of the Union and assisting to ensure a better co-ordination public development assistance for the benefit of member States of the Union. In addition to its own resources, BOAD mobilised FCFA 511 billion in the form of: internal borrowing (FCFA 203 billion), external borrowings (FCFA 255 billion) and grants from external partners (FCFA 53 billion). All these resources enabled BOAD to inject into the economies of the Union FCFA 923 billion which helped in attracting to the Union an amount of FCFA 2 200 billion in the form of co-financing with external partners for the execution of an investment programme of FCFA 3 500 billion (duty free).
BOAD intervenes in resource mobilisation by positioning its Fund for Development and Cohesion (FDC) as a regional mechanism for receiving financial assistance from development partners with a view to financing productive investment projects and economic and social infrastructure. The FDC is a means designed to ensure transparency in financial resource mobilisation and its appropriate allocation according to the nature of applications to be financed. Furthermore, in order to complete its action and provide more support for the development guidelines and priorities defined by its member States, BOAD, in collaboration with its partners established specialised financial structures. These are: - Cauris Investment PLC, a risk capital firm created in January 1995, the objective
of which is to provide the shortfall in equity capital for firms for the financing of profitable activities ; since 2005 its activities have been taken a step further by CAURIS-CROISSANCE ;
- the Guarantee Fund for Private Investments in West Africa « GARI Fund »
created in January 1995, which is managed by BOAD. The Fund offers guarantees to banks and financial institutions which the banks could resort to in order to finance firms in ECOWAS countries;
- West African Investment Fund (FOAI) and the West African Assets
Management Company (SOAGA) which were created in October 2002. The FOAI is managed by SOAGA.
Furthermore, within the framework of agreements signed by BOAD and the Swiss Federal Government, the Swiss Fund utilisation project was established in 1995 to serve as the focal point for the implementation of Swiss financial assistance for the development of micro credit and institutional support for the grassroots organisations in UEMOA countries. On the whole, the UEMOA offers its foreign partners through the BOAD Group and FAIR, a privileged framework and a tried and tested financial intermediary for the mobilisation of the resources necessary for the execution of the REP.
29c. Promotion of innovative resource mobilisation mechanisms
Considering the new tool for public development assistance mobilisation which was launched in 2005 by the United Kingdom and referred to as «International Financial Facility», a fund for the securitisation of future public development assistance resources expected from development partners could be promoted by the UEMOA. The resources of such a Fund which initially would be made up of borrowings would be utilised for the financing of the projects of the regional economic programme (REP). The mobilised aid resources would be used to finance the projects of the regional economic programme. The mobilised aid resources would subsequently be earmarked for the repayment of loans received. With regard to resource mobilisation for the financing of the REP, the envisaged economic infrastructure projects could also benefit from this new source of financing depending on the ability of their promoter to access the regional financial market. Furthermore, some financial innovations which are being promoted by various regional financial market players (BOAD, CREMPF, BCEAO) could also make it possible to mobilise resources for the financing of the REP. These include the securitization of the expected financial flows with a view to mobilising repayable resources, which is now a current practice on the international financial market and which could be developed by the UEMOA within the framework of the diversification of its financial market. The mobilisation of resources for the execution of the REP demands more than ever from the member States a spirit of shared solidarity in order to infuse the regional economy with the dynamism required in order to fully capitalize on the complementariness effects and the realisation of integration-enhancing investments which bring the economies together and enhance their competitiveness.
3.2. Mechanism of execution and monitoring/evaluation Drawing inspiration from the existing mechanisms for the execution and monitoring of UEMOA regional programme, particularly the Community Road Infrastructure and Transport Action Programme (PACITR), the mechanism for the execution and monitoring/evaluation of the REP requires the creation of a consultative, co-ordination and monitoring framework which clearly spells out the roles of the various local and foreign players. These players include on the one hand, Community institutions, namely, the UEMOA Commission, BOAD, BCEAO, UEMOA member States and on the other hand, bilateral and multilateral development partners as well as private sector operators. Thus, the execution framework will be supported by the players in different ways depending on whether a project is strictly that of one or several States of the Union. The monitoring/evaluation framework for its part will mainly concentrate on the existing institutional mechanism, namely, the Steering Committee, the REP Management Unit (CG/PER) and the UEMOA Council of Ministers.
303.2.1. The execution framework Generally, the REP projects could be executed by resorting to executing agencies, including BOAD. By way of illustration, in the case of road works, a co-ordination committee bringing together the various States concerned will be set up which will be chaired by the Community institutions to ensure co-ordinated action in seeking funds and harmony in the programming and in the characteristics of the infrastructure. In the case of each road segment and permanent structure targeted, the States, represented by their Ministries responsible for roads will be the project owners. The executing agencies will be the directorates or structures responsible for road maintenance in the countries concerned. Works supervision and control will be entrusted to specialised engineering firms following international tenders and the works will be executed by firms following international tenders. Likewise, for the construction of adjacent checkpoints for instance, a Committee comprising the two States concerned and the UEMOA Commission will be set up to steer the project. The Project Management Consultant will be the UEMOA Commission works supervision and monitoring will be entrusted to a specialised engineering firm following an international tender and the works will be executed by a contractor following an international tender.
a. UEMOA member States The execution of the REP lies within the purview of the member States with support from Community institutions. The member States are thus the major players and beneficiaries of the Programme. It is therefore necessary to ensure a permanent interaction between the REP and the Public Investment Programme (PIP) of each State which is one of the essential criteria for the selection of projects. Taking projects into consideration in the PIP makes it possible to raise the REP to national priority status and enhance the acceptance of the regional integration process by national Authorities. At the operational level, since the REP is a multisectoral programme each State should create an Inter-Ministerial Committee based essentially on the competent technical structures responsible for the execution of projects. The composition and duties of this Committee could be determined by the REP Steering Committee in collaboration with the Member States of these structures could be entrusted to the National Economic Policy Committee (CNPE) which takes over the work of the UEMOA Commission in the member States. The REP will be executed basically using the on-going and future programmes which will be steered by the departments of each sector ministry. In line with the priority given to the execution of the REP by the highest authorities of the Union, member States investment policies should be geared towards the regional projects selected for the programme. To this end, adequate budgetary provisions should be made for the sectors covered by the REP.
b. The Steering Committee of the REP The Steering Committee of the REP which was created by Decision N° 878/2004/P.COM/UEMOA is composed of representatives of the UEMOA
31Commission, BOAD and BCEAO. It is chaired by the UEMOA Commission. Member States’ representatives and development partners may participate in its meetings in an advisory capacity if necessary. The Steering Committee is responsible for the monitoring and evaluation of the REP. In this connection:
proposes to the Council of Ministers of UEMOA the annual updating of the REP. This activity should be executed in October of each year to allow for time for the preparation of the following year’s budget in the member States;
prepares semi-annual and annual reports on the progress of the REP;
prepares and statement of the financing secured and the financing to be
mobilised;
makes recommendations aimed at ensuring maximum financing for the projects to be executed;
prepares a work programme and corresponding budget to be submitted to the
three institutions for approval and inclusion in their budget programming;
sees to the smooth implementation of educational campaigns for the States (General Administration, public institutions, etc…) the private sector, the civil society and development partners;
sees to the integration of the REP in Public Investments Programmes and in
member States’ Poverty Reduction Strategy Documents;
ascertains that the actions taken within the framework of the REP are in harmony with those of the other regional programmes, particularly, NEPAD.
The Steering Committee holds at least two ordinary sessions yearly when convened by its Chairman. The first session is held in April and the second in October each year. The Steering Committee of the REP is assisted by the REP Management Unit which does its secretarial work and is aided by the competent national structures designated by the member States in the monitoring and evaluation of the REP. It may have recourse to any other persons or structures in discharging its tasks. This Steering Committee should at the end of the donors’ conference be replaced by a wider Committee including the representatives of all the players concerned by the execution of the REP, particularly the representatives of member States and development partners, the regional consular chamber, the private sector, etc…
c. The REP Management Unit The REP Management Unit was created by Decision N° 879/2004/P.COM/UEMOA. It assists the Steering Committee in monitoring and evaluation of the REP, and is responsible mainly for:
making proposals concerning the annual updating of the REP;
doing the secretarial work of the REP on a permanent basis, its major tasks being:

32
making preparations for the meetings of the Steering Committee;
the preparation of preliminary drafts of the semi-annual and annual reports on the status of execution of the REP;
Keeping and filing of correspondence and reports of meetings relating to
the execution of the REP. To ensure complementariness and synergy between projects on the one hand and between countries on the other hand, the intervention strategy of the REP Management Unit must strive to achieve an effective combination of means and resources with a view to optimising results. To this end, the intervention of the REP Management Unit could be designed around the following organisations:
sectoral sub-commissions dealing with the central activity of linking the REP to national strategies for monitoring the mobilisation and absorption of resources in which the various players concerned will participate, including development partners;
country representatives in the technical structures concerned, who are
responsible for the execution of the Programme. Recourse to consultants from time to time according to the principle of commissioning under the supervision of the Unit will make it possible to carry out the activities identified.
d. The private sector The regional and the extra-regional private sector should be an essential component of the mechanism for the execution of the projects selected in the REP which relate to commercial activities (creation of a sub-regional airline company, interconnection of priority electric grids, high-performance intra-Community telecommunications network, promotion NICT, implementation of the cotton agenda, etc...). In order to ensure a strong involvement of this sector, a widely publicised information campaign should accompany the conference of donors to the REP and the sector should be associated with the campaign. Following upon the donors information campaign, project profiles concerning this sector should be disseminated in order to attract potential investors. At Community level, the regional consular chamber should be deeply involved, within the framework of a dialogue which would come up with the expectations of the various stakeholders with a view to initiating the measures necessary to encourage the mobilisation of this sector. At the level of the States, contacts will be given pride of place and will be made through the partnerships existing among Chambers of Commerce and some foreign investors, following consultations on the sector organised everywhere in the member States.

333.2.2. Monitoring/evaluation mechanism The REP monitoring/evaluation mechanism is one from which decisions emanate. In this regard, it is responsible particularly for the following tasks:
appreciating the orientations and the frequency of drawing up and adjusting the programme of actions;
examining the results of meetings to draw up and readjust the programme of
action;
examining and approving the periodic reports on the execution of the REP;
recommending general or specific studies required in order to make the programme of action more detailed and ensure the maturing of the projects;
examining and approving the system of monitoring and evaluating the
Programmes;
proposing objective contracts with development partners and private sector operators to ensure that the Programme has a better impact.
The mechanism should be designed around the following decision-making bodies :
The UEMOA Council of Ministers; The REP Steering Committee; The REP Management Unit; The representations in member States of the Union/
The UEMOA Council of Ministers is the decision-making body in terms of the monitoring/evaluation and execution of the Programme. In this regard, it is the recipient of the periodic reports monitoring the execution, and evaluating the impact of the Programme. It approves the strategic orientations proposed by the Steering Committee and the annual updating of the Programme. The Steering Committee is responsible for the monitoring and evaluation of the REP. As such, its mission is to contribute generally toward seeking appropriate solutions to the problems inherent in the execution of the programme, play the role of moderator and define appropriate measures in order to remove the constraints encountered in executing the Programme. The REP Management Unit is the keystone of the mechanism for the monitoring and evaluation of the Programme. It is responsible on the one hand for appreciating the sectoral programmes and the monitoring and evaluation system and, on the other hand, for preparing reports on the execution of the programme of action. It is the place where measures are taken to increase incentives and promote the projects selected under the Programme with a view to making relevant proposals concerning the updating of the Programme and also ensures that sectoral policies are in harmony with the REP. As such, the following objectives will guide the intervention strategy of the REP Management Unit:

34(i) monitoring of the progress of the execution of the Programme ; (ii) evaluating of the effects and impact of the Programme by monitoring the
intermediate indicators and the results ;
(iii) monitoring and evaluation of financial execution ;
(iv) establishment of an information system. Within this framework, a detailed manual concerning the functioning of the monitoring/evaluation mechanism should be drawn up by the REP Management Unit with a precise list of monitoring indicators and other data to be fed into the REP information system. In the member States, the competent national structures are the national intermediaries of the mechanism. They will provide specific country data which will make it possible for regional players to react on the basis of precise and sufficiently detailed information. These bodies will be supported by an inter-ministerial technical committee responsible for the execution of the Programme and the National Economic Policy Committees. Out of concern to involved all the players in the monitoring and evaluation of the Programme, the mechanism could be extended to donors and sub-regional organisations which will participate in the financing of the REP, within a consultational framework. Community institutions (UEMOA Commission, BCEAO and BOAD): the Community institutions are under the obligation to produce results in executing and monitoring the REP, because of its regional nature. Since the execution of projects on the field lies essentially within the purview of the States, Community institutions will play the role of prime movers, facilitators and co-ordinators. In this regard, their main contribution will concern the establishment of an institutional framework on the one hand and, on the other hand, the carrying out of co-ordination activities in order to regulate the efforts of the States in collectively speeding up execution and the search for financing. Thus, the UEMOA Commission will play the role of inter-state groups working on various components of the Programme as well as workshops to share experiences on the technical themes which will ensure more synergy among the various national officials and experts from the sectoral departments of the UEMOA Commission. Moreover, the various departments of the Commission on which the sectors of intervention of the REP depend will support the execution of the Programme according to their various duties. BOAD as leader of the donors for the financing of the REP, is the institution responsible for the financing of the balanced development promotion of the economic integration of UEMOA member States. It will support the execution of the Programme by ensuring the co-ordination of the interventions of donors within the framework of the Programme. This consultational framework is a framework for the assessment of the results obtained and for mobilisation of resources. Its duties will be to evaluate and propose measures likely to improve consultation and dialogue between countries of the Union
35and their partners. As such, it should suggestions to member countries of the Union aimed at improving their performances in terms of execution of the Programme.

REP EXECUTION FRAMEWORK
UEMOA Council of Ministers
Steering Committee (UEMOA Commission, BOAD,
BCEAO, Representatives of States, Donors and private sector)
REP Management Unit
Monitoring/Evaluation, Information and Communication
Monitoring of mobilisation and absorption of resources
Programming and budgeting
Reports
Monitoring and evaluation
Reports
Approval of Reports
Decisions of orientation and recommendations
(NEPC) National Economic Policy Committee
States (Inter ministerial Committee)
National and international private sector
Strategic level
Operational Level
37
IV. POTENTIONAL RISKS ASSOCIATED WITH THE EXECUTION OF THE PROGRAMME
The execution of the programme pre-supposes the non-competitiveness of a number of factors which could jeopardize its smooth execution, hence constituting potential risks. These risks concern the persistence of socio-political conflicts in the sub-region, the weakness of project execution capacities of the States and the insufficient of the mobilisation of funds for the execution of the Programme. Political risk: the results of several theoretical and empirical studies on private investment show that political risk is one of the foremost preoccupations of private investors, particularly foreigners, on African markets. A minimum of political stability and security is required in any country for the efforts to attract private investment, particularly foreign, to bear fruits. However, several UEMOA countries are experiencing a situation of social tension or more or less pronounced internal strife, or are emerging from such a situation. Besides, the human cost which is often dramatic, these conflicts also have a high cost in terms of economic performance and demotivation of investors. The simulated results of the execution of the REP over the 2006-2010 period pre-suppose that the economy of the UEMOA zone should not experience any upheavals as a result of internal tensions which are likely to attenuate the impact of the programme significantly. The results of the projection show that if the Ivorian conflict is not finally resolved, the investments concerning that country will not be realised and that will directly reduce the average growth in 2010 to 4.1% compared to 5.25% under the assumption that the conflict is resolved. In addition to this direct negative effect, the cross effects will be recorded as a result of the shrinking of the market because of the significant weight of Côte d’Ivoire which would discourage some investors. The efforts being made at sub-regional and African level and by the international community to resolve the Ivorian crisis and appease socio-political tensions in the countries of the Union concerned should be pursued and intensified in order to reduce this risk. Effect of the persistence of difficulties in absorbing resources: an important assumption on which the execution of the REP is based is the capacity of member States of the Union to actually absorb the resources allocated for the execution of the various projects. In fact, certain structural constraints hindering the absorption of the resources mobilised for programmes and projects in the member States could persist. This is a risk for the smooth execution of the Programme which would result in the reduction in the volume of the investments made within the framework of the REP, hence a downward revision of the impact and macro-economic effects of the Programme. Differences in the absorption rate of the sectors (economic infrastructure, education, health, etc.) could result in the differential reduction in sectoral investments. However, it should be pointed out that for some years now, almost all the countries of the Union have been undertaking budgetary reforms in order to increase the efficiency of public spending within a transparent management framework. These reforms generally cover : i) the utilisation of the budget-programme approach in order

38
to ensure optimum resource allocation ; ii) the establishment of a new circuit of expenditure and modernisation of control ; iii) making spendthrift ministries more responsible and the obligation to give accounts ; and iv) recourse to performance indicators. These reforms initiated and implemented at national level are backed by the adoption at regional level of a Directive concerning the Code of transparency in the management of public finances. Likewise, the implementing of the Directives concerning the award, execution and payments in respect of public contracts and the delegation of public services in the UEMOA on the one hand, and the Code concerning the control and regularisation of public contracts and the delegation of public services on the other hand, which were recently adopted by the UEMOA Council of Ministers at its session held on 9 December 2005 are important measures the implementation of which will contribute towards stamping out this risk. Effect of the non mobilisation of all the external resources expected: the execution of the REP is also based on the assumption that all the financing for the Programme would be secured, thanks particularly to the external resources expected, which are made up mainly of grants and concessional borrowings. Even though a considerable internal effort can be made by the States and Community institutions to reduce the share of external resources to be mobilised for the financing of the Programme to a realistic level, it is likely that all the resources expected from abroad may not be mobilised. Failure to mobilise all the external resources necessary to secure full financing would have negative effects on the impact and the effects expected from the execution of the Programme, particularly as regards the economic growth targets. However, reasons for appeasement exist in the face of this risk. In fact, five UEMOA member States out of eight have reached the point of completion of the HIPC initiative and can thus benefit from the recent initiative of the G8 concerning an additional alleviation of their debts. Thus, these countries could receive additional budgetary resources for the financing of the development project while improving their debt capacity. Furthermore, in order to limit this risk, the resource mobilisation strategy for the financing of the programme should be well co-ordinated by Community institutions, particularly BOAD, lead bank of the donors towards the financing of the Programme and should receive the necessary political support from the highest Authorities of the Union, particularly the Chairman of the Authority of Heads of State and Government of UEMOA. Likewise, the mechanism used for monitoring/evaluation of the Programme should ensure a strict monitoring of the financing intentions of donors and the involvement in the monitoring/evaluation mechanism.
39
CONCLUSION The Regional Economic Programme is an innovative programme in Africa. Its set objectives are in harmony with those of other regional, continental and international strategies. The Community institutions responsible for steering its execution have acquired relevant experience in the area of managing policies, programmes and projects which enhance integration. The REP is mainly oriented towards the establishment of economic infrastructure with 78.1% of its total financing, more than 90% of which is meant for road and rail transport. The REP thus aims to transform and diversify intra-community trade flows, thereby contributing towards achieving one of the medium term objectives of the Union, namely to facilitate the movement of persons and goods traffic through the improvement of the quantity and quality of road infrastructure and the cross-border interconnection of roads, with, as direct effects, the reduction of transport time and costs of goods transport and improvement of access to energy and telecommunications services. The REP will also contribute significantly to the increase of the supply and productivity of labour in the Union.
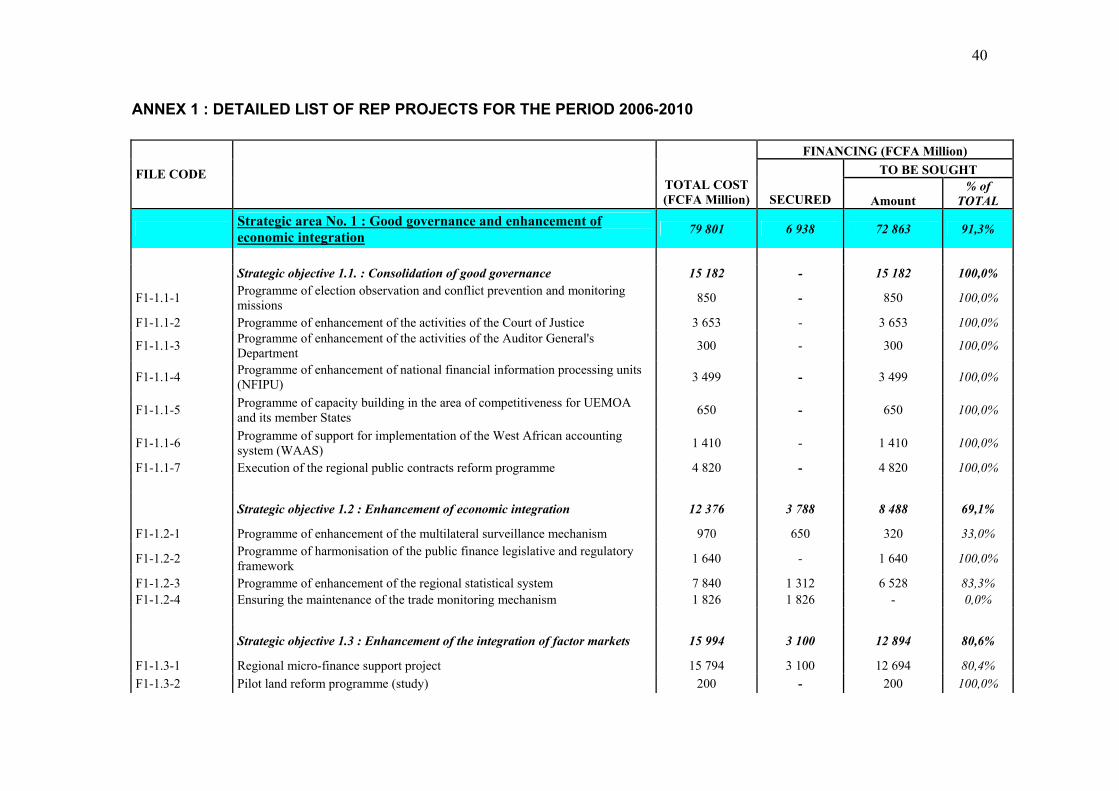
40
ANNEX 1 : DETAILED LIST OF REP PROJECTS FOR THE PERIOD 2006-2010
FINANCING (FCFA Million) TO BE SOUGHT FILE CODE
TOTAL COST (FCFA Million) SECURED Amount
% of TOTAL
Strategic area No. 1 : Good governance and enhancement of economic integration 79 801 6 938 72 863 91,3%
Strategic objective 1.1. : Consolidation of good governance 15 182 - 15 182 100,0%
F1-1.1-1 Programme of election observation and conflict prevention and monitoring missions 850 - 850 100,0%
F1-1.1-2 Programme of enhancement of the activities of the Court of Justice 3 653 - 3 653 100,0%
F1-1.1-3 Programme of enhancement of the activities of the Auditor General's Department 300 - 300 100,0%
F1-1.1-4 Programme of enhancement of national financial information processing units (NFIPU) 3 499 - 3 499 100,0%
F1-1.1-5 Programme of capacity building in the area of competitiveness for UEMOA and its member States 650 - 650 100,0%
F1-1.1-6 Programme of support for implementation of the West African accounting system (WAAS) 1 410 - 1 410 100,0%
F1-1.1-7 Execution of the regional public contracts reform programme 4 820 - 4 820 100,0%
Strategic objective 1.2 : Enhancement of economic integration 12 376 3 788 8 488 69,1%
F1-1.2-1 Programme of enhancement of the multilateral surveillance mechanism 970 650 320 33,0%
F1-1.2-2 Programme of harmonisation of the public finance legislative and regulatory framework 1 640 - 1 640 100,0%
F1-1.2-3 Programme of enhancement of the regional statistical system 7 840 1 312 6 528 83,3% F1-1.2-4 Ensuring the maintenance of the trade monitoring mechanism 1 826 1 826 - 0,0%
Strategic objective 1.3 : Enhancement of the integration of factor markets 15 994 3 100 12 894 80,6%
F1-1.3-1 Regional micro-finance support project 15 794 3 100 12 694 80,4% F1-1.3-2 Pilot land reform programme (study) 200 - 200 100,0%

41
Strategic objective 1.4 : Development of Community solidarity 36 349 50 36 299 99,9%
F1-1.4-1 Programme of integrated development in disadvantaged border areas of the Union 26 300 50 26 250 99,8%
F1-1.4-2 Programme of support for girl child education in disadvantaged border areas of member States of the Union 10 049 - 10 049 100,0%
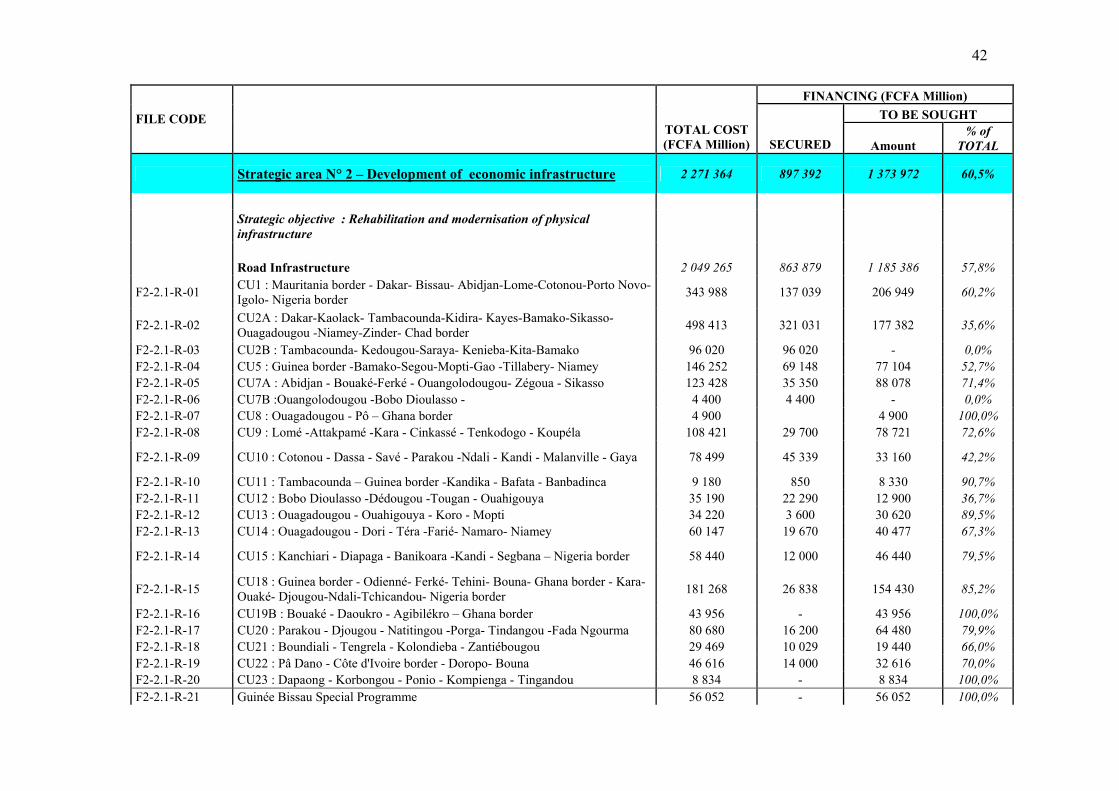
42
FINANCING (FCFA Million) TO BE SOUGHT FILE CODE
TOTAL COST (FCFA Million) SECURED Amount
% of TOTAL
Strategic area N° 2 – Development of economic infrastructure 2 271 364 897 392 1 373 972 60,5%
Strategic objective : Rehabilitation and modernisation of physical infrastructure
Road Infrastructure 2 049 265 863 879 1 185 386 57,8%
F2-2.1-R-01 CU1 : Mauritania border - Dakar- Bissau- Abidjan-Lome-Cotonou-Porto Novo-Igolo- Nigeria border 343 988 137 039 206 949 60,2%
F2-2.1-R-02 CU2A : Dakar-Kaolack- Tambacounda-Kidira- Kayes-Bamako-Sikasso-Ouagadougou -Niamey-Zinder- Chad border 498 413 321 031 177 382 35,6%
F2-2.1-R-03 CU2B : Tambacounda- Kedougou-Saraya- Kenieba-Kita-Bamako 96 020 96 020 - 0,0% F2-2.1-R-04 CU5 : Guinea border -Bamako-Segou-Mopti-Gao -Tillabery- Niamey 146 252 69 148 77 104 52,7% F2-2.1-R-05 CU7A : Abidjan - Bouaké-Ferké - Ouangolodougou- Zégoua - Sikasso 123 428 35 350 88 078 71,4% F2-2.1-R-06 CU7B :Ouangolodougou -Bobo Dioulasso - 4 400 4 400 - 0,0% F2-2.1-R-07 CU8 : Ouagadougou - Pô – Ghana border 4 900 4 900 100,0% F2-2.1-R-08 CU9 : Lomé -Attakpamé -Kara - Cinkassé - Tenkodogo - Koupéla 108 421 29 700 78 721 72,6%
F2-2.1-R-09 CU10 : Cotonou - Dassa - Savé - Parakou -Ndali - Kandi - Malanville - Gaya 78 499 45 339 33 160 42,2%
F2-2.1-R-10 CU11 : Tambacounda – Guinea border -Kandika - Bafata - Banbadinca 9 180 850 8 330 90,7% F2-2.1-R-11 CU12 : Bobo Dioulasso -Dédougou -Tougan - Ouahigouya 35 190 22 290 12 900 36,7% F2-2.1-R-12 CU13 : Ouagadougou - Ouahigouya - Koro - Mopti 34 220 3 600 30 620 89,5% F2-2.1-R-13 CU14 : Ouagadougou - Dori - Téra -Farié- Namaro- Niamey 60 147 19 670 40 477 67,3%
F2-2.1-R-14 CU15 : Kanchiari - Diapaga - Banikoara -Kandi - Segbana – Nigeria border 58 440 12 000 46 440 79,5%
F2-2.1-R-15 CU18 : Guinea border - Odienné- Ferké- Tehini- Bouna- Ghana border - Kara- Ouaké- Djougou-Ndali-Tchicandou- Nigeria border 181 268 26 838 154 430 85,2%
F2-2.1-R-16 CU19B : Bouaké - Daoukro - Agibilékro – Ghana border 43 956 - 43 956 100,0% F2-2.1-R-17 CU20 : Parakou - Djougou - Natitingou -Porga- Tindangou -Fada Ngourma 80 680 16 200 64 480 79,9% F2-2.1-R-18 CU21 : Boundiali - Tengrela - Kolondieba - Zantiébougou 29 469 10 029 19 440 66,0% F2-2.1-R-19 CU22 : Pâ Dano - Côte d'Ivoire border - Doropo- Bouna 46 616 14 000 32 616 70,0% F2-2.1-R-20 CU23 : Dapaong - Korbongou - Ponio - Kompienga - Tingandou 8 834 - 8 834 100,0% F2-2.1-R-21 Guinée Bissau Special Programme 56 052 - 56 052 100,0%

43
F2-2.1-R-23 Regional Facilitation Programme 892 375 517 58,0% Railway Transport 36 580 31 013 5 567 15,2% F2-2.1-F -01 West African railway network interconnection programme 5 877 310 5 567 F2-2.1-F -02 Rehabilitation of the Dakar – Bamako railway 30 703 30 703 - 0,0% Air Transport 92 450 2 500 89 950 97,3%
F2-2.1-Aé -01 Updating of member States airport facilities to international standard 60 000 - 60 000 100,0%
F2-2.1-Aé -02 Additional financing for the Community air safety co-ordination mechanism (COSCAP) 3 100 2 500 600 19,4%
F2-2.1-Aé -03 Enhancement of member States' civil aviation safety 350 - 350 100,0% F2-2.1-Aé -04 Creation of a sub-regional airline company 29 000 - 29 000 100,0% Energy 74 600 - 74 600 100,0% F2-2.1-En -01 Interconnection of the priority electric grids of Mali and Côte d'Ivoire 74 600 - 74 600 100,0% Information and Communication technology 18 469 - 18 469 100,0%
F2-2.1-tic -01 Establishment of a high-performance intra-Community telecommunications network 13 450 - 13 450 100,0%
F2-2.1-tic -02 Community action programme for the promotion of Information and Communication Technology in the UEMOA zone 5 019 - 5 019 100,0%
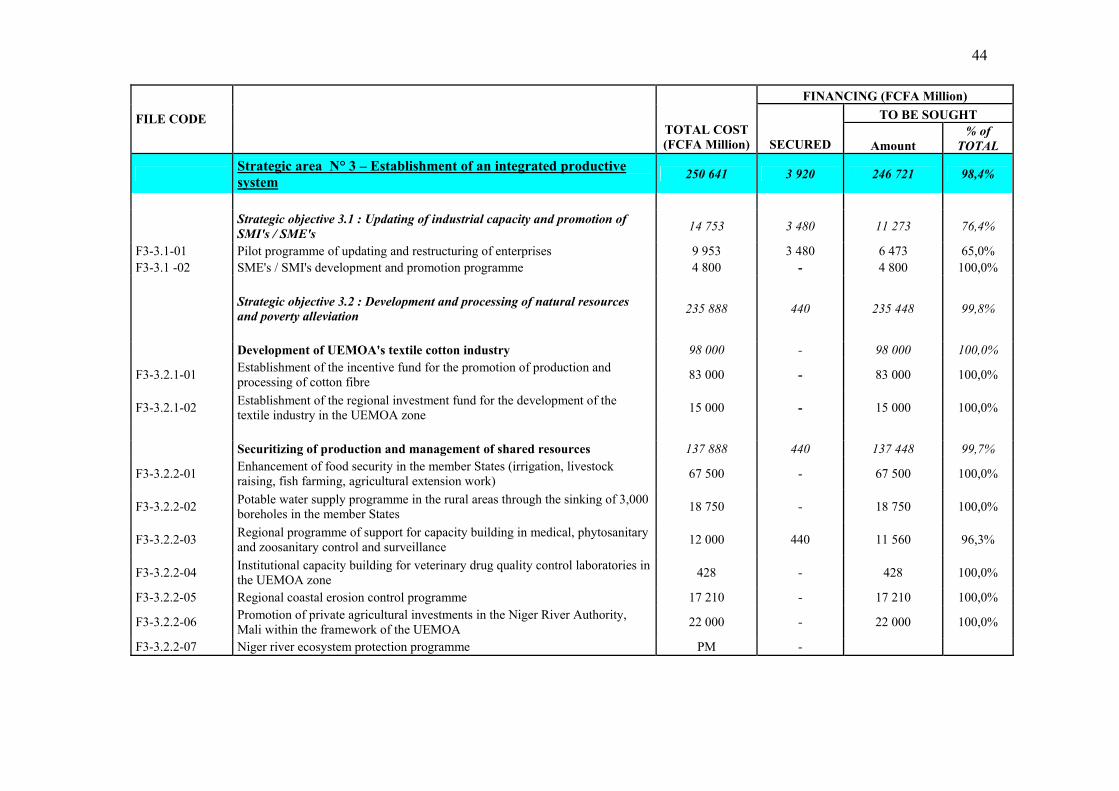
44
FINANCING (FCFA Million) TO BE SOUGHT FILE CODE
TOTAL COST (FCFA Million) SECURED Amount
% of TOTAL
Strategic area N° 3 – Establishment of an integrated productive system 250 641 3 920 246 721 98,4%
Strategic objective 3.1 : Updating of industrial capacity and promotion of SMI's / SME's 14 753 3 480 11 273 76,4%
F3-3.1-01 Pilot programme of updating and restructuring of enterprises 9 953 3 480 6 473 65,0% F3-3.1 -02 SME's / SMI's development and promotion programme 4 800 - 4 800 100,0%
Strategic objective 3.2 : Development and processing of natural resources and poverty alleviation 235 888 440 235 448 99,8%
Development of UEMOA's textile cotton industry 98 000 - 98 000 100,0%
F3-3.2.1-01 Establishment of the incentive fund for the promotion of production and processing of cotton fibre 83 000 - 83 000 100,0%
F3-3.2.1-02 Establishment of the regional investment fund for the development of the textile industry in the UEMOA zone 15 000 - 15 000 100,0%
Securitizing of production and management of shared resources 137 888 440 137 448 99,7%
F3-3.2.2-01 Enhancement of food security in the member States (irrigation, livestock raising, fish farming, agricultural extension work) 67 500 - 67 500 100,0%
F3-3.2.2-02 Potable water supply programme in the rural areas through the sinking of 3,000 boreholes in the member States 18 750 - 18 750 100,0%
F3-3.2.2-03 Regional programme of support for capacity building in medical, phytosanitary and zoosanitary control and surveillance 12 000 440 11 560 96,3%
F3-3.2.2-04 Institutional capacity building for veterinary drug quality control laboratories in the UEMOA zone 428 - 428 100,0%
F3-3.2.2-05 Regional coastal erosion control programme 17 210 - 17 210 100,0%
F3-3.2.2-06 Promotion of private agricultural investments in the Niger River Authority, Mali within the framework of the UEMOA 22 000 - 22 000 100,0%
F3-3.2.2-07 Niger river ecosystem protection programme PM -
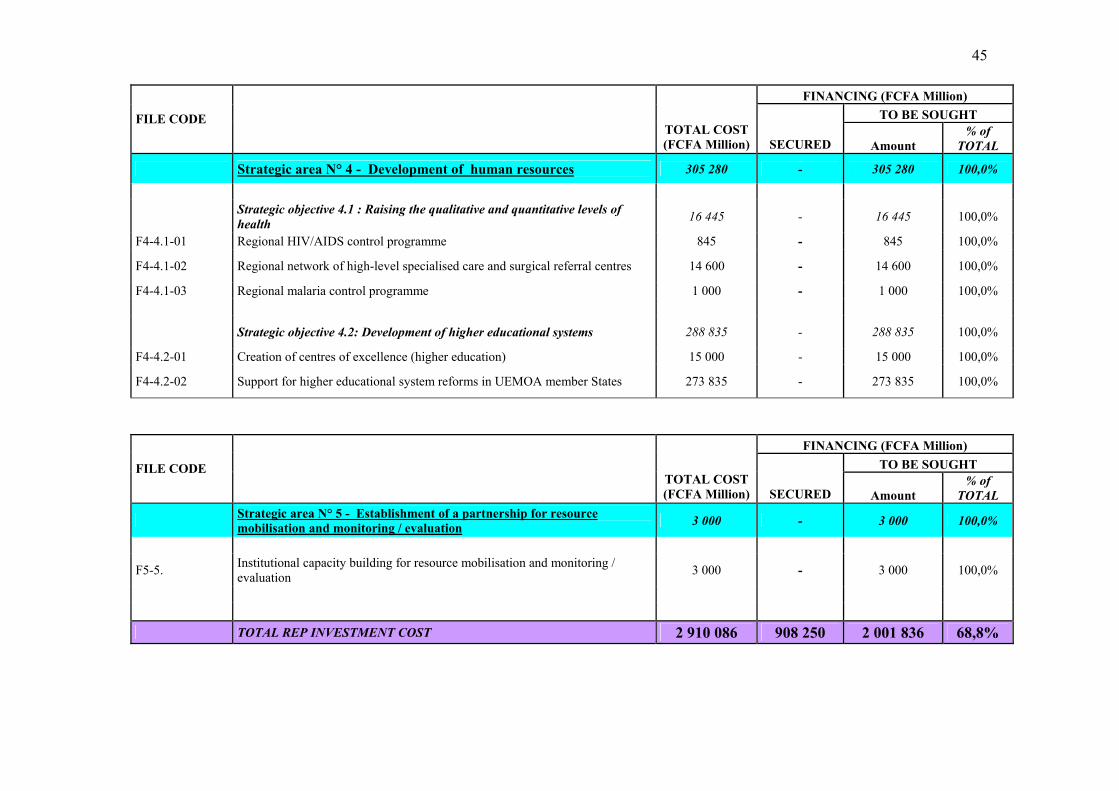
45
FINANCING (FCFA Million) TO BE SOUGHT FILE CODE
TOTAL COST (FCFA Million) SECURED Amount
% of TOTAL
Strategic area N° 4 - Development of human resources 305 280 - 305 280 100,0%
Strategic objective 4.1 : Raising the qualitative and quantitative levels of health 16 445 - 16 445 100,0%
F4-4.1-01 Regional HIV/AIDS control programme 845 - 845 100,0%
F4-4.1-02 Regional network of high-level specialised care and surgical referral centres 14 600 - 14 600 100,0%
F4-4.1-03 Regional malaria control programme 1 000 - 1 000 100,0%
Strategic objective 4.2: Development of higher educational systems 288 835 - 288 835 100,0%
F4-4.2-01 Creation of centres of excellence (higher education) 15 000 - 15 000 100,0%
F4-4.2-02 Support for higher educational system reforms in UEMOA member States 273 835 - 273 835 100,0%
FINANCING (FCFA Million) TO BE SOUGHT FILE CODE
TOTAL COST (FCFA Million) SECURED Amount
% of TOTAL
Strategic area N° 5 - Establishment of a partnership for resource mobilisation and monitoring / evaluation 3 000 - 3 000 100,0%
F5-5. Institutional capacity building for resource mobilisation and monitoring / evaluation 3 000 - 3 000 100,0%
TOTAL REP INVESTMENT COST 2 910 086 908 250 2 001 836 68,8%

46
ANNEX 2 : FINANCIAL PROGRAMMING OF THE RESOURCES OF THE REP
Financing to be sought
Programming
Strategic area 1 : consolidation of economic governance and enhancement of economic integration
Total cost in FCFA (million)
Amount secured In FCFA (million)
Amount in FCFA
(million)
% of total Before 2006
2006 2007 2008 2009 2010
OS 1.1 : Consolidation of good governance 15 182 0 15 182 100,0% 2730 3998 2637 2683 3135
Programme of election observation and conflict prevention and monitoring missions 850 0 850 100,0% 200 200 200 200 50
Programme of enhancement of the legal system and equipment of Community legal machinery
3 653 0 3653 100,0% 840 673 719 1 421
Programme of action of the Auditor General's Department 300 0 300 100,0% 100 50 50 50 50
Programme of enhancement of national financial information processing units 3 499 0 3499 100,0% 600 750 750 750 650
Capacity building for UEMOA and its member States in the area of competitiveness 650 0 650 100,0% 250 400
Implementation of the West African accounting system (SYSCOA) 1 410 0 1410 100,0% 630 780
Regional public contract reform programme 4 820 0 4820 100,0% 950 978 964 964 964

47
OS 1.2 : Enhancement of regional integration 12 376 3 788 8 488 69,1% 1 271 5 242 2 955 1 529 1 279
Enhancement of the multilateral monitoring mechanism 970 650 320 33,0% 194 224 224 204 124
Harmonisation of the legislative and regulatory frameworks in the area of public finance 1 640 0 1640 100,0% 90 1550
Programme of enhancement of the regional statistical system 7 840 1 312 6528 83,3% 987 3 012 2 275 868 698
Ensuring the maintenance of the trade monitoring mechanism
1 826 1 826 - 0,0% 456 456 457 457
OS 1.3 : Enhancement of factor markets
15 994 3 100 12 894 80,6% 5 190 2 701 2 701 1 360 4 042
Regional micro-finance support project 15 794 3100 12 694 80,4% 4 990 2 701 2 701 1 360 4 042 Pilot land reform project 200 0 200 100,0% 200 OS 1.4 : Development of Community solidarity 36 349 50 36 299 99,9% 1 557 4 312 4 370 9 045 17 065
Programme of integrated development in disadvantaged border areas of the union 26 300 50 26 250 99,8% 50 795 2 695 7 370 15 390
Programme of support for girl child education in disadvantaged border areas of member States of the Union
10 049 0 10 049 100,0% 1 507 3 517 1 675 1 675 1 675
TOTAL AS 1 79 801 6 938 72 863 91,3% 10 748 16 253 12 663 14 617 25 521
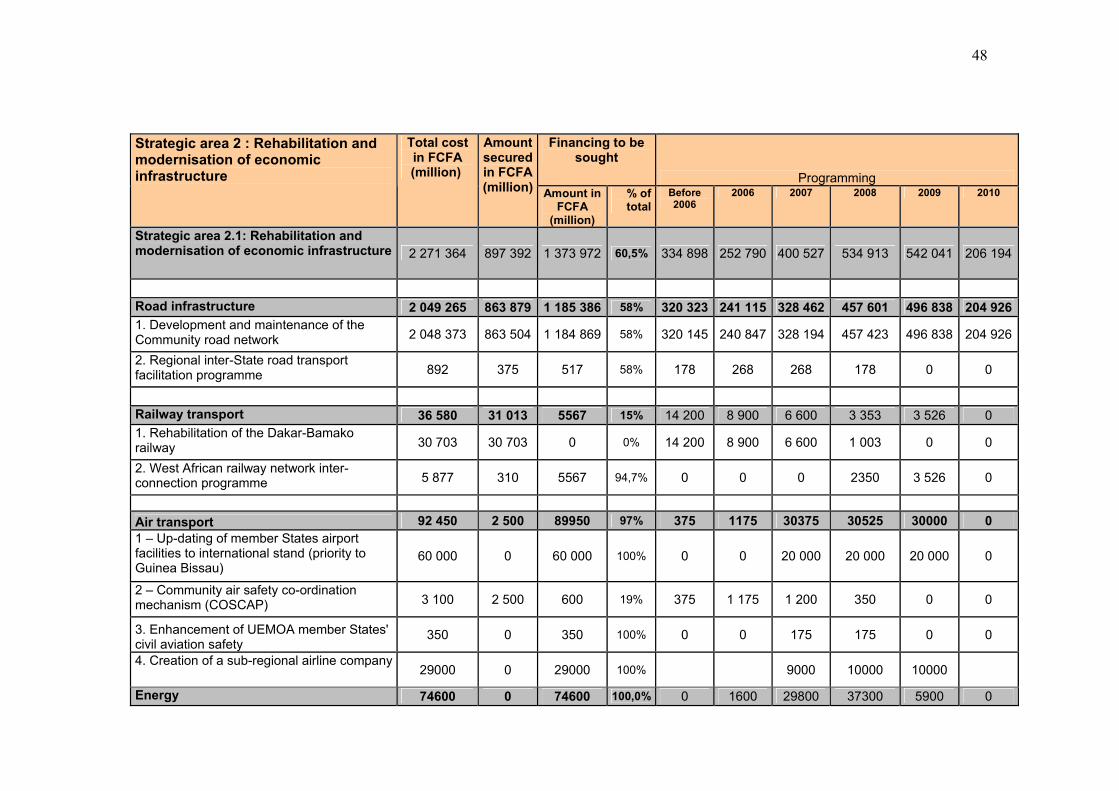
48
Financing to be sought
Programming
Strategic area 2 : Rehabilitation and modernisation of economic infrastructure
Total cost in FCFA (million)
Amount secured in FCFA (million) Amount in
FCFA (million)
% of total
Before 2006
2006 2007 2008 2009 2010
Strategic area 2.1: Rehabilitation and modernisation of economic infrastructure 2 271 364 897 392 1 373 972 60,5% 334 898 252 790 400 527 534 913 542 041 206 194
Road infrastructure 2 049 265 863 879 1 185 386 58% 320 323 241 115 328 462 457 601 496 838 204 926 1. Development and maintenance of the Community road network 2 048 373 863 504 1 184 869 58% 320 145 240 847 328 194 457 423 496 838 204 926
2. Regional inter-State road transport facilitation programme 892 375 517 58% 178 268 268 178 0 0
Railway transport 36 580 31 013 5567 15% 14 200 8 900 6 600 3 353 3 526 0 1. Rehabilitation of the Dakar-Bamako railway 30 703 30 703 0 0% 14 200 8 900 6 600 1 003 0 0
2. West African railway network inter-connection programme 5 877 310 5567 94,7% 0 0 0 2350 3 526 0
Air transport 92 450 2 500 89950 97% 375 1175 30375 30525 30000 0 1 – Up-dating of member States airport facilities to international stand (priority to Guinea Bissau)
60 000 0 60 000 100% 0 0 20 000 20 000 20 000 0
2 – Community air safety co-ordination mechanism (COSCAP) 3 100 2 500 600 19% 375 1 175 1 200 350 0 0
3. Enhancement of UEMOA member States' civil aviation safety
350 0 350 100% 0 0 175 175 0 0
4. Creation of a sub-regional airline company 29000 0 29000 100% 9000 10000 10000
Energy 74600 0 74600 100,0% 0 1600 29800 37300 5900 0

49
1- Interconnection of the priority electric grids : Mali-Côte d’Ivoire 74600 0 74600 100,0% 1600 29800 37300 5900
Telecommunications 18 469 0 18 469 100% 0 0 5290 6134 5777 1268 1 – Establishment of a high-performance intra-Community telecommunications network
13 450 0 13 450 100% 4 912 4 269 4269
2 – REP-PROM project : Community action programme for the promotion of Information and Communication Technology in the UEMOA zone
5 019 0 5 019 100% 378 1 865 1 508 1268
TOTAL AS 2 2 271 364 897 392 1 373 972 60,5% 334 898 252 790 400 527 534 913 542 041 206 194

50
Financing to be sought
Programming
Strategic area 3: Establishment of an integrated productive system
Total cost in FCFA (million)
Amount secured in FCFA (million) Amount in
FCFA (million)
% of total Before
2006 2006 2007 2008 2009 2010 Strategic objective 3.1 Updating of industrial capacity and promotion of SMI's / SME's
14 753 3 480 11 273 76,4% 0 3395 7 178 1 580 1 500 1 100
1 – Restructuring and updating of member States' industries (pilot programme) 9 953 3 480 6 473 65% 3 395 6 558
2 – Regional SME's / SMI's promotion and financing programme 4 800 4 800 100,0% 620 1 580 1500 1100
Strategic objective 3.2 : Development and processing of natural resources and poverty alleviation
235 888 440 235 448 99,81% 0 0 59569 59070 59071 58178
1. Incentive fund for the promotion of production and processing of cotton fibre 83 000 83 000 100,0% 21500 20500 20500 20500
2. Regional investment fund for the development of the textile industry 15 000 15 000 100,0% 3750 3750 3750 3 750
3. Structural enhancement of food security in the member States (small irrigation schemes, raising of small livestock, fish farming, extension work involving improved seeds)
67 500 0 67 500 100,0% 16 875 16 875 16 875 16 875
4 – Potable water supply programme in the rural areas through the sinking of 3,000 boreholes in the member States
18 750 0 18 750 100,0% 4 500 5 000 5 000 4 250
5 – Regional programme of support for national and regional capacity building in medical, phytosanitary and zoo sanitary control and surveillance
12 000 440 11 560 96,3% 3000 3000 3000 3000
6. Institutional capacity building for veterinary drug quality control laboratories in the UEMOA zone
428 0 428 100,0% 142 143 143
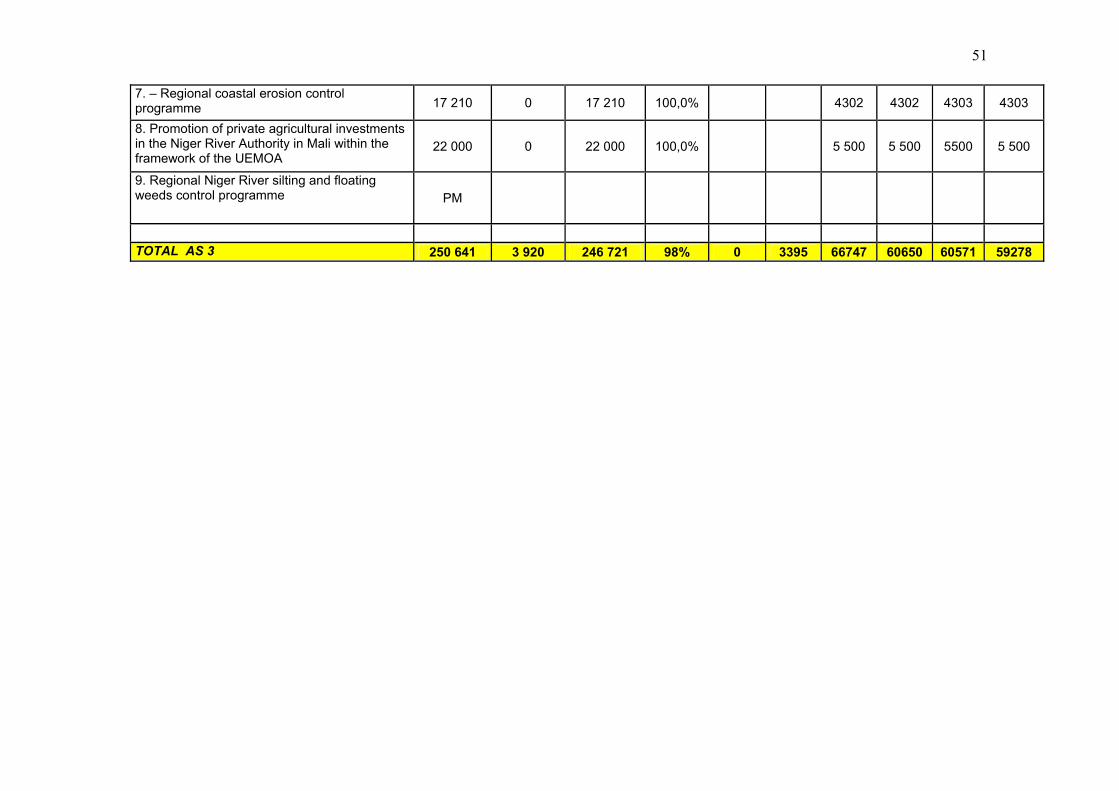
51
7. – Regional coastal erosion control programme 17 210 0 17 210 100,0% 4302 4302 4303 4303
8. Promotion of private agricultural investments in the Niger River Authority in Mali within the framework of the UEMOA
22 000 0 22 000 100,0% 5 500 5 500 5500 5 500
9. Regional Niger River silting and floating weeds control programme PM
TOTAL AS 3 250 641 3 920 246 721 98% 0 3395 66747 60650 60571 59278
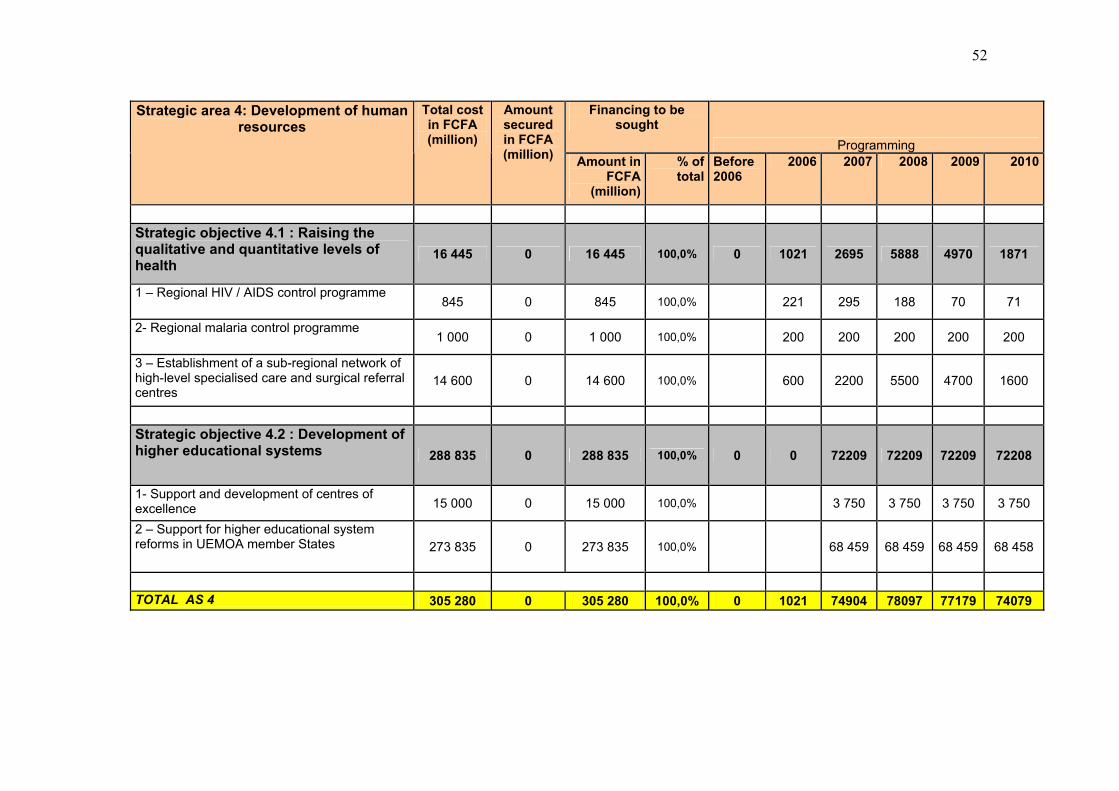
52
Financing to be
sought Programming
Strategic area 4: Development of human resources
Total cost in FCFA (million)
Amount secured in FCFA (million) Amount in
FCFA (million)
% of total
Before 2006
2006 2007 2008 2009 2010
Strategic objective 4.1 : Raising the qualitative and quantitative levels of health
16 445 0 16 445 100,0% 0 1021 2695 5888 4970 1871
1 – Regional HIV / AIDS control programme845 0 845 100,0% 221 295 188 70 71
2- Regional malaria control programme 1 000 0 1 000 100,0% 200 200 200 200 200
3 – Establishment of a sub-regional network of high-level specialised care and surgical referral centres
14 600 0 14 600 100,0% 600 2200 5500 4700 1600
Strategic objective 4.2 : Development of higher educational systems 288 835 0 288 835 100,0% 0 0 72209 72209 72209 72208
1- Support and development of centres of excellence 15 000 0 15 000 100,0% 3 750 3 750 3 750 3 750
2 – Support for higher educational system reforms in UEMOA member States 273 835 0 273 835 100,0% 68 459 68 459 68 459 68 458
TOTAL AS 4 305 280 0 305 280 100,0% 0 1021 74904 78097 77179 74079
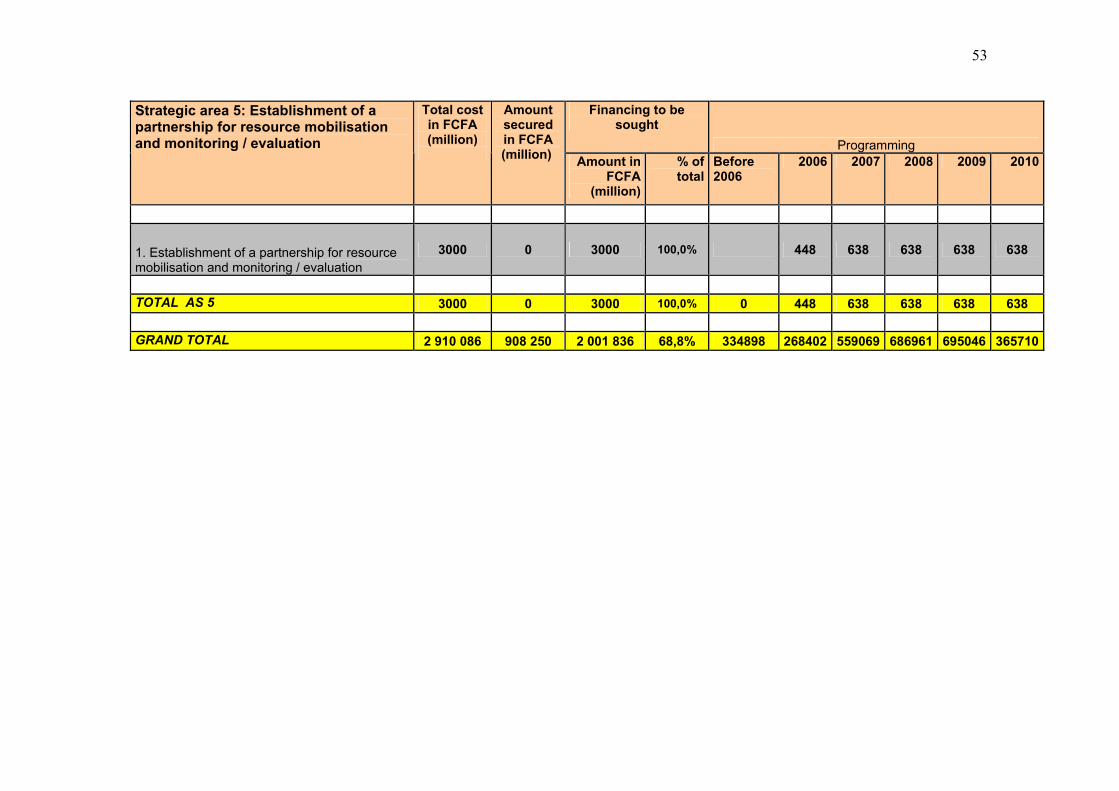
53
Financing to be
sought Programming
Strategic area 5: Establishment of a partnership for resource mobilisation and monitoring / evaluation
Total cost in FCFA (million)
Amount secured in FCFA (million) Amount in
FCFA (million)
% of total
Before 2006
2006 2007 2008 2009 2010
1. Establishment of a partnership for resource mobilisation and monitoring / evaluation
3000 0 3000 100,0% 448 638 638 638 638
TOTAL AS 5 3000 0 3000 100,0% 0 448 638 638 638 638 GRAND TOTAL 2 910 086 908 250 2 001 836 68,8% 334898 268402 559069 686961 695046 365710
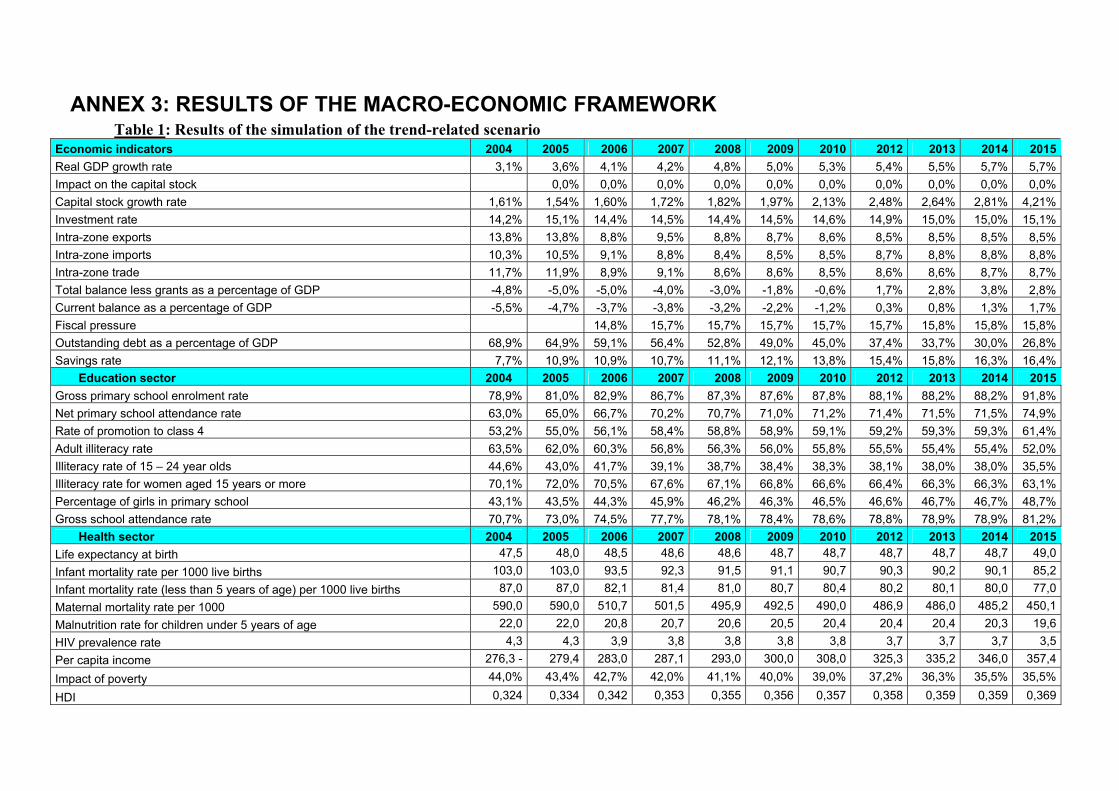
ANNEX 3: RESULTS OF THE MACRO-ECONOMIC FRAMEWORK Table 1: Results of the simulation of the trend-related scenario
Economic indicators 2004 2005 2006 2007 2008 2009 2010 2012 2013 2014 2015 Real GDP growth rate 3,1% 3,6% 4,1% 4,2% 4,8% 5,0% 5,3% 5,4% 5,5% 5,7% 5,7% Impact on the capital stock 0,0% 0,0% 0,0% 0,0% 0,0% 0,0% 0,0% 0,0% 0,0% 0,0% Capital stock growth rate 1,61% 1,54% 1,60% 1,72% 1,82% 1,97% 2,13% 2,48% 2,64% 2,81% 4,21% Investment rate 14,2% 15,1% 14,4% 14,5% 14,4% 14,5% 14,6% 14,9% 15,0% 15,0% 15,1% Intra-zone exports 13,8% 13,8% 8,8% 9,5% 8,8% 8,7% 8,6% 8,5% 8,5% 8,5% 8,5% Intra-zone imports 10,3% 10,5% 9,1% 8,8% 8,4% 8,5% 8,5% 8,7% 8,8% 8,8% 8,8% Intra-zone trade 11,7% 11,9% 8,9% 9,1% 8,6% 8,6% 8,5% 8,6% 8,6% 8,7% 8,7% Total balance less grants as a percentage of GDP -4,8% -5,0% -5,0% -4,0% -3,0% -1,8% -0,6% 1,7% 2,8% 3,8% 2,8% Current balance as a percentage of GDP -5,5% -4,7% -3,7% -3,8% -3,2% -2,2% -1,2% 0,3% 0,8% 1,3% 1,7% Fiscal pressure 14,8% 15,7% 15,7% 15,7% 15,7% 15,7% 15,8% 15,8% 15,8% Outstanding debt as a percentage of GDP 68,9% 64,9% 59,1% 56,4% 52,8% 49,0% 45,0% 37,4% 33,7% 30,0% 26,8% Savings rate 7,7% 10,9% 10,9% 10,7% 11,1% 12,1% 13,8% 15,4% 15,8% 16,3% 16,4% Education sector 2004 2005 2006 2007 2008 2009 2010 2012 2013 2014 2015 Gross primary school enrolment rate 78,9% 81,0% 82,9% 86,7% 87,3% 87,6% 87,8% 88,1% 88,2% 88,2% 91,8% Net primary school attendance rate 63,0% 65,0% 66,7% 70,2% 70,7% 71,0% 71,2% 71,4% 71,5% 71,5% 74,9% Rate of promotion to class 4 53,2% 55,0% 56,1% 58,4% 58,8% 58,9% 59,1% 59,2% 59,3% 59,3% 61,4% Adult illiteracy rate 63,5% 62,0% 60,3% 56,8% 56,3% 56,0% 55,8% 55,5% 55,4% 55,4% 52,0% Illiteracy rate of 15 – 24 year olds 44,6% 43,0% 41,7% 39,1% 38,7% 38,4% 38,3% 38,1% 38,0% 38,0% 35,5% Illiteracy rate for women aged 15 years or more 70,1% 72,0% 70,5% 67,6% 67,1% 66,8% 66,6% 66,4% 66,3% 66,3% 63,1% Percentage of girls in primary school 43,1% 43,5% 44,3% 45,9% 46,2% 46,3% 46,5% 46,6% 46,7% 46,7% 48,7% Gross school attendance rate 70,7% 73,0% 74,5% 77,7% 78,1% 78,4% 78,6% 78,8% 78,9% 78,9% 81,2% Health sector 2004 2005 2006 2007 2008 2009 2010 2012 2013 2014 2015 Life expectancy at birth 47,5 48,0 48,5 48,6 48,6 48,7 48,7 48,7 48,7 48,7 49,0 Infant mortality rate per 1000 live births 103,0 103,0 93,5 92,3 91,5 91,1 90,7 90,3 90,2 90,1 85,2 Infant mortality rate (less than 5 years of age) per 1000 live births 87,0 87,0 82,1 81,4 81,0 80,7 80,4 80,2 80,1 80,0 77,0 Maternal mortality rate per 1000 590,0 590,0 510,7 501,5 495,9 492,5 490,0 486,9 486,0 485,2 450,1 Malnutrition rate for children under 5 years of age 22,0 22,0 20,8 20,7 20,6 20,5 20,4 20,4 20,4 20,3 19,6 HIV prevalence rate 4,3 4,3 3,9 3,8 3,8 3,8 3,8 3,7 3,7 3,7 3,5 Per capita income 276,3 - 279,4 283,0 287,1 293,0 300,0 308,0 325,3 335,2 346,0 357,4
Impact of poverty 44,0% 43,4% 42,7% 42,0% 41,1% 40,0% 39,0% 37,2% 36,3% 35,5% 35,5%
HDI 0,324 0,334 0,342 0,353 0,355 0,356 0,357 0,358 0,359 0,359 0,369
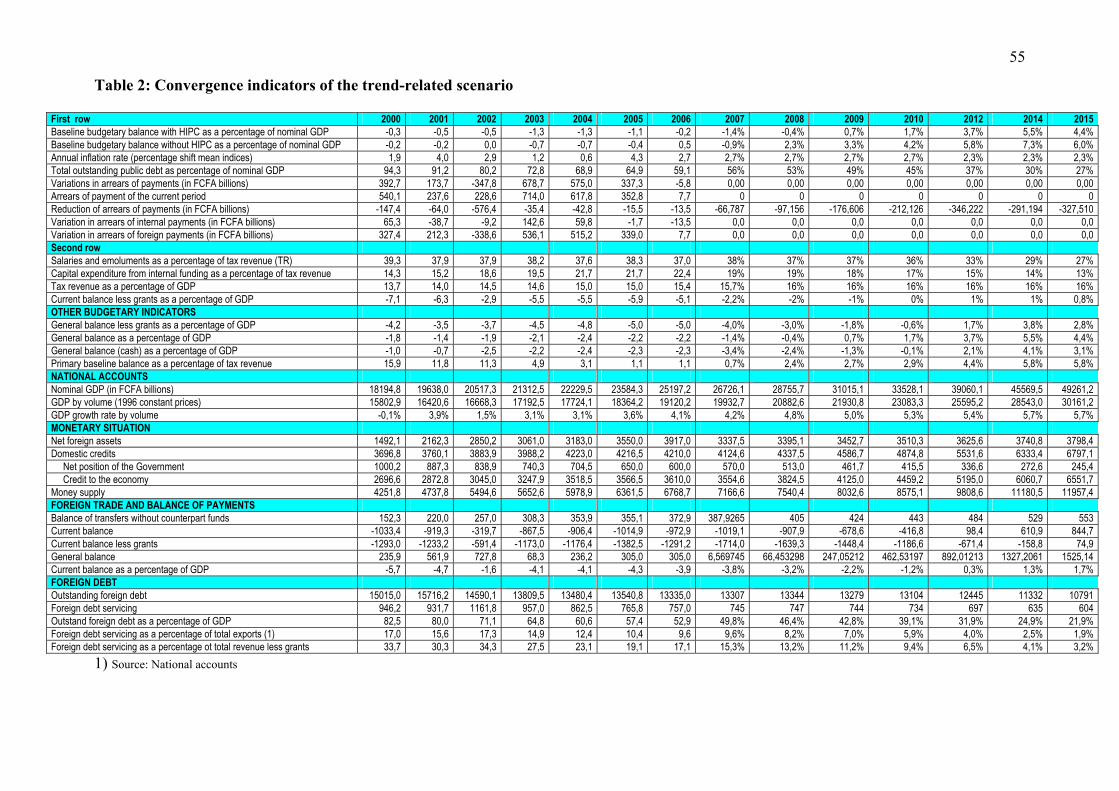
55
Table 2: Convergence indicators of the trend-related scenario
First row 2000 2001 2002 2003 2004 2005 2006 2007 2008 2009 2010 2012 2014 2015 Baseline budgetary balance with HIPC as a percentage of nominal GDP -0,3 -0,5 -0,5 -1,3 -1,3 -1,1 -0,2 -1,4% -0,4% 0,7% 1,7% 3,7% 5,5% 4,4% Baseline budgetary balance without HIPC as a percentage of nominal GDP -0,2 -0,2 0,0 -0,7 -0,7 -0,4 0,5 -0,9% 2,3% 3,3% 4,2% 5,8% 7,3% 6,0% Annual inflation rate (percentage shift mean indices) 1,9 4,0 2,9 1,2 0,6 4,3 2,7 2,7% 2,7% 2,7% 2,7% 2,3% 2,3% 2,3% Total outstanding public debt as percentage of nominal GDP 94,3 91,2 80,2 72,8 68,9 64,9 59,1 56% 53% 49% 45% 37% 30% 27% Variations in arrears of payments (in FCFA billions) 392,7 173,7 -347,8 678,7 575,0 337,3 -5,8 0,00 0,00 0,00 0,00 0,00 0,00 0,00 Arrears of payment of the current period 540,1 237,6 228,6 714,0 617,8 352,8 7,7 0 0 0 0 0 0 0 Reduction of arrears of payments (in FCFA billions) -147,4 -64,0 -576,4 -35,4 -42,8 -15,5 -13,5 -66,787 -97,156 -176,606 -212,126 -346,222 -291,194 -327,510 Variation in arrears of internal payments (in FCFA billions) 65,3 -38,7 -9,2 142,6 59,8 -1,7 -13,5 0,0 0,0 0,0 0,0 0,0 0,0 0,0 Variation in arrears of foreign payments (in FCFA billions) 327,4 212,3 -338,6 536,1 515,2 339,0 7,7 0,0 0,0 0,0 0,0 0,0 0,0 0,0 Second row Salaries and emoluments as a percentage of tax revenue (TR) 39,3 37,9 37,9 38,2 37,6 38,3 37,0 38% 37% 37% 36% 33% 29% 27% Capital expenditure from internal funding as a percentage of tax revenue 14,3 15,2 18,6 19,5 21,7 21,7 22,4 19% 19% 18% 17% 15% 14% 13% Tax revenue as a percentage of GDP 13,7 14,0 14,5 14,6 15,0 15,0 15,4 15,7% 16% 16% 16% 16% 16% 16% Current balance less grants as a percentage of GDP -7,1 -6,3 -2,9 -5,5 -5,5 -5,9 -5,1 -2,2% -2% -1% 0% 1% 1% 0,8% OTHER BUDGETARY INDICATORS General balance less grants as a percentage of GDP -4,2 -3,5 -3,7 -4,5 -4,8 -5,0 -5,0 -4,0% -3,0% -1,8% -0,6% 1,7% 3,8% 2,8% General balance as a percentage of GDP -1,8 -1,4 -1,9 -2,1 -2,4 -2,2 -2,2 -1,4% -0,4% 0,7% 1,7% 3,7% 5,5% 4,4% General balance (cash) as a percentage of GDP -1,0 -0,7 -2,5 -2,2 -2,4 -2,3 -2,3 -3,4% -2,4% -1,3% -0,1% 2,1% 4,1% 3,1% Primary baseline balance as a percentage of tax revenue 15,9 11,8 11,3 4,9 3,1 1,1 1,1 0,7% 2,4% 2,7% 2,9% 4,4% 5,8% 5,8% NATIONAL ACCOUNTS Nominal GDP (in FCFA billions) 18194,8 19638,0 20517,3 21312,5 22229,5 23584,3 25197,2 26726,1 28755,7 31015,1 33528,1 39060,1 45569,5 49261,2 GDP by volume (1996 constant prices) 15802,9 16420,6 16668,3 17192,5 17724,1 18364,2 19120,2 19932,7 20882,6 21930,8 23083,3 25595,2 28543,0 30161,2 GDP growth rate by volume -0,1% 3,9% 1,5% 3,1% 3,1% 3,6% 4,1% 4,2% 4,8% 5,0% 5,3% 5,4% 5,7% 5,7% MONETARY SITUATION Net foreign assets 1492,1 2162,3 2850,2 3061,0 3183,0 3550,0 3917,0 3337,5 3395,1 3452,7 3510,3 3625,6 3740,8 3798,4 Domestic credits 3696,8 3760,1 3883,9 3988,2 4223,0 4216,5 4210,0 4124,6 4337,5 4586,7 4874,8 5531,6 6333,4 6797,1 Net position of the Government 1000,2 887,3 838,9 740,3 704,5 650,0 600,0 570,0 513,0 461,7 415,5 336,6 272,6 245,4 Credit to the economy 2696,6 2872,8 3045,0 3247,9 3518,5 3566,5 3610,0 3554,6 3824,5 4125,0 4459,2 5195,0 6060,7 6551,7 Money supply 4251,8 4737,8 5494,6 5652,6 5978,9 6361,5 6768,7 7166,6 7540,4 8032,6 8575,1 9808,6 11180,5 11957,4 FOREIGN TRADE AND BALANCE OF PAYMENTS Balance of transfers without counterpart funds 152,3 220,0 257,0 308,3 353,9 355,1 372,9 387,9265 405 424 443 484 529 553 Current balance -1033,4 -919,3 -319,7 -867,5 -906,4 -1014,9 -972,9 -1019,1 -907,9 -678,6 -416,8 98,4 610,9 844,7 Current balance less grants -1293,0 -1233,2 -591,4 -1173,0 -1176,4 -1382,5 -1291,2 -1714,0 -1639,3 -1448,4 -1186,6 -671,4 -158,8 74,9 General balance 235,9 561,9 727,8 68,3 236,2 305,0 305,0 6,569745 66,453298 247,05212 462,53197 892,01213 1327,2061 1525,14 Current balance as a percentage of GDP -5,7 -4,7 -1,6 -4,1 -4,1 -4,3 -3,9 -3,8% -3,2% -2,2% -1,2% 0,3% 1,3% 1,7% FOREIGN DEBT Outstanding foreign debt 15015,0 15716,2 14590,1 13809,5 13480,4 13540,8 13335,0 13307 13344 13279 13104 12445 11332 10791 Foreign debt servicing 946,2 931,7 1161,8 957,0 862,5 765,8 757,0 745 747 744 734 697 635 604 Outstand foreign debt as a percentage of GDP 82,5 80,0 71,1 64,8 60,6 57,4 52,9 49,8% 46,4% 42,8% 39,1% 31,9% 24,9% 21,9% Foreign debt servicing as a percentage of total exports (1) 17,0 15,6 17,3 14,9 12,4 10,4 9,6 9,6% 8,2% 7,0% 5,9% 4,0% 2,5% 1,9% Foreign debt servicing as a percentage ot total revenue less grants 33,7 30,3 34,3 27,5 23,1 19,1 17,1 15,3% 13,2% 11,2% 9,4% 6,5% 4,1% 3,2%
1) Source: National accounts

56
Table 3: Results of the simulations of the desirable scenario
Economic indicators 2004 2005 2006 2007 2008 2009 2010 2012 2013 2014 2015 Real GDP growth rate 3,1% 3,6% 4,12% 5,0% 6,4% 6,7% 7,1% 7,0% 7,1% 7,6% 7,9% Impact on the capital stock 0,0% 0,6% 0,5% 0,6% 0,7% 0,9% 0,0% 0,0% 0,0% 0,0% Investment rate 14,2% 15,1% 15,9% 18,4% 20,1% 21,9% 23,6% 22,1% 22,9% 23,7% 24,5% Capital stock growth rate 1,61% 1,54% 2,70% 2,96% 3,59% 4,28% 4,94% 4,80% 6,23% 6,56% 6,93% Intra-zone exports 13,8% 13,8% 11,2% 11,2% 11,8% 12,1% 12,8% 14,4% 15,5% 16,6% 17,8% Intra-zone imports 10,3% 10,5% 9,7% 10,4% 11,2% 11,7% 12,7% 15,3% 17,1% 19,3% 21,8% Intra-zone trade 11,7% 11,9% 10,4% 10,8% 11,5% 11,9% 12,8% 14,8% 16,3% 17,8% 19,6% Total balance less grants as a percentage of GDP -4,8% -5,0% -5,0% -2,8% -2,5% -2,1% -1,4% 0,1% 1,0% 2,0% 3,1% Current balance as a percentage of GDP -5,5% -4,7% -3,7% -3,6% -2,9% -2,0% -1,0% 1,2% 2,5% 4,0% 5,7% Fiscal pressure 16,6% 16,8% 17,0% 17,2% 17,4% 17,9% 18,1% 18,3% 18,5% Outstanding debt as a percentage of GDP 68,9% 64,9% 59,1% 54,0% 49,3% 44,4% 39,0% 27,8% 23,9% 19,7% 15,4% Savings rate 7,7% 10,9% 11,8% 11,3% 11,4% 11,4% 11,6% 12,8% 14,4% 16,4% 17,3% Education sector 2004 2005 2006 2007 2008 2009 2010 2012 2013 2014 2015 Gross primary school enrolment rate 78,9% 81,0% 86,3% 90,0% 93,8% 97,7% 100,0% 100,0% 100,0% 100,0% 100,0% Net primary school attendance rate 63,0% 65,0% 68,2% 70,9% 73,7% 76,6% 79,4% 84,6% 87,1% 89,5% 91,9% Rate of promotion to class 4 53,2% 55,0% 57,6% 59,4% 61,3% 63,2% 65,0% 68,4% 70,0% 71,5% 73,0% Adult illiteracy rate 63,5% 62,0% 58,2% 56,0% 53,8% 51,7% 49,8% 46,7% 45,3% 44,1% 42,9% Illiteracy rate of 15 – 24 year olds 44,6% 43,0% 38,9% 36,6% 34,3% 32,3% 30,5% 27,5% 26,2% 25,1% 24,1% Illiteracy rate for women aged 15 years or more 70,1% 72,0% 68,3% 66,1% 63,9% 61,8% 60,0% 56,8% 55,4% 54,1% 52,9% Percentage of girls in primary school 43,1% 43,5% 45,5% 46,9% 48,3% 49,7% 50,0% 50,0% 50,0% 50,0% 50,0% Gross school attendance rate 70,7% 73,0% 76,7% 79,3% 81,9% 84,6% 87,1% 91,9% 94,1% 96,3% 98,4% Health sector 2004 2005 2006 2007 2008 2009 2010 2012 2013 2014 2015 Life expectancy at birth 47,5 48,0 49,1 49,6 50,1 50,8 51,4 52,8 53,6 54,4 54,8 Infant mortality rate per 1000 live births 103,0 103,0 93,5 84,8 77,1 70,4 64,7 55,5 51,7 48,4 46,7 Infant mortality rate (less than 5 years of age) per 1000 live births 87,0 87,0 82,1 76,4 71,3 66,8 63,0 56,8 54,2 51,9 50,8 Maternal mortality rate per 100 000 590,0 590,0 510,7 442,7 387,2 341,1 304,0 248,5 227,2 209,0 200,3 Malnutrition rate for children under 5 years of age 22,0 22,0 20,8 19,7 18,6 17,6 16,8 15,4 14,9 14,4 14,1 HIV prevalence rate 4,3 4,3 3,2 2,9 2,6 2,4 2,2 1,9 1,8 1,7 1,6 Per capita income 276,3 279,4 283,0 289,5 300,3 312,6 326,7 356,4 372,8 392,1 413,7 Impact of poverty 44,0% 43,4% 42,4% 40,7% 37,9% 34,8% 31,4% 24,8% 21,3% 17,4% 13,3% HDI 0,324 0,334 0,352 0,363 0,375 0,387 0,398 0,420 0,431 0,442 0,450
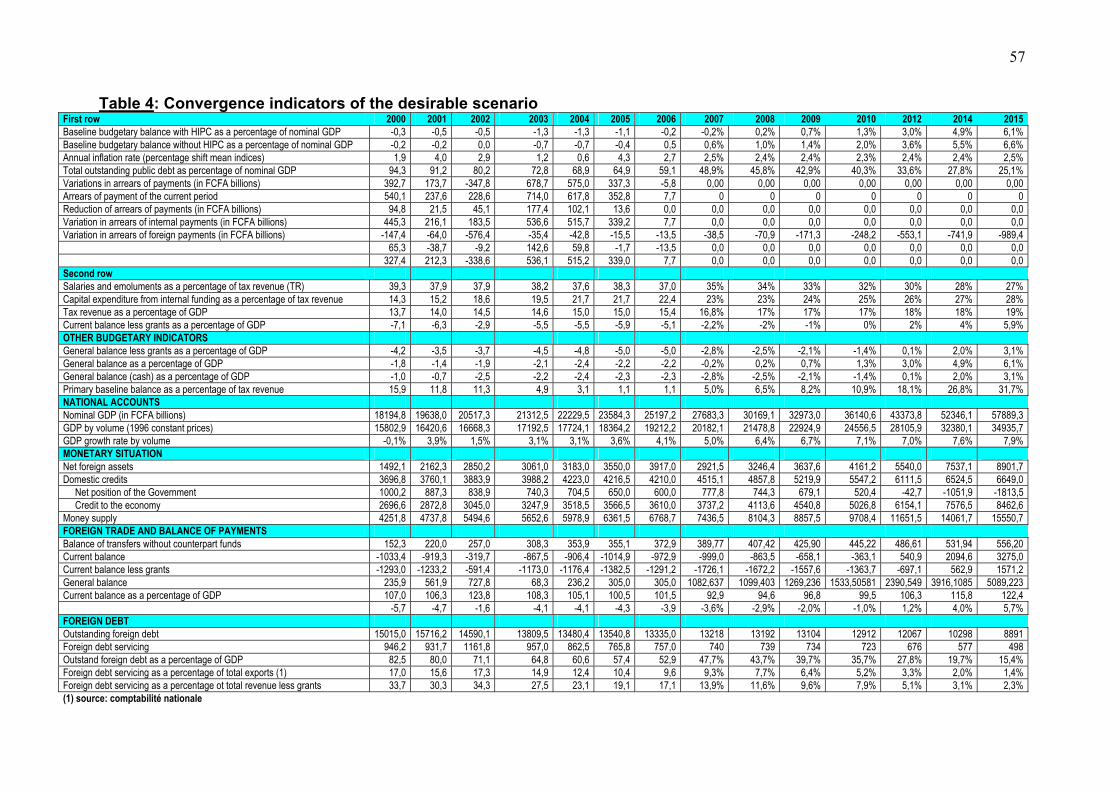
57
Table 4: Convergence indicators of the desirable scenario
First row 2000 2001 2002 2003 2004 2005 2006 2007 2008 2009 2010 2012 2014 2015 Baseline budgetary balance with HIPC as a percentage of nominal GDP -0,3 -0,5 -0,5 -1,3 -1,3 -1,1 -0,2 -0,2% 0,2% 0,7% 1,3% 3,0% 4,9% 6,1% Baseline budgetary balance without HIPC as a percentage of nominal GDP -0,2 -0,2 0,0 -0,7 -0,7 -0,4 0,5 0,6% 1,0% 1,4% 2,0% 3,6% 5,5% 6,6% Annual inflation rate (percentage shift mean indices) 1,9 4,0 2,9 1,2 0,6 4,3 2,7 2,5% 2,4% 2,4% 2,3% 2,4% 2,4% 2,5% Total outstanding public debt as percentage of nominal GDP 94,3 91,2 80,2 72,8 68,9 64,9 59,1 48,9% 45,8% 42,9% 40,3% 33,6% 27,8% 25,1% Variations in arrears of payments (in FCFA billions) 392,7 173,7 -347,8 678,7 575,0 337,3 -5,8 0,00 0,00 0,00 0,00 0,00 0,00 0,00 Arrears of payment of the current period 540,1 237,6 228,6 714,0 617,8 352,8 7,7 0 0 0 0 0 0 0 Reduction of arrears of payments (in FCFA billions) 94,8 21,5 45,1 177,4 102,1 13,6 0,0 0,0 0,0 0,0 0,0 0,0 0,0 0,0 Variation in arrears of internal payments (in FCFA billions) 445,3 216,1 183,5 536,6 515,7 339,2 7,7 0,0 0,0 0,0 0,0 0,0 0,0 0,0 Variation in arrears of foreign payments (in FCFA billions) -147,4 -64,0 -576,4 -35,4 -42,8 -15,5 -13,5 -38,5 -70,9 -171,3 -248,2 -553,1 -741,9 -989,4 65,3 -38,7 -9,2 142,6 59,8 -1,7 -13,5 0,0 0,0 0,0 0,0 0,0 0,0 0,0 327,4 212,3 -338,6 536,1 515,2 339,0 7,7 0,0 0,0 0,0 0,0 0,0 0,0 0,0 Second row Salaries and emoluments as a percentage of tax revenue (TR) 39,3 37,9 37,9 38,2 37,6 38,3 37,0 35% 34% 33% 32% 30% 28% 27% Capital expenditure from internal funding as a percentage of tax revenue 14,3 15,2 18,6 19,5 21,7 21,7 22,4 23% 23% 24% 25% 26% 27% 28% Tax revenue as a percentage of GDP 13,7 14,0 14,5 14,6 15,0 15,0 15,4 16,8% 17% 17% 17% 18% 18% 19% Current balance less grants as a percentage of GDP -7,1 -6,3 -2,9 -5,5 -5,5 -5,9 -5,1 -2,2% -2% -1% 0% 2% 4% 5,9% OTHER BUDGETARY INDICATORS General balance less grants as a percentage of GDP -4,2 -3,5 -3,7 -4,5 -4,8 -5,0 -5,0 -2,8% -2,5% -2,1% -1,4% 0,1% 2,0% 3,1% General balance as a percentage of GDP -1,8 -1,4 -1,9 -2,1 -2,4 -2,2 -2,2 -0,2% 0,2% 0,7% 1,3% 3,0% 4,9% 6,1% General balance (cash) as a percentage of GDP -1,0 -0,7 -2,5 -2,2 -2,4 -2,3 -2,3 -2,8% -2,5% -2,1% -1,4% 0,1% 2,0% 3,1% Primary baseline balance as a percentage of tax revenue 15,9 11,8 11,3 4,9 3,1 1,1 1,1 5,0% 6,5% 8,2% 10,9% 18,1% 26,8% 31,7% NATIONAL ACCOUNTS Nominal GDP (in FCFA billions) 18194,8 19638,0 20517,3 21312,5 22229,5 23584,3 25197,2 27683,3 30169,1 32973,0 36140,6 43373,8 52346,1 57889,3 GDP by volume (1996 constant prices) 15802,9 16420,6 16668,3 17192,5 17724,1 18364,2 19212,2 20182,1 21478,8 22924,9 24556,5 28105,9 32380,1 34935,7 GDP growth rate by volume -0,1% 3,9% 1,5% 3,1% 3,1% 3,6% 4,1% 5,0% 6,4% 6,7% 7,1% 7,0% 7,6% 7,9% MONETARY SITUATION Net foreign assets 1492,1 2162,3 2850,2 3061,0 3183,0 3550,0 3917,0 2921,5 3246,4 3637,6 4161,2 5540,0 7537,1 8901,7 Domestic credits 3696,8 3760,1 3883,9 3988,2 4223,0 4216,5 4210,0 4515,1 4857,8 5219,9 5547,2 6111,5 6524,5 6649,0 Net position of the Government 1000,2 887,3 838,9 740,3 704,5 650,0 600,0 777,8 744,3 679,1 520,4 -42,7 -1051,9 -1813,5 Credit to the economy 2696,6 2872,8 3045,0 3247,9 3518,5 3566,5 3610,0 3737,2 4113,6 4540,8 5026,8 6154,1 7576,5 8462,6 Money supply 4251,8 4737,8 5494,6 5652,6 5978,9 6361,5 6768,7 7436,5 8104,3 8857,5 9708,4 11651,5 14061,7 15550,7 FOREIGN TRADE AND BALANCE OF PAYMENTS Balance of transfers without counterpart funds 152,3 220,0 257,0 308,3 353,9 355,1 372,9 389,77 407,42 425,90 445,22 486,61 531,94 556,20 Current balance -1033,4 -919,3 -319,7 -867,5 -906,4 -1014,9 -972,9 -999,0 -863,5 -658,1 -363,1 540,9 2094,6 3275,0 Current balance less grants -1293,0 -1233,2 -591,4 -1173,0 -1176,4 -1382,5 -1291,2 -1726,1 -1672,2 -1557,6 -1363,7 -697,1 562,9 1571,2 General balance 235,9 561,9 727,8 68,3 236,2 305,0 305,0 1082,637 1099,403 1269,236 1533,50581 2390,549 3916,1085 5089,223 Current balance as a percentage of GDP 107,0 106,3 123,8 108,3 105,1 100,5 101,5 92,9 94,6 96,8 99,5 106,3 115,8 122,4 -5,7 -4,7 -1,6 -4,1 -4,1 -4,3 -3,9 -3,6% -2,9% -2,0% -1,0% 1,2% 4,0% 5,7% FOREIGN DEBT Outstanding foreign debt 15015,0 15716,2 14590,1 13809,5 13480,4 13540,8 13335,0 13218 13192 13104 12912 12067 10298 8891 Foreign debt servicing 946,2 931,7 1161,8 957,0 862,5 765,8 757,0 740 739 734 723 676 577 498 Outstand foreign debt as a percentage of GDP 82,5 80,0 71,1 64,8 60,6 57,4 52,9 47,7% 43,7% 39,7% 35,7% 27,8% 19,7% 15,4% Foreign debt servicing as a percentage of total exports (1) 17,0 15,6 17,3 14,9 12,4 10,4 9,6 9,3% 7,7% 6,4% 5,2% 3,3% 2,0% 1,4% Foreign debt servicing as a percentage ot total revenue less grants 33,7 30,3 34,3 27,5 23,1 19,1 17,1 13,9% 11,6% 9,6% 7,9% 5,1% 3,1% 2,3% (1) source: comptabilité nationale

58
Table 4: Difference between desirable and trend-related Economic indicators 2004 2005 2006 2007 2008 2009 2010 2012 2014 2015 Real GDP growth rate 0,0% 1,3% 1,7% 1,7% 1,9% 1,6% 2,0% 2,2% Impact on the capital stock 0,6% 0,5% 0,6% 0,7% 0,9% 0,0% 0,0% 0,0% Investment rate 1,4% 3,9% 5,6% 7,4% 8,9% 7,2% 8,6% 9,3% Intra-zone exports 2,4% 1,7% 2,9% 3,3% 4,2% 5,8% 8,1% 9,3% Intra-zone imports 0,6% 1,6% 2,7% 3,2% 4,2% 6,6% 10,5% 13,0% Intra-zone trade 1,5% 1,7% 2,8% 3,3% 4,2% 6,2% 9,2% 11,0% Total balance less grants as a percentage of GDP 0,0% 1,2% 0,6% -0,2% -0,8% -1,6% -1,8% 0,3% Current balance less grants as a percentage of GDP 0,0% 0,6% 0,4% 0,3% 0,4% 1,1% 2,7% 3,9% Fiscal pressure 1,9% 1,2% 1,4% 1,5% 1,7% 2,1% 2,5% 2,7% Education sector 2004 2005 2006 2007 2008 2009 2010 2012 2014 2015 Gross primary school enrolment rate 3,4% 3,2% 6,5% 10,1% 12,2% 11,9% 11,8% 8,2% Net primary school attendance rate 1,5% 0,7% 3,0% 5,6% 8,2% 13,2% 18,0% 17,0% Rate of promotion to class 4 1,5% 1,0% 2,5% 4,2% 5,9% 9,1% 12,2% 11,5% Adult illiteracy rate -2,0% -0,9% -2,5% -4,3% -6,0% -8,9% -11,3% -9,1% Illiteracy rate of 15 – 24 years olds -2,7% -2,5% -4,3% -6,2% -7,8% -10,6% -12,9% -11,3% Illiteracy rate for women aged 15 years or more -2,2% -1,5% -3,2% -5,0% -6,7% -9,6% -12,2% -10,2% Percentage of girls in primary school 1,3% 1,0% 2,1% 3,4% 3,5% 3,4% 3,3% 1,3% Gross school attendance rate 2,2% 1,6% 3,7% 6,2% 8,5% 13,1% 17,4% 17,2% Health sector 2004 2005 2006 2007 2008 2009 2010 2012 2014 2015 Life expectancy at birth 0,53 0,96 1,49 2,09 2,74 3,42 4,87 5,64 Infant mortality rate per 1000 live births - - 7,56 - 14,42 - 20,68 - 26,05 - 30,72 - 38,46 - 41,71 Infant mortality rate (less than 5 years of age) per 1000 live births - - 5,07 - 9,64 - 13,84 - 17,45 - 20,61 - 25,89 - 28,12 Maternal mortality rate per 1000 - - 58,8 - 108,7 - 151,4 - 186,0 - 214,5 - 258,8 - 276,3 Malnutrition rate for children under 5 years of age - - 1,03 - 1,97 - 2,86 - 3,63 - 4,32 - 5,48 - 5,98 HIV prevalence rate - 0,68 - 0,93 - 1,16 - 1,36 - 1,54 - 1,69 - 1,94 - 2,04 Per capita income - 2,42 7,27 12,58 18,72 24,94 37,66 46,12 Impact of poverty -0,3% -1,3% -3,2% -5,2% -7,6% -9,9% -15,0% -18,1% HDI 0,01 0,01 0,02 0,03 0,04 0,05 0,07 0,08