reotdocumentation page - dtic.mil page ... 'the breakdown of native and anodically -grown oxide...
TRANSCRIPT

REOTDOCUMENTATION PAGE 0ONo. 00-1-
O.swi~s ,anwa. jute IlC4 Atoirnqlaon.4 aý2.243O2. hsto tmi Ofrtce of mariaiatyWAI and duage,t oras C253
1.AGENCY USE ONLY (Le-a" OWNfl) 2. REPORT OATF 3 REPORT TYPE AND DATES COVERED1/20/94 Interim 6/93 - 12/93
4L TITLE AND SUBTITLE S. FUNDING NUMBERS
0 N00014-91-J-1927Go Pitting Corrosion of Titanium
6. AUTHOR(S) R&TCd 1V0
Norberto Casillas, Steven J. CharleboisWilliam H. Smyri and Henry S. White I____________
~- 7. PERFORMING ORAIZTO NAME(S) AND AOCIRESSUES) '8. PREPORTIN GUBRGNZTC
Department of ChemistryREOTNMRg~ Henry Eyring Building
University of Utah 28Salt Lake City, Utah 84112 1.SONRLGONTIN
SPONSORiNG '.,-NITCRING AGENCY _".13(S 6-if 1.SONSikG vDNTRN
Office of Naval Research ',5Z~iC' ~?R-'iUMBER.800 North Quincy Street v-
Arlington, Virginia11MM
11. SUPPLEM4ENTARY NOTES
12a. DISTRIBUTIONi AVAILABILITY STATEMENT V~~3~9~3A~~~I 12b. DISTRIBUTION CODE
Appov~d for puM! re~umqDbtrlbution UnliMitd
13. ABSTRACT :.Wasimum 100 woros)
'The breakdown of native and anodically -grown oxide films on Ti electrodes is investigated by scanningelectrochemical microscopy (SECM), video microscopy, transmission electron microscopy andvoltarnietry. SECM is used to demonstrate that the oxidation of Br on Ti occurs at microscopic surfacesites (10 - 50 pim diameter. 30 sites/cm2) that are randomly positioned across the oxide surface. After
~ ~o determining the position of the active sites for Br oxidation, breakdown of the oxide is initiated byincreasing the electroe potential to more positive values. Direct correspondence is observed between thelocation of the electroactive sites and corrosion pits, indicating that oxide breakdown is associated with a
~ I localized site of high electrical conductivity. The potential at which pitting is observed in voltamrnetric
0 I eperimnts is found to be proportional to the average oiide thickness, for values ranging between 20I and10 A indicating that breakdown is determined either by the magnitude of the electric field within
C)0 the oxide or by the interfacial potential at the oxide/Br solution interface.Pitnocusasgifanl~ (.0 lower potentials in Br solutions than in C[ outions, suggesting a strong chemical interaction between- the Ti02 surface and Br. A mechanism of oxide breakdown is proposed that is based on the potential-
dcpcndcnt chemical dissolution of the oxide at microscopic surface sites.
14. SIUIC- Timmt, S. NUMBIR OF PAGES;c~inninir Etectrrchemical Xicroscopy; Corrosion Pitting.
I" r -inl !iitI 16. PRICE coot
17, SICUN%1Y CLA$SJEIATPOSOIt SECURITY CLASSIDICAIIO 1; EUIY 1S~C Q. ILINUTA TION CIP ABSTRACTall "IPO# Do T?11 PACE OP AISTRACT
11lckqiA f led Uncagifqled U~ngt~ _________
941 24 054

OFFICE OF NAVAL RESEARCH
Contract N00014-91-1-1927
R&T Code 413v001
Technical Report No. 28
PITTING CORROSION OF TITANIUM
by
NORBERTO CASILLAS, STEVEN J. CHARLEBOIS.WILLIAM H. SMYRL AND HENRY S. WHITE
Prepared for Publication in
Journal of the Electrochemical Society
University of UtahDepartment of ChemistrySalt Lake City, UT 84112
December 16, 1993
Reproduction in whole or in part is permitted for any purpose of the United States
Government.
This document has been approved for public ref-ase and sale; its distribution is unlimited.

PITTING CORROSION OF TITANIUM
Norberto Casillas, Steven Charlebois, William H. SmyrlDepartment of Chemical Engineering & Materials Science
University of MinnesotaMinneapolis, MIN 55435
anid
Henr' S. WhiteDepartment of Chemistry
University of UtahSalt Lake City, UT 84112
ABSTRACT. The breakdown of native and anodically-grown oxide films on Ti
electrodes is investigated by scanning electrochemical microscopy (SECM),
video microscopy, transmission electron microscopy, and voltammetry. SECMI
is used to demonstrate that the oxidation of Br- on Ti occurs at microscopic
surface sites (10 - C0 g.±m diameter, 30 sites/cm2 ) that are randomly positioned
across the oxide surface. After determining the position of the active sites, for
Br- oxidation, breakdown of the o.xdde is initiated by increasing the electrode
potential to more positive values. Direct correspondence is observed between
the location of the electroactive sites and corrosion pits, indicating that oxide
breakdown is associated with a localized site of high eletrical- conductivity.
The potential at which pitting is observed in voltammetric experiments is
found to be proportional to the average oxide thickness, for values ranging
between 20 and 100 A, indicating that breakdown is determined either by the
magnitude of the electric field within the oxide or by the interfacial potential
at the oxide/Br" solution interface. Pitting occurs at significantly lower
potentials in Br- solutions than in C1" solutions, suggesting a strong chemical
interaction between the TiO2 surface and Br-. A mechanism of oxide
breakdown is proposed that is based on the potential-dependent chemical o
dissolution of the oxide at microscopic surface sites. 5Eti ULunin-ced
Subm itted to ]. L kctrochem . Soc., July, 1993.B Jut ifiy t'eut
DTIo qUjALrry iNsPECTED 0 Avtnhlab ility 8o
Avail and/,/
!Distf pqaS....L....it._•

INTRODUCTION. The chemical stability of Ti is due to the formation of a thin
TiO2 film on the surface. The oxide film, which is -20A thick in the native state,
is chemically inert in air and most aqueous solutions, and serves to separate
the highly reactive underlying Ti metal from corrosive environments.
Breakdown of the TiO2 film in aqueous halide solutions occurs rapidly when the
potential of the metal is increased to values above -lV, the exact potential
being dependent on the identity of the halogen ion. Following oxide
breakdown, exposure of the Ti substrate results in rapid growth of a corrosion
pit.
The most detailed investigations of corrosion pitting of Ti in halide
solutions are described by Dugdale and Cotton1 and by' Beck.2 ,3,4. One of
several findings of these earlier studies is the tendency for Ti electrodes to pit
at significantly lower potentials in Br- solutions than in either I- or Cl"
solutions. To our knowledge, an explanation of this observation has not yet
been described.
In a preliminary report from our laboratories$, the breakdown of 50 A-
thick oxide films on Ti electrodes immersed in aqueous solutions containing Br-
was shown to occur at randomly positioned, microscopic surface sites that were
identified by scanning electrochemical microscopy (SECM) prior to corrosion
pitting. A key finding of this investigation was that the site of oxide
breakdown correlated with a highly localized i'brface activity for Br- oxidation.
These studies suggested that the electrical conductivity of the TiO2 film is
highly non-uniform, and that this spatial heterogeneity is associated with the
mechanism of oxide film breakdown. Electron tunneling spectroscopy of the
electrodes, employing a scanning tunneling microscope, more directly
demonstrated local variations in the conductivity of the oxide, albeit for

reasons that are not understood, but that are probably related to variations in
the structure (e.g, defect density) or stoichiometry of the film 6 .
In the present report, a detailed description of SECM imaging of Ti
electrodes in Br- solutions is described. In addition to extending our previous
analyses of the localized oxidation of Br- at microscopic surface sites, and the
correlation of such sites as precursors for pitting, we now report
measurements of the rate of Br- oxidation and the potential of oxide breakdown
as a function of the oxide film thickness. The rate of Br- oxidation at precursor
sites for oxide breakdown is shown to decrease with increasing film thickness,
concurrent with an increase in the potential necessary to initiate pitting. The
results suggest that the above mentioned acceleration of oxide breakdown in
Br- solutions is related to a potential-dependent chemical interaction between
the oxide and the solution anion. A mechanism of oxide breakdown is
proposed that is consistent with the observed dependence of breakdown on the
film thickness, the chemical specificity to Br-, and the local spatial variations
in the electrochemical activity for Br- oxidation prior to pitting. In addition
to these studies, a method is described for preparing free-standing 50 A-thick
TiO2 films.
EXPERIMENTAL
Preparation of Ti Electrodes. Ti electrodes were constructed from 25 gm thick,
-5 mm x 25 mm rectangular samples of 99.98% commercially pure T! (Johnson
Matthey, Ward Hill, MA). A copper wire was attached to the foi! using silver
epoxy (Acme, Inc). The copper wire and silver epoxy were sealed into the end
of a glass pipette with epoxy (Dexter, Inc), exposing the sides and the edges of
the Ti sample.
3

Ti electrodes were etched in a solution containihg 2% (by vol.) HF
(Mallinckrodt Inc.), 4% HNO 3 (Fisher Scientific Inc.) and 94% H20 by wiping
the surface with a cotton swab that was wetted with the etching solution. The
electrodes were rinsed with deionized water and dried in air. Anodic growth of
oxide was performed in a 0.05 M H2S0 4 solution. The electrode was immersed in
the 0.05 NI H2SO 4 solution until an open-circuit potential of -0.25 V vs a
saturated calomel electrode (SCE) was obtained. The potential of the Ti
electrode was then scanned from the open-circuit value to the desired oxide
growth potential at a rate of I mV/s. A typical oxide growth curve is shown in
Fig. 1. The thickness of the oxide film was determined using a calbration plot
of ellipsometrically-measured thickness (t) vs final growth potential, reported
by Ohtsuka et al. 7 The calibration plot was established using a growth
procedure similar to that employed in the present study.
All voltammetric measurements were performed using a conventional 3-
electrode cell configuaration, with a Pt counter electrode and a SCF. reference
electrode.
Scanning Electrochemical Microscopy. Fig. 2 shows a schematic of the
scanning electrochemical microscope (SECNI). A custom-built Teflon cell, used
in previous iontophoresis/SECM experiments 8- 1 2 , was adapted for imaging Ti
electrodes. Four ports, positioned one on-each side of the corrosion cell, held
two platinum auxiliary electrodes and two SCE reference electrodes.
The SECM scanning tip was an 8 ýim diameter carbon fiber (Johnson
Matthey) insulated with polyphenylene oxide except at the very tip. The
method of preparing the carbon fiber followed the procedure of Potje-Kamloth
et al.13 The upper 10 mm of a 20 mm-long carbon fiber was inserted into a 3
mL glass microcapillary (Drummond Scientific Inc.) and sealed at the end with
4

I
epoxy (Dexter Mic.). To provide a conductive path to the scanning tip, a 0.25
mm-diameter tungsten wire (Johnson Matthey Inc.) was inserted into the end
of the microcapillary and attached to the carbon fiber with silver epoxy.
Polyphenylene was electrodeposited on the lower portion of the fiber from a
40:60 H20/methanol solution containing 0.25 M 2-allyiphenol (Aldrich, Inc.),
0. I M ammonium hydroxide (Mallinckrodt Inc), and 0.2 M 2-butoxyethanol
(Fisher Scientific Inc.). A 3-electrode cell configuration was used to deposit
polyphenylene oxide on the carbon fiber for 2 minutes at a potential of 4 V vs
SCE. The insulated carbon fiber was then rinsed with a 40/60 mixture of
H20/methanol and cured at 130 oC for 30 min. The active area of the carbon
fiber microelectrode was exposed by cutting the insulated fiber using a razor
blade. The electrochemical activity of the fiber was tested by cyclic
voltammetry in a 0.1 M K3 Fe(CN) 6 solution prior to use in SECM imaging.
The potential of the Ti electrode and SECM scanning tip were controlled
independently using two potentiostats, both operating in a conventional 3-
electrode configuration. A Pine Instrument RDE4 potenfiostat w'as used to
control the potential of the Ti electrode. A previously described custom-built
low-current potentiostat was used to control the potential of the SECM
scann--'- ip. 9
The typical procedure for obtaining a SECM image is as follows. First, the
Ti electrode is immersed in the i NI KBr, 0.03NI H2S04 solution without applying a
potential bias to either the SECNI scanning tip or the sample. The SECM tip is
lowered until it touches the Ti surface, producing a slight bend in the carbon
fiber. The tip is then slowly raised until it is straightened. This position is
taken as the vertical zero position (z = 0). From the zero point, the carbon fiber
is moved away from the Ti surface until a gap of approximately 10 - 20 4.tm is
established. After verifying free movement of the tip in the x-y plane, the
5
potential of the SECM tip and sample are set to constant values and the SECM tip
is scanned in the x-y plane. The tip is scanned at a rate of 40 p. m/s.
SECM images are constructed by plotting the current measured at the tip
vs the position of the tip as it is rastered in the x-y plane. Eight hundred data
points are collected during each line scan in the x direction; every 4
consecutive data points are averaged resulting in 200 stored data points per
scan. Low-resolution survey images are acquired by incrementing the tip in
the y direction by 100 i.im after every line scan. Higher-resolution images
were acquired by incrementing the tip in the y direction by -10 i±m after each
line scan. Acquisition of a 400 x 400 4m 2 image using the latter mode requires
-15 minutes.
Only high resolution images are reported in this article. However, the
low-resolution survey scans are especially useful in initially identifying the
positions of electroactive sites on the Ti surface, as well as for rapidly
collecting data for the statistical analysis of the number of electroactive sites
on a large area sample. Identification of the electroactive sites was a1so greatly
facilitated by converting the SECM tip reponse to an audio signal, Fig. 2. The
frequency of the audio reponse was proportional to the tip current, alerting
the experimentalist, in real time, that the SECNI tip was above a site of high
electrochemical activity. Since the number density of sites that occur on the
samples investigated was extremely low (-:30 per cm 2 , vide infra), the low
resolution method of on-line detection was found to be particularly useful,
reducing the analysis time by an order of magnitude. Once an electroactive
site had been located, the higher resolution imaging mode was employed to
obtain the images presented in this article. Data acquisition and x-y
positioning are controlled by an IBM XT microcomputer as previously
6

described. Stored data are replotted in 16-level gray scale format using a
Macintosh II-ci computer.
The Ti electrode and the scanning tip are monitored during imaging
using a video camera (JVC Inc.) equipped with a 50 X magnification zoom-lens;
video images are recorded using a VHS video recorder (JVC Inc.).
Surface an, ises of free-standing Ti02 films. Transmission electron
microscopy (JEOL 100CX electron microscope), x-ray photoelectron
spectroscopy (Perkin-Elmer Phi 5400 ESCA), and Auger electron spectroscopy
(Physical Electronics) were used for analysis of free-standing 50 A-thick TiO 2
films. Free standing films were prepared by biasing a Ti electrode (t = 50A) in
a 1 NI KBr, 0.05 NI H2S04 solution at a potential sufficiently positive (-3-5 V vs
SCE) to initiate the growth of 3 - 4 active pits. Rapid dissolution of the Ti metal
beneath the oxide film occurred without further initiation of active pits, as
readily determined by video microscopy (vide infra). After -10 minutes, all of
the Ti electrode had dissolved, yielding 2 (back and front sides) large area 50 A
TiO2 films. The films spontaneously collapsed and brok-e 'into smaller pieces;
however, millimeter-size pieces of the TiQ2 films were carefully collected from
the solution using a 200-mesh gold (Electron Microscopy Sciences Inc.) or 400-
mesh platinum (Asar Co.) microscope grids. The films were then immersed in
H20 to remove any remaining KBr solution. The o.,dde films were collected from
the H2 0 using microscope grids and stored in a desiccator for 48 hours prior to
surface analyses.
RESULTS AND DISCUSSION.
Voltammetric Behavior of Ti Electrodes. Titanium is susceptible to pitting
corrosion in aqueous solutions containing Br- over a wide range of solution
7

pH14 . Our experiments are limited to investigations of Ti electrodes with either
a native or anodically-grown oxide film, immersed in a 1 NI KBr, 0.05 M H2SO 4
solution (pH = 1.05) that was exposed to the ambient environment. All
references to Br-containing solutions refer to this specific solution
composition. All electrode potentials are referenced to the SCE.
Fig. 3 shows the voltammetric behavior (scan rate = 1.0 mV/s) of Ti
electrodes immersed in the Br- solution for several different oxide thicknesses.
The potential at which oxide breakdown occurs, Ep, is readily identified by an
abrupt increase in the current density near the end of the positive scan.
Visual inspection of the electrode surface immediately after the onset of pitting
showed the presence of several large corrosion pits. Fig. 3 also shows that Ep
shifts to positive potentials with increasing oxide thickness.
The voltammetric response of Ti electrodes with oxide thicknesses, t,
between 40 and 70 A also exhibited a broad anodic wave in the voltammetric
curve between 1.2 V to 2 V. This wav'e corresponds to the oxidation of Br- at the
TiO2 surface, and is completely absent in solutions containing only H2 S0 4
(compare Fig. I and 3). In one set of experimeints, the amount of
electrogenerated Br2 present in the solution was periodically measured by UV-
visible spectroscopy and found to be in good agreement (within 5%) with the
value calculated by integration of the charge under the anodic wave.
Br- oxidation is insignificant for oxide, films thicker than -70 A, as
indicated by the absence of the anodic wave centered between 1.2 and 2 V. For
omide films thinner that -40 A, the onset of pitting and Br- oxidation occur at
approximately the same potential, as shown in Fig. 3 for electrodes coated with
a native oxide and a 30 A-thick anodic oxide.
For electrodes with oxide films of intermediate thickness, e.g., t - SO A,
the anodic wave corresponding to Br- oxidation decays to background current
8

levels when the potential is more positive that -1.6 V. Thus, the i-V curves in
Fig. 3 do not represent steady-state responses. If* the potential of the electrode
is scanned repeatedly between 0 and 2 V, the size of the anodic wave is rapidly
diminished. Our interpretation of these findings is that electrode potentials
more positive that 1.6 V result in passivation of the surface towards Br
oxidation. The fact that the Br- oxidation wave is not observed for t > 70 A,
indirectly indicates that an increase in the thickness of the 50 A-thick oxide
layer, beginning at -1.6 V, is responsible for the observed time-dependent
decrease in rate of Br- oxidation.
A low power microscope was used to determine the number of pits on
the TiO2 surface. Analyses of 25 Ti electrodes for each oxide thickness, made
for the first two minutes after the first pit appeared, yielded values of 20 + 10
pits/cm 2 for t = 20 A (native oxide), 6 3 for t = 30A, 5 ± 2 for t = 50/ Aand 3 + 2
for t = 90 A. rhe larger number density of' pits observed f'or the native oxide
films suggests the existence of a larger number of precursor sites for oxide
breakdown. The existence of these precursor sites is demonstrated using SECM,
as discussed in a later section. . -
Fig. 4 shows the dependence of the breakdown potential, Ep, on the
oxide film thickness, t. Each data point represents at least 10 independent
measurements of Ep. 'rhe data indicate that EL has an approximately linear
dependence on the oxide thickness, a poiitt that we shall address later in the
discussing the mechanism of pitting. The dependence of Ep on scan rate has
not been investigated: however, we note that pitting is observed to occur at
substantially lower potentials than the values indicated in Fig. 4, if the
electrode is biased at a constant potential for extended periods (e.g., 40 minutes
at 1.5 V for a SO A thick film). Thus, the reported values of Ep most likely are
affected by the kinetics of the breakdown reaction.
9

The temperature dependence of the pitting potential was briefly
investigated. Fig. 5 shows voltammetric curves obtained at 0 and 22 °C for
electrodes passivated by a native oxide film. In qualitative agreement with
the more extensive studies of Beck 3 , the onset of pitting in Br- is shifted
positive by 2 += I V at the lower temperature, suggesting that pitting is a
thermally activated process.
Active Pit Growth and Free-Standing Oxide Films.
The growth of active pits on a Ti electrode (t 50A) was recorded using
video microscopy. Fig. 6 shows an example of a time-lapse sequence showing
pit nucleation and growth over a -2 minute period. In this experiment, the
electrode was scanned at 1 mV/s to the pitting potential (-2.5 V, as noted by a
sudden increase in current). The growth of the pit results in a steady stream of
gas bubbles that emerges from a singular point on the surface (Fig. 6). During
the next 2 minutes, pits nucleate and growth at several locations on the
surface, each producing a stream of small bubbles. A-particularly;" interesting
feature of pit growth is that as the metal rapidly dissolves, a thin oxide "veil" is
generated that covers the region of metal dissolution. Using a video camera
with a S0 X magnification lens, the gas bubbles are observed to flow through a
small circular opening in the oxide veil, which is located at the point of oxide
breakdown. Oxide veils over several large pits (-2 mm diameter) can be seen
in Fig. 6. The openings in the oxide film, which are not apparent in the
reproductions of the low-resolution micrographs, have diameters on the order
of 50 pm.
Fig. 7 shows a schematic picture of the pit geometry (not drawn to scale)
and the processes occurring within the pit. Ti dissolution is rapid within the
pit cavity as noted by the moving boundary of the metal/solution interface.
10
The gaseous products, which have not been analyzed, can be seen in the video
tapes to flow radially from the metal/solution interface towards the center of
the circular-shaped pit, escaping through the small opening in the oxide film.
Continued metal dissolution leads to overlapping pits (Fig. 6). Eventually, the
pits extend to the edges of the electrode, resulting in complete dissolution of
the electrode. At the end of the experiment, two 50 A-thick free-standing
oxide films (corresponding to the front and back oxide layers) remain attached
to the glass tubing and epoxy that initially supported the (dissolved) electrode.
The films tend to collapse during attempts to remove them from the solution.
However, millimeter-size pieces can be collected from the solution (see
Experimental Section) and examined by ex-situ microscopy and surface
spectroscopy.
Fig. 8 shows a TENM micrograph of a free-standing 50 A TiO2 film produced
by the above method. The oxide film is polycrystalline with an average grain
size of 1.5 gm 2 . Electron diffraction patterns of the free-standing films
indicate that individual grains are crystalline. Auger electron spectrioscopy
(AES) of the films yield signals for Ti, 0, C and S, the strongest signals at 390 eV
and 505 eV corresponding to Ti and 0, respectively 15. The presence of C and S
signals likely correspond to surface contamination. Results from X-ray
photoelectron spectroscopy are consistent with the AES data. In addition, AES
depth profiling of the oxide films did not sh6w pcaks corresponding to Br,
indicating that there was very little, if any, diffusion of Br- into the oxide film
during the pitting experiment.
Scanning Electrochemical Mlicroscopyý (SECMI). In a previous reportS, SECNI
was used to demonstrate large spatial variations in the rate of oxidation of Br-
on T'i electrodes. The SECM tip (an 8 .tm-diameter carbon fiber microelectrode)
11

was rastered across the Ti surface while being held at a potential sufficiently
negative of the standard redox potential of the Br'/Br2 couple to reduce Br2 at
the mass-transport limited rate, Fig. 9. The rate of Br2 reduction is a direct
measure of the local concentration of Br2 at the surface of the Ti electrode.
Thus, variations in the cathodic current at the SECNI tip, as a function of the tip
position, reflect local variations in the rate of Br- oxidation on the Ti surface.
Only electrodes covered by 50 A-thick anodically-grown oxide films were
investigated in the SECM experiments. Oxide films of thickness less than 40A
tended to break down at potentials that significantly overlap with Br- oxidation,
Fig. 3, making it impossible to detect tlr2 generation prior to pitting. On the
other hand, Br" oxidation is immeasurably slow on Ti electrodes that have oxide
films of thickness greater than 70 A. For the intermediate oxide thicknesses,
Br- oxidation is sufficiently fast that it can be detected in the SECM
experiments, and since Br2 i- electrogencrated at potentials well-below the
pitting potential at 5OA thick oxide, the surface can be readily imaged prior to
breakdown. However, as noted above, if an electrode with a 50A thick oxide
is held at a constant potential within the potential region )%her-e Br- oxidation
occurs (e.g., 1.5 V), oxide breakdown will occur after an induction period of .-40
minutes. For this reason, a relatively large tip scan rate of 40 ý.m/s was used
to acquire images prior to breakdown. As shown below, this rather fast scan
speed resulted in some distortion of the SEICM images due to convective flow
induced by the tip.
Fig. 10 shows SECM images (400 x 400 p.tm 2 ) for 4 different Ti electrodes (t =
50A). The SECNI tip was maintained at a constant potential of 0.6 V and
positioned -20 gm above the surface. When the Ti surface was baised at
potentials below 1.0 V, SECNI images %w'ere essentially featureless and the tip
current was of the magnitude of -0.1 nA. At potentials between 1.0 and 2.0 V,
12
SECM images revealed a number of' microscopic sites where the Br2
concentration was large. For example, Fig. 10 (a) illustrates a typical SECM
image of an electroactive site on the TiO2 surface. The sample was held at a
potential of 1.3 V during the scanning. The maximum current detected in this
area was 1.45 nA, well above the background current of 0.1 nA. The large
differences between the maximum and the background currents clearly
demonstrates that the oxidation of Br- does not occur uniformly across the
surface.
The number of surface sites active for Br- oxidation on the anodic
surfaces is small. From low resolution survey scans on several electrodes, a
value of 30 - 10 sites/cm 2 was determined for the 50 A thick TiO2 films.
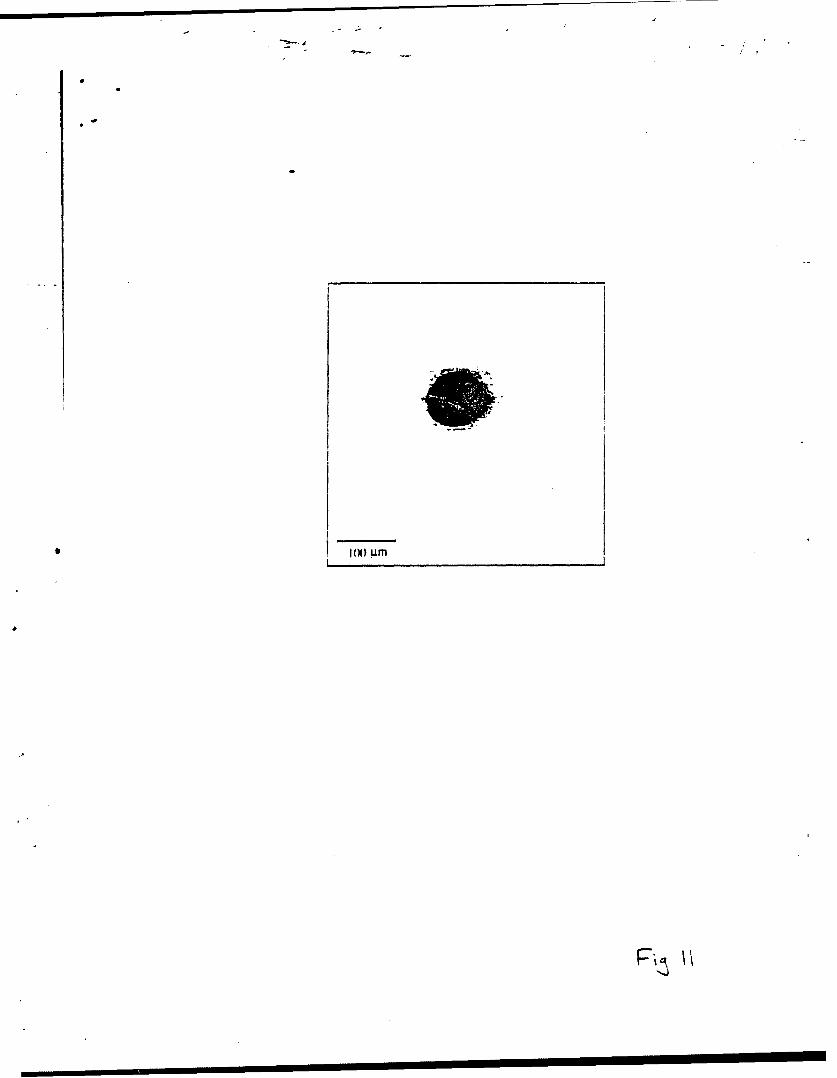
To estimate the size of the electroactive sites on the Ti electrode, a 25 gm-
diameter Pt microdisk electrode was imaged by SECNi in the same Br- solution.
The potentials for the SECM tip and Pt disk were maintained at 0.6 V and 1.0,
respectively, and the tip was positioned -20 4•m above the Pt surface. Fig. 11
shows a typical image of the Pt disk. Comparison of this image with the SECM
images in Fig. 10 demonstrates that the dimensions of Lheetecriroactive sites on
the Ti electrode are comparable to that of the Pt disk. We estimate that the
diameters of the electroactive sites range from 10 to 50 pLm. The rate of Br-
oxidation, as estimated from the magnitude of the SECNI tip current, is an order
of magnitude larger on the Pt disk that for .khe most active sites on the Ti
electrodes. Although the rate of Br- oxidation at the microscopic sites is
sufficiently large to allow their detection by SECNII, the smaller currents
indicates that the reaction proceeds at a kinetically- controlled rate. This
finding is not surprising in view of the fact that the average thickness of the
oxide film is 50 A.
13

Each of the images in Figs. II and 12 are slightly distorted due to the
high tip scan speed employed In these studies. The tip movement causes the
fluid to flow in the direction of the scan, resulting in nonspherical
concentration profiles around the Pt disk or electroactive sites on Ti, as is
evident in the images. The effect is pronounced in the 1.0 N1 3r- solutions,
where a relatively dense layer of Br2 is generated between the tip and
substrate.
The SECNI image contrast is a function of the potential applied to the Ti
substrate, due to the potential dependence of Br- oxidation on this substrate.
Fig. 12 shows a set of four images of an electroactive site obtained at different
potentials. Fig. 12 (a) shows the image of the active site at a potential of 1.3 V,
%%ith a maximum current of 0.16 nA, and a detected background current of 0.09
nA. Fig. 12 (b) shows the same area taken 13 minutes later at a potential of 1.4
V. The maximum current has increased to 0.18 nA. Fig. 12 (c) shows the same
area scanned at a potential of 1.56 V. The current at the center of the active site
increased to 0.24 nA. 'Fig. 12 (d) shows an image of the same area taken 40
minutes later at the same potential. I lere, the maximum current has decreased
to 0. 18 hA, due to slow passivation of the surface, as previously discussed.
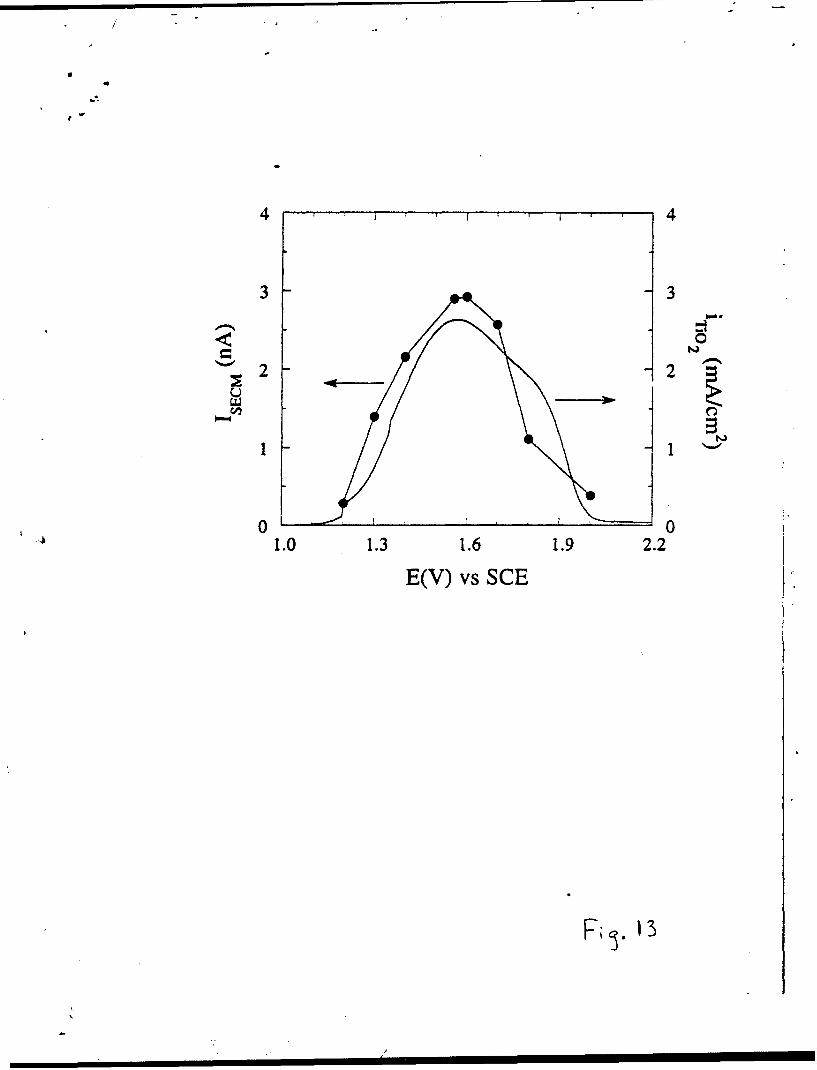
Fig. 13 shows a comparison between a voltammetric curve obtained for a
50 A thick film at I mV/s (Fig. 3), and a i-V curve constructed from values of
the maximum SECI tip current measured above an electroactive site. Both
curves display similar shapes, with a maximum current at -1.6 V.
14

Proposed PiRting Mechanism.
The mechanism for oxide breakdown and pitting must be consistent with
the following experimental observations:
1. The microscopic sites at which breakdown occurs are electrochemically
active. It therefore follows that the electrical conductivity of the oxide is
high at these sites relative to the surrounding film.
If. Oxide breakdown occurs at more positive potentials with increasing
average oxide film thickness.
II. Oxide breakdown occurs at significantly lower potentials in Br- solutions
(Ep s 5 V) relative to CI (Ep >_ 10 V), as previously demonstrated by Dugdale
and Cotton 1 and by Beck 2 ,3, 4 . We have confirmed their results using Ti
electrodes prepared in our laboratory.
Observation I clearly indicates that sites of oxide-ýeakdvown have a
distinctly different structure or chemical composition in comparison to the
average properties of the oxide film. For this reason, there is no need to
discuss the breakdown mechanism in terms of stoichastic events. Observation
If suggests that oxide breakdown occurs either when the electric field within
the film exceeds a critical strength or when the potential at the TiO2/solution
interface exceeds a critical value. Both the field within the oxide and the
interfacial potential will increase as the electrode potential is increased to
positive values 16.
The chemical specificity of breakdown to solutions containing Br-
clearly eliminates any mechanism Involving simple electrical or thermal
15

breakdown, as occurs in metal/dielectric/metal structures.' Such a mechanism
would result in similar behavior for all of the halides. Beck's observation that
the pitting potential has different temperature dependencies in Br- and I-
solutions further suggests that the mechanism of pitting in solutions
containing these halide ions may be completely different.
The involvement of the anion, coupled with the dependence of the
pitting potential on oxide thickness, suggest a potential-dependent chemical
dissolution of the outermost layer of the oxide in the presence of Br-. Ti+4
readily forms a number of soluble oxo halide salts in acid solutions. We
speculate that chemisorption of Br- would be most pronounced at positive
potentials, promoting the formation of' Ti-Br bonds at the oxide/solution
interface and subsequently, oxide dissolution.
The dependence on Ep on film thickness is the consequence of a larger
potential crop occurring within the thicker films, i.e., for a constant applied
potential, the potential at the oxide/solution interface would be less positive
for a thicker film, resulting in a decrease in the concentration, or
chemisorption, of Br- at the interface 1 6 . The bretk-down of the film, as is
indicated by the abrupt increase in the current density (Fig. 3), would be
anticipated based on this mechanism as a result of the rapid increase in the
interfacial potential as the film became thinner.
Fig. 14 schematically depicts the ,,arious processes that occur during a
voltammetric experiment and that lead to oxide breakdown. Based on SECM
images of the Ti electrodes, the oxide film contains a low number density of
sites (,30 sites/cm 2 ) that possess sufficient electrical conductivity for Br-
oxidation to occur at relatively fast rate. In Fig. 14, these sites have been
depicted as a region where the insulating nature of the oxide is compromised,
without regard to the physical or chemical properties of the oxide at the
16

microscopic site. For a 50 A-thick oxide film, the following sequence of
events appear to occur during a voltammetric scan (e.g., Fig. 3 for t = 50A).
Very little current flows at potentials negative of the redox potential of the Br-
/Br2 couple (Fig. 14a). As the potential is biased to values positive of -1.2 V,
Br- is rapidly oxidized at the microscopic sites (Fig. 14b). This process
continues at higher potentials until the conductivity of the microscopic sites is
reduced, most likely due to thickening of the oxide film (Fig. 14c). We note
that a local increase in the oxide thickness at the microscopic sites, without an
increase in the average film thickness, is sufficient to cause the passivation of
the surface towards Br- oxidation. Between -2 and 3 V, Br- is strongly
chemisorbed (Fig. 14 d) leading to dissolution of the film and the growth of a
pit.
The results presented here show that precursor sites for pitting. of Ti
may be identified with SECNI. Further work will be needed to determine how
precursor sites are formed as a function of surface pretreatment, film
formation and processing, and the electrolyte chemistry. -_-<l'he-- results also
enable further work to be done on the precursor sites themselves to
characterize their unique susceptibility to breakdown. The susceptibility is
undoubtedly associated with defect structures in the oxide film, but the type of
defect is not revealed by the present study. Inclusions, mechanically formed
defects, and structural defects due to crystallographic termination are
important for bulk and surface electronic properties or TiO2. Other types of
defects, such as line defects at steps and terraces, three dimensional defects at
oxide crystallite grain boundaries, and crystallographic shear plane array
defects are expected to influence the bulk and surface as well 1 7 -2 0 . High
concentrations of these types of' deects may increase the electronic
17

conductivity. Identifying the type of defect, howv it is formed, and especially
how it may be eliminated, are of fundamental and technological importance.
ACKNOWLEDGMENTS. This work was supported by the Office of Naval Research
and the Department of Energy-Office of Basic Energy Sciences.
REFERENCES
1. 1. Dugdale and J. GB. Cotton, Corrosion Sci., 4, 397 (1964).2. T. R. Beck, Proceedings of International Conference on Localized
Corrosion 644 (1971), Williansburg, Va., NACE.
3. T. R. Beck, J, Electrochem. Soc. 120, 1317 (1973).
4. T. R. Beck, J. Electrochem. Soc. 120, 1310 (1973).
5. N. Casillas, S. J. Charlebois, W. H. Smyrl, and II. S. White J. Electrochem.
Soc., in press.6. N. Casillas, S. R. Snyder, W. H. Smyrl, H. S. White, j. Phys. Chem. 95, 7002
(1991).7. T. Ohtsuka, M. Masuda and N. Sato, J. Electrochem. Soc. 132, 787 (1985).
8. E. R. Scott, H. S. White and ]. B. Phipps, Solid State lonics 53-5.6, 176
(1992). - -
9. E. R. Scott, H.S. White and J. B. Phipps, J. Memb. Sci. 58, 71 (1991).
10. E. R. Scott, H.S. White and J. B. Phipps, Ana. Chem. 65, 1537 (1993).
11. E. R. Scott, H.S. White and J. B. Phipps, Pharm. Res., in press.
12. E. R. Scott, j. B. Phipps, and H. S. White, Science, submitted.
13. K. Potje-Kamloth, J. Janata and M. Josowicz, Ber. Bunsenges. Phys. Chem.
93, 1480 (.989). 1.
14. M.F. Abd Rabboh and P. J. Boden, Proceedings of International
Conference on Localized Corrosion 653 (1971), Williansburg, Va., NACE.
15. j. Lausmaa, B. Kaseno, H. Nlattsson, AppL. Surf. Sci. 44, 133 (1990).
16. C. P. Smith and H. S. White, Anal. Chem., 64, 2398 (1992).
17. D.J. Smith Proc. R. Soc. London A391, 351 (1984).
18. D. J. Smith, L. A. Bursill, and MI.G. Blanchin, Phil. Alag 50, 473 (1984).
19. F. Millot, N1. G. Blanchin, R. 'etot, J.-F.Nlarucco, B. Poumellec, C. Picard,
and B. Touzelin, Proc. Solid. State. Chem. 17, 263 (1987).
18

20.. G. Rohrer, V.E. Henrich, and D. A. Bonnell, Science 250, 1239 (1990).
19

FIGURE CAPTIONS
Fig. 1 Oxide growth curve for a chemically-etched Ti electrode in 0.05 M
H2S04. Scan rate = I mV/s.
Fig. 2 Schematic diagram of the scanning electrochemical microscope.
Fig. 3 Voltammetric responses of Ti electrodes as a function of oxide
thickness, t, in a IM KBr, 0.05 M H2SO 4 (pH=1.05) solution. Scan rate =
1.0 mV/s.
Fig. 4 Pitting potential, Ep, versus oxide thickness, t, for Ti electrodes. Data
were obtained from the voltammetric responses in a I NM KBr, 0.05 M
H2SO4 (pH = 1.05) solution at a scan rate of I mV/s.
Fig. 5 Voltammetric responses of Ti electrodes (nitive oxide, t - 20A) at 0
and 22 OC in a I NI KBr, 0.05 M H12 SO4 (pH =1.05) solution.
Fig. 6 Video micrographs showing the growth of active pits on a Ti (t= 50
A) electrode immersed in a I M KBr, 0.05 MN H2SO 4 (pH = 1.05) solution.
Fig. 7 Schematic of processes occurring during pitting corrosion of a Ti
electrode in a 1 NI KBr, 0.05 NI I-2SO4 (pH = 1.05) solution. Dissolution of
the metal yields free-standing TiO2 films...
Fig. 8 Transmission electron micrograph of a 50 A-thick, free-standing TiO2
film.
Fig. 9 Schematic drawing showing the localized oxidation of Br- on the Ti
electrode and the reduction of electrogenerated Br2 at the SECM tip.
Fig. 10 SECM images (400 x 400 pm 2 ) of electroactive sites on 4 different Ti
electrodes (t = 50 A). The electrodes were biased at: (a) 1.3 V, (b) 1.56
V, (c) 1.56 V, and (d) 1.4 V. All images were obtained at a tip-to-
surface separation of -20 ý±m in a I NI KBr, 0.05 M H2 SO4 (pH =1.05)
solution. SECM-tip potential = 0.6 V. The greyscale contrast
corresponds to an absolute maximum-minimum tip current range of:
(a) 1.45 - 0.1 nA, (b) 0.26 - 0.07 nA, (c) 1.6 - 0.09 nA, and (d) 0.20 - 0.12
nA.
20

Fig. II SECM image (500 x 500 p.m 2 ) of Br2 production at a 12.5 p.m-radius Pt
disk. '[he SECM tip and4 Pt Qlectrode potentials were 0.6 and 1 V vs SCE,
respectively. The ii," ,e was obtained in a I NI KBr, 0.05 NIV H2SO4
(pH = 1.05) solution at a tip-to-sample separation of -20 g.m. The
greyscale contrast corresponds to an absolute maximum-minimum
tip-current range of 10 - 0.09 nA.
Fig. 12 SECNI images of an individual electroactive site on a Ti (t = 50 A)
electrode at (a) 1.3 V, (b) 1.4 V, (c) 1.56 V, (d) and 1.56 V vs SCE.
Image (d) was obtained -40 min. after image (c). All images were
obtained at a tip-to-surface separation of -20 p.m in a I M KBr, 0.05 M
H2 SO 4 (pH =1.05) solution. SECNI tip potential = 0.6 V. The greyscale
contrast corresponds to an absolute maximum-minimum tip current
range of: (a) 0.16 - 0.09 nA, (b) 0.18 - 0.1 nA, (c) 0.24 - 0.1 nA, and (d)
0.18 - 0.09 nA.
Fig. 13 Comparison of the potential dependence of Br2 electrogeneration on
a Ti (t = 50A) electrode as measured from the Voltammetric response
and from the SECNI-tip response.
Fig. 14 Schematic drawing of the proposed sequence of events occurring
during the voltammetric scan of a Ti (t = 50A) electrode in-a 1 M KBr,
0.05 NI H2S04 solution. [he shaded rcctLuig-rýir ?egion within the
oxide film represents a region where the electrical conductivity is
large relative to the surrounding region. (a) Below the
thermodynamic redox potential of the Br=/Br2 couple, Br- is not
oxidized at the surface. (b) Between 1.2 and 2.0 V, oxidation of Br
occurs at microscopic surface sites. (c) Thickening of the oxide at
the microscopic sites at V > 2.0 results in a decrease in the electron-
transfer rate for Br- oxidation. (d) At potentials corresponding
approximately to the onset of pitting, Br chemisorption at the
microscopic sites results in dissolution of the oxide and oxide
breakdown. Steps (a), (b), and (c) are supported directly from
voltammetric and SECNI analyses. Chemisorption oif Br (step (d)) and
oxide dissolution is suggested by the acceleration of oxide breakdown
in Br- solutions, relative to the rate in C1= solutions.
21

-
8
0
•<6e40
0.5 2 3.5 5E(V) vs SCE
- -~ *.k- 0

AID COMPUTER
AUDIOSIGNAL
VCR
POT;E.NTIOSTAT MONITOR POTEN710STAT
X-Y-Z
L TRANSLAnON
VIDEO CAMERA STAGE
CARBON FIBERMICROELECTRODE
LEM
DE
REFERENCEEFERENCE_L CTPMI C R Oi
if ;riý FR E ODETVTi02 ELECMODE
EPOXY--
JGMASSy
AUXELLARY ELECTRODES
Ilk
F1

10NativeOxide
8 t 30A• ~t=50,OA
S6 ~t=9oA-
2
0 "
0 12 3 4
E (V) vs SCE
3;

min min
min.

.. Free-standingTiO2 film
Free-standingTiO2 film
p-25 gm
F4 p

* *�1
*1 .*-*u -. - * p- - --. ..
* *** - is- U. 7-i.
-%. .i; -�* r'� t --.. / & .�1. �r�* *
j�IP�II�
- - .*% -j.: v �'
* . ,t. ..
-4S p'.5, -
'�•4�Tiv -

6
5
Q4
3I
00 20 40 60 80 100 120
Oxide thickness, (A)

1
8 22 °C Native Oxide
6
"-2
# I
0 - -- --- ana
-20 1 2 3 4
E (V) vs SCE
Fil ..

CARB, )N FIBER 1 M KBr
E =0.6 V vs SCE 0.05 M H2SO4
Br2 Bi"
2TiO 2
Ti
1.2 1 E • 2.0 V vs SCE

ar b
100pmC
I- I,
0
L 1(X) urn

I()~m(a) 1.3 V (b) 1.4 V
(c) -i.56 V (d) 1.56 V
~ 12
4 4
3 3
S2 2 •
1 1
0 " 01.0 1.3 1.6 1.9 2.2
E(V) vs SCE
F. 1

'" t 50 A
Ti V~ V 12
(a) /
(b)
Br-TiK/ 1.2< V < 2.OV
/ Br 2
Br-Ti V > 2.0V
(d)
BrTij Br V > 3.0 V
B