renting in victoria
TRANSCRIPT
RENTING IN VICTORIA:Snapshot 2021

CONTENTS
Introduction
Part 1: Who is renting? Rental households in Victoria, 2016 Composition of Victorian rental households Tenants
Part 2: Where are people renting? Rental households by Metro-Regional Local Government Areas Top ten Local Government Areas with highest percentages of rental households
Part 3: What type of housing are people renting? Rental households by dwelling structure Victorians living in boarding or rooming houses
Part 4: Who are people renting from? New housing finance attributed to Investors Profiles of registered property managers
Part 5: What is renting like? Affordable new lettings by region Lower income households and Commonwealth Rent Assistance recipients Renters in crowded dwellings Median rent movement by Local Government Area Bond lodgements, lengths, transfers and repayments Number of active Bonds over last five years Longer term tenancy agreements and Fixed Long term agreements Average length of tenancy in days Accommodation complaints to the Victorian Equal Opportunity and Human Rights Commission Vacancy rate movement Rental households that moved in the last 5 years
Part 6: What happened to renters during COVID-19? Headline results from other key research COVID-19 rental measures Residential Tenancies Dispute Resolution Scheme Department of Health and Human Services rental relief grants
Part 7: What happens when there is a problem? Enquires and complaints to Consumer Affairs Victoria Infringement notices issed by Consumer Affairs Victoria Enquiries received by Tenants Victoria Tenancy Assistance and Advocacy Program service types Tenancy-related services provided by Victoria Legal Aid Types of applications to the Victorian Civil & Administrative Tribunal Victorian Civil & Administrative Tribunal 'At fault' eviction applications Victorian Civil & Administrative Tribunal 'No fault' eviction applications
Acknowledgements
3
4445
666
777
889
101010101112121313131415
1616161718
191919202021212122
23

INTRODUCTION
I am pleased to present the second in our series of annual snapshots about renting in Victoria.
This one represents eight months of a reasonably ordinary year until February 2020 when westarted to see renters moving as the seriousness of the COVID crisis began to be apparent.
The next four months were very unusual and the story of the impact of COVID on renting and onthe wider property market continues to develop as I write this introduction in the middle of 2021,well past the twelve month period of this report.
This report makes a start on recording this historic situation for renting in Victoria. Not only didmany people move in with family, thousands of others returned from living overseas, peopleplanning to come to Victoria as new migrants or international students did not arrive and othersaltered their living arrangements to cope with lockdowns.
There were also great fluctuations in the incomes of many households with people on Job Seekergetting a boost, some low paid workers enjoying more certainty with Job Keeper than causalshifts normally allow, and others suffering huge falls in income from closed businesses.
Governments across Australia made unusually strong measures to protect renters from evictionsand rent increases and the legal processes for tenancy disputes were altered. Victoria added adispute resolution scheme to the existing VCAT option and set up rent relief grants for thosebadly affected by COVID circumstances.
This report is a first instalment of the COVID renting story, with more to come next year. It is alsoa presentation of the basic statistics about renting in Victoria so that any reader can have themeasily available. It repeats the Census data from 2016 while we wait for the results of the 2021Census as well as offering a lot of updated numbers.
The figures show some trends continuing such as the growth in property owners with two or moreproperties and the steady growth in the number of rooming houses. The number of longer fixedterm tenancy agreements continues to rise.
Heather HolstCommissioner for Residential Tenancies
Renting in Victoria: Snapshot 2021 3

WHO IS RENTING?
27.5%616,990 households in Victoria wererenting in 2016, that's 27.5% of allhouseholds.
ClassificationPersons renting
Number Percentage
Rental households
Number Percentage
Private rental
Community housing
Public housing 8.7%
1.7%
89.7%
130,545
24,843
1,347,711
10.2%
2.2%
87.6%
62,995
13,476
540,519
Composition of all Victorian rental households, 2016
One person household
Couple with children
Couple with no children
One parent family
Group household
Other family or Multi-familyhousehold
Other/Unknown
28.4%
22.0%
19.5%
14.6%
10.7%
3.2%
1.6%
Renting in Victoria: Snapshot 2021 4
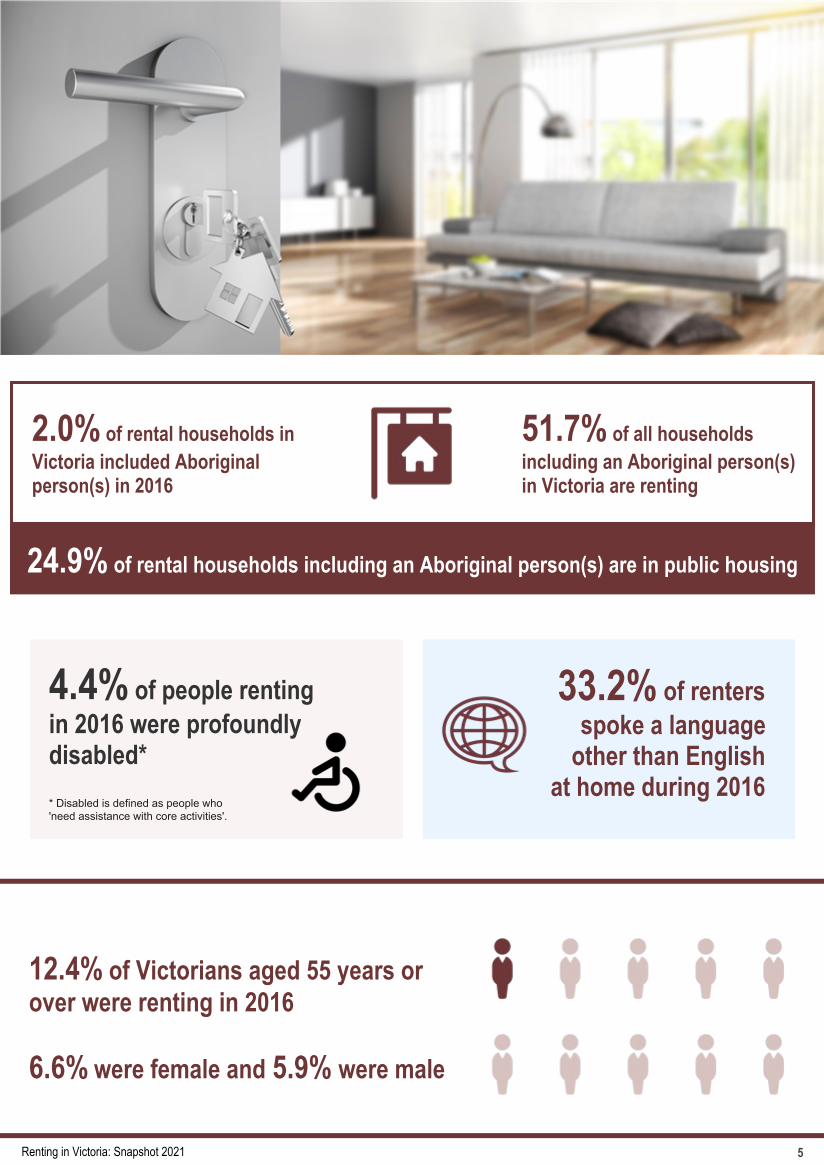
2.0% of rental households inVictoria included Aboriginalperson(s) in 2016
51.7% of all householdsincluding an Aboriginal person(s)in Victoria are renting
24.9% of rental households including an Aboriginal person(s) are in public housing
4.4% of people rentingin 2016 were profoundlydisabled*
* Disabled is defined as people who'need assistance with core activities'.
33.2% of rentersspoke a languageother than Englishat home during 2016
12.4% of Victorians aged 55 years orover were renting in 2016
6.6% were female and 5.9% were male
Renting in Victoria: Snapshot 2021 5

WHERE ARE PEOPLE RENTING?
© OpenStreetMap
Melbourne
Yarra
Port Phillip
Stonnington
Maribyrnong
Darebin
Moreland
Wodonga
Greater Dandenong
Glen Eira 32.6%
33.4%
34.0%
36.1%
36.3%
42.0%
44.2%
49.2%
50.3%
59.8%
Renting in Victoria: Snapshot 2021 6
© OpenStreetMap
0.0% 60.0%0 - 12% 13 - 24% 25-36% 37 - 48% 49 - 60%
23.5%of all Regional
Victorian householdsare renting
29.0%of all MetropolitanVictorian households
are renting
Top ten Local Government Areas where people are renting in Victoria
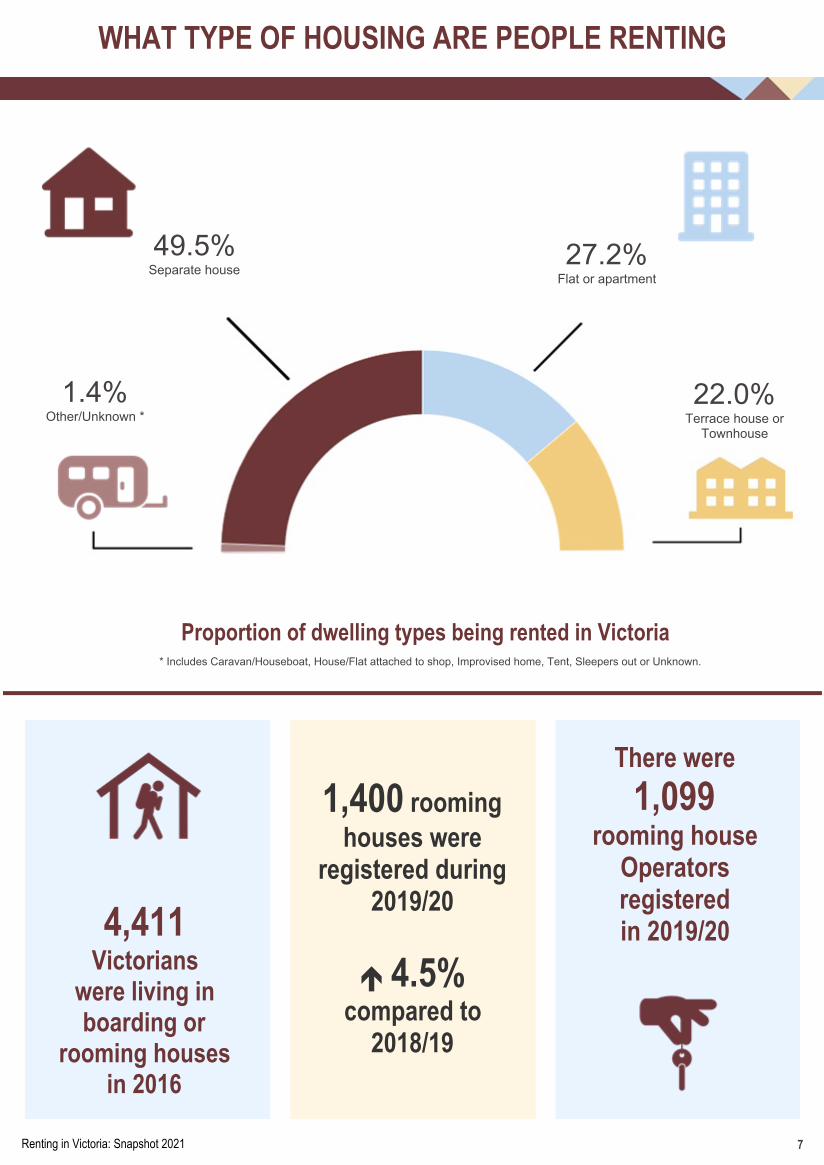
WHAT TYPE OF HOUSING ARE PEOPLE RENTING
4,411Victorianswere living inboarding orrooming housesin 2016
1,400 roominghouses wereregistered during2019/20
é 4.5%compared to2018/19
There were
1,099rooming houseOperatorsregisteredin 2019/20
Renting in Victoria: Snapshot 2021 7
49.5%Separate house
1.4%Other/Unknown *
27.2%Flat or apartment
22.0%Terrace house orTownhouse
* Includes Caravan/Houseboat, House/Flat attached to shop, Improvised home, Tent, Sleepers out or Unknown.
Proportion of dwelling types being rented in Victoria
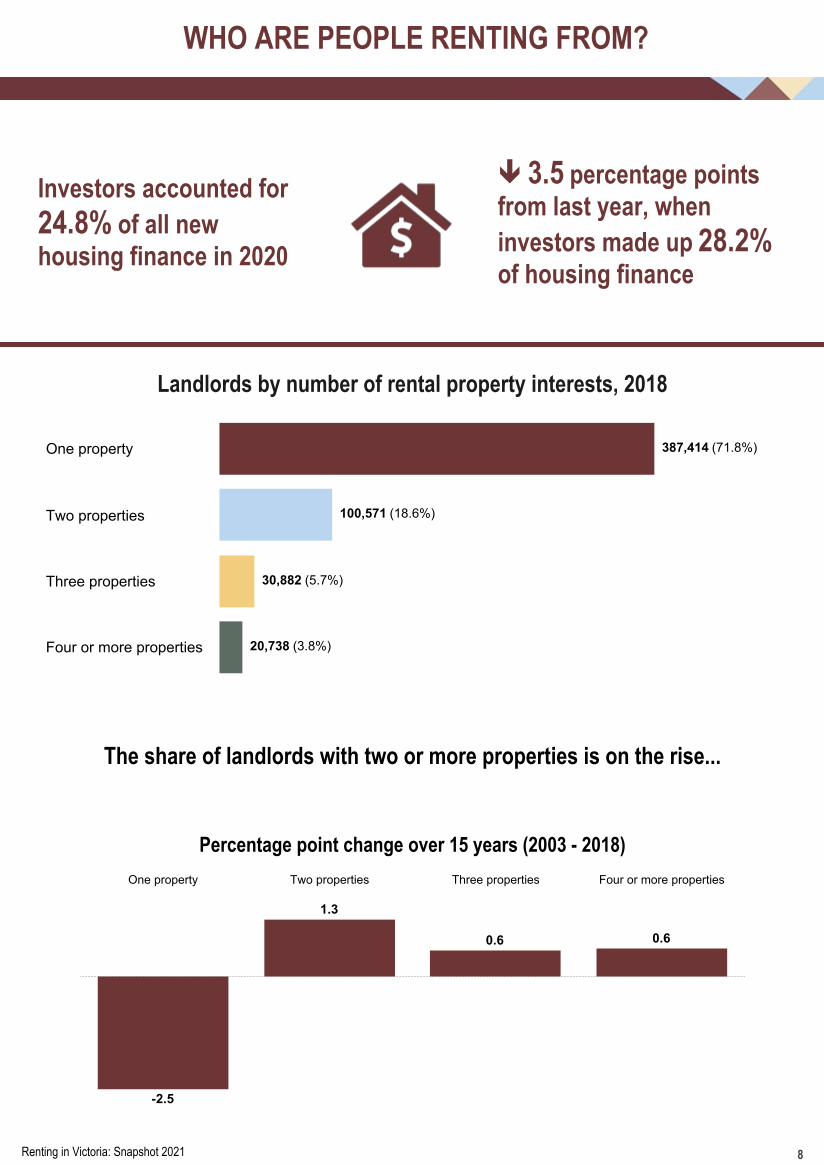
WHO ARE PEOPLE RENTING FROM?
Investors accounted for24.8% of all newhousing finance in 2020
ê 3.5 percentage pointsfrom last year, wheninvestors made up 28.2%of housing finance
One property
Two properties
Three properties
Four or more properties
387,414 (71.8%)
100,571 (18.6%)
30,882 (5.7%)
20,738 (3.8%)
Landlords by number of rental property interests, 2018
The share of landlords with two or more properties is on the rise...
One property Two properties Three properties Four or more properties
-2.5
1.3
0.6 0.6
Percentage point change over 15 years (2003 - 2018)
Renting in Victoria: Snapshot 2021 8

REA Icon colourFalse
True67% of rental properties in 2016 wererented through a real estate agent
Profiles of registered property managers, February 2021
35% of property managers arelicenced real estate agents.The remaining 65% are agents'representatives.
Of the 11,298 female property managers 21% arelicenced real estate agents...
while 49% of the 11,716 male property managersare licenced real estate agents.

WHAT IS RENTING LIKE?
Dec 2019 Mar 2020 Jun 2020 Sep 2020
43.6%
13.9%
7.1%
40.5%
11.5%
5.8%
47.0%
16.1%
8.7%
42.2%
14.6%
7.8%
Proportion of new private rentals that were affordable
46.6% of rental households in Victoria wereconsidered lower-income during the 2017/18 financial year
145,770lower-income householdswere paying more than 30% ofincome in rent in 2017/18
28.7% of CommonwealthRent Assistance recipientspaid more than 30% oftheir income in rent in 2020
That's 43.9%of all lower-income rental
households
ê -10.80 percentagepoints compared to theprevious year (39.5%)
1.2% of renters in Victoria wereliving in overcrowded or severelyovercrowded dwellings in 2016
8,929 people were consideredhomeless due to living in severelyovercrowded dwellings in 2016.
Renting in Victoria: Snapshot 2021 10
Metro Regional Victoria

Change in median rent (dollars) by Local Government Area(percentage change from September 2019 to September 2020)
© OpenStreetMap
Metropolitan
© OpenStreetMap
Regional
Bayside
Mornington Peninsula
Maribyrnong
Stonnington
Melbourne -18.4%
-7.4%
-5.5%
7.5%
9.1%
Top 5 Local Government Areas with greatest median annual rent movement in Metropolitan Melbourne
Melbourne saw the biggest movement in the Metropolitan region with a median rentdecrease of -18.4%. While Regional Victoria saw the largest movement in Towongwith a median rent increase of 25.0%
Towong
Buloke
Pyrenees
Central Goldfields
Glenelg 11.1%
11.8%
13.2%
15.8%
25.0%
Top 5 Local Government Areas with greatest median annual rent increase in Regional Victoria
Renting in Victoria: Snapshot 2021 11
-19.0% 25.0%
Note higher percentages and darker maroon indicates median rents ($) have increased. Negative percentages indicate median rents ($) have decreased.
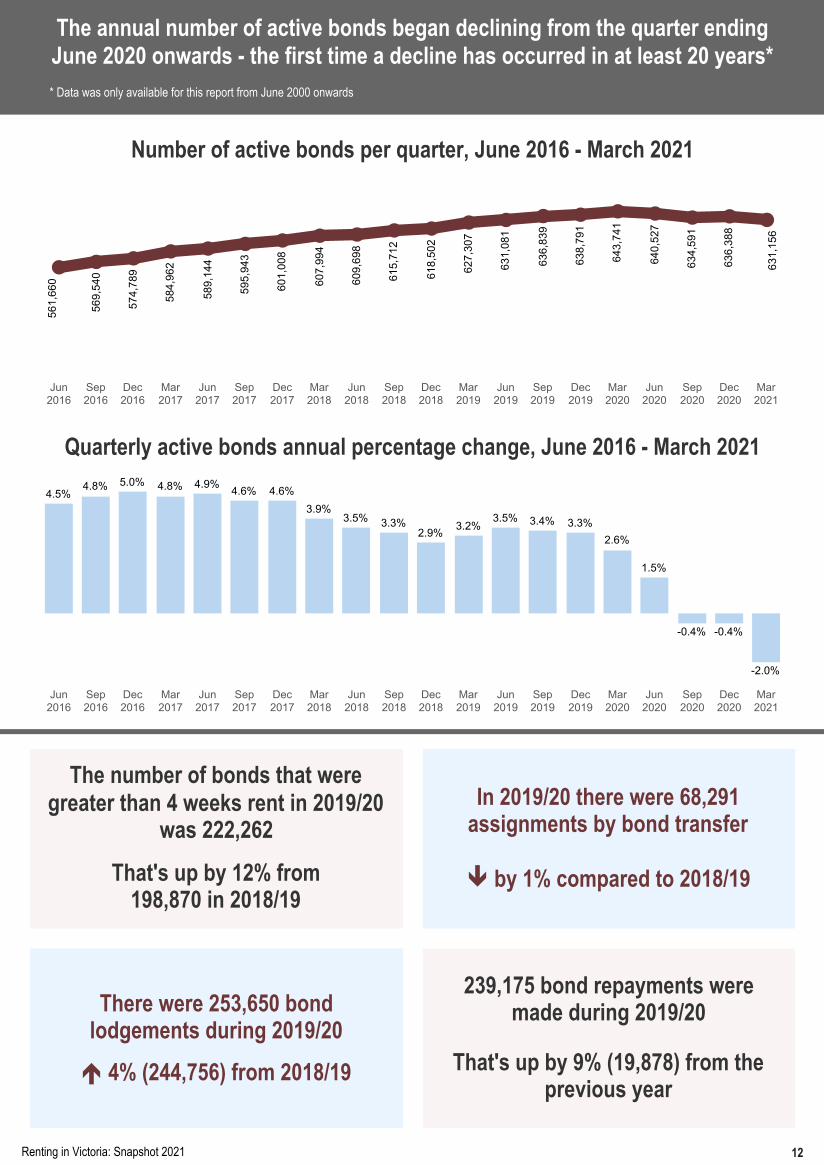
The annual number of active bonds began declining from the quarter endingJune 2020 onwards - the first time a decline has occurred in at least 20 years*
* Data was only available for this report from June 2000 onwards
Jun2016
Sep2016
Dec2016
Mar2017
Jun2017
Sep2017
Dec2017
Mar2018
Jun2018
Sep2018
Dec2018
Mar2019
Jun2019
Sep2019
Dec2019
Mar2020
Jun2020
Sep2020
Dec2020
Mar2021
561,660
569,540
574,789
584,962
589,144
595,943
601,008
607,994
609,698
615,712
618,502
627,307
631,081
636,839
638,791
643,741
640,527
634,591
636,388
631,156
Number of active bonds per quarter, June 2016 - March 2021
Jun2016
Sep2016
Dec2016
Mar2017
Jun2017
Sep2017
Dec2017
Mar2018
Jun2018
Sep2018
Dec2018
Mar2019
Jun2019
Sep2019
Dec2019
Mar2020
Jun2020
Sep2020
Dec2020
Mar2021
-0.4% -0.4%
-2.0%
4.5%4.8% 5.0% 4.8% 4.9%
4.6% 4.6%
3.9%3.5% 3.3%
2.9%3.2%
3.5% 3.4% 3.3%
2.6%
1.5%
Quarterly active bonds annual percentage change, June 2016 - March 2021
The number of bonds that weregreater than 4 weeks rent in 2019/20
was 222,262
That's up by 12% from198,870 in 2018/19
In 2019/20 there were 68,291assignments by bond transfer
ê by 1% compared to 2018/19
There were 253,650 bondlodgements during 2019/20
é 4% (244,756) from 2018/19
239,175 bond repayments weremade during 2019/20
That's up by 9% (19,878) from theprevious year
Renting in Victoria: Snapshot 2021 12

There were
149,283active tenancy agreementsthat have been in place for5 or more years asof February 2021
é 6.6% since last year
The number of fixed longterm tenancy agreements(5 or more years) signedduring the 2020/21 financial
year was
69ê -23.3% compared tothe 2019/20 financial year
The average length of atenancy in 2019/20 wasapproximately 24 months(or 733 days)
2016/17 2017/18 2018/19 2019/20
566554
733
532
Accommodation complaints made to the Victorian Equal Opportunityand Human Rights Commission, 2017/18 - 2019/20
There were 225 accommodationenquiries made to the Commission inthe 2019/20 financial year. Of those,102 matters became complaints.
2017/18
2018/19
2019/20
139
111
102
41%of accommodation complaints during2019/20 related to disability discrimination
Renting in Victoria: Snapshot 2021 13
Average length of a tenancy in days

Inner Metropolitan Melbourne (4 Kms) saw the greatest increase in rental vacancy witha jump from 2.0% in March 2020 to 7.5% in December 2020
Outer Metropolitan Melbourne (Mornington Peninsula) saw the greatest decrease inrental vacancies, falling from 4.3% in June 2020 to 0.7% in December 2020.
December 2019 March 2020 June 2020 September 2020 December 2020
0
2
4
6
0.7%
2.1%
5.6%
6.4%
7.5%
Rental vacancy rate of Metropolitan Melbourne
December 2019 March 2020 June 2020 September 2020 December 20200
2
4
5.4%
1.1%
3.0%
1.8%
2.2%
1.7%
Rental vacancy rate Metropolitan Melbourne vs Regional Victoria
Renting in Victoria: Snapshot 2021 14
Inner Metropolitan Melbourne (4 Kms)
Inner Metropolitan Melbourne (4-10 Kms)
Middle Metropolitan Melbourne (10-20 Kms)
Outer Metropolitan Melbourne (20+ Kms exc. Mornington Pensula)
Outer Metropolitan Melbourne (Mornington Pensula)
Metropolitan Melbourne Regional Victoria
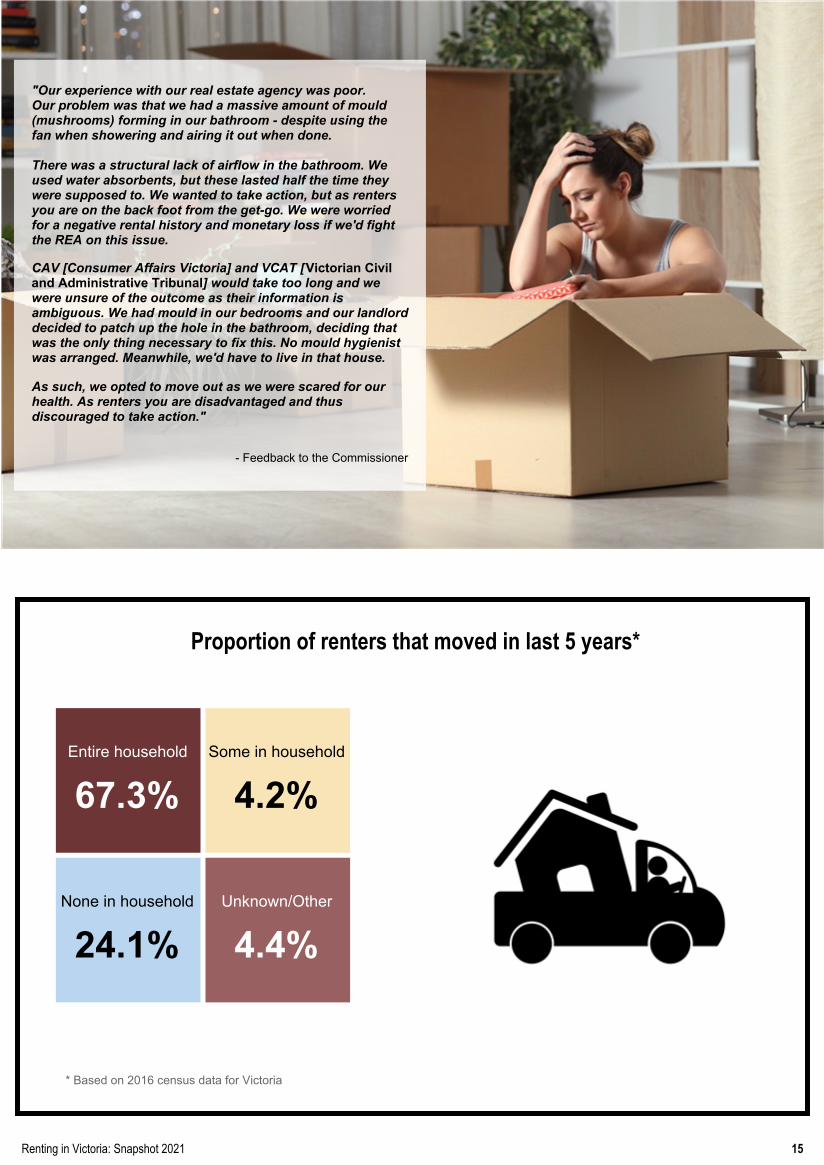
Some in household
4.2%
None in household
24.1%
Entire household
67.3%
Unknown/Other
4.4%
Renting in Victoria: Snapshot 2021 15
Proportion of renters that moved in last 5 years*
"Our experience with our real estate agency was poor.Our problem was that we had a massive amount of mould(mushrooms) forming in our bathroom - despite using thefan when showering and airing it out when done.
There was a structural lack of airflow in the bathroom. Weused water absorbents, but these lasted half the time theywere supposed to. We wanted to take action, but as rentersyou are on the back foot from the get-go. We were worriedfor a negative rental history and monetary loss if we'd fightthe REA on this issue.
CAV [Consumer Affairs Victoria] and VCAT [Victorian Civiland Administrative Tribunal] would take too long and wewere unsure of the outcome as their information isambiguous. We had mould in our bedrooms and our landlorddecided to patch up the hole in the bathroom, deciding thatwas the only thing necessary to fix this. No mould hygienistwas arranged. Meanwhile, we'd have to live in that house.
As such, we opted to move out as we were scared for ourhealth. As renters you are disadvantaged and thusdiscouraged to take action."
- Feedback to the Commissioner
* Based on 2016 census data for Victoria
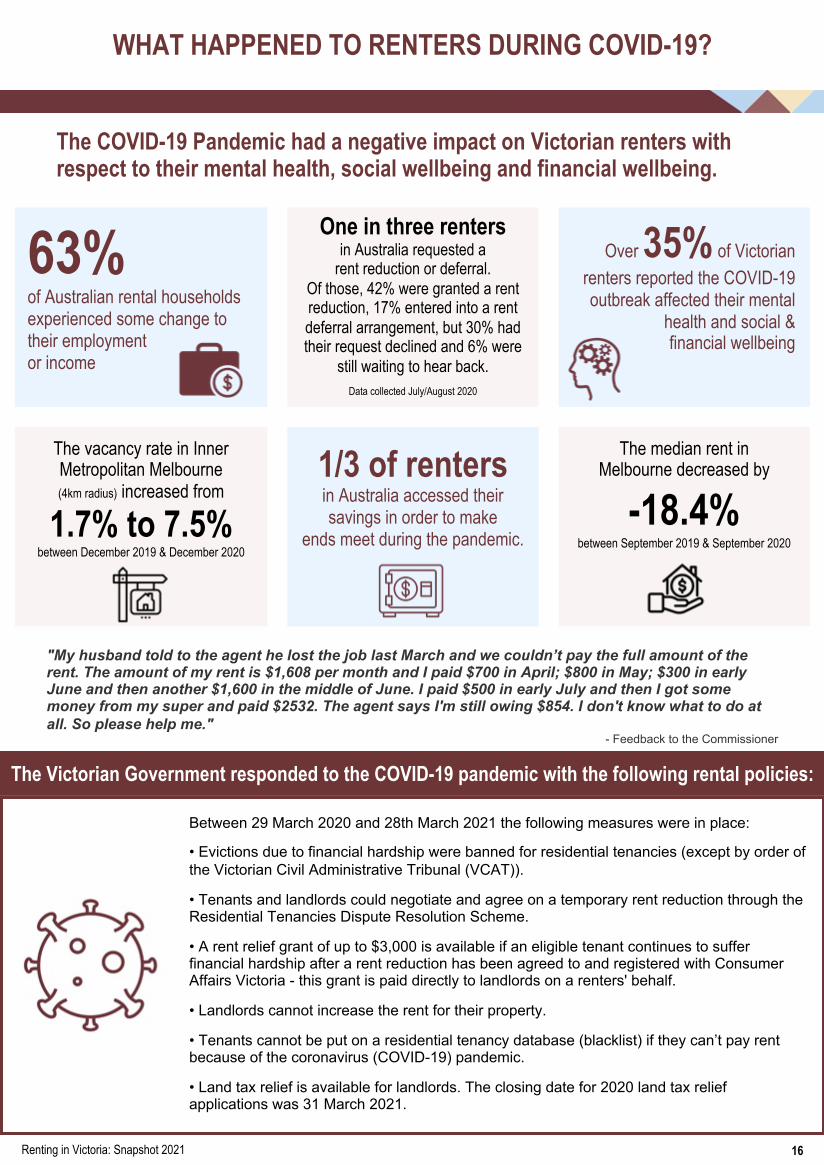
WHAT HAPPENED TO RENTERS DURING COVID-19?
The COVID-19 Pandemic had a negative impact on Victorian renters withrespect to their mental health, social wellbeing and financial wellbeing.
63%of Australian rental householdsexperienced some change totheir employmentor income
One in three rentersin Australia requested arent reduction or deferral.
Of those, 42% were granted a rentreduction, 17% entered into a rentdeferral arrangement, but 30% hadtheir request declined and 6% werestill waiting to hear back.Data collected July/August 2020
Over 35% of Victorianrenters reported the COVID-19outbreak affected their mental
health and social &financial wellbeing
The vacancy rate in InnerMetropolitan Melbourne(4km radius) increased from
1.7% to 7.5%between December 2019 & December 2020
1/3 of rentersin Australia accessed theirsavings in order to make
ends meet during the pandemic.
The median rent inMelbourne decreased by
-18.4%between September 2019 & September 2020
"My husband told to the agent he lost the job last March and we couldn’t pay the full amount of therent. The amount of my rent is $1,608 per month and I paid $700 in April; $800 in May; $300 in earlyJune and then another $1,600 in the middle of June. I paid $500 in early July and then I got somemoney from my super and paid $2532. The agent says I'm still owing $854. I don't know what to do atall. So please help me."
- Feedback to the Commissioner
The Victorian Government responded to the COVID-19 pandemic with the following rental policies:
Between 29 March 2020 and 28th March 2021 the following measures were in place:
• Evictions due to financial hardship were banned for residential tenancies (except by order ofthe Victorian Civil Administrative Tribunal (VCAT)).
• Tenants and landlords could negotiate and agree on a temporary rent reduction through theResidential Tenancies Dispute Resolution Scheme.
• A rent relief grant of up to $3,000 is available if an eligible tenant continues to sufferfinancial hardship after a rent reduction has been agreed to and registered with ConsumerAffairs Victoria - this grant is paid directly to landlords on a renters' behalf.
• Landlords cannot increase the rent for their property.
• Tenants cannot be put on a residential tenancy database (blacklist) if they can’t pay rentbecause of the coronavirus (COVID-19) pandemic.
• Land tax relief is available for landlords. The closing date for 2020 land tax reliefapplications was 31 March 2021.
Renting in Victoria: Snapshot 2021 16

Residential Tenancies Dispute Resolution Scheme
The Residential Tenancies Dispute Resolution Scheme commenced on 24 April 2020 as part of the VictorianGovernment’s response to the coronavirus (COVID-19) pandemic and was one of a range of measures put in placeto support Victorian renters.The scheme supported Victorian renters and rental providers to negotiate and lodge agreements to reduce rent. Itwas also a requirement that people first contact the scheme before they could take a rental dispute to the VictorianCivil and Administrative Tribunal (VCAT). The Scheme concluded on 28 March 2021.
Note: Data for the final week of the Residential Tenancies Dispute Resolution Scheme is not included in the figures below.
Advice only wasprovided to
94,115clients
5,582matters were closedthrough the DisputeSettlement Centre of
Victoria
72,157reduced rentagreementswere lodged
Consumer Affairs Victoriareceived
220,949contacts overall
..
20,126matters were closedthrough Frontlineresolution
174binding orders wereissued by the
DSCV Chief DisputeResolution Officer
28,795matters were referred
to VCAT
1. Rent Reduction
2. Rent arrears
3. Rent relief
Top three dispute reasons:
The average number of days fromreferral date to closure was 26.4
Renting in Victoria: Snapshot 2021 17
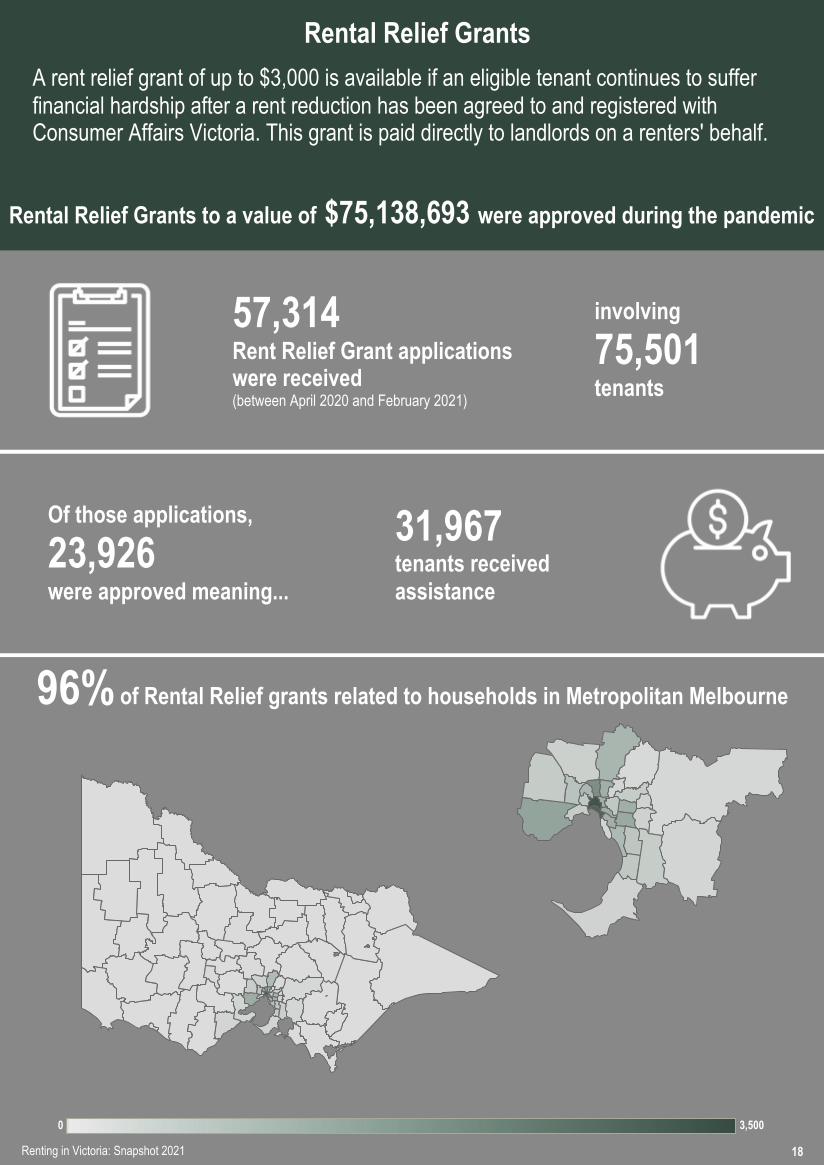
Rental Relief GrantsA rent relief grant of up to $3,000 is available if an eligible tenant continues to sufferfinancial hardship after a rent reduction has been agreed to and registered withConsumer Affairs Victoria. This grant is paid directly to landlords on a renters' behalf.
Rental Relief Grants to a value of $75,138,693 were approved during the pandemic
57,314Rent Relief Grant applicationswere received(between April 2020 and February 2021)
involving
75,501tenants
Of those applications,
23,926were approved meaning...
31,967tenants receivedassistance
96% of Rental Relief grants related to households in Metropolitan Melbourne
© OpenStreetMap
Renting in Victoria: Snapshot 2021 18
© OpenStreetMap
0 3,500

WHAT HAPPENS WHEN THERE IS A PROBLEM?
70,670rental queries were received by ConsumerAffairs Victoria (CAV) in 2019/20includes contacts related to the Residential Tenancies Dispute Resolution Scheme
é 25% compared to last year (56,490)
96% of queries received by CAV in 2019/20were from the Victorian private rental market
# % change since2018/19
1. Termination of lease
2. Repairs & Maintenance
3. New rental agreement*
4. General requirements
5. Inspection requests -29.7%
7.5%
-4.9%
9.7%
5,274
5,714
6,317
8,758
12,855
58% (1,086) of disputesreferred to Frontlineresolution (FLR)
were resolved in 2019/20,ê 24% from 2018/19
Figures do not include the Residenal Tenancies DisputeResoluon Scheme introduced in response to the
coronavirus (COVID-19) pandemic
CAV issued 27 infringementnotices under the tenancy
law in 2019/20,é 69% comparedto last year
Renting in Victoria: Snapshot 2021 19
The top 5 reasons for contacting CAV in 2019/20
* New rental agreement % change is not available as it was not a category in the 2018/19 financial year
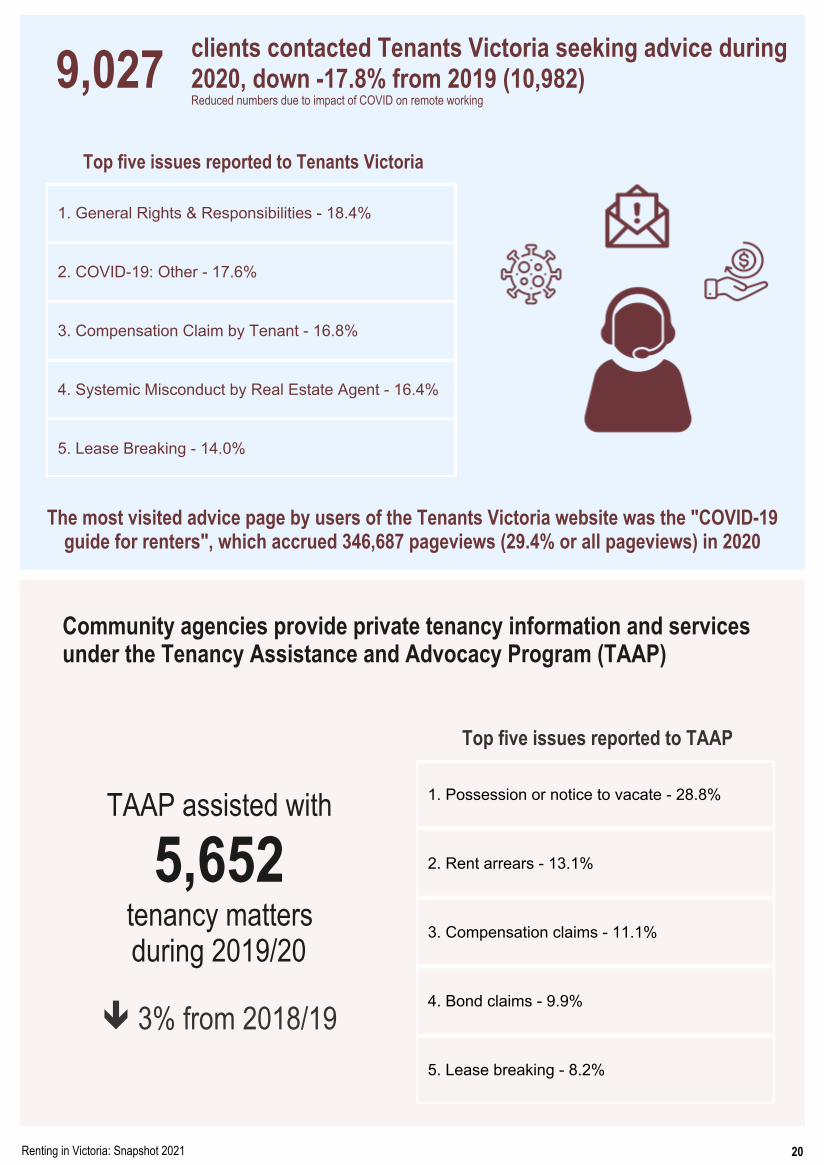
9,027clients contacted Tenants Victoria seeking advice during2020, down -17.8% from 2019 (10,982)Reduced numbers due to impact of COVID on remote working
5. Lease Breaking - 14.0%
4. Systemic Misconduct by Real Estate Agent - 16.4%
3. Compensation Claim by Tenant - 16.8%
2. COVID-19: Other - 17.6%
1. General Rights & Responsibilities - 18.4%
Top five issues reported to Tenants Victoria
The most visited advice page by users of the Tenants Victoria website was the "COVID-19guide for renters", which accrued 346,687 pageviews (29.4% or all pageviews) in 2020
Community agencies provide private tenancy information and servicesunder the Tenancy Assistance and Advocacy Program (TAAP)
TAAP assisted with
5,652tenancy mattersduring 2019/20
ê 3% from 2018/19 5. Lease breaking - 8.2%
4. Bond claims - 9.9%
3. Compensation claims - 11.1%
2. Rent arrears - 13.1%
1. Possession or notice to vacate - 28.8%
Top five issues reported to TAAP
Renting in Victoria: Snapshot 2021 20
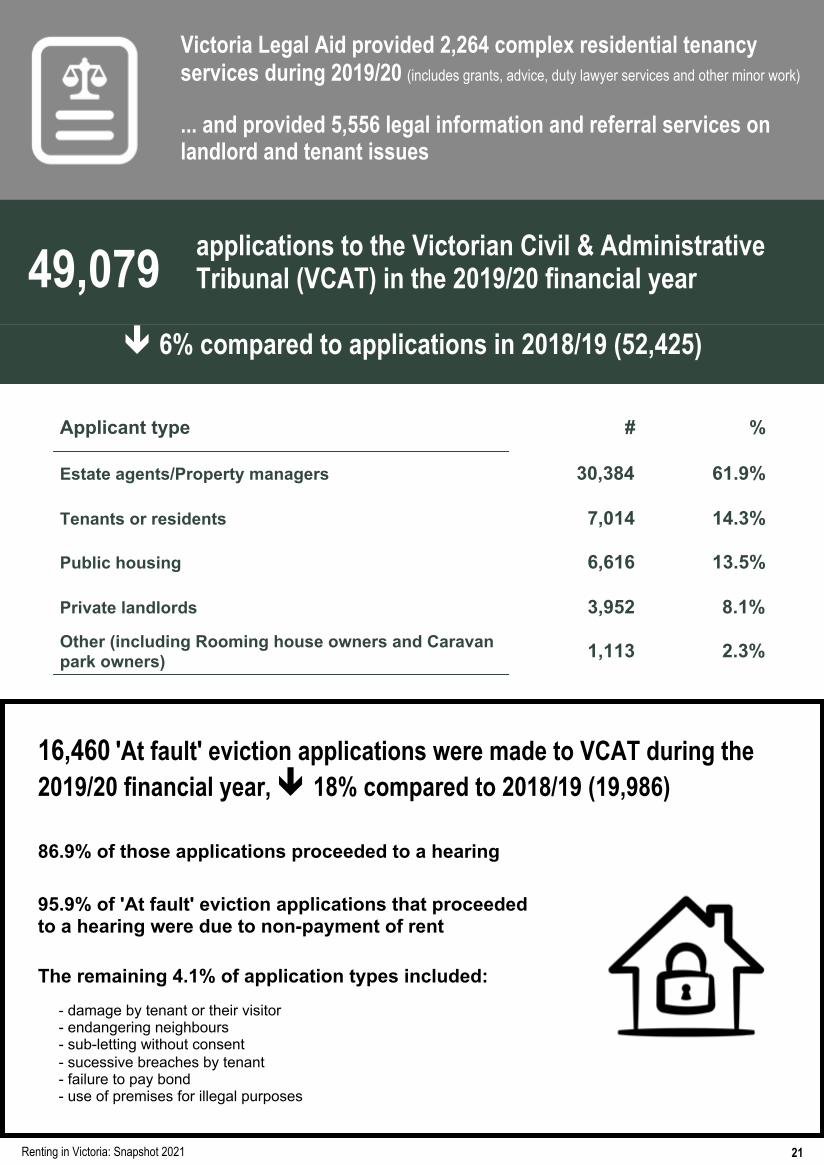
Victoria Legal Aid provided 2,264 complex residential tenancyservices during 2019/20 (includes grants, advice, duty lawyer services and other minor work)
... and provided 5,556 legal information and referral services onlandlord and tenant issues
49,079applications to the Victorian Civil & AdministrativeTribunal (VCAT) in the 2019/20 financial year
ê 6% compared to applications in 2018/19 (52,425)
Applicant type # %
Estate agents/Property managers
Tenants or residents
Public housing
Private landlords
Other (including Rooming house owners and Caravanpark owners) 2.3%
8.1%
13.5%
14.3%
61.9%
1,113
3,952
6,616
7,014
30,384
16,460 'At fault' eviction applications were made to VCAT during the2019/20 financial year, ê 18% compared to 2018/19 (19,986)
86.9% of those applications proceeded to a hearing
95.9% of 'At fault' eviction applications that proceededto a hearing were due to non-payment of rent
The remaining 4.1% of application types included:
- damage by tenant or their visitor - endangering neighbours - sub-letting without consent - sucessive breaches by tenant - failure to pay bond - use of premises for illegal purposes
Renting in Victoria: Snapshot 2021 21

2,183 'No fault' eviction applications were made to Victorian Civil &Administrative Tribunal (VCAT) during 2019/20
ê 24% compared to 2018/19 (2,885)
71.6% of those applications proceeded to a hearing
# %
Notice to vacate for no specified reason
End of fixed term tenancy
Premises to be sold
Termination after death of sole tenant
Premises to be occupied by landlord or landlord's family
Repairs (repair, renovate or reconstruct the premises)
Other 8.5%
7.4%
10.3%
12.1%
14.5%
21.0%
26.2%
133
115
161
189
227
329
409
Number of 'No fault' eviction applications that proceeded to a hearing, by type
Approximately 22% of hearings were contested at VCAT
"I have attended VCAT twice before about damageto the roof of the property I rent. I asked for theroof to be repaired one month after I moved in.The landlord has attempted to hold off as much aspossible on outlaying money for the propertyrepairs. The landlord and agent on manyoccasions have left myself and my children in ahazardous situation, with roof leaking through tolights in the kitchen, laundry, upstairs bathroomand downstairs lounge room. The risk ofelectrocution scares my children from turning thelights on.In November the roof began to again rapidly flowrain water through. 2 weeks later kids and myselfstill at risk of electrocution. Real estate ignoringme. Not heard back from CAV."
- Feedback to the Commissioner
"I'm a single mother and the last 13 months hasbeen hell.I was lied to about the property to get me to signthe lease. The landlord let himself into theproperty while me and my one year old where [sic]sleeping. The power short circuited and they leftus without power for days and we lost everythingin our freezer and fridge and now it's been a weeksince we have had water cause the landlordrefuses to fix it and the real estate basically sayit's not their problem.
I'm bathing my daughter in the kitchen sink usingbottled water. The last few days have been over 30degrees and we don't have any running water."
- Feedback to the Commissioner
Renting in Victoria: Snapshot 2021 22

ACKNOWLEDGEMENTS
The Commissioner for Residential Tenancies would like to acknowledge and thank the CrimeStatistics Agency in Victoria for the preparation of this report.
The Commissioner for Residential Tenancies is grateful to all contributors for the provision ofdata required to complete this report. Special thanks are extended to: Consumer Affairs Victoria;Victorian Civil and Administrative Tribunal; Tenants Victoria; Victoria Legal Aid; Victorian EqualOpportunity and Human Rights Commission; Homes Victoria; Australian Bureau of Statistics;and The Real Estate Institute of Victoria Ltd (REIV).
Renting in Victoria: Snapshot 2020 23
rentingcommissioner.vic.gov.au
1300 029 783
Published by the Commissioner for Residential Tenancies,Level 12, 222 Exhibition Street, Melbourne VIC 3000.
Copyright © 2021 State of Victoria, Australia
Renting in Victoria: Snapshot 2021August 2021ISSN 2652-6409
The work is licensed under the terms of the Creative Commons Attribution 4.0 International licence. To viewa copy of this licence, visit: creativecommons.org/licenses/by-nc-sa/4.0/legalcodeIt is a condition of this Creative Commons Attribution 4.0 Licence that you give credit to the original author,who is the State of Victoria.
The Commissioner acknowledges Aboriginal and Torres Strait Islander people as the Traditional Custodians of the land and acknowledges andpays respect to their Elders, past and present.