rental housing and crime: the role of property ownership ... · pdf filea number of studies...
TRANSCRIPT

Rental Housing and Crime: The Role ofProperty Ownership and Management
Terance J. RephannAllegany College of Maryland12401 Willowbrook Road
Cumberland, MD 21502 [email protected]
March 22, 2007
Abstract
Previous studies suggest a connection between neighborhood rentaloccupancy rates and crime. This paper explores characteristics of rentalproperties with disturbances, assaults, and drug use and distribution. Itexamines police department incident reports for privately owned rentaldwellings. Results show that a small percentage of properties accountfor all the reports for rental dwellings. Count model regressions indicatethat residence of owner, size of rental property holdings, tenant Section8 voucher use, and neighborhood owner-occupied housing rates are asso-ciated with reported violations. The paper concludes with recommenda-tions about local government policies that could help to reduce crime inrental housing.
1 Intro
In towns and cities across the country, the so-called �absentee� landlord andurban �slumlord� is viewed as a major source of problems, such as crime andneighborhood blight, that plague distressed neighborhoods. According to con-ventional wisdom, non-resident landlords are less likely to inspect and improvetheir properties, less likely to screen their tenants, less likely to manage andmaintain properties properly, and less likely to have an interest in the wellbeingof the surrounding neighborhood and community (Mayer 1981; Dymowski 2001).The growth in external ownership and the problems associated with it have alsobeen identi�ed as sources of middle class �ight from cities (Dymowski 2001).
1

Rental Housing and Crime: The Role of Property Ownership and Management
Given the preponderance of strong feelings on the issue, there is a surprisinglack of empirical data to support the contention that rental property ownershipand management arrangements contribute to property deterioration and crime.A number of studies link homeownership and various types of positive outcomes(Dietz and Haurin 2003). These outcomes include lower crime (Alba, Loganand Bellair 1994; Glaeser and Sacerdote 1999; Rephann 1999); higher prop-erty values (Rohe and Stewart 1996; Coulson, Hwang and Imai 2002; Coulson,Hwang and Imai 2003), better building maintenance (Mayer 1981), more civic-minded neighbors (Rohe and Stewart 1996; DiPasquale and Glaeser 1999; Rohe,Van Zandt and McCarthy 2002) and better educated and well-adjusted children(Haurin, Parcel and Haurin 2001; Harkness and Newman 2002; Rohe et al. 2002;Harkness and Newman 2002). Therefore, it would seem on the surface thatrental ownership qualities including the physical proximity of a landlord or man-agement entity may matter in a rental setting as well.
Recent dramatic decreases in the national crime rate and impressive increasesin the percentage of national housing stock that is owner-occupied suggest thatgrowth and qualities of rental properties are not a major contributor to recentnation-wide crime trends. Furthermore, crimes occur in a variety of settings,including public streets and commercial areas, and can occur because of a va-riety of motives, including economic as well as a¤ective considerations. Theymay also be triggered by lowered inhibitions to conducting mischief caused byconsumption of alcoholic beverages and drugs. Therefore, diverse theories mustbe invoked to explain the complicated phenomenon.
Still, additional attention to this issue is merited for at least three rea-sons. First, there is a ongoing public perception that non-local landlords andpoor property management are a cause of many local crime problems. Evenwithin criminology and the social sciences, there is a growing recognition thatresearchers should �pay closer attention to the economics of property owner-ship and the management of places�(Eck and Wartell 1998). Second, evidencesuggests that the �absentee owned� share of the national rental inventory isincreasing (Apgar 2004). With the growth of Internet real estate marketing, ithas become much easier for individuals to research, purchase, and rent apart-ments without ever actually visiting them. Third, high rates of tenancy canoften be found in many neighborhoods with higher crime levels. Therefore, un-derstanding the characteristics of these types of properties could help in craftingappropriate policies to revitalize neighborhoods.
This study examines the incidence and frequency of certain types of crimesthat occur in privately owned rental properties, including disturbances, assaults,and drug possession and distribution. These crimes were selected because theyare more frequently found in a residential setting and are often considered im-portant measures or indicators of neighborhood �quality of life.�Characteristicsof rental properties are examined with the aid of multivariate count regressionmodels which incorporate property, tenant, and neighborhood variables includ-
2

Terance J. Rephann
ing residence of owner, size of landlord property holdings, tenant HUD Section 8voucher use, and neighborhood socioeconomic characteristics. It is hypothesizedthat problem properties are more likely to be found when the owner resides fur-ther away from the property, when the owner owns multiple units, when tenantsreceive public housing assistance, and when neighborhood measures of residen-tial mobility and disadvantage are greater.
The �rst section contains a review of literature which draws on routine activ-ities theories of crime to explain intra-metropolitan or intra-urban variation incriminal activity. The third section describes the study region of Cumberland,Maryland. The fourth section explains how the study data were assembled us-ing several sources of municipal and U.S. Census data. The �fth section detailsthe working research hypotheses which motivate this study. The sixth sectionexplains the count regression techniques used. The seventh section presents anddiscusses the empirical results. The paper concludes with a summary and policyrecommendations.
2 Literature Review
Whether stated explicitly or not, many studies of the geographical distributionof crime are motivated by Routine Activities Theory. Rather than examining theeconomic or psychological aspects of the individual�s decision to commit a crime,Routine Activities Theory focuses on the �criminology of places,�that is to saythe situational aspects such as the physical, locational, functional, and man-agement characteristics of the properties themselves (Cohen and Felson 1979).The theory recognizes three factors that contribute to crime occurrence: (a) amotivated o¤ender, (b) an attractive target, and (c) level of guardianship for thetarget. Assuming that supply of motivated o¤enders is constant, variations incrime occurs because of di¤erences in the availability of targets and di¤erencesin levels of target guardianship.
Places di¤er in terms of the presence of factors that contribute to crime com-mission. For instance, for the crime of larceny, shopping centers are likely tobe viewed as more attractive targets than residences because of the abundanceof new merchandise. Places also di¤er with respect to the level of guardianship�for example, some stores employ better security measures (e.g., alarms, sur-veillance cameras and security personnel). Furthermore, the available supply ofmotivated o¤enders �typically young males drawn from disadvantaged socioe-conomic backgrounds� may di¤er from locale to locale. Before introducing themodel used in this study, it may be useful to review some of the variables thathave been found important in the literature.
3
Rental Housing and Crime: The Role of Property Ownership and Management
2.1 Local Built Environment Characteristics
Certain aspects of the local built environment have been found to be importantin determining the attractiveness of a target and its level of guardianship.
The suitability of a target may vary with ease of access. Residential locationswith �multiple access points,� on corner lots, and in close proximity to high-ways are more vulnerable than others (Fishman, Hakim and Shachmurove 1998;Hakim, Rengert and Shachmurove 2001). Furthermore, the layout of housingsubdivisions, including the presence of dead-end streets and cul-de-sacs, canpotentially decrease the attractiveness of a target by increasing the costs ofcriminal travel and increasing the odds of detection. Remoteness, however, is adouble edged sword. As property lots increase in size, residents and neighborsmay be less likely to detect criminal activity. Also, proximity to wooded areasimpedes criminal detection possibilities (Fishman et al. 1998; Hakim et al. 2001).
Physical design and layout of grounds and buildings may also be impor-tant. For instance, the design of public housing high rise buildings is thoughtto contribute to less community cohesiveness and lower levels of guardianship(Mazerolle and Terill 1997). Physical barriers such as fences, gates, walls andlandscaping may impede criminal movement, while improved visibility for park-ing lots, play areas, and pedestrian areas can improve crime detection. Zelinkaand Brennan 2001 suggests a variety of urban design features to foster a senseof community, improve citizen perceptions of safety, and increase possibilitiesfor criminal detection arranged around the principles of (a) providing betterpedestrian orientation, (b) increasing possibilities for citizen socialization andinteraction, (c) promoting citizen ownership of spaces, and (d) increasing visi-bility.
2.2 Security Characteristics
Certain types of security enhancements can help prevent crime. Fishman et al.1998 de�ne four types of precautionary security measures that help to �harden�property targets. They include (a) deterrent measures that �create the physicalillusion that somebody is in the house�such as a car parked in a driveway, lightsturned on, or appliances such as radio or television running�, (b) managerialmeasures that are �physical indicators that reduce the impression that no oneis in house�such as having the newspaper delivery stopped when residents areon vacation, (c) preventive measures that �make actual entry more di¢ cult�such as locked doors and windows, and (d) detection measures that �transmitsignals when a burglary attempt is made� such as a burglar alarm. Securityenhancements are associated with lower likelihood of victimization and relativelyinexpensive �xes such as leaving a car in the driveway, installing light timersand/or motion sensors, or having neighbors collect mail and newspapers can
4

Terance J. Rephann
have a measurable deterrent e¤ect (Fishman et al. 1998; Hakim et al. 2001).Commercial security investments such as lighting and alarm systems are alsoassociated with a lower likelihood of burglary (Hakim and Shachmurove 1996).
2.3 Commercial Land and Building Uses
Commercial properties are at greater risk of property-based crime such as theftand burglary. Hakim and Shachmurove 1996 �nds that retail stores have thehighest likelihood of burglary followed by wholesale establishments. Service andmanufacturing businesses are less likely to be burglarized. Within the commer-cial sector, certain types of establishments, such as bars, fast food restaurants,shopping centers, fast food restaurants, and hotels have been found to attractmore crime than others (Sherman, Gartin and Buerger 1989; Roncek, Bell andFrancik 1981; Olligschlaeger 1997). The enticements of cash and goods are ingreater abundance in these establishments and the �ow of people greater. More-over, the �time at risk�is often higher because they are open longer (Shermanet al. 1989). Taverns and pubs provide a more fertile environment for crimebecause their clientele is more likely to include potential o¤enders and the ef-fect of consuming intoxicating beverages is likely to alter patrons�behavior andjudgment (Roncek et al. 1981).
2.4 Law Enforcement/Legal Characteristics
For areas that encompass several di¤erent political jurisdictions, di¤erences inlaw enforcement quality and legal penalties could potentially account for di¤er-ences in local crime rates. Routine Activities theory may motivate the incorpo-ration of some variables representing law enforcement surveillance capabilitiessuch as amount of police presence (measured in terms of police o¢ cers percapita and expenditures per capita) and police response times. However, theinclusion of legal penalty variables more often re�ects an economic model ofcrime in which criminal decision-makers compare the expected bene�ts of ac-quiring more loot to the expected costs of imprisonment. Variables of interestinclude, probability of arrest (e.g., ratio of arrest to o¤enses), probability ofconviction (e.g., ratio of convictions to arrests), probability (e.g., percentage ofconvictions that lead to prison sentences), and severity of sentences (Cornwelland Trumbull 1994).
Evidence for the e¤ectiveness of law enforcement variables varies. Mixed re-sults for police presence have been obtained in part because of di¤erences in thee¤orts to rectify two econometric problems. Measures of police size/expendituresare often endogenous�that is to say, improved police surveillance can reducecrime but areas that have higher crime rates have a need to invest more in lawenforcement (Hakim, Ovadia, Sagi and Weinblatt 1979; Cornwell and Trumbull
5

Rental Housing and Crime: The Role of Property Ownership and Management
1994). Also, criminal displacement may occur when police presence increases(Hakim et al. 1979). This problem is likely to be more pronounced when smallergeographical units are used (Sorenson, Trumbull and Cornwell 1996). There-fore, spatial autocorrelation may hinder interpretation of the signi�cance of lawenforcement coe¢ cients.
It has generally been assumed that increases in likelihood of arrest and pun-ishment is a more e¤ective deterrent to crime than longer or more severe sentenc-ing (Sullivan 1990). However, the magnitude and ordering of these e¤ects havebeen called into question by second generation studies that use more advancedeconometric techniques (Cornwell and Trumbull 1994).
2.5 Property Ownership/ Management Characteristics
Property ownership and management characteristics are often associated withcrime. Roncek et al. 1981 note that commercial bar establishments with man-agement and security de�ciencies experience more crime. Among residentialhouseholds, homeownership may help foster conditions less favorable to crime(Alba et al. 1994; Glaeser and Sacerdote 1999; Rephann 1999).
There are several reasons that homeowners might be both less likely to bevictimized as well as less likely to commit crime. First, homeowners are lessmobile than tenants (Rohe and Stewart 1996; Dietz and Haurin 2003). Theyare less likely to move because of �nancial factors such as incurring transactioncosts from buying and selling. Because they are less mobile, they may havea heightened awareness of any changes in their surroundings, have establishedbetter social networks such as involvement in neighborhood associations, andinteract with and have more familiarity with neighbors (Rohe and Stewart 1996;DiPasquale and Glaeser 1999; Rohe et al. 2002). Second, homeowners are morelikely to be sensitive to decreases in property values and any changes in underly-ing quality of life factors such as crime that might detract from property values.Their interests in preserving the value of properties creates a �vested interestin neighborhood conditions� (Rohe and Stewart 1996), a greater likelihood ofinvesting in property maintenance (Rohe and Stewart 1996) and possibly se-curity (Dietz and Haurin 2003). Third, homeownership has been connectedto better child outcomes (Haurin et al. 2001; Rohe et al. 2002; Harkness andNewman 2002; Dietz and Haurin 2003). This relationship may exist in partbecause homeowners exhibit lower household mobility which in turn fosters amore stable home environment. Therefore, homeowners may produce childrenwho are less likely to engage in juvenile crime. Fourth, homeownership has beenlinked to better physical and mental health outcomes (Rohe et al. 2002; Dietzand Haurin 2003). Therefore, homeowners may be more resilient when faced bystressful situations and less likely to react violently or unpredictably.
While rental properties often have more crime activity than owner-occupied
6

Terance J. Rephann
dwellings, di¤erences have been found among rental properties. Public own-ership has been found to be associated with more crime (Roncek et al. 1981;McNulty and Holloway 2000). This �nding may in part or whole simply re�ectother factors correlated with public housing such as tenant socioeconomic dis-advantage and social isolation (McNulty and Holloway 2000), certain aspects ofthe built environment (Mazerolle and Terill 1997) or apartment complex scale(Roncek et al. 1981; Santiago, Galster and Pettit 2003).
Recent work emphasizes the importance of rental property management incontrolling crime through tenant selection and managing tenant behavior. Eckand Wartell 1998 �nd that �drug dealers select places that have weak man-agement.�Weak management is often distinguished by lower levels of propertymaintenance, less frequent visits by the owners and managers to the property,and fewer e¤orts to screen tenants. Clarke and Bichler-Robertson 1998 suggestthat when new property management is upgraded at slumlord owned apartmentdwellings, crime is reduced through applicant screening, eviction and improvedsecurity.
Management quality is not directly observable and that presents a di¢ -culty for empirical hypothesis testing. Since poorly managed properties receiveless maintenance, and will exhibit signs of greater physical deterioration, theappearance of the exterior may provide a visual clue. Ownership characteris-tics may also be important indicators. Apgar 2004 notes that many part-time�mom-and-pop�rental property investors lack the skills to manage and main-tain rental housing. The challenges of managing these properties may grow asthe size of holdings expand. Physical distance may also serve as a managerialimpediment. More remote owners may �nd it di¢ cult to monitor the conditionsthat exist at their properties. On the other hand, nearby owners will have botha greater stake in property conditions because of its e¤ect on their own livingspace (Mayer 1981) or surrounding neighborhood.
2.6 Neighborhood Characteristics
Neighborhood socioeconomic characteristics are sometimes invoked as explana-tory variables for crime. Often variables measured in aggregated geographicalunits are used because of the absence of microdata. However, there are alsovalid theoretical rationales for introducing neighborhood e¤ects in micro models(e.g., contagion theories, the collective socialization model, competition theory,relative deprivation theory, and game theory) (Dietz 2002).1
1Dietz (2002) argues that these variables are often introduced in a casual way withoutconsideration of wider modeling and econometric rami�cations including: (a) the re�ectionproblem, (b) omitted variable bias, and (c) endogenous regressors. He �nds that most studieswhich include them do so with a lack of econometric precision and tend to overestimate theirimportance. Neighborhood e¤ects often dissipate when these additional corrective measuresare employed.
7

Rental Housing and Crime: The Role of Property Ownership and Management
Within a Routine Activities framework, neighborhood housing, demographicand socioeconomic variables can be used to gauge place di¤erences in the sup-ply of potential o¤enders, the attractiveness of targets, and/or the levels ofguardianship. For instance, areas will larger percentages of unemployed youngmales might be expected to have a larger pool of potential o¤enders.2 Neigh-borhoods with higher home values might represent more attractive targets forproperty crime. Neighborhoods with low levels of homeownership or high levelsof mobility could have more di¢ culty establishing local social networks neededto foster better guardianship.
Although theoretical rationales often di¤er, there is some commonality inthe types of neighborhood variables used to explain crime variation. They in-clude poverty (Alba et al. 1994; Olligschlaeger 1997; Miles-Doan 1998; Baumer,Horney, Felson and Lauritsen 2003), female headed households with children(Roncek et al. 1981; Olligschlaeger 1997; Miles-Doan 1998; McNulty and Holloway2000; Baumer et al. 2003), racial demographics (Roncek et al. 1981; Albaet al. 1994; Miles-Doan 1998; McNulty and Holloway 2000; Baumer et al. 2003),age demographics (Alba et al. 1994; Olligschlaeger 1997; Miles-Doan 1998),unemployment rates (Miles-Doan 1998; McNulty and Holloway 2000; Baumeret al. 2003), public assistance (Miles-Doan 1998; Baumer et al. 2003) housing val-ues (Roncek et al. 1981; Miles-Doan 1998), household income (Alba et al. 1994;Olligschlaeger 1997), homeownership (Alba et al. 1994), and education levels(Alba et al. 1994; Miles-Doan 1998).
3 The Study Area
The study area is the small city (population 21,518) of Cumberland located inthe rugged Appalachian mountain region of Western Maryland. Cumberland isapproximately two hours driving time from three major metropolitan areas in-cluding Washington, DC, Baltimore, MD, and Pittsburgh, PA. It is the countyseat of Allegany County which experienced a rapid decline in well-paying manu-facturing jobs in the 1970s and 1980s from which it still has not fully recovered.Therefore, measures of well-being, such as per capita income, dropped fromabout 75% of State per capita income in 1969 to 61% in 2004.
The City has experienced a signi�cant increase in the crime rate during thepast 20 years that has abated slightly only recently (see Figure 1). While thecrime rate has decreased in the State at large, this pattern has not been pro-nounced in Cumberland. As a result, the crime rate now stands signi�cantlyhigher than the state average and the reputation of the area as being a safe
2Neighborhood boundaries are less likely to adequately capture the pool of available o¤end-ers because criminals are able to travel to the target. Therefore, spatial econometric methodsare sometimes recommended to correct for the in�uence of proximate neighborhoods.
8

Terance J. Rephann
Figure 1: Cumberland Crime, 1985-2005
rural community has begun to be called into question. In part, this may re-�ect a nationwide phenomenon of urban /rural convergence in crime rates or"metropolitan spillover" (Rephann 1999). It may also re�ect problems asso-ciated with the recent deindustrialization, including the kind of neighborhoodblight and social decay that has been attributed to crime rate increases in smallcities elsewhere in the rustbelt region (Ackerman and Murray 2004). Other sig-ni�cant local developments that may have contributed to crime increases werethe designation of an Interstate highway through the heart of the city and theopening of two medium security prisons (WCI a state prison and FCI a federalprison) in the vicinity.
Compared to the U.S. and Maryland, the City of Cumberland has a relativelylow rate of home occupancy that has changed very little in the past 40 years.According to the 2000 Census, approximately 58% of occupied housing unitsare owner occupied compared to 67.7% for Maryland and 66.2% for the U.S.Much of the rental stock is located in the central older and more distressedareas of town (see Figure 2). Over half of the units are owned by those whoreside outside city limits (see Table 1). Fewer than one in �ve property ownerslives on the same premises as the rental unit; this compares with one in fourin a national survey (Savage 1998). Neighborhood crime indicators such as thenumber of disturbance incident reports �led per 100,000 residents (see Figure3) are positively associated with neighborhood rental occupancy rates.
9

Rental Housing and Crime: The Role of Property Ownership and Management
Figure 2: Cumberland Percentage Owner-Occupied Housing
Figure 3: Cumberland Disturbances Rate
10

Terance J. Rephann
Table 1: Apartment properties and units by address of ownerResidence # properties % Cum % # units % Cum %Same property 289 18.68 18.68 472 16.07 16.07Same neighborhood 207 13.38 32.06 392 11.01 27.08Same city 336 21.72 53.78 736 20.68 47.76Same zip code 297 19.20 72.98 620 17.42 65.18Within 60 miles 223 14.41 87.39 469 13.18 78.36Within 500 miles 157 10.15 97.54 677 19.02 97.38500 miles or greater 38 2.46 100.00 93 2.62 100.00Total 1,547 100.00 3,559 100.00
4 Data Assembly and Characteristics
4.1 Data Sources
Data for this study are derived from several sources:
City of Cumberland Police Department Incident Report Database.This database records incidents �led by City Police. For calendar year 2005,it contains information on approximately 25,000 incident reports (IRs) basedon emergency hotline calls and police observations including criminal incidents,tra¢ c reports, and service calls. Each incident report record contains an address,brief description of the nature of the call, time of call, investigating o¢ cer, anddisposition of the case (e.g., closed, open, arrest).
The incident reports are based on call data and police surveillance. Theyare not to be confused with actual criminal reports which form the basis forthe statistics reported in the Uniform Crime Report. However, such data maystill be useful (Sherman et al. 1989). It may be more comprehensive thanUniform Crime Report data because victims may be willing to make a call butnot to �le a criminal report. In addition, it provides the only way to �nd thelocations of crimes because this information is not retained by Uniform CrimeReport reports. At the same time, these data have certain weaknesses (Shermanet al. 1989). For instance, it is not possible to determine whether the locationgiven in the report is the actual location of the crime, the callers�location, orthe place where police o¢ cers are dispatched. In addition, there is no way toascertain the veracity of the report� false alarms or mistakes may be reportedalong with genuine crimes.
City of Cumberland Rental Unit Database. This data contains in-formation on 3,134 privately owned registered rental units representing 1,480properties within the City of Cumberland. Rental registration is required tocomply with City Ordinance. Registered units are subject to an annual regis-
11
Rental Housing and Crime: The Role of Property Ownership and Management
tration fee and must be inspected when an apartment unit changes tenants.3
Not all city rental units are represented in this database. It does not includerecords for publicly owned rental units, privately owned rental units that utilizeSection 8 vouchers, or units that are rented/leased by agencies through pro-grams that are sponsored by the state. These units are exempted by ordinancebecause they are subject to other housing agency inspections.
There are approximately 430 public housing units in the city, 436 Section 8units, and 411 other exempt units. The total number of registered and exemptunits is 4,411 which exceeds the 2000 Census count of 4,084 renter-occupiedunits. However, this discrepancy can be accounted for by new apartment con-struction since the 2000 census (at least 120 units), owner-occupied to rentaldwelling conversions, and some overlap between section 8 registration and reg-ular rental registration systems. Nonetheless, these �gures suggest that there isa relatively high rate of compliance with the city rental registration program.
City of Cumberland HUD Section 8 Voucher Database. This data-base contains the addresses and owner/manager address of approximately 436HUD Section 8 vouchers. The Section 8 program is administered di¤erentlythan the Rental unit Database and records are �led di¤erently.
Maryland O¢ ce of Planning Property View. This database compilesinformation from the Department of Assessments and Taxation on all privateand public real property. It includes information on various characteristics ofthe property including street location, physical location in terms of latitudinaland longitudinal coordinates, Census Block Group identi�cation code, lot size,dwelling age, enclosed area, structure condition code, and assessable value.
U.S. Census 2000 of Population and Housing. This data containsCensus Block Group level data on various population and housing characteristicsthat were used to generate neighborhood indicators of socioeconomic levels andhousing quality.
4.2 Data Assembly
Geographical Information Systems (GIS) technology has greatly assisted e¤ortsto map and model crime patterns. Sherman et al. 1989 was one of the earlieststudies to use this methodology to identify criminogenic places, and the prob-lems they encountered are still relevant today. Incident report data is used tokeep a record of police activity for internal monitoring and legal reference. It isnot usually designed to be used for research and analysis. Therefore, geograph-ical information contained in individual records ranges in quality.
3 Ideally allowance would be made for the amount of time that each rental unit was occupied.Rental units that were registered were not necessarily rented out for the entire year. However,data were not available on the exact times of tenant occupancy.
12

Terance J. Rephann
In reviewing the incident report data for this study, a variety of problemswere observed. In many cases, incident locations were not assigned an exactstreet address. For example, some incidents were identi�ed as �CumberlandArea�because a suspect may have been observed in the city at an unknown lo-cation. In other cases, intersections were identi�ed (e.g., corner of ColumbiaAvenue and Valley Street) or establishments were identi�ed by name (e.g.,a popular pub). When street addresses were found, errors are not uncom-mon. Sometimes, addresses were misspelled. In other instances, incorrect streetnumbers were assigned �(e.g., Columbia Street runs from 100-400 blocks andColumbia Avenue from 500-800 blocks but sometimes an incident report wouldidentify, say, �212 Columbia Avenue�and �514 Columbia Street�which don�texist).
Because of these kinds of problems, it was necessary to review individualrecords for accuracy and revise them manually in instances where the entry wasclearly in error. Street addresses found in Maryland Property View were used asthe reference point and street abbreviations and addresses were modi�ed so thatthe two datasets would mesh using street address as the temporary key. Sincethe rental registration records utilize the same property identi�er number usedin Property View, it was possible to make a direct correspondence between theserecords (with a handful of manual modi�cations to correct data entry errors)and the remaining rental registration records.
It was not necessary to geo-code the addresses obtained above. In addi-tion to providing various property attributes used in assessing real property,Property View includes the longitudinal and latitudinal coordinates and censusblock group identi�cations for each property parcel. Geographical location in-formation obtained via this route is better than what could be obtained fromgeo-coding via ARGIS using a TIGER base map. The TIGER base map lackeda complete street inventory for the City and geo-coding is done by interpola-tion of the street arc (Olligschlaeger 1997) which measures parcel centroids lessaccurately than the polygon methods employed by Property View.
The relatively high degree of incomplete addresses meant that it was impos-sible to assign every police incident report to a street number. Approximately73% of all criminal incident data had street addresses and 93% of these weresuccessfully merged with the PropertyView data for an overall success rate of68%. However, this rate falls short of the levels achieved in some other stud-ies. For instance, Miles-Doan (1998) obtains 84% for Duval County, Florida(which contains Jacksonville) and Olligschlaeger (1997) achieves 97% in Pitts-burgh. However, there are di¤erences in the type, quality, and research purposefor the data. The data for those studies was collected by larger metropolitanpolice departments that have more advanced data entry, query, and reportingsystems. Finally, this study is concerned with crime that occurs on privateproperty. So, crime occurring in public spaces such as street intersections orplaces that cannot be assigned are of less interest.
13

Rental Housing and Crime: The Role of Property Ownership and Management
5 Research Hypotheses
The Uniform Crime Reports distinguishes between property and violent crimes.This distinction is useful in as much as it highlights the severity of the crime aswell as suggests possibly di¤ering explanatory models. Another distinction issometimes made between �predatory or exploitive crimes�and �crimes that aremutualistic, competitive and individualistic�(Roncek et al. 1981). Argumentsbetween familiar parties such as assaults would constitute �competitive�crimeswhereas burglary would be considered �exploitative.�
The role of place is likely to di¤er depending on the type of crime. Sherman,Gartin and Buerger (2000) argue that �predatory stranger� crimes are muchmore dependent on place than �competitive�crimes. The presence of compet-itive crimes like domestic assaults and disturbances at certain residences �maysimply indicate that certain buildings are receptors for the kind of people mostlikely to experience, or at least call police about, domestic problems; such callsmight occur at the same rate no matter where they lived.�
Eck and Wartell (1998) argues that place characteristics such as propertymanagement may help explain variation in these kinds of problems as well.When residents are more likely to engage in disruptive behavior, loose propertymanagement and low levels of property surveillance may be accessory factors. Ifdisturbances and other nuisance conditions originate in a particular rental unitand no attempt is made to notify the occupant that the behavior is disruptiveto the harmony and tranquility enjoyed by other tenants and/or neighborhoodresidents, one can conclude that the property has weak guardianship.
In the case of owner-occupied residential properties, guardianship is clear �the owner-occupant lives in the property and assumes principal responsibly forits maintenance and the conduct of its residents. For tenant occupied residentialproperties, guardianship is often less clear cut. Ownership may be local orexternal to the community. In the case of the latter contacting the owner orhis local agent may be more challenging. Furthermore, the non-local owner willhave fewer opportunities for directing, inspecting and monitoring the property.Ownership may also be more di¤use in the case of legal ownership forms such aspartnerships and corporations. Management skills may di¤er based on years ofrental management experience and the number of properties which are managed.
Since management quality is not directly observable, this paper tests forseveral hypothetical correlates of property management (see Table 2). It is hy-pothesized that local owners that reside on the property (LEVEL1) are likely tobe more e¤ective property managers than those who live further away (LEVEL2-LEVEL7). Moreover, because of the higher transactions costs associated withmanagement from a distance, the e¤ect is hypothesized to weaken with eachincrement in distance from the property. In addition, it is hypothesized thatthere are rather immediate diseconomies of scale in the management of proper-
14

Terance J. Rephann
ties (OWNUNITS). As the number of units registered by the landlord increases,the e¤ectiveness of property management is hypothesized to decrease.
Additional property, tenant, and neighborhood level variables are introducedto control for other explanations for residential crime variation (see Table 2).The number of apartment units (UNITS) in a dwelling would be expected toincrease the likelihood of observing crime there because of the greater numberof households residing there. It may also increase the likelihood of detectionbecause of the relatively close proximity of other tenants. The only tenant levelindicator available for this study is a dummy variable indicating whether a ten-ant of the property uses a HUD section 8 voucher to pay for rent (HUDUNIT).This variable is used to control for tenant socioeconomic status. A disadvan-taged socioeconomic level is associated with a greater likelihood of criminalactivity. Therefore, the coe¢ cient for this variable would be expected to bepositive. On the other hand, the Section 8 voucher program �one strike�policyplaces certain restrictions on its tenants. Local program administrators mayrevoke a tenants Section 8 voucher for �any criminal activity that threatens thehealth, safety, or right to peaceful enjoyment of the premises by other residents;any criminal activity that threatens the health, safety, or right to peaceful en-joyment of their residences by persons residing in the immediate vicinity of thepremises; any criminal activity that threatens the health, or safety of any on-siteproperty management sta¤ responsible for managing the premises; or any drugrelated criminal activity on or near such premises, engaged in by the resident,any member of the resident�s household, or any guest or other person under theresident�s control.�
Based on the criminal literature review, selected neighborhood variables areused as control variables. In de�ning the boundaries of neighborhoods, thisstudy uses Census Block Groups from the 2000 U.S. Census� a conventionused for practical reasons rather than �thoughtful theoretical considerations�(Dietz 2002). The neighborhood variables include measures of residential sta-bility (RESSTAB) and home ownership (OWNOCC) which are expected to benegatively associated with rental unit crime as noted previously, measures ofsocioeconomic deprivation such as the percentage of households headed by fe-male householders with children (FFHH), poverty rate (POVRATE), minoritypopulation percentage (MINPOP), unemployment rate (UNEMP), percentageof households receiving public assistant (PUBASS), and median household in-come (HHINC) and demographic factors which indicate populations with variedpropensities to criminal activity such as the percentage of residents that is youngmales (MALEPOP), percentage of teenagers that is �drifters�(YOUNGUN), andpercentage of residents that is college educated (COLLPOP).
The units of observation used in this study are individual properties withdwellings that are represented in Property View. Usually, these properties aresingle family homes, but in some instances they are attached structures suchas residential duplexes, row houses, and condominium/apartment units within
15
Rental Housing and Crime: The Role of Property Ownership and Management
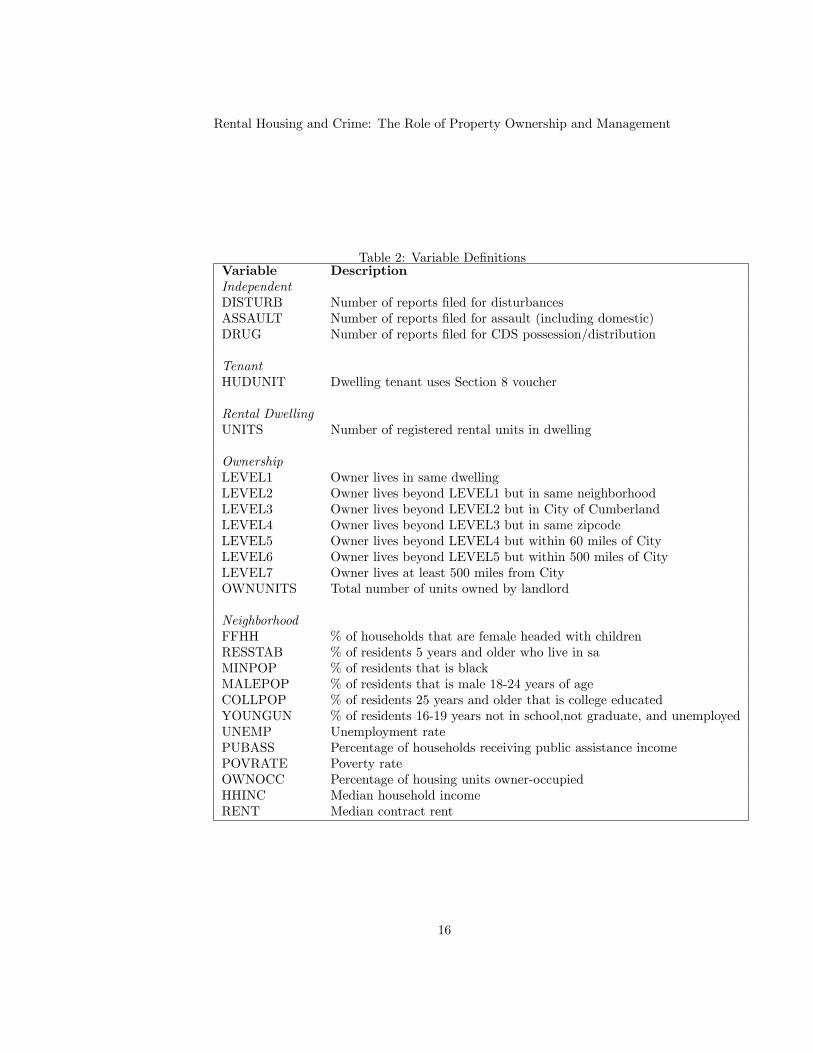
Table 2: Variable De�nitionsVariable DescriptionIndependentDISTURB Number of reports �led for disturbancesASSAULT Number of reports �led for assault (including domestic)DRUG Number of reports �led for CDS possession/distribution
TenantHUDUNIT Dwelling tenant uses Section 8 voucher
Rental DwellingUNITS Number of registered rental units in dwelling
OwnershipLEVEL1 Owner lives in same dwellingLEVEL2 Owner lives beyond LEVEL1 but in same neighborhoodLEVEL3 Owner lives beyond LEVEL2 but in City of CumberlandLEVEL4 Owner lives beyond LEVEL3 but in same zipcodeLEVEL5 Owner lives beyond LEVEL4 but within 60 miles of CityLEVEL6 Owner lives beyond LEVEL5 but within 500 miles of CityLEVEL7 Owner lives at least 500 miles from CityOWNUNITS Total number of units owned by landlord
NeighborhoodFFHH % of households that are female headed with childrenRESSTAB % of residents 5 years and older who live in saMINPOP % of residents that is blackMALEPOP % of residents that is male 18-24 years of ageCOLLPOP % of residents 25 years and older that is college educatedYOUNGUN % of residents 16-19 years not in school,not graduate, and unemployedUNEMP Unemployment ratePUBASS Percentage of households receiving public assistance incomePOVRATE Poverty rateOWNOCC Percentage of housing units owner-occupiedHHINC Median household incomeRENT Median contract rent
16
Terance J. Rephann
Figure 4: Observed Crime Counts
larger structures.
The dependent variables used in this study are the number of incident re-ports �led for individual properties for three separate categories of criminal inci-dents during the 2005 calendar year: disturbances, assault (including domesticassault), and use or distribution of controlled dangerous substances includingcocaine, opiates, marijuana and barbiturates.
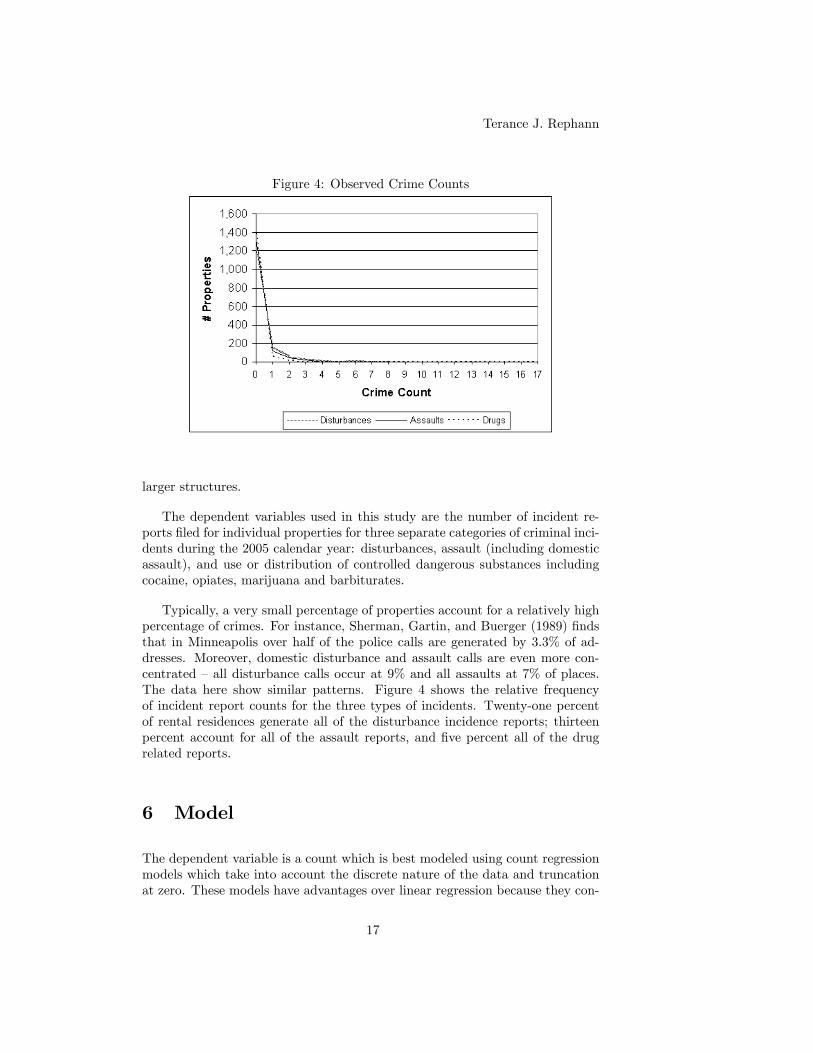
Typically, a very small percentage of properties account for a relatively highpercentage of crimes. For instance, Sherman, Gartin, and Buerger (1989) �ndsthat in Minneapolis over half of the police calls are generated by 3.3% of ad-dresses. Moreover, domestic disturbance and assault calls are even more con-centrated �all disturbance calls occur at 9% and all assaults at 7% of places.The data here show similar patterns. Figure 4 shows the relative frequencyof incident report counts for the three types of incidents. Twenty-one percentof rental residences generate all of the disturbance incidence reports; thirteenpercent account for all of the assault reports, and �ve percent all of the drugrelated reports.
6 Model
The dependent variable is a count which is best modeled using count regressionmodels which take into account the discrete nature of the data and truncationat zero. These models have advantages over linear regression because they con-
17

Rental Housing and Crime: The Role of Property Ownership and Management
form more closely to the pattern of data generation observed, produce positivepredictions, and o¤er the possibility of e¢ ciency improvements over the linearregression model (Grogger 1990).
The reference point for developing count models is the Poisson distribution.The Poisson distribution represents the probability of a count y of discrete eventsoccurring during a designated time period as follows:
Pr1(y) =e���y
y! y = 0; 1; 2; :::N:
In order to incorporate independent explanatory factors, Poisson regressionallows � to vary with each observation. Independent variables are invoked toexplain the variation in �i. This can be represented as follows:
�i = E(yijxi) = exi� = e�1+�2x2i+:::�kxki
The Poisson regression model (PRM) is somewhat restrictive because it hasthe property that both the mean and variance are the same �E(y) = V (y) = ��a condition referred to as equidispersion. Relatedly, Poisson count regressionsalso often result in lower predictions of zero counts than are realized in the data.This problem can often be attributed to equation misspeci�cation (Cameron andTrivedi 2006). Selecting other count regression models which allow the varianceto exceed the mean (a condition referred to as overdispersion) can often rectifythe problem too.
Three such models are examined here. The �rst, the Negative Binomialregression model (NBRM), adjusts the Poisson model by introducing a randomerror ("i) that is independent of the independent variables (xi). That is to say:
�i = E(yijxi) = exi� = e�1+�2x2i+:::�kxki+"i
Assuming that E(e"i) is equal to one (equivalent to the assumption that theexpected value of the error term equals zero in the linear regression model) andthat e"i is drawn from a gamma distribution (�(:)) leads to a negative binominaldistribution:
Pr2(y) =�(y+��1)y!�(��1)
���1
��1+�
���1 ��
��1+�
�ywhere V (e"i) � �. This results in E(y) = � and V (y) = �(1 + � �). So, �
in�uences the degree of dispersion �and if � = 0 the model is equivalent to thePoisson regression model.
The zero-in�ated count (ZIP) model and zero-in�ated Negative Binomialmodel (ZINB) achieve overdisperson by in e¤ect mixing bi-variate and countmodels. One assumes that observations can be divided into two latent groups.The �rst group has no probability of event occurrence, perhaps because of someintrinsic qualities of the observation (e.g., in the example provided by this study,
18
Terance J. Rephann
a rental dwelling is empty). The other group has a probability of events occur-ring with frequency greater or equal to zero.
Probabilities for the model are computed as a weighted average of estimatedprobabilities of occurrence according to a bi-variate regression process (for in-stance logit or probit) and estimated probability of the number of occurrencesaccording to count regression models described above. This can more formallybe represented as follows:
Prj(y) =�Pr(0)+(1�Pr(0)) Pri(0) if y=0(1�Pr(0)) Pri(k) if y�1 where j = 3; 4
Pr(0) is the binary model computed probability of zero occurrences andPri(0) and Pri(k) are the count model computed probabilities of zero occur-rences and k occurrences respectively. For i=1 (where the count model is thePoisson), the model corresponds to the ZIP and for i=2 (where the count modelis the Negative Binomial) the model is the ZINB. The variables used in estimat-ing the binary regression may di¤er from those used in the count regression.
7 Results
Regressions and diagnostic tests were conducted using STATA software�s countmodel procedures POISSON, NBREG, ZIP, ZINB, additional count model di-agnostic programs LISTCOEF and COUNFIT (Long and Freese 2006), andcollinearity diagnostic routine COLDIAG2 (Hendrickx 2004). In order to forma more parsimonious set of explanatory variables, linear regression diagnosticssuch as the condition index, variance in�ation factor (VIF), and pairwise corre-lations were examined for values that were unusually high. Five variables wereculled from the analysis including POVRATE, RENT, RESTAB, HHINC, andUNEMP resulting in a condition index of 25, a maximum VIF of less than two,and pairwise correlations below .53 in absolute value.
Tables 3 and 4 present the results of the four di¤erent regression modelsof disturbances counts: Poisson, Negative Binomial, zero in�ated Poisson, andzero in�ated negative binomial. The tables show the estimated coe¢ cients, t teststatistics4 , and exponentiated coe¢ cients5 for each of the models. Since ZIP andZINB are mixed models as explained above, they estimate two equations. Thesecond estimated equation represents the overall probability of a zero count; the�rst represents the probability for a non-zero count. The same set of independentvariables are used in estimating each equation.
4***� = :01; **� = :05; **� = :105The exponentiated coe¢ cient (e�k� ) is equal to the factor increase in the expected count
when xk increases by �, holding all other variables constant. That is to say:E(yjx;xk+�)E(yjx;xk)
= e�k�
19

Rental Housing and Crime: The Role of Property Ownership and Management
Table 3: Count Model Resutls for Disturbances: Poisson and Negative BinomialPRM NBRM
� t e�k � t e�k
OwnershipLEVEL2 -0.0575 -0.33 0.944 0.1171 0.42 1.124LEVEL3 0.0286 0.19 1.029 0.2543 1.05 1.289LEVEL4 0.3834 2.73*** 1.467 0.3586 1.53 1.431LEVEL5 0.5436 3.85*** 1.722 0.6565 2.65*** 1.928LEVEL6 0.8278 5.75*** 2.288 0.7898 2.93*** 2.203LEVEL7 0.5466 2.54** 1.727 0.6743 1.43 1.963OWNUNITS 0.0150 4.58*** 1.015 0.0190 2.38*** 1.019
TenantHUDUNIT 1.0525 13.89*** 2.865 0.9561 5.44*** 2.601
Rental DwellingUNITS -0.0018 -0.38 0.998 0.0486 1.24 1.050
NeighborhoodFFHH 0.0375 2.00** 1.038 0.4625 1.43 1.047MINPOP 0.0483 2.86*** 1.050 0.0356 1.05 1.036YOUNGUN 0.0197 3.28*** 1.020 0.0147 1.36 1.015MALEPOP -0.0365 -0.95 0.964 -0.0483 -0.69 0.953COLLPOP -0.0219 -2.86*** 0.978 -0.0142 -1.26 0.0986OWNOCC -0.0119 -3.87 0.988 -0.0124 -2.32** 0.988
CONSTANT -1.2685 -3.87*** -1.4592 -2.55**Mean jDi¤j 0.019 0.001BIC 3447.839 2551.449
20

Terance J. Rephann
Table 4: Count Model Results for Disturbances: Zero In�ated Poisson andNegative Binomial
ZIP ZINB� t e�k � t e�k
LEVEL2 -0.0535 -0.25 0.948 0.3807 0.95 1.463LEVEL3 -0.3315 -1.80* 0.718 -0.1810 -0.56 0.834LEVEL4 -0.3594 -2.08** 0.698 -0.0381 -0.12 0.963LEVEL5 0.1246 0.74 1.133 0.3645 1.12 1.440LEVEL6 0.0707 0.41 1.073 0.5256 1.56 1.691LEVEL7 0.2719 0.98 1.312 0.8326 1.65* 2.299OWNUNITS -0.0043 -0.81 0.996 -0.0061 -0.79 0.994UNITS 0.1416 8.06*** 1.152 0.006 0.04 1.001FFHH 0.0507 2.15** 1.052 0.0479 1.15 1.049MINPOP 0.0128 0.63 1.013 -0.0168 -0.46 0.983YOUNGUN 0.0056 0.74 1.006 0.004 0.03 1.000MALEPOP 0.0053 0.11 1.005 0.0619 0.68 1.064COLLPOP 0.0032 0.37 1.003 -0.0277 -.198** 0.973OWNOCC -0.0082 -2.16** 0.992 -0.0109 -1.60 0.989CONSTANT 0.1908 0.49 -0.1307 -0.19
LEVEL2 0.1948 0.59 1.215 0.8084 1.55 2.244LEVEL3 -0.5575 -1.98** 0.573 -0.7069 -1.28 0.493LEVEL4 -0.8616 -3.18*** 0.422 -0.5535 -1.18 0.575LEVEL5 -0.6200 -2.31** 0.538 -0.4061 -0.85 0.666LEVEL6 -0.7639 -2.59** 0.466 -0.3298 -0.62 0.719LEVEL7 -0.3804 -0.74 0.684 1.0198 1.03 2.773OWNUNITS -0.0325 -3.03*** 1.033 -0.1114 -2.81*** 0.895HUDUNIT -1.0865 -6.21*** 0.337 -0.3768 -0.62 0.686UNITS 0.0321 1.89* 0.968 -0.4423 -2.33** 0.643FFHH 0.0078 0.21 1.008 -0.0077 -0.10 0.992MINPOP -0.6325 -1.68* 0.939 -0.1337 -1.75* 0.875YOUNGUN -0.0168 -1.37 0.983 -0.0332 -1.35 0.967MALEPOP 0.0715 0.91 1.074 0.2026 1.35 1.225COLLPOP 0.0323 2.39** 1.033 -0.0090 -0.33 0.991OWNOCC -0.0005 -0.01 1.000 -0.0059 -0.55 0.994CONSTANT 1.7674 2.68*** 2.2566 1.72*Mean jDi¤j 0.005 0.002BIC 2776.957 2596.039
21

Rental Housing and Crime: The Role of Property Ownership and Management
The results for the di¤erent estimation methods show certain similarities.The coe¢ cients for dummy variables LEVEL2-LEVEL7 generally grow in mag-nitude indicating that crime increases as the property owner lives further awayfrom a given rental property. There are also statistically signi�cant di¤erencesin incident report counts for those variables indicating landlords who live inclose proximity to their properties versus those residing outside the immediatearea. This �nding provides support for the hypothesis that management quali-ties di¤er between local and non-local landlords. Larger rental property holdings(OWNUNITS) are also associated with higher counts, suggesting diseconomiesof scale in managing rental properties. Other factors are relevant as well. Hav-ing tenants in a rental property who use Section 8 vouchers (HUDUNIT) isassociated with a greater frequency of incident reports as are neighborhoodswith a lower percentages of owner-occupied units (OWNOCC). Disturbancesmay be exacerbated in neighborhoods where lower levels of residential stabilityand stake-holding exist. Alternatively, problem properties may be concentratedin neighborhoods with low owner occupancy �an identi�cation problem whichsuggests the use of instrumental variable (IV) techniques.
Several diagnostic tests recommend the Negative Binomial regression modelover the alternatives. A likelihood ratio test rejects the null hypothesis that� = 0 and provides evidence that the data is overdispersed, thereby disquali-fying the Poisson model. A visual inspection of Figure 5 shows that the meanpredicted probability of the Negative Binomial model provides a better �t tothe observed data than the other models. This is further supported by theaverage residual of observed and average predicted counts (Mean jDi¤j).6 TheBayesian Information Criterion (BIC) model selection test statistic also supportsthe choice of the Negative Binomial regression model.
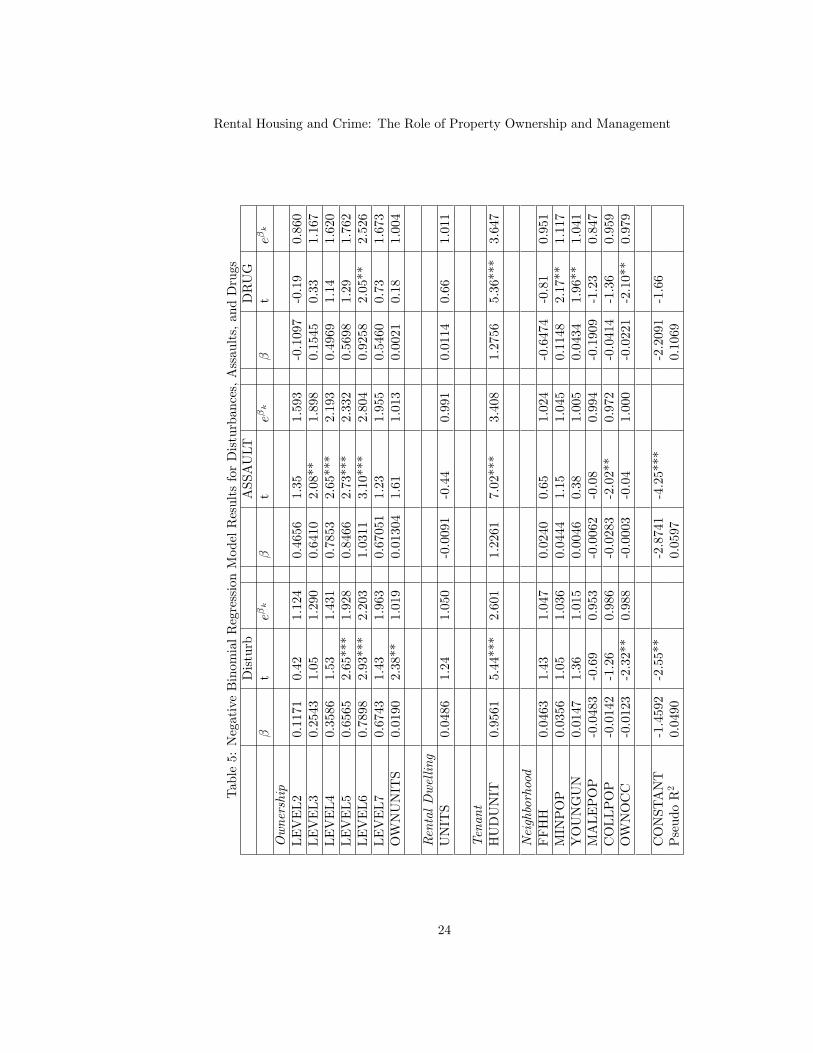
Table 5 shows the results of Negative Binomial regressions for disturbances,assaults, and drugs. For all three types of incidents, the magnitude of the esti-mated coe¢ cients grow with the owner�s remoteness from the rental property.This �ownership distance gradient�for crime is illustrated in Figure 6. Section8 voucher use at the rental property is also associated with more incident re-ports in each category. In two of the three regressions (disturbances and drugs),neighborhood owner-occupation rates are associated with lower activity.
6MeanjDi¤j=PMi=0
���Probserved(y=i)� 1N
PNj=1 Prpredicted(yj=i)
���M+1
where Probserved is the observed probability, Prpredicted is the estimated probability, N isthe number of observations, and M is the maximum count.
22

Terance J. Rephann
Figure 5: Count Model Prediction Residuals
23
Rental Housing and Crime: The Role of Property Ownership and Management
Table5:NegativeBinomialRegressionModelResultsforDisturbances,Assaults,andDrugs
Disturb
ASSAULT
DRUG
�t
e�k
�t
e�k
�t
e�k
Ownership
LEVEL2
0.1171
0.42
1.124
0.4656
1.35
1.593
-0.1097
-0.19
0.860
LEVEL3
0.2543
1.05
1.290
0.6410
2.08**
1.898
0.1545
0.33
1.167
LEVEL4
0.3586
1.53
1.431
0.7853
2.65***
2.193
0.4969
1.14
1.620
LEVEL5
0.6565
2.65***
1.928
0.8466
2.73***
2.332
0.5698
1.29
1.762
LEVEL6
0.7898
2.93***
2.203
1.0311
3.10***
2.804
0.9258
2.05**
2.526
LEVEL7
0.6743
1.43
1.963
0.67051
1.23
1.955
0.5460
0.73
1.673
OWNUNITS
0.0190
2.38**
1.019
0.01304
1.61
1.013
0.0021
0.18
1.004
RentalDwelling
UNITS
0.0486
1.24
1.050
-0.0091
-0.44
0.991
0.0114
0.66
1.011
Tenant
HUDUNIT
0.9561
5.44***
2.601
1.2261
7.02***
3.408
1.2756
5.36***
3.647
Neighborhood
FFHH
0.0463
1.43
1.047
0.0240
0.65
1.024
-0.6474
-0.81
0.951
MINPOP
0.0356
1.05
1.036
0.0444
1.15
1.045
0.1148
2.17**
1.117
YOUNGUN
0.0147
1.36
1.015
0.0046
0.38
1.005
0.0434
1.96**
1.041
MALEPOP
-0.0483
-0.69
0.953
-0.0062
-0.08
0.994
-0.1909
-1.23
0.847
COLLPOP
-0.0142
-1.26
0.986
-0.0283
-2.02**
0.972
-0.0414
-1.36
0.959
OWNOCC
-0.0123
-2.32**
0.988
-0.0003
-0.04
1.000
-0.0221
-2.10**
0.979
CONSTANT
-1.4592
-2.55**
-2.8741
-4.25***
-2.2091
-1.66
PseudoR2
0.0490
0.0597
0.1069
24
Terance J. Rephann
Figure 6: Ownership Distance Crime Gradients
There are also notable di¤erences among the results. In contrast to dis-turbances, the size of landlord rental property holdings is not associated withmore assault and drug incident reports. In addition, for assaults and drugs,other neighborhood correlates are observed � percentage of college educatedresidents (COLLPOP) for assaults and minority population and young males(YOUNGUN) for drugs. These results suggest, perhaps, that the exacerbatingneighborhood conditions di¤er depending on the nature of the crime.
One way of viewing the contribution of absentee ownership to disorderlyproperties is to predict the number of criminal incidents emanating from privaterental dwellings assuming that all the rental properties have a landlord livingon the site. In this situation, the landlord is more likely to be selective of thetenants he chooses, less accommodating to behavior and lifestyles which disturbthe peace and harmony of the neighborhood, and more attentive to security. Bysetting the LEVEL variables equal to zero (i.e., landlord lives in rental dwelling),one �nds that the total number of disturbances drops from 776 to 512 (a 34%decrease), the number of assaults goes from 313 to 159 (a 49% decrease), andthe number of drug incidents declines from 79 to 54 (a 32% decrease).7 While
7Boardman et al (1997) suggest monetizing the impact of crime using imputed costs. Theyreport estimates of the cost of assault (in 1994 $ terms) that varies from $6,700-$26,700 percrime and cost of drug crimes at $6,400 per crime. Assuming each of the incidents re�ects areal crime, the total costs of absentee ownership would range between $1,185,400 to $4,265,400.For reference purposes, even the lower range of these �gures far outstrips the city property taxand fee revenues generated by the rental properties in question (property tax base $59,989,680times .9479 per $100 assessed value)=$568,642.Alternatively, the municipal �scal impact of external rental ownership can be estimated by
multiplying police department expenditures by the percentage of additional crime attributableto external ownership. Approximately thirty percent (30%) of all criminal incident reports
25
Rental Housing and Crime: The Role of Property Ownership and Management
it might be assumed that these activities would merely be displaced to otherproperties in the city or move outside the city boundaries, evidence suggeststhat there is real deterrence value in better property management and that thetotal number of crimes will decrease (Sherman, Gartin and Buerger 1989; Clarkeand Bichler-Robertson 1998; Eck and Wartell 1998).
8 Summary and Conclusions
Several studies relate neighborhood homeownership patterns to lower levels ofcrime. The converse of this statement is that a rise in the share of tenantproperties may contribute to higher crime. This paper shows that this general-ization is not entirely useful because only a relatively small percentage of rentalproperties are sources of criminal activity.
By focusing on three categories of criminal incidents (disturbances, assaults,and drugs) that residents often cite as detracting from a neighborhood�s qualityof life, certain patterns are evident. Foremost, property ownership and manage-ment characteristics such as owner�s remoteness from his properties is positivelyassociated with reported criminal activity. It is suggested here that this associa-tion is in part causal because such owners often exhibit weaker management andhave less of a stake in maintaining the harmony of the surrounding neighbor-hood. They may be less selective in the choice of tenants, more accommodatingof behavior and lifestyles that they would not accept if it were located �nextdoor�to their own residence, and less likely to institute surveillance and secu-rity measures. In instances such as this, there may be a role for local governmentto provide better information, education, and enforcement to improve landlordawareness and management capabilities.
The results here suggest a role for proper local government stewardship aswell. HUD Section 8 voucher recipients agree to certain restrictions when theyaccept publicly subsidized housing that other private renters do not. In sit-uations where enforcement is lax, there is an opportunity for Local HousingAuthorities to leverage their position as a subsidy provider to improve tenantbehavior. Better enforcement would involve greater coordination between lo-cal police departments and housing assistance o¢ ces to identify disorderly andcriminal tenants.
Neighborhood based correlates of criminal activity are much less amenableto local government control than the aforementioned variables. But, the resultshere suggest that neighborhood homeownership may have a ameliorative e¤ecton crime. Promoting homeownership, especially among residents who lack the
are �led at rental units. If one assumes that the lower end (32%) estimate of reduction incrime is evident across other criminal incidents, that would translate into an approximately10% reduction in crime or potential savings of $420,000.
26

Terance J. Rephann
�nancial assets, credit history, income, or life skills (e.g., balancing a checkbook, parenting) is a challenging process. Moreover, homeownership is not foreverybody �especially frequent movers and younger people. However, only 41%of renters rent as a matter of choice (Fannie Mae 2001), most renters see rentingas not being a very positive experience (Fannie Mae 2003), and homeowners are�more satis�ed than renters with their dwelling units�(Rohe and Stewart 1996).Therefore, programs designed to improve tenant transition to homeownershipmay deserve additional resources.
Sampson 2001 lists additional local government actions to lessen drug crimescommitted in privately owned apartments. Some of these responses may helpabate other types of nuisances. They include landlord centered e¤orts suchas increased code enforcement activities to identify poorly managed properties,noti�cation letters sent by the police department to landlords when criminalactivity is detected in a rental dwelling, and mandatory landlord training to en-hance management capabilities. Other approaches include establishing landlordlicensing to disqualify poorly attentive landlords from operating rental proper-ties, supporting the construction of professionally managed workforce housingprojects to enhance the quality and availability of properly managed rental prop-erties, and fostering the growth of neighborhood associations and crime watchesto improve neighborhood crime detection and neighborhood social capital.
This study falls within the ��rst-generation�category of studies where econo-metric controls are relatively weak (Dietz and Haurin 2003). Several additionallayers of empirical modeling would improve con�dence in the results. First as al-luded to previously, several independent variables are possibly co-determinantsof disorderly property and property characteristics �particularly neighborhoodcovariates. Therefore, tests utilizing instrumental variable techniques are rec-ommended. Second, this study utilized only a portion of the variables avail-able for study. For instance, rental structure quality may provide evidence ofrental maintenance management and the presence of other types of neglect likenuisance citations may help to identify poorly managed properties. Finally,additional insight may be gained by expanding the number of observations toinclude other publicly owned and publicly inspected rental properties.
References
Ackerman, W. V. and Murray, A. T.: 2004, Assessing spatial patterns of crimein Lima, Ohio, Cities 21(5), 423�437.
Alba, R. D., Logan, J. R. and Bellair, P. E.: 1994, Living with crime: Theimplications of racial/ethnic di¤erences in suburban location, Social Forces72(2), 395�434.
27

Rental Housing and Crime: The Role of Property Ownership and Management
Apgar, W.: 2004, Rethinking rental housing: Expanding the ability of rentalhousing to serve as a pathway to economic and social opportunity, Technicalreport, Harvard University, Joint Center for Housing Studies.
Baumer, E., Horney, J., Felson, R. and Lauritsen, J. L.: 2003, Neighborhooddisadvantage and the nature of violence, Criminology 41(1), 39�71.
Cameron, A. C. and Trivedi, P. K.: 2006, Regression analysis of count data,Cambridge University Press, New York.
Clarke, R. V. and Bichler-Robertson, G.: 1998, Place managers, slumlords andcrime in low rent apartment buildings, Security Journal 11(1), 11�19.
Cohen, L. E. and Felson, M.: 1979, Social change and crime rate trends: Arountine activity approach, American Sociological Review 44(4), 588�608.
Cornwell, C. and Trumbull, W. N.: 1994, Estimating the economic model ofcrime with panel data, Review of Economics and Statistics 76(2), 153�174.
Coulson, N. E., Hwang, S.-J. and Imai, S.: 2002, The value of owner occupationin neighborhoods, Journal of Housing Research 13(2), 153�174.
Coulson, N. E., Hwang, S.-J. and Imai, S.: 2003, The bene�ts of owner-occupation in neighborhoods, Journal of Housing Research 13(1), 21�48.
Dietz, R. D.: 2002, The estimation of neighborhood e¤ects in the social sciences:An interdisciplinary approach, Social Science Research 31(4), 539�575.
Dietz, R. D. and Haurin, D. R.: 2003, The social and private micro-level conse-quences of homeownership, Journal of Urban Economics 54(3), 401�450.
DiPasquale, D. and Glaeser, E. L.: 1999, Incentives and social capital: Arehomeowners better citizens?, Journal of Urban Economics 45(2), 354�384.
Dymowski, G. R.: 2001, Malicious landlords and problem properties: A whitepaper, Technical report, Metropolis St. Louis.
Eck, J. E. and Wartell, J.: 1998, Improving the management of rental proper-ties with drug problems: A randomized experiment, in L. Mazerolle andJ. Roehl (eds), Civil Remedies and Crime Prevention, Vol. 9 of CrimePrevention Studies, Criminal Justice Press, Monsey, NY, pp. 161�185.
Fannie Mae: 2001, Fannie mae national housing survey 2001: Examining thecredit-impaired borrower.
Fannie Mae: 2003, Fannie mae national housing survey 2003: Understandingamerica�s homeownership gaps.
Fishman, G., Hakim, S. and Shachmurove, Y.: 1998, The use of householdsurvey data�the probability of property crime victimization, Journal ofEconomic and Social Measurement 24(1), 1�13.
28
Terance J. Rephann
Glaeser, E. L. and Sacerdote, B.: 1999, Why is there more crime in cities?,Journal of Political Economy 107(6), 225�258.
Grogger, J.: 1990, The deterrent e¤ect of capital punishment: An analysisof daily homicide counts, Journal of the American Statistical Association85(410), 295�303.
Hakim, S., Ovadia, A., Sagi, E. and Weinblatt, J.: 1979, Interjurisdictionalspillover of crime and police expenditure, Land Economics 55(2), 200�212.
Hakim, S., Rengert, G. F. and Shachmurove, Y.: 2001, Target search of burglars:A revised economic model, Papers in Regional Science 80(2), 121�137.
Hakim, S. and Shachmurove, Y.: 1996, Spatial and temporal patterns of com-mercial burglaries: the evidence examined, The American Journal of Eco-nomics and Sociology 55(4), 443�456.
Harkness, J. and Newman, S. J.: 2002, Homeownership for the poor in distressedneighborhoods: Does this make sense?, Housing Policy Debate 13(3), 597�630.
Haurin, D. R., Parcel, T. L. and Haurin, R. J.: 2001, The impact of howeown-ership on child outcomes, Technical Report LIHO-01.14.
Hendrickx, J.: 2004, Coldiag2: Stata module to evaluate collinearity in linearregression.
Long, J. S. and Freese, J.: 2006, Regression models for categorical dependentvariables using Stata, Stata Press, College Station, TX.
Mayer, N. S.: 1981, Rehabilitation decisions in rental housing: An empiricalanalysis, Journal of Urban Economics 10(1), 76�94.
Mazerolle, L. G. and Terill, W.: 1997, Problem-oriented policing in public hous-ing: Identifying the distribution of problem places, Policing 20(2), 235�255.
McNulty, T. and Holloway, S. R.: 2000, Race, crime, and public housing inAtlanta: Testing a conditional e¤ect hypothesis, Social Forces 79(2), 707�729.
Miles-Doan, R.: 1998, Violence between spouses and intimates: Does neighbor-hood context matter?, Social Forces 77(2), 623�45.
Olligschlaeger, A. M.: 1997, Spatial analysis of crime using GIS-based data:Weighted spatial adaptive �ltering and chaotic cellular forecasting with ap-plications to street level drug markets., PhD thesis, Carnegie Mellon Uni-versity.
Rephann, T.: 1999, Links between rural development and crime, Papers inRegional Science 78(4), 365�386.
29

Rental Housing and Crime: The Role of Property Ownership and Management
Rohe, W. M. and Stewart, L. S.: 1996, Homeownership and neighborhood sta-bility, Housing Policy Debate 7(1), 37�81.
Rohe, W. M., Van Zandt, S. and McCarthy, G.: 2002, Home ownership andaccess to opportunity, Housing Studies 17(1), 51�61.
Roncek, D. W., Bell, R. and Francik, J. M. A.: 1981, Housing projects andcrime: Testing a proximity hypothesis, Social Problems 29(2), 151�166.
Sampson, R.: 2001, Drug dealing in privately owned apartment complexes,Problem-Oriented Guides for Police Series, U.S. Department of Justice,O¢ ce of Community Oriented Policing Series, Washington, DC.
Santiago, A. M., Galster, G. C. and Pettit, K. L. S.: 2003, Neighborhood crimeand scattered-site public housing, Urban Studies 40(11), 2147�2163.
Savage, H.: 1998, What we have learned about properties, owners, and ten-ants from the 1995 property owners and managers survey, Technical ReportH121/98-1, U.S. Census Bureau.
Sherman, L. W., Gartin, P. R. and Buerger, M. E.: 1989, Hot spots of preada-tory crime: Routine activities and the criminology of place, Criminology27(1), 27�55.
Sorenson, D. J., Trumbull, W. N. and Cornwell, C.: 1996, Estimating the eco-nomic model of crime: Does space matter?, Technical Report 9620, Re-gional Research Institute.
Sullivan, A. M.: 1990, Urban economics, Irwin, Boston.
Zelinka, A. and Brennan, D.: 2001, SafeScape: Creating safer, more livablecommunities through planning and design, American Planning Association,Chicago.
30