renewables information 2020 edition database …
TRANSCRIPT

RENEWABLES INFORMATION 2020 EDITION
DATABASE DOCUMENTATION

2 - RENEWABLES INFORMATION: DATABASE DOCUMENTATION (2020 Edition)
INTERNATIONAL ENERGY AGENCY
This documentation provides support information for the IEA Renewables Information database. This document
can be found online at: http://wds.iea.org/wds/pdf/ren_documentation.pdf.
Please address your inquiries to [email protected].
Please note that all IEA data is subject to the following Terms and Conditions found on the IEA’s website: https://www.iea.org/terms

RENEWABLES INFORMATION: DATABASE DOCUMENTATION (2020 Edition) - 3
INTERNATIONAL ENERGY AGENCY
TABLE OF CONTENTS
1. CHANGES FROM LAST EDITION ............................................................................... 4
2. DATABASE STRUCTURE ........................................................................................... 5
3. FLOW DEFINITIONS .................................................................................................... 7
4. PRODUCT DEFINITIONS ........................................................................................... 27
5. GEOGRAPHICAL COVERAGE .................................................................................. 34
6. COUNTRY NOTES AND SOURCES .......................................................................... 47
7. UNITS AND CONVERSIONS...................................................................................... 75
8. ABBREVIATIONS ....................................................................................................... 79
4 - RENEWABLES INFORMATION: DATABASE DOCUMENTATION (2020 Edition)
INTERNATIONAL ENERGY AGENCY
1. CHANGES FROM LAST EDITION
Geographical coverage
Colombia joined the OECD in April 2020 however, data for Colombia are not included in the OECD aggregate
for this edition.
In this edition, Equatorial Guinea, and the Lao People’s Democratic Republic have been added as countries in the
world files (RENWORLDBAL.IVT and RENWORLDBES.IVT).
New OECD files
In this edition, the trade of renewable products has been added to this package. RENOECDEXP contains OECD
exports by destination and RENOECDIMP contains OECD imports by origin.

RENEWABLES INFORMATION: DATABASE DOCUMENTATION (2020 Edition) - 5
INTERNATIONAL ENERGY AGENCY
2. DATABASE STRUCTURE
The database Renewables Information includes annual data for:
OECD files (Updated July 2020)
countries: 36 OECD countries and 5 regional aggregates (see section Geographical coverage);
years: 1990-2019 (OECD countries and regions);
RENOECDBAL.IVT OECD, Renewables Balance (GWh, TJ, ktoe)
Energy balances in matrix form (18 products; 78 flows)
Electricity and heat output by type of producer (10 flows)
RENOECDBES.IVT OECD, Renewables Supply and Consumption (GWh, TJ, kt)
Energy statistics in matrix form (36 products; 78 flows)
Electricity and heat output by type of producer (10 flows)
RENOECDCAP.IVT OECD, Net Capacity - Renewables (MWe, m2, MWth)
Electrical capacity in matrix form (20 products)
Solar collector surface and thermal capacity (2 products)
RENOECDEXP.IVT OECD, Exports by destination (kt)
OECD member countries’ exports by destination in matrix form (165 country
destinations)
Liquid biofuels and wood pellets (6 products)
RENOECDIMP.IVT OECD, Imports by origin (kt)
OECD member countries’ imports by origin in matrix form (165 country origins)
Liquid biofuels and wood pellets (6 products)

6 - RENEWABLES INFORMATION: DATABASE DOCUMENTATION (2020 Edition)
INTERNATIONAL ENERGY AGENCY
WORLD files (Updated July 2020)
countries: 148 countries and regional aggregates (see section Geographical coverage);
years: 1990-2019;
RENWORLDBAL.IVT WORLD, Renewables and Waste Energy Supply (GWh, TJ, ktoe)
Energy balances in matrix form (148 countries + 20 aggregates; 18 products; 7 flows)
Electricity and heat output (2 flows)
This edition includes data through 2018 and provisional data for 2019.
RENWORLDBES.IVT WORLD, Renewables and Waste Statistics (GWh, TJ, kt)
Energy statistics in matrix form (148 countries + 20 aggregates; 16 products; 7 flows)
Electricity and heat output (2 flows)
This edition includes data through 2018 and provisional data for 2019.
Differences may exist for OECD countries and aggregates between RENWORLDBAL and RENWORLDBES
compared to RENOECDBAL and RENOECDBES in shared flows and the interactive specific information (such
as country notes or product definitions) provided for each element. This also means that the information provided
in this documentation may supersede the interactive information found in RENWORLDBAL and REN-
WORLDBES.

RENEWABLES INFORMATION: DATABASE DOCUMENTATION (2020 Edition) - 7
INTERNATIONAL ENERGY AGENCY
3. FLOW DEFINITIONS
OECD, Renewables Balance (ktoe): RENOECDBAL.IVT
WORLD, Renewables and Waste Energy Supply: RENWORLDBAL.IVT
Supply
Flow Short name Definition
Production INDPROD Comprises the production of primary energy, i.e. hard coal, lig-
nite/brown coal, peat, crude oil, NGLs, natural gas, combustible
renewables and waste, nuclear, hydro, geothermal, solar and the
heat from heat pumps that is extracted from the ambient environ-
ment. Production is calculated after removal of impurities (e.g. sul-
phur from natural gas). Calculation of production of hydro, geo-
thermal, etc. and nuclear electricity is explained in the section
Units and conversions.
Imports IMPORTS Comprise amounts having crossed the national territorial boundaries
of the country whether or not customs clearance has taken place.
Exports EXPORTS Comprise amounts having crossed the national territorial boundaries
of the country whether or not customs clearance has taken place.
International marine
bunkers
MARBUNK Covers those quantities delivered to ships of all flags that are engaged
in international navigation. The international navigation may take
place at sea, on inland lakes and waterways, and in coastal waters.
Consumption by ships engaged in domestic navigation is excluded.
The domestic/international split is determined on the basis of port of
departure and port of arrival, and not by the flag or nationality of the
ship. Consumption by fishing vessels and by military forces is also
excluded. See domestic navigation, fishing and other non-specified.
International marine bunkers are excluded from the supply at the
country and regional level, but not for world, where they are includ-
ed in transport under World marine bunkers.
8 - RENEWABLES INFORMATION: DATABASE DOCUMENTATION (2020 Edition)
INTERNATIONAL ENERGY AGENCY
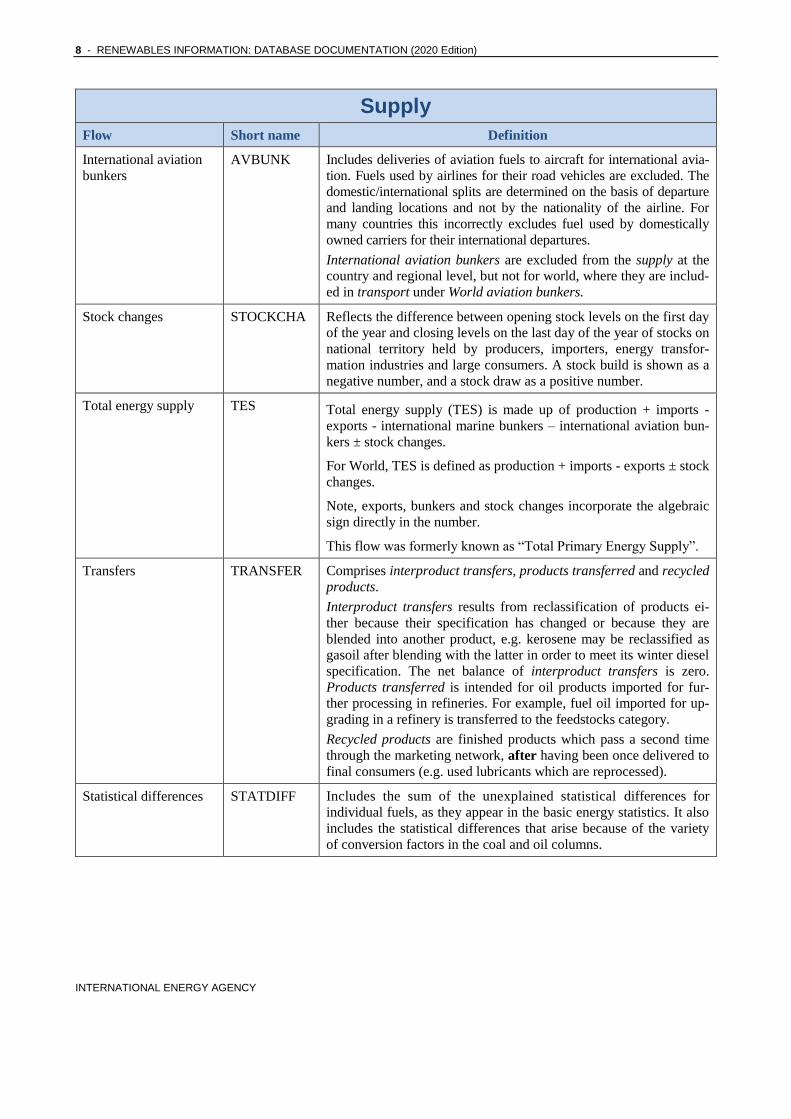
Supply
Flow Short name Definition
International aviation
bunkers
AVBUNK Includes deliveries of aviation fuels to aircraft for international avia-
tion. Fuels used by airlines for their road vehicles are excluded. The
domestic/international splits are determined on the basis of departure
and landing locations and not by the nationality of the airline. For
many countries this incorrectly excludes fuel used by domestically
owned carriers for their international departures.
International aviation bunkers are excluded from the supply at the
country and regional level, but not for world, where they are includ-
ed in transport under World aviation bunkers.
Stock changes STOCKCHA Reflects the difference between opening stock levels on the first day
of the year and closing levels on the last day of the year of stocks on
national territory held by producers, importers, energy transfor-
mation industries and large consumers. A stock build is shown as a
negative number, and a stock draw as a positive number.
Total energy supply TES Total energy supply (TES) is made up of production + imports -
exports - international marine bunkers – international aviation bun-
kers ± stock changes.
For World, TES is defined as production + imports - exports ± stock
changes.
Note, exports, bunkers and stock changes incorporate the algebraic
sign directly in the number.
This flow was formerly known as “Total Primary Energy Supply”.
Transfers TRANSFER Comprises interproduct transfers, products transferred and recycled
products.
Interproduct transfers results from reclassification of products ei-
ther because their specification has changed or because they are
blended into another product, e.g. kerosene may be reclassified as
gasoil after blending with the latter in order to meet its winter diesel
specification. The net balance of interproduct transfers is zero.
Products transferred is intended for oil products imported for fur-
ther processing in refineries. For example, fuel oil imported for up-
grading in a refinery is transferred to the feedstocks category.
Recycled products are finished products which pass a second time
through the marketing network, after having been once delivered to
final consumers (e.g. used lubricants which are reprocessed).
Statistical differences STATDIFF Includes the sum of the unexplained statistical differences for
individual fuels, as they appear in the basic energy statistics. It also
includes the statistical differences that arise because of the variety
of conversion factors in the coal and oil columns.

RENEWABLES INFORMATION: DATABASE DOCUMENTATION (2020 Edition) - 9
INTERNATIONAL ENERGY AGENCY
Transformation processes
Flow Short name Definition
Transformation
processes
TOTTRANF The transformation processes comprises the conversion of primary
forms of energy to secondary and further transformation (e.g. coking
coal to coke, crude oil to petroleum products, and heavy fuel oil to
electricity). Inputs to transformation processes are shown as negative
numbers and output from the process is shown as a positive number.
Transformation losses will appear in the “total” column as negative
numbers.
Main activity producer
electricity plants
MAINELEC Refers to plants which are designed to produce electricity only. If
one or more units of the plant is a CHP unit (and the inputs and
outputs cannot be distinguished on a unit basis) then the whole
plant is designated as a CHP plant. Main activity producers (for-
merly referred to as public supply undertakings) generate electrici-
ty for sale to third parties, as their primary activity. They may be
privately or publicly owned. Note that the sale need not take place
through the public grid.
Autoproducer
electricity plants
AUTOELEC Refers to plants which are designed to produce electricity only. If
one or more units of the plant is a CHP unit (and the inputs and
outputs cannot be distinguished on a unit basis) then the whole
plant is designated as a CHP plant. Autoproducer undertakings
generate electricity wholly or partly for their own use as an activity
which supports their primary activity. They may be privately or
publicly owned.
Main activity producer
CHP plants
MAINCHP Refers to plants which are designed to produce both heat and elec-
tricity (sometimes referred to as co-generation power stations). If
possible, fuel inputs and electricity/heat outputs are on a unit basis
rather than on a plant basis. However, if data are not available on a
unit basis, the conventions for defining a CHP plant noted above
are adopted. Main activity producers (formerly referred to as public
supply undertakings) generate electricity and/or heat for sale to
third parties, as their primary activity. They may be privately or
publicly owned. Note that the sale need not take place through the
public grid.
Autoproducer CHP
plants
AUTOCHP Refers to plants which are designed to produce both heat and elec-
tricity (sometimes referred to as co-generation power stations). If
possible, fuel inputs and electricity/heat outputs are on a unit basis
rather than on a plant basis. However, if data are not available on a
unit basis, the conventions for defining a CHP plant noted above
are adopted. Note that for autoproducer CHP plants, all fuel inputs
to electricity production are taken into account, while only the part
of fuel inputs to heat sold is shown. Fuel inputs for the production
of heat consumed within the autoproducer’s establishment are not
included here but are included with figures for the final consump-
tion of fuels in the appropriate consuming sector. Autoproducer
undertakings generate electricity and/or heat, wholly or partly for
their own use as an activity which supports their primary activity.
They may be privately or publicly owned.
10 - RENEWABLES INFORMATION: DATABASE DOCUMENTATION (2020 Edition)
INTERNATIONAL ENERGY AGENCY
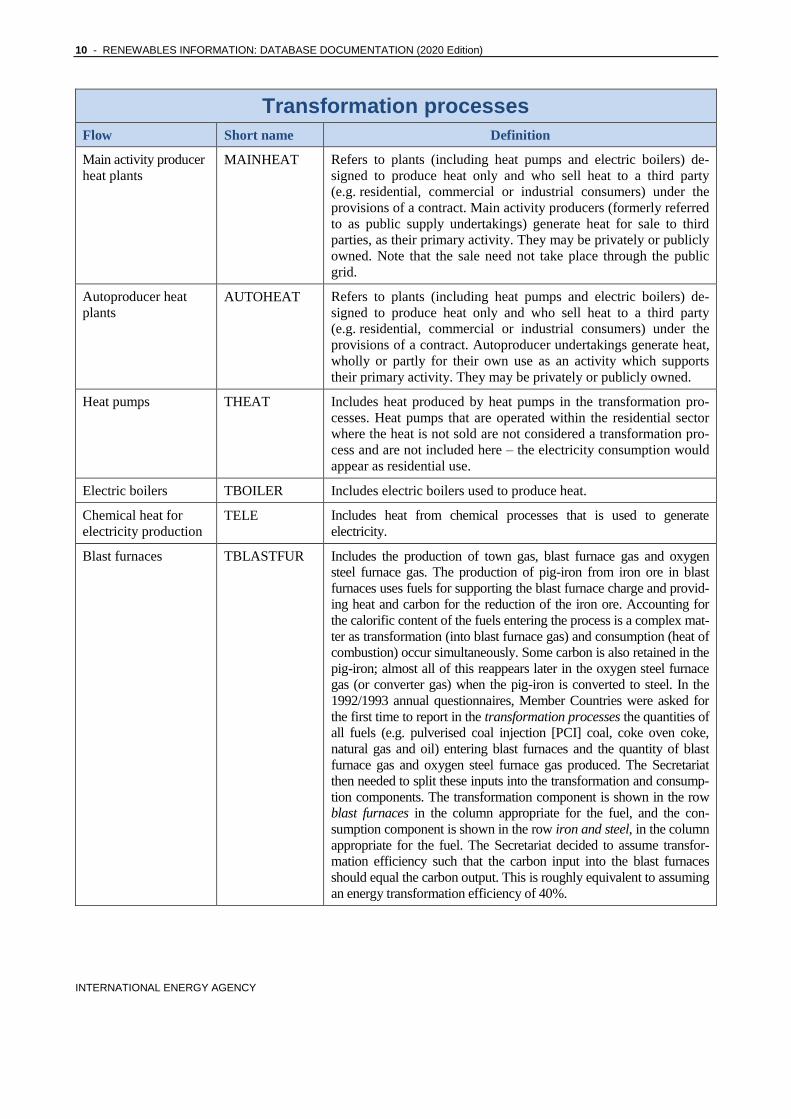
Transformation processes
Flow Short name Definition
Main activity producer
heat plants
MAINHEAT Refers to plants (including heat pumps and electric boilers) de-
signed to produce heat only and who sell heat to a third party
(e.g. residential, commercial or industrial consumers) under the
provisions of a contract. Main activity producers (formerly referred
to as public supply undertakings) generate heat for sale to third
parties, as their primary activity. They may be privately or publicly
owned. Note that the sale need not take place through the public
grid.
Autoproducer heat
plants
AUTOHEAT Refers to plants (including heat pumps and electric boilers) de-
signed to produce heat only and who sell heat to a third party
(e.g. residential, commercial or industrial consumers) under the
provisions of a contract. Autoproducer undertakings generate heat,
wholly or partly for their own use as an activity which supports
their primary activity. They may be privately or publicly owned.
Heat pumps THEAT Includes heat produced by heat pumps in the transformation pro-
cesses. Heat pumps that are operated within the residential sector
where the heat is not sold are not considered a transformation pro-
cess and are not included here – the electricity consumption would
appear as residential use.
Electric boilers TBOILER Includes electric boilers used to produce heat.
Chemical heat for
electricity production
TELE Includes heat from chemical processes that is used to generate
electricity.
Blast furnaces TBLASTFUR Includes the production of town gas, blast furnace gas and oxygen
steel furnace gas. The production of pig-iron from iron ore in blast
furnaces uses fuels for supporting the blast furnace charge and provid-
ing heat and carbon for the reduction of the iron ore. Accounting for
the calorific content of the fuels entering the process is a complex mat-
ter as transformation (into blast furnace gas) and consumption (heat of
combustion) occur simultaneously. Some carbon is also retained in the
pig-iron; almost all of this reappears later in the oxygen steel furnace
gas (or converter gas) when the pig-iron is converted to steel. In the
1992/1993 annual questionnaires, Member Countries were asked for
the first time to report in the transformation processes the quantities of
all fuels (e.g. pulverised coal injection [PCI] coal, coke oven coke,
natural gas and oil) entering blast furnaces and the quantity of blast
furnace gas and oxygen steel furnace gas produced. The Secretariat
then needed to split these inputs into the transformation and consump-
tion components. The transformation component is shown in the row
blast furnaces in the column appropriate for the fuel, and the con-
sumption component is shown in the row iron and steel, in the column
appropriate for the fuel. The Secretariat decided to assume transfor-
mation efficiency such that the carbon input into the blast furnaces
should equal the carbon output. This is roughly equivalent to assuming
an energy transformation efficiency of 40%.

RENEWABLES INFORMATION: DATABASE DOCUMENTATION (2020 Edition) - 11
INTERNATIONAL ENERGY AGENCY
Transformation processes
Flow Short name Definition
Gas works TGASWKS Includes the manufacture of town gas. Note: in the summary bal-
ances this item also includes other gases blended with natural gas
(TBLENDGAS).
Coke ovens TCOKEOVS Includes the manufacture of coke and coke oven gas.
Patent fuel plants TPATFUEL Includes the manufacture of patent fuels.
BKB plants/PB plants TBKB Includes the manufacture of BKB and peat briquettes.
Oil refineries TREFINER Includes the manufacture of finished petroleum products.
Petrochemical plants TPETCHEM Covers backflows returned from the petrochemical sector. Note
that backflows from oil products that are used for non-energy pur-
poses (i.e. white spirit and lubricants) are not included here, but in
non-energy use.
Coal liquefaction
plants
TCOALLIQ Includes coal, oil and tar sands used to produce synthetic oil.
Gas-to-liquids (GTL)
plants
TGTL Includes natural gas used as feedstock for the conversion to liquids,
e.g. the quantities of fuel entering the methanol product process for
transformation into methanol.
For blended natural
gas
TBLENDGAS Includes other gases that are blended with natural gas.
Charcoal production
plants
TCHARCOAL Includes the transformation of solid biofuels into charcoal.
Non-specified
(transformation)
TNONSPEC Includes other non-specified transformation.
12 - RENEWABLES INFORMATION: DATABASE DOCUMENTATION (2020 Edition)
INTERNATIONAL ENERGY AGENCY
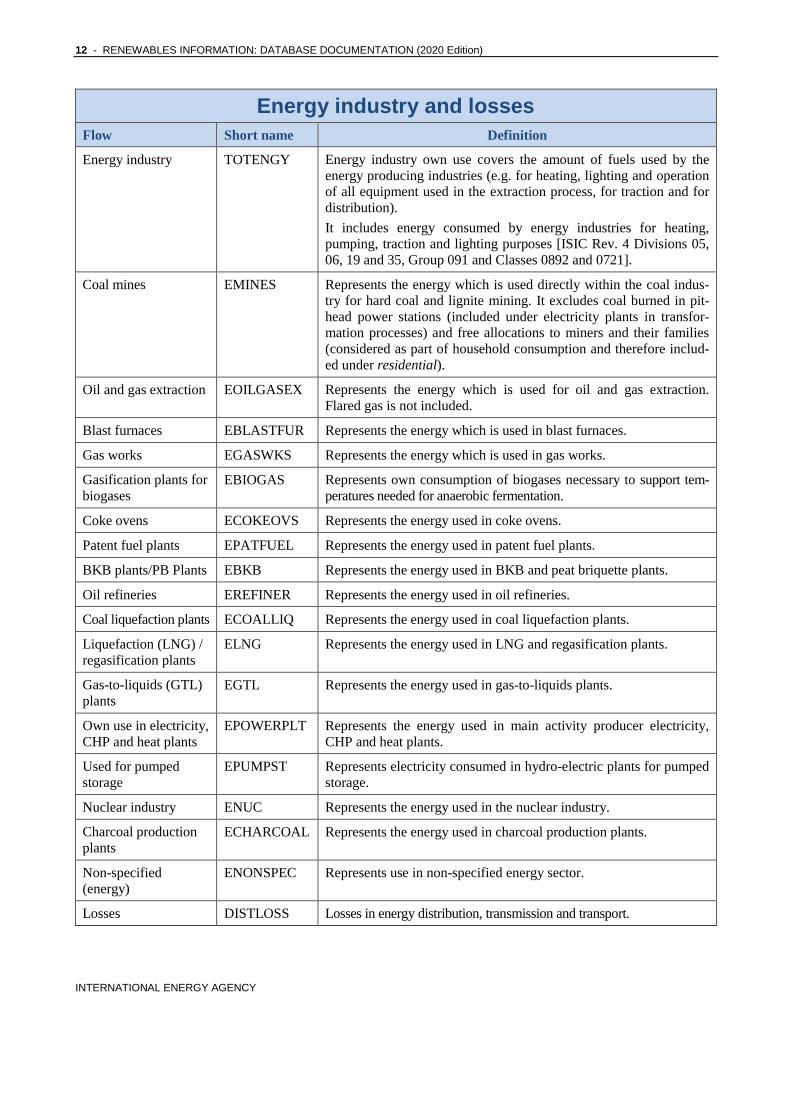
Energy industry and losses
Flow Short name Definition
Energy industry TOTENGY Energy industry own use covers the amount of fuels used by the
energy producing industries (e.g. for heating, lighting and operation
of all equipment used in the extraction process, for traction and for
distribution).
It includes energy consumed by energy industries for heating,
pumping, traction and lighting purposes [ISIC Rev. 4 Divisions 05,
06, 19 and 35, Group 091 and Classes 0892 and 0721].
Coal mines EMINES Represents the energy which is used directly within the coal indus-
try for hard coal and lignite mining. It excludes coal burned in pit-
head power stations (included under electricity plants in transfor-
mation processes) and free allocations to miners and their families
(considered as part of household consumption and therefore includ-
ed under residential).
Oil and gas extraction EOILGASEX Represents the energy which is used for oil and gas extraction.
Flared gas is not included.
Blast furnaces EBLASTFUR Represents the energy which is used in blast furnaces.
Gas works EGASWKS Represents the energy which is used in gas works.
Gasification plants for
biogases
EBIOGAS Represents own consumption of biogases necessary to support tem-
peratures needed for anaerobic fermentation.
Coke ovens ECOKEOVS Represents the energy used in coke ovens.
Patent fuel plants EPATFUEL Represents the energy used in patent fuel plants.
BKB plants/PB Plants EBKB Represents the energy used in BKB and peat briquette plants.
Oil refineries EREFINER Represents the energy used in oil refineries.
Coal liquefaction plants ECOALLIQ Represents the energy used in coal liquefaction plants.
Liquefaction (LNG) /
regasification plants
ELNG Represents the energy used in LNG and regasification plants.
Gas-to-liquids (GTL)
plants
EGTL Represents the energy used in gas-to-liquids plants.
Own use in electricity,
CHP and heat plants
EPOWERPLT Represents the energy used in main activity producer electricity,
CHP and heat plants.
Used for pumped
storage
EPUMPST Represents electricity consumed in hydro-electric plants for pumped
storage.
Nuclear industry ENUC Represents the energy used in the nuclear industry.
Charcoal production
plants
ECHARCOAL Represents the energy used in charcoal production plants.
Non-specified
(energy)
ENONSPEC Represents use in non-specified energy sector.
Losses DISTLOSS Losses in energy distribution, transmission and transport.
RENEWABLES INFORMATION: DATABASE DOCUMENTATION (2020 Edition) - 13
INTERNATIONAL ENERGY AGENCY
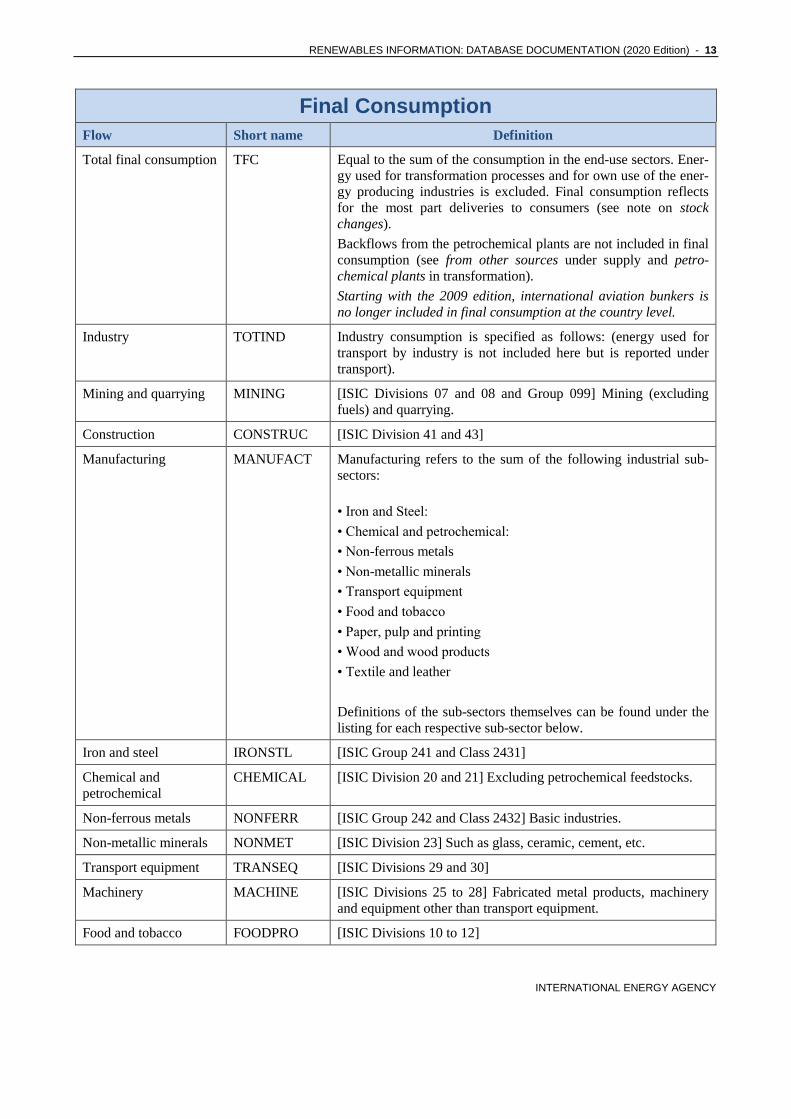
Final Consumption
Flow Short name Definition
Total final consumption TFC Equal to the sum of the consumption in the end-use sectors. Ener-
gy used for transformation processes and for own use of the ener-
gy producing industries is excluded. Final consumption reflects
for the most part deliveries to consumers (see note on stock
changes).
Backflows from the petrochemical plants are not included in final
consumption (see from other sources under supply and petro-
chemical plants in transformation).
Starting with the 2009 edition, international aviation bunkers is
no longer included in final consumption at the country level.
Industry TOTIND Industry consumption is specified as follows: (energy used for
transport by industry is not included here but is reported under
transport).
Mining and quarrying MINING [ISIC Divisions 07 and 08 and Group 099] Mining (excluding
fuels) and quarrying.
Construction CONSTRUC [ISIC Division 41 and 43]
Manufacturing MANUFACT Manufacturing refers to the sum of the following industrial sub-
sectors:
• Iron and Steel:
• Chemical and petrochemical:
• Non-ferrous metals
• Non-metallic minerals
• Transport equipment
• Food and tobacco
• Paper, pulp and printing
• Wood and wood products
• Textile and leather
Definitions of the sub-sectors themselves can be found under the
listing for each respective sub-sector below.
Iron and steel IRONSTL [ISIC Group 241 and Class 2431]
Chemical and
petrochemical
CHEMICAL [ISIC Division 20 and 21] Excluding petrochemical feedstocks.
Non-ferrous metals NONFERR [ISIC Group 242 and Class 2432] Basic industries.
Non-metallic minerals NONMET [ISIC Division 23] Such as glass, ceramic, cement, etc.
Transport equipment TRANSEQ [ISIC Divisions 29 and 30]
Machinery MACHINE [ISIC Divisions 25 to 28] Fabricated metal products, machinery
and equipment other than transport equipment.
Food and tobacco FOODPRO [ISIC Divisions 10 to 12]
14 - RENEWABLES INFORMATION: DATABASE DOCUMENTATION (2020 Edition)
INTERNATIONAL ENERGY AGENCY
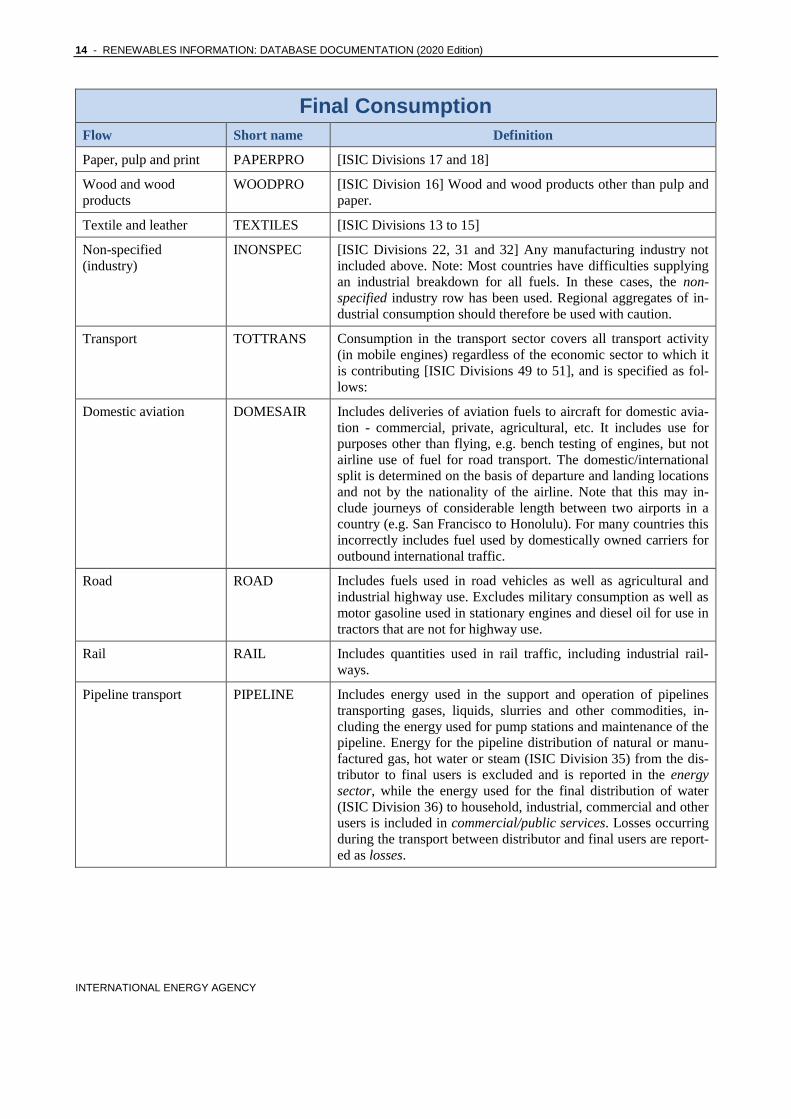
Final Consumption
Flow Short name Definition
Paper, pulp and print PAPERPRO [ISIC Divisions 17 and 18]
Wood and wood
products
WOODPRO [ISIC Division 16] Wood and wood products other than pulp and
paper.
Textile and leather TEXTILES [ISIC Divisions 13 to 15]
Non-specified
(industry)
INONSPEC [ISIC Divisions 22, 31 and 32] Any manufacturing industry not
included above. Note: Most countries have difficulties supplying
an industrial breakdown for all fuels. In these cases, the non-
specified industry row has been used. Regional aggregates of in-
dustrial consumption should therefore be used with caution.
Transport TOTTRANS Consumption in the transport sector covers all transport activity
(in mobile engines) regardless of the economic sector to which it
is contributing [ISIC Divisions 49 to 51], and is specified as fol-
lows:
Domestic aviation DOMESAIR Includes deliveries of aviation fuels to aircraft for domestic avia-
tion - commercial, private, agricultural, etc. It includes use for
purposes other than flying, e.g. bench testing of engines, but not
airline use of fuel for road transport. The domestic/international
split is determined on the basis of departure and landing locations
and not by the nationality of the airline. Note that this may in-
clude journeys of considerable length between two airports in a
country (e.g. San Francisco to Honolulu). For many countries this
incorrectly includes fuel used by domestically owned carriers for
outbound international traffic.
Road ROAD Includes fuels used in road vehicles as well as agricultural and
industrial highway use. Excludes military consumption as well as
motor gasoline used in stationary engines and diesel oil for use in
tractors that are not for highway use.
Rail RAIL Includes quantities used in rail traffic, including industrial rail-
ways.
Pipeline transport PIPELINE Includes energy used in the support and operation of pipelines
transporting gases, liquids, slurries and other commodities, in-
cluding the energy used for pump stations and maintenance of the
pipeline. Energy for the pipeline distribution of natural or manu-
factured gas, hot water or steam (ISIC Division 35) from the dis-
tributor to final users is excluded and is reported in the energy
sector, while the energy used for the final distribution of water
(ISIC Division 36) to household, industrial, commercial and other
users is included in commercial/public services. Losses occurring
during the transport between distributor and final users are report-
ed as losses.
RENEWABLES INFORMATION: DATABASE DOCUMENTATION (2020 Edition) - 15
INTERNATIONAL ENERGY AGENCY
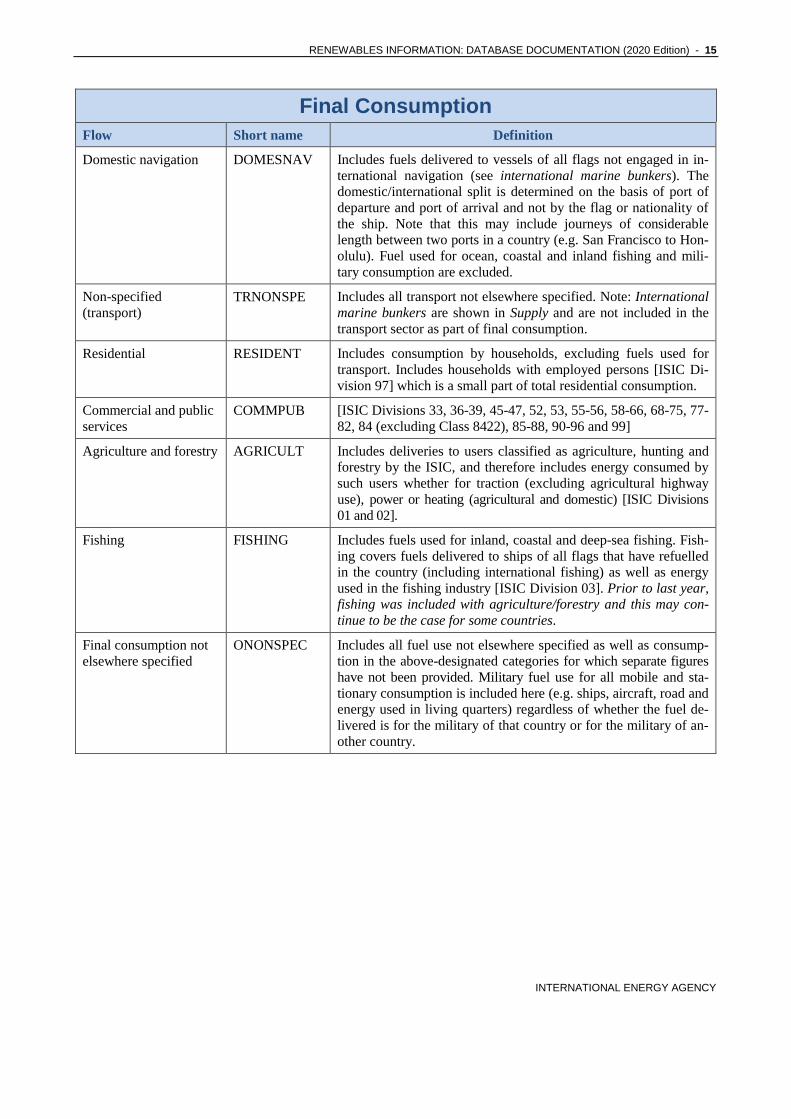
Final Consumption
Flow Short name Definition
Domestic navigation DOMESNAV Includes fuels delivered to vessels of all flags not engaged in in-
ternational navigation (see international marine bunkers). The
domestic/international split is determined on the basis of port of
departure and port of arrival and not by the flag or nationality of
the ship. Note that this may include journeys of considerable
length between two ports in a country (e.g. San Francisco to Hon-
olulu). Fuel used for ocean, coastal and inland fishing and mili-
tary consumption are excluded.
Non-specified
(transport)
TRNONSPE Includes all transport not elsewhere specified. Note: International
marine bunkers are shown in Supply and are not included in the
transport sector as part of final consumption.
Residential RESIDENT Includes consumption by households, excluding fuels used for
transport. Includes households with employed persons [ISIC Di-
vision 97] which is a small part of total residential consumption.
Commercial and public
services
COMMPUB [ISIC Divisions 33, 36-39, 45-47, 52, 53, 55-56, 58-66, 68-75, 77-
82, 84 (excluding Class 8422), 85-88, 90-96 and 99]
Agriculture and forestry AGRICULT Includes deliveries to users classified as agriculture, hunting and
forestry by the ISIC, and therefore includes energy consumed by
such users whether for traction (excluding agricultural highway
use), power or heating (agricultural and domestic) [ISIC Divisions
01 and 02].
Fishing FISHING Includes fuels used for inland, coastal and deep-sea fishing. Fish-
ing covers fuels delivered to ships of all flags that have refuelled
in the country (including international fishing) as well as energy
used in the fishing industry [ISIC Division 03]. Prior to last year, fishing was included with agriculture/forestry and this may con-
tinue to be the case for some countries.
Final consumption not
elsewhere specified
ONONSPEC Includes all fuel use not elsewhere specified as well as consump-
tion in the above-designated categories for which separate figures
have not been provided. Military fuel use for all mobile and sta-
tionary consumption is included here (e.g. ships, aircraft, road and
energy used in living quarters) regardless of whether the fuel de-
livered is for the military of that country or for the military of an-
other country.

16 - RENEWABLES INFORMATION: DATABASE DOCUMENTATION (2020 Edition)
INTERNATIONAL ENERGY AGENCY
Electricity output (GWh)
Flow Short name Definition
Electricity output in
GWh
ELOUTPUT Shows the total number of GWh generated by power plants separated
into electricity plants and CHP plants. Contrary to the Basic Energy Statistics, electricity production for hydro pumped storage is
excluded.
Electricity output-
main activity
producer electricity
plants
ELMAINE Shows the total number of GWh generated by main activity producer
electricity plants.
Electricity output-
autoproducer
electricity plants
ELAUTOE Shows the total number of GWh generated by autoproducer electrici-
ty plants.
Electricity output-
main activity
producer CHP
plants
ELMAINC Shows the total number of GWh generated by main activity producer
CHP plants.
Electricity output-
autoproducer CHP
plants
ELAUTOC Shows the total number of GWh generated by autoproducer CHP
plants.
Heat output (TJ)
Flow Short name Definition
Heat output in TJ HEATOUT Shows the total number of TJ generated by power plants separated
into CHP plants and heat plants.
Heat output-main
activity producer
CHP plants
HEMAINC Shows the total number of TJ generated by main activity producer
CHP plants.
Heat output-
autoproducer CHP
plants
HEAUTOC Shows the total number of TJ generated by autoproducer CHP plants.
Heat output-main
activity producer
heat plant
HEMAINH Shows the total number of TJ generated by activity producer heat
plant.
Heat output-
autoproducer heat
plants
HEAUTOH Shows the total number of TJ generated by autoproducer heat plants.
RENEWABLES INFORMATION: DATABASE DOCUMENTATION (2020 Edition) - 17
INTERNATIONAL ENERGY AGENCY
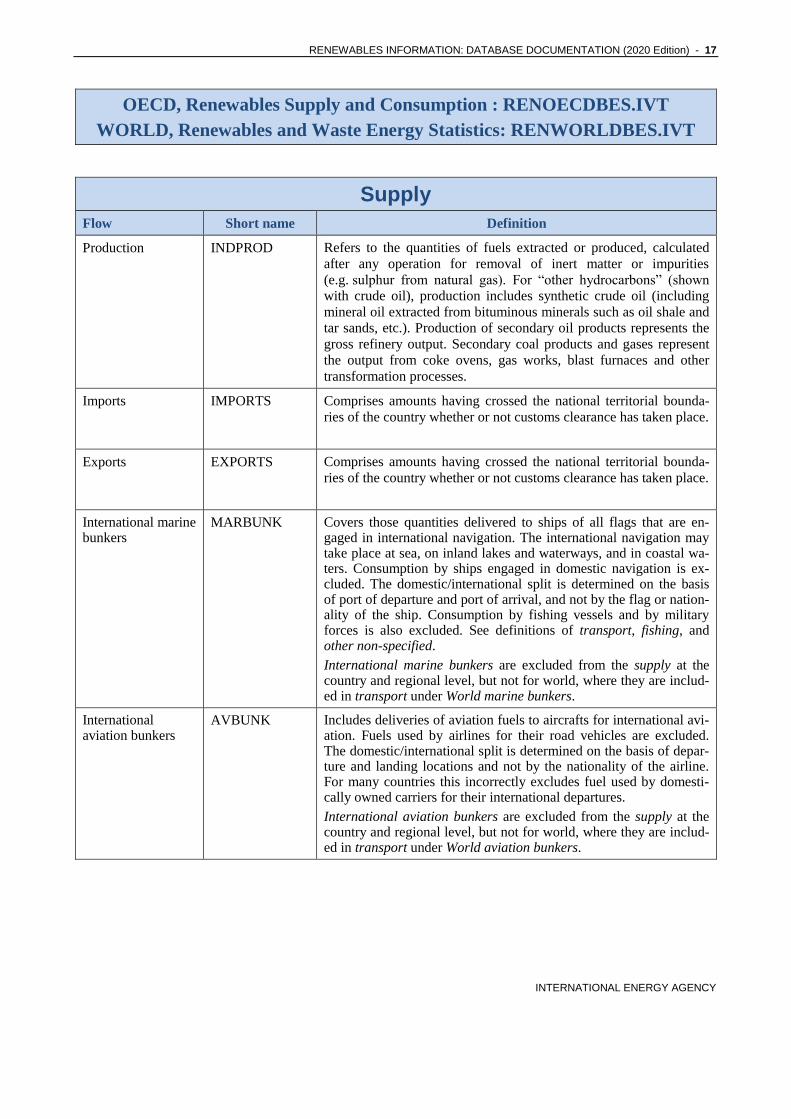
OECD, Renewables Supply and Consumption : RENOECDBES.IVT
WORLD, Renewables and Waste Energy Statistics: RENWORLDBES.IVT
Supply
Flow Short name Definition
Production INDPROD Refers to the quantities of fuels extracted or produced, calculated
after any operation for removal of inert matter or impurities
(e.g. sulphur from natural gas). For “other hydrocarbons” (shown
with crude oil), production includes synthetic crude oil (including
mineral oil extracted from bituminous minerals such as oil shale and
tar sands, etc.). Production of secondary oil products represents the
gross refinery output. Secondary coal products and gases represent
the output from coke ovens, gas works, blast furnaces and other
transformation processes.
Imports IMPORTS Comprises amounts having crossed the national territorial bounda-
ries of the country whether or not customs clearance has taken place.
Exports EXPORTS Comprises amounts having crossed the national territorial bounda-
ries of the country whether or not customs clearance has taken place.
International marine bunkers
MARBUNK Covers those quantities delivered to ships of all flags that are en-gaged in international navigation. The international navigation may take place at sea, on inland lakes and waterways, and in coastal wa-ters. Consumption by ships engaged in domestic navigation is ex-cluded. The domestic/international split is determined on the basis of port of departure and port of arrival, and not by the flag or nation-ality of the ship. Consumption by fishing vessels and by military forces is also excluded. See definitions of transport, fishing, and other non-specified.
International marine bunkers are excluded from the supply at the country and regional level, but not for world, where they are includ-ed in transport under World marine bunkers.
International aviation bunkers
AVBUNK Includes deliveries of aviation fuels to aircrafts for international avi-ation. Fuels used by airlines for their road vehicles are excluded. The domestic/international split is determined on the basis of depar-ture and landing locations and not by the nationality of the airline. For many countries this incorrectly excludes fuel used by domesti-cally owned carriers for their international departures.
International aviation bunkers are excluded from the supply at the country and regional level, but not for world, where they are includ-ed in transport under World aviation bunkers.
18 - RENEWABLES INFORMATION: DATABASE DOCUMENTATION (2020 Edition)
INTERNATIONAL ENERGY AGENCY
Supply
Flow Short name Definition
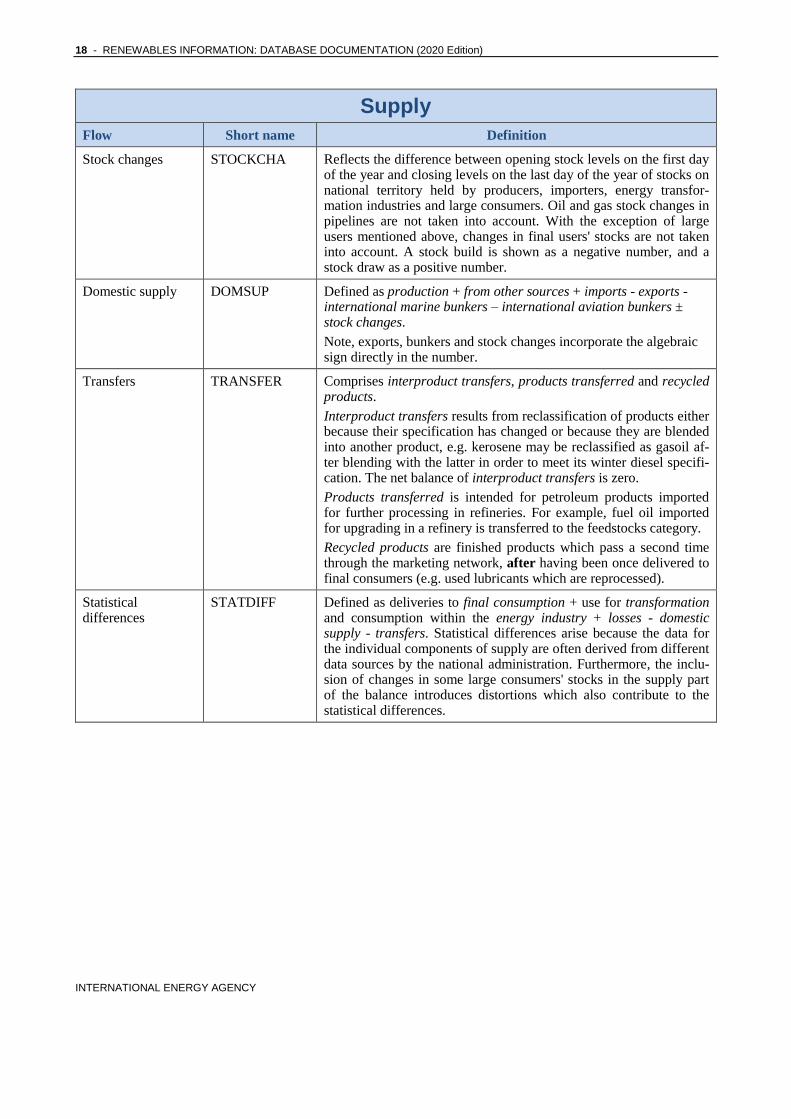
Stock changes STOCKCHA Reflects the difference between opening stock levels on the first day of the year and closing levels on the last day of the year of stocks on national territory held by producers, importers, energy transfor-mation industries and large consumers. Oil and gas stock changes in pipelines are not taken into account. With the exception of large users mentioned above, changes in final users' stocks are not taken into account. A stock build is shown as a negative number, and a stock draw as a positive number.
Domestic supply DOMSUP Defined as production + from other sources + imports - exports -international marine bunkers – international aviation bunkers ± stock changes.
Note, exports, bunkers and stock changes incorporate the algebraic sign directly in the number.
Transfers TRANSFER Comprises interproduct transfers, products transferred and recycled products.
Interproduct transfers results from reclassification of products either because their specification has changed or because they are blended into another product, e.g. kerosene may be reclassified as gasoil af-ter blending with the latter in order to meet its winter diesel specifi-cation. The net balance of interproduct transfers is zero.
Products transferred is intended for petroleum products imported for further processing in refineries. For example, fuel oil imported for upgrading in a refinery is transferred to the feedstocks category.
Recycled products are finished products which pass a second time through the marketing network, after having been once delivered to final consumers (e.g. used lubricants which are reprocessed).
Statistical differences
STATDIFF Defined as deliveries to final consumption + use for transformation and consumption within the energy industry + losses - domestic supply - transfers. Statistical differences arise because the data for the individual components of supply are often derived from different data sources by the national administration. Furthermore, the inclu-sion of changes in some large consumers' stocks in the supply part of the balance introduces distortions which also contribute to the statistical differences.

RENEWABLES INFORMATION: DATABASE DOCUMENTATION (2020 Edition) - 19
INTERNATIONAL ENERGY AGENCY
Transformation processes
Flow Short name Definition
Transformation
processes
TOTTRANF The transformation processes comprises the conversion of primary
forms of energy to secondary and further transformation (e.g. coking
coal to coke, crude oil to petroleum products, and heavy fuel oil to
electricity).
Main activity
producer electricity
plants
MAINELEC Refers to plants which are designed to produce electricity only. If one
or more units of the plant is a CHP unit (and the inputs and outputs
cannot be distinguished on a unit basis) then the whole plant is desig-
nated as a CHP plant. Main activity producers (formerly referred to as
public supply undertakings) generate electricity for sale to third par-
ties, as their primary activity. They may be privately or publicly
owned. Note that the sale need not take place through the public grid.
Autoproducer
electricity plants
AUTOELEC Refers to plants which are designed to produce electricity only. If one
or more units of the plant is a CHP unit (and the inputs and outputs
cannot be distinguished on a unit basis) then the whole plant is desig-
nated as a CHP plant. Autoproducer undertakings generate electricity
wholly or partly for their own use as an activity which supports their
primary activity. They may be privately or publicly owned.
Main activity
producer CHP
plants
MAINCHP Refers to plants which are designed to produce both heat and electric-
ity (sometimes referred to as co-generation power stations). If possi-
ble, fuel inputs and electricity/heat outputs are on a unit basis rather
than on a plant basis. However, if data are not available on a unit ba-
sis, the convention for defining a CHP plant noted above should be
adopted. Main activity producers (formerly referred to as public sup-
ply undertakings) generate electricity and/or heat for sale to third par-
ties, as their primary activity. They may be privately or publicly
owned. Note that the sale need not take place through the public grid.
Autoproducer CHP
plants
AUTOCHP Refers to plants which are designed to produce both heat and electric-
ity (sometimes referred to as co-generation power stations). If possi-
ble, fuel inputs and electricity/heat outputs are on a unit basis rather
than on a plant basis. However, if data are not available on a unit ba-
sis, the convention for defining a CHP plant noted above should be
adopted. Note that for autoproducer CHP plants, all fuel inputs to
electricity production are taken into account, while only the part of
fuel inputs to heat sold is shown. Fuel inputs for the production of
heat consumed within the autoproducer's establishment are not in-
cluded here but are included with figures for the final consumption of
fuels in the appropriate consuming sector. Autoproducer undertakings
generate electricity and/or heat, wholly or partly for their own use as
an activity which supports their primary activity. They may be pri-
vately or publicly owned.
20 - RENEWABLES INFORMATION: DATABASE DOCUMENTATION (2020 Edition)
INTERNATIONAL ENERGY AGENCY
Transformation processes
Flow Short name Definition
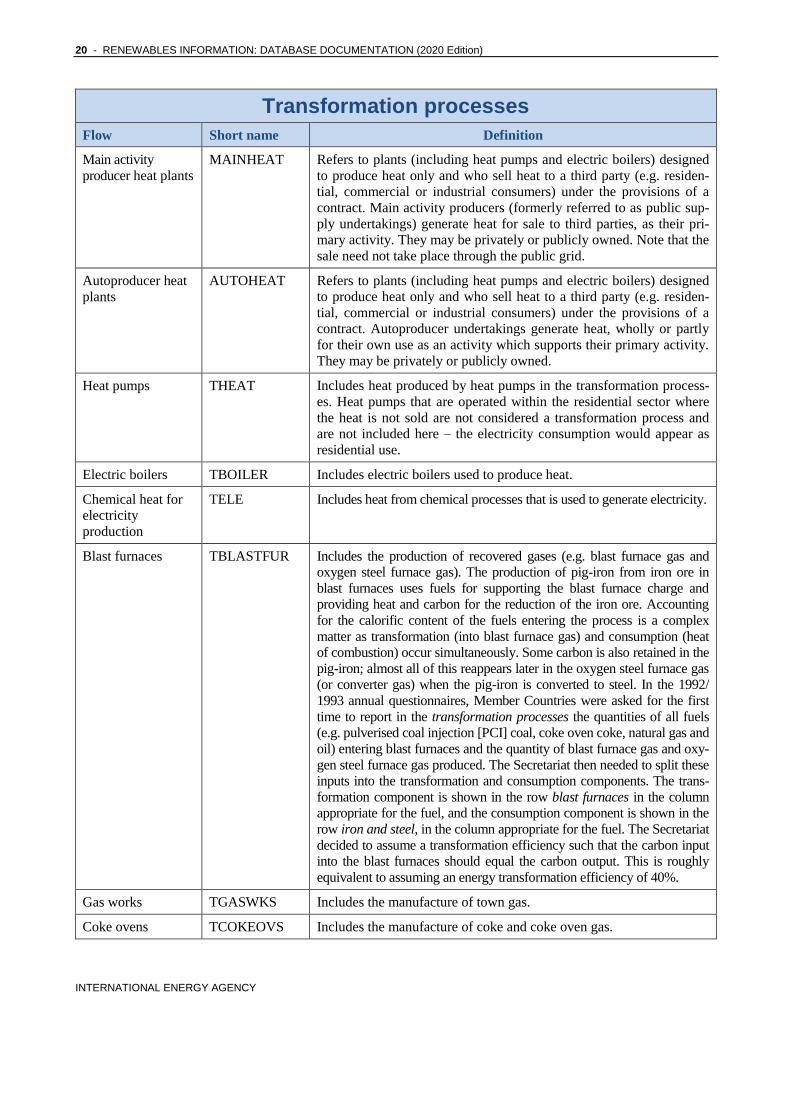
Main activity
producer heat plants
MAINHEAT Refers to plants (including heat pumps and electric boilers) designed
to produce heat only and who sell heat to a third party (e.g. residen-
tial, commercial or industrial consumers) under the provisions of a
contract. Main activity producers (formerly referred to as public sup-
ply undertakings) generate heat for sale to third parties, as their pri-
mary activity. They may be privately or publicly owned. Note that the
sale need not take place through the public grid.
Autoproducer heat
plants
AUTOHEAT Refers to plants (including heat pumps and electric boilers) designed
to produce heat only and who sell heat to a third party (e.g. residen-
tial, commercial or industrial consumers) under the provisions of a
contract. Autoproducer undertakings generate heat, wholly or partly
for their own use as an activity which supports their primary activity.
They may be privately or publicly owned.
Heat pumps THEAT Includes heat produced by heat pumps in the transformation process-
es. Heat pumps that are operated within the residential sector where
the heat is not sold are not considered a transformation process and
are not included here – the electricity consumption would appear as
residential use.
Electric boilers TBOILER Includes electric boilers used to produce heat.
Chemical heat for
electricity
production
TELE Includes heat from chemical processes that is used to generate electricity.
Blast furnaces TBLASTFUR Includes the production of recovered gases (e.g. blast furnace gas and
oxygen steel furnace gas). The production of pig-iron from iron ore in
blast furnaces uses fuels for supporting the blast furnace charge and
providing heat and carbon for the reduction of the iron ore. Accounting
for the calorific content of the fuels entering the process is a complex
matter as transformation (into blast furnace gas) and consumption (heat
of combustion) occur simultaneously. Some carbon is also retained in the
pig-iron; almost all of this reappears later in the oxygen steel furnace gas
(or converter gas) when the pig-iron is converted to steel. In the 1992/
1993 annual questionnaires, Member Countries were asked for the first
time to report in the transformation processes the quantities of all fuels
(e.g. pulverised coal injection [PCI] coal, coke oven coke, natural gas and
oil) entering blast furnaces and the quantity of blast furnace gas and oxy-
gen steel furnace gas produced. The Secretariat then needed to split these
inputs into the transformation and consumption components. The trans-
formation component is shown in the row blast furnaces in the column
appropriate for the fuel, and the consumption component is shown in the
row iron and steel, in the column appropriate for the fuel. The Secretariat
decided to assume a transformation efficiency such that the carbon input
into the blast furnaces should equal the carbon output. This is roughly
equivalent to assuming an energy transformation efficiency of 40%.
Gas works TGASWKS Includes the manufacture of town gas.
Coke ovens TCOKEOVS Includes the manufacture of coke and coke oven gas.
RENEWABLES INFORMATION: DATABASE DOCUMENTATION (2020 Edition) - 21
INTERNATIONAL ENERGY AGENCY
Transformation processes
Flow Short name Definition
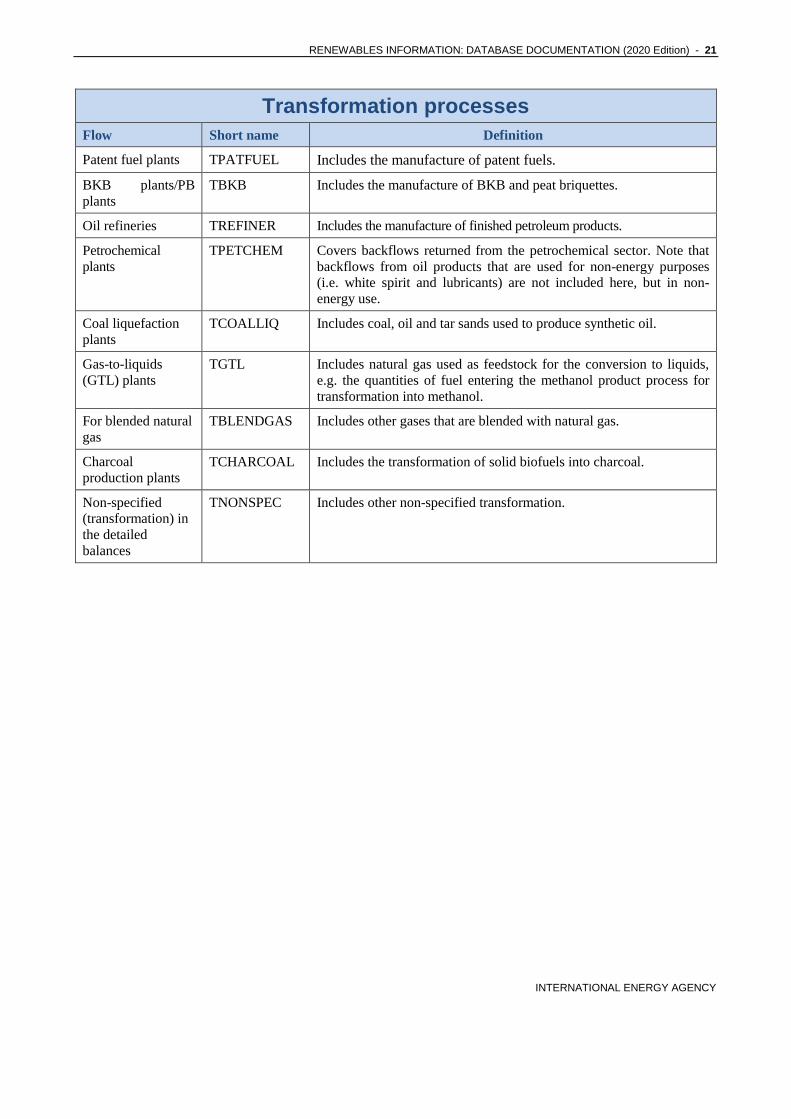
Patent fuel plants TPATFUEL Includes the manufacture of patent fuels.
BKB plants/PB
plants
TBKB Includes the manufacture of BKB and peat briquettes.
Oil refineries TREFINER Includes the manufacture of finished petroleum products.
Petrochemical
plants
TPETCHEM Covers backflows returned from the petrochemical sector. Note that
backflows from oil products that are used for non-energy purposes
(i.e. white spirit and lubricants) are not included here, but in non-
energy use.
Coal liquefaction
plants
TCOALLIQ Includes coal, oil and tar sands used to produce synthetic oil.
Gas-to-liquids
(GTL) plants
TGTL Includes natural gas used as feedstock for the conversion to liquids,
e.g. the quantities of fuel entering the methanol product process for
transformation into methanol.
For blended natural
gas
TBLENDGAS Includes other gases that are blended with natural gas.
Charcoal
production plants
TCHARCOAL Includes the transformation of solid biofuels into charcoal.
Non-specified
(transformation) in
the detailed
balances
TNONSPEC Includes other non-specified transformation.
22 - RENEWABLES INFORMATION: DATABASE DOCUMENTATION (2020 Edition)
INTERNATIONAL ENERGY AGENCY
Energy industry and losses
Flow Short name Definition
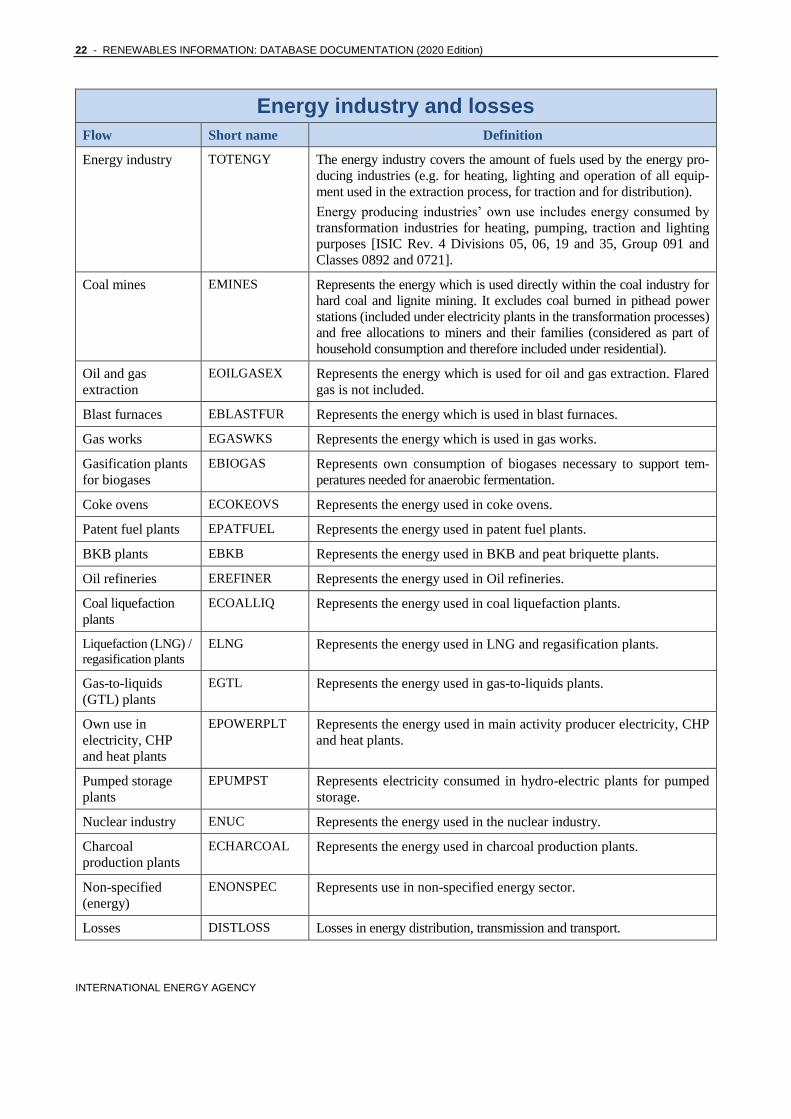
Energy industry TOTENGY The energy industry covers the amount of fuels used by the energy pro-
ducing industries (e.g. for heating, lighting and operation of all equip-
ment used in the extraction process, for traction and for distribution).
Energy producing industries’ own use includes energy consumed by
transformation industries for heating, pumping, traction and lighting
purposes [ISIC Rev. 4 Divisions 05, 06, 19 and 35, Group 091 and
Classes 0892 and 0721].
Coal mines EMINES Represents the energy which is used directly within the coal industry for
hard coal and lignite mining. It excludes coal burned in pithead power
stations (included under electricity plants in the transformation processes)
and free allocations to miners and their families (considered as part of
household consumption and therefore included under residential).
Oil and gas
extraction
EOILGASEX Represents the energy which is used for oil and gas extraction. Flared
gas is not included.
Blast furnaces EBLASTFUR Represents the energy which is used in blast furnaces.
Gas works EGASWKS Represents the energy which is used in gas works.
Gasification plants
for biogases
EBIOGAS Represents own consumption of biogases necessary to support tem-
peratures needed for anaerobic fermentation.
Coke ovens ECOKEOVS Represents the energy used in coke ovens.
Patent fuel plants EPATFUEL Represents the energy used in patent fuel plants.
BKB plants EBKB Represents the energy used in BKB and peat briquette plants.
Oil refineries EREFINER Represents the energy used in Oil refineries.
Coal liquefaction
plants
ECOALLIQ Represents the energy used in coal liquefaction plants.
Liquefaction (LNG) /
regasification plants
ELNG Represents the energy used in LNG and regasification plants.
Gas-to-liquids
(GTL) plants
EGTL Represents the energy used in gas-to-liquids plants.
Own use in
electricity, CHP
and heat plants
EPOWERPLT Represents the energy used in main activity producer electricity, CHP
and heat plants.
Pumped storage
plants
EPUMPST Represents electricity consumed in hydro-electric plants for pumped
storage.
Nuclear industry ENUC Represents the energy used in the nuclear industry.
Charcoal
production plants
ECHARCOAL Represents the energy used in charcoal production plants.
Non-specified
(energy)
ENONSPEC Represents use in non-specified energy sector.
Losses DISTLOSS Losses in energy distribution, transmission and transport.
RENEWABLES INFORMATION: DATABASE DOCUMENTATION (2020 Edition) - 23
INTERNATIONAL ENERGY AGENCY
Final consumption
Flow Short name Definition
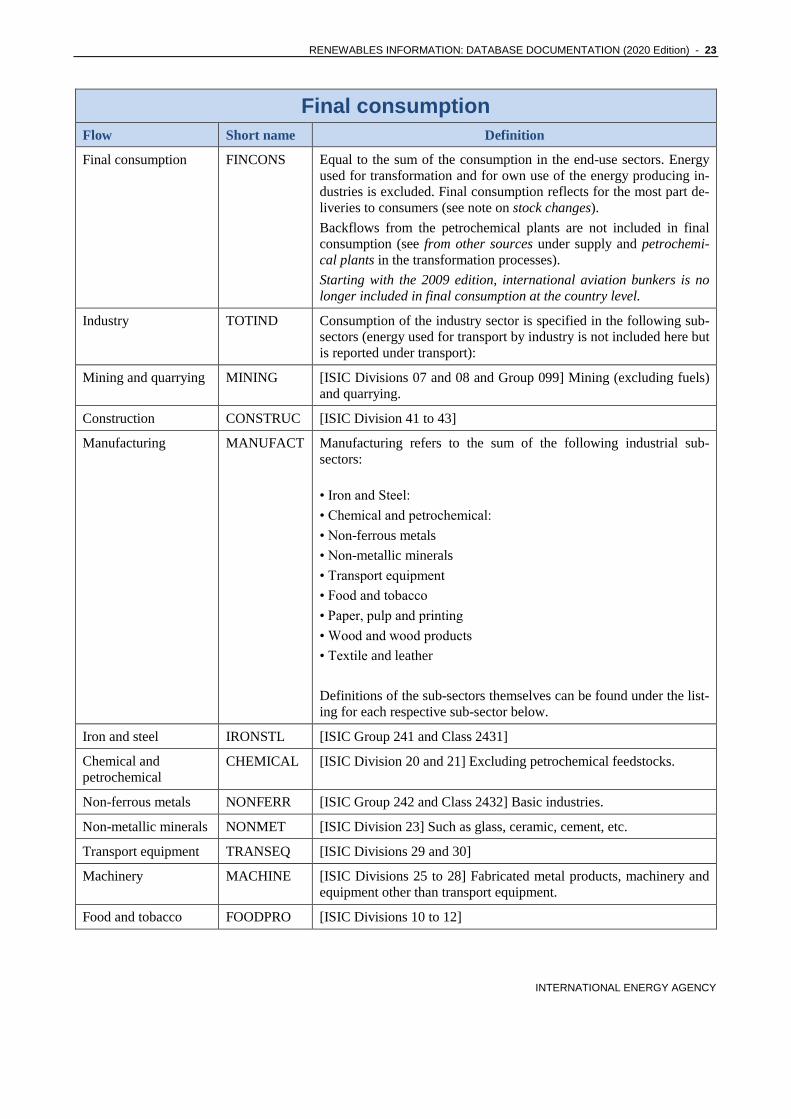
Final consumption FINCONS Equal to the sum of the consumption in the end-use sectors. Energy
used for transformation and for own use of the energy producing in-
dustries is excluded. Final consumption reflects for the most part de-
liveries to consumers (see note on stock changes).
Backflows from the petrochemical plants are not included in final
consumption (see from other sources under supply and petrochemi-
cal plants in the transformation processes).
Starting with the 2009 edition, international aviation bunkers is no
longer included in final consumption at the country level.
Industry TOTIND Consumption of the industry sector is specified in the following sub-
sectors (energy used for transport by industry is not included here but
is reported under transport):
Mining and quarrying MINING [ISIC Divisions 07 and 08 and Group 099] Mining (excluding fuels)
and quarrying.
Construction CONSTRUC [ISIC Division 41 to 43]
Manufacturing MANUFACT Manufacturing refers to the sum of the following industrial sub-
sectors:
• Iron and Steel:
• Chemical and petrochemical:
• Non-ferrous metals
• Non-metallic minerals
• Transport equipment
• Food and tobacco
• Paper, pulp and printing
• Wood and wood products
• Textile and leather
Definitions of the sub-sectors themselves can be found under the list-
ing for each respective sub-sector below.
Iron and steel IRONSTL [ISIC Group 241 and Class 2431]
Chemical and
petrochemical
CHEMICAL [ISIC Division 20 and 21] Excluding petrochemical feedstocks.
Non-ferrous metals NONFERR [ISIC Group 242 and Class 2432] Basic industries.
Non-metallic minerals NONMET [ISIC Division 23] Such as glass, ceramic, cement, etc.
Transport equipment TRANSEQ [ISIC Divisions 29 and 30]
Machinery MACHINE [ISIC Divisions 25 to 28] Fabricated metal products, machinery and
equipment other than transport equipment.
Food and tobacco FOODPRO [ISIC Divisions 10 to 12]
24 - RENEWABLES INFORMATION: DATABASE DOCUMENTATION (2020 Edition)
INTERNATIONAL ENERGY AGENCY
Final consumption
Flow Short name Definition
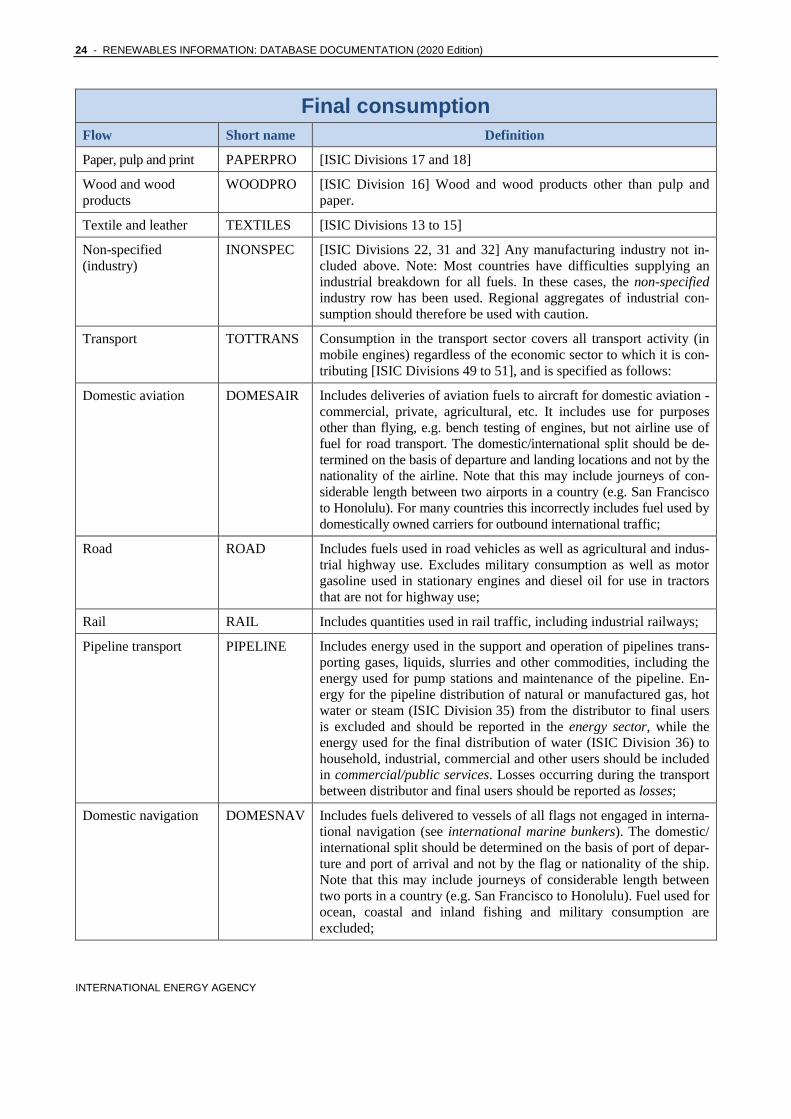
Paper, pulp and print PAPERPRO [ISIC Divisions 17 and 18]
Wood and wood
products
WOODPRO [ISIC Division 16] Wood and wood products other than pulp and
paper.
Textile and leather TEXTILES [ISIC Divisions 13 to 15]
Non-specified
(industry)
INONSPEC [ISIC Divisions 22, 31 and 32] Any manufacturing industry not in-
cluded above. Note: Most countries have difficulties supplying an
industrial breakdown for all fuels. In these cases, the non-specified
industry row has been used. Regional aggregates of industrial con-
sumption should therefore be used with caution.
Transport TOTTRANS Consumption in the transport sector covers all transport activity (in
mobile engines) regardless of the economic sector to which it is con-
tributing [ISIC Divisions 49 to 51], and is specified as follows:
Domestic aviation DOMESAIR Includes deliveries of aviation fuels to aircraft for domestic aviation -
commercial, private, agricultural, etc. It includes use for purposes
other than flying, e.g. bench testing of engines, but not airline use of
fuel for road transport. The domestic/international split should be de-
termined on the basis of departure and landing locations and not by the
nationality of the airline. Note that this may include journeys of con-
siderable length between two airports in a country (e.g. San Francisco
to Honolulu). For many countries this incorrectly includes fuel used by
domestically owned carriers for outbound international traffic;
Road ROAD Includes fuels used in road vehicles as well as agricultural and indus-
trial highway use. Excludes military consumption as well as motor
gasoline used in stationary engines and diesel oil for use in tractors
that are not for highway use;
Rail RAIL Includes quantities used in rail traffic, including industrial railways;
Pipeline transport PIPELINE Includes energy used in the support and operation of pipelines trans-
porting gases, liquids, slurries and other commodities, including the
energy used for pump stations and maintenance of the pipeline. En-
ergy for the pipeline distribution of natural or manufactured gas, hot
water or steam (ISIC Division 35) from the distributor to final users
is excluded and should be reported in the energy sector, while the
energy used for the final distribution of water (ISIC Division 36) to
household, industrial, commercial and other users should be included
in commercial/public services. Losses occurring during the transport
between distributor and final users should be reported as losses;
Domestic navigation DOMESNAV Includes fuels delivered to vessels of all flags not engaged in interna-
tional navigation (see international marine bunkers). The domestic/
international split should be determined on the basis of port of depar-
ture and port of arrival and not by the flag or nationality of the ship.
Note that this may include journeys of considerable length between
two ports in a country (e.g. San Francisco to Honolulu). Fuel used for
ocean, coastal and inland fishing and military consumption are
excluded;

RENEWABLES INFORMATION: DATABASE DOCUMENTATION (2020 Edition) - 25
INTERNATIONAL ENERGY AGENCY
Final consumption
Flow Short name Definition
Non-specified
(transport)
TRNONSPE Includes all transport not elsewhere specified. Note: International
marine bunkers are shown in Supply and are not included in the
transport sector as part of final consumption.
Residential RESIDENT Includes consumption by households, excluding fuels used for
transport. Includes households with employed persons [ISIC
Division 97 and 98], which is a small part of total residential
consumption.
Commercial and
public services
COMMPUB [ISIC Divisions 33, 36-39, 45-47, 52, 53, 55-56, 58-66, 68-75, 77-82,
84 (excluding Class 8422), 85-88, 90-96 and 99]
Agriculture/forestry AGRICULT Includes deliveries to users classified as agriculture, hunting and for-
estry by the ISIC, and therefore includes energy consumed by such
users whether for traction (excluding agricultural highway use), pow-
er or heating (agricultural and domestic) [ISIC Divisions 01 and 02].
Fishing FISHING Includes fuels used for inland, coastal and deep-sea fishing. Fishing
covers fuels delivered to ships of all flags that have refuelled in the
country (including international fishing) as well as energy used in the
fishing industry [ISIC Division 03].
Final consumption not
elsewhere specified
ONONSPEC Includes all fuel use not elsewhere specified as well as consumption
in the above-designated categories for which separate figures have not
been provided. Military fuel use for all mobile and stationary con-
sumption is included here (e.g. ships, aircraft, road and energy used
in living quarters) regardless of whether the fuel delivered is for the
military of that country or for the military of another country.

26 - RENEWABLES INFORMATION: DATABASE DOCUMENTATION (2020 Edition)
INTERNATIONAL ENERGY AGENCY
Electricity output (GWh)
Flow Short name Definition
Electricity output (GWh) ELOUTPUT Shows the total number of GWh generated by power
plants separated into electricity plants and CHP plants.
Electricity output-main activity
producer electricity plants
ELMAINE Shows the total number of GWh generated by main
activity producer electricity plants.
Electricity output-autoproducer
electricity plants
ELAUTOE Shows the total number of GWh generated by auto-
producer electricity plants.
Electricity output-main activity
producer CHP plants
ELMAINC Shows the total number of GWh generated by main
activity producer CHP plants.
Electricity output-autoproducer
CHP plants
ELAUTOC Shows the total number of GWh generated by auto-
producer CHP plants.
Heat output (TJ)
Flow Short name Definition
Heat output (TJ) HEATOUT Shows the total amount of TJ generated by power
plants separated into CHP plants and heat plants.
Heat output-main activity
producer CHP plants
HEMAINC Shows the total amount of TJ generated by main activ-
ity producer CHP plants.
Heat output-autoproducer CHP
plants
HEAUTOC Shows the total amount of TJ generated by auto-
producer CHP plants.
Heat output-main activity
producer heat plants
HEMAINH Shows the total amount of TJ generated by main activ-
ity producer heat plants.
Heat output-autoproducer heat
plants
HEAUTOH Shows the total amount of TJ generated by autopro-
ducer heat plants.
RENEWABLES INFORMATION: DATABASE DOCUMENTATION (2020 Edition) - 27
INTERNATIONAL ENERGY AGENCY
4. PRODUCT DEFINITIONS
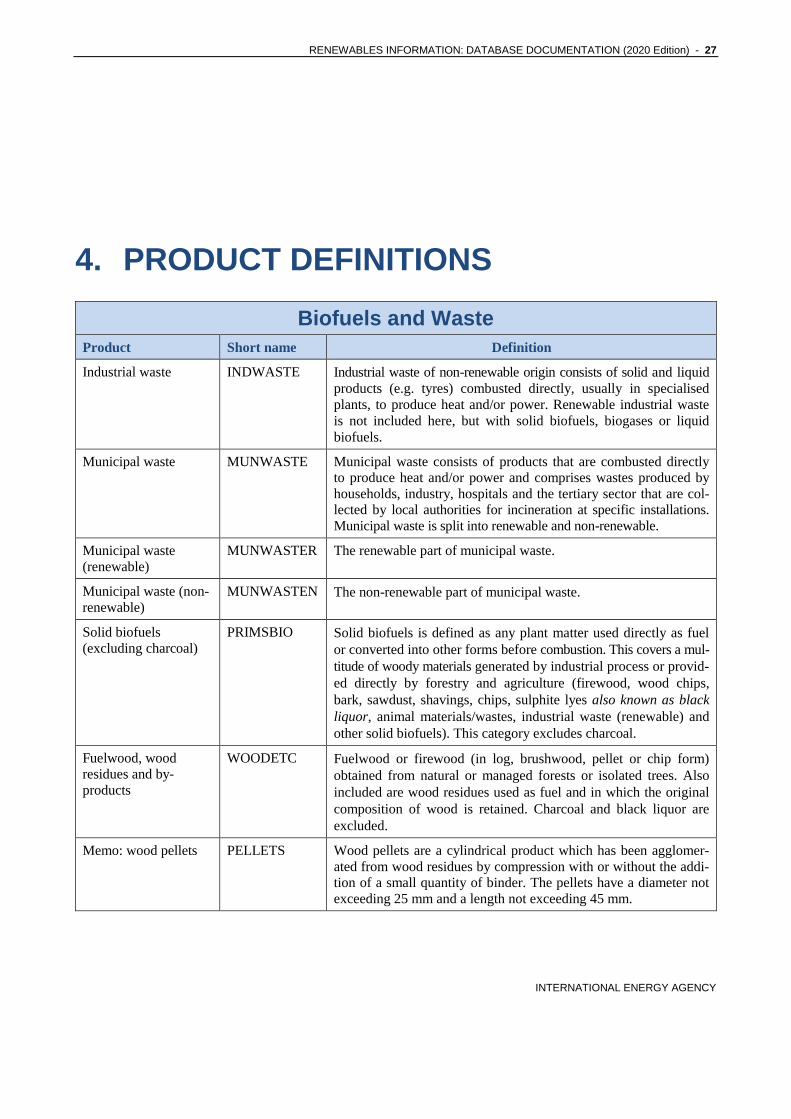
Biofuels and Waste
Product Short name Definition
Industrial waste INDWASTE Industrial waste of non-renewable origin consists of solid and liquid
products (e.g. tyres) combusted directly, usually in specialised
plants, to produce heat and/or power. Renewable industrial waste
is not included here, but with solid biofuels, biogases or liquid
biofuels.
Municipal waste MUNWASTE Municipal waste consists of products that are combusted directly
to produce heat and/or power and comprises wastes produced by
households, industry, hospitals and the tertiary sector that are col-
lected by local authorities for incineration at specific installations.
Municipal waste is split into renewable and non-renewable.
Municipal waste
(renewable)
MUNWASTER The renewable part of municipal waste.
Municipal waste (non-
renewable)
MUNWASTEN The non-renewable part of municipal waste.
Solid biofuels
(excluding charcoal)
PRIMSBIO Solid biofuels is defined as any plant matter used directly as fuel
or converted into other forms before combustion. This covers a mul-
titude of woody materials generated by industrial process or provid-
ed directly by forestry and agriculture (firewood, wood chips,
bark, sawdust, shavings, chips, sulphite lyes also known as black
liquor, animal materials/wastes, industrial waste (renewable) and
other solid biofuels). This category excludes charcoal.
Fuelwood, wood
residues and by-
products
WOODETC Fuelwood or firewood (in log, brushwood, pellet or chip form)
obtained from natural or managed forests or isolated trees. Also
included are wood residues used as fuel and in which the original
composition of wood is retained. Charcoal and black liquor are
excluded.
Memo: wood pellets PELLETS Wood pellets are a cylindrical product which has been agglomer-
ated from wood residues by compression with or without the addi-
tion of a small quantity of binder. The pellets have a diameter not
exceeding 25 mm and a length not exceeding 45 mm.

28 - RENEWABLES INFORMATION: DATABASE DOCUMENTATION (2020 Edition)
INTERNATIONAL ENERGY AGENCY
Biofuels and Waste
Product Short name Definition
Black liquor BLACKLIQ Energy from the alkaline-spent liquor obtained from the digesters
during the production of sulphate or soda pulp required for paper
manufacture.
Bagasse BAGASSE Fuel obtained from the fibre which remains after juice extraction
in sugar cane processing.
Animal waste ANIMALW Energy from excreta of animals, meat and fish residues which,
when dry, are used directly as a fuel. This excludes waste used in
anaerobic fermentation plants. Fuel gases from these plants are
included under biogases.
Industrial waste
(renewable)
INDWASTER Solid renewable portion of industrial waste combusted directly at
specific installations for meaningful energy purposes (for example
natural rubber in waste rubber tires or natural fibres in textile
wastes). The quantity of fuel used is reported on a net calorific
value basis. Note that the liquid or gaseous portions of industrial
wastes (renewable) are included under liquid biofuels or biogases,
respectively.
Other vegetal
materials and residuals
OBIOSOL Biofuels not specified elsewhere and including straw, vegetable
husks, ground nut shells, pruning brushwood, olive pomace and
other wastes arising from the maintenance, cropping and pro-
cessing of plants.
Charcoal CHARCOAL Covers the solid residue of the destructive distillation and pyrol-
ysis of wood and other vegetal material. Since charcoal is a sec-
ondary product, its treatment is slightly different than that of the
other primary biofuels. Production of charcoal (an output in the
transformation process) is offset by the inputs of primary biofu-
els into the charcoal production process. The losses from this
process are included in the transformation processes. Other sup-
ply (e.g. trade and stock changes) as well as consumption are
aggregated directly with the primary biofuels. In some countries,
only primary biofuels are reported.
Biogases BIOGASES Gases composed principally of methane and carbon dioxide
produced by anaerobic fermentation of biomass, or by thermal
processes.
Landfill gas LANDFILL Covers gas formed by digestion of landfilled waste.
Sludge gas SLUDGEGS Covers gas produced from the anaerobic fermentation of sewage
sludge.
Other biogases from
anaerobic processes
OBIOGAS Covers gases such as biogases produced from the anaerobic fer-
mentation of animal slurries and of waste abattoirs, breweries
and other agro-food industries.
Biogases from thermal
processes
BGTHERM Biogases produced from thermal processes (by gasification or
pyrolysis) of biomass.
Biogasoline BIOGASOL Liquid biofuels suitable to be blended with or replace motor gaso-
line from fossil origin.
RENEWABLES INFORMATION: DATABASE DOCUMENTATION (2020 Edition) - 29
INTERNATIONAL ENERGY AGENCY
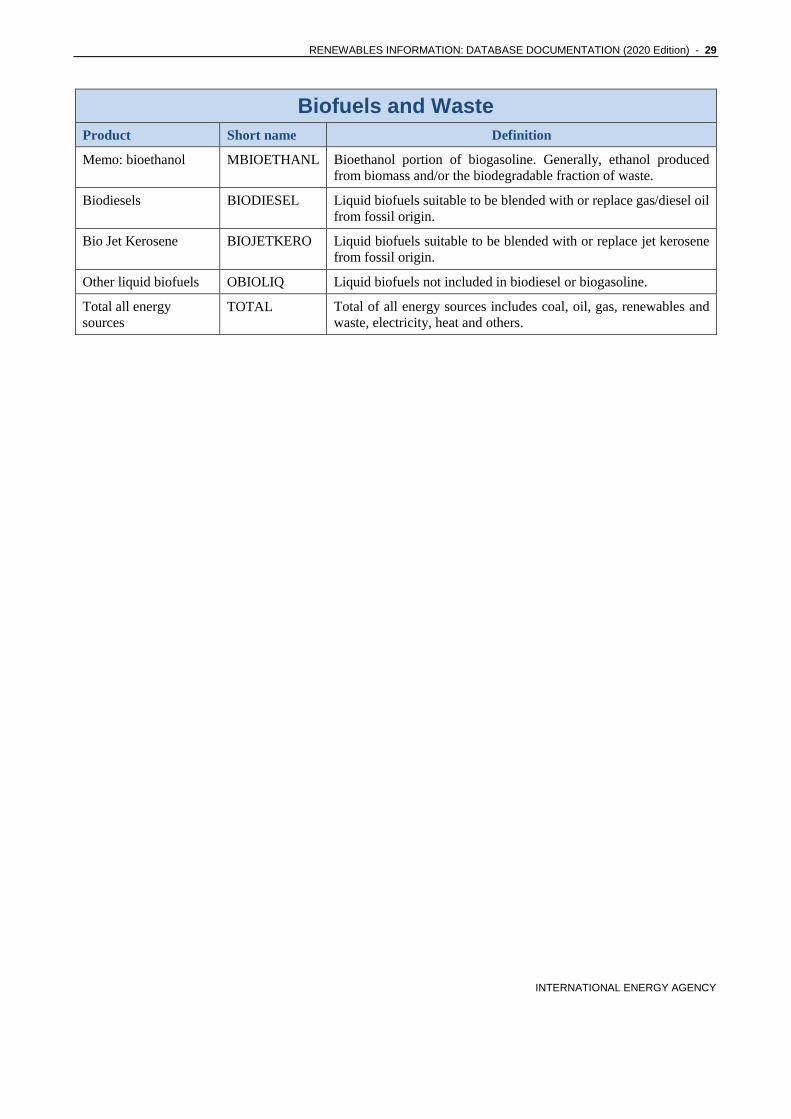
Biofuels and Waste
Product Short name Definition
Memo: bioethanol MBIOETHANL Bioethanol portion of biogasoline. Generally, ethanol produced
from biomass and/or the biodegradable fraction of waste.
Biodiesels BIODIESEL Liquid biofuels suitable to be blended with or replace gas/diesel oil
from fossil origin.
Bio Jet Kerosene BIOJETKERO Liquid biofuels suitable to be blended with or replace jet kerosene
from fossil origin.
Other liquid biofuels OBIOLIQ Liquid biofuels not included in biodiesel or biogasoline.
Total all energy
sources
TOTAL Total of all energy sources includes coal, oil, gas, renewables and
waste, electricity, heat and others.
30 - RENEWABLES INFORMATION: DATABASE DOCUMENTATION (2020 Edition)
INTERNATIONAL ENERGY AGENCY
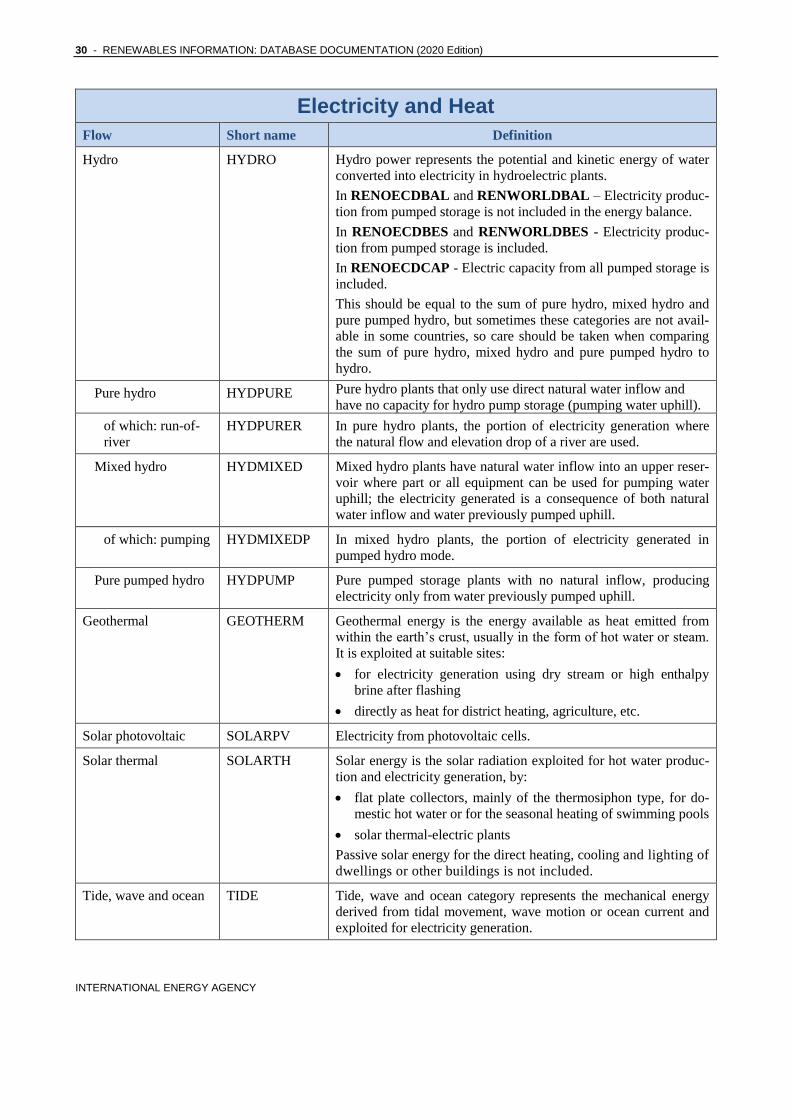
Electricity and Heat
Flow Short name Definition
Hydro HYDRO Hydro power represents the potential and kinetic energy of water
converted into electricity in hydroelectric plants.
In RENOECDBAL and RENWORLDBAL – Electricity produc-
tion from pumped storage is not included in the energy balance.
In RENOECDBES and RENWORLDBES - Electricity produc-
tion from pumped storage is included.
In RENOECDCAP - Electric capacity from all pumped storage is
included.
This should be equal to the sum of pure hydro, mixed hydro and
pure pumped hydro, but sometimes these categories are not avail-
able in some countries, so care should be taken when comparing
the sum of pure hydro, mixed hydro and pure pumped hydro to
hydro.
Pure hydro HYDPURE Pure hydro plants that only use direct natural water inflow and
have no capacity for hydro pump storage (pumping water uphill).
of which: run-of-
river
HYDPURER In pure hydro plants, the portion of electricity generation where
the natural flow and elevation drop of a river are used.
Mixed hydro HYDMIXED Mixed hydro plants have natural water inflow into an upper reser-
voir where part or all equipment can be used for pumping water
uphill; the electricity generated is a consequence of both natural
water inflow and water previously pumped uphill.
of which: pumping HYDMIXEDP In mixed hydro plants, the portion of electricity generated in
pumped hydro mode.
Pure pumped hydro HYDPUMP Pure pumped storage plants with no natural inflow, producing
electricity only from water previously pumped uphill.
Geothermal GEOTHERM Geothermal energy is the energy available as heat emitted from
within the earth’s crust, usually in the form of hot water or steam.
It is exploited at suitable sites:
for electricity generation using dry stream or high enthalpy
brine after flashing
directly as heat for district heating, agriculture, etc.
Solar photovoltaic SOLARPV Electricity from photovoltaic cells.
Solar thermal SOLARTH Solar energy is the solar radiation exploited for hot water produc-
tion and electricity generation, by:
flat plate collectors, mainly of the thermosiphon type, for do-
mestic hot water or for the seasonal heating of swimming pools
solar thermal-electric plants
Passive solar energy for the direct heating, cooling and lighting of
dwellings or other buildings is not included.
Tide, wave and ocean TIDE Tide, wave and ocean category represents the mechanical energy
derived from tidal movement, wave motion or ocean current and
exploited for electricity generation.

RENEWABLES INFORMATION: DATABASE DOCUMENTATION (2020 Edition) - 31
INTERNATIONAL ENERGY AGENCY
Electricity and Heat
Flow Short name Definition
Wind WIND Wind energy represents the kinetic energy of wind exploited for
electricity generation in wind turbines.
Care should be taken when comparing the sum of onshore wind
and offshore wind to wind for product, flow or country aggregates
due to the lack of data availability for both onshore and offshore
wind for all countries and flows.
Onshore wind WINDON Production of electricity by wind in locations offshore.
Care should be taken when comparing the sum of onshore wind
and offshore wind to wind for product, flow or country aggregates
due to the lack of data availability for both onshore and offshore
wind for all countries and flows.
Offshore wind WINDOFF Production of electricity by wind in locations offshore (e.g. sea,
ocean and artificial islands). In relation to offshore wind produc-
tion outside of the territorial waters of the concerned territory, all
installations located in the exclusive economic zone of a country
shall be taken into account.
Care should be taken when comparing the sum of onshore wind
and offshore wind to wind for product, flow or country aggregates
due to the lack of data availability for both onshore and offshore
wind for all countries and flows.
32 - RENEWABLES INFORMATION: DATABASE DOCUMENTATION (2020 Edition)
INTERNATIONAL ENERGY AGENCY
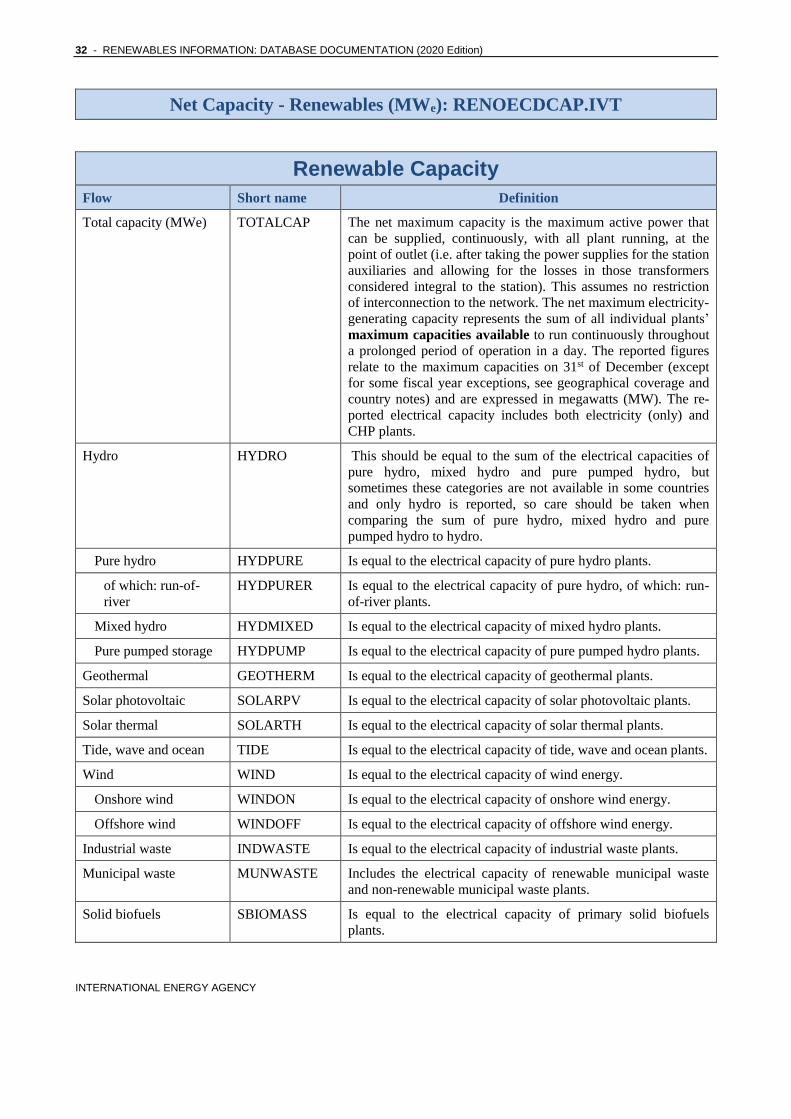
Net Capacity - Renewables (MWe): RENOECDCAP.IVT
Renewable Capacity
Flow Short name Definition
Total capacity (MWe) TOTALCAP The net maximum capacity is the maximum active power that
can be supplied, continuously, with all plant running, at the
point of outlet (i.e. after taking the power supplies for the station
auxiliaries and allowing for the losses in those transformers
considered integral to the station). This assumes no restriction
of interconnection to the network. The net maximum electricity-
generating capacity represents the sum of all individual plants’
maximum capacities available to run continuously throughout
a prolonged period of operation in a day. The reported figures
relate to the maximum capacities on 31st of December (except
for some fiscal year exceptions, see geographical coverage and
country notes) and are expressed in megawatts (MW). The re-
ported electrical capacity includes both electricity (only) and
CHP plants.
Hydro HYDRO This should be equal to the sum of the electrical capacities of
pure hydro, mixed hydro and pure pumped hydro, but
sometimes these categories are not available in some countries
and only hydro is reported, so care should be taken when
comparing the sum of pure hydro, mixed hydro and pure
pumped hydro to hydro.
Pure hydro HYDPURE Is equal to the electrical capacity of pure hydro plants.
of which: run-of-
river
HYDPURER Is equal to the electrical capacity of pure hydro, of which: run-
of-river plants.
Mixed hydro HYDMIXED Is equal to the electrical capacity of mixed hydro plants.
Pure pumped storage HYDPUMP Is equal to the electrical capacity of pure pumped hydro plants.
Geothermal GEOTHERM Is equal to the electrical capacity of geothermal plants.
Solar photovoltaic SOLARPV Is equal to the electrical capacity of solar photovoltaic plants.
Solar thermal SOLARTH Is equal to the electrical capacity of solar thermal plants.
Tide, wave and ocean TIDE Is equal to the electrical capacity of tide, wave and ocean plants.
Wind WIND Is equal to the electrical capacity of wind energy.
Onshore wind WINDON Is equal to the electrical capacity of onshore wind energy.
Offshore wind WINDOFF Is equal to the electrical capacity of offshore wind energy.
Industrial waste INDWASTE Is equal to the electrical capacity of industrial waste plants.
Municipal waste MUNWASTE Includes the electrical capacity of renewable municipal waste
and non-renewable municipal waste plants.
Solid biofuels SBIOMASS Is equal to the electrical capacity of primary solid biofuels
plants.

RENEWABLES INFORMATION: DATABASE DOCUMENTATION (2020 Edition) - 33
INTERNATIONAL ENERGY AGENCY
Renewable Capacity
Flow Short name Definition
Biogases BIOGASES Is equal to the electrical capacity of plants running on landfill
gas, sludge gas, and other biogases from anaerobic and thermal
processes.
Biodiesel BIODIESEL Is equal to the electrical capacity of biodiesel plants.
Biogasoline BIOGASOL Is equal to the electrical capacity of biogasoline plants.
Other liquid biofuels OBIOLIQ Is equal to the electrical capacity of liquid biofuels plants, not
included in biodiesels plants.
Solar collector surface
(1000 m2)
SOLARSUR Accumulated surface area of all solar collectors; glazed and
unglazed collectors, flat-plate and vacuum tube with a liquid or
air as the energy carrier, in 1000 m2.
Cap. of solar collectors
(MWth)
SOLARTHSQ Converted at 0.7 kWth/m2 of solar collector area, as estimated
by the IEA Solar Heating & Cooling Programme.

34 - RENEWABLES INFORMATION: DATABASE DOCUMENTATION (2020 Edition)
INTERNATIONAL ENERGY AGENCY
5. GEOGRAPHICAL COVERAGE
Countries and Regions This document is without prejudice to the status of or sovereignty over any territory, to the delimitation of in-
ternational frontiers and boundaries and to the name of any territory, city or area.
Country/Region Short name Definition
Australia AUSTRALI Excludes the overseas territories.
Data are reported on a fiscal year basis. By convention,
data for the fiscal year that starts on 1 July Y-1 and ends
on 30 June Y are labelled as year Y.
Austria AUSTRIA
Belgium BELGIUM
Canada CANADA
Chile CHILE
Czech Republic CZECH
Denmark DENMARK Excludes Greenland and the Faroe Islands.
Estonia ESTONIA Estonia joined the IEA in May 2014. Data are included
starting in 1990.
Finland FINLAND
France FRANCE From 2011 data onwards, France now includes Monaco,
and the following overseas departments (Guadeloupe;
French Guiana; Martinique; Mayotte; and Réunion); and
excludes the overseas collectivities (New Caledonia;
French Polynesia; Saint Barthélemy; Saint Martin; Saint
Pierre and Miquelon; and Wallis and Futuna).
Prior to 2011, France includes Monaco and excludes the
following overseas departments and territories:
Guadeloupe; French Guiana; Martinique; Mayotte and
Réunion; New Caledonia; French Polynesia; Saint
Barthélemy; Saint Martin; Saint Pierre and Miquelon;
and Wallis and Futuna.
Germany GERMANY
Greece GREECE

RENEWABLES INFORMATION: DATABASE DOCUMENTATION (2020 Edition) - 35
INTERNATIONAL ENERGY AGENCY
Countries and Regions This document is without prejudice to the status of or sovereignty over any territory, to the delimitation of in-
ternational frontiers and boundaries and to the name of any territory, city or area.
Country/Region Short name Definition
Hungary HUNGARY
Iceland ICELAND
Ireland IRELAND
Israel ISRAEL The statistical data for Israel are supplied by and under
the responsibility of the relevant Israeli authorities. The
use of such data by the OECD is without prejudice to the
status of the Golan Heights, East Jerusalem and Israeli
settlements in the West Bank under the terms of
international law.
Italy ITALY Includes San Marino and the Holy See.
Japan JAPAN Includes Okinawa.
Starting in 1990, data are reported on a fiscal year basis.
By convention, data for the fiscal year that starts on 1
April Y and ends on 31 March Y+1 are labelled as year
Y.
Korea KOREA
Latvia LATVIA Data are included starting in 1990. Prior to 1990, data
for Latvia are included in Former Soviet Union in the
publication of World Energy Statistics.
Lithuania LITHUANIA Data for Lithuania are available starting in 1990. Prior to
that, they are included in Former Soviet Union in the
publication of World Energy Statistics.
Luxembourg LUXEMBOU
Mexico MEXICO
Netherlands NETHLAND Excludes Suriname, Aruba and the other former
Netherlands Antilles (Bonaire, Curaçao, Saba, Saint
Eustatius and Sint Maarten).
New Zealand NZ
Norway NORWAY
Poland POLAND
Portugal PORTUGAL Includes the Azores and Madeira.
Slovak Republic SLOVAKIA
Slovenia SLOVENIA Data start in 1990. Prior to that, they are included within
Former Yugoslavia.
Spain SPAIN Includes the Canary Islands.
Sweden SWEDEN

36 - RENEWABLES INFORMATION: DATABASE DOCUMENTATION (2020 Edition)
INTERNATIONAL ENERGY AGENCY
Countries and Regions This document is without prejudice to the status of or sovereignty over any territory, to the delimitation of in-
ternational frontiers and boundaries and to the name of any territory, city or area.
Country/Region Short name Definition
Switzerland SWITLAND Includes Liechtenstein for oil data. Data for other fuels
do not include Liechtenstein.
Turkey TURKEY
United Kingdom UK Shipments of coal and oil to the Channel Islands and the
Isle of Man from the United Kingdom are not classed as
exports. Supplies of coal and oil to these islands are,
therefore, included as part of UK supply. Exports of natural
gas to the Isle of Man are included with the exports to
Ireland.
United States USA Includes the 50 states and the District of Columbia but
generally excludes all territories, and all trade between the
U.S. and its territories. Oil statistics include Guam, Puerto
Rico and the United States Virgin Islands; trade statistics
for coal include international trade to and from Puerto
Rico and the United States Virgin Islands.
Starting with 2017 data, electricity statistics include
Puerto Rico, for electricity production and capacity.
OECD Total OECDTOT Includes Australia, Austria, Belgium, Canada, Chile,
Czech Republic, Denmark, Estonia, Finland, France,
Germany, Greece, Hungary, Iceland, Ireland, Israel, Italy,
Japan, Korea, Latvia, Lithuania, Luxembourg, Mexico,
Netherlands, New Zealand, Norway, Poland, Portugal,
Slovak Republic, Slovenia, Spain, Sweden, Switzerland,
Turkey, United Kingdom and United States.
Colombia joined the OECD in April 2020 however, data
for Colombia are not included in the OECD aggregate
for this edition.
OECD Americas OECDAM Includes Canada, Chile, Mexico and the United States.
OECD Asia Oceania OECDAO Includes Australia, Israel, Japan, Korea and New
Zealand.
OECD Europe OECDEUR Includes Austria, Belgium, Czech Republic, Denmark,
Estonia, Finland, France, Germany, Greece, Hungary,
Iceland, Ireland, Italy, Latvia, Lithuania, Luxembourg,
Netherlands, Norway, Poland, Portugal, Slovak
Republic, Slovenia, Spain, Sweden, Switzerland, Turkey
and United Kingdom.
RENEWABLES INFORMATION: DATABASE DOCUMENTATION (2020 Edition) - 37
INTERNATIONAL ENERGY AGENCY
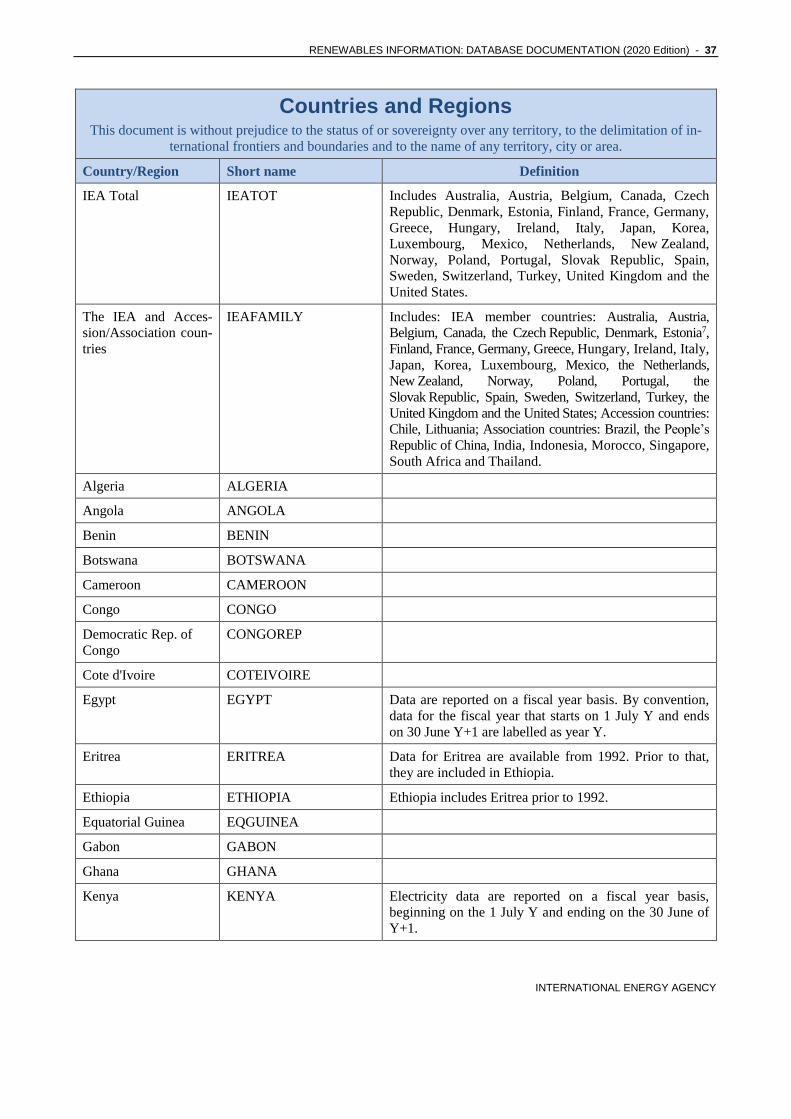
Countries and Regions This document is without prejudice to the status of or sovereignty over any territory, to the delimitation of in-
ternational frontiers and boundaries and to the name of any territory, city or area.
Country/Region Short name Definition
IEA Total IEATOT Includes Australia, Austria, Belgium, Canada, Czech
Republic, Denmark, Estonia, Finland, France, Germany,
Greece, Hungary, Ireland, Italy, Japan, Korea,
Luxembourg, Mexico, Netherlands, New Zealand,
Norway, Poland, Portugal, Slovak Republic, Spain,
Sweden, Switzerland, Turkey, United Kingdom and the
United States.
The IEA and Acces-
sion/Association coun-
tries
IEAFAMILY Includes: IEA member countries: Australia, Austria,
Belgium, Canada, the Czech Republic, Denmark, Estonia7,
Finland, France, Germany, Greece, Hungary, Ireland, Italy,
Japan, Korea, Luxembourg, Mexico, the Netherlands,
New Zealand, Norway, Poland, Portugal, the
Slovak Republic, Spain, Sweden, Switzerland, Turkey, the
United Kingdom and the United States; Accession countries:
Chile, Lithuania; Association countries: Brazil, the People’s
Republic of China, India, Indonesia, Morocco, Singapore,
South Africa and Thailand.
Algeria ALGERIA
Angola ANGOLA
Benin BENIN
Botswana BOTSWANA
Cameroon CAMEROON
Congo CONGO
Democratic Rep. of
Congo
CONGOREP
Cote d'Ivoire COTEIVOIRE
Egypt EGYPT Data are reported on a fiscal year basis. By convention,
data for the fiscal year that starts on 1 July Y and ends
on 30 June Y+1 are labelled as year Y.
Eritrea ERITREA Data for Eritrea are available from 1992. Prior to that,
they are included in Ethiopia.
Ethiopia ETHIOPIA Ethiopia includes Eritrea prior to 1992.
Equatorial Guinea EQGUINEA
Gabon GABON
Ghana GHANA
Kenya KENYA Electricity data are reported on a fiscal year basis,
beginning on the 1 July Y and ending on the 30 June of
Y+1.

38 - RENEWABLES INFORMATION: DATABASE DOCUMENTATION (2020 Edition)
INTERNATIONAL ENERGY AGENCY
Countries and Regions This document is without prejudice to the status of or sovereignty over any territory, to the delimitation of in-
ternational frontiers and boundaries and to the name of any territory, city or area.
Country/Region Short name Definition
Libya LIBYA
Mauritius MAURITIUS
Morocco MOROCCO
Mozambique MOZAMBIQUE
Namibia NAMIBIA Data for Namibia are available starting in 1991. Prior to
that, data are included in Other Africa.
Niger NIGER Prior to 2000, data for Niger are presented in Other
Africa.
Nigeria NIGERIA
Senegal SENEGAL
South Africa SOUTHAFRIC South Africa joined the IEA as an Association country in
November 2018.
South Sudan SSUDAN Data for South Sudan are available from 2012. Prior to
2012, they are included in Sudan.
Sudan SUDAN South Sudan became an independent country on 9 July
2011. From 2012, data for South Sudan are reported
separately.
United Republic of
Tanzania
TANZANIA Oil data are reported on a fiscal year basis, beginning on
the 1 July Y and ending on the 30 June Y+1.
Togo TOGO
Tunisia TUNISIA
Zambia ZAMBIA
Zimbabwe ZIMBABWE
Other Africa OTHERAFRIC Includes Burkina Faso; Burundi; Cabo Verde; Central
African Republic; Chad; Comoros; Djibouti; the
Kingdom of Eswatini; Gambia; Guinea; Guinea-Bissau;
Lesotho; Liberia; Madagascar; Malawi; Mali;
Mauritania; Namibia (up to 1991); Niger (until 1999);
Réunion (up to 2011); Rwanda; Sao Tome and Principe;
Seychelles; Sierra Leone; Somalia; and Uganda.
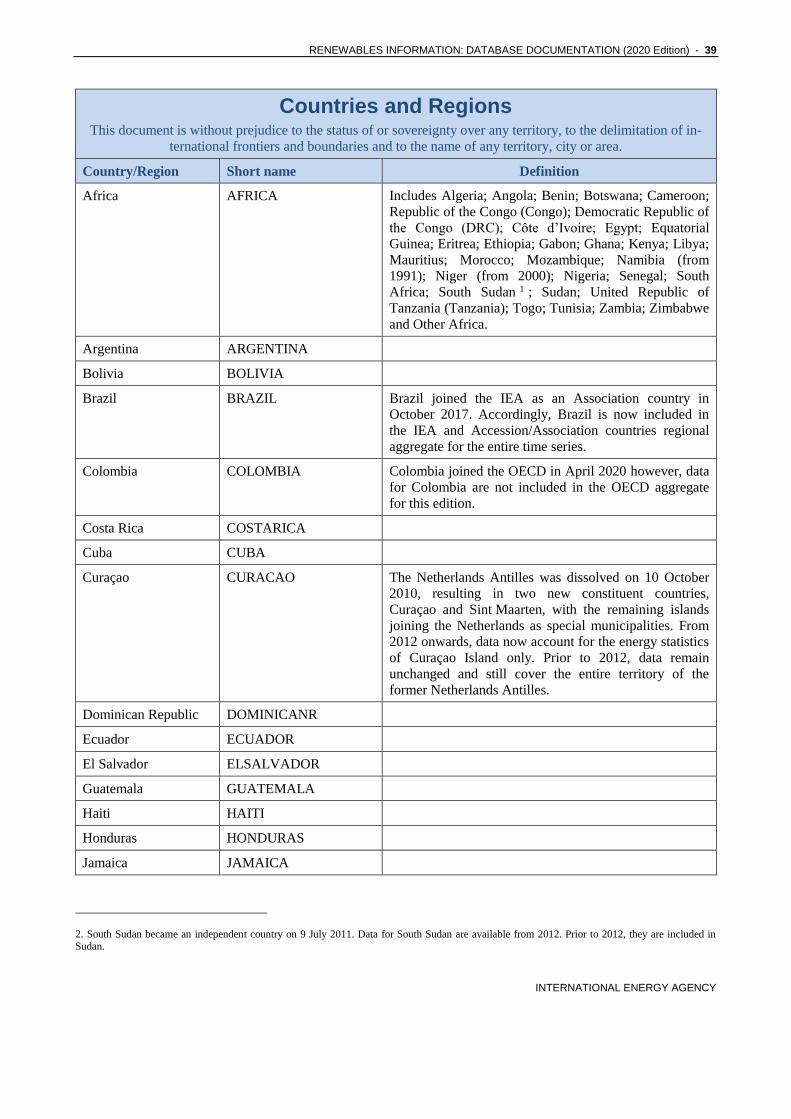
RENEWABLES INFORMATION: DATABASE DOCUMENTATION (2020 Edition) - 39
INTERNATIONAL ENERGY AGENCY
Countries and Regions This document is without prejudice to the status of or sovereignty over any territory, to the delimitation of in-
ternational frontiers and boundaries and to the name of any territory, city or area.
Country/Region Short name Definition
Africa AFRICA Includes Algeria; Angola; Benin; Botswana; Cameroon;
Republic of the Congo (Congo); Democratic Republic of
the Congo (DRC); Côte d’Ivoire; Egypt; Equatorial
Guinea; Eritrea; Ethiopia; Gabon; Ghana; Kenya; Libya;
Mauritius; Morocco; Mozambique; Namibia (from
1991); Niger (from 2000); Nigeria; Senegal; South
Africa; South Sudan 1 ; Sudan; United Republic of
Tanzania (Tanzania); Togo; Tunisia; Zambia; Zimbabwe
and Other Africa.
Argentina ARGENTINA
Bolivia BOLIVIA
Brazil BRAZIL Brazil joined the IEA as an Association country in
October 2017. Accordingly, Brazil is now included in
the IEA and Accession/Association countries regional
aggregate for the entire time series.
Colombia COLOMBIA Colombia joined the OECD in April 2020 however, data
for Colombia are not included in the OECD aggregate
for this edition.
Costa Rica COSTARICA
Cuba CUBA
Curaçao CURACAO The Netherlands Antilles was dissolved on 10 October
2010, resulting in two new constituent countries,
Curaçao and Sint Maarten, with the remaining islands
joining the Netherlands as special municipalities. From
2012 onwards, data now account for the energy statistics
of Curaçao Island only. Prior to 2012, data remain
unchanged and still cover the entire territory of the
former Netherlands Antilles.
Dominican Republic DOMINICANR
Ecuador ECUADOR
El Salvador ELSALVADOR
Guatemala GUATEMALA
Haiti HAITI
Honduras HONDURAS
Jamaica JAMAICA
2. South Sudan became an independent country on 9 July 2011. Data for South Sudan are available from 2012. Prior to 2012, they are included in Sudan.

40 - RENEWABLES INFORMATION: DATABASE DOCUMENTATION (2020 Edition)
INTERNATIONAL ENERGY AGENCY
Countries and Regions This document is without prejudice to the status of or sovereignty over any territory, to the delimitation of in-
ternational frontiers and boundaries and to the name of any territory, city or area.
Country/Region Short name Definition
Nicaragua NICARAGUA
Panama PANAMA
Paraguay PARAGUAY
Peru PERU
Suriname SURINAME Data for Suriname are available starting in 2000. Prior to
that, they are included in Other Non-OECD Americas.
Trinidad and Tobago TRINIDAD
Uruguay URUGUAY
Venezuela VENEZUELA
Other Non-OECD
Americas
OTHERLATIN Includes Anguilla, Antigua and Barbuda; Aruba; the
Bahamas; Barbados; Belize; Bermuda; Bonaire (from
2012); the British Virgin Islands; the Cayman Islands;
Dominica; the Falkland Islands (Malvinas); French
Guiana (until 2010); Grenada; Guadeloupe (until 2010);
Guyana; Martinique (until 2010); Montserrat; Puerto
Rico (for natural gas and – up to 2016 data -
electricity)Error! Bookmark not defined. 2 ; Saba (from 2012);
Saint Eustatius (from 2012); Saint Kitts and Nevis;
Saint Lucia; Saint Pierre and Miquelon; Saint Vincent
and the Grenadines; Sint Maarten (from 2012);
Suriname (until 1999); the Turks and Caicos Islands.
Non-OECD Americas LATINAMERI Includes Argentina; Plurinational State of Bolivia (Bolivia);
Brazil; Colombia 3 ; Costa Rica; Cuba; Curaçao 4 ; the
Dominican Republic; Ecuador; El Salvador; Guatemala;
Haiti; Honduras; Jamaica; Nicaragua; Panama; Paraguay;
Peru; Suriname (from 2000), Trinidad and Tobago;
Uruguay; the Bolivarian Republic of Venezuela
(Venezuela) and Other Non-OECD Americas.
Bangladesh BANGLADESH Data are reported on a fiscal year basis. By convention
data for the fiscal year that starts on 1 July Y-1 and ends
on 30 June Y are labelled as year Y.
Brunei BRUNEI
2 Natural gas and electricity data for Puerto Rico are included under Other non-OECD Americas, except for input to and output to electricity and heat
generation, included under the United States starting with 2017 data.
3 Data for Colombia, that joined the OECD in April 2020, are not included in the OECD aggregate for this edition.
4. The Netherlands Antilles was dissolved on 10 October 2010 resulting in two new ‘constituent countries’ (Curaçao and Sint Maarten) with the other islands joining The Netherlands as ‘special municipalities’. However, due to lack of detailed data the IEA secretariat’s data and estimates under the
‘Netherlands Antilles’ still refer to the whole territory of the Netherlands Antilles as it was known prior to 10 October 2010 up to the end of 2011.
Data refer only to the island of Curaçao from 2012. The other islands of the former Netherlands Antilles are added to Other Non-OECD Americas from 2012.
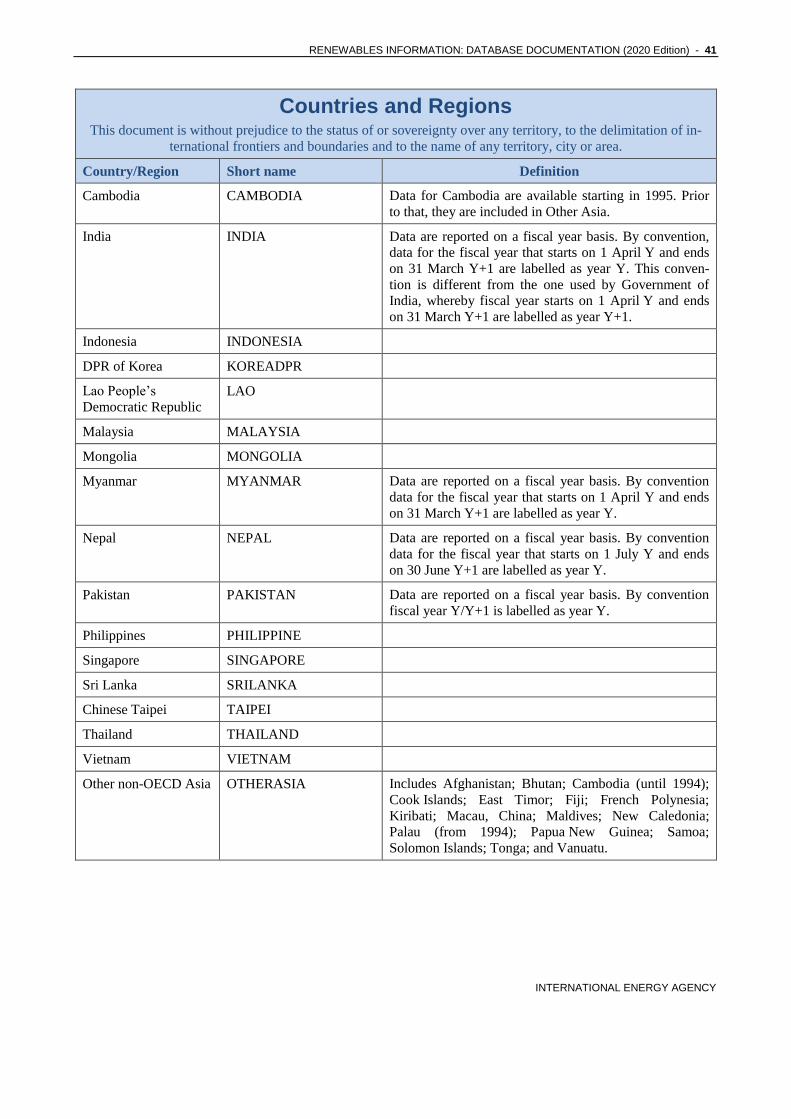
RENEWABLES INFORMATION: DATABASE DOCUMENTATION (2020 Edition) - 41
INTERNATIONAL ENERGY AGENCY
Countries and Regions This document is without prejudice to the status of or sovereignty over any territory, to the delimitation of in-
ternational frontiers and boundaries and to the name of any territory, city or area.
Country/Region Short name Definition
Cambodia CAMBODIA Data for Cambodia are available starting in 1995. Prior
to that, they are included in Other Asia.
India INDIA Data are reported on a fiscal year basis. By convention,
data for the fiscal year that starts on 1 April Y and ends
on 31 March Y+1 are labelled as year Y. This conven-
tion is different from the one used by Government of
India, whereby fiscal year starts on 1 April Y and ends
on 31 March Y+1 are labelled as year Y+1.
Indonesia INDONESIA
DPR of Korea KOREADPR
Lao People’s
Democratic Republic
LAO
Malaysia MALAYSIA
Mongolia MONGOLIA
Myanmar MYANMAR Data are reported on a fiscal year basis. By convention
data for the fiscal year that starts on 1 April Y and ends
on 31 March Y+1 are labelled as year Y.
Nepal NEPAL Data are reported on a fiscal year basis. By convention
data for the fiscal year that starts on 1 July Y and ends
on 30 June Y+1 are labelled as year Y.
Pakistan PAKISTAN Data are reported on a fiscal year basis. By convention
fiscal year Y/Y+1 is labelled as year Y.
Philippines PHILIPPINE
Singapore SINGAPORE
Sri Lanka SRILANKA
Chinese Taipei TAIPEI
Thailand THAILAND
Vietnam VIETNAM
Other non-OECD Asia OTHERASIA Includes Afghanistan; Bhutan; Cambodia (until 1994);
Cook Islands; East Timor; Fiji; French Polynesia;
Kiribati; Macau, China; Maldives; New Caledonia;
Palau (from 1994); Papua New Guinea; Samoa;
Solomon Islands; Tonga; and Vanuatu.
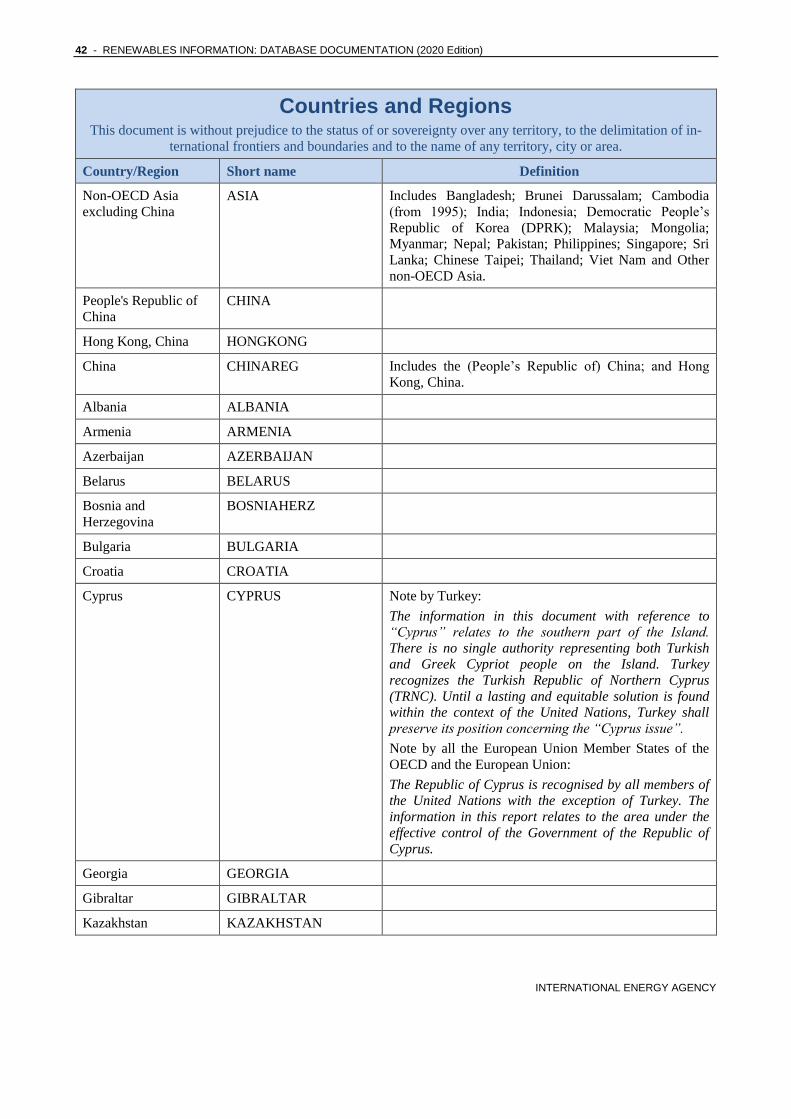
42 - RENEWABLES INFORMATION: DATABASE DOCUMENTATION (2020 Edition)
INTERNATIONAL ENERGY AGENCY
Countries and Regions This document is without prejudice to the status of or sovereignty over any territory, to the delimitation of in-
ternational frontiers and boundaries and to the name of any territory, city or area.
Country/Region Short name Definition
Non-OECD Asia
excluding China
ASIA Includes Bangladesh; Brunei Darussalam; Cambodia
(from 1995); India; Indonesia; Democratic People’s
Republic of Korea (DPRK); Malaysia; Mongolia;
Myanmar; Nepal; Pakistan; Philippines; Singapore; Sri
Lanka; Chinese Taipei; Thailand; Viet Nam and Other
non-OECD Asia.
People's Republic of
China
CHINA
Hong Kong, China HONGKONG
China CHINAREG Includes the (People’s Republic of) China; and Hong
Kong, China.
Albania ALBANIA
Armenia ARMENIA
Azerbaijan AZERBAIJAN
Belarus BELARUS
Bosnia and
Herzegovina
BOSNIAHERZ
Bulgaria BULGARIA
Croatia CROATIA
Cyprus CYPRUS Note by Turkey:
The information in this document with reference to “Cyprus” relates to the southern part of the Island.
There is no single authority representing both Turkish and Greek Cypriot people on the Island. Turkey
recognizes the Turkish Republic of Northern Cyprus
(TRNC). Until a lasting and equitable solution is found within the context of the United Nations, Turkey shall
preserve its position concerning the “Cyprus issue”.
Note by all the European Union Member States of the
OECD and the European Union:
The Republic of Cyprus is recognised by all members of the United Nations with the exception of Turkey. The
information in this report relates to the area under the
effective control of the Government of the Republic of
Cyprus.
Georgia GEORGIA
Gibraltar GIBRALTAR
Kazakhstan KAZAKHSTAN
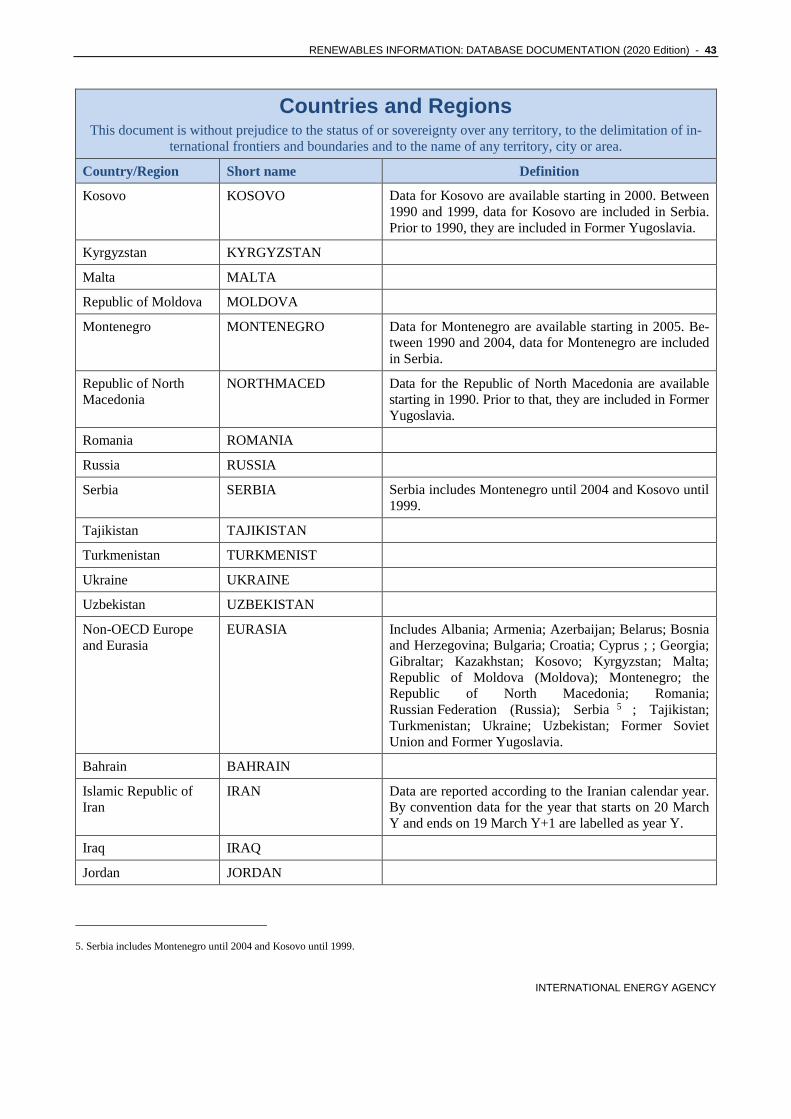
RENEWABLES INFORMATION: DATABASE DOCUMENTATION (2020 Edition) - 43
INTERNATIONAL ENERGY AGENCY
Countries and Regions This document is without prejudice to the status of or sovereignty over any territory, to the delimitation of in-
ternational frontiers and boundaries and to the name of any territory, city or area.
Country/Region Short name Definition
Kosovo KOSOVO Data for Kosovo are available starting in 2000. Between
1990 and 1999, data for Kosovo are included in Serbia.
Prior to 1990, they are included in Former Yugoslavia.
Kyrgyzstan KYRGYZSTAN
Malta MALTA
Republic of Moldova MOLDOVA
Montenegro MONTENEGRO Data for Montenegro are available starting in 2005. Be-
tween 1990 and 2004, data for Montenegro are included
in Serbia.
Republic of North
Macedonia
NORTHMACED Data for the Republic of North Macedonia are available
starting in 1990. Prior to that, they are included in Former
Yugoslavia.
Romania ROMANIA
Russia RUSSIA
Serbia SERBIA Serbia includes Montenegro until 2004 and Kosovo until
1999.
Tajikistan TAJIKISTAN
Turkmenistan TURKMENIST
Ukraine UKRAINE
Uzbekistan UZBEKISTAN
Non-OECD Europe
and Eurasia
EURASIA Includes Albania; Armenia; Azerbaijan; Belarus; Bosnia
and Herzegovina; Bulgaria; Croatia; Cyprus ; ; Georgia;
Gibraltar; Kazakhstan; Kosovo; Kyrgyzstan; Malta;
Republic of Moldova (Moldova); Montenegro; the
Republic of North Macedonia; Romania;
Russian Federation (Russia); Serbia 5 ; Tajikistan;
Turkmenistan; Ukraine; Uzbekistan; Former Soviet
Union and Former Yugoslavia.
Bahrain BAHRAIN
Islamic Republic of
Iran
IRAN Data are reported according to the Iranian calendar year.
By convention data for the year that starts on 20 March
Y and ends on 19 March Y+1 are labelled as year Y.
Iraq IRAQ
Jordan JORDAN
5. Serbia includes Montenegro until 2004 and Kosovo until 1999.

44 - RENEWABLES INFORMATION: DATABASE DOCUMENTATION (2020 Edition)
INTERNATIONAL ENERGY AGENCY
Countries and Regions This document is without prejudice to the status of or sovereignty over any territory, to the delimitation of in-
ternational frontiers and boundaries and to the name of any territory, city or area.
Country/Region Short name Definition
Kuwait KUWAIT
Lebanon LEBANON
Oman OMAN
Qatar QATAR
Saudi Arabia SAUDIARABI
Syria SYRIA
United Arab Emirates UAE
Yemen YEMEN
Middle East MIDDLEEAST Includes Bahrain; Islamic Republic of Iran (Iran); Iraq;
Jordan; Kuwait; Lebanon; Oman; Qatar; Saudi Arabia;
Syrian Arab Republic (Syria); United Arab Emirates;
and Yemen.
Non-OECD Total NONOECDTOT Includes all Non-OECD countries.
World marine and
aviation bunkers
WORLDBUNK Due to the structure of the database and the specific
nature of international marine and aviation bunkers,
including CO2 emissions, World marine and aviation
bunkers are reported both as a flow and as an entity
similar to a country or a region.
World marine and aviation bunkers represent the sum of
international marine and aviation bunkers from all
countries. Therefore, World marine and aviation bunkers
are not applicable for individual countries and regions,
and they are included in the transport for the world total.
World WORLD Includes OECD Total; Africa; Non-OECD Americas;
Non-OECD Asia (excluding China); China (People’s
Republic of China and Hong Kong, China); Non-OECD
Europe and Eurasia; Middle East; World aviation
bunkers and World marine bunkers. It is also the sum of
Africa, Americas, Asia, Europe, Oceania, World
aviation bunkers and World marine bunkers.
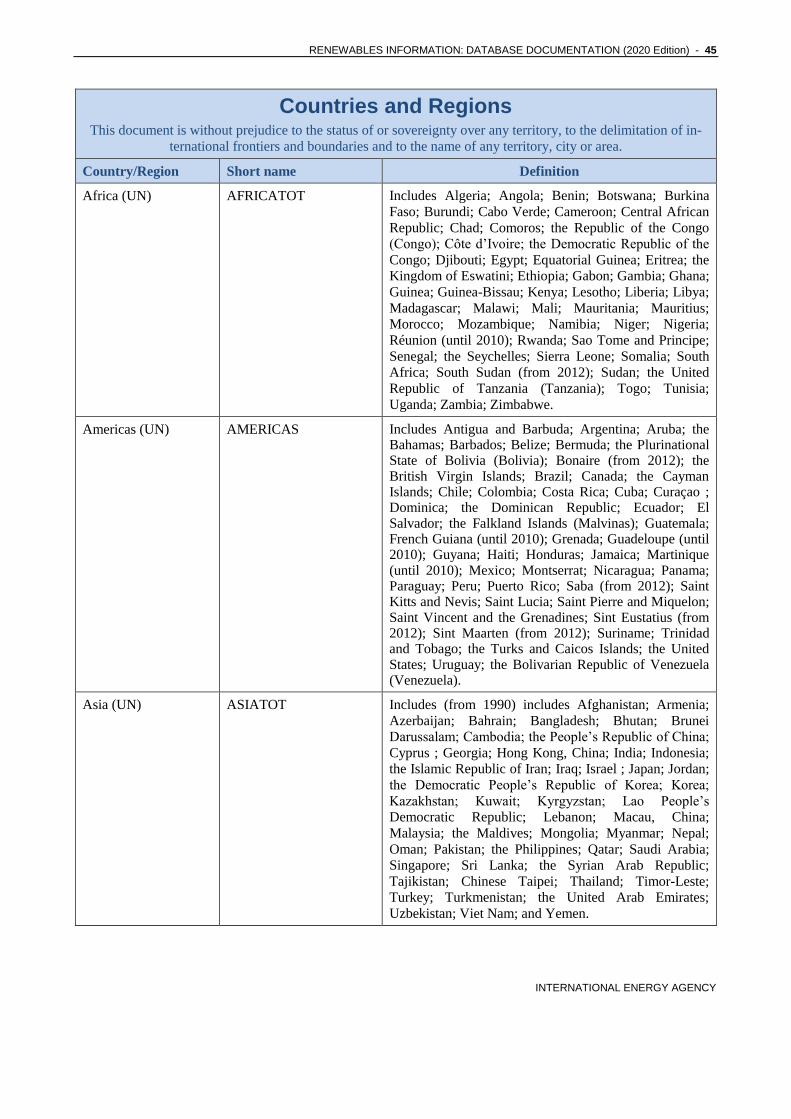
RENEWABLES INFORMATION: DATABASE DOCUMENTATION (2020 Edition) - 45
INTERNATIONAL ENERGY AGENCY
Countries and Regions This document is without prejudice to the status of or sovereignty over any territory, to the delimitation of in-
ternational frontiers and boundaries and to the name of any territory, city or area.
Country/Region Short name Definition
Africa (UN) AFRICATOT Includes Algeria; Angola; Benin; Botswana; Burkina
Faso; Burundi; Cabo Verde; Cameroon; Central African
Republic; Chad; Comoros; the Republic of the Congo
(Congo); Côte d’Ivoire; the Democratic Republic of the
Congo; Djibouti; Egypt; Equatorial Guinea; Eritrea; the
Kingdom of Eswatini; Ethiopia; Gabon; Gambia; Ghana;
Guinea; Guinea-Bissau; Kenya; Lesotho; Liberia; Libya;
Madagascar; Malawi; Mali; Mauritania; Mauritius;
Morocco; Mozambique; Namibia; Niger; Nigeria;
Réunion (until 2010); Rwanda; Sao Tome and Principe;
Senegal; the Seychelles; Sierra Leone; Somalia; South
Africa; South Sudan (from 2012); Sudan; the United
Republic of Tanzania (Tanzania); Togo; Tunisia;
Uganda; Zambia; Zimbabwe.
Americas (UN) AMERICAS Includes Antigua and Barbuda; Argentina; Aruba; the Bahamas; Barbados; Belize; Bermuda; the Plurinational State of Bolivia (Bolivia); Bonaire (from 2012); the British Virgin Islands; Brazil; Canada; the Cayman Islands; Chile; Colombia; Costa Rica; Cuba; Curaçao ; Dominica; the Dominican Republic; Ecuador; El Salvador; the Falkland Islands (Malvinas); Guatemala; French Guiana (until 2010); Grenada; Guadeloupe (until 2010); Guyana; Haiti; Honduras; Jamaica; Martinique (until 2010); Mexico; Montserrat; Nicaragua; Panama; Paraguay; Peru; Puerto Rico; Saba (from 2012); Saint Kitts and Nevis; Saint Lucia; Saint Pierre and Miquelon; Saint Vincent and the Grenadines; Sint Eustatius (from 2012); Sint Maarten (from 2012); Suriname; Trinidad and Tobago; the Turks and Caicos Islands; the United States; Uruguay; the Bolivarian Republic of Venezuela (Venezuela).
Asia (UN) ASIATOT Includes (from 1990) includes Afghanistan; Armenia;
Azerbaijan; Bahrain; Bangladesh; Bhutan; Brunei
Darussalam; Cambodia; the People’s Republic of China;
Cyprus ; Georgia; Hong Kong, China; India; Indonesia;
the Islamic Republic of Iran; Iraq; Israel ; Japan; Jordan;
the Democratic People’s Republic of Korea; Korea;
Kazakhstan; Kuwait; Kyrgyzstan; Lao People’s
Democratic Republic; Lebanon; Macau, China;
Malaysia; the Maldives; Mongolia; Myanmar; Nepal;
Oman; Pakistan; the Philippines; Qatar; Saudi Arabia;
Singapore; Sri Lanka; the Syrian Arab Republic;
Tajikistan; Chinese Taipei; Thailand; Timor-Leste;
Turkey; Turkmenistan; the United Arab Emirates;
Uzbekistan; Viet Nam; and Yemen.

46 - RENEWABLES INFORMATION: DATABASE DOCUMENTATION (2020 Edition)
INTERNATIONAL ENERGY AGENCY
Countries and Regions This document is without prejudice to the status of or sovereignty over any territory, to the delimitation of in-
ternational frontiers and boundaries and to the name of any territory, city or area.
Country/Region Short name Definition
Europe (UN) EUROPE Includes (from 1990) includes Albania; Austria; Belarus;
Belgium; Bosnia and Herzegovina; Bulgaria; Croatia;
the Czech Republic; Denmark; Estonia; Finland; France
; Germany; Gibraltar; Greece; Hungary; Iceland; Ireland;
Italy; Kosovo ; Latvia; Lithuania; Luxembourg; Malta;
the Republic of Moldova (Moldova); Montenegro; the
Netherlands; the Republic of North Macedonia; Norway;
Poland; Portugal; Romania; the Russian Federation;
Serbia ; the Slovak Republic; Slovenia; Spain; Sweden;
Switzerland; Ukraine; the United Kingdom.
Oceania (UN) OCEANIA Includes Australia; New Zealand; Cook Islands; Fiji;
French Polynesia; Kiribati; New Caledonia; Palau;
Papua New Guinea; Samoa; the Solomon Islands;
Tonga; Vanuatu.
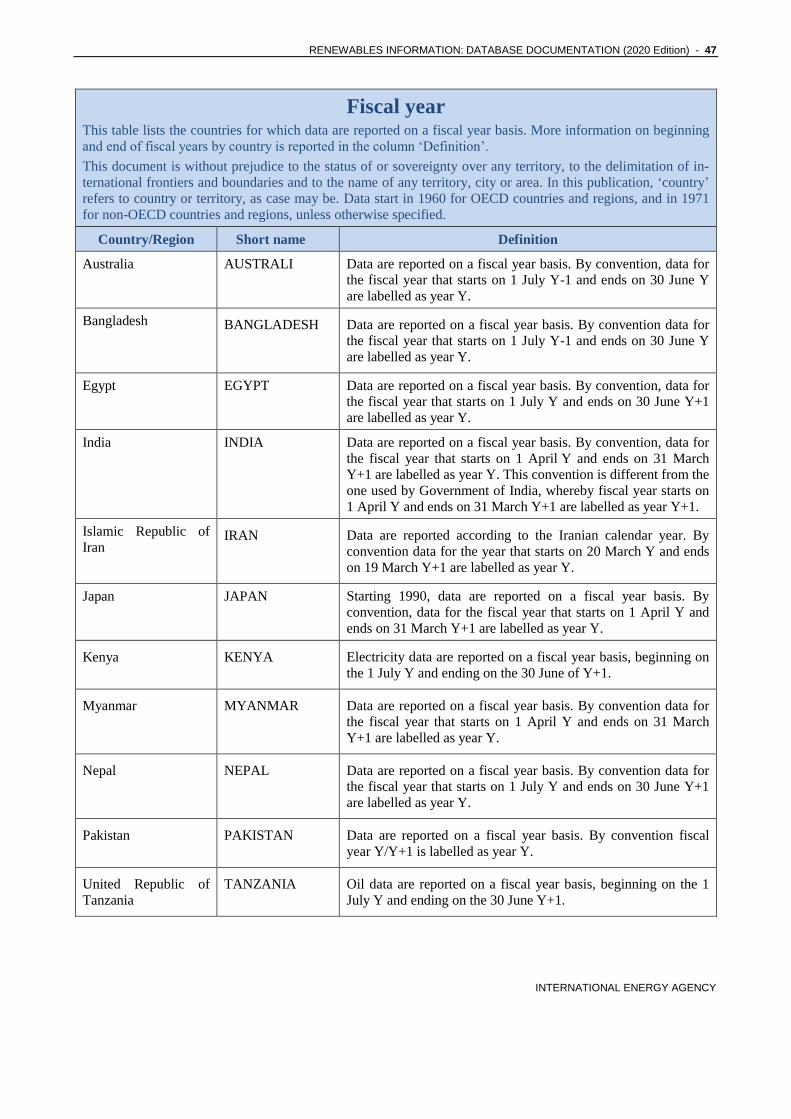
RENEWABLES INFORMATION: DATABASE DOCUMENTATION (2020 Edition) - 47
INTERNATIONAL ENERGY AGENCY
Fiscal year This table lists the countries for which data are reported on a fiscal year basis. More information on beginning
and end of fiscal years by country is reported in the column ‘Definition’.
This document is without prejudice to the status of or sovereignty over any territory, to the delimitation of in-
ternational frontiers and boundaries and to the name of any territory, city or area. In this publication, ‘country’
refers to country or territory, as case may be. Data start in 1960 for OECD countries and regions, and in 1971
for non-OECD countries and regions, unless otherwise specified.
Country/Region Short name Definition
Australia AUSTRALI Data are reported on a fiscal year basis. By convention, data for
the fiscal year that starts on 1 July Y-1 and ends on 30 June Y
are labelled as year Y.
Bangladesh BANGLADESH Data are reported on a fiscal year basis. By convention data for
the fiscal year that starts on 1 July Y-1 and ends on 30 June Y
are labelled as year Y.
Egypt EGYPT Data are reported on a fiscal year basis. By convention, data for
the fiscal year that starts on 1 July Y and ends on 30 June Y+1
are labelled as year Y.
India INDIA Data are reported on a fiscal year basis. By convention, data for
the fiscal year that starts on 1 April Y and ends on 31 March
Y+1 are labelled as year Y. This convention is different from the
one used by Government of India, whereby fiscal year starts on
1 April Y and ends on 31 March Y+1 are labelled as year Y+1.
Islamic Republic of
Iran IRAN Data are reported according to the Iranian calendar year. By
convention data for the year that starts on 20 March Y and ends
on 19 March Y+1 are labelled as year Y.
Japan JAPAN Starting 1990, data are reported on a fiscal year basis. By
convention, data for the fiscal year that starts on 1 April Y and
ends on 31 March Y+1 are labelled as year Y.
Kenya KENYA Electricity data are reported on a fiscal year basis, beginning on
the 1 July Y and ending on the 30 June of Y+1.
Myanmar MYANMAR Data are reported on a fiscal year basis. By convention data for
the fiscal year that starts on 1 April Y and ends on 31 March
Y+1 are labelled as year Y.
Nepal NEPAL Data are reported on a fiscal year basis. By convention data for
the fiscal year that starts on 1 July Y and ends on 30 June Y+1
are labelled as year Y.
Pakistan PAKISTAN Data are reported on a fiscal year basis. By convention fiscal
year Y/Y+1 is labelled as year Y.
United Republic of
Tanzania
TANZANIA Oil data are reported on a fiscal year basis, beginning on the 1
July Y and ending on the 30 June Y+1.

48 - RENEWABLES INFORMATION: DATABASE DOCUMENTATION (2020 Edition)
INTERNATIONAL ENERGY AGENCY
6. COUNTRY NOTES AND SOURCES
General notes
Energy data for OECD countries are submitted by all
OECD Member countries to the IEA secretariat in a
common format and methodology to allow for inter-
national comparisons.
One general issue regarding renewable statistics is
that the variety of definitions for the word “renewa-
ble” may not refer to the same energy sources. Some
of the definitions of renewable energy used by nation-
al and international bodies include specific renewa-
bles technologies such as large hydro, geothermal,
peat, municipal waste or industrial waste while others
exclude them. Similarly, renewables may or may not
include non-commercial biofuels, which has substan-
tial effects regarding renewable data for developing
countries.
The Renewable Energy Working Party of the Interna-
tional Energy Agency set down the following broad
definition:
“Renewable Energy is derived from natural processes
that are replenished constantly. In its various forms,
it derives directly or indirectly from the sun, or from
heat generated deep within the earth. Included in the
definition is energy generated from solar, wind, biofu-
els, geothermal, hydropower and ocean resources,
and biofuels and hydrogen derived from renewable
resources.”
Therefore, in this publication the renewable products
are: hydro (large, medium and small), geothermal,
solar photovoltaic, solar thermal, tide, wave, ocean,
wind, solid biofuels, biogases, liquid biofuels and re-
newable municipal waste.
It follows that total renewables does not include in-
dustrial waste, non-renewable municipal waste, waste
heat, net heat generated by heat pumps, and electricity
generated with hydro pumped storage.
While some OECD member countries accept industri-
al waste and non-renewable municipal waste as
renewable energy sources, many countries exclude
them on the grounds that they are not biodegradable.
Under the IEA methodology, industrial waste and
non-renewable municipal waste are excluded from the
definition of renewable energy sources. However,
these data are included in this publication in order to
account for the full range of statistics collected in the
Annual Renewables and Waste Questionnaire.
Even though data quality improves with each new
edition due to the continuous efforts of the IEA in
partnership with national administrations, it is im-
portant to highlight that difficulties exist in the collec-
tion of some data. As a result, there can be breaks in
the time series for the countries.
For example, one continuing problem is the break-
down between municipal waste and industrial waste.
In some countries industrial waste statistics are not of
the same quality as those for other products, because
renewables and waste data collection systems were
not in place in many countries in the early 1990s. Fur-
thermore, the breakdown between the renewable and
non-renewable portions of municipal waste is some-
times not known and as a result is based on estimates.
The breakdown is important because most countries
include the renewable (biodegradable) part of munici-
pal waste in their renewables definition, while they
exclude the remainder. The classification of waste as
renewable is also important because the non-
renewable component is counted when calculating
CO2 emissions. In cases where the breakdown of mu-
nicipal waste into renewable and non-renewable com-
RENEWABLES INFORMATION: DATABASE DOCUMENTATION (2020 Edition) - 49
INTERNATIONAL ENERGY AGENCY
ponents was not reported, the IEA Secretariat estimat-
ed equal shares of renewable and non-renewable
components.
Data collection from off-grid systems that work inde-
pendently or are connected to a local distribution
system remains a problem. These systems are frequently
omitted in national statistics due to difficulties in
collecting these data. This is, for example, the case
regarding solar energy data, where for a number of
countries, production and capacity are likely to be
considerably higher than indicated in this publication.
Collection of the data presents national governments
with some unique challenges. Renewable energy sys-
tems tend to be smaller than conventional systems,
and harder to track. Operators tend to be more diverse
and more numerous.
Many systems are connected to the grid at the distri-
bution level, rather than at the transmission level, and
so do not require interconnection permits. National
governments are seeking to improve data collection
methods to capture the total nature of their renewable
energies. In general, the dispersion of renewables and
waste production, specifically off-grid production
(such as domestic solar collectors and/or small wind
turbines), creates transparency and measurement
problems. Thus, the nature and structure of the renew-
ables energy market impedes data quality and reliabil-
ity when compared to that of the traditional fossil
fuels, which mainly produce heat and electricity in
grid-connected plants.
This report is focused on the data from 1990 onward,
due to the limited availability of data prior to 1990.
Non-commercial biofuels are included in the IEA def-
inition, but data are not always complete. Electricity
from fuel cells using hydrogen from renewable, as
well as non-renewable, sources is not included in this
publication due to a lack of reliable information.
When using these data, special attention should also
be given to the percentage that renewables represents
in TES in countries where the net trade of electricity
is large and also represents a significant percentage. In
these cases, the high net imports of electricity can
heavily influence the percentage of renewables in
TES.
Statistics of non-OECD countries presented in this
publication are based on data available at the time of
publishing and may differ from the final non-OECD
data to be published in World Energy Balances.
Additional information on the methodologies and re-
porting conventions used here are included in the
notes in World Energy Balances.
Historical data (1990-2018)
The annual historical data in this report are taken from
the IEA/OECD databases of Energy Statistics which
are based on annual submissions from all OECD
Member countries.
i) IEA/OECD renewables statistics
This database of annual statistics for OECD countries
covers hydroelectricity, solid biofuels, geothermal,
renewable municipal waste, wind, gas from biomass,
liquid biofuels, solar photovoltaic, solar thermal,
tide/wave/ocean, non-renewable municipal waste and
industrial waste. It includes electricity and heat pro-
duction from renewable sources and supply/demand
balances of renewable and waste products.
The main data from this system are published annual-
ly in this publication.
ii) IEA/OECD electricity statistics
This database of annual statistics for OECD countries
covers generating capacity and electricity production
from main activity producer and autoproducer plants.
It includes information on electricity production by
fuel type and supply/demand balances for electricity
and for heat sold to third parties from different types
of power and heat plants.
The main data from this system are published annually
in the IEA/OECD publication Electricity Information.
iii) World energy balances
Overall energy balances are constructed annually for
all OECD countries from the basic energy statistics
systems of the IEA. The overall energy balance data
are expressed in a common energy unit of tonnes of
oil equivalent (toe) and presented in a standard matrix
format. The balances are published annually in the
IEA/OECD publication Energy Balances of OECD Countries in which detailed country notes referring to
historical data can be found.

50 - RENEWABLES INFORMATION: DATABASE DOCUMENTATION (2020 Edition)
INTERNATIONAL ENERGY AGENCY
Australia
Source
Department of Industry, Science, Energy and Re-
sources, Canberra.
General notes
All data refer to the fiscal year (e.g. July 2017 to June 2018 for 2018).
A large biogas production facility did not report any production in 2016-2017. In 2017, this led to reductions in the consumption of biogases in auto CHP plants and the commercial and public ser-vices sector.
Increases in indigenous production of solid bio-fuels since 2014 are related to incentives under the Renewable Energy Target legislation, which went into effect in 2001, and aims to increase the share of electricity generation from renewable sources. More information is available here: http://www.cleanenergyregulator.gov.au/RET
The data for biogasoline and biodiesel are not available before 2003 and 2004 respectively.
There are breaks in the time series for many data between 2002 and 2003 due to the adoption of the National Greenhouse and Energy Reporting (NGER) data as the main energy consumption data source for the Australian Energy Statistics.
In 2002, the Australian administration started to
use a new survey methodology and reclassified the
types of plants between main activity producers
and autoproducers.
From 1996, a different industry consumption break-
down for biofuels and waste is available and leads
to breaks in time series.
Supply
Indigenous production of biodiesel decreased sub-
stantially starting with 2016 data because one of
major biodiesel producers ceased production in
January 2016. The trend continues with 2017 and
2018 data, when, according to Bioenergy Austral-
ia, low oil prices and higher feedstock prices cre-
ated a difficult market for the remaining biodiesel
producers.
Indigenous production of biogasoline (ethanol)
has decreased since the Ethanol Production Grants
Programme ended on 30 June 2015. On 1 July
2015, the fuel excise on domestically produced
ethanol was reduced to zero and will be increased
by 2.5 cents per litre until it reaches 12.5 cents
per litre. More information is available here:
http://biomassproducer.com.au/markets/bioenergy-
markets-in-australia/ethanol/#.Wwf7Le6FOUk.
Additionally, 2017 data were also affected by low
oil prices.
Biogas production data at sewage treatment works
are not available.
The production data of electricity from wind are
available from 1994.
Transformation
In the 2018 edition, new methodologies were in-
troduced by the Australian administration for re-
porting electricity production from solar sources.
First, the methodology for reporting electricity
production from solar PV and solar thermal was
changed between 2009 and 2010, resulting in a
break in time series. Prior to 2010, the ratio of
electricity production from solar thermal to total
solar was assumed to be the same each year. After
2010, solar PV autoproducer electricity produc-
tion is the residual after the main activity solar PV
and solar thermal are deducted from total solar
production. There is an additional break in time se-
ries between 2013 and 2014 for solar production
when a new methodology for determining large-
scale solar PV production was introduced for
main activity solar PV plants.
Electricity production from solar PV starts in
1992 and from solar thermal in 2003.
Prior to 1995, electricity production from biogases
is included in natural gas.
Consumption
In the 2018 edition, solid biofuels were revised
back to 2010 by the Australian administration, ex-
panding the scope from the revisions in the 2016
and 2017 editions to indigenous production and
consumption sectors which weren’t previously re-
vised. This results in a break in time series be-
tween 2009 and 2010.
In the 2017 edition of this publication, there has been
a revision to the time series of solid biofuels con-
sumption in “Paper, pulp and printing” sector. This
time series has been revised back to 2010 resulting in
break in time series between 2009 and 2010.
In the 2016 edition of this publication, the Australian
administration revised primary solid biofuels
back to 2010 which impact mostly final consump-
RENEWABLES INFORMATION: DATABASE DOCUMENTATION (2020 Edition) - 51
INTERNATIONAL ENERGY AGENCY
tion in Food and Tobacco. This created breaks in
time series.
The consumption data of biogases in industry is
not available before 2003.
Austria
Source
Bundesanstalt Statistik Österreich, Vienna.
General notes
Starting with the 2016 edition, widespread data
revisions were received due to enhanced reporting
for 2005 onwards as a consequence of the Austrian
Energy Efficiency Act (Bundes-Energieeffizienz-
gesetz). For some time series, these revisions were
extrapolated back to 1990. As a consequence,
there may be breaks between 2004 and 2005, and
1989 and 1990. For more details on the meth-
odologies in the revisions in the energy balance,
there is more information here:
http://www.statistik.at/wcm/idc/idcplg?IdcService
=GET_PDF_FILE&RevisionSelectionMethod=La
testReleased&dDocName=036412. For more de-
tails on the methodologies related to consumption
in households, there is more information here:
http://www.statistik.at/wcm/idc/idcplg?IdcService
=GET_PDF_FILE&RevisionSelectionMethod=La
testReleased&dDocName=078265
Data for solar photovoltaic and wind are avail-
able from 1993.
Transformation
Electricity plants data may include some CHP plants
operating in electricity only mode.
Electricity production from geothermal main elec-
tricity plants only refers to electricity that is fed in-
to the grid. Total production is not known as these
plants are below the reporting threshold.
Fluctuating efficiencies from year to year for solid
biofuel and industrial waste plants are related to
operational decisions which are governed by a
formula described in the Standard documentation Meta information on Energy balances for Austria and the Laender of Austria published in June 2016
on the Statistics Austria website (link above).
In the 2018 edition, electricity production from
municipal waste main activity electricity plants
was revised from 2003-2009. Additionally, elec-
tricity production from municipal waste main ac-
tivity CHP plants was revised in 2014.
A large autoproducer electricity plant was reclassified
as an autoproducer CHP plant and therefore creates
a break in time series for municipal waste in 2011.
Due to a change in the survey methodology, the
heat produced in small plants (capacity inferior to
1 MW) is not reported starting in 2002.
Prior to 2002, data for biogases only include
plants of 1 MW or larger.
Electricity generation from geothermal started in
2002.
Consumption
In the 2016 edition, improvement in the iron and
steel industry data have allowed more precision in
the consumption, among other for industrial
wastes in blast furnaces.
In the 2016 edition, the consumption of solid bio-
fuels in the residential sector was revised down
from 2005 data.
Belgium
Source
Observatoire de l'Energie, Brussels.
General notes
Renewable municipal wastes include a share of
renewable industrial wastes.
No information on wood pellets and animal waste
is available prior to 2012.
Data for biodiesels and biogasoline are available
starting in 2009.
Supply
Data on pure biogasoline and biodiesels trade are
not available for 2009 and 2010.
Transformation
In 2015, part of the law regulating the blending of
biodiesel with diesel was temporarily suspended
but in 2016, this law was reinstated.
2009 was the first year of offshore wind produc-
tion in Belgium. 2010 is the first year data are
available.

52 - RENEWABLES INFORMATION: DATABASE DOCUMENTATION (2020 Edition)
INTERNATIONAL ENERGY AGENCY
No information is available on heat production in main
activity CHP plants for industrial waste in 2007.
In 2003, combustion of municipal waste for elec-
tricity and heat generation purposes increased sig-
nificantly. However, because a large portion of the
heat produced is not used (sold), plant efficiencies
dropped significantly between 2002 and 2003.
In 2000, most autoproducer electricity plants using
combustible fuels were reclassified as autopro-
ducer CHP plants; the heat production from these
plants was used for internal industrial processes
and not sold to third parties until 2005.
For 1998 and 1999, electricity production at CHP
plants with annual heat output below 0.5 TJ is re-
ported with electricity only plants.
Consumption
In the 2019 edition, revisions were implemented
for the direct use of solar thermal in other sectors
back to 2010 due to improved data availability.
Consumption of bioethanol increased in 2017 due
to legislation which went into effect on 1 January
2017 which increased the blending obligation for
gasoline products.
Industrial waste consumption in the chemical
sector started in 2011.
Other liquid biofuels consumed in power plants
reported before 2011 can include biodiesel.
New data on consumption cause breaks in time
series for primary solid biofuels between 2011
and 2012.
Canada
Source
Natural Resources Canada, Ottawa.
General notes
The split of municipal waste reported assumes
65% renewable and 35% non-renewable.
Starting in 2009, a new data source has been used by
Canadian administration for electricity production
from solar, wind, and tide. This new source co-
vers production from solar and wind only from
plants with capacity higher than 500 kW.
The IEA Secretariat has estimated the data for bi-
ogases, industrial and municipal waste from
1990 to 2004, biogasoline (ethanol) from 1998 to
2004 based on information supplied by Natural
Resources Canada.
Supply
Canadian biodiesel production increased signifi-
cantly in 2014 because a large producer came
online at the end of 2013. In 2016 again, there was
big increase in production of biodiesel due to a
large plant coming online in Alberta. This is also
the reason for the increase in export, as Canada
exports most of its biodiesel to the US.
There were no exports of biogasoline since 2013.
Transformation
For 2017 data, the electrical capacity of other liq-
uid biofuels is included without any relevant in-
puts or outputs due to the lack of data.
In the 2018 edition, revisions were made to elec-
tricity production from wind back to 2013.
In the 2016 edition of this publication, there was a
reclassification from autoproducer to main activity
producer for plants fuelled by biogases and mu-
nicipal waste.
In the 2016 edition of this publication, the electri-
cal capacity of solid biofuels revised back to 2005,
which makes break in time series between 2004
and 2005.
Only gross maximum electrical capacity is available.
Production capacity figures for biodiesel and bio-
gasoline are not available.
Consumption
The solid biofuels consumption for the residential
sector for the years 2015 - 2017 are equal to 2014
data because firewood data lag one year behind.
Chile
Source
Energía Abierta, Comisión Nacional de Energía,
Ministerio de Energía, Santiago.
General notes
The Chilean administration applied a new revised
methodology for final consumption of primary
solid biofuels. This may lead to breaks in time se-
ries between 2013 and 2014.

RENEWABLES INFORMATION: DATABASE DOCUMENTATION (2020 Edition) - 53
INTERNATIONAL ENERGY AGENCY
Charcoal production and consumption have been
estimated by the IEA Secretariat until 2013. From
2014 data, only solid biofuels input to charcoal
production plant is estimated.
The split of electricity generation by main activity
and autoproducer by fuel was estimated by the
Chilean administration for the period 1990 to 2003.
From 1990, consumption in paper and pulp in-
cludes forestry and consumption in agriculture is
included in non-specified industry.
Supply
Production of landfill gas ceased from 2001 -
2014 as landfill sites stopped producing adequate
gas to continue collection.
Solar thermal heat production has been estimated
by the IEA Secretariat using data published by
Chilean ministry of energy.
Transformation
Electricity production from geothermal started at
Cerro Pabellón in 2017.
Biofuels are co-fired with other fuels for electrici-
ty production. For plants where multiple fuels are
used for electricity production, capacities are re-
ported under the dominant fuel.
Regarding electricity generation from solar PV
and wind, Chilean administration applied a new
methodology for 2014 and this resulted in breaks
in time series between 2013 and 2014. The revi-
sion for the previous years is pending.
A new survey on primary solid biofuels causes
breaks in production and input to autoproducer
CHP between 2011 and 2012.
Data for heat production in CHP and heat plants
are not available.
The split of hydro generation by plant size is
available from 1996 for main activity and from
2000 for autoproducers.
Consumption
Solar thermal consumption data are not available
so all consumption data are allocated to the non-
specified (other) sector.
Czech Republic
Source
Ministry of Industry and Trade, Prague.
General notes
The restructuring of the Czech electricity market
leads to breaks in the time series in all sectors be-
tween 1998 and 1999.
Data for municipal waste and solid biofuels are
not available prior to 1990 and liquid biofuels da-
ta are not available prior to 1992.
Transformation
Starting in 2016, a main activity producer CHP
incineration plant fired by municipal waste was in
test operation at Chotikov.
In 2012, a main activity producer electricity plant
using solid biofuels started to produce heat and
was reclassified as main activity CHP plant.
Data on biogases used in main activity producer
CHP and autoproducer heat plants start in 1997.
Industrial waste use in main activity producer
electricity plants is included with solid biofuels
from 1996.
Consumption
The increase in the consumption of industrial
wastes (non-renewable) in the non-metallic min-
erals sector in 2018 is related to increased demand
from cement companies.
Starting in 2016, an increased excise duty was im-
posed on biofuels, causing a decline in consumption.
In the 2017 edition, due to a new survey in house-
holds made by the Czech Statistical Office in 2015
(ENERGO 2015), solid biofuels consumption in
residential sector has been considerably revised up-
wards since 1990.
Hospital waste previously reported as municipal
waste is reported under industrial waste since 2008.
New survey systems cause breaks in final con-
sumption in 1999 and in 2002. Breaks in both sup-
ply and consumption of biofuels and waste occur
again in 2003.
Data for direct use of solar energy are available
from 2003.
54 - RENEWABLES INFORMATION: DATABASE DOCUMENTATION (2020 Edition)
INTERNATIONAL ENERGY AGENCY
Denmark
Source
Danish Energy Agency, Copenhagen.
General note
In the 2014 edition, total heat production was re-
vised back to 1994, due to the availability of new
data for heat production from liquid biofuels.
Supply
In the 2015 edition, the Danish administration re-
vised the geothermal heat production from 1990
to 2009.
From 2012, biodiesel production is confidential
and gathered with imports.
Transformation
In the 2020 edition, there are revisions from 2010
to 2017 for solid biofuels, biogases and solar
thermal.
Biodiesels and biogasoline consumption for elec-
tricity and heat production are reported under oth-
er liquid biofuels, for confidentiality reasons.
Data for other liquid biofuels main activity heat
plants are available from 1994.
Due to the high number of heating companies
burning wood chips that are equipped with boilers
with flue-gas condensation, the solid biofuels heat
plants show a high efficiency.
Fish oil used in main activity producer heat plants
is included with solid biofuels.
For some years, heat plants for municipal wastes,
solid biofuels and biogases show efficiencies
larger than 100%, on a net calorific value basis,
due to the use of condensing boilers that recover
the latent heat of vaporisation.
Based on the reported indigenous production of
solar thermal collectors and installed surface of
these, a decline in specific production [kWh/m2] is
observed. The main reason is that the sources of
the production data and installed surface are dif-
ferent from each other. The production data origi-
nates from the “energy-producer-survey” that
misses some of the newly established installations.
The Danish administration expects that this diver-
gence will probably become smaller each year.
Consumption
In the 2020 edition, the consumption of municipal
wastes in the commercial and public services sec-
tor for 2017 data was revised.
In the 2016 edition, the Danish statistics revised
energy consumption in industry sectors causing
some breaks in solid biofuels consumption be-
tween 2010 and 2011.
The data on the consumption of municipal waste
in the industry sector are delayed by one year and
the Danish administration duplicates the previous
year’s data for the most recent year until the data
become available.
Estonia
Source
Statistics Estonia, Tallinn.
General notes
Data for Estonia are available starting in 1990. Prior
to that, they are included in the Former Soviet
Union in World Energy Statistics.
Data for biogases include landfill gas starting in
2005.
Transformation
For plants where multiple fuels are used for elec-
tricity production, capacities are reported under the
dominant fuel.
In the 2018 edition, the surge in main activity heat
from solid biofuels was related to reclassification
from autoproducer heat plants, where previously au-
toproducer own use heat and associated fuel inputs
are not reported, and the fuel consumption appears
in the main economic activity of the autoproducer.
Finland
Source
Statistics Finland, Helsinki.
General notes
A new survey system and a reclassification of the
data lead to breaks in the time series between 1999
and 2000 for most products and sectors. The new
RENEWABLES INFORMATION: DATABASE DOCUMENTATION (2020 Edition) - 55
INTERNATIONAL ENERGY AGENCY
survey system is more detailed and has better
product coverage, especially in electricity, CHP
and heat production, as well as in industry.
Prior to 2004, industrial waste also included other
energy forms such as hydrogen, heat from chem-
ical processes, natural gas and blast furnace gas.
Data for biogases and industrial waste are availa-
ble from 1996.
Supply
Due to confidentiality reasons, the biodiesel pro-
duction includes trade figures and stock changes
starting with 2015 data. Regarding biogasoline, im-
port covers production, exports and stock changes.
Transformation
The use of charcoal in blast furnaces started in
2018 on a test basis.
The capacities of co-firing plants are reported un-
der the dominant fuel.
The amount of biodiesel used for blending with
diesel fell greatly in 2016 after record levels for
the past two years. Annual variation in the con-
sumption of biofuels is possible and caused by
Finland’s biofuel legislation, which gives distribu-
tors the possibility to fulfil the bio obligation flex-
ibly in advance.
In the 2016 edition, the allocation of solar photo-
voltaic between main activity and autoproducer
plants was revised.
In 2014, the new consumption of other liquid bio-
fuels in main activity electricity plant corresponds
to biopyrolisis oil made from wood chips.
The increase in heat production from municipal
waste in 2014 is due to the opening of a new plant.
Heat output from autoproducer CHP plants is
available starting in 1996 and from autoproducer
heat plants starting in 2000.
Before 1999, all electricity production from auto-
producers running on fuelwood is allocated to
CHP plants.
Prior to 1992, outputs from the use of combustible
renewables and waste to generate electricity and/or
heat were included in peat. Therefore, the IEA
Secretariat estimated the breakdown of outputs
from municipal waste and solid biofuels based on
reported inputs.
Consumption
Starting in 2017, the large increase of biogas con-
sumption in the paper, pulp and printing industry
is due to a change in process in the industry. Wood
was gasified and replaced natural gas or oil.
France
Source
SDES, Ministry of Ecology, Sustainable Development
and Energy, Paris.
General notes
From 2011 data onwards, France now includes
Monaco, and the following overseas departments
(Guadeloupe; French Guiana; Martinique;
Mayotte; and Réunion); and excludes the overseas
collectivities (New Caledonia; French Polynesia;
Saint Barthélemy; Saint Martin; Saint Pierre and
Miquelon; and Wallis and Futuna). Prior to 2011,
France includes Monaco and excludes the
following overseas departments and territories:
Guadeloupe; French Guiana; Martinique; Mayotte
and Reunion; New Caledonia; French Polynesia;
Saint Barthélemy; Saint Martin; Saint Pierre and
Miquelon; and Wallis and Futuna. In the 2018
edition, following an analysis of biogases in the
energy sector by the French administration, there
are revisions in biogas indigenous production,
inputs to the transformation sector, heat production
and final consumption back to 2005. Electricity
production from biogases is revised back to 2011.
This causes breaks in time series between 2004
and 2005 as well as 2010 and 2011.
Indigenous production, transformation and final
consumption of industrial waste are reported
from 2013. In the 2018 edition, indigenous pro-
duction and transformation of industrial waste
were added from 2007 - 2012. It follows that there
is a break in time series between 2012 and 2013.
In the 2018 edition, solid biofuels’ indigenous
production and inputs to main activity and auto-
producer heat plants have been revised back to
2007 Electricity production has been revised back
to 2013. This causes breaks in time series between
2006 and 2007 as well as 2012 and 2013.
In the 2018 edition, indigenous production and
inputs to main activity heat plants have been re-
vised back to 2007 for municipal waste. Electrici-
56 - RENEWABLES INFORMATION: DATABASE DOCUMENTATION (2020 Edition)
INTERNATIONAL ENERGY AGENCY
ty production has been revised back to 2011. This
causes breaks in time series between 2006 and
2007 as well as 2010 and 2011. Prior to 2007, pro-
duction and consumption of industrial waste were
included in municipal waste.
In 2014, a new survey on solid biofuels and bio-
gases causes breaks in time series between 2013
and 2014. Biogas was previously reported under
Solid biofuels.
Prior to 2005, all the geothermal heat consump-
tion was reported as direct use. From 2005 data,
some quantities are reported as output of heat
plants, resulting in breaks in time series for pro-
duction, transformation and consumption.
Transformation
Electricity plants data may include some CHP
plants operating in electricity only mode. And heat
plants data may include some CHP plants operat-
ing in heat only mode.
In the 2018 edition, electricity production from
hydro was revised back to the year 2000, in some
cases only amounting to plant reclassification.
Data for heat produced from combustible fuels in
heat only plants are available starting from 2012.
Electricity production from geothermal started in
2011 and stopped in 2012 due to the maintenance
of the only plant.
From 2011, all photovoltaic plants with capacity
above 1 MWp are considered as main activity pro-
ducers, while all plants with capacity below that
value are considered autoproducers.
Plants using municipal waste were reclassified as
autoproducer CHP plants from 1995, which leads
to a break in time series. Breaks in time series in
2005 for municipal waste and solid biofuels are
caused by sectoral reclassifications.
Data on electricity production from wind is avail-
able from 1990.
Consumption
From 2012, the energy consumption is more de-
tailed due to a new national survey.
Production and consumption of industrial waste
are reported from 2013. Prior to that, they were in-
cluded in municipal waste.
A revision of the solid biofuels and biogases time
series created breaks in the direct use time series
between 2004 and 2005.
The breakdown of the final energy consumption of
biogases was estimated by the French administra-
tion from 1970 to 2003.
Germany
Source
Federal Ministry for Economic Affairs and Energy,
Berlin.
General notes
In the 2020 edition, there was a revision of nearly
all renewables data back to 2003, basically related
to error correction and new information. This leads
to a break in series between 2002 and 2003.
Starting with the 2020 edition, final consumption
in the agriculture sector is now reported separate-
ly. Previously, it was included in commercial and
public services.
Changes in the reporting system lead to breaks in
time series between 1996 and 1997, 2002 and
2003, 2006 and 2007 and between 2010 and 2011.
Starting in 2008, municipal waste and industrial
waste data were collected separately. This leads to
breaks in the time series between 2007 and 2008.
Data from 2007 incorporates a new methodology
for reporting heat. From 2007 onwards all heat
production in autoproducers is considered as non-
sold (i.e. for self-use). Therefore, inputs of com-
bustible renewables and waste for heat production
are no longer reported in the transformation sector
and appear in final energy consumption, broken
down by sector, in 2007. More information on dis-
trict heat also became available in 2007, resulting
in increased inputs to main activity heat plants
starting in 2007. These issues combined to cause
breaks in the transformation and final consumption
time series between 2006 and 2007.
Data on geothermal heat production and direct
consumption were revised by the German admin-
istration and are only available starting in 2003.
GDP figures prior to 1991 are based on conver-
sions made by the German Institute for Economic
Research (Deutsches Institut für Wirtschafts-
forschung) and the former Statistical Office of the
GDR (Statistisches Amt der DDR).
RENEWABLES INFORMATION: DATABASE DOCUMENTATION (2020 Edition) - 57
INTERNATIONAL ENERGY AGENCY
Supply
Trade data for biogasoline are available from 2004
and for biodiesels from 2003.
Transformation
From 2018 onwards, own use of electricity at main
electricity geothermal plants includes electricity
used for pumping.
For 2018, the increase in electricity output from
solar PV was in part due to higher than average
solar radiation during that year.
Industrial wastes are co-fired with other fuels for
electricity production. For plants where multiple
fuels are used for electricity production, capacities
are reported under the dominant fuel.
Due to a reclassification of wind energy and solar
photovoltaic in the official data of the German
Federal Statistical Office since 2011, the produc-
tion is now only reported under main activity pro-
ducer plants.
Prior to 2003 electricity production in electricity
plants includes production from CHP plants and
heat production in CHP plants includes production
from heat plants.
In some instances, electricity generation from hydro-
electricity, solar and wind in autoproducer elec-
tricity plants are confidential or non-available and
therefore are included in main activity producer
electricity plants.
Consumption
Increased consumption of industrial wastes (non-
renewable) in the non-metallic minerals sector in
2018 is related to increased cement production due
to a high level of activity in the construction sec-
tor.
For solid biofuels consumption in the commercial
and public services sector, new data were derived
in cooperation with the Federal Research Institute
for Rural Areas, Forestry and Fisheries by apply-
ing a different calculation approach based on the
total demand for material and energy use of the re-
source wood in Germany. This had resulted in
breaks in time series between 2013 and 2014.
Greece
Source
Ministry for Environment and Energy, Athens.
General notes
New information on solid biofuels is available from
1996 and leads to breaks between 1995 and 1996.
Data for biofuels and waste input and output to
transformation are available from 1992.
Data for biogases are available from 1990 and data
for industrial waste from 1992.
Supply
Indigenous production and inland consumption of
industrial waste have been estimated by the IEA
Secretariat for 2019p.
No heat production of solar heat is reported alt-
hough it exists.
Transformation
In the 2020 edition, revisions for 1998 – 2017 of
the indigenous production of solar thermal are the
result of a revision of the latest data on solar
thermal efficiency.
In 2018, the increase in efficiency at industrial
waste (non-renewable) -fired Autoproducer CHP
plants was due to increased generation of unsold
heat.
The big increase in delivery of industrial wastes
to autoproducer CHP plant in 2010 is mainly due
to the opening of a new plant.
Inputs of solid biofuels to charcoal production are
estimated for 2007 to 2010 by the IEA Secretariat
assuming an efficiency of 40%.
Industrial waste used in autoproducer CHP plants
decreased substantially in 2006 because a plant
closed.
Consumption
Solid biofuels consumption in commercial/public
services is included in residential until 2011.
The consumption of solid biofuels in the paper,
pulp and printing industry is not available from
2003 to 2012.
58 - RENEWABLES INFORMATION: DATABASE DOCUMENTATION (2020 Edition)
INTERNATIONAL ENERGY AGENCY
Direct use of geothermal heat in residential is
available starting in 2004.
Hungary
Source
Hungarian Energy and Public Utility Regulatory
Authority, Budapest.
General notes
Data for biogases are available from 2000; for
industrial waste from 2003; for biodiesel produc-
tion from 2007.
Data for wind and solar thermal are available
from 2001.
The Hungarian administration reclassified some of
their plants between 1996 and 2000, which caused
some breaks in the time series.
Supply
A 2012 change in biogasoline reporting method-
ology results in break in time series between 2011
and 2012.
Transformation
In 2017, a new geothermal power plant began
operations.
For 2017 onwards, inputs and outputs from power
plants are reported at a unit level, while for prior
years, data are reported at a plant level. As a result,
breaks in series are observed between 2016 and
2017. In particular, for heat output from industrial
waste at autoproducer CHP and autoproducer heat
plants.
For 2017, the decline in heat production from in-
dustrial waste is partly due to the reclassification
of a main activity producer as an autoproducer.
In 2014, some CHP plants running on Industrial
waste and solid biofuels produced only heat and
were reclassified to heat plants.
From 2014 data, more data suppliers were in-
volved in the process, causing new autoproducer
time series to appear for geothermal and indus-
trial waste plants.
Data on electricity and heat production from solid
biofuels in autoproducer CHP plants are available
from 1995.
Geothermal heat production from main activity
producer heat plants is also available from 1995.
Consumption
In the 2018 edition, the Hungarian authority has
revised solid biofuels consumption in other sectors
back to 2005 based on the new survey from Hun-
garian Central Statistical Office (HCSO). This re-
sulted in break in series between 2004 and 2005.
A new reporting methodology for the direct use of
geothermal energy was applied from 2014 result-
ing in break in time series between 2013 and 2014.
Data for direct use of geothermal heat are availa-
ble from 1990.
Iceland
Source
National Energy Authority, Reykjavík.
General notes
Data for 2019p have been estimated by the IEA
Secretariat.
Energy industry own use of electricity refers mainly
to the use of electricity by the geothermal industry to
pump geothermal water from underground sources.
2013 is the first year of data availability for the
supply and consumption of solid biofuels.
In the 2015 edition, the Icelandic administration
revised geothermal heat production and heat con-
sumption back to 1990. This affects mainly the geo-
thermal direct use, the geothermal heat production
and the final consumption of heat. Prior to 1990, all
heat for space heating was reported in residential.
Transformation
The rise in heat in 2018 is due to an increase in the
number of residential and commercial connections
to new and existing district heating networks.
The increase in geothermal electricity production
in 2018 is due to a new 90MW power plant, half of
which came online in 2017, and half in 2018.
From 2016 onwards, the decline in electricity pro-
duction from wind is due to a combination of low-
er wind speeds and lower installed capacity.
Gross heat production from geothermal sources
increased by 30% from 2015 to 2016. This is due to more accurate reporting from Reykjavik Energy
RENEWABLES INFORMATION: DATABASE DOCUMENTATION (2020 Edition) - 59
INTERNATIONAL ENERGY AGENCY
about the temperature of delivered and returned water, rather than physical increases in supply or generation. Revisions to historical data may be
forthcoming in future editions
From 2013 data, the Hellisheidi geothermal pow-er plant, previously reported under main activity electricity plant, was categorised as main activity CHP plant.
The increase in hydroelectric and geothermal
electricity production and capacity between 2007 and 2008 is due to the expansion of the aluminium industry.
The use of municipal waste to produce heat is available from 1993 and stops in 2010.
In 2002, the increase of heat produced by geo-
thermal was due to the installation of a third unit at the Nesjavellir CHP power plant.
In 1998, 60 MW of generating capacity was in-stalled in the geothermal CHP plant at Nesjavellir. Since the plant was inoperable for four months, production of geothermal heat is almost same with
1997. The extra electricity capacity caused electrici-ty production from geothermal to almost double over the same period.
Electricity production from geothermal sources in main activity producer CHP plants is available from 1992.
Consumption
Biodiesel consumption data for 2014 are estimated
by Icelandic administration based on 2013.
Revisions in the direct use of geothermal heat
from 2013 create breaks in time series between
2012 and 2013.
Biogases used for transport purposes were report-
ed for the first time in 2007.
The geothermal consumption on industrial sector
is reported under non-specified industry, as the
Icelandic administration decided not to estimate
the allocation amongst the sub-sectors of industry.
Ireland
Sources
Department of Communications, Energy and Natu-
ral Resources, Dublin.
Sustainable Energy Authority of Ireland, Cork.
General notes
Data for municipal waste are available from 2009.
Data for solid biofuels and biogases are available
from 1990.
The solid biofuels capacity only refers to CHP.
The electricity generated by solid biofuels from
main activity producer electricity plants, refers to a
118 MW co-firing plant using milled peat and bi-
omass. As the primary fuel is peat, this capacity is
reported under peat.
Supply
In the 2019 edition, revisions were made by the
Irish administration for the indigenous production
of solar thermal for the years 2011 – 2016.
Due to increased demand from a second waste to
energy electricity plant which began operation in
2017, indigenous production of municipal waste
increased sharply starting in late 2017.
Prior to 2011, production and trade of biogasoline
and biodiesels cannot be distinguished due to con-
fidentiality issues.
Transformation
Starting in 2016, the increase of electricity produc-
tion of solid biofuels is a result of a decarbonisa-
tion programme and comes from a plant which is
co-firing peat and biomass.
In 2012 and 2013, the renewable fraction of tyre-
derived fuel (12%) used by a cement plant was
reported by the administration under renewable
municipal waste; the non-renewable fraction
(88%) was reported under industrial waste.
In 2012, a new main activity electricity plant burning
municipal waste (the Meath plant) started operation
There is no Pumped Hydro capacity reported in
2010 and 2011 due to the fact that Ireland’s
pumped storage station, Turlough Hill, was taken
offline for an overhaul late in 2010 and did not
come back online until February 2012.
Electricity production from wind begins in 1992
and from biogases in 1996.
Consumption
The Biofuels Obligation Scheme places an obliga-
tion on suppliers of mineral oil to ensure that
8.695% (by volume) of the gas/diesel oil they
place on the market in Ireland is produced from
renewable sources, e.g. bioethanol and biodiesel.

60 - RENEWABLES INFORMATION: DATABASE DOCUMENTATION (2020 Edition)
INTERNATIONAL ENERGY AGENCY
The obligation was increased from the 1st January,
2017, previously it was 6.383%.
Despite the Biofuels Obligation Scheme, bio-
ethanol consumption decreased in 2017 because
there was a reduction in overall motor gasoline use
and fuel tourism.
Increases in biodiesel consumption in 2017 are
related to the Biofuels Obligation Scheme and in-
creases in road freight, which is heavily dependent
on diesel oil.
The consumption of pure biodiesel in the industry
sector and in the road transport refers to one site,
which is no longer in operation since 2014.
Data for direct use of solar thermal heat are
available from 1990.
Israel
Source
Israel Central Bureau of Statistics, Jerusalem.
General notes
Data for 2019p are estimated by the IEA Secretari-
at.
The statistical data for Israel are supplied by and un-
der the responsibility of the relevant Israeli admin-
istration. The use of such data by the OECD and/or
the IEA is without prejudice to the status of the
Golan Heights, East Jerusalem and Israeli settlements
in the West Bank under the terms of international law.
Data on imports and consumption of charcoal are
estimated since 1992 using data from the Forestry
Production and Trade database from the Food and
Agriculture Organization of the United Nations.
Data on the breakdown of hydroelectric plants by
size became available in 2009.
Transformation
For 2017 data, due to confidentiality reasons, elec-
tricity production reported under auto producer
wind includes generation from main activity wind,
total hydro, and autoproducer biogases.
For 2016 data, due to confidentiality reasons, elec-
tricity production reported under solar PV auto-
producer electricity plants includes hydro and
wind electricity generation.
In 2014, the breakdown of hydro electricity pro-
duction by size is revised due to more accurate
data.
Hydroelectricity production data for 2012 were
estimated based on the previous years.
Electricity production from wind begins in 2001.
Consumption
Since the 2017 edition, solar thermal production
and direct consumption were revised, and are now
estimated by the IEA Secretariat from 2012 on-
wards, using data published in the IEA-Solar Heat-
ing and Cooling Programme Annual Report. These
estimations may create breaks in time series be-
tween 2011 and 2012.
Data on imports and consumption of charcoal
were estimated since 2012 based on figures for
2011.
Italy
Sources
Gestore dei Servizi Energetici - GSE S.p.A., Rome.
General notes
The methodology of data collection for the geo-
thermal sector changed in 2010, causing a break
in time series between 2009 and 2010.
A change in methodology leads to breaks in time
series for industry and transformation between
2003 and 2004.
Supply
Biogasoline includes bio-ETBE.
From 2014, a distinction between trade and produc-
tion became available for other liquids biofuels.
Transformation
In 2018, a new biomethane plant was installed
leading to increases in biogas blending with natu-
ral gas.
For 2018, the decrease in electricity output from
solar PV was due to lower than solar irradiation.
2017 is the first year that biogas is blended with
natural gas.

RENEWABLES INFORMATION: DATABASE DOCUMENTATION (2020 Edition) - 61
INTERNATIONAL ENERGY AGENCY
The methodology of data collection for photo-
voltaic electricity production changed in 2009 and
the distinction between main activity and auto-
producer plants could not be determined, causing a
break in the time series.
In 2008, data for biofuels and waste were reclas-
sified, which results in several breaks in the time
series for transformation.
Heat production is reported starting in 2004 and
includes self-generation in industry.
Up to 2003, solid biofuels capacity includes indus-
trial waste capacity.
From 2000 onwards, the Italian administration
defines electricity and heat production from auto-
producers as generation from producers that con-
sume more than 70% of their own electricity pro-
duction. However, for the 2000 to 2002 period, all
electricity production from autoproducers is re-
ported with main activity producers.
Consumption
From 2018 data onwards, the increase in biodiesel
demand is related to blending obligations.
The final consumption of biogas has been constant
from 2013 to 2016 as these figures are the result of
a survey which is not carried out annually.
In the 2016 edition, the methodology used to cal-
culate solid biofuels consumption in the residen-
tial sector for 2002 to 2014 was updated and this
created a break in time series between 2001 and
2002. This also affects the indigenous production
of solid biofuels. The revisions were limited
backwards to 2002 because of reliability issues.
Japan
Source
The Institute of Energy Economics Japan, Tokyo.
General notes
Starting in 1990, data are reported on a fiscal year
basis (e.g. April 2015 to March 2016 for 2015).
In the 2019 edition, data for Japan were revised
back to 1990 based on new methodology.
Solar collectors surface is estimated by the IEA
secretariat back to 2003 consistent with current
and past reports of the IEA Solar Heating and
Cooling Programme “Solar Heat Worldwide”.
Consumption data for commercial/public services
may include consumption in small and medium-size
industries. The Japanese administration expects that
this shortcoming be corrected in the near future.
There was a large revision in municipal waste
data in the 2016 edition of this publication. This
revision has removed data for municipal waste for
the entire time series up to 2010, which create
breaks in time series between 2009 and 2010.
For municipal waste data, the breakdown between
renewable and non-renewable municipal waste is
estimated by the IEA Secretariat.
Transformation
The Japanese Administrations attributes heat out-
puts (with the exception of heat from electric boil-
ers) to individual fuels based on their share of in-
puts, assuming efficiencies are 100% or less. As a
result, fuel-specific transformation efficiencies
may not reflect actual efficiencies.
Electricity production from mixed hydro plants is
not available and has been split between pure hy-
dro and pure pumped storage.
The capacities of co-firing plants are reported un-
der the dominant fuel.
Input data of solid biofuels to charcoal production
are estimated by the IEA Secretariat assuming an
efficiency of 40%.
Data on heat produced for sale by autoproducer
heat plants are not available.
Electricity and heat produced in CHP plants are not
included in the CHP data time series, but instead are
reported as separate electricity or heat components.
Heat production from geothermal and solar
thermal sources in Japan is not reported by the
Japanese administration.
In the 2017 edition, the Japanese administration
revised electrical capacity for combustible fuels
back to 2003 creating breaks in time series be-
tween 2002 and 2003.
Due to the data availability, municipal waste plant
generation capacity includes plants operating on
black liquor since 2012. Prior to 2012, black liq-
uor capacity was included under solid biofuels
capacity.
Autoproducer solar photovoltaic capacity is de-
rived from data from the Japanese administration
as well as the IEA Photovoltaic Power Systems

62 - RENEWABLES INFORMATION: DATABASE DOCUMENTATION (2020 Edition)
INTERNATIONAL ENERGY AGENCY
Programme (IEA-PVPS) report, “Trends in Photo-
voltaic Applications” published in 2019.
Large increases in 2016 of main activity electricity
generation from solar PV and wind are due to re-
classification from autoproducer status after liber-
alisation of the Japanese power market in April
2016.
The industrial waste consumption in the trans-
formation sector (non-specified) surged in 2013,
because of the increase in use of waste plastics for
coke production.
Prior to 1998, the electricity produced using TRT
technology (Top pressure Recovery Turbines) was
included with electricity generated from wood,
wood waste and other solid waste.
Data on electricity production from wind began in
1993.
Korea
Source
Korea Energy Economics Institute, Ulsan.
General notes
Due to the change of reporting methodology,
breaks in time series may occur between 2013-
2014 and 2014-2015.
Prior to 2009, autoproducer heat production in-
cludes amounts of unsold heat.
Data for 2002 onwards have been reported on a
different basis, causing breaks in series between
2001 and 2002, especially for inputs and outputs to
electricity generation and consumption in the iron
and steel industry. The Korean administration is
planning to revise the historical series as time and
resources permit.
Electricity statistics from 1971 to 1993 have been
estimated by the IEA Secretariat based on the
Korean National Statistics. Data from 1994 have
been submitted by the Korean administration.
This leads to breaks in time series between 1993
and 1994. Before 1994, electricity production from
main activity producer CHP plants is included
with main activity producer electricity only plants.
Heat data are available starting in 1993.
Transformation
Inputs to autoproducer heat plants have been esti-
mated by the IEA Secretariat because of efficiency
issues for municipal waste prior to 2011 and in
2012 and for biogas in 2008, 2011 and 2012.
New plants were included in the Korean survey
creating breaks in time series in 2011.
In 2007, some main activity heat plants and auto-
producers in the commercial/public services sector
were reclassified as main activity CHP plants, re-
sulting in a break in the time series between 2006
and 2007 for biogases.
Prior to 2007, the consumption of landfill gas in
main activity CHP plants may have been included
in main activity heat plants. Difficulties in owner-
ship classification are also the reason landfill gas
data only appears one time in the commercial and
public services sector in 2006.
Between 1993 and 1999, the breakdown of heat
output by type of fuel was estimated by the IEA
Secretariat. In 2000, the Korean administration
started to report heat statistics for some heat plants
which were not reported before.
Consumption
Data for direct use of geothermal heat are availa-
ble from 2002. Geothermal direct use data are
overstated as it refers to heat production by geo-
thermal heat pumps, which include inputs of elec-
tricity and/or gas in the transformation process.
Latvia
Source
Central Statistical Bureau, Riga.
General notes
Data for Latvia are available starting in 1990. Prior
to that, they are included in Former Soviet Union
in the publication of World Energy Statistics.
Supply
For 2018 data, the increase in the indigenous pro-
duction of solid biofuels is due to wood pellet
production.
For 2017, higher rainfall resulted in a significant
increase in electricity output from hydro, and a
decrease in both imports of electricity and output
from combustible fuels.
RENEWABLES INFORMATION: DATABASE DOCUMENTATION (2020 Edition) - 63
INTERNATIONAL ENERGY AGENCY
In 2017, a biodiesel producer exported amounts
produced in 2017 and also some amounts from
stocks.
Transformation
From 2012 to 2015, electrical capacity of solar
photovoltaic was not reported, because capacity
was under 0.5 MW. For the same reason, electrical
capacity of biodiesel for 2010 to 2015 was not
reported.
From 2012 onwards, the increase in electricity
production from solid biofuels is due to the de-
ployment of six new main activity producer CHP
plants running on wood chips.
From 2010 - 2012, electrical capacity of biodiesel
was not reported, because capacity was under
0.5 MW.
Due to a reclassification in 2004, there was break
in time series of electricity production from auto-
producer electricity plant fuelled by biogas be-
tween 2003 and 2004.
Consumption
The increase in inland consumption of biodiesel in
2018 data are related to the implementation of fa-
vourable legislation (the “Biofuel Law”).
The increase in inland consumption (calculated)
for solid biofuels from 2016 to 2017 is due to in-
creased usage in the industry sector.
From 2014, biodiesel consumption has been de-
creasing due to policies which support the sale of
arctic diesel fuel without renewable additives.
Lithuania
Source
Statistics Lithuania, Vilnius.
General notes
In 2019, the increase in the indigenous production
of industrial waste (non-renewable) is the result
of increased data availability.
Data for Lithuania are available starting in 1990.
Prior to that, they are included in Former Soviet
Union in the publication World Energy Statistics.
Supply
The production of charcoal has been over-
estimated prior to 2017 due to the fact that it was
not possible to report data less than 1 kt.
Starting from 2016, some industrial waste (re-
newable) was collected via sorting. These wastes
consist of non-recyclable paper, textiles and wood
wastes and their production is included in solid
biofuels.
Transformation
In March 2017, the Geoterma geothermal heat
plant, the only geothermal heat plant in Lithuania,
closed down.
The Fortum Klaipėda CHP plant produces elec-
tricity and heat from industrial waste (non-
renewable), municipal waste and solid biofuels
since the end of 2013. Since its inception, structur-
al optimisation has been sought. Additionally, be-
fore 2016, calorific values of the fuels were calcu-
lated by taking samples of fuels and after this peri-
od, calculations were made from steam. For these
reasons, there are fluctuations in fuel inputs, ener-
gy production and fuel ratios between industrial
waste (non-renewable), municipal waste and sol-
id biofuels since 2013.
In 2013, an incinerator combusting industrial
waste (non-renewable) and municipal waste be-
gan operations.
Luxembourg
Source
STATEC, Institut national de la statistique et des
études économiques du Grand-Duché du Luxembourg,
Luxembourg.
General notes
There was a fire at the co-digestion plant Itzig in
September 2018. The plant was not reopened until
October 2019, causing a decrease in biogas pro-
duction (specifically: other biogases from anaer-
obic fermentation).
Most of the hydro production shown for Luxem-
bourg is from the Vianden pumped storage plant
and is exported directly to Germany.
The Luxembourgian administration started includ-
ing trade figure of wood chips in trade figure of
64 - RENEWABLES INFORMATION: DATABASE DOCUMENTATION (2020 Edition)
INTERNATIONAL ENERGY AGENCY
Solid biofuels from 2015 data. This creates breaks
in time series between 2014 and 2015.
Data for solar thermal are available starting in
2001 and for solar PV starting in 2000.
Data on solid biofuels are available from 1992.
Supply
In 2015, imports and exports of solid biofuel fig-
ure includes the trade of wood chips.
Transformation
The production of electricity from solid biofuels
from 2013 corresponds to the opening of a new
plant burning wood wastes.
In 2011, the blending of biogases with natural
gas started.
Data on electricity production from biogases are
available from 1998 and heat production from
2010.
Mexico
Source
Secretaría de Energía (SENER), Mexico City.
General notes
Data for 2019p have been estimated by the IEA
Secretariat.
For 2018, all data have been estimated by the IEA
Secretariat based on preliminary supply side data
submitted during the 2018/19 cycle, and the 2018
energy balances published by the Mexican Secre-
taría de Energía (SENER).
The Mexican administration believes the fuels cat-
egorised as industrial wastes (non-renewable)
are likely residual gas. More investigation is need-
ed.
The Mexican administration submitted data direct-
ly by questionnaire for the first time with 1992 da-
ta. As a result, some breaks in time series may oc-
cur between 1991 and 1992. For prior years, data
are partly estimated based on the publication Bal-
ance Nacional - Energía.
Supply
Prior to 2017 data, some bagasse production has
been attributed to other vegetal materials and
residues. This causes a break in series between
2016 and 2017. Revisions prior to 2017 are ex-
pected in the future.
Data for bagasse production is available from
2008.
Data on the production of sewage sludge gas are
available from 1997.
Transformation
The decrease in electricity produced from wind in
2017 data is due to an earthquake which damaged
infrastructure in the south of the country.
Electricity production from solid biofuels and bi-
ogases data are available respectively from 1991
and 1997.
Data on electricity production from wind and so-
lar photovoltaic are available from 1990.
In 2012, a main activity solar photovoltaic power
plant has been commissioned and so electricity
production data can be seen in the relative tables.
Consumption
Increased consumption in the industry and trans-
formation sectors for solid biofuels in 2017 is at-
tributed to bagasse.
Data for solid biofuels used in autoproducer elec-
tricity plants from 1991 to 2005 have been esti-
mated by the Mexican administration.
Data on biogases consumption are available from
1997.
Direct use of solar thermal heat is available from
1990.
Netherlands
Source
Statistics Netherlands, The Hague.
General note
Statistics Netherlands has conducted reviews and
revisions of their energy balance three times; in
2005, 2011 and 2015. The 2005 revisions were to
RENEWABLES INFORMATION: DATABASE DOCUMENTATION (2020 Edition) - 65
INTERNATIONAL ENERGY AGENCY
improve basic energy statistics, particularly with
respect to carbon and CO2 reporting, while the
2011 revisions were part of a harmonization pro-
gram with international energy statistics. The 2015
revisions were the result of increased data collec-
tion, availability of new source information, and
further alignment with international energy defini-
tions. More details are available here: www.cbs.nl.
Supply
Increases in biodiesel production for 2017 are re-
lated to increased capacity of existing plants and
increased demand.
From 2009 to 2012, and again from 2014 the pro-
duction and trade of pure biogasoline were confi-
dential; net imports were estimated by the Dutch
administration based on consumption.
Trade data for municipal waste are available from
2011.
Transformation
Data on electricity and heat output from industrial
waste are available from 2019. Historical revisions
are pending.
The imports of wood pellets are up in 2018 due to
the renewed subsidy for co-firing of biomass at
energy plants.
For 2018, the increase in electricity output from
solar PV and autoproducer electricity plants is in
part due to the inclusion of solar PV on industry
surveys.
For 2018, the declines in heat generation from
municipal waste, and heat used for electricity
generation, and the increase in electricity output
from municipal waste, are due to a change in own-
ership of a company which sold heat.
In 2017, the increase in heat production from solid
biofuels in main activity CHP plants is because
there were two additional companies reporting data.
All municipal solid waste autoproducer electricity
and heat only plants have been reclassified by Sta-
tistics Netherlands as autoproducers CHP from
2012, causing breaks in the time series.
Prior to 2008, a few small autoproducer electricity
plants using solid biofuels were included with
main activity plants for reasons of confidentiality.
In 2006, for municipal waste some plants changed
ownership and were reclassified from electricity
only to CHP plants as they started heat projects.
For biofuels and waste, all electricity and heat
produced prior to 1995 is included in CHP plants.
Electricity production from solar photovoltaic is
available from 1990.
Heat produced from biofuels and waste is availa-
ble from 1990.
Consumption
In the 2020 edition, there was a revision from 1990
to 2017 of the consumption of solid biofuels in the
residential sector.
In 2018, there were four new geothermal installa-
tions producing heat which warmed greenhouses.
As in the past, these would be categorised in the
agriculture/forestry sector.
From 2014, a better allocation of heat own use was
available for biogas digester prewarming, and in mu-
nicipal waste burning plants for flue gas cleaning.
The final consumption of solid biomass in the resi-
dential and agriculture sector increased in 2014 due
to the results of new surveys and parameters.
Direct use of geothermal heat in agriculture/
forestry starting in 2008 is due to a new project ex-
tracting deep geothermal heat. The heat produced
has been used for heating greenhouses.
New Zealand
Source
Ministry of Business, Innovation and Employment,
Wellington.
General notes
In the 2020 edition, extensive revisions were made
for the time series back to 1990. The majority of
the revisions were related to transiting the New
Zealand data system from excel based to R based.
For solar PV, the source data, Electricity Market
Information, changed their entire time series.
For the 2019 edition, the New Zealand administra-
tion submitted extensive revisions back to 1990
following an internal review of their systems and
methodologies.
Due to improved wood data collection starting
with 2016 data, increases in solid biofuels in
transformation, supply and consumption may not
be a true increase but more representative of in-
66 - RENEWABLES INFORMATION: DATABASE DOCUMENTATION (2020 Edition)
INTERNATIONAL ENERGY AGENCY
creased data survey respondents. This results in a
break in time series between 2015 and 2016.
Prior to 1994, data refer to fiscal year (April 1993
to March 1994 for 1993). From 1994 data refer to
calendar year.
Transformation
In the 2019 edition, data on electricity production
from biogases were significantly revised by the
New Zealand administration following an internal
review of systems and methodologies.
Electricity production from autoproducer geo-
thermal plants data is available from 1990.
The New Zealand administration has updated effi-
ciencies for electricity production from geother-
mal heat from 10% to 15% from 1990 onwards;
this causes a break in the time series between 1989
and 1990.
Consumption
In the 2020 edition, the repetition of data is an es-
timate by the New Zealand administration for the
consumption of biogases in the food, beverages
and tobacco sector for the years 1990 to 2018 due
to unavailability of data. The same is true for the
consumption of biogases in the commercial and
public services sector from 2007 to 2018.
In the 2018 edition, electricity consumption gen-
erated by autoproducer electricity and CHP plant
in the Commercial and public services sector for
2002 to 2016 have been estimated by the IEA Sec-
retariat, based on revised biogas data, submitted in
the Renewables and Waste questionnaire.
Data on direct use of geothermal heat are availa-
ble from 1990 and direct use of solar thermal
heat from 2002.
Norway
Source
Statistics Norway, Oslo.
General notes
Some of the data reported under solid biofuels
excluding charcoal includes charcoal. Efforts are
being made by the Norwegian administration to
separate this data in the future.
The Norwegian administration expects to revise
2017 data for biogases in the next reporting cycle.
In the 2018 edition, data for Norway were revised
back to 2010, following the introduction of a new
system for energy balances and energy accounts.
Breaks in series may appear between 2009 and
2010 as a result. For more detailed information re-
garding the methodological changes, please refer
to the documentation of statistics production since
statistics year 2010 on the Statistics Norway web-
site. At the time of writing, the document was
available in Norwegian as “Dokumentasjon av
statistikkproduksjonen fra statistikkår 2010 og
fremover”.
Prior to 2007, equal shares of renewable and non-
renewable municipal waste were estimated be-
cause the actual split was not known.
Data for industrial waste and biogases are availa-
ble from 1991.
Supply
The data for the indigenous production of biogases
is based on consumption data.
In 2014, the biodiesel production facility closed.
Liquid biofuels imports data are available starting
in 2006.
Transformation
Increased heat production from biogases and oth-
er liquid biofuels in 2018 is related to replacing
fossil fuels.
For 2017, the apparent increase in heat output
from solid biofuel-fired Main CHP plants is due to
a plant reclassification.
No data on electricity production from solar
energy are submitted separately to the IEA by the
Norwegian administration.
Breaks in the time series between 1996 and 1997
and between 2001 and 2002 and now 2009 and
2010 are due to a reclassification of main activity
producers and autoproducers. This includes the
apparent cessation of autoproducer pumped hydro
and hydro electricity generation since 2010, where
this generation has been reclassified as main activ-
ity in the 2018 edition.
In the 2016 edition, Norway corrected the indus-
trial waste consumption in heat plants, and reclas-
sified some the corresponding heat output under
other sources.
RENEWABLES INFORMATION: DATABASE DOCUMENTATION (2020 Edition) - 67
INTERNATIONAL ENERGY AGENCY
For 2003 to 2009, estimates of solar thermal col-
lector capacity were made by the IEA Secretariat
using data published in the IEA-Solar Heating and
Cooling Programme Annual Report.
Heat production from biogas data are available
from 1995.
Electricity production from wind data are availa-
ble from 1993.
Consumption
Distribution losses for biogases are included in
commercial/public services prior to 2003.
Poland
Source
Central Statistical Office, Warsaw.
General notes
Several breaks in the industrial wastes time series
are caused by difficulties in the classification of
wastes.
In the 2018 edition, solid biofuels were corrected
for 2015 data.
There is a break in time series between 2015 and
2016 for biogases due to reclassification from au-
toproducer to main activity plants.
The increases in municipal wastes starting in
2016 are related to two new plants.
Data on biodiesels are available from 2005, bio-
gasoline from 2003, and other liquid biofuels
from 2009.
In 2008, a new questionnaire was launched which
increased the coverage of renewable and waste data.
In 1993 and 1995, new estimation methodologies
were used for solid biofuels data and this creates
a break in time series between 1992/1993 and
1994/1995.
Supply
Under current Polish law, only producers and
importers of biodiesel are obliged to fulfil the
National Indicative Target of share of biofuels in
the total usage of transportation fuels. Since the
regulation is currently not applied to retail dis-
tributors they, for economic reason, rather export
the biodiesel than sell it domestically. This results
in low domestic consumption and increase of ex-
ports in 2016.
Production of other liquid biofuels increased in
2015 because new companies started to report their
biofuel production to the Polish administration.
Transformation
For 2019, the increase in electricity output from
industrial waste was in part due to the opening of
a new waste-to-energy plant in late 2018.
In 2017, heat production from autoproducer CHP
and heat plants burning municipal wastes in-
creased due to two new plants.
For plants where multiple fuels are used for elec-
tricity production, capacities are reported under the
dominant fuel.
In 2019, electricity output from solid biofuels in-
creased following the introduction of a new state
support scheme. State support for biomass co-
firing was reduced in 2016, resulting in electricity
production from solid biofuels falling during this
period.
In 2008, a number of CHP plants were reclassified
from autoproducer to main activity producer due
to an industry re-organisation.
Prior to 2010, heat supply and consumption can
include autoproducers unsold heat. Previous at-
tempts to address such issue may have caused
breaks for heat production and fuel in auto-
producer heat plants (1993) and in autoproducer
CHP plants, and for heat consumption in industry
sub-sectors.
Before 2000, industrial wastes were used inter-
changeably with light fuel oil in some plants,
which might result in breaks in the time series.
Consumption
The decrease in the consumption of biodiesel in
the road sector in 2017 is related to an unfavoura-
ble pricing scheme on the domestic market, caus-
ing consumers to choose diesel and producers to
export or blend the biodiesel they produced.
The consumption of solid biofuels in non-metallic
minerals decreased in 2017 because modern clink-
er ovens have been replacing solid biofuels with
municipal wastes.
Increases in consumption of biodiesel in 2016 are
related to a policy change in the middle of the
year.

68 - RENEWABLES INFORMATION: DATABASE DOCUMENTATION (2020 Edition)
INTERNATIONAL ENERGY AGENCY
Data for biogases refer only to the gas from fer-
mentation of biomass.
Data for direct use of geothermal heat are availa-
ble from 2000 and direct use of solar thermal heat
in commercial/public services from 2002 and in
residential from 2009.
Until 1998, data for industrial waste include oth-
er recovered gases which have to be reported in
Coal questionnaire, causing a break between 1997
and 1998.
Between 1992 and 1993, due to data availability,
there is a large increase in solid biofuels for resi-
dential, commercial/public services and agriculture/
forestry.
Portugal
Source
Direcção Geral de Energia e Geologia, Lisbon.
General notes
Charcoal data for 2018 (indigenous production
and residential sector) are delayed. Revisions are
expected in the future.
The production capacity of other liquid biofuels
for the years 2006 to 2012 are estimated by the
Portuguese administration.
Data are available from 1994 for biogases, from
1999 for municipal waste and from 2003 for in-
dustrial waste.
Data for solid biofuels were revised by the National
administration from 1990 to 2001, which may result
in breaks in time series between 1989 and 1990.
Transformation
The large decrease in electricity output from
hydro in 2017 is due to decreased rainfall.
For 2016 data onwards, heat and electricity pro-
duction from chemical sources have been reclassi-
fied as autoproducer CHP production from indus-
trial waste, causing breaks in the industrial waste
time series between 2015 and 2016.
The power station that burns industrial waste
started to work as a CHP plant in 2007, whereas
previously it was only producing electricity.
In 2007, some power plants that were previously
reported as main activity CHP have been reclassi-
fied as autoproducer CHP.
New plants fuelled by solid biofuels and by mu-
nicipal waste started in 1999.
Data for production of electricity from solar pho-
tovoltaic and wind are available from 1989.
Consumption
The use of biogasoline for blending decreased
with 2017 data because it is no longer compulsory
to use biofuels in gasoline.
Data on solid biofuels were further revised based
on a new survey on industry, resulting in breaks in
sub-sectoral consumption for 2012.
Between 2009 and 2010 a new survey on energy
consumption in households creates a break in time
series in the solid biofuels consumption in resi-
dential time series.
Data for direct use of solar thermal heat are
available from 1989 and direct use of geothermal
heat from 1994.
Slovak Republic
Source
Statistical Office of the Slovak Republic, Bratislava.
General notes
The Slovak Republic became a separate state in
1993 and harmonised its statistics to EU standards
in 2000. These two facts lead to several breaks in
time series between 1992 and 1993, and between
2000 and 2001.
Data for solar photovoltaic are available from
2010.
Prior to 2001, the data reported as industrial
waste include biogases and municipal waste.
Transformation
Electricity and heat production from combustible
fuels from 1990 to 2000 have been estimated
based on the data on fuel used for electricity
and heat plants reported in the annual fuel
questionnaires.

RENEWABLES INFORMATION: DATABASE DOCUMENTATION (2020 Edition) - 69
INTERNATIONAL ENERGY AGENCY
Prior to 2001, electricity generation from primary
solid biofuels, municipal waste and biogases are
included with industrial waste.
Consumption
Consumption of solid biofuels in the commercial
and public services sector increased because there
were many new reporting units.
Data for direct use of geothermal heat are availa-
ble from 2001 and direct use of solar thermal
heat from 2005.
Slovenia
Source
Statistical Office of the Republic of Slovenia,
Ljubljana.
General notes
Data for Slovenia are available starting in 1990.
Prior to that, they are included in Former
Yugoslavia in World Energy Statistics.
A new energy data collection system was imple-
mented in January 2001, causing some breaks in
time series between 1999 and 2000.
Consumption
Increases in consumption of biodiesel starting
from 2017 are the result of an amended energy
policy, which went into effect in mid-2017.
The break in time series between 2008 and 2009
for solid biofuels is due to revisions based on a
new household survey which is to be carried out
on an annual basis.
Direct use of solar thermal and geothermal heat
is available from 2009.
Breaks in total final consumption for industrial
waste prior to 2008 are a result of a sectoral
reclassification.
Spain
Source
Ministerio para la Transición Ecológica y el Reto
Demográfico (MITECO).
General notes
New reporting systems were implemented in 2000
and again in 2006 which resulted in a reclassifica-
tion of many plants from main activity to auto-
producer and vice versa. This leads to breaks in the
time series for the transformation sector and final
consumption sectors between 1999 and 2000 and
again between 2005 and 2006.
The Spanish administration verifies that produc-
tion and consumption of industrial waste (non-
renewable) existed from 2001 - 2017 but data are
not available. Prior to 2018 data, industrial waste
(non-renewable) data were included with solid
biofuels. A revision of the historical time series is
expected in the future.
Prior to 2018 data, other liquid biofuels data were
included with solid biofuels. A revision of the
historical time series is expected in the future.
As of the 2020 edition, the reporting methodolo-
gies for solid biofuels, biogases and solar ther-
mal are under review by the Spanish administra-
tion. Revisions are expected next cycle.
Transformation
Heat production from renewable sources is mostly
not sold to third parties but rather, used for indus-
trial purposes or consumed by heat production fa-
cilities. Revisions are expected in the 2021 edition
that include some heat production from renewable
sources.
In the 2020 edition, electricity generation for
wind was revised from 1998 – 2017
2017 is the first year that data are available for the
blending of biogas with natural gas. An update to
the time series is expected in the future.
Based on studies from the Institute of Cork, Wood
and Charcoal (IPROCOR), the efficiency of char-
coal production plants is assumed to be 20%.
Since January 2013, the tax exemption for biofuels
has expired, and the mandatory biodiesel blending
target has been reduced from 7% to 4.1%, causing
70 - RENEWABLES INFORMATION: DATABASE DOCUMENTATION (2020 Edition)
INTERNATIONAL ENERGY AGENCY
a significant decrease in the amount of pure bio-
diesel sent to blending.
From 2013 data, a revision of the industry sector of some companies causes breaks in time series for solid biofuels, municipal wastes and biogases.
A reclassification of plants from main activity to autoproducer in 2008 has led to breaks in electrici-ty production between 2008 and 2009.
The National Energy Commission reclassified plants that consume biogases, leading to breaks in time series between 2007 and 2008.
Data for electricity from solar thermal plants are available from 2007.
Prior to 2006, inputs of biogases used to generate process heat by autoproducers were included as inputs to transformation when they should have been reported in the appropriate industry in final
consumption.
From 2005, residential rooftop solar photovoltaic electricity production data are included in main ac-tivity electricity plants according to the Spanish administration classification; previously they were reported under autoproducer.
Electricity production from wind and solar are reported from 1989 when data became available.
Consumption
Increased consumption of biofuels from 2016 to
2017 is a result of increased demand for motor
gasoline/diesel.
Prior to 2006, inputs of biogases used to generate
process heat were erroneously included as inputs to
transformation when they should have been report-
ed in the appropriate industry in final consumption.
The breakdown of solid biofuels direct use in the
industry sector prior to 1999 is not available.
Data for direct use of geothermal and solar thermal
heat are available from 1990.
Sweden
Sources
Statistics Sweden, Örebro.
Swedish Energy Agency, Eskilstuna.
General notes
New data in the 2020 edition for biodiesel in in-
dustry, transport and other sectors for 2005 –
2017 are related to a new survey.
There are some breaks in time series between 2015
and 2016 in pumped hydro, industrial waste and
other liquid biofuels figures due to the lack of da-
ta. The figures are expected to be modified in the
2018 edition.
From 1990 to 2006, municipal waste was reported
as 60% non-renewable and 40% renewable. In
2007, reanalysis of the waste revealed the content
was 40% non-renewable and 60% renewable. This
was reanalysed again starting from 2016 data, when
the result of the analysis revealed the split should be
52% renewable and 48% non-renewable. This re-
sults in breaks in the time series between 2006 and
2007 and also 2015 and 2016 for both renewable
and non-renewable municipal waste.
In the 2018 edition, data for biodiesels were re-
vised from 2006 to 2015 while biogasoline and
bioethanol were revised from 2005 to 2015. The
revisions affected indigenous production due to in-
creased information about net trade, as well as the
transformation sector, for blending with motor
gasoline/diesel/kerosene and consumption in the
road sector.
Supply
Due to a change of tax regulations in 2017, it was
no longer profitable to produce fatty acid methyl
ester (FAME) in the same capacity as before, so
there was a drop in biodiesel production. This
drop in production was substituted by imports to
meet increased demand.
In the 2019 edition, trade data for municipal
wastes was included starting with 2002 data.
In the 2018 edition, trade data were added for
primary solid biofuels starting from 2012. As the
net trade used to be reported together with indige-
nous production, this has resulted in a downward
revision of indigenous production for 2012 – 2015.
Transformation
For 2019p, electricity and heat production data
are based on surveys which do not have the same
coverage as the annual survey. Therefore data are
provisional and subject to revision. In particular,
due to this difference in coverage, the distribution
of output across combustible fuels shows breaks in
series compared with data for previous years.
RENEWABLES INFORMATION: DATABASE DOCUMENTATION (2020 Edition) - 71
INTERNATIONAL ENERGY AGENCY
For 2017, electricity production and capacity for
hydro plants are reported according to a revised
methodology. As a result, breaks occur between
2016 and 2017. Prior to 2017, the production and
capacity of mixed hydro plants are split between
pure hydro and pure pumped storage. Historical
revisions are pending.
Heat production from solid biofuels in autoproducer
CHP includes waste heat and chemical heat.
For 2012 and 2013, small quantities of bio-
methanol used to produce electricity are included
in other liquid biofuels, under production, as well
as input and output of autoproducer CHP.
Prior to 1992, data on electricity production from
biogases are included with solid biofuels.
Consumption
Increased consumption of biogases in the industry
sector in 2018 was because several industries
switched from natural gas to biogases.
Changes in tax regulations as of 1 July, 2018 has contributed to decreased consumption of biodiesel
in 2018 data.
Due to confidentiality issues, solid biofuels con-sumption in food, beverages and tobacco is report-ed with paper, pulp and printing for 2014 data.
Consumption data by sector for biogases are available from 2011.
In 2011, there was a change in the reporting meth-odology for consumption of solid biofuels and
waste in the residential sector, which is responsi-ble for breaks in concerned time series between
2010 and 2011.
Data on direct use of solar thermal are available from 1989.
For biogases, the residential sector is used as a
residual.
Switzerland
Sources
Swiss Federal Office of Energy (SFOE), Ittigen.
Carbura, Swiss Organisation for Stockholding of
Liquid Fuels, Zurich.
General note
From 1999, data on consumption result from a
new survey and are not comparable with data of
previous years.
Supply
Due to favourable taxation in Switzerland, the im-
ports of biodiesel and bioethanol intended to be
blended with oil products increased significantly
from 2016 to 2017.
Due to a new program launched in September
2014 in which CO2 emissions due to traffic can be
compensated by substituting fossil gasoline and
diesel by biofuels, the imports and road consump-
tion of biodiesels and biogasoline increased sharp-
ly starting in 2015.
Transformation
In the 2020 edition, some significant revisions
were in industrial waste (non-renewable) from
2013 to 2015 for fuel input to autoproducer CHP
plants because one plant operator corrected its fuel
input.
The capacity reported for biogases only refers to
the sum of capacities of landfill and sewage
sludge gas.
In 2016, two new pumped hydroelectric plants
went into operation.
In 2015, the big decrease seen in electricity and
heat production from industrial wastes is due to
one large main activity CHP plant significantly re-
duced their activity. In 2016, this plant was fully
shut down.
From 2012, the municipal waste autoproducer
plant previously reported as electricity plant met
the CHP requirements and was reclassified as such.
Biogas is no longer being used for heat production
as of 2011.
The autoproducer heat plant that produced heat for
sale using municipal waste was closed in 2006.
Electricity production from wind data are available
from 1996 and from 1990 for solar photovoltaic.
Consumption
Starting in 2018, several agricultural biogas plants
installed a system to measure heat production.
Previously, it was estimated. Due to measure-
ments, they realised they produce much more heat

72 - RENEWABLES INFORMATION: DATABASE DOCUMENTATION (2020 Edition)
INTERNATIONAL ENERGY AGENCY
than estimated. This creates a break in series be-
tween 2017 and 2018 data.
Consumption data for biogases in the transport
sector are available from 1996 to 2012 as a biogas
fuel station had stopped selling biogas in 2013.
Data for direct use of geothermal heat and solar
thermal heat are available from 1990.
Turkey
Source
Ministry of Energy and Natural Resources (Enerji ve
Tabii Kaynaklar Bakanlığı), Ankara.
General notes
The Turkish administration only intermittently
surveys renewables and waste used for power
and heat. Due to this fact, some breaks may appear
in the biofuels and waste time series.
In the 2006 edition, the Turkish Statistical Office
started providing electricity and heat output on the
basis of a new survey that revised time series back
to 2000. This causes breaks in the time series be-
tween 1999 and 2000. Not all of the input time se-
ries have been revised.
In 1995, the Turkish administration reclassified auto-
producer plants by type and source to be consistent
with IEA definitions. This caused breaks between
1994 and 1995 for electricity production.
Transformation
Biodiesel blending with diesel increased in 2018
because there was a new policy requiring that die-
sel be blended with 5% biodiesel.
In 2017, the increase in electricity production
from solar PV main activity producers is related to
new plants coming online, mostly unlicensed.
In 2017, the increase in electricity production in
main activity producers burning solid biofuels is
related to new plants.
Data on electricity generated from biofuels are
available from 1991.
Electricity production from wind is available start-
ing in 1998.
Consumption
Starting with 2018 data, new sub-sector data in the
industry sector for industrial waste (non-
renewable) and solid biofuels is available as a re-
sult of a new survey. Backward revisions will not
be available in the future.
Prior to 1998, consumption in the wood and wood
products sector includes that of the paper, pulp
and printing industry.
United Kingdom
Source
Department for Business, Energy and Industrial Strat-
egy (BEIS), London.
General notes
In the 2017 edition, the UK government revised
the data time series for municipal waste and solid
biofuels back to 2001. As a result, breaks in time
series may occur between 2000 and 2001.
The launch of a feed-in-tariff scheme in April
2010 resulted in a rapid increase of capacity and
corresponding electricity production growth from
solar PV in the following years
Supply
Data for indigenous production and inland con-
sumption (calculated) of industrial waste (non-
renewable) have been estimated by the IEA Sec-
retariat for 2019p.
In 2009, the biogasoline production was above the
reported production capacity. This is because of
the fact that the capacity had reduced at the end of
the year, due to closure.
Transformation
Data for off-grid solar PV are currently not avail-
able in the United Kingdom but the addition of this
data is expected in the future.
From 2015, the UK administration started collecting
data from the main activity solar PV companies. Pri-
or to this, all data were included under autoproducers.
The consumption of solid biofuels has increased
in 2015, as the largest power station in the UK
half-way through the year converted a further unit
from coal to biomass, plus the previously convert-
ed unit had a full year of operation in 2015 rather
than just the last few months of 2014.
RENEWABLES INFORMATION: DATABASE DOCUMENTATION (2020 Edition) - 73
INTERNATIONAL ENERGY AGENCY
Prior to 2013, due to data confidentiality reasons,
one or two main-activity municipal waste plants
had to be included within the autoproducer plant
category. Since 2013, as there have been at least
three main-activity companies, these plants have
been reclassified from autoproducer plant to main
activity electricity plant, with some CHP plants in-
cluded under main electricity due to confidentiality
reasons.
New data for electricity production from main ac-
tivity electricity wind plant became available in
2007.
Heat production started to be reported from 2008
onward.
Electricity production data for solar PV are avail-
able from 1999.
Consumption
In the 2018 edition, following a review of the con-
sumption of biogases and municipal wastes for
2015 and 2016 data, data that were allocated to
other sectors have been reallocated to the industry
sectors. This has caused a break in time series be-
tween 2014 and 2015. A review prior to 2015 is
expected in the next cycle.
The UK administration undertook a survey of do-
mestic wood consumption in 2015 and revised fig-
ures back to 2008. This resulted in breaks in time
series for solid biofuels consumption in residential
sector between 2007 and 2008.
United States
Source
U.S. Energy Information Administration, Washington DC.
General notes
Starting with 2017 data, electricity production and
capacity data include Puerto Rico.
The EIA assumes all industrial waste is non-
renewable.
Capacity is net summer capacity.
Due to the change in reporting methodology for
liquid biofuels, breaks in time series occur be-
tween 2009 and 2010. This is especially noticeable
in the biodiesel time series.
Solar PV electricity production reported for main
activity producers refers only for grid-connected
central power stations. The IEA Secretariat esti-
mated US photovoltaic (PV) electricity generation
from autoproducers starting in 1999 by multiply-
ing the dispersed and distributed PV capacity es-
timated by the US administration by an average
capacity factor of 12%. The capacity factor was
based on a report published in 2007 by the IEA
Photovoltaic Power Systems Programme, Cost and
Performance Trends in Grid-Connected Photo-
voltaic Systems and Case Studies.
Geothermal supply and inputs to transformation
data are estimated by the IEA Secretariat starting
in 2009 because of efficiency discrepancies.
Data on liquid biofuels became available in 1993.
Data on industrial waste and gas from biomass for
1990 and 1991 were estimated by IEA Secretariat.
Supply
Indigenous production of industrial waste has
been decreasing since May 2014 due to reclassifi-
cation, resulting in a break in series between 2013
and 2014.
Indigenous production of biodiesel is estimated by
the IEA Secretariat in 2010 based on the EIA’s
Monthly Energy Report.
Transformation
The EIA collects generation and consumption data
from all plants 1 MW or more in capacity.
Offshore wind production began in 2016.
Starting in 2015, many plants did not report indus-
trial waste capacity as a primary energy source.
This results in break in time series between 2014
and 2015.
From 2007 to 2009, industrial waste includes
recovered heat from industrial processes. From
2010, the electricity produced from recovered heat
is reported under other sources.
The solar collector surface figures are estimated
by IEA Secretariat from 2010 – 2015, and by the
EIA since 2016.
In the 2009 edition, the US administration changed
their methodology for calculating heat production in
CHP plants, and revised data back to 2006. This leads
to breaks in time series between 2005 and 2006.
For the United States, prior to 2000, autoproducers
include small and independent power producers,

74 - RENEWABLES INFORMATION: DATABASE DOCUMENTATION (2020 Edition)
INTERNATIONAL ENERGY AGENCY
which under IEA definitions are considered main
activity producers.
Prior to 1999, solar thermal electricity produc-
tion includes generation from natural gas because
some natural gas units are attached to solar
thermal plants and their production could not be
separated.
In the 2003 edition, the US administration reclassi-
fied some plants to autoproducers. This reclassifi-
cation causes more breaks between 1998 and 1999.
Heat production data for solid biofuels became
available in 1991.
Consumption
There is a break in series for geothermal and so-
lar thermal direct use data between 2017 and
2018 as a new methodology for reporting these
data was adopted with 2018 data. There is an ad-
ditional break in series between 2018 and 2019p
data for geothermal direct use data because the
methodology changed again.
Due to an improved estimation methodology, there
are some breaks in time series of the industrial and
other sectors between 2009 and 2010 for many
fuels types: For the industrial sector, this can be
found in geothermal, biogases and industrial
waste (paper, pulp and printing). For other sectors,
breaks can be shown in geothermal and solar
thermal.
Prior to 2008, heat produced by heat pumps was
reported as geothermal use in residential and
commercial/public services.
Direct use of solar thermal heat in residential is
available from 1999.
Due to problems in reporting, there are numerous
breaks in time series for the US data, particularly
in 1992, 1999, 2001 and 2002. Care should be tak-
en when evaluating consumption by sector since
inputs of fuel to autoproducers are included in
final consumption for some years. No data are
available for most energy products in the construc-
tion and mining and quarrying industries.
RENEWABLES INFORMATION: DATABASE DOCUMENTATION (2020 Edition) - 75
INTERNATIONAL ENERGY AGENCY
7. UNITS AND CONVERSIONS
Primary energy conventions
When constructing an energy balance, it is necessary
to adopt conventions for primary energy from several
sources, such as nuclear, geothermal, solar, hydro,
wind, etc. The two types of assumptions that have to
be made are described below.
Choice of the primary energy form
For each of these sources, there is a need to define the
form of primary energy to be considered; for instance,
in the case of hydro energy, a choice must be made
between the kinetic energy of falling water and the
electricity produced. For photovoltaic electricity, the
choice is between the solar radiation received and the
electricity produced.
The principle adopted by the IEA is that the primary
energy form should be the first energy form down-
stream in the production process for which multiple
energy uses are practical. The application of this prin-
ciple leads to the choice of the following primary en-
ergy forms:
Heat from geothermal and solar thermal;
Electricity from hydropower, wind, tide/wave/
ocean and solar photovoltaic.
Calculation of the primary energy equivalent
There are essentially two methods that can be used to
calculate the primary energy equivalent of the above
energy sources: the partial substitution method and the
physical energy content method.
The partial substitution method: In this method, the
primary energy equivalent of the above sources of
electricity generation represents the amount of energy
that would be necessary to generate an identical
amount of electricity in conventional thermal power
plants. The primary energy equivalent is calculated
using an average generating efficiency of these plants.
This method has several shortcomings, including the
difficulty in choosing an appropriate generating effi-
ciency and the fact that the partial substitution method
is not relevant for countries with a high share of hy-
droelectricity. For these reasons, the IEA has, as most
of the international organizations have, adopted the
physical energy content method.
The physical energy content method: This method
uses the physical energy content of the primary ener-
gy source as the primary energy equivalent. As a con-
sequence, there is an obvious link between the princi-
ples adopted in defining the primary energy forms of
energy sources and the primary energy equivalent of
these sources.
For instance, in the case of solar thermal and geo-
thermal electricity production, where heat is selected
as the primary energy form by the IEA, the primary
energy equivalent is the quantity of heat generated in
the geothermal or solar thermal plant for electricity
generation. In the case of hydropower, wind, tide and
solar PV, where electricity is selected as the primary
energy form, the primary energy equivalent is the
physical energy content of the electricity generated in
the plant, which amounts to assuming an efficiency of
100%.
For geothermal, if no country-specific information
was reported, the primary energy equivalent is calcu-
lated as follows:
10% for geothermal electricity
50% for geothermal heat
33% for solar thermal electricity
100% for solar thermal heat
Since these two types of energy balances differ signif-
icantly in the treatment of electricity from solar,
hydro, wind, etc., the share of renewables in total
76 - RENEWABLES INFORMATION: DATABASE DOCUMENTATION (2020 Edition)
INTERNATIONAL ENERGY AGENCY
energy supply will appear to be very different depend-
ing on the method used. As a result, when looking at
the percentages of various energy sources in total
supply, it is important to understand the underlying
conventions that were used to calculate the primary
energy balances.
Units
Original units
Electricity is expressed in gigawatt hours and heat is
expressed in terajoules.
Non-combustible renewables have original units of
their primary energy form (see Primary energy con-
ventions for the primary energy form of non-
combustible renewables).
Primary solid biofuels, biogases, municipal waste, and
industrial waste are presented in their original units in
terajoules on a net calorific basis. The Secretariat
does not receive information on volumes and other
characteristics of these fuels.
Liquid biofuels and charcoal have original units in
1000 tonnes.
Energy balance units
The IEA energy balance methodology is based on the
net calorific content of the energy commodities and a
common unit of account. The unit of account adopted
by the IEA is the tonne of oil equivalent (toe) which is
defined as 107 kilocalories (41.868 gigajoules). This
quantity of energy is, within a few percent, equal to
the net heat content of 1 tonne of crude oil. Through-
out this publication 1 tonne means 1 metric ton or
1000 kg.
Conversion (from original units to toe)
The change from using the original units to tonnes of
oil equivalent implies choosing coefficients of equiva-
lence between different forms and sources of energy.
This problem can be approached in many different
ways. For example, one could adopt a single equiva-
lence for each major primary energy source in all coun-
tries, e.g. 29 307 kJ/kg (7 000 kcal/kg) for hard coal,
41 868 kJ/kg (10 000 kcal/kg) for oil, etc.
The main objection to this method is that it results in
distortions since there can be a wide spread between
calorific values of fuels (i.e. liquid biofuels) in differ-
ent countries.
For charcoal, biogasoline, biodiesels and other liquid
biofuels, specific factors have been used for production,
imports and exports based on consultations with
experts from the national administrations.
The balances are expressed in terms of “net” calorific
value. The difference between the “net” and the
“gross” calorific value for each fuel is the latent heat
of vaporisation of the water produced during combus-
tion of the fuel. For coal and oil, net calorific value is
about 5% less than gross, for most forms of natural
and manufactured gas the difference is 9-10%, while
for electricity and heat there is no difference as the
concept has no meaning in this case. The use of net
calorific value is consistent with the practice of the
Statistical Offices of the European Communities and
the United Nations.
Electricity data are converted from original units of
gigawatt hours to million tonnes of oil equivalent
using the relationship: 1 terawatt hour = 0.086 Mtoe.
Biofuels and waste
Data for primary solid biofuels, biogases, municipal
waste and industrial waste are converted from original
units in terajoules to energy balance units in tonne of
oil equivalent using 1 terajoule = 0.00002388 Mtoe.
Data for charcoal and liquid biofuels are converted
from original units in tonnes to energy balance units
in tonne of oil equivalent using the average net calo-
rific values given at the end of this section. Unless
country-specific information has been provided, data
are converted using the following average net calorific
values:
Charcoal: 30 800 kJ/kg
Biogasoline: 26 800 kJ/kg
Biodiesels: 36 800 kJ/kg
Other liquid biofuels: 36 800 kJ/kg
Electricity
Figures for electricity production, trade, and final con-
sumption are calculated using the energy content of the
electricity (i.e. at a rate of 1 TWh = 0.086 Mtoe).
RENEWABLES INFORMATION: DATABASE DOCUMENTATION (2020 Edition) - 77
INTERNATIONAL ENERGY AGENCY
Hydroelectricity production and electricity produced
by other non-thermal means (wind, tide/wave/ocean,
photovoltaic, etc.) are accounted for similarly using
1 TWh = 0.086 Mtoe.
The primary energy equivalent of nuclear electricity is
calculated from the gross generation by assuming a 33%
conversion efficiency, i.e. 1 TWh = (0.086 ÷ 0.33) Mtoe.
In the case of electricity produced from geothermal
heat, if the actual geothermal efficiency is not known,
then the primary equivalent is calculated assuming an
efficiency of 10%, so 1 TWh = (0.086 ÷ 0.1) Mtoe.
Heat
Information on heat is supplied in terajoules (TJ) and
1 TJ = 0.00002388 Mtoe.
In the case of heat produced in a geothermal plant, if the
actual geothermal efficiency is not known, then the pri-
mary equivalent is calculated assuming an efficiency
of 50%, so 1 TWh = (0.086 ÷ 0.5) Mtoe.
For direct use of geothermal and solar thermal heat,
all the heat consumed is accounted for in production
and consumption.
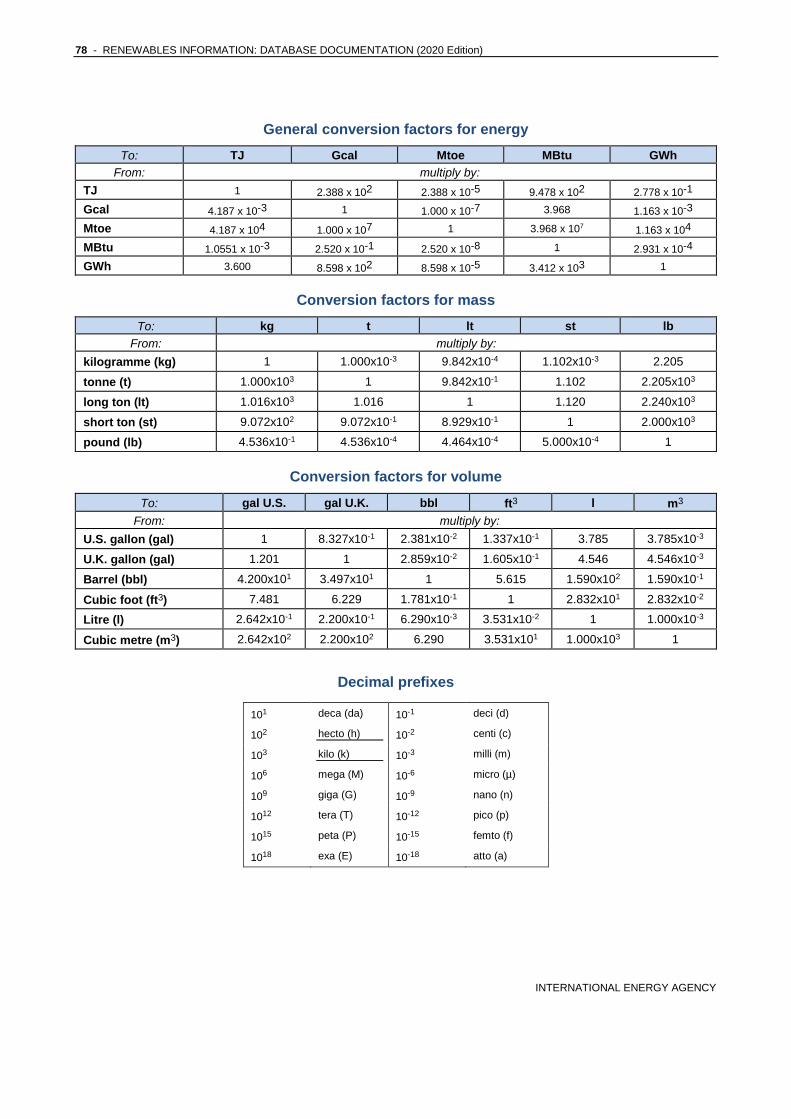
78 - RENEWABLES INFORMATION: DATABASE DOCUMENTATION (2020 Edition)
INTERNATIONAL ENERGY AGENCY
General conversion factors for energy
To: TJ Gcal Mtoe MBtu GWh
From: multiply by:
TJ 1 2.388 x 10² 2.388 x 10⁻⁵ 9.478 x 10² 2.778 x 10⁻¹
Gcal 4.187 x 10⁻³ 1 1.000 x 10⁻⁷ 3.968 1.163 x 10⁻³
Mtoe 4.187 x 10⁴ 1.000 x 10⁷ 1 3.968 x 10⁷ 1.163 x 10⁴
MBtu 1.0551 x 10⁻³ 2.520 x 10⁻¹ 2.520 x 10⁻⁸ 1 2.931 x 10⁻⁴
GWh 3.600 8.598 x 10² 8.598 x 10⁻⁵ 3.412 x 10³ 1
Conversion factors for mass
To: kg t lt st lb
From: multiply by:
kilogramme (kg) 1 1.000x10⁻³ 9.842x10⁻⁴ 1.102x10⁻³ 2.205
tonne (t) 1.000x10³ 1 9.842x10⁻¹ 1.102 2.205x10³
long ton (lt) 1.016x10³ 1.016 1 1.120 2.240x10³
short ton (st) 9.072x10² 9.072x10⁻¹ 8.929x10⁻¹ 1 2.000x10³
pound (lb) 4.536x10⁻¹ 4.536x10⁻⁴ 4.464x10⁻⁴ 5.000x10⁻⁴ 1
Conversion factors for volume
To: gal U.S. gal U.K. bbl ft3 l m3
From: multiply by:
U.S. gallon (gal) 1 8.327x10⁻¹ 2.381x10⁻² 1.337x10⁻¹ 3.785 3.785x10⁻³
U.K. gallon (gal) 1.201 1 2.859x10⁻² 1.605x10⁻¹ 4.546 4.546x10⁻³
Barrel (bbl) 4.200x101 3.497x101 1 5.615 1.590x10² 1.590x10⁻¹
Cubic foot (ft3) 7.481 6.229 1.781x10⁻¹ 1 2.832x101 2.832x10⁻²
Litre (l) 2.642x10⁻¹ 2.200x10⁻¹ 6.290x10⁻³ 3.531x10⁻² 1 1.000x10⁻³
Cubic metre (m3) 2.642x10² 2.200x10² 6.290 3.531x101 1.000x10³ 1
Decimal prefixes
101 deca (da) 10-1 deci (d)
102 hecto (h) 10-2 centi (c)
103 kilo (k) 10-3 milli (m)
106 mega (M) 10-6 micro (µ)
109 giga (G) 10-9 nano (n)
1012 tera (T) 10-12 pico (p)
1015 peta (P) 10-15 femto (f)
1018 exa (E) 10-18 atto (a)
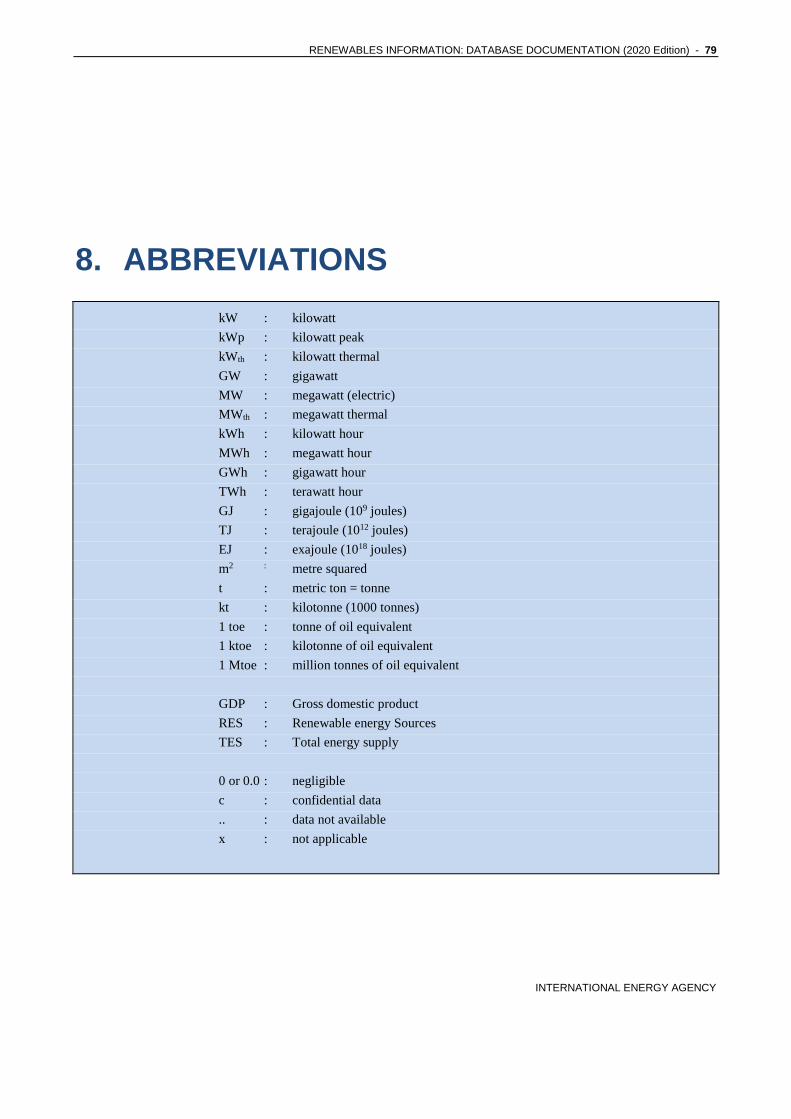
RENEWABLES INFORMATION: DATABASE DOCUMENTATION (2020 Edition) - 79
INTERNATIONAL ENERGY AGENCY
8. ABBREVIATIONS
kW : kilowatt
kWp : kilowatt peak
kWth : kilowatt thermal
GW : gigawatt
MW : megawatt (electric)
MWth : megawatt thermal
kWh : kilowatt hour
MWh : megawatt hour
GWh : gigawatt hour
TWh : terawatt hour
GJ : gigajoule (109 joules)
TJ : terajoule (1012 joules)
EJ : exajoule (1018 joules)
m2 : metre squared
t : metric ton = tonne
kt : kilotonne (1000 tonnes)
1 toe : tonne of oil equivalent
1 ktoe : kilotonne of oil equivalent
1 Mtoe : million tonnes of oil equivalent
GDP : Gross domestic product
RES : Renewable energy Sources
TES : Total energy supply
0 or 0.0 : negligible
c : confidential data
.. : data not available
x : not applicable