renewable energy technology road-mapping · •resource maps renewable energy resources solar wind...
TRANSCRIPT

Renewable Energy Technology Road-mapping
Assessment of Renewable Energy Technologies using Multi-Criteria Decision-Analysis
A.G.T. Sugathapala, K.A.C. Seneviratne, S.A.G.C. Subasinghe, W.D.A.G.K. Katugaha
Sri Lanka Sustainable Energy Authority

CONTENT
▪ Renewable Energy Exploration
▪ Renewable Energy Resources
▪ Resource Maps
▪ Resource Inventories
▪ Technology Road-Mapping
▪ Resource Technology Options Prioritization
▪ Analytical Hierarchical Process
▪ Weighted Sum Matrix Model
▪ Illustration Example
▪ Discussion
2
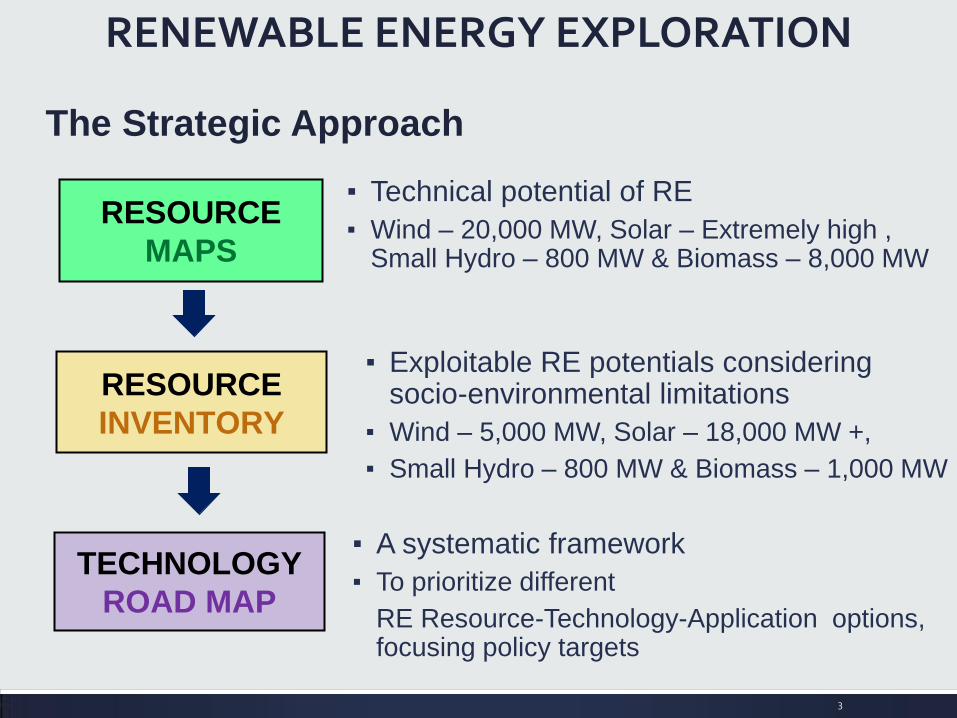
RESOURCE
MAPS
▪ Technical potential of RE
▪ Wind – 20,000 MW, Solar – Extremely high , Small Hydro – 800 MW & Biomass – 8,000 MW
RESOURCE
INVENTORY
TECHNOLOGY
ROAD MAP
RENEWABLE ENERGY EXPLORATION
The Strategic Approach
▪ Exploitable RE potentials considering socio-environmental limitations
▪ Wind – 5,000 MW, Solar – 18,000 MW +,
▪ Small Hydro – 800 MW & Biomass – 1,000 MW
▪ A systematic framework
▪ To prioritize different
RE Resource-Technology-Application options, focusing policy targets
3

• Resource Maps
RENEWABLE ENERGY RESOURCES
Solar
Wind
Hydro
Biomass – Dendro Plantations
(kWh/m2/yr)
Very Good
Restricted Areas
Poor
Moderate
Good
Excellent
Hydro Potential
Areas
River Network
1,790 – 1,840
1,247 – 1,556
1,557 – 1,653
1,654 – 1,727
1,728 – 1,789
2,006– 2,106
1,841 – 1,899
1,890 – 1,932
1,923 – 1967
1,968– 2,005
4
< 50,000
100,001 – 150,000
> 200,000
50,001 – 100,000
150,001 – 200,000
Tons per Annum
Sources : NREL and SLSEA Resource Maps
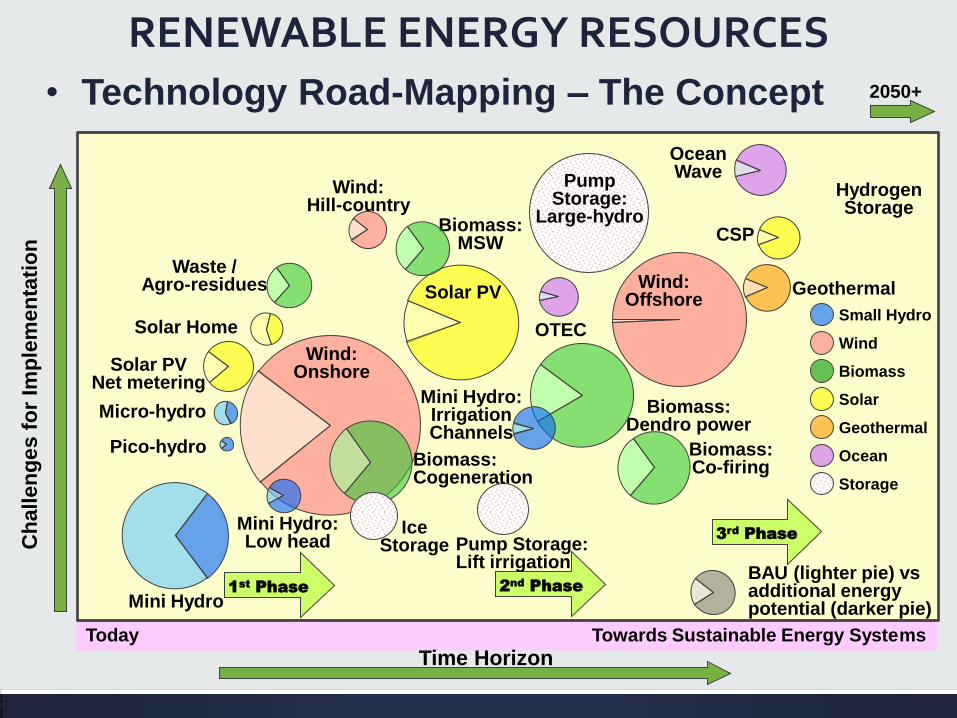
• Technology Road-Mapping – The Concept
RENEWABLE ENERGY RESOURCES
5
Today Towards Sustainable Energy Systems
Micro-hydro
Waste / Agro-residues
Mini Hydro
Wind: Offshore
Ocean Wave
Geothermal
BAU (lighter pie) vs additional energy potential (darker pie)
Ch
allen
ges f
or
Imp
lem
en
tati
on
Time Horizon
3rd
Phase
1st
Phase 2nd
Phase
Solar PV Net metering
Pico-hydro
Solar Home
Biomass: Dendro power
Mini Hydro: Irrigation Channels
OTEC
Biomass: MSW
Solar PV
Wind: Hill-country
Pump Storage:
Large-hydro
Pump Storage: Lift irrigation
Ice Storage
Wind: Onshore
Biomass: Cogeneration
Mini Hydro: Low head
Small Hydro
Wind
Biomass
Solar
Geothermal
Ocean
CSP
Storage
Biomass: Co-firing
Hydrogen Storage
2050+

RESOURCE-TECHNOLOGY-OPTIONS
▪ Evaluation of RE resource-technology- options in terms of implementation difficulty and planning period
▪ Prioritization based on the Multi-Criteria Decision-Analysis (MCDA)
a. Analytical Hierarchical Process (AHP)
&
b. Weighted Sum Matrix (WSM)
PRIORITIZATION
6

To assess the implementation difficulties of renewable resource for electricity generation Goal
Criteria Technical Financial Social Environmental Other
Sub-
criteria
Grid Availability
Dispatch flexibility
Technology
Transfer
Technology cost-
Investment
Life Cycle Cost
Financing
Availability
Social Acceptance
Life Cycle Cost
Socio-Economic
Impact
Outdoor Air
Quality
Green House Gas
Mitigation
Opportunity
WLB Impact
Land Availability
National Policies
and Strategies
Institutional
Arrangements
Information
Alternatives
Hydro
Mini Micro Low
head
Wind
On-Grid Complex
Terrain
Off
Shore On
Shore
Biomass
On Grid Off
Grid MSW
Solar
CSP PV Off
Grid
1. Problem Decomposition
a. ANALYTICAL HIERARCHICAL PROCESS (AHP)
7

2. Comparative analysis
- Pair wise comparison of sustainability criteria
3. Computation of Priority Values
a. ANALYTICAL HIERARCHICAL PROCESS cont..
b. WEIGHTED SUM MATRIX MODEL
8
• Evaluate Technology Options

ILLUSTRATION EXAMPLE : GRAPHICAL REPRESENTATION
0.000
0.100
0.200
0.300
0.400
0.500
0.600
0.700
0.800
0.900
1.000
2010 2020 2030 2040 2050
Implementation Difficulty
Time (Development Periods)
Solar CSP
Solar PV
WindOnshore
Small Hydro
MSW
High
Low
Prioritization of RE resource-technology-options
9
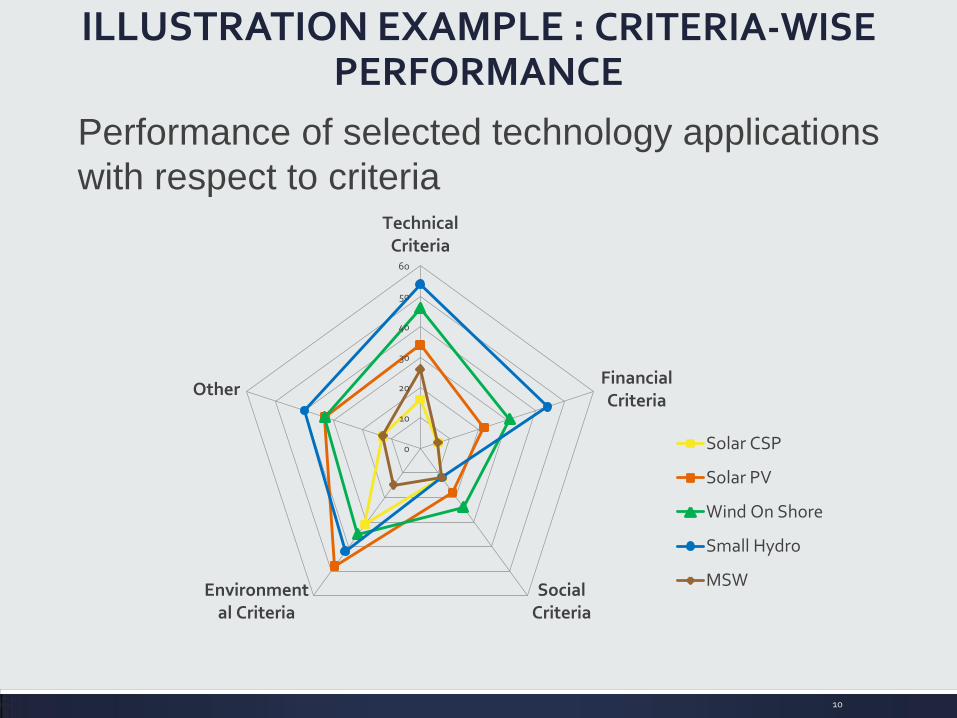
ILLUSTRATION EXAMPLE : CRITERIA-WISE PERFORMANCE
0
10
20
30
40
50
60
TechnicalCriteria
FinancialCriteria
SocialCriteria
Environmental Criteria
Other
Solar CSP
Solar PV
Wind On Shore
Small Hydro
MSW
Performance of selected technology applications
with respect to criteria
10
DISCUSSION ▪ Effective tool for policy makers and planners
▪ Comprehensive understanding about the RE resource-tech-applications is required
▪ Should be supported by data/literature information
▪ Difficulty of selecting mutually independent sub criteria for two axis (Implementation difficulty & Deployment period)
▪ Importance of engagement of stakeholders throughout this process
▪ Monitoring and evaluating mechanism, feedback for continuous improvement
11
Acknowledgements for the organizers of ACEF 2015

Computation of Priority Values
Technical Financial Social Environ-
mental Other
Normalized
Eigen
Vectors
Technical 1.00 2.00 3.00 4.00 5.00 0.429
Financial 0.50 1.00 2.00 2.00 3.00 0.236
Social 0.33 0.50 1.00 1/2 3.00 0.125
Environmental 0.25 0.50 2.0 1.00 2.00 0.143
Other 0.20 0.33 0.33 0.50 1.00 0.067
Normalized
Eigen
Vectors
0.2
0.2
0.2
0.2
0.2
Weights of
sustainable
criteria
Equally
distribution
of Weights
12
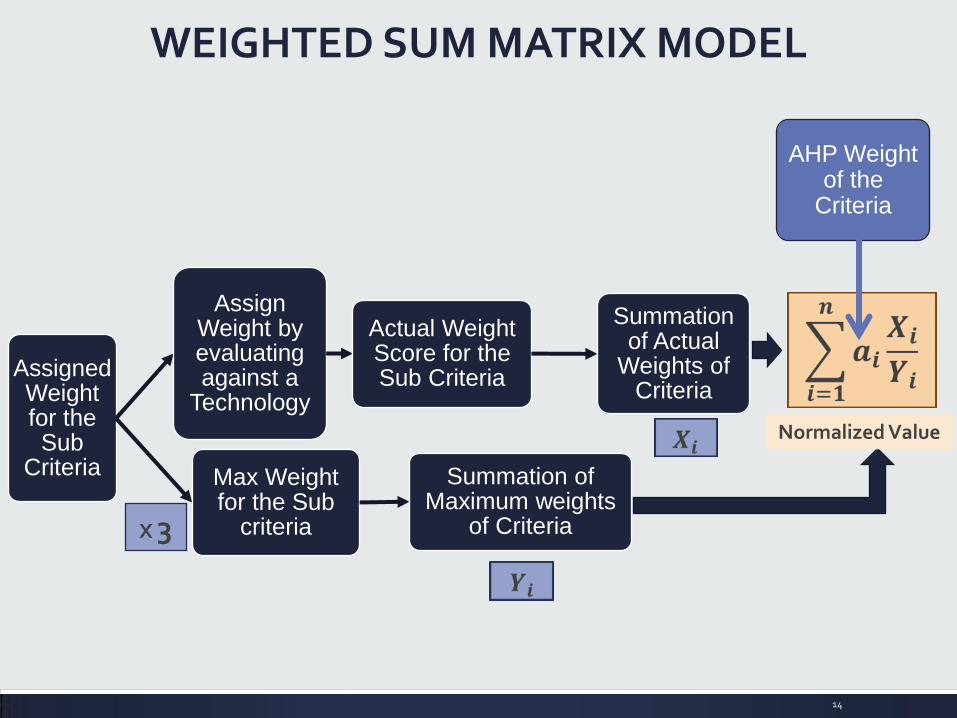
14
Assigned Weight for the Sub
Criteria
Assign Weight by evaluating against a
Technology
Actual Weight Score for the Sub Criteria
Summation of Actual
Weights of Criteria
Max Weight for the Sub
criteria
Summation of Maximum weights
of Criteria X 3
AHP Weight of the
Criteria
Normalized Value
WEIGHTED SUM MATRIX MODEL