renewable energy potential for winter...
TRANSCRIPT

M A T T H E W L A M B E R T G P H 9 0 4
RENEWABLE ENERGY POTENTIAL FOR WINTER ISLAND, SALEM, MA

OBJECTIVE
• To determine the potential for wind and solar energy
generation for Winter Island, Salem, MA
http://02809photo.com/2012/01/22/one-frigid-light-fort-pickering-winter-island-salem-massachusetts

BACKGROUND
-

COMMUNITY INFORMATION
Salem, MA
• Essex County
• Land Area: 8.10 square miles
• Water Area: 9.95 square miles
• Population: 40,407
(U.S.Census 2000)
• Density: 4,986 per sq. mile
• 750MW coal fired (soon to be
natural gas) power plant adjacent
to study area
Winter Island
• City Park with a beach, boat
launch and campsites
• ~ 45 acres in land area
• Site of historic Fort Pickering
• Chosen for analysis based strictly
on curiosity

DATA
• MassGIS Data - 2010 Census Blocks, Block Groups, and Tracts data
• MassGIS Data - Digital Terrain Model (DTM) Files
• MassGIS Data - Modeled Wind Speed Grids (70 meter)
• ArcGIS Data - World Imagery Base Map (satellite imagery)
• Projected Coordinate System: NAD_1983_StatePlane_Massachusetts_Mainland_FIPS_2001
• Datum:
D_North_American_1983
METHODS
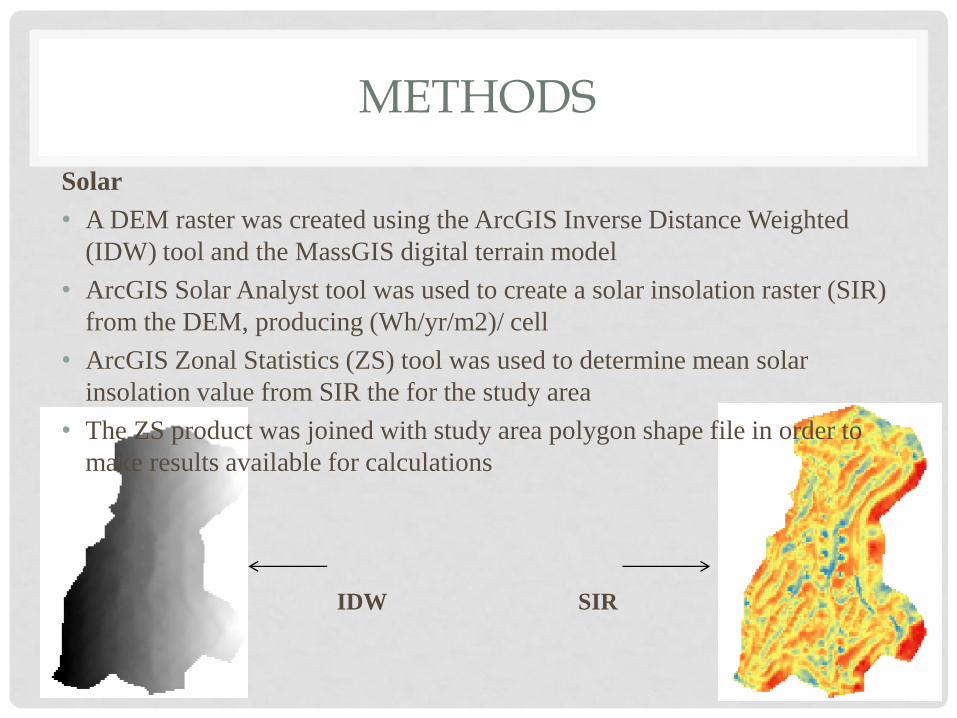
Solar
• A DEM raster was created using the ArcGIS Inverse Distance Weighted
(IDW) tool and the MassGIS digital terrain model
• ArcGIS Solar Analyst tool was used to create a solar insolation raster (SIR)
from the DEM, producing (Wh/yr/m2)/ cell
• ArcGIS Zonal Statistics (ZS) tool was used to determine mean solar
insolation value from SIR the for the study area
• The ZS product was joined with study area polygon shape file in order to
make results available for calculations
IDW SIR

Winter Island
• 20 % of shape area was used for
deterring solar potential based on
land area, not building outlines
• Some of the buildings are not
structurally sound
• Largest building is an airplane
hanger with an irregularly roof

SOLAR CALCULATIONS
Constraints
• 20% of the shape area of polygon was used
• 12% deducted for transmission efficiency
• 55% deducted for cloud cover (NOAA)
Calculations
(mean Wh) x ( shape area m2 x.20)= Wh/ year
/1000=kWh
x 0.12
x 0.55
/10,000 = potential house holds supplied

Winter Island Wind Turbines
• 3 Vestas V80 wind turbines
• Rated power 1.8 MW
• Hub height 80m
• Blade length 49m
http://easywindenergy.blogspot.com/2013/05/vestas-v100-18-mw.html

Wind
• 70 meter annual wind speed raster was used
• Calculations were based on generating potential of the land
area and potential using a Vestas V80 wind turbine, rated at
1.8 Megawatts (same model currently in use in Hull, MA)
• Based on the wind speed raster Hull is in the same category as
Salem
• Maximum potential of V80 turbine was calculated using:
(turbine) MW × days × hours × operating capacity =

Solar Results (Wh/year)72858693951.761307 / 1000 = (kWh/year)
72858693.951761
(72858693.951761) (.20) (.12) (.55) =961734.76014 kWk/year
961734.76014 / 10000 = 96. 173
There is potential to produce enough solar energy in the study
area to supply energy to 96 house holds.
Wind Results
1.8 MW × 365 days × 24 hours × 25% = 3942 MWh x 1000
=3,942,000 kWh
/ 10, 000 = ~394 households
x 3 = 1,182 households

DISCUSSION
Caveats
• No environmental or social impact studies were considered for solar
or wind
• Did not use wind speed as a variable in calculating wind potential
Conclusions
• Winter Island does have potential for generating wind and solar
energy
• Approximately 1,300 households could be powered using 20% of the
land area for solar
and 3 1.8 MW wind turbines
• This could power ~ 14% of the housing units in Salem
• I would recommend installing at least 1 wind turbine at Winter
Island

References
MassGIS. Office of Geo Information. Commonwealth of Massachusetts, Information
Technology Division. Digital Terrain Model (DTM) Files. Accessed 19 April 2014.
http://www.mass.gov/anf/research-and-tech/it-serv-and-support/application-serv/office-of-
geographic-information-massgis/datalayers/dtm.html
MassGIS. Office of Geo Information. Commonwealth of Massachusetts, Information
Technology Division. Datalayers from the 2010 U.S. Census. Census_2010_tracts_SHP.
Accessed 19 April 2014. http://www.mass.gov/anf/research-and-tech/it-serv-and-
support/application-serv/office-of-geographic-information-
massgis/datalayers/census2010.html
MassGIS. Office of Geo Information. Commonwealth of Massachusetts, Information
Technology Division. Building Structures (2-D, from 2011-2013 Ortho Imagery)
structures_poly_258.shp. Accessed 20 April 2014. http://www.mass.gov/anf/research-and-
tech/it-serv-and-support/application-serv/office-of-geographic-information-
massgis/datalayers/structures.html
NOAA. National Oceanic and Atmospheric Administration. Average Annual Daytime Cloud
Coverage. 2013. Accessed 20 April 2014
http://www.erh.noaa.gov/ctp/features/2013/sky_cover/index.php
Hull Wind 2010. Accessed 25 April 2014. http://www.hullwind.org/
Vestas. 2014. Products and Services. Accessed 25 April 2014.
http://www.vestas.com/en/products_and_services/turbines/v100-2_0_mw#!