renewable energy infigen energy for...
TRANSCRIPT

Infigen Energy Annual Report 2016
RENEWABLE ENERGY FOR FUTURE GENERATIONS
INF
IGE
N E
NE
RG
Y | A
NN
UA
L R
EP
OR
T 20
16


OUR COMMITMENTSWe plan and act to protect the health and wellbeing of our people, ensuring we operate our facilities safely and the environment is not harmed by our activities. We measure our environmental, social and corporate governance performance (ESG) against our sustainability targets.1
CONTENTS
Who We Are 2
2016 Highlights 4
Chairman's Report 6
Managing Director's Report 8
Management Discussion and Analysis 10
Infigen Board 24
Infigen Management 26
Corporate Structure 28
Directors' Report 30
Remuneration Report 35
Auditor's Independence Declaration 48
Consolidated Financial Statements 49
Directors' Declaration 110
Independent Auditor's Report 111
Additional Investor Information 113
Glossary 116
Corporate Directory 117
To generate economic value whilst acting on climate change.
SECURITYHOLDERS
To provide a safe, enjoyable, rewarding and inclusive work environment.
EMPLOYEES
To foster respectful, responsive and enduring relationships.
COMMUNITY
To provide competitive renewable energy products and services.
CUSTOMERS
All figures in this report relate to businesses of the Infigen Energy Group (“Infigen” or “the Group”), being Infigen Energy Limited (“IEL”), Infigen Energy Trust (“IET”) and Infigen Energy (Bermuda) Limited (“IEBL”) and the subsidiary entities of IEL and IET, for the year ended 30 June 2016 compared with the year ended 30 June 2015 (“prior year” or “prior corresponding period”) except where otherwise stated.
All references to $ are a reference to Australian dollars unless specifically marked otherwise. Individual items and totals are rounded to the nearest appropriate number or decimal. Some totals may not add down the column due to rounding of individual components. Period on period changes on a percentage basis are presented as favourable (positive) or unfavourable (negative). Period on period changes to items measured on a percentage basis are presented as percentage point changes (“ppts”). Period on period changes that are not comparable are marked not meaningful (“n.m.”).
No representation, warranty or other assurance is made or given by, or on behalf of, Infigen that any projection, forecast, forward-looking statement, assumption or estimate contained in this report should or will be achieved.
1 Our 2016 ESG Report is available at http://www.infigenenergy.com/esg/
1

Infigen trades on the Australian Securities Exchange (ASX) under the code IFN.
Infigen is the largest owner of wind farms in Australia. We:
− develop large-scale wind and solar projects − own six large-scale wind farms with a combined installed capacity of 557 megawatts − manage the operations of our assets from a 24/7 control centre
1 Average annual household consumption in different states and territories is approximately 5–8 megawatt hours (MWh) per household, http://www.energymadeeasy.gov.au/
2 Infigen's scope 1 and 2 emissions in the 2016 financial year were 3,249 tCO2e.
3 More information on Infigen’s development pipeline is in the Management Discussion and Analysis, page 10.
4 In 2015 Infigen entered into a letter of intent regarding co-development and potential sale of the Manildra solar development project, with the sale conditional upon that project being successful in the ARENA large-scale solar PV competitive grant round. If the sale proceeds, Infigen will receive a payment determined by reference to the proposed MW capacity of the Manildra project.
5 Infigen has a 32% equity interest.
6 Infigen has a 50% equity interest.
DEVELOPMENT PROJECTS
PROJECT
APPROVED CAPACITY (MW)
DATE OF APPROVAL OF PLANNING APPLICATION
COMMUNITY CONSULTATION COMMITTEE
Solar Farm
Bogan River 12 Dec 2010 N/A
Capital 50 Dec 2010 Sep 2013
Cloncurry 30 N/A N/A
Manildra4 50 Mar 2011 N/A
Walkaway 25 45 Jul 2016 N/A
Wind Farm
Bodangora6 90-110 Aug 2013 Jun 2012
Capital 2 90-100 Nov 2011 Sep 2013
Cherry Tree 45-55 Nov 2013 N/A
Flyers Creek 100-115 Mar 2014 Dec 2012
Forsayth6 70-80 Feb 2014 N/A
Walkaway 25 ~41 Dec 2008 N/A
Walkaway 35 ~310 Dec 2008 N/A
Woakwine ~450 Jun 2012 N/A
Infigen Energy is a leading Australian renewable energy company supplying electricity that is commercially, socially and environmentally sustainable.
250,000+HOMES POWERED BY OUR OPERATING ASSETS1
Operation of our wind farms emitted less than 2 grams2 of carbon dioxide equivalent greenhouse gases per kilowatt hour
~1,100 MWLARGE-SCALE RENEWABLE ENERGY DEVELOPMENT PROJECTS
Our development pipeline comprises over 1,000 megawatts of projects with planning approval3
WHO WE ARE
2 INFIGEN ENERGY ANNUAL REPORT 2016

Solar farm development project
Wind farm development project
Operating solar farm
Operating wind farm
OPERATIONAL ASSETS
ASSET STATE
COMMERCIAL OPERATION DATE
NAMEPLATE CAPACITY (MW)
O&M SERVICES AGREEMENT END DATE
SALE OF PRODUCTION: POWER AND LARGE-SCALE GENERATION CERTIFICATES (LGCs)
Alinta wind farm
WA Jul 2006 89.1 Post-warranty: Dec 2017
100% of power to Alinta Energy until Dec 2026 100% of LGCs to Alinta Energy and AGL until Jan 2021
Capital wind farm
NSW Jan 2010 140.7 Post-warranty: Dec 20177
90-100% of power and 50-100% of LGCs to Sydney Desalination Plant8 until Dec 2030
Capital East solar farm
NSW Oct 2013 0.1 N/A 100% of power and LGCs merchant
Lake Bonney 1 wind farm
SA Mar 2005 80.5 Post-warranty: Dec 2017
100% of power and LGCs merchant
Lake Bonney 2 wind farm
SA Sep 2008 159.0 Post-warranty: Dec 2017
100% of power and LGCs merchant
Lake Bonney 3 wind farm
SA Jul 2010 39.0 Post-warranty: Dec 2017
100% of power and LGCs merchant
Woodlawn wind farm
NSW Oct 2011 48.3 OEM9 warranty: Oct 2016
100% of power merchant 100% of LGCs to Origin Energy until Sep 2020
Total 556.7
7 Infigen has option to extend to December 2022.
8 Effectively all output is contracted when Sydney Desalination Plant (SDP) is operating. Approximately 50% of LGCs are sold on a merchant basis when the plant is not operating.
9 Original equipment manufacturer.
3

2016 HIGHLIGHTSSAFETY ENVIRONMENT COMMUNITIES
<1.5̊ CEMISSIONS REDUCTION TARGET ADOPTED BASED ON GLOBAL WARMING LIMITS
74%PRODUCTS AND SERVICES FOR OUR OPERATIONS WERE PROCURED WITHIN AUSTRALIA
ZEROMAINTAINED OUR ZERO LOST TIME INJURY FREQUENCY RATE
4.8REDUCED OUR TOTAL RECORDABLE INJURY FREQUENCY RATE FROM 9.7
0.002 tCO2e/MWh
EMISSIONS INTENSITY OF OUR OPERATIONS REMAINED STEADY
$0.3mCONTRIBUTED IN COMMUNITY INVESTMENTS
4 INFIGEN ENERGY ANNUAL REPORT 2016

KEY FINANCIAL OUTCOMES (CONTINUING OPERATIONS)
FY16 37.4
FY15 34.8
FY14 36.1
FY16 595
FY15 742
FY14 994
FY16 120
FY15 84
FY14 93($M) ($M)($M)
Infigen’s extensive experience as a developer, owner, operator and acquirer of assets has created a disciplined investment appraisal culture where we will only pursue opportunities with acceptable risk adjusted returns. Approximately $100 million of cash is available for investment in growth opportunities.
$173mREVENUE INCREASED BY 29%
$148mCASH BALANCE INCREASED BY 300%
$7mNET PROFIT INCREASED BY $25.4 MILLION
$57mNET OPERATING CASH FLOW INCREASED BY 71%
$57m$51 MILLION OF GLOBAL FACILITY AND $6 MILLION OF WOODLAWN FACILITY BORROWINGS REPAID
1,469 GWh
PRODUCTION INCREASED BY 1%
$37.4mACHIEVED OPERATING COSTS BELOW THE $37.5-39.5 MILLION GUIDANCE RANGE
$595mNET DEBT REDUCED $147 MILLION
$120mEBITDA INCREASED BY 44%
5

“Infigen is now a simplified business that has a better capital structure and is positioned for profitable growth.”
Dear Securityholders,
On behalf of the Infigen Boards it is my pleasure to present your 2016 annual report. I am pleased to report that the Group’s position has improved markedly over the last 12 months.
Safety remains our first priority. Our ongoing initiatives to keep our people safe at work resulted in us achieving our goal of zero harm. We must however always avoid complacency. We continue to challenge management, staff and contractors in adopting further safety improvements throughout the business.
Infigen is now a simplified business that has a better capital structure and is positioned for profitable growth. We have moved into a supportive policy environment where renewable energy is acknowledged as a significant contributor to delivering reliable, affordable and sustainable electricity.
Two key events in the 2016 financial year (FY16) helped to restore market confidence in the Large-scale Renewable Energy Target (LRET) legislation. Firstly, the change in Federal Government leadership in September 2015 and the subsequent combination of energy and environment portfolios signalled a positive change in the Government’s approach to integrating energy and climate change policies. Secondly, Australia’s active participation in the Paris Climate Conference in December 2015 demonstrated our renewed commitment to supporting global efforts to limit the worst effects and risks of climate change.
Another pivotal event for Infigen has been positioning the business for profitable growth in the Australian market. During the financial year we completed the sale of our US assets. We also completed an organisation restructure to reduce our corporate overhead costs and position the Australian business for profitable growth. As a result, our corporate costs are expected to be 25% lower in the 2017 financial year. Market conditions now support increased development activities and expenditure.
We substantially reduced our debt during the year and now have improved prospects for refinancing of our corporate debt facility. This would reduce our cost of debt and free up cash flow that could be directed towards further growth and distributions in the medium term.
Turning to FY16 performance, your company achieved a net operating cash flow from continuing operations of $56.9 million. This was 71% or $23.7 million higher than the prior year.
Operating costs of $37.4 million were below our guidance range of $37.5 million to $39.5 million. We are progressing negotiations with our service and maintenance providers with a view to maintaining our long-term service and maintenance costs at levels that reflect efficient service provision and mitigate the risk of major component failures.
We are pleased to see improved value recognition for Infigen’s business with the security price increasing approximately 250% over the financial year with some improved level of institutional investment emerging. The inclusion of Infigen in the ASX200 index following the September 2016 quarterly rebalance is also a welcome consequence. This should improve liquidity of our securities.
CHAIRMAN’S REPORT
6 INFIGEN ENERGY ANNUAL REPORT 2016

BOARD AND MANAGEMENT We are pleased to report that your non-executive director, Ms Fiona Harris, who was granted an unpaid leave of absence from 1 July 2015 to 29 February 2016, has resumed her duties along with responsibility for chairing the Audit, Risk and Compliance Committee. This latter role was shared between Mr Ross Rolfe and me during her absence.
The absence of a non-executive director for this period highlighted the need for succession and diversity of experience to ensure that the Board had the skills and capability to maintain sound governance in the absence of any single director. I look forward to introducing you to Ms Sylvia Wiggins at our forthcoming Annual General Meeting. Sylvia was appointed to the Boards of Infigen Energy Limited, Infigen Energy (Bermuda) Limited and Infigen Energy RE Limited in April 2016 following a formal search process.
There was one change to the key management personnel (KMP) during the year. Following the sale of the US business David Smith, who was the CEO of Infigen’s US business, ceased to be a KMP of Infigen. We thank David for his role in contributing towards successful completion of the sale of our US business.
BUSINESS PERFORMANCEWind conditions resulted in Infigen’s production being lower than its five-year historical annual average of about 1,500 gigawatt hours. Such variability is inherent in our business.
Our net operating cash flow from continuing operations of $56.9 million improved by 71%. We reduced outstanding borrowings related to continuing operations by $56.5 million. We also applied the net proceeds from the sale of the US Class B wind business to debt reduction. In addition, the sale of the US solar development assets and the US Class A wind interests resulted in an approximately $100 million increase in cash held in Excluded Companies.
Infigen reported a net profit before tax from continuing operations of $10.6 million. This was a $28.8 million improvement compared with an $18.2 million net loss before tax from continuing operations in the prior year. Infigen’s statutory net profit of $4.5 million compared with a net loss of $303.6 million in the prior year. The $308.1 million variance was largely due to the announced divestment of the US operations in the prior year, which included a $284.5 million impairment.
As I mentioned earlier, Infigen now has a better capital structure, and is well positioned for growth in a rejuvenated Australian market. We improved our revenue assurance through an extension of the Large-scale Generation Certificate (LGC) contract with Alinta Energy for the Alinta wind farm, and executed a five-year LGC contract with Origin Energy for the Woodlawn wind farm. The cash balance in the Excluded Companies increased to approximately $137 million. We remain diligent and disciplined in the deployment of our capital reserves and pursue only those opportunities that offer acceptable risk-adjusted returns.
OUTLOOKInfigen moves into the 2017 financial year with good prospects for continued earnings growth from higher merchant prices.
Momentum is building to meet the medium-term shortfall in LGC certificate supply. However, the current rate of new build must increase to avoid a supply shortfall in 2018. Large liable entities under the LRET appear to be leaving themselves, and by extension their customers, exposed to rising merchant prices for LGCs. Some consumers are starting to look to satisfy their LRET liability directly with renewable energy generators to avoid inefficient costs being passed through to them. We will look to capture these opportunities as they arise.
We will continue to seek opportunities to secure power purchase agreements (PPAs) through tender processes and bilateral negotiations. We noted the PPA price outcomes of a limited number of announced procurement processes that we participated in during the year. Our knowledge of our projects and others’ indicates to us that some proponents have been willing to accept investment returns that we would find inadequate, in order to secure a PPA. Bidding lower investment returns might be in part due to the scarcity of PPAs coupled with large pools of capital that are seeking lower risk investments. It might also reflect the inability of some proponents to access capital without a PPA.
Electricity futures markets are now showing prices substantially higher than recently reported PPA prices. This creates opportunities for projects with a low cost of energy to capture higher returns with prudently managed merchant exposures. We have the capability, resources and pipeline of projects that are well positioned to capitalise on these near-term opportunities.
We will also continue to assess corporate activity opportunities that might arise within the current fragmented renewable energy sector in Australia.
I would like to thank my fellow directors, including the managing director, Mr Miles George, his leadership team, and all Infigen staff for their contributions to the business during the year.
Finally, I would like to thank securityholders for your continued support. Your directors look forward to welcoming you to our Annual General Meeting later in the year.
Mike Hutchinson Chairman
SAFETY
ZEROLOST TIME INJURIES
NET PROFIT BEFORE TAX
$10.6m
NET OPERATING CASH FLOW
$56.9m
7

Dear Securityholders,
During FY16 your management team’s focus was on operating Infigen’s business safely and efficiently, completing the sale of the US assets, reducing Global Facility borrowings, and repositioning the business to pursue profitable growth opportunities in Australia.
KEY MILESTONES
During FY16 the sale of Infigen’s US assets resulted in substantial debt reduction and added approximately $100 million to cash available in the Excluded Companies.
Following the sale of the US businesses, we completed an organisation restructure to reduce corporate costs and position the Australian business for profitable growth.
During the year we extended our LGC off-take contract with Alinta Energy for the Alinta wind farm to December 2020, and we executed a new five-year LGC off-take contract with Origin Energy for the Woodlawn wind farm.
Following the reporting period, S&P Dow Jones announced that Infigen’s stapled securities would be added to the S&P/ASX200 index in the September 2016 quarterly rebalance of that index.
ESG PERFORMANCE
We adopted the Global Reporting Initiative framework to monitor our environmental, social and corporate governance (ESG) performance.
Our first priority will always be the safety of our people and the communities in which we operate. During the year we achieved a rolling 12-month lost time injury frequency rate of zero, with no lost time injuries since November 2013, and eight years without a lost time injury at the Alinta and Lake Bonney wind farms. Our total recordable injury frequency rate fell from 9.7 to 4.8 during FY16.
Whilst the gender composition of the workforce remained unchanged at 38% females and 62% males, we continued to support initiatives that increase participation of females and persons from minority backgrounds.
Infigen actively monitors risks and opportunities associated with climate change, while seeking to reduce our own carbon footprint. We aim to be transparent in reporting of our targets and performance. As signatories to the Carbon Disclosure Project initiative for corporate climate action, we are aligning the emissions reduction target of our business with a 1.5°C warming pathway. During the year we submitted our emissions reduction target for a quality check under that process.
During FY16 a National Wind Farm Commissioner was appointed by the Federal Government. The renewable energy industry has worked collaboratively with the Commissioner throughout the year and continues to work constructively with him and his office. We continue to maintain community consultation through face-to-face meetings and formal committee meetings, and host wind farm open days including our Run with the Wind event held at the Woodlawn wind farm in October each year.
Our 2016 ESG Report is available at http://www.infigenenergy.com/esg/
OPERATIONAL AND FINANCIAL REVIEW
Production increased 1% to 1,469 GWh in FY16 primarily due to better wind conditions in New South Wales, partially offset by lower wind conditions in South Australia and Western Australia.
MANAGING DIRECTOR’S REPORT
INFIGEN ENERGY ANNUAL REPORT 20168

In December 2015 the Australian Government committed to join with other nations under the Paris Agreement seeking to limit the worst effects of climate change. Australia’s initial commitment is to develop and implement an economy-wide target to reduce greenhouse gas emissions by 26-28% below 2005 levels by 2030. Under the Paris Agreement Australia also committed to the far more ambitious global goal to hold average temperature increase to well below 2°C, and to pursue efforts to keep warming below 1.5°C above pre-industrial levels. To achieve the global goal all participating countries will set mitigation targets from 2020, and review targets every five years to build ambition over time, informed by a global carbon emissions stocktake. Commitments under the Paris Agreement to achieve the 2°C warming goal require the achievement of net zero global carbon emissions by around mid-century. To meet the 1.5°C warming goal will require even faster action. In Australia, this will require enhanced policy measures that could include an extension and expansion of the existing large-scale renewable energy target scheme, a strengthening of the Safeguards Mechanism of the Government’s Direct Action policy, and an emissions reduction scheme for the electricity sector based on an emissions intensity trading scheme and/or a scheme for planned closures of old coal-fired power generators. These policy measures are not mutually exclusive, and a combination of measures is likely to be required to meet the necessary reductions in emissions. The Government has committed to a review of the alternative policy measures in 2017.Increasingly investors are including assessments of material environmental and social impacts in their investment decisions. Policy stability is often part of the framework of that assessment. Announcing a formal carbon budget and expressing the policy architecture around that budget would send a strong investment signal from the Government to business. It would also improve the clarity of public discourse on climate policy. In the future, energy policy stability will be key to Australia achieving its commitments under the Paris Agreement. Policies that are well understood by the market and have demonstrated successful delivery of objectives should naturally retain a role. The large-scale renewable energy target is one such policy that can achieve a larger contribution to emissions reduction if it is expanded and extended as part of the policy response.
PARIS AGREEMENTRevenue increased 29% to $173.2 million, primarily as a result of higher LGC and electricity prices, the sale of LGCs from inventory at prices reflecting a large uplift on book value, and net production hedge revenue.
During FY16 Infigen’s wind turbines were covered by original equipment manufacturer’s warranty (Woodlawn wind farm) or post-warranty service agreements. This contributed to the stability and predictability of operating costs. At $37.4 million these were below the guidance range of between $37.5 million and $39.5 million, but 8% higher than FY15. The increase was due to a step-up in post-warranty costs at the Capital wind farm. In addition we incurred above historical average frequency control ancillary services (FCAS) fees in South Australia following upgrade works on the Heywood interconnector between Victoria and South Australia. These higher costs were partially offset by lower production-linked service and maintenance costs in South Australia and Western Australia.
Corporate costs were up 3% to $14.0 million and development costs were down 15% to $1.7 million. EBITDA was up 44% to $120.2 million, reflecting higher operating EBITDA.
Infigen repaid $51.0 million of Global Facility debt and $5.5 million of Woodlawn project finance facility borrowings related to our continuing operations. Completion of the sale of the US assets resulted in substantial debt reduction and approximately $100 million increase in available cash.
GUIDANCE AND OUTLOOK
Infigen expects wind conditions and production to improve in FY17 primarily because FY16 and FY15 wind conditions were below the historical long-term average. We will continue to report our production and revenue on a quarterly basis in arrears. The business’ merchant assets are expected to enjoy stronger cash flows from significantly improved LGC prices and wholesale electricity prices in South Australia, and to a lesser extent, increased wholesale electricity prices in New South Wales. Our priorities for the existing operating business include maintaining a safe workplace and continuing to pursue operational excellence to maximise the amount and value of energy that we produce.
We expect to finalise a post-warranty service and maintenance agreement for Woodlawn wind farm in the near term. We will also progress negotiations on long-term service and maintenance agreements for our other fleet assets during FY17, ahead of the expiry of existing service and maintenance contracts in December 2017.
In FY17 we anticipate higher operating costs associated with a further increase in FCAS charges in the first half of the year as the Victoria/South Australia interconnector works are completed during that period. Thereafter FCAS
charges are expected to decline. We also expect higher revenue losses in FY17 associated with lower marginal loss factors applying at Lake Bonney, whilst prospective loss factors at Capital, Woodlawn and Alinta are slightly improved. Woodlawn’s transition to a post-warranty turbine service and maintenance agreement from October 2016 will also increase costs in FY17.
Australia’s amended LRET requires investment in around 5,000 MW of new large-scale renewable energy capacity to meet legislated demand to 2020 and beyond. Infigen is well positioned to participate in the strong growth in investment that is required to meet that demand. During FY16 we participated in several competitive procurement processes and bilateral negotiations with off-take counterparties with a view to contracting revenues to underpin commencement of our pipeline investments in the near term. Negotiations continue at the time of this report and we will report on progress in due course.
Our geographically diverse development pipeline of wind and solar projects remains well positioned to proceed to construction as attractive market opportunities emerge. We have applied disciplined investment criteria in this early stage of investment commitments under the amended legislation, and we remain confident of our ability to deploy our pipeline opportunities to participate in profitable growth under the scheme. We are also enhancing our development pipeline by prospecting for further solar opportunities.
During FY16 Infigen enhanced its development capability to respond to the emerging market opportunities. Infigen also completed an organisation restructure that has positioned the business for growth and reduced costs. Corporate costs are expected to be approximately $10.5 million, a $3.5 million reduction from FY16, and in line with our previous guidance; while development costs will increase to approximately $3.5 million in FY17.
Based on these production, price and cost outlooks, we expect EBITDA to be approximately $130 million in FY17.
On behalf of the management team, I would like to thank our employees for their efforts in achieving a strong operating result in FY16 and positioning the Australian business for profitable growth in FY17 and beyond.
Finally, I would like to thank securityholders for your ongoing support. I look forward to meeting with you at the AGM, and reporting further on the performance of the business at that time.
Miles George Managing Director
9

MANAGEMENT DISCUSSION AND ANALYSIS of Financial and Operational Performance for the year ended 30 June 2016
INFIGEN ENERGY ANNUAL REPORT 201610

With a stable capital structure we have now positioned the business for growth in a rejuvenated market. Our development pipeline comprises over 1,100 megawatts of large-scale wind and solar projects with planning approvals.
OVERVIEWInfigen Energy (Infigen) is a developer, owner and operator of renewable energy generation assets in Australia. Infigen has an operating capacity of 557 megawatts (MW) comprising six wind farms, the 89 MW Alinta wind farm in Western Australia (WA), the three Lake Bonney wind farms in South Australia (SA) with capacities of 81 MW, 159 MW and 39 MW respectively, and the 141 MW Capital and 48 MW Woodlawn wind farms in New South Wales (NSW). Infigen holds a 100% equity interest in each wind farm. Infigen also owns and operates the 0.1 MW Capital East energy storage and solar photovoltaic (PV) demonstration facility adjacent to its Capital wind farm.
Infigen sells the contracted generation output from its operations through “run of plant” power purchase agreements (PPAs), Large-scale Generation Certificate (LGC) sales agreements, and retail supply agreements. Merchant output is sold via forward sales and on wholesale electricity/LGC markets. Each wind farm is entitled to create one LGC for each megawatt hour (MWh) that is exported to the grid after applying its marginal loss factor.
Of Infigen’s six operational wind farms, approximately 45-50%1 of the production from these wind farms (electricity and LGCs) is currently contracted under medium and long-term agreements. Further details of the off-take agreements for Infigen’s wind farms are included on page 23.
Infigen’s development pipeline comprises equity interests of approximately 1,100 MW of large-scale wind and solar PV projects in Australia.
1 Merchant LGC exposure varies based on the Sydney Desalination Plant’s operating regime.
11

MANAGEMENT DISCUSSION AND ANALYSIS
FY16 HIGHLIGHTS
SALE OF US BUSINESSES
$137mINCREASED CASH BALANCE HELD IN THE EXCLUDED COMPANIES
Completed the sale of the US solar development assets and the US wind business resulting in approximately $100 million increase in cash available for growth.
SAFETY
0ACHIEVED OUR TARGET OF ZERO HARM
Achieved a rolling 12-month lost time injury frequency rate (LTIFR) of zero, with no lost time injuries (LTIs) since November 2013, and eight years without an LTI at the Alinta and Lake Bonney wind farms.
LOST TIME INJURIES
NET PROFIT AFTER TAX
$4.5m$308.1 MILLION IMPROVEMENT
A $308.1 million improvement compared to the pcp which included a $285.2 million loss from discontinued US operations.
NET PROFIT AFTER TAX (continuing operations)
$7.0m$25.4 MILLION IMPROVEMENT
A $25.4 million improvement compared to the pcp, primarily due to higher electricity and LGC prices.
EBITDA
$120.2 million, up 44% or $36.7 million on the pcp. $120m
FY16 120
FY15 84
FY14 93
12 INFIGEN ENERGY ANNUAL REPORT 2016

REDUCED BORROWINGS
$595mNET DEBT BALANCE
$51.0 million of Global Facility borrowings repaid from operating cash flow and $5.5 million of Woodlawn borrowings repaid, with a net debt balance of $594.9 million at 30 June 2016.
NET OPERATING CASH FLOW (continuing operations)
$56.9mOPERATING CASHFLOW INCREASED BY 71%
Up 71% or $23.7 million on the pcp.
ORGANISATION RESTRUCTURE
CompleteCompleted after the sale of the US businesses, to reduce corporate costs from FY17 and position the Australian business for growth.
GROWTH AND DEVELOPMENT
PositionedPositioned development pipeline to respond to supportive market conditions.
PRODUCTION (GWh)
1,469FY16 1,469
FY15 1,459
FY14 1,572
REVENUE
$173mFY16 173
FY15 134
FY14 145
13

KEY FINANCIAL OUTCOMES
Summary of the key financial outcomes and metrics
The prior corresponding period (pcp) comparisons are reported on a continuing operations basis.
YEAR ENDED 30 JUNE($M UNLESS OTHERWISE INDICATED) 2016 2015 CHANGE %
Revenue 173.2 133.8 29
EBITDA 120.2 83.5 44
Depreciation and amortisation (52.0) (54.5) 5
EBIT 68.2 29.0 135
Net financing costs (57.6) (47.2) (22)
Profit/(loss) before income tax 10.6 (18.2) 158
Tax expense (3.6) (0.2) (1,700)
Loss from discontinued operations (2.5) (285.2) 99
Net profit/(loss) 4.5 (303.6) 101
EBITDA margin 69.4% 62.4% 7.0 ppts
Net operating cash flow per security (cps) 7.4 4.3 72
Earnings per security (cps)1 1.0 (2.3) 143
POSITION AT 30 JUNE($M UNLESS OTHERWISE INDICATED) 2016 2015 CHANGE %
Debt 742 787 6
Cash 148 45 229
Net debt 595 742 20
Securityholders’ equity 281 261 8
Book gearing 68.0% 74.0% 6.0 ppts
EBITDA/(net debt + equity) 13.7% 8.3% 5.4 ppts
Net assets per security ($) 0.36 0.34 6
Net tangible assets per security ($) 0.20 0.17 18
1 Calculated using weighted average issued securities and net profit/(loss) from continuing operations.
MANAGEMENT DISCUSSION AND ANALYSIS
(Continued)
14 INFIGEN ENERGY ANNUAL REPORT 2016

REVIEW OF FINANCIAL AND OPERATIONAL PERFORMANCE
YEAR ENDED 30 JUNE($M UNLESS OTHERWISE INDICATED) 2016 2015 CHANGE %
Operating capacity (MW) 557 557 –
Production2 (GWh) 1,469 1,459 1
Capacity factor during year 30.1% 29.9% 0.2 ppts
Turbine availability 97.7% 97.2% 0.5 ppts
Site availability 97.2% 96.5% 0.7 ppts
Total recordable injury frequency rate (TRIFR) 4.8 9.7 51
Lost time injury frequency rate (LTIFR) – – –
Scope 1 and 2 greenhouse gas emissions3 (tCO2e) 3,249 3,324 2
Total energy consumption (TJ) 18.4 18.6 1
Revenue 173.2 133.8 29
Operating costs (37.4) (34.7) (8)
Operating EBITDA 135.8 99.1 37
Corporate costs (14.0) (13.6) (3)
Development costs and other costs and income (1.7) (2.0) 15
EBITDA 120.2 83.5 44
Depreciation and amortisation (52.0) (54.5) 5
EBIT 68.2 29.0 135
Net borrowing costs (53.6) (55.3) 3
Net FX and revaluation of derivatives (4.0) 8.0 (150)
Profit/(loss) before income tax 10.6 (18.2) 158
Tax expense (3.6) (0.2) (1,700)
Loss from discontinued operations (2.5) (285.2) 99
Net profit/(loss) 4.5 (303.6) 101
Operating EBITDA margin 78.4% 74.1% 4.3 ppts
Average price4 ($/MWh) 117.9 91.7 29
Operating costs ($/MWh) 25.5 23.8 7
Emissions intensity (tCO2e/MWh) – – –
2 Includes compensated production of 7.7 GWh in FY16 and 14.1 GWh in FY15.
3 FY16 emissions remain subject to review by the Clean Energy Regulator.
4 FY16 average price includes the net payout from the production hedge that matured on 31 March 2016.
15

PRODUCTION
YEAR ENDED 30 JUNE (GWh) 2016 2015 CHANGE %
Alinta wind farm 300 323 (7)
Capital wind farm 360 320 13
Lake Bonney 1, 2 and 3 wind farms 654 677 (3)
Woodlawn wind farm 147 125 19
Compensated production 8 14 (42)
Total production 1,469 1,459 1
Production increased 1% or 10 GWh to 1,469 GWh due to better wind conditions in NSW (+46 GWh), reduced turbine availability losses at Capital and Woodlawn wind farms (+13 GWh), reduced network losses at the Alinta wind farm (+8 GWh), improved network availability at Lake Bonney wind farm (+7 GWh), and improved site availability (+2 GWh). This was partially offset by lower wind conditions in SA and WA (-60 GWh), and lower compensated production (-6 GWh).
PRICESThe weighted average portfolio bundled (electricity and LGCs) price was $117.9/MWh, 29% higher than $91.7/MWh in the pcp reflecting higher LGC and electricity prices, and the net payout from the production hedge that matured on 31 March 2016.
Electricity
TWA WHOLESALE ELECTRICITY PRICE ($/MWh) FY16 FY15 10 YEAR AVERAGE
South Australia 61.67 39.29 52.67
New South Wales 51.60 35.17 44.40
Western Australia1 49.13 42.68 54.15
Time weighted average (TWA) spot electricity prices in SA and NSW were 57% and 47% higher respectively than the pcp due to greater electricity demand, retirement of generators, planned generator outages, and to a lesser extent, higher average daily maximum temperatures.
INFIGEN’S DWA WHOLESALE ELECTRICITY PRICE ($/MWh) FY16 FY15 CHANGE %
South Australia (Lake Bonney 1, 2 and 3) 50.97 30.28 68
New South Wales (Woodlawn) 51.86 34.64 50
Infigen’s dispatch weighted average (DWA) electricity prices increased 68% to $50.97/MWh in SA and 50% to $51.86/MWh in NSW. Lake Bonney wind farm DWA prices were 17% below the SA TWA prices, whereas Woodlawn wind farm’s DWA price was close to the NSW TWA price.
Average spot prices in the National Electricity Market can be significantly influenced by short-term extreme price events. Wholesale electricity spot prices can vary between the market price floor of -$1,000/MWh and the market price cap of $14,000/MWh. During the year there were 185 half-hourly settlement intervals above $300/MWh in SA and 10 in NSW compared to 49 in SA and one in NSW for the pcp. There were 288 negative price events in SA and one in NSW compared to 154 in SA and none in NSW in the pcp.
1 Data from the Wholesale Electricity Market of WA dates back to September 2006. Alinta wind farm is contracted and hence will not become exposed to merchant electricity prices until 2026.
MANAGEMENT DISCUSSION AND ANALYSIS
(Continued)
16 INFIGEN ENERGY ANNUAL REPORT 2016

Large-scale Generation Certificates (LGCs)
LGC SPOT PRICES ($/LGC) 2016 2015 CHANGE %
Closing price at 30 June 84.20 51.75 63
Average price during the financial year 69.79 38.46 81
The closing LGC market price of $84.20/LGC at 30 June 2016 was up 63% compared to $51.75/LGC at 30 June 2015. The 12-month average merchant LGC market price was up 81% to $69.79/LGC compared to an average of $38.46/LGC in the pcp.
The increase in LGC spot prices was driven by improved regulatory certainty. In June 2015 legislation was passed to set a revised target (33,000 GWh by 2020) under the Large-scale Renewable Energy Target (LRET) scheme. The Australian Government’s climate commitments2 made under the Paris Agreement in December 2015 added further confidence that there would be no adverse changes to the LRET scheme. Expectations of a likely shortfall in LGC supply over the medium term also increased demand from the major electricity retailers. Infigen’s LGC inventory at 30 June 2016 was approximately 328,000 certificates (255,000 in the pcp). The increase was due to strong production in May and June. The value of inventory at 30 June 2016 was $20.6 million ($12.7 million in the pcp) resulting from an increased volume of LGCs being brought to account at higher average LGC spot prices.
REVENUE Revenue increased $39.4 million or 29% to $173.2 million due to higher LGC prices (+$20.9 million), higher electricity prices (+$14.6 million), hedge revenue (+$3.1 million), and higher production (+$1.5 million), partially offset by lower compensated revenue (-$0.6 million).
2 Australia committed to implementing an economy-wide target to reduce emissions by 26-28% below 2005 levels by 2030 and to contribute its fair share of the further global action required to limit temperature increases to well below 2°C.
17

OPERATING, CORPORATE AND DEVELOPMENT COSTS
YEAR ENDED 30 JUNE 2016 2015 CHANGE CHANGE %
Asset management 6.7 6.2 (0.5) (8)
Frequency control ancillary services (FCAS) fees1 2.0 0.3 (1.7) (567)
Turbine operations and maintenance (O&M) 18.9 18.4 (0.5) (3)
Balance of plant 0.9 0.4 (0.5) (125)
Other direct costs 7.0 7.4 0.4 5
Total wind farm costs 35.5 32.7 (2.8) (9)
Energy Markets 1.9 2.0 0.1 5
Operating costs 37.4 34.7 (2.7) (8)
Operating costs increased $2.7 million or 8% to $37.4 million. The key variances include:
• $0.5 million increase in asset management costs due to personnel and compliance costs (+$0.5 million), and higher legal and professional fees (+$0.2 million), partially offset by savings in overhead and travel costs (-$0.2 million)
• $1.7 million increase in frequency control ancillary services fees incurred as a result of Heywood interconnector upgrade works in South Australia
• $0.5 million increase in turbine operations and maintenance costs primarily due to a full year step-up in post-warranty costs at the Capital wind farm (+$1.7 million), partially offset by lower production-linked turbine O&M costs at the Lake Bonney and Alinta wind farms (-$0.9 million) and other net operating costs (-$0.3 million)
• $0.5 million increase in balance of plant costs due to lower scheduled maintenance works at Alinta and Lake Bonney wind farms in the pcp (+$0.3 million) and higher unscheduled balance of plant maintenance costs at Capital wind farm (+$0.2 million)
• $0.4 million decrease in other direct costs largely driven by lower insurance premiums obtained in the current year
Infigen is currently finalising a new post-warranty service and maintenance agreement for the Woodlawn wind farm. The contract is expected to come into effect from October 2016.
Operating Earnings Before Interest, Tax, Depreciation and Amortisation (Operating EBITDA) was $135.8 million, up 37% or $36.7 million. This was primarily due to higher revenue, partially offset by higher wind farm costs.
Corporate costs were $14.0 million, up 3% or $0.4 million due to organisational restructure costs, partially offset by lower audit, IT and travel costs.
Development costs were $1.7 million, down 15% or $0.3 million.
PROFIT AND LOSSEBITDA was $120.2 million, up 44% or $36.7 million reflecting higher operating EBITDA, partially offset by higher corporate costs.
Depreciation and amortisation expense of $52.0 million was 5% or $2.5 million lower than the pcp that included a write-down of two development assets.
Earnings Before Interest and Tax (EBIT) was $68.2 million, up 135% or $39.2 million.
1 Frequency control ancillary services (FCAS) fees relate to services that maintain key technical characteristics of the power system.
MANAGEMENT DISCUSSION AND ANALYSIS
(Continued)
18 INFIGEN ENERGY ANNUAL REPORT 2016

FINANCING COSTS
YEAR ENDED 30 JUNE ($M) 2016 2015 CHANGE %
Interest expense (52.0) (53.2) 2
Bank fees and amortisation of loan costs (2.3) (2.8) 18
Amortisation of decommissioning costs (0.1) (0.1) –
Total borrowing costs (54.4) (56.1) 3
Interest income 0.8 0.8 –
Net borrowing costs (53.6) (55.3) 3
Net FX and revaluation of derivatives (4.0) 8.0 (150)
Net financing costs (57.6) (47.2) (22)
Net borrowing costs were $53.6 million, down $1.7 million. Lower average debt balances over the period compared to the pcp resulted in a lower interest expense (-$1.2 million) and lower bank fees following the sale of the US business.
Net FX and revaluation of derivatives resulted in a $4.0 million expense driven by FX losses due to the depreciation of the AUD, and fair value gains on financial instruments in the pcp.
Profit from continuing operations before tax was $10.6 million, a $28.8 million favourable variance to the pcp due to a favourable operating result, partially offset by higher FX and revaluation of derivative expenses.
Income tax expense of $3.6 million was $3.4 million higher than the $0.2 million tax expense in the pcp due to higher EBITDA.
Loss from discontinued operations was $2.5 million, a $282.7 million favourable variance due to a US$221.2 million or $284.5 million impairment of the US business in the pcp.
Infigen reported a net profit after tax of $4.5 million, a favourable variance of $308.1 million compared to the pcp.
CASH FLOWCash Movement
Cash at 30 June 2016 was $147.6 million, 227% or $102.4 million higher than $45.2 million at 30 June 2015. The cash balance at 30 June 2016 comprised $10.7 million held by entities within the Global Facility Borrower Group2 ($11.0 million at 30 June 2015) and $136.9 million held by entities outside of that group (“Excluded Companies”) ($34.2 million at 30 June 2015).
Cash inflows included $102.0 million from the sale of part of the US wind business (Class A interests) and sale of the US solar development assets, operating cash flow from continuing operations of $56.9 million, and a favourable FX effect on cash balances held in USD and EUR of $4.4 million.
Other cash movements included $56.5 million for debt repayments (refer to Debt section on page 20) and $3.7 million capital expenditure on IT, development, and wind farm property, plant and equipment.
2 Infigen’s borrowings include a multi-currency Global Facility secured by Infigen’s interests in all of its operational wind farms except Woodlawn – “the Borrower Group”.
19

OPERATING CASH FLOW
YEAR ENDED 30 JUNE ($M) 2016 2015 CHANGE %
Operating EBITDA 135.8 99.1 37
Corporate and development costs and other income (15.7) (15.6) (1)
Movement in working capital and non-cash items (11.3) 2.4 (571)
Financing costs (51.9) (52.7) 2
Net operating cash flow (continuing operations) 56.9 33.2 71
Net operating cash flow (discontinued operations) – 46.3 n.m.
Net operating cash flow 56.9 79.5 (28)
Net operating cash flow was down $22.6 million from $79.5 million primarily due to cessation of cash flow from discontinued operations (-$46.3 million) and an unfavourable movement in working capital and non-cash items (-$13.7 million). This was partially offset by higher operating EBITDA (+$36.7 million) and lower financing costs (+$0.8 million).
The movement in working capital and non-cash items was primarily related to the effect of increased LGC prices on higher LGC inventory due to strong production in May and June 2016 and holding LGC inventory for contracts that will settle in early FY17 (-$7.9 million) (refer to Prices commentary on pages 16-17) and higher operations and maintenance prepayments compared to the pcp (-$3.1 million).
CAPITAL STRUCTUREDebt
Total debt1 (including capitalised loan costs2) at 30 June 2016 was $742.5 million, including Global Facility borrowings of $707.7 million and Woodlawn facility borrowings of $39.9 million. This was $44.4 million lower than at 30 June 2015. During the year Infigen repaid $51.0 million of Global Facility borrowings from cash flow from continuing operations and $5.5 million of Woodlawn facility borrowings. The depreciation of the AUD against the USD resulted in $10.6 million in unfavourable FX movements, with the balance comprising expensed and capitalised loan costs.
The Global Facility is a multi-currency facility with outstanding USD, EUR and AUD balances. The outstanding foreign currency balances at 30 June 2016 were USD116.2 million and EUR14.0 million.
The outlook for ongoing Global Facility leverage ratio covenant compliance has been strengthened by higher operating cash flow increasing the rate of debt reduction. The Global Facility leverage ratio covenant was satisfied at 30 June 2016 (i.e. less than 8.5 times). Infigen expects to continue to satisfy the Global Facility leverage ratio covenant in conformity with the terms of the facility (i.e. less than 6.0 times from 31 December 2016, until the next step-down from July 2019).
Net Debt
Net debt relating to continuing operations decreased from $741.7 million at 30 June 2015 to $594.9 million at 30 June 2016. The net movement of $146.8 million was due to debt repayments and US sale related cash inflows into the Excluded Companies’ cash balance offset by unfavourable net FX movements.
Equity
Total equity increased 8% from $260.9 million at 30 June 2015 to $280.6 million at 30 June 2016. The increase of $19.7 million is attributable to:
• Movement in reserves (+$14.1 million)
• Net profit for the year (+$4.5 million)
• Issue of equity securities (+$1.1 million)
During the year the number of IFN stapled securities on issue increased by 4,581,565 to 772,469,146. The securities were issued to satisfy vested Performance Rights relating to FY13 Long Term Incentive and FY14 Deferred Short Term Incentive entitlements.
1 Further information is available in note 15 to the FY16 financial statements on pages 78-81.
2 Capitalised loan costs accounted for $5.1 million as at 30 June 2016.
MANAGEMENT DISCUSSION AND ANALYSIS
(Continued)
20 INFIGEN ENERGY ANNUAL REPORT 2016

Gearing
The following table provides a comparison of Infigen’s book gearing at 30 June 2016 and 30 June 2015. The change reflects the movement in net debt and equity described above. A summarised balance sheet is provided in Appendix A, page 22.
POSITION AT 30 JUNE ($M) 2016 2015 CHANGE %
Net debt 595 742 20
Total equity 281 261 8
Book gearing 68% 74% 6.0 ppts
Distributions
No distributions for the year ended 30 June 2016 have been declared or paid.
GROWTH AND DEVELOPMENT
DEVELOPMENT PROJECT STATE CAPACITY (MW)
PLANNING STATUS
APPROVAL DATE
CONNECTION STATUS
Bodangora wind farm3 NSW 90-110 Approved Aug 2013 Advanced
Bogan River solar farm NSW 12 Approved Dec 2010 Intermediate
Capital solar farm NSW 50 Approved Dec 2010 Offer received
Capital 2 wind farm NSW 90-100 Approved Nov 2011 Offer received
Cherry Tree wind farm VIC 45-55 Approved Nov 2013 Advanced
Cloncurry solar farm QLD 30 N/A N/A Early
Flyers Creek wind farm NSW 100-115 Approved Mar 2014 Intermediate
Forsayth wind farm3 QLD 70-80 Approved Feb 2014 Advanced
Manildra solar farm4 NSW 50 Approved Mar 2011 Advanced
Walkaway 2 wind farm5 WA 41 Approved Dec 2008 Intermediate
Walkaway 2 solar farm5 WA 45 Approved July 2016 Intermediate
Walkaway 3 wind farm5 WA ~310 Approved Dec 2008 Early
Woakwine wind farm SA ~450 Approved Jun 2012 Intermediate
Total (Infigen equity interests) ~1,100
The contract to merchant price spread is wide and widening, implying large value transfers from developers to off-takers. Attractive merchant opportunities exist for low cost energy projects.
During the year, Infigen was active in tendering to supply renewable energy through multiple formal procurement processes, and engaged in bilateral discussions to supply electricity retailers. Infigen will pursue opportunities with acceptable risk adjusted returns consistent with its disciplined investment appraisal culture.
Planning modifications were obtained for Manildra and Bogan River solar farms, and for Bodangora and Flyers Creek wind farms during the period.
Land agreements were extended at Bodangora, Manildra, and Walkaway 2 and 3, and connection studies were completed for Cherry Tree.
Community engagement activities during the year included a community engagement survey, implementation of Infigen’s sponsorship program, and facilitation of community meetings.
3 Infigen has a 50% equity interest.
4 In 2015 Infigen entered into a letter of intent regarding co-development and potential sale of the Manildra solar farm development project, with the sale conditional upon that project being successful in the ARENA large-scale solar PV competitive grant round. If the sale proceeds, Infigen will receive a payment determined by reference to the proposed MW capacity of the Manildra project.
5 Infigen has a 32% equity interest.
21

APPENDIX A – BALANCE SHEET
AS AT 30 JUNE ($M) 2016 2015
Cash 147.6 45.2
Receivables 24.1 76.7
Inventory (LGCs) 20.6 12.7
PP&E 783.8 830.2
Goodwill and intangible assets 122.7 126.8
Investments in associates 1.3 0.5
Deferred tax assets and other assets 52.4 49.9
Assets of disposal group classified as held for sale – 1,286.8
Total assets 1,152.5 2,428.8
Payables 17.4 29.0
Provisions 11.3 9.8
Borrowings 742.5 786.9
Derivative liabilities 100.8 99.3
Liabilities of disposal group classified as held for sale – 965.3
Borrowings and swaps associated with sale of disposal group – 277.6
Total liabilities 872.0 2,167.9
Net assets 280.5 260.9
FOREIGN EXCHANGE RATES AS AT 30 JUNE 2016 2015 CHANGE %
AUD:USD (average rate) 0.7408 0.8319 (11)
AUD:EUR (average rate) 0.6591 0.6942 (5)
AUD:USD (closing rate) 0.7457 0.7680 (3)
AUD:EUR (closing rate) 0.6724 0.6866 (2)
MANAGEMENT DISCUSSION AND ANALYSIS
(Continued)
22 INFIGEN ENERGY ANNUAL REPORT 2016

APPENDIX B – OPERATIONAL ASSETS
ASSET STATE COMMERCIAL OPERATION DATE
NAMEPLATE CAPACITY (MW)
FY16 AVERAGE OUTPUT1
FY16 MARGINAL LOSS FACTOR2
Alinta wind farm WA Jul 2006 89.1 38% 0.9384
Capital wind farm NSW Jan 2010 140.7 29% 0.9748
Lake Bonney 1 wind farm SA Mar 2005 80.5 26% 0.9352
Lake Bonney 2 wind farm SA Sep 2008 159.0 27% 0.9352
Lake Bonney 3 wind farm SA Jul 2010 39.0 27% 0.9352
Woodlawn wind farm NSW Oct 2011 48.3 35% 0.9748
Total 556.7
ASSETO&M SERVICES AGREEMENT END DATE
POWER CONTRACTED
LGCs CONTRACTED
POWER/LGC CONTRACT END DATE
CUSTOMER
Alinta wind farmPost-warranty: Dec 2017 100% 100%
Power: Dec 2026 LGC: Jan 2021
Power: Alinta Energy LGCs: Alinta Energy and AGL
Capital wind farm Post-warranty: Dec 20173 90 – 100% 50 – 100%4 Power and LGC:
Dec 2030SDP and merchant
Lake Bonney 1 wind farm Post-warranty: Dec 2017
– – – Merchant
Lake Bonney 2 wind farm Post-warranty: Dec 2017
– – – Merchant
Lake Bonney 3 wind farm Post-warranty: Dec 2017 – – – Merchant
Woodlawn wind farm OEM warranty: Oct 2016
– 100% LGC: Sep 2020 Power: merchant LGCs: Origin Energy
1 Average percentage of nameplate capacity.
2 AEMO published annual marginal loss factors which are available at http://www.aemo.com.au/Electricity/National-Electricity-Market-NEM/Security-and-reliability/-/media/EC6AF881593F4DB7B10F6286F3AD1004.ashx/
3 Infigen has option to extend to December 2022.
4 Effectively all output is contracted when Sydney Desalination Plant (SDP) is operating. Approximately 50% of LGCs are sold on a merchant basis when the plant is not operating.
23
MILES GEORGE
Managing Director
Miles is the Managing Director of Infigen Energy and has over 20 years’ experience in business development, investment, financing and management roles in the infrastructure and energy sectors in Australia, the US and Europe.
Over the past 16 years Miles has been focused on development, investment, financing and management in the renewable energy industry.
Miles undertook a leading role in the development of Infigen’s first wind farm project at Lake Bonney in South Australia, commencing in 2000. In 2003 Miles jointly led the team that established the renewable energy business now known as Infigen Energy. In 2005 Miles jointly led the Initial Public Offer and listing of Infigen’s business on the ASX.
Following listing, Miles continued to work on the development, financing and management of Infigen’s wind farm investments in Australia, the US and Europe. He was appointed as Managing Director of Infigen Energy in 2009.
Miles was elected Chairman of the Board of the Clean Energy Council in December 2013 and was re-elected as Chairman in December 2015.
In December 2015 Miles was appointed as the Generator Representative on the Australian Energy Market Commission Reliability Panel.
Miles holds degrees of Bachelor of Engineering and Master of Business Administration (Distinction) from the University of Melbourne.
MICHAEL HUTCHINSON
Non-Executive Chairman
Mike was appointed an Independent Non-Executive Director of Infigen Energy in June 2009 and subsequently elected Chairman on 11 November 2010. He is also Chairman of the Nomination and Remuneration Committee.
Mike was formerly an international transport engineering consultant, a senior Federal Government official and a corporate advisory consultant; and has extensive experience in the transport and communications sectors.
Mike has previously been a non-executive director of the Australian Infrastructure Fund Ltd, Leighton Holdings Ltd, Epic Energy Holdings Ltd, Hastings Funds Management Ltd, Westpac Funds Management Ltd, Pacific Hydro Ltd, OTC Ltd, HiTech Group Australia Ltd, the Australian Postal Corporation and the Australian Graduate School of Management Ltd.
Mike holds a first class honours degree in Civil Engineering from the University of Newcastle upon Tyne, United Kingdom, and graduated from the Harvard Business School Advanced Management Program (AMP110). He is a member of the Institution of Civil Engineers, the Institution of Highways and Transportation, Engineers Australia, and the Australian Institute of Company Directors.
FIONA HARRIS
Non-Executive Director
Fiona was appointed as an Independent Non-Executive Director of Infigen Energy in June 2011 and is the Chairman of the Audit, Risk and Compliance Committee. Fiona is also a member of the Nomination and Remuneration Committee.
Fiona has been a professional non-executive director for the past 21 years, during which time she has been a director of organisations across a variety of industry sectors, including utilities, financial services, energy and natural resources and property, and been involved in a range of corporate transactions. Prior to this Fiona spent 14 years with KPMG, working in Perth, San Francisco and Sydney, and specialising in financial services.
Fiona is currently Chairman of Barrington Consulting Group, a director of BWP Trust and a director of Perron Group Limited. Fiona’s previous directorships of listed companies in the past three years were Aurora Oil and Gas Limited, Oil Search Limited, Sundance Resources Limited and Toro Energy Limited.
Fiona holds a Bachelor of Commerce degree and is a Fellow of Chartered Accountants Australia and New Zealand, and is a past State President and National Board Director of the Australian Institute of Company Directors.
INFIGEN BOARD
24 INFIGEN ENERGY ANNUAL REPORT 2016

PHILIP GREEN
Non-Executive Director
Philip was appointed a Non-Executive Director of Infigen Energy in November 2010.
Philip is a Partner of TCI Advisory Service LLP (TCI), an advisor to a substantial securityholder of Infigen Energy. Philip joined TCI in 2007 and his responsibilities include TCI’s global utility, renewable energy and infrastructure investments.
Prior to joining TCI, Philip led European Utilities equity research at Goldman Sachs, Merrill Lynch and Lehman Brothers over a 12-year period. Philip is a UK Chartered Accountant (ACA) and has a Bachelor of Science (Hons) in Geotechnical Engineering.
ROSS ROLFE AO
Non-Executive Director
Ross was appointed an Independent Non-Executive Director of Infigen Energy in September 2011. Ross is a member of the Audit, Risk and Compliance Committee and the Nomination and Remuneration Committee.
Ross has broad experience in the Australian energy and infrastructure sectors in senior management, government and strategic roles.
In August 2008 Ross was appointed to the position of Chief Executive Officer of Alinta Energy. Ross completed a capital restructuring of the business and stepped down from the CEO and Managing Director role in April 2011.
Prior to that appointment, Ross held the position of Director General of a range of Queensland Government Departments, including Premier and Cabinet, State Development, and Environment and Heritage, as well as the position of Co-ordinator General. Ross was also the Chief Executive Officer of Stanwell Corporation, one of Queensland’s largest energy generation companies from 2001 until 2005. Ross was previously Chairman of WDS Limited and CS Energy, and a non-executive director of CMI Limited and Thiess Pty Ltd.
Ross is currently Chairman of the North Queensland Airport Group and a director of Transurban Queensland and Tennis Queensland. Ross also holds a part-time senior executive role at Lend Lease.
SYLVIA WIGGINS
Non-Executive Director
Sylvia was appointed an Independent Non-Executive Director of Infigen Energy in April 2016. Sylvia is a member of the Audit, Risk and Compliance Committee.
Sylvia has over 20 years’ experience as a legally qualified chief executive officer, executive and senior investment banker across a broad range of businesses and countries, most recently working in the energy, infrastructure, defence and structured finance areas.
Sylvia has originated, structured and advised upon transactions including capital and debt issuance, IPOs, asset acquisitions and divestments, mergers and acquisitions, and trade sales. Sylvia has also provided corporate advice covering strategic planning, commercial negotiations, capital management and corporate governance.
Sylvia manages her own advisory firm, which she established in 2014 having previously worked with a number of international investment and advisory firms. From 2009 to 2011 Sylvia worked at the Alinta Energy Group. Prior to that Sylvia was the inaugural Chief Executive Officer of Global Investments Limited, which is listed on the Singapore Stock Exchange.
25
MILES GEORGE
Managing Director
Miles is the Managing Director of Infigen Energy and has over 20 years’ experience in business development, investment, financing and management roles in the infrastructure and energy sectors in Australia, the US and Europe.
Over the past 16 years Miles has been focused on development, investment, financing and management in the renewable energy industry.
Miles undertook a leading role in the development of Infigen’s first wind farm project at Lake Bonney in South Australia, commencing in 2000. In 2003 Miles jointly led the team that established the renewable energy business now known as Infigen Energy. In 2005 Miles jointly led the Initial Public Offer and listing of Infigen’s business on the ASX.
Following listing, Miles continued to work on the development, financing and management of Infigen’s wind farm investments in Australia, the US and Europe. He was appointed as Managing Director of Infigen Energy in 2009.
Miles was elected Chairman of the Board of the Clean Energy Council in December 2013 and was re-elected as Chairman in December 2015.
In December 2015 Miles was appointed as the Generator Representative on the Australian Energy Market Commission Reliability Panel.
Miles holds degrees of Bachelor of Engineering and Master of Business Administration (Distinction) from the University of Melbourne.
CHRIS BAVEYSTOCK
Chief Financial Officer
Chris was appointed Chief Financial Officer of Infigen Energy in March 2011, with responsibility for managing the financial risks of the business while being responsible for financial control and reporting. Additionally, he is also responsible for the investor relations, information technology and facilities functions in Australia.
Chris has over 20 years of experience as a finance executive in mergers and acquisitions, acquisition integration, financing, project evaluation and review, bids and tenders, and all facets of financial reporting. His most recent roles were as Chief Financial Officer of the Tenix Group, and subsequently a number of senior finance roles at Transfield Services, including Group Financial Controller.
Chris holds a Bachelor of Arts in History from the University of Cambridge and is a Chartered Accountant qualifying with the Institute of Chartered Accountants England & Wales (ICAEW).
INFIGEN MANAGEMENT
26 INFIGEN ENERGY ANNUAL REPORT 2016

BRAD HOPWOOD
Executive General Manager – Commercial & Corporate Finance
Brad is the Executive General Manager – Commercial & Corporate Finance for Infigen Energy, with responsibility for commercial and development activities focused on asset growth, sourcing capital for the business, corporate activity and projects.
Brad has worked with Infigen Energy since 2006 and been responsible for tax, structure, corporate finance matters and debt facilities management, as well as acquisition and divestment activities.
Brad has over 20 years’ experience in advising on, managing and leading local and international structuring, acquisitions, divestments and financing transactions in a range of sectors including renewable energy, conventional electricity generation, infrastructure, telecoms, property and structured finance.
Brad holds Bachelor degrees in Economics and Law and a Graduate Diploma of Legal Practice. Brad is also admitted in New South Wales as a (non-practising) Solicitor.
STEFAN WRIGHT
General Counsel
Stefan joined Infigen Energy in October 2009 and is the group’s General Counsel.
Stefan advises the Infigen Energy Board and senior management team on corporate, legal and transactional matters and is responsible for the group’s legal function.
He has been involved in the renewable energy industry since 2007.
Stefan has previously worked at leading law firms in Sydney and New York and as corporate counsel at an Australian financial services business. His skill set includes advising on acquisitions and divestments, joint ventures, financing and capital markets transactions, major projects, restructurings and dispute resolution.
Stefan holds Bachelor degrees in Commerce and Law from the University of Adelaide and a Graduate Diploma of Legal Practice.
27

INFIGEN ENERGY TRUST
INFIGEN ENERGY
RE LIMITED
INFIGEN ENERGY HOLDINGS PTY LIMITED
WOODLAWN WIND FARM
DEVELOPMENT ASSETS
INFIGEN ENERGY (BERMUDA) LIMITED
INFIGEN ENERGY LIMITED
ALINTA, CAPITAL AND LAKE BONNEY WIND FARMS
The Infigen Energy Group (Infigen or the Group) consists of the following entities:
• Infigen Energy Limited (IEL), a public company incorporated in Australia;
• Infigen Energy Trust (IET), a managed investment scheme registered in Australia;
• Infigen Energy (Bermuda) Limited (IEBL), a company incorporated in Bermuda; and
• the subsidiary entities of IEL and IET.
One share in each of IEL and IEBL and one unit in IET have been stapled together to form a single stapled security, tradable on the Australian Securities Exchange under the “IFN” code.
Infigen Energy RE Limited (IERL) is the Responsible Entity of IET.
The current stapled structure of the Infigen Energy Group was established immediately prior to listing on the Australian Securities Exchange in 2005 and currently cannot be readily materially simplified due to requirements of Infigen’s corporate debt facility (Global Facility). IEBL was established and included in Infigen’s stapled structure in 2005 to provide flexibility regarding potential investment ownership structures. IEBL has not been utilised for that purpose since it was established and Infigen aims to wind up this entity when it is feasible to do so.
The following diagram represents the structure of the Infigen Energy Group, including the entities and assets within the Global Facility borrower group.
INFIGEN ENERGY SECURITYHOLDERS
STAPLED SECURITIES
Entities and assets within the Global Facility borrower group as at 30 June 2016
UNITS
RESPONSIBLE ENTITY
SHARES SHARES
CORPORATE STRUCTURE
28 INFIGEN ENERGY ANNUAL REPORT 2016

29
The Directors of Infigen Energy Limited and the Directors of Infigen Energy RE Limited, the Responsible Entity of Infigen Energy Trust, present their report together with the Financial Report of the Group and the Trust (refer below) for the year ended 30 June 2016.
The Financial Report of IEL comprises the consolidated Financial Report of IEL and its controlled entities, including IET and its controlled entities and Infigen Energy (Bermuda) Limited, (the Infigen Energy Group or Group).
The Financial Report of IET comprises the consolidated Financial Report of IET and its controlled entities (the Infigen Energy Trust Group or Trust).
Directors
The following people were Directors of IEL, IEBL and IERL during the whole of the financial year and up to the date of this report (unless otherwise indicated):
• Michael Hutchinson
• Philip Green
• Fiona Harris (granted leave of absence by the Board from 1 July 2015 to 29 February 2016)
• Ross Rolfe AO
• Sylvia Wiggins (appointed a Director on 18 April 2016)
• Miles George
Further Information on Directors
The particulars of the Directors of IEL, IERL and IEBL at or since the end of the financial year and up to the date of the Directors’ Report are set out below.
Name Particulars
Michael Hutchinson
Non-Executive Chairman of IEL, IEBL and IERL
Appointed to IEL, IEBL and IERL on 18 June 2009
Chairman of the Nomination and Remuneration Committee
Mike was appointed an independent non-executive director of Infigen Energy in June 2009 and subsequently elected Chairman on 11 November 2010. He is also Chairman of the Nomination and Remuneration Committee.
Mike was formerly an international transport engineering consultant, a senior Federal Government official and a corporate advisory consultant; and has extensive experience in the transport and communications sectors.
Mike has previously been a non-executive director of the Australian Infrastructure Fund Ltd, Leighton Holdings Ltd, Epic Energy Holdings Ltd, Hastings Funds Management Ltd, Westpac Funds Management Ltd, Pacific Hydro Ltd, OTC Ltd, HiTech Group Australia Ltd, the Australian Postal Corporation and the Australian Graduate School of Management Ltd.
Mike holds a first class honours degree in Civil Engineering from the University of Newcastle upon Tyne, United Kingdom, and graduated from the Harvard Business School Advanced Management Program (AMP110). He is a member of the Institution of Civil Engineers, the Institution of Highways and Transportation, Engineers Australia, and the Australian Institute of Company Directors.
Philip Green
Non-Executive Director of IEL, IEBL and IERL
Appointed to IEL, IEBL and IERL on 18 November 2010
Philip was appointed a non-executive director of Infigen Energy in November 2010.
Philip is a Partner of TCI Advisory Services LLP (TCI), an advisor to a substantial securityholder of Infigen Energy. Philip joined TCI in 2007 and his responsibilities include TCI’s global utility, renewable energy and infrastructure investments.
Prior to joining TCI, Philip led European Utilities equity research at Goldman Sachs, Merrill Lynch and Lehman Brothers over a 12-year period. Philip is a UK Chartered Accountant (ACA) and has a Bachelor of Science (Hons) in Geotechnical Engineering.
Fiona Harris
Non-Executive Director of IEL, IEBL and IERL
Appointed to IEL, IEBL and IERL on 21 June 2011
Chairman of the Audit, Risk and Compliance Committee
Member of the Nomination and Remuneration Committee
Fiona was appointed an independent non-executive director of Infigen Energy in June 2011 and is the Chairman of the Audit, Risk and Compliance Committee. Fiona is also a member of the Nomination and Remuneration Committee.
Fiona has been a professional non-executive director for the past 21 years, during which time she has been a director of organisations across a variety of industry sectors, including utilities, financial services, energy and natural resources and property, and been involved in a range of corporate transactions. Prior to this Fiona spent 14 years with KPMG, working in Perth, San Francisco and Sydney, and specialising in financial services.
Fiona is currently Chairman of Barrington Consulting Group, a director of BWP Trust and a director of Perron Group Limited. Fiona’s previous directorships of listed companies in the past three years were Aurora Oil & Gas Limited, Oil Search Limited, Sundance Resources Limited and Toro Energy Limited.
Fiona holds a Bachelor of Commerce degree and is a Fellow of Chartered Accountants Australia and New Zealand, and is a past State President and National Board Director of the Australian Institute of Company Directors.
DIRECTORS’ REPORT
30 INFIGEN ENERGY ANNUAL REPORT 2016

DIRECTORS’ REPORT (Continued)
Name Particulars
Ross Rolfe AO
Non-Executive Director of IEL, IEBL and IERL
Appointed to IEL, IEBL and IERL on 9 September 2011
Member of the Audit, Risk and Compliance Committee
Member of the Nomination and Remuneration Committee
Ross was appointed an independent non-executive director of Infigen Energy in September 2011. Ross is a member of the Audit, Risk and Compliance Committee and the Nomination and Remuneration Committee.
Ross has broad experience in the Australian energy and infrastructure sectors in senior management, government and strategic roles.
In August 2008 Ross was appointed to the position of Chief Executive Officer of Alinta Energy. Ross completed a capital restructuring of the business and stepped down from the CEO and Managing Director role in April 2011.
Prior to that appointment, Ross held the position of Director General of a range of Queensland Government Departments, including Premier and Cabinet, State Development, and Environment and Heritage, as well as the position of Co-ordinator General. Ross was also the Chief Executive Officer of Stanwell Corporation, one of Queensland’s largest energy generation companies, from 2001 until 2005. Ross was previously Chairman of WDS Limited and CS Energy, as well as a non-executive director of CMI Limited and Thiess Pty Ltd.
Ross is currently Chairman of the North Queensland Airports Group and a Director of Transurban Queensland and Tennis Queensland. Ross also holds a part-time senior executive role at Lend Lease.
Sylvia Wiggins
Non-Executive Director of IEL, IEBL and IERL
Appointed to IEL, IEBL and IERL on 18 April 2016
Member of the Audit, Risk and Compliance Committee
Sylvia was appointed an independent non-executive director of Infigen Energy in April 2016. Sylvia is a member of the Audit, Risk and Compliance Committee.
Sylvia has over 20 years’ experience as a legally qualified chief executive officer, executive and senior investment banker across a broad range of businesses and countries, most recently working in the energy, infrastructure, defence and structured finance areas.
Sylvia has originated, structured and advised upon transactions including capital and debt issuance, IPOs, asset acquisitions and divestments, mergers and acquisitions, and trade sales. Sylvia has also provided corporate advice covering strategic planning, commercial negotiations, capital management and corporate governance.
Sylvia manages her own advisory firm, which she established in 2014 having previously worked with a number of international investment and advisory firms. From 2009 to 2011 Sylvia worked at the Alinta Energy Group. Prior to that Sylvia was the inaugural Chief Executive Officer of Global Investments Limited, which is listed on the Singapore Stock Exchange.
Miles George
Executive Director of IEL, IEBL and IERL
Appointed to IEL, IEBL and IERL on 1 January 2009
Miles is the Managing Director of Infigen Energy and has over 20 years’ experience in business development, investment, financing and management roles in the infrastructure and energy sectors in Australia, the US and Europe.
Over the past 16 years Miles has been focused on development, investment, financing and management in the renewable energy industry.
Miles undertook a leading role in the development of Infigen’s first wind farm project at Lake Bonney in South Australia, commencing in 2000. In 2003 Miles jointly led the team that established the renewable energy business now known as Infigen Energy, and in 2005 Miles jointly led the Initial Public Offer and listing of Infigen’s business on the ASX.
Following listing, Miles continued to work on the development, financing and management of Infigen’s wind farm investments in Australia, the US and Europe. He was appointed as Managing Director of Infigen Energy in 2009.
Miles was elected Chairman of the Board of the Clean Energy Council in December 2013 and was re-elected as Chairman in December 2015. In December 2015 Miles was appointed as the Generator Representative on the Australian Energy Market Commission Reliability Panel.
Miles holds degrees of Bachelor of Engineering and Master of Business Administration (Distinction) from the University of Melbourne.
31

DIRECTORS’ REPORT (Continued)
Directors’ Interests in IFN Stapled Securities
One share in each of IEL and IEBL and one unit in IET have been stapled together to form a single stapled security, tradable on the Australian Securities Exchange under the “IFN” code. IERL is the Responsible Entity of IET. The table below lists the Directors of IEL, IEBL and IERL during the financial year, as well as showing the relevant interests of those Directors in IFN stapled securities during the financial year.
Directors Role
IFN Stapled Securities Held
Balance 1 July 2015
Acquired during
the yearSold during
the yearBalance
30 June 2016
M Hutchinson Independent Chairman 192,500 40,000 – 232,500
F Harris Independent Non-Executive Director 100,000 – – 100,000
P Green1 Non-Executive Director – – – –
R Rolfe Independent Non-Executive Director – 57,500 – 57,500
S Wiggins Independent Non-Executive Director – – – –
M George Executive Director 2,629,827 1,813,6742 (650,000)3 3,793,501
1 P Green is a Partner of TCI Advisory Services LLP which is an advisor to a substantial securityholder of IFN. Mr Green has advised Infigen that he does not have a relevant interest in those IFN securities.
2 The IFN securities acquired by M George during the year resulted from the vesting of Performance Rights relating to FY13 Long-Term Incentives as well as Deferred Short-Term Incentives earned in FY14.
3 M George sold IFN securities during the year to fund tax liabilities associated with the vesting of Performance Rights issued in accordance with the Infigen Energy Equity Plan.
Directors’ Meetings
The number of Board meetings and meetings of standing Committees established by the respective Boards held during the year ended 30 June 2016, and the number of meetings attended by each Director, are set out below.
Directors
Board Meetings Committee Meetings
IEL IERL IEBLAudit, Risk and
ComplianceIEL Nomination and
Remuneration
A B A B A B A B A B
M Hutchinson1 23 23 23 23 23 23 3 3 7 7
F Harris2 6 6 6 6 6 6 2 2 3 3
P Green3 21 23 21 23 21 23 3 3 n/a n/a
R Rolfe 21 23 21 23 21 23 5 5 7 7
S Wiggins4 2 2 2 2 2 2 2 2 n/a n/a
M George 23 23 23 23 23 23 n/a n/a n/a n/a
A = Number of meetings attended.B = Number of meetings held during the period that the person held office during the year.1 M Hutchinson was temporarily appointed to the Audit, Risk and Compliance Committee whilst F Harris was on leave and attended all Committee meetings during that period.2 F Harris was granted a leave of absence from 1 July 2015 to 29 February 2016. F Harris attended all Board and Committee meetings upon returning from leave through
to 30 June 2016.3 P Green was a member of the Audit, Risk and Compliance Committee from 1 July 2015 to 1 May 2016 and attended all Committee meetings during that period.4 S Wiggins was appointed a Director on 18 April 2016 and a member of the Audit, Risk and Compliance Committee on 1 May 2016, and attended all Board and Committee
meetings following appointment through to 30 June 2016.
Additional meetings of committees of Directors were held during the year, but these are not included in the above table (for example, where the Boards delegated authority to a committee of Directors to oversee or approve specific matters or otherwise approve documentation on behalf of the Boards).
Company Secretary
The name and particulars of the Company Secretary of IEL, IERL and IEBL during and since the end of the financial year are set out below.
Name Particulars
David Richardson
Company Secretary of IEL, IEBL and IERL
Appointed 26 October 2005
David is the General Manager Corporate Governance and Company Secretary of Infigen Energy, and is responsible for the company secretarial, risk management, insurances, corporate compliance and internal audit functions.
David joined Infigen Energy as Company Secretary in 2005. David was previously a Company Secretary within the AMP Group, including AMP Capital Investors, Financial Services and Insurance divisions, as well as holding prior financial services sector and regulatory positions.
David holds a Diploma of Law, Bachelor of Economics, Graduate Diploma in Company Secretarial Practice and is a Graduate of the AICD Company Directors Course. David is a Member of the Governance Institute of Australia and the Australian Institute of Company Directors.
32 INFIGEN ENERGY ANNUAL REPORT 2016

DIRECTORS’ REPORT (Continued)
Principal Activities
(i) Infigen Energy Group
The Infigen Energy Group is a specialist renewable energy business that develops, owns and operates energy generation assets.
Infigen currently owns and operates six wind farms and one solar farm in Australia. These generation assets have a combined installed capacity of 557 megawatts (MW) operating in New South Wales, South Australia and Western Australia.
Infigen also has a pipeline of development assets comprising approximately 1,100 MW (on an equity interest basis) of large‑scale wind and solar energy projects spread across five states in Australia.
(ii) Infigen Energy Trust
During the reporting period, IET held interests in financial investments.
In 2005, the units issued in IET were stapled to the shares issued by IEL and IEBL to form stapled securities. Since 2005, IET has raised the majority of the equity capital for the Group as part of the issue and listing of stapled securities on the Australian Securities Exchange. IET has also been the stapled entity that has enabled distributions to be paid to securityholders since that time.
Review of Operations
(i) Infigen Energy Group
During the year ended 30 June 2016, the Group recorded revenues of $173.2 million compared with $133.8 million in FY15, representing an increase of approximately 29.5%.
The Group recorded a statutory net profit for FY16 of $4.5 million compared to a net loss for FY15 of $303.6 million. The FY15 net loss included a loss from discontinued operations of $285.2 million following the sale of the US business.
Infigen has an operating capacity of 557 MW in Australia, comprising the following six wind farms:
• Alinta wind farm in Western Australia (89.1 MW)
• Capital wind farm in New South Wales (140.7 MW)
• Lake Bonney 1 wind farm in South Australia (80.5 MW)
• Lake Bonney 2 wind farm in South Australia (159.0 MW)
• Lake Bonney 3 wind farm in South Australia (39.0 MW)
• Woodlawn wind farm in New South Wales (48.3 MW)
Infigen also owns and operates the 0.1 MW Capital East energy storage and solar photovoltaic (PV) demonstration facility adjacent to its Capital wind farm.
Infigen holds a 100% equity interest in each of these assets. There was no change to Infigen’s operating capacity in Australia during FY16.
Of Infigen’s six operational wind farms, approximately 45‑50% of the production from these wind farms (electricity and LGCs) is currently contracted under medium and long‑term agreements. Merchant LGC exposure varies based on the Sydney Desalination Plant’s operating regime.
Key highlights for the Group during the year included:
• Safety: achieved a rolling 12‑month lost time injury frequency rate (LTIFR) of zero, with no lost time injuries (LTIs) since November 2013, and eight years without an LTI at the Alinta and Lake Bonney wind farms.
• Sale of US businesses: completed the sale of the US solar development assets and the US wind business resulting in approximately $100 million increase in cash available for growth.
• Net profit after tax: $4.5 million, a $308.1 million improvement compared to the prior corresponding period (pcp), which included a $285.2 million loss from discontinued US operations.
• Net profit after tax (continuing operations): $7.0 million, a $25.4 million improvement compared to the pcp, primarily due to higher electricity and LGC prices.
• EBITDA: $120.2 million, up 44% or $36.7 million on the pcp.
• Net operating cash flow (continuing operations): $56.9 million, up 71% or $23.7 million on the pcp.
• Reduced borrowings: $51.0 million of Global Facility borrowings repaid from operating cash flow and $5.5 million of Woodlawn facility borrowings repaid, with a net debt balance of $594.9 million at 30 June 2016.
• Organisational restructure: completed after the sale of the US businesses, to reduce corporate costs from FY17 and position the Australian business for growth.
• Growth and development: positioned development pipeline to respond to supportive market conditions.
(ii) Infigen Energy Trust Group
The profit attributable to unitholders of IET for the year ended 30 June 2016 was $28.6 million compared to a loss of $206.0 million for the prior year (following the impairment of loans in FY15).
Further commentary regarding the Group’s and Trust’s operating and financial performance for the year is included in the Management Discussion and Analysis of Financial and Operational Performance Report on pages 10‑23.
Distributions
No distribution for the year ended 30 June 2016 has been declared.
As previously advised, the sweeping of surplus cash flows from operating assets held within the Global Facility borrower group to repay debt effectively serves to continue to preclude the payment of distributions to securityholders from the borrower group.
Notwithstanding the sale of the US business increasing Infigen’s cash reserves, Infigen remains relatively highly geared and will continue to use the majority of its future net operating cash flow to repay borrowings.
Further details regarding distributions are set out in Note 22 to the Financial Statements.
Infigen Energy Trust
As at 30 June 2016, IET had 772,469,146 units on issue. During FY16, 4,581,565 units were issued by IET. These units were issued on 4 September 2015 in accordance with the Infigen Energy Equity Plan relating to vesting of FY13 LTI and FY14 Deferred STI obligations.
During FY16 the Responsible Entity of IET, Infigen Energy RE Limited, did not hold any units in IET.
As at 30 June 2016, IET held assets of $568.9 million (30 June 2015: $538.4 million). The increase was predominantly due to the Trust recognising $29.3 million for the unwinding of the discount of the loan receivable from related parties recognised in FY15.
33

DIRECTORS’ REPORT (Continued)
Further details regarding the assets held by IET during the financial year are set out in the Consolidated Statements of Financial Position and relevant Notes to the Financial Statements, including the basis for valuation of the assets as disclosed in Note 7.
Changes in State of Affairs
During the year management focused on efficiency improvements for the operating wind farms as well as continuing to advance the wind and solar PV projects in the development pipeline.
Infigen completed the sale of substantially all of its US solar development assets to a wholly owned subsidiary of SunPower Corporation on 27 July 2015. The residual US solar development assets were sold to Duke Energy Renewables on 21 December 2015.
Infigen completed the sale of its US wind business to a portfolio company affiliated with ArcLight Capital Partners, LLC on 28 October 2015.
Other changes in the state of affairs for the year are included in the Management Discussion and Analysis of Financial and Operational Performance Report.
Subsequent Events
Since the end of the financial year, in the opinion of the Directors, there have not been any transactions or events of a material or unusual nature likely to affect significantly the operations or affairs of IEL and IET in future financial periods.
Future Developments
The outlook for LGC and electricity market prices remains substantially higher than recently reported power purchase agreement prices. This price spread continues to widen, implying larger value transfers from developers to off‑takers. Attractive merchant opportunities now exist for projects with a low cost of energy.
Infigen’s extensive experience as a developer‑owner‑operator and acquirer of assets has created a disciplined investment appraisal culture where Infigen will only pursue opportunities with acceptable risk adjusted returns.
Infigen continues to participate in opportunities to secure power purchase agreements from formal tender processes and bilateral negotiations.
Infigen will also continue to assess corporate activity opportunities that might arise within the current fragmented renewable energy sector in Australia. New greenfield solar PV development initiatives to address the expected increased demand for solar projects will also be pursued.
The Queensland and Victorian state governments’ proposed renewable energy targets that will see those states increase their renewable energy ambition beyond the Federal targets will provide further opportunities for Infigen to build out its development pipeline.
The Federal Government has announced that it will commence consideration of the required emissions reduction policies in 2017, in close consultation with businesses and the community.
Further development of Federal and/or state‑based emissions reduction policies is required for Australia to meet its commitment under the Paris Agreement to reduce emissions by 26‑28% on 2005 levels by 2030. Australia’s commitment under that agreement to contribute its fair share of the global action required to limit temperature increases to well below two degrees will require much more ambitious emissions reduction targets.
Environmental Regulations
To the best of the Directors’ knowledge, Infigen has complied with all significant environmental regulations applicable to its operations.
Indemnification and Insurance of Officers
Infigen has agreed to indemnify all Directors and Officers against losses incurred in their role as Director, Alternate Director, Secretary, Executive or other employee of Infigen or its subsidiaries, subject to certain exclusions, including to the extent that such indemnity is prohibited by the Corporations Act 2001 or any other applicable law. Infigen will meet the full amount of any such liabilities, costs and expenses (including legal fees). Infigen has not been advised of any claims under any of the above indemnities.
During the financial year, Infigen paid insurance premiums for a Directors’ and Officers’ liability insurance contract which provides cover for the current and former Directors, Alternate Directors, Secretaries and Executive Officers of Infigen and its subsidiaries. The Directors have not included details of the nature of the liabilities covered in this contract or the amount of the premium paid, as disclosure is prohibited under the terms of the contract.
Proceedings on Behalf of Infigen
No person has applied for leave of the Court to bring proceedings on behalf of Infigen, or to intervene in any proceedings to which Infigen is a party, for the purpose of taking responsibility on behalf of Infigen for all or part of those proceedings. Infigen was not a party to any such proceedings during the year.
Former Partners of the Audit Firm
No current Directors or Officers of Infigen have been Partners of PricewaterhouseCoopers at a time when that firm has been the auditor of Infigen.
Non-Audit Services
Based on written advice of the Audit, Risk and Compliance Committee, the Directors are satisfied that the provision of non‑audit services during the year by the auditor (or by another person or firm on the auditor’s behalf) is compatible with the general standard of independence for auditors imposed by the Corporations Act 2001. Details of amounts paid or payable to the auditor for non‑audit services provided during the year by the auditor are outlined in Note 34 to the Financial Statements.
Auditor’s Independence Declaration
Infigen’s auditor has provided a written declaration under section 307C of the Corporations Act 2001 that to the best of its knowledge and belief, there have been no contraventions of:
• the auditor independence requirements of the Corporations Act 2001 in relation to the audit; and
• the applicable Australian code of professional conduct in relation to the audit.
The auditor’s independence declaration is attached to this Directors’ Report.
Rounding
Pursuant to ASIC Corporations (Rounding in Financial/Directors’ Reports) Instrument 2016/191, amounts in the Directors’ Report and the Financial Report are rounded to the nearest thousand dollars, unless otherwise indicated.
34 INFIGEN ENERGY ANNUAL REPORT 2016

DIRECTORS’ REPORT (Continued)
REMUNERATION REPORT
Dear Securityholder,
We are pleased to present the 2016 Remuneration Report.
Following the sale of the US business and the settlement of an amended Large‑scale Renewable Energy Target (LRET) in Australia, Infigen is in an improved position.
In February 2016 we restructured the business to reflect an Australian‑only operating business and create an increased organisational capability to take advantage of the emerging business opportunities within the Australian market.
The Board has maintained a disciplined approach to remuneration matters in FY16 with key management personnel (KMP) increases limited to 2.6%. Incentive arrangements continued to be structured such that achievement of the maximum Short Term Incentive (STI) and Long Term Incentive (LTI) opportunity requires stretch outperformance.
The FY14 Deferred STI payments and 70.3% of Tranche 2 of the FY13 LTI grant, which contained the EBITDA performance condition, vested when the trading window was opened for Infigen personnel on 23 December 2015. Infigen issued 4,581,565 securities on 4 September 2015 to meet these FY14 Deferred STI and FY13 LTI obligations.
When the next trading window opens, vesting will occur for:
• 100% of Tranche 1 of the FY13 LTI grant;
• 100% of Tranche 1 of the FY14 LTI grant;
• 90% of Tranche 2 of the FY14 LTI grant; and
• the FY15 Deferred STI payments.
This is the first time that the TSR performance condition has been met since the introduction of the LTI plan, thereby resulting in Tranche 1 LTI grants qualifying for vesting. In accordance with the Infigen Energy Equity Plan, Infigen will issue 8,108,219 securities to meet these vesting obligations, following release of the FY16 annual results.
There was no requirement to apply the clawback mechanism for any vested Deferred STI or LTI payments made to employees in the past financial year.
Directors’ fees again remained unchanged throughout the year. The Board approved payment of a Special Committee Fee to two non‑executive directors in respect of a project requiring their more intensive engagement. Ms Fiona Harris was granted a leave of absence as a Director from 1 July 2015 to 29 February 2016. During this period responsibility for chairing the Audit, Risk and Compliance Committee was shared between Mr Ross Rolfe and me.
The absence of a non‑executive director for this period highlighted the need for succession and diversity of experience to ensure that the Board had the skills and capability to maintain sound governance in the absence of any single director. In April 2016, following a formal search process, the Board appointed Ms Sylvia Wiggins to the Boards of Infigen Energy Limited, Infigen Energy (Bermuda) Limited and Infigen Energy RE Limited.
Yours faithfully,
Mike Hutchinson Chairman
Nomination and Remuneration Committee
35

DIRECTORS’ REPORT (Continued)
1. REMUNERATION REPORT – EXECUTIVE SUMMARY
The Nomination and Remuneration Committee has:
• reviewed executive and senior management salaries;
• monitored performance and the alignment of key performance indicators (KPIs) to business objectives and priorities;
• approved an organisational restructure for an Australian‑only operating business that has reduced corporate costs; and
• reviewed succession plans and organisational capability to support a growth strategy.
Significant matters to note for director, executive and senior management FY16 remuneration are:
• KMP remuneration was increased by 2.6%;
• Tranche 1 of the FY13 Long Term Incentive (LTI) grant met the relative total shareholder return performance condition following the final year retest period ending 30 June 2016. As a result 100% will vest; 2,805,266 securities will be issued following the release of the FY16 results to meet this obligation;
• Tranche 1 of the FY14 LTI grant also met the relative total shareholder return performance condition such that 100% will vest; 1,837,945 securities will be issued following the release of the FY16 results to meet this obligation;
• Tranche 2 of the FY14 LTI grant met the financial performance condition such that 90% will vest; 1,654,151 securities will be issued following the release of the FY16 results to meet this obligation. The remaining 10% of Tranche 2 will lapse;
• Deferred Short Term Incentive (STI) payments from FY14 vested on 23 December 2015. 2,609,463 securities were issued to meet this obligation;
• Deferred STI payments from FY15 will vest when the first trading window opens following the release of the FY16 results; 1,810,857 securities are expected to be issued to meet this obligation; and
• STI payment deferral continues to apply to 50% of an STI payment where that payment is over $100,000 and to the amount of an STI payment that exceeds $50,000 where the payment is less than $100,000. Deferred STI payments are awarded in the form of a grant of performance rights under the Infigen Energy Equity Plan.
2. REMUNERATION FRAMEWORK
Infigen’s remuneration framework aims to ensure remuneration:
• is commensurate with contributions, positions and responsibilities;
• is fair and reasonable relative to market benchmarks;
• is linked with Infigen’s strategic goals and business performance;
• rewards the delivery of consistently high performance;
• aligns performance with the organisational values and leadership behaviour;
• attracts and retains high performing individuals; and
• is aligned with the long‑term interests of securityholders.
3. REMUNERATION OF SENIOR MANAGEMENT
The remuneration framework for KMP comprises three components:
• fixed pay;
• an STI, which is a variable payment linked to achieving specified performance measures over a 12‑month period; and
• an LTI, which is a payment linked to meeting specified performance hurdles over a three or four‑year period.
Remuneration is benchmarked having regard to the advice of external advisers, Guerdon Associates, against industry peers within utilities, electricity generation and infrastructure.
3.1 Fixed Pay
Fixed pay is cash salary and superannuation. Infigen does not offer remuneration packaging other than superannuation salary sacrifice.
3.2 Short Term Incentives (STI)
STI is an at‑risk performance‑related component of remuneration. STIs are subject to performance against key performance indicators (KPIs). KPIs are set annually and reviewed during the year. KPIs are aligned with strategy, budget, and individual objectives and accountabilities.
Consistent with prior years, the Board has determined that it is appropriate and desirable to motivate and reward the key management personnel (KMP) to focus on delivering stable and predictable results by delivering annual improvements in operating efficiency (maximising production at lowest cost) to deliver cash flow outcomes.
36 INFIGEN ENERGY ANNUAL REPORT 2016

DIRECTORS’ REPORT (Continued)
The Board determines the aggregate amount of STI payments, the KPIs for the CEO, and the amount of the CEO’s STI payment; and reviews KPI achievement and STI payments for other KMP.
In setting the aggregate amount of the FY16 STI pool, the Board maintained the “gateway hurdles” within the FY16 STI scheme to establish the benchmark for determining what events will automatically trigger Board consideration to rerate the STI pool. The gateway hurdles are:
1) Non‑achievement of the Budgeted Operating Cash target; or
2) A material non‑compliance (breach) of a major debt facility; or
3) A “Catastrophic”, “Major” or multiple “Moderate” incidents occurring as defined in Infigen’s Risk Management Policy.
Consideration of the STI pool also has regard to the opportunities for management to influence a business outcome, and to those matters (such as wind speeds and energy market pricing) that are not subject to short‑term management influence but which are nonetheless required to be forecast as accurately as possible and variations managed professionally.
Reflecting the commitment of the Board and senior management to maintain a disciplined approach to managing operating costs and generating cash flow to reduce debt, the KMP financial goal outcomes determined 80% of the FY16 STI opportunity. Strategic and operational goal outcomes determined 20%.
We have set out in Table 1 a description of the FY16 KPIs used to determine the STI payments for KMP. Each KPI is weighted as a percentage of the total STI opportunity and includes an assessment criterion or hurdle. Each KPI contains quantitative measures including budget achievement and is scaled progressively around stretch targets. The hurdles are weighted so that better than budget performance results in self‑funded STI payments. The FY16 personal business goals support the alignment of strategic objectives and short‑term metrics. The Board retains discretion to vary the formulaic assessment of STI payments to allow for any “out of plan” developments, exceptional effort, or other relevant considerations. Such variation can be positive or negative.
TABLE 1: FY16 KPIs for STI
Financial Business Goals (Target Weighting of 80% of STI Target)
Measure Goals Hurdle
Stable, predictable and profitable performance – Safety
Achievement against a total reportable injury frequency rate (TRIFR) benchmark
Sliding scale of achievement where:
• Maximum 50% of the KPI weighting is paid for delivering on target; and
• 100% of the KPI weighting is paid for delivering better than target for safety performance.
In addition to completing site‑based critical control audits.
Stable, predictable and profitable performance – Total Costs
Achieve budget total costs Sliding scale of budget achievement where:
• Maximum 50% of the KPI weighting is paid for delivering on budget; and
• 100% of the KPI weighting is paid for delivering a stretch target for better than budget performance.
Stable, predictable and profitable performance – Operating Cash
Achieve budget operating cash Sliding scale of budget achievement where:
• Maximum 50% of the KPI weighting is paid for delivering on budget; and
• 100% of the KPI weighting is paid for delivering a stretch target for better than budget performance.
Personal Business Goals (Target Weighting of 20% of STI Target)
Measure Goals
Stable, predictable and profitable performance – Board Approved Initiatives
Develop and implement pro‑active Board‑approved measures within FY16, demonstrate substantial and sustainable progress towards realising Infigen’s commercial options within the Australian region to enhance profitability (EBITDA), including facilitating growth opportunities.
37

DIRECTORS’ REPORT (Continued)
3.2.1 FY16 Short Term Incentive Performance
To illustrate how individual STI payments are determined, we have included in Table 2 the range of KMP’s FY16 KPI assessments as a percentage of total STI opportunity. The resulting STI payments awarded to the KMP are illustrated in Table 3 in section 4.1.
TABLE 2: FY16 STI KPI opportunity and achievement
Measure Weighting as a % of Total OpportunityKMP Achievement as a % of Total Opportunity
Safety 5% 5%
Total Costs 25% 25%
Operating Cash 50% 50%
Personal Business Goals 20% 11% – 15%
Total 100% 91% – 95%
The Board exercised its discretion to award 13 employees, including the KMP, a supplementary STI payment in FY16. This supplementary payment was in recognition of exceptional efforts in completing two challenging transactions, favourably resolving a legacy operational issue and responding to inbound and pursuing outbound potential transactions, while continuing to manage day‑to‑day business responsibilities.
3.2.2 Short Term Incentive Deferral
STI payments include a 12‑month partial deferral condition. STI payment deferral continues to apply to 50% of an STI payment where that payment is over $100,000 and to the amount of an STI payment that exceeds $50,000 where the payment is less than $100,000. Deferred STI payments are awarded in the form of a grant of performance rights under the Infigen Energy Equity Plan. Each vested performance right will entitle the participant to receive one security or a cash amount equivalent to the market price of a security on the vesting date, with settlement in cash or securities determined by the Board in its absolute discretion.
The deferred STI will vest at the end of the deferral period provided the employee has not resigned or had their employment terminated for cause prior to vesting. The deferred payment may be reduced or forfeited if the STI payment was associated with a materially adverse financial misstatement, or, from FY17, if the achievement of a personal KPI proves in hindsight to have been materially overstated.
The deferral condition includes a clawback mechanism that complements the LTI clawback provision. These provisions enable forfeiture of some or all unvested STI and/or LTI related performance rights, if a previously vested LTI grant was associated with a materially adverse financial misstatement.
A total of $546,154 was deferred from FY15 STI payments in the form of 1,810,857 performance rights at a security value of $0.3016. A total of 1,810,857 securities are expected to be issued by Infigen following the release of the FY16 financial results to satisfy vesting obligations in relation to these deferred STI amounts. It is not presently intended to claw back any of these securities. Since recipients of these securities will incur an associated taxation liability, there will likely be some sales of securities to fund the tax liability. Any such sales are subject to Infigen’s Securities Trading Policy and insider trading laws.
3.3 Long Term Incentives
KMP in positions that can directly affect the long‑term value of Infigen securities may be eligible for LTIs. LTIs are awarded as future rights to acquire Infigen securities. The rights may vest after three or four years, subject to performance hurdles being met. Each vested performance right will entitle the participant to receive one security, or a cash amount equivalent to the market price of a security, on the vesting date. Settlement in cash or securities is determined by the Board in its absolute discretion.
The Managing Director’s grant is subject to securityholder approval.
The number of rights granted is based on the LTI value, divided by the reference price for Infigen securities. This is the volume weighted average ASX market price in the last five trading days of the prior financial year. For rights granted for FY16 the reference price was $0.3016; for FY17 the reference price will be $1.0465.
LTI grants comprise two equal tranches, each subject to a different performance test. Vesting of each Tranche is contingent on achieving the relevant performance hurdle.
38 INFIGEN ENERGY ANNUAL REPORT 2016

DIRECTORS’ REPORT (Continued)
The two performance hurdles are (a) Relative Total Shareholder Return (TSR) and (b) a financial performance test. The financial performance test is a test of the cumulative growth in the ratio of earnings before interest, taxes, depreciation and amortisation (EBITDA) to capital base.
Performance Test
Tranche 1 Relative TSR
Tranche 2 EBITDA/Capital
Both hurdles are measured initially over a three‑year period. The three‑year performance period of the FY16 Grant is 1 July 2015 to 30 June 2018. In the event that no performance rights vest after the initial three‑year performance period, then the LTI grant will be subject to a single re‑test on 30 June 2019, after which all unvested rights will lapse. The re‑test provision remains appropriate given the long‑term nature of the assets and the lead times involved in improving performance.
3.3.1 TSR performance condition
TSR measures the growth in the price of securities plus cash distributions notionally reinvested in securities. In order for any portion of the Tranche 1 Performance Rights to vest, the TSR of Infigen must outperform that of the median company in the S&P/ASX 200 index (excluding financial services and the materials/resources sector).
Tranche 1 Performance Rights vest progressively as follows:
Infigen Energy’s TSR performance compared to the relevant peer group
FY14, FY15 and FY16 Grant Percentage of Tranche 1 Performance Rights that vest
0 to 49th percentile Nil
50th percentile 25% of the Tranche 1 Performance Rights will vest
51st to 75th percentile 27% to 75% (i.e. for every percentile increase between 51% and 75% an additional 2% of the Tranche 1 Performance Rights will vest)
76th to 95th percentile 76.25% to 100% (i.e. for every percentile increase between 76% and 95% an additional 1.25% of the Tranche 1 Performance Rights will vest)
>95th percentile 100%
The current TSR vesting scale was introduced in FY12 recognising then that the Infigen security price did not reflect the true value of the business and to acknowledge that corporate strategies to reduce Global Facility debt would result in a significant rerating of the security price once completed.
During FY16 there has been a favourable rerating of the Infigen security price. The five‑day volume‑weighted average price (VWAP) as at 30 June 2016 ($1.0465) is 3.3 times higher than the same period ending 30 June 2011 ($0.3194), when the current vesting scale was introduced.
Following this rerating, the Board has amended the vesting scale of the TSR performance condition for future LTI grants to more closely align to market practice. The FY17 Tranche 1 Performance Rights will vest progressively from 25% to 75% of the relevant peer group performance as follows:
Infigen Energy’s TSR performance compared to the relevant peer group
FY17 Grant Percentage of Tranche 1 Performance Rights that vest
0 to 24th percentile Nil
25th percentile 25% of the Tranche 1 Performance Rights will vest
26th to 50th percentile 26% to 50% (i.e. for every percentile increase between 26% and 50% an additional 1% of the Tranche 1 Performance Rights will vest)
51st to 75th percentile 52% to 100% (i.e. for every percentile increase between 51% and 75% an additional 2% of the Tranche 1 Performance Rights will vest)
>75th percentile 100%
39

DIRECTORS’ REPORT (Continued)
3.3.2 EBITDA performance condition
The annual target is a specified percentage increase in the ratio of EBITDA to capital base over the year. The capital base will be measured as equity (net assets) plus net debt. Both the EBITDA and capital base are measured on a proportionately consolidated basis to reflect Infigen’s economic interest in all investments.
The annual target for FY16 was set to reflect the performance expectations of Infigen’s business and prevailing market conditions. The annual target for each subsequent financial year will be established by the Board based on stretch targets no later than the time of the release of Infigen’s annual financial results for the preceding financial year.
The prospective targets are set with reference to Infigen’s annual budgets. In prospect, they remain confidential to Infigen. However, each year’s target and the performance against that target are disclosed retrospectively.
The EBITDA performance condition rewards management for sustaining and delivering capital efficiency performance over an extended period.
Relevant metrics for the last four financial years and current period are provided in the table below.
30 June 2012
30 June 2013
30 June 2014
30 June 2015
30 June 2016
Closing security price ($) 0.225 0.251 0.242 0.320 1.005
EBITDA ($’000) 140,500 160,445 176,682 186,583 120,196
Capital base ($’000) 1,656,177 1,591,793 1,733,099 1,639,635 1,021,051
EBITDA to capital base (%) 8.48 10.08 10.19 11.38 11.77
Target (%) 9.26 9.40 10.03 10.83 10.00
Tranche 2 Performance Rights in FY14, FY15 and FY16 vest progressively as shown in the table below:
Infigen Energy’s EBITDA performanceFY14, FY15 and FY16 Grantpercentage of Tranche 2 Performance Rights that vest
0%‑90% Nil
90% ≤ 110% of the cumulative target For every 1% increase between 90% and 110% of EBITDA target, 5% of the Tranche 2 Performance Rights will vest
e.g. 91% of target = 5% vest; 100% of target = 50% vest; 110% of target = 100% vest
3.3.3 Long Term Incentive performance
Tranche 1 of the FY13 LTI grant was subject to a final retest as at 30 June 2016. Infigen engaged Orient Capital, who has the expertise and independence to conduct the TSR Calculation and Ranking Report for the period 1 July 2012 to 30 June 2016. As a result of the rerating of the Infigen security price over FY16, Infigen’s TSR performance for the four‑year measurement period was 387.51%, placing Infigen at 97.53% of the comparator group. This will result in 100% of the Tranche 1 Performance Rights vesting when the next trading window is opened following the release of the FY16 financial results.
The initial three‑year performance period for the FY14 LTI grant ended on 30 June 2016. Orient Capital provided the TSR Calculation and Ranking Report for the period 1 July 2013 to 30 June 2016. Infigen’s TSR performance for the three‑year measurement period was 324.21%, placing Infigen at 98.89% of the comparator group. This will result in 100% of the Tranche 1 Performance Rights vesting. The Tranche 2 financial performance condition of the FY14 LTI grant also passed the performance test as at 30 June 2016 resulting in 90% of the Tranche 2 Performance Rights vesting. Vesting of both tranches will occur when the first trading window opens after 1 July 2016. The remaining 10% of Tranche 2 will lapse. A total of 3,492,096 securities are expected to be issued by Infigen prior to the trading window opening following the release of the FY16 financial results.
3.4 Equity Plan rules
Performance rights and options are governed by the rules of the Equity Plan approved by securityholders in 2009 and 2011. The Equity Plan includes provisions under which the Board may exercise discretion to accelerate the vesting of any performance rights or options in the event of a change in control of Infigen. In exercising its discretion, the Board would intend to have regard to the performance, duration of the performance period and the nature of the relevant transaction.
During the year the Nomination and Remuneration Committee reviewed the policy in respect of any future change of control arrangement that may trigger the option to accelerate vesting of performance rights. The policy of assessing such vesting based on elapsed time within the vesting period and performance assessment (unless there was to be good reason to the contrary) was addressed. It emerged that the terms of the Equity Plan may imply that any residual performance rights that remained unvested after a partial acceleration, would remain on foot for assessment at the end of the original testing periods. The Board has exercised its authority under the Equity Plan to make an amendment that addresses this issue for all grants made under the Equity Plan from 1 July 2016. Where vesting of future grants is partially accelerated, the remaining unvested portion of that grant will, unless the Board determines otherwise, now automatically lapse.
3.5 Separation Benefits
The Board proposes to continue to limit any future separation benefits to a maximum of 12 months’ fixed remuneration.
40 INFIGEN ENERGY ANNUAL REPORT 2016

DIRECTORS’ REPORT (Continued)
4. INFIGEN ENERGY – KMP REMUNERATION DETAILS
In addition to the non‑executive directors, the following persons were the KMP of the Infigen Energy group during the financial year:
M George Chief Executive Officer
C Baveystock Chief Financial Officer
B Hopwood Executive General Manager Commercial and Corporate Finance
S Wright General Counsel
D Smith CEO US Business (until 28 October 2015)
4.1 Remuneration Received by Executive KMP during the year
The following table summarises the components of fixed and at‑risk remuneration KMP received in FY16 compared to FY15. The only cash remuneration received in FY16 was in the form of salary, superannuation, and non‑deferred STI and retention payments. The executive KMP received Infigen securities for the deferred STI and LTI that vested throughout the period.
TABLE 3: Remuneration received by executive KMP during the year
ExecutiveFixed
remunerationAwarded STI
(cash)
Vested deferred
STI1,2 Vested LTI2 Other
Total actual remuneration
received
$ $ $ $ $ $
M George FY16 636,000 300,580 486,749 416,279 – 1,839,608
FY15 620,000 135,405 159,426 56,050 – 970,881
C Baveystock FY16 362,000 120,525 150,108 120,095 – 752,728
FY15 353,000 50,000 55,712 18,938 – 477,650
B Hopwood FY16 362,000 124,845 139,325 93,810 – 719,980
FY15 353,000 56,653 61,793 18,938 – 490,384
S Wright FY16 362,000 129,110 139,301 56,404 – 686,815
FY15 353,000 54,825 49,267 – – 457,092
D Smith3,4,5 FY16 144,335 – 95,080 – 205,959 445,374
FY15 353,717 72,626 – – 120,170 546,513
FY16 1,866,335 675,060 1,010,564 686,587 205,959 4,444,505
FY15 2,032,717 369,509 326,198 93,927 120,170 2,942,520
1 The deferred STI payment is awarded in the form of a grant of performance rights under the Infigen Energy Equity Plan.2 The value of the vested award is calculated based on the taxable security price at vesting multiplied by the number of securities that vest.3 The remuneration amounts reflect a conversion of $AU into $US using an average rate of AU$0.8368 in FY15 and AU$0.7283 in FY16.4 D Smith was not offered an LTI in FY15 or FY16; instead he received a Capital Structure Improvement Bonus as shown in “Other”.5 D Smith ceased to be a KMP on 28 October 2015.
The amounts disclosed in Table 3 above are not the same as the remuneration expensed in relation to each KMP in accordance with the accounting standards ($3,918,298 for 2016, see Table 4). The directors believe that the remuneration received is more relevant to users for the following reasons:
• the statutory remuneration expensed is based on historic cost and does not reflect the value of the equity instruments when they are actually received by the KMPs;
• the statutory remuneration shows benefits before they are actually received by the KMPs; and
• where performance rights do not vest because the TSR Performance Condition is not satisfied, the company must still recognise the full amount of expense, even though the KMPs will never receive any benefits.
The information in this section has been audited together with the rest of the Remuneration Report.
41

DIRECTORS’ REPORT (Continued)
4.2 Statutory Remuneration Data for the Year Ended 30 June 2016
The Statutory Remuneration Data table below shows the accounting expensed amounts that reflect a portion of possible future remuneration arising from prior and current year LTI grants.
TABLE 4: Statutory remuneration data for executive KMP
Short-term employee benefits
Post employ-
ment benefits
Other long-term employee benefits Share-based payments
Executive Year Salary
STI paid in current
period Other
Non-monetary benefits1
Total of short-term employee
benefitsSuper-
annuationLSL
accrualEquity
settled2Cash
settled2 Total
$ $ $ $ $ $ $ $ $ $
M George FY16 616,692 300,580 – – 917,272 19,308 17,308 570,288 – 1,524,176
FY15 601,217 135,405 – – 736,622 18,783 11,302 616,523 – 1,383,237
C Baveystock FY16 342,693 120,525 – – 463,218 19,308 9,189 153,481 – 645,196
FY15 334,217 50,000 – – 384,217 18,783 5,796 187,153 – 595,949
B Hopwood FY16 342,693 124,845 – – 467,538 19,308 8,264 220,191 – 715,301
FY15 334,217 56,653 – – 390,870 18,783 12,119 177,334 – 599,106
S Wright FY16 342,693 129,110 – – 471,803 19,308 12,457 179,763 – 683,331
FY15 334,217 54,825 – – 389,042 18,783 8,621 132,602 – 549,048
D Smith3,4,5 FY16 125,924 – 205,959 8,509 340,392 9,902 – – – 350,294
FY15 344,118 72,626 120,170 23,223 560,137 9,599 – – 63,741 633,477
Total Remuneration
FY16 1,770,695 675,060 205,959 8,509 2,660,223 87,134 47,218 1,123,723 – 3,918,298
FY15 1,947,986 369,509 120,170 23,223 2,460,888 84,731 37,838 1,113,614 63,741 3,760,810
1 US health benefits (medical, dental, vision) are offered to all Infigen US employees.2 Includes the Deferred STI granted in the period.3 The remuneration amounts reflect a conversion of $AU into $US using an average rate of AU$0.8368 in FY15 and AU$0.7283 in FY16.4 D Smith was not offered an LTI in FY15 or FY16; instead he received a Capital Structure Improvement Bonus as shown in “Other”.5 D Smith ceased to be a KMP on 28 October 2015.
4.3 KMP Total Remuneration: Components of Fixed and Variable “at-risk” remuneration as a Proportion of Total Remuneration
The proportions of fixed remuneration to at‑risk performance‑based remuneration are decided on a case‑by‑case basis for each executive. The proportions for FY16 fixed remuneration and the at‑risk opportunity are set out below.
TABLE 5: Remuneration components for executive KMP in Financial Year 2016
0%
10%
20%
30%
40%
50%
60%
70%
80%
90%
100%
LTI OpportunitySTI OpportunityFixed Rem
D Smith*S WrightB HopwoodC BaveystockM George
*D Smith received a Capital Structure Improvement Bonus instead of an LTI.
42 INFIGEN ENERGY ANNUAL REPORT 2016

DIRECTORS’ REPORT (Continued)
4.4 Value of Remuneration That May Vest in Future Years
Remuneration amounts provided in the table below refer to the maximum value of performance rights relating to Infigen securities. These amounts have been determined at grant date by using a pricing model and amortised in accordance with AASB 2 Share-Based Payments. The minimum value of remuneration that may vest is nil.
TABLE 6: Remuneration that may vest in future years
Executive Grant
Maximum value of remuneration which is subject to vesting in accordance with AASB 2 Share-Based Payments
FY14 FY15 FY16 FY17 FY18
$ $ $ $ $
M George FY14 86,195 149,815 150,226
FY15 93,815 155,368 154,943
FY16 120,082 190,565 190,565
FY161 144,612 41,705
Total 86,195 243,630 570,288 387,213 190,565
C Baveystock FY14 25,497 44,316 44,437
FY15 27,751 45,958 45,833
FY16 27,319 37,346 37,346
FY161 35,767 10,315
Total 25,497 72,067 153,481 93,494 37,346
B Hopwood FY14 25,497 44,316 44,437
FY15 27,751 45,958 45,833
FY16 27,319 37,346 37,346
FY161 102,477 72,908
Total 25,497 72,067 220,191 156,087 37,346
S Wright FY14 15,791 27,447 27,522
FY15 17,187 28,464 28,387
FY16 16,838 23,018 23,018
FY161 106,939 78,324
Total 15,791 44,634 179,763 129,729 23,018
1 FY15 Deferred STI.
43

DIRECTORS’ REPORT (Continued)
4.5 Unvested Performance Rights
The table below provides details of outstanding performance rights relating to Infigen securities that have been granted to KMP (FY14, FY15 and FY16 Grants). The performance rights are valued as at the grant date even though the grant was based on the VWAP of the five trading days up to 30 June in the year prior to the grant.
TABLE 7: Unvested performance rights
Executive Grant Granted number Grant date
Value per performance right at grant
date
Value of performance
rights granted at grant date Potential vesting dates
$ $LTI
Tranche 1LTI
Tranche 2Deferred
STI
M George FY131,2 1,189,288 26 Oct 12 0.1492 177,427 30 Jun 15
FY14 2,071,146 2 Dec 13 0.1865 386,236 30 Jun 16 30 Jun 16
FY15 2,167,080 21 Nov 14 0.1865 404,127 30 Jun 17 30 Jun 17
FY16 1,780,504 13 Nov 15 0.2815 501,212 30 Jun 18 30 Jun 18
FY163 448,956 13 Nov 15 0.4150 186,317 15 Sep 16
C Baveystock FY131,2 347,254 26 Oct 12 0.1492 51,806 30 Jun 15
FY14 612,648 2 Dec 13 0.1865 114,249 30 Jun 16 30 Jun 16
FY15 641,026 21 Nov 14 0.1865 119,541 30 Jun 17 30 Jun 17
FY16 527,188 7 Oct 15 0.1935 102,011 30 Jun 18 30 Jun 18
FY163 161,691 7 Oct 15 0.2850 46,082 15 Sep 16
B Hopwood FY131,2 276,895 26 Oct 12 0.1492 41,309 30 Jun 15
FY14 612,648 2 Dec 13 0.1865 114,249 30 Jun 16 30 Jun 16
FY15 641,026 21 Nov 14 0.1865 119,541 30 Jun 17 30 Jun 17
FY16 527,188 7 Oct 15 0.1935 102,011 30 Jun 18 30 Jun 18
FY163 187,842 7 Oct 15 0.2850 53,535 15 Sep 16
FY164 174,072 14 Apr 16 0.7000 121,850 15 Sep 16
S Wright FY131,2 161,144 26 Oct 12 0.1429 24,041 30 Jun 15
FY14 379,447 2 Dec 13 0.1865 70,761 30 Jun 16 30 Jun 16
FY15 397,022 21 Nov 14 0.1865 74,038 30 Jun 17 30 Jun 17
FY16 324,934 7 Oct 15 0.1935 62,875 30 Jun 18 30 Jun 18
FY163 181,781 7 Oct 15 0.2850 51,808 15 Sep 16
FY164 190,650 14 Apr 16 0.7000 133,455 15 Sep 16
1 Relates to Tranche 1 of this grant that entered the fourth year retest.2 Vesting will occur when the first trading window opens following the release of the FY16 results.3 Relates to the STI deferred from FY15.4 Relates to the deferral of a Supplementary FY16 STI payment.
TABLE 8: Change in number of performance rights held by KMP
Set out below is the change in the number of performance rights held by KMP over the period 1 July 2015 to 30 June 2016.
Balance at 30 June 2015
Grantedduring FY16
Vestedduring FY16 Other changes1
Balance at 30 June 2016
M George 7,594,406 2,229,460 (1,813,674) (353,218) 7,656,974
C Baveystock 2,253,310 688,879 (549,248) (103,134) 2,289,807
B Hopwood 2,096,567 889,102 (483,760) (82,238) 2,419,671
S Wright 1,378,534 697,365 (393,061) (47,860) 1,634,978
1 Represents forfeitures due to vesting conditions not met.
44 INFIGEN ENERGY ANNUAL REPORT 2016

DIRECTORS’ REPORT (Continued)
5. KMP EMPLOYMENT CONTRACTS
The base salaries (excluding superannuation guarantee payments) for KMP as at 30 June 2016 are as follows:
M George $616,692
C Baveystock $342,693
B Hopwood $342,693
S Wright $342,693
Employment contracts relating to the KMP contain the following conditions:
Duration of contract • Open‑ended.
Notice period to terminate the contract • The employment of M George is able to be terminated by either party on six months’ written notice. For B Hopwood, C Baveystock and S Wright their employment is able to be terminated by either party on three months’ written notice. Infigen may elect to pay an amount in lieu of completing the notice period, calculated on the base salary as at the termination date.
Termination payments provided under the contract
• Upon termination, any accrued but untaken annual and long‑service (but not sickness or personal) leave entitlements, in accordance with applicable legislation, are payable. In the event of redundancy, a severance payment is payable equivalent to four weeks’ base salary for each year of service (or part thereof), up to a maximum of 36 weeks.
6. REMUNERATION OF NON-EXECUTIVE DIRECTORS
Non‑executive director fees are determined by the Infigen Boards within the aggregate amount approved by securityholders. The approved aggregate fee pool for IEL and IEBL is $1,000,000.
The fee paid to directors varies with individual Board and committee responsibilities. Director fees were not adjusted during the year and no change is proposed for FY17. Based on market data received from the Board‑appointed independent remuneration advisor, Guerdon Associates, Committee fees will be increased in FY17.
Non‑executive directors receive a cash fee for service inclusive of statutory superannuation. Non‑executive directors do not receive any performance‑based remuneration or retirement benefits other than statutory superannuation contributions.
6.1 Board/Committee Fees
Aggregate annual fees payable to non‑executive directors during the year ended 30 June 2016 are set out below.
Board/Committee Role FY16 Fee (pa)
Infigen Boards Chairman $250,000
Non‑Executive Director $125,000
Infigen Audit, Risk and Compliance Committees Chairman $21,000
Member $10,500
IEL Nomination and Remuneration Committee Chairman1 $12,000
Member $7,500
1 The present Committee Chairman is also the Chairman of the Board and does not receive this fee.
Aggregate annual fees payable to non‑executive directors in FY17 are set out below.
Board/Committee Role FY17 Fee (pa)
Infigen Boards Chairman $250,000
Non‑Executive Director $125,000
Infigen Audit, Risk and Compliance Committees Chairman $24,000
Member $12,000
IEL Nomination and Remuneration Committee Chairman1 $20,000
Member $10,000
1 The present Committee Chairman is also the Chairman of the Board and does not receive this fee.
45

DIRECTORS’ REPORT (Continued)
6.2 Remuneration of Non-Executive Directors for the Year Ended 30 June 2016
The nature and amount of each element of fee payments to each non‑executive director of Infigen for the years ended 30 June 2015 and 30 June 2016 are set out in the table below.
Non-Executive Directors Year
Fees Superannuation
Total $
IERL$
IEL and IEBL$ $
M Hutchinson1 FY16 101,505 129,188 19,307 250,000
FY15 101,735 129,482 18,783 250,000
P Green2 FY16 – – – –
FY15 – – – –
F Harris3 FY16 19,162 27,565 4,439 51,166
FY15 57,319 82,864 13,317 153,500
R Rolfe4,5 AO FY16 58,453 84,355 13,567 156,375
FY15 53,177 77,417 12,406 143,000
S Wiggins5,6 FY16 12,749 16,763 2,804 32,316
FY15 – – – –
Total remuneration FY16 191,869 257,871 40,117 489,857
FY15 212,231 289,763 44,506 546,500
1 M Hutchinson was acting Chair of the Audit, Risk and Compliance Committee for the period 1 July 2015 until 30 September 2015. Mr Hutchinson did not receive any additional fees during this period.
2 P Green was appointed as a Non‑Executive Director of Infigen Energy Limited, Infigen Energy (Bermuda) Limited and Infigen Energy RE Limited on 18 November 2010. Mr Green is a partner of TCI Advisory Services LLP, an advisor to a substantial shareholder of Infigen. Throughout FY16 Mr Green elected to receive no Director fees.
3 F Harris was granted a leave of absence as a Director on the Boards of Infigen Energy Limited, Infigen Energy (Bermuda) Limited and Infigen Energy RE Limited from 1 July 2015 to 29 February 2016.
4 R Rolfe AO was acting Chair of the Audit, Risk and Compliance Committee for the period 1 October 2015 until 29 February 2016. Mr Rolfe received the Chairman fees of this Committee for this period.
5 In addition to the existing Board and Committee fees, the Director is receiving a special committee fee, which is a temporary monthly project‑related fee.6 S Wiggins was appointed as a Non‑Executive Director of Infigen Energy Limited, Infigen Energy (Bermuda) Limited and Infigen Energy RE Limited on 18 April 2016.
7. GUIDELINE FOR MINIMUM SECURITYHOLDINGS FOR NON-EXECUTIVE DIRECTORS
In February 2014, the Board established a guideline where non‑executive directors, who receive payment of director fees from Infigen, are encouraged to acquire Infigen securities equivalent to the after‑tax value of one year’s director base fee. The acquisition of the relevant amount of Infigen securities should be completed within three years from the adoption of the guideline for existing non‑executive directors, or three years following appointment for subsequently elected non‑executive directors. The acquisition of Infigen securities under this guideline is subject to Infigen’s Securities Trading Policy and sufficient trading windows being open during the relevant period.
Two non‑executive directors acquired Infigen securities in FY16 as shown in Table 9: IFN Security Holdings of KMP.
TABLE 9: IFN security holdings of KMP
IFN security holdings of KMP, including held by their personally related parties, over the period 1 July 2015 to 30 June 2016.
Balance at 30 June 2015
Acquired during FY16
Soldduring FY16
Balance at 30 June 2016
M Hutchinson 192,500 40,000 – 232,500
P Green – – – –
F Harris 100,000 – – 100,000
R Rolfe AO – 57,500 – 57,500
S Wiggins – – – –
M George 2,629,827 1,813,674 (650,000) 3,793,501
C Baveystock 412,782 549,248 (512,030) 450,000
B Hopwood 364,331 483,760 (798,591) 49,500
S Wright – 393,061 (393,061) –
46 INFIGEN ENERGY ANNUAL REPORT 2016

DIRECTORS’ REPORT (Continued)
8. REMUNERATION ADVISER
The Nomination and Remuneration Committee engaged the services of Guerdon Associates throughout FY16 to:
• provide market data in relation to executive KMP remuneration against ASX‑listed industry peers within utilities, infrastructure and generation;
• provide market data in relation to non‑executive director remuneration against ASX‑listed industry peers within utilities, infrastructure and generation; and
• provide market data in relation to accelerated vesting of LTI.
The consultant provided no other services to the company during this period.
No advice was provided that falls within the definition of a remuneration recommendation of the Corporations Act 2001, Chapter 1, Part 1.2, Division 1, section 9B (1)(a) and (b).
To ensure the Nomination and Remuneration Committee is provided with advice and, as required, remuneration recommendations, free from undue influence by members of the executive KMP to whom the recommendations may relate, the engagement of Guerdon Associates is based on an agreed set of protocols to be followed by Guerdon Associates, members of the Committee and members of executive KMP.
The Board was satisfied that the advice received was free from undue influence of the executive KMP to whom the advice related because:
• Guerdon Associates was appointed by independent directors;
• Guerdon Associates did not provide services to management;
• reports with recommendations were only received by Non‑Executive Directors; and
• the agreed protocols were followed.
Pursuant to section 298(2) of the Corporations Act 2001, this report is made in accordance with resolutions of the Directors of Infigen Energy Limited and the Directors of Infigen Energy RE Limited, the responsible entity of the Infigen Energy Trust.
On behalf of the Directors of Infigen Energy Limited and Infigen Energy RE Limited:
Mike Hutchinson Miles GeorgeChairman Managing Director
Sydney, 29 August 2016
47

Auditor’s Independence Declaration
As lead auditor for the audit of Infigen Energy Group and Infigen Energy Trust Group for the year ended 30 June 2016, I declare that to the best of my knowledge and belief, there have been:
1. no contraventions of the auditor independence requirements of the Corporations Act 2001 in relation to the audit; and
2. no contraventions of any applicable code of professional conduct in relation to the audit.
This declaration is in respect of Infigen Energy Group and Infigen Energy Trust Group and the entities it controlled during the period.
Marc Upcroft SydneyPartnerPricewaterhouseCoopers
29 August 2016
PricewaterhouseCoopers, ABN 52 780 433 757 Darling Park Tower 2, 201 Sussex Street, GPO BOX 2650, SYDNEY NSW 1171T: +61 2 8266 0000, F: +61 2 8266 9999, www.pwc.com.au
Liability limited by a scheme approved under Professional Standards Legislation.
AUDITOR’S INDEPENDENCE DECLARATION
48 INFIGEN ENERGY ANNUAL REPORT 2016

CONSOLIDATED FINANCIAL STATEMENTS
Registered office and principal place of business: 56 Pitt Street Sydney NSW 2000
The financial statements were authorised for issue by the Directors on 29 August 2016. The Directors have the power to amend and reissue the financial statements.
All press releases, financial reports and other information are available on our website www.infigenenergy.com
CONSOLIDATED STATEMENTS OF COMPREHENSIVE INCOME 50
CONSOLIDATED STATEMENTS OF FINANCIAL POSITION 51
CONSOLIDATED STATEMENTS OF CHANGES IN EQUITY 52
CONSOLIDATED CASH FLOW STATEMENTS 54
NOTES TO THE CONSOLIDATED FINANCIAL STATEMENTS 56
ABOUT THIS REPORT 56
Critical accounting estimates and judgements 56
Basis of consolidation 57
Foreign currency 57
Other accounting policies 57
PERFORMANCE FOR THE YEAR 58
1. Segment information 58
2. Revenue 60
3. Other income 60
4. Expenses 61
5. Income taxes and deferred taxes 62
6. Earnings per share/unit 66
OPERATING ASSETS AND LIABILITIES 68
7. Trade and other receivables 68
8. Inventory 69
9. Property, plant and equipment 69
10. Intangible assets 71
11. Valuation of non‑financial assets 73
12. Trade and other payables 75
13. Provisions 75
CAPITAL MANAGEMENT 77
14. Cash and cash equivalents 77
15. Borrowings 78
16. Other financial assets and liabilities 81
17. Fair value hierarchy 82
18. Financial risk management 84
EQUITY 93
19. Contributed equity 93
20. Reserves 94
21. Retained earnings 95
22. Distributions 95
GROUP STRUCTURE 96
23. Investment in associates and joint ventures 96
24. Discontinued operations 97
25. Subsidiaries 98
26. Deed of Cross Guarantee 100
27. Parent disclosures 102
UNRECOGNISED ITEMS 103
28. Commitments 103
29. Contingent liabilities 104
30. Events occurring after the reporting period 104
OTHERS 104
31. Related party transactions 104
32. Share‑based payments 105
33. Key management personnel disclosures 108
34. Remuneration of auditors 108
35. New and amended accounting standards 109
DIRECTORS’ DECLARATION 110
INDEPENDENT AUDITOR’S REPORT 111
ADDITIONAL INVESTOR INFORMATION 113
GLOSSARY 116
49

CONSOLIDATED STATEMENTS OF COMPREHENSIVE INCOMEFOR THE YEAR ENDED 30 JUNE 2016
Infigen Energy Group Infigen Energy Trust Group
Note2016
$’0002015
$’0002016
$’0002015
$’000
Revenue from continuing operations 2 173,229 133,807 – –
Other income 3 790 9,181 29,326 7
Operating expenses (37,401) (34,743) – –
Corporate costs (13,997) (13,541) (20) (21)
Development costs (1,667) (1,976) – –
Responsible entity expenses – – (678) (675)
Depreciation and amortisation expense 4 (51,950) (54,497) – –
Impairment of financial assets 4 – – – (205,300)
Interest expense 4 (51,963) (53,163) – –
Other finance costs 4 (6,417) (3,251) – –
Share of net profit/(loss) of associates and joint ventures 25 (66) – –
Net profit/(loss) before income tax benefit 10,649 (18,249) 28,628 (205,989)
Income tax expense 5 (3,616) (183) – –
Profit/(loss) from continuing operations 7,033 (18,432) 28,628 (205,989)
Loss from discontinued operations 24 (2,547) (285,171) – –
Net profit/(loss) for the year 4,486 (303,603) 28,628 (205,989)
Other comprehensive income/(loss)
Items that may be reclassified to profit or loss
Exchange differences on translation of foreign operations 20(a) 6,774 39,093 – –
Changes in the fair value of cash flow hedges, net of tax 20(b) 7,617 32,062 – –
Other comprehensive income for the year, net of tax 14,391 71,155 – –
Total comprehensive income/(loss) for the year, net of tax 18,877 (232,448) 28,628 (205,989)
Net profit/(loss) for the year is attributable to stapled securityholders as:
Equity holders of the parent 5,565 (303,018) – –
Equity holders of the other stapled entities (non‑controlling interests) (1,079) (585) 28,628 (205,989)
4,486 (303,603) 28,628 (205,989)
Total comprehensive income/(loss) for the year is attributable to stapled securityholders as:
Equity holders of the parent 19,956 (231,863) – –
Equity holders of the other stapled entities (non‑controlling interests) (1,079) (585) 28,628 (205,989)
18,877 (232,448) 28,628 (205,989)
Earnings per security of the parent based on income/(loss) from continuing operations attributable to the equity holders of the parent
Basic (cents per security/unit) 6 1.1 (2.3) 3.7 (26.8)
Diluted (cents per security/unit) 6 1.0 (2.3) 3.7 (26.8)
Earnings per security of the parent based on income/(loss) from discontinued operations attributable to the equity holders of the parent
Basic (cents per security/unit) 6 (0.3) (37.2) – –
Diluted (cents per security/unit) 6 (0.3) (37.2) – –
The above consolidated statements of comprehensive income should be read in conjunction with the accompanying notes.
50 INFIGEN ENERGY ANNUAL REPORT 2016

CONSOLIDATED STATEMENTS OF FINANCIAL POSITIONAS AT 30 JUNE 2016
Infigen Energy Group Infigen Energy Trust Group
Note2016
$’0002015
$’0002016
$’0002015
$’000
Current assets
Cash and cash equivalents 14 147,602 45,182 405 399
Trade and other receivables 7 20,369 72,556 – –
Inventory 8 20,620 12,695 – –
Derivative financial instruments 16 355 566 – –
Assets of disposal group classified as held for sale 24 – 1,286,840 – –
Total current assets 188,946 1,417,839 405 399
Non-current assets
Receivables 7 3,769 4,163 568,446 538,000
Derivative financial instruments 16 132 53 – –
Investment in associates 23 1,258 452 – –
Property, plant and equipment 9 783,819 830,167 – –
Deferred tax assets 5 51,937 49,301 – –
Intangible assets 10 122,671 126,823 – –
Total non-current assets 963,586 1,010,959 568,446 538,000
Total assets 1,152,532 2,428,798 568,851 538,399
Current liabilities
Trade and other payables 12 17,356 28,981 4,858 4,179
Borrowings 15 73,601 46,259 – –
Derivative financial instruments 16 25,681 30,698 – –
Provisions 13 2,900 1,588 – –
Liabilities of disposal group classified as held for sale 24 – 965,279 – –
Borrowings and swaps associated with sale of discontinued operations 15, 16 – 277,588 – –
Total current liabilities 119,538 1,350,393 4,858 4,179
Non-current liabilities
Borrowings 15 668,889 740,624 – –
Derivative financial instruments 16 75,119 68,648 – –
Provisions 13 8,421 8,229 – –
Total non-current liabilities 752,429 817,501 – –
Total liabilities 871,967 2,167,894 4,858 4,179
Net assets 280,565 260,904 563,993 534,220
Equity holders of the parent
Contributed equity 19 2,305 2,305 755,748 754,603
Reserves 20 (106,451) (120,481) – –
Retained earnings 21 (353,125) (358,690) (191,755) (220,383)
(457,271) (476,866) 563,993 534,220
Equity holders of the other stapled entities (non-controlling interests)
Contributed equity 19 762,009 760,864 – –
Retained earnings 21 (24,173) (23,094) – –
737,836 737,770 – –
Total equity 280,565 260,904 563,993 534,220
The above consolidated statements of financial position should be read in conjunction with the accompanying notes.
51

CONSOLIDATED STATEMENTS OF CHANGES IN EQUITYFOR THE YEAR ENDED 30 JUNE 2016
Infigen Energy Group
Note
Attributable to Equity Holders of the Parent
Non-controlling
interests $’000
Total equity $’000
Contributed equity $’000
Reserves $’000
Retained earnings
$’000
Total equity of
the parent $’000
Total equity at 1 July 2014 2,305 (192,221) (55,672) (245,588) 737,646 492,058
Net loss for the year – – (303,018) (303,018) (585) (303,603)
Changes in the fair value of cash flow hedges, net of tax 20(b) – 32,062 – 32,062 – 32,062
Exchange differences on translation of foreign operations and movement in fair value 20(a) – 39,093 – 39,093 – 39,093
Total comprehensive income/(loss) for the year – 71,155 (303,018) (231,863) (585) (232,448)
Transactions with owners in their capacity as owners:
Recognition of share‑based payments 20(d) – 585 – 585 709 1,294
Total equity at 30 June 2015 2,305 (120,481) (358,690) (476,866) 737,770 260,904
Total equity at 1 July 2015 2,305 (120,481) (358,690) (476,866) 737,770 260,904
Net profit for the year – – 5,565 5,565 (1,079) 4,486
Changes in the fair value of cash flow hedges, net of tax 20(b) – 7,617 – 7,617 – 7,617
Exchange differences on translation of foreign operations and movement in fair value 20(a) – 6,774 – 6,774 – 6,774
Total comprehensive income/(loss) for the year – 14,391 5,565 19,956 (1,079) 18,877
Transactions with owners in their capacity as owners:
Recognition of share‑based payments 20(d) – (361) – (361) 1,145 784
Total equity at 30 June 2016 2,305 (106,451) (353,125) (457,271) 737,836 280,565
52 INFIGEN ENERGY ANNUAL REPORT 2016

CONSOLIDATED STATEMENTS OF CHANGES IN EQUITY (Continued)
Infigen Energy Trust Group
Note
Contributed equity $’000
Retained earnings
$’000
Total equity $’000
Total equity at 1 July 2014 753,894 (14,394) 739,500
Net loss for the year – (205,989) (205,989)
Changes in the fair value of cash flow hedges, net of tax 20(b) – – –
Exchange differences on translation of foreign operations and movement in fair value 20(a) – – –
Total comprehensive income/(loss) for the year – (205,989) (205,989)
Transactions with owners in their capacity as owners:
Recognition of share‑based payments 709 – 709
Total equity at 30 June 2015 754,603 (220,383) 534,220
Total equity at 1 July 2015 754,603 (220,383) 534,220
Net profit for the year – 28,628 28,628
Changes in the fair value of cash flow hedges, net of tax 20(b) – – –
Exchange differences on translation of foreign operations and movement in fair value 20(a) – – –
Total comprehensive income/(loss) for the year – 28,628 28,628
Transactions with owners in their capacity as owners:
Recognition of share‑based payments 1,145 – 1,145
Total equity at 30 June 2016 755,748 (191,755) 563,993
The above consolidated statements of changes in equity should be read in conjunction with the accompanying notes.
53

CONSOLIDATED CASH FLOW STATEMENTSFOR THE YEAR ENDED 30 JUNE 2016
Infigen Energy Group Infigen Energy Trust Group
Note2016
$’0002015
$’0002016
$’0002015
$’000
Cash flows from operating activities
Profit/(loss) for the year 4,486 (303,603) 28,628 (205,989)
Adjustments for:
Loss for the year from discontinued operations 24 2,547 285,171 – –
(Gain)/loss on revaluation for fair value through profit or loss financial assets – financial instruments – (2,642) – –
Depreciation and amortisation of non‑current assets 51,950 54,497 – –
Impairment of financial assets – – – 205,300
Unwind of discount on related party loan receivables – – (29,321) –
Unrealised foreign exchange loss/(gain) 5,396 (4,382) – –
Amortisation of share‑based payments expense 32 536 720 – –
Amortisation of borrowing costs capitalised 1,523 1,807 – –
Share of (profits)/losses from associates (25) 64 – –
Accretion of decommissioning and restoration provisions 119 117 – –
Income tax expense 3,616 – – –
(Increase)/decrease in deferred tax assets (2,636) 1,619 – –
Changes in operating assets and liabilities, net of effects on disposal of controlled entities:
(Increase)/decrease in assets:
Current receivables and other current assets (10,425) 1,575 – –
Increase/(decrease) in liabilities:
Current payables (376) (1,967) 678 668
Non‑current payables 192 217 – –
Net cash flow from operating activities (continuing operations) 56,903 33,193 (15) (21)
Net cash flow from operating activities (discontinued operations) – 46,318 – –
Cash flows from investing activities
Payments for property, plant and equipment (1,987) (1,048) – –
Payments for intangible assets (1,693) (52) – –
Payments for investments in associates and joint ventures (781) –
Proceeds transferred from discontinued operations from the sale of the US business 102,030 – – –
Contribution for US developments and investments – (10,481) – –
Net cash flow from investing activities (continuing operations) 97,569 (11,581) – –
Net cash flow from investing activities (discontinued operations) 300,532 (4,688) – –
54 INFIGEN ENERGY ANNUAL REPORT 2016

CONSOLIDATED CASH FLOW STATEMENTS (Continued)
Infigen Energy Group Infigen Energy Trust Group
Note2016
$’0002015
$’0002016
$’0002015
$’000
Cash flows from financing activities
Proceeds transferred from discontinued operations used to repay borrowings and interest – 20,218 – –
Proceeds from issue of equity securities – – 1,146 709
Repayment of borrowings 15 (56,462) (66,049) – –
Repayment from/(loans to) related parties – – (1,125) (681)
Net cash flow from financing activities (continuing operations) (56,462) (45,831) 21 28
Net cash flow from financing activities (discontinued operations) (300,532) (46,149) – –
Net increase/(decrease) in cash and cash equivalents 98,010 (28,738) 6 7
Cash and cash equivalents at the beginning of the financial year 45,182 80,699 399 392
Effects of exchange rate changes on the balance of cash held in foreign currencies 4,410 2,458 – –
Cash and cash equivalents at the end of the financial year 147,602 54,419 405 399
Included in cash and cash equivalents per the balance sheet 14 147,602 45,182 405 399
Included in assets of disposal group classified as held for sale – 9,237 – –
The above consolidated cash flow statements should be read in conjunction with the accompanying notes.
55

NOTES TO THE CONSOLIDATED FINANCIAL STATEMENTSFOR THE YEAR ENDED 30 JUNE 2016ABOUT THIS REPORT
ABOUT THIS REPORT As permitted by ASIC Class Order 05/642, this consolidated general purpose financial report for the year ended 30 June 2016 consists of consolidated financial statements and accompanying notes of both:
• Infigen Energy Group (the Group), being Infigen Energy Limited (IEL), Infigen Energy Trust (IET), Infigen Energy (Bermuda) Limited (IEBL) and the controlled entities of IEL and IET; and
• Infigen Energy Trust Group (the Trust), being Infigen Energy Trust (IET) and its controlled entities.
The Group and the Trust are for‑profit entities for the purpose of preparing the financial statements. The Group and the Trust are incorporated and domiciled in Australia.
This financial report is a general purpose financial report that:
• treats Infigen Energy Limited as the “parent” of the stapled entity for the purposes of preparing consolidated financial statements, with the other stapled entities being presented as non‑controlling interests in accordance with the relief available to stapled entities in ASIC Class Order 13/1050 as amended by Class Order 13/1644 which enables stapled entities to present consolidated or combined financial statements;
• has been prepared in accordance with the requirements of the Corporations Act 2001, Australian Accounting Standards and other authoritative pronouncements of the Australian Accounting Standards Board (AASB) and International Financial Reporting Standards (IFRS) as issued by the International Accounting Standards Board (IASB);
• has been prepared under the historical cost convention, as modified by the revaluation of financial assets and liabilities (including derivative instruments) at fair value through profit or loss, and as modified by reductions in carrying value of assets from impairment expenses;
• has been prepared on the basis of the legislative and regulatory regime that exists as at 30 June 2016 and at the date of this report. Changes to the regulatory regime would be likely to impact the carrying values of assets and future renewable energy project development;
• is presented in Australian Dollars with all values rounded off to the nearest thousand dollars, unless otherwise stated, in accordance with the Australian Securities and Investments Commission (ASIC) Corporations (Rounding in Financial/Directors’ Reports) Instrument 2016/191;
• adopts all new and amended Accounting Standards and Interpretations issued by AASB that are relevant to operations of the Group and/or the Trust and effective for the reporting periods beginning on or after 1 July 2015.
Stapled securities
The shares of IEL and IEBL and the units of IET are combined and issued as stapled securities in Infigen Energy Group. The shares of IEL and IEBL and the units of IET cannot be traded separately and can only be traded as stapled securities.
Trust information
IET was established in Australia on 16 June 2003. On 26 September 2005, IET became a Registered Scheme and Infigen Energy RE Limited (IERL) became the Responsible Entity of IET. The relationship of the Responsible Entity with the Scheme is governed by the terms and conditions specified in the Constitution of IET.
Critical accounting estimates and judgements
The Group or the Trust makes estimates and assumptions concerning the future that are regularly evaluated based on historical experience and other factors. This includes expectations of future events that may have a financial effect on the Group and the Trust and that are believed to be reasonable under the circumstances. The resulting accounting estimates will, by definition, seldom equal the related actual results. Estimates and judgements that are material to the financial report are found in the following notes:
Note 5 Income taxes and deferred taxes
Note 7 Trade and other receivables
Note 9 Property, plant and equipment
Note 10 Intangible assets
Note 11 Valuation of non‑financial assets
Note 13 Provisions
Note 17 Fair value hierarchy
56 INFIGEN ENERGY ANNUAL REPORT 2016

NOTES TO THE CONSOLIDATED FINANCIAL STATEMENTSABOUT THIS REPORT (Continued)
Basis of consolidation
For the purpose of UIG 1013 Pre-date of Transition Stapling Arrangements and AASB Interpretation 1002 Post-date of Transition Stapling Arrangements, IEL was identified as the parent entity of the Group in relation to the pre‑date of transition stapling with IET and the post‑date of transition stapling with IEBL. In accordance with UIG 1013, the results and equity of IEL and of IET have been combined in the financial statements of the Group. However, since IEL had entered into both pre‑ and post‑date of transition stapling arrangements, the results and equity of IET and IEBL are both treated and disclosed as non‑controlling interests in the financial statements of the Group under the principles established in AASB Interpretation 1002.
The consolidated financial statements comprise the financial statements of all controlled entities (subsidiaries) of the Group and the Trust at year ended 30 June 2016. A list of the subsidiaries at year end is contained in Note 25.
The financial statements of all subsidiaries are prepared for the same reporting period as the parent company and apply consistent accounting policies to all the years presented, unless otherwise stated.
In preparing the consolidated financial statements, all intercompany transactions, balances, income and expenses and profits and losses resulting from intra‑group transactions have been eliminated. Unrealised gains and/or losses are also eliminated unless the transaction provides evidence of the impairment of the asset transferred. Subsidiaries are fully consolidated from the date on which control is transferred to the Group or the Trust. They are de‑consolidated from the date that control ceases. The purchase method of accounting is used to account for the acquisition of subsidiaries by the Group or the Trust.
The Group applies a policy of treating transactions with non‑controlling interests as transactions with a shareholder external to the Group. Purchases from non‑controlling interests result in an acquisition reserve being the difference between any consideration paid and the relevant share acquired of the carrying value of identifiable net assets of the subsidiary. Non‑controlling interests in the results and equity of subsidiaries are shown separately in the consolidated income statement and balance sheets respectively.
Foreign currency
Functional and presentation currency
Items included in the financial statements of each of the Group’s or the Trust’s entities are measured using the currency of the primary economic environment in which the entity operates (“the functional currency”). The consolidated financial statements are presented in Australian dollars, which is the Group’s and the Trust’s presentation currency.
Transactions and balances
Foreign currency transactions are translated into the functional currency using the exchange rates prevailing at the dates of the transactions. Foreign exchange gains and losses resulting from the settlement of such transactions and from the translation at year‑end exchange rates of monetary assets and liabilities denominated in foreign currencies are recognised in the income statement, except when they are deferred in equity as qualifying net investment hedges or are attributable to part of the net investment in a foreign operation.
Translation differences on non‑monetary financial assets and liabilities such as equities held at fair value through profit or loss are recognised in profit or loss as part of the fair value gain or loss.
The results and financial position of all Group or Trust entities (none of which has the currency of a hyperinflationary economy) that have a functional currency different from the presentation currency are translated into the presentation currency as follows:
• assets and liabilities for each balance sheet presented are translated at the closing rate at the date of that balance sheet;
• income and expenses for each income statement are translated at average exchange rates (unless this is not a reasonable approximation of the cumulative effect of the rates prevailing on the transaction dates, in which case income and expenses are translated at the dates of the transactions); and
• all resulting exchange differences are recognised as a separate component of equity.
On consolidation, exchange differences arising from the translation of any net investment in foreign entities including balances of cash held in foreign currency, and of borrowings and other financial instruments designated as hedges of such investments, are taken to shareholders’ equity. When a foreign operation is sold or any borrowings forming part of the net investment are repaid, a proportionate share of such exchange differences is recognised in the income statement, as part of the gain or loss on sale where applicable.
Goodwill and fair value adjustments arising on the acquisition of a foreign entity are treated as assets and liabilities of the foreign entities and translated at the closing rate.
Other accounting policies
Significant and other accounting policies that summarise the measurement basis used and are relevant to an understanding of the financial statements are provided throughout the notes to the financial statements.
A number of new or amended standards became applicable for the current reporting period, however, the Group or the Trust did not have to change its accounting policy or make retrospective adjustments as a result of adopting these standards. Details of new and amended accounting standards are outlined in Note 35.
57

NOTES TO THE CONSOLIDATED FINANCIAL STATEMENTSPERFORMANCE FOR THE YEAR
PERFORMANCE FOR THE YEAR
1. Segment information
a) Segment information provided to the Board of Directors
Operating segments are reported in a manner that is consistent with the internal reporting provided to the chief operating decision‑maker. The Group has determined the operating segments based on the reports reviewed by the Board of Directors of IEL that are used to make strategic decisions.
The Board of Directors considers the business primarily from a geographic perspective and has identified one reportable segment. The reporting segment consists of the renewable energy businesses held in Australia.
The Board of Directors assesses the performance of the operating segments based on a measure of EBITDA (Segment EBITDA).
This measurement basis (Segment EBITDA) excludes the effects of equity‑settled share‑based payments which are included in corporate costs and unrealised gains/losses on financial instruments.
Interest income and expenditure are allocated to Australia as this type of activity is driven by the corporate treasury function of the continuing operations, which manages the cash position of the Group.
The Board of Directors reviews segment revenues on a proportional basis, reflective of the economic ownership held by the Group.
The segment information provided to the Board of Directors for the operating segments together with a reconciliation of segment EBITDA to operating profit/(loss) before income tax for the year ended 30 June 2016 is below. Segment EBITDA excludes discontinued operations.
Infigen Energy Group
Statutory basis
$’000Australia
$’000US
$’000Unallocated
$’000
Year ended 30 June 2016
Segment revenue 173,229 173,229 – –
Operating costs (37,401) (37,401) – –
Segment EBITDA from continuing operations 135,828 135,828 – –
Corporate costs (13,997) – – (13,997)
Development costs (1,667) (1,667) – –
Share of net profit of associates 25 25 – –
Other income and costs 7 7 – –
EBITDA 120,196 134,193 – (13,997)
Depreciation and amortisation (51,950) (51,950) – –
EBIT 68,246 82,243 – (13,997)
Net finance costs (57,597) (57,597) – –
Profit before income tax 10,649 24,646 – (13,997)
Tax expense (3,616) (3,616) – –
Loss from discontinued operations (2,547) – (2,547) –
Net profit after tax 4,486 21,030 (2,547) (13,997)
Year ended 30 June 2015
Segment revenue 133,807 133,807 – –
Operating costs (34,743) (34,743) – –
Segment EBITDA from continuing operations 99,064 99,064 – –
Corporate costs (13,541) – – (13,541)
Development costs (1,976) (1,976) – –
Share of losses of associates (66) (66) – –
Other income and costs 12 12 – –
EBITDA 83,493 97,034 – (13,541)
Depreciation and amortisation (54,497) (54,497) – –
EBIT 28,996 42,537 – (13,541)
Net finance costs (47,245) (47,245) – –
Loss before income tax (18,249) (4,708) – (13,541)
Tax expense (183) (183) – –
Loss from discontinued operations (285,171) – (285,171) –
Net loss after tax (303,603) (4,891) (285,171) (13,541)
58 INFIGEN ENERGY ANNUAL REPORT 2016

NOTES TO THE CONSOLIDATED FINANCIAL STATEMENTSPERFORMANCE FOR THE YEAR (Continued)
A summary of assets and liabilities by operating segment is provided as follows:
Infigen Energy Group
Statutory basis
$’000
Add: Share of assets and
liabilities of associates
and JVs $’000
Total economic
interest basis $’000
Australia $’000
US $’000
As at 30 June 2016
Assets of continuing operations 1,152,532 – 1,152,532 1,152,532 –
Total segment assets 1,152,532 – 1,152,532 1,152,532 –
Total assets of continuing operation includes:
Investment in associates and joint ventures 1,258 (1,258) – – –
Additions to non‑current assets (other than financial assets and deferred tax) 3,680 – 3,680 3,680 –
Liabilities of continuing operations 871,967 – 871,967 871,967 –
Total segment liabilities 871,967 – 871,967 871,967 –
As at 30 June 2015
Assets of continuing operations 1,141,958 – 1,141,958 1,141,958 –
Assets of disposal group classified as held for sale 1,286,840 – 1,286,840 – 1,286,840
Total segment assets 2,428,798 – 2,428,798 1,141,958 1,286,840
Total assets of continuing operation includes:
Investment in associates and joint ventures 452 (452) – – –
Additions to non‑current assets (other than financial assets and deferred tax) 1,100 – 1,100 1,100 –
Liabilities of continuing operations 925,027 – 925,027 925,027 –
Liabilities of disposal group classified as held for sale 965,279 – 965,279 – 965,279
Borrowings and swaps associated with sale of discontinued operations 277,588 – 277,588 – 277,588
Total segment liabilities 2,167,894 – 2,167,894 925,027 1,242,867
59

NOTES TO THE CONSOLIDATED FINANCIAL STATEMENTSPERFORMANCE FOR THE YEAR (Continued)
2. Revenue
Infigen Energy Group
2016 $’000
2015$’000
From continuing operations
Sale of energy and environmental products 100,916 69,443
Lease of plant and equipment 71,574 63,014
Compensated revenue 739 1,350
173,229 133,807
Recognition and measurement
Revenue is measured at the fair value of the consideration received or receivable. Revenue is recognised if it meets the criteria outlined below.
Sale of energy and environmental products
Sale of energy and environmental products is revenues from the:
• sale of electricity generated from the Group’s wind farms; and
• generation of Large‑scale Generation Certificates (LGCs). These are recognised at fair value when they are generated and in the same period as the costs are incurred.
The Group or the Trust recognises revenue when the amount of revenue can be reliably measured, when the significant risks and rewards of ownership of the products have passed to the buyer, and the Group attains the right to be compensated.
The amount of revenue is not considered to be reliably measurable until all contingencies relating to the sale have been resolved. The Group or the Trust bases estimates on historical results, taking into consideration the type of customer, the type of transaction and the specifics of each arrangement.
Revenues are recognised on an accruals basis net of the amount of associated GST unless the GST incurred is not recoverable from the taxation authority.
Lease of plant and equipment (contracted revenue)
In accordance with UIG 4 Determining whether an Asset Contains a Lease, revenue that is generated under certain power purchase agreements, where the Group sells substantially all of the related electricity to one customer, is classified as lease income.
3. Other income
Infigen Energy Group Infigen Energy Trust Group
2016 $’000
2015$’000
2016 $’000
2015$’000
From continuing operations:
Other income
Interest income 783 827 5 7
Unwind of discount on related party loan receivables – – 29,321 –
Foreign exchange gains – 5,369 – –
Fair value gains on financial instruments1 – 2,974 – –
Other income 7 11 – –
790 9,181 29,326 7
1 From 1 July 2015, the Group has early adopted and applied AASB 9 Financial Instruments resulting in the changes in the fair value of financial instruments being recognised in the hedge reserve. Refer to Note 35 for details.
60 INFIGEN ENERGY ANNUAL REPORT 2016

NOTES TO THE CONSOLIDATED FINANCIAL STATEMENTSPERFORMANCE FOR THE YEAR (Continued)
4. Expenses
Infigen Energy Group Infigen Energy Trust Group
2016 $’000
2015$’000
2016 $’000
2015$’000
From continuing operations:
Depreciation and amortisation expense
Depreciation of property, plant and equipment 46,524 46,535 – –
Amortisation of intangible assets 5,426 7,962 – –
51,950 54,497 – –
Interest expense
Interest expense on borrowings 25,413 27,490 – –
Interest expense on derivative financial instruments 26,550 25,673 – –
51,963 53,163 – –
Other finance costs
Bank fees and loan amortisation costs 2,251 2,802 – –
Foreign exchange losses 4,002 –
Other fair value losses on financial instruments 45 332 – –
Recognition and unwinding of discount on decommissioning provisions 119 117 – –
6,417 3,251 – –
Impairment expense
Impairment of financial assets2 – – – 205,300
– – – 205,300
2 Relates to the loan receivable due from members of the Group. Refer to Note 7 for further information.
61

NOTES TO THE CONSOLIDATED FINANCIAL STATEMENTSPERFORMANCE FOR THE YEAR (Continued)
Recognition and measurement
Interest expense
Interest expense is recognised in the period it occurs in connection with the borrowing of funds or derivative financial instruments.
5. Income taxes and deferred taxes
Income tax expense
Infigen Energy Group
2016 $’000
2015$’000
Current tax 3,504 (1,840)
Deferred tax 112 2,023
Income tax expense from continuing operations 3,616 183
Aggregate income tax benefit is attributable to:
Expense from continuing operations 3,616 183
Expense from discontinued operations 3,349 9,893
Aggregate income tax expense 6,965 10,076
Deferred income tax expense included in income tax benefit comprises:
Decrease in deferred tax assets 4,738 2,242
Increase/(decrease) in deferred tax liabilities (4,626) (219)
112 2,023
a) Reconciliation of prima facie income tax expense/(benefit):
Infigen Energy Group
2016 $’000
2015$’000
Profit/(loss) from continuing operations before income tax 10,649 (18,249)
Total loss before income tax 10,649 (18,249)
Income tax expense/(benefit) calculated at 30% (2015: 30%) 3,195 (5,475)
Increase/(decrease) in tax expense due to:
Tax losses not recognised as an asset 127 6,728
Unrealised foreign exchange movement 91 (300)
Sundry items 203 (770)
Income tax expense 3,616 183
62 INFIGEN ENERGY ANNUAL REPORT 2016

NOTES TO THE CONSOLIDATED FINANCIAL STATEMENTSPERFORMANCE FOR THE YEAR (Continued)
b) Amounts recognised directly in equity
The following deferred amounts were not recognised in net profit or loss but charged directly to equity during the period:
Infigen Energy Group
2016 $’000
2015$’000
Deferred tax asset 6,252 467
Deferred tax liabilities – –
Net deferred tax 6,252 467
c) Tax losses
Infigen Energy Group
2016 $’000
2015$’000
Unused tax losses for which no deferred tax asset has been recognised 237,703 259,268
Potential tax benefit at 30% 71,311 77,780
d) Current tax liabilities
Infigen Energy Group
2016 $’000
2015$’000
Income tax payable attributable to: 6,925 9,893
Discontinued operations 6,925 9,893
63

NOTES TO THE CONSOLIDATED FINANCIAL STATEMENTSPERFORMANCE FOR THE YEAR (Continued)
e) Deferred tax
Infigen Energy Group
Opening balance
$’000
Charged to income
$’000
Charged to equity $’000
Acquisitions/disposals
$’000
Closing balance
$’000
Year ended 30 June 2016
Gross deferred tax assets
Unused revenue tax losses 87,314 (3,504) – – 83,810
Effect of hedge movements 25,005 (1,232) 6,252 – 30,025
Unrealised foreign exchange losses 3,987 (3,506) – – 481
116,306 (8,242) 6,252 – 114,316
Gross deferred tax liabilities
Depreciation (59,131) (782) – – (59,913)
Unrealised foreign exchange gains (4,066) 4,066 – – –
Other (3,808) 1,342 – – (2,466)
(67,005) 4,626 – – (62,379)
Total deferred tax assets 49,301 (3,616) 6,252 – 51,937
Year ended 30 June 2015
Gross deferred tax assets
Unused revenue tax losses 87,773 (459) – – 87,314
Effect of hedge movements 24,892 (354) 467 – 25,005
Unrealised foreign exchange losses 5,012 (1,025) – – 3,987
117,677 (1,838) 467 – 116,306
Gross deferred tax liabilities
Depreciation (57,781) (1,350) – – (59,131)
Unrealised foreign exchange gains (4,086) 20 – – (4,066)
Other (5,357) 1,549 – – (3,808)
(67,224) 219 – – (67,005)
Total deferred tax assets 50,453 (1,619) 467 – 49,301
Infigen Energy Group
2016 $’000
2015$’000
Deferred tax assets to be recovered within 12 months – –
Deferred tax assets to be recovered after more than 12 months 51,937 49,301
Total deferred tax assets 51,937 49,301
64 INFIGEN ENERGY ANNUAL REPORT 2016

NOTES TO THE CONSOLIDATED FINANCIAL STATEMENTSPERFORMANCE FOR THE YEAR (Continued)
Recognition and measurement
The Group is subject to income taxes in Australia and jurisdictions where it has foreign operations.
Under current legislation, IET is not subject to income tax as unitholders are presently entitled to the income of IET.
Tax consolidation
IEL and its wholly owned Australian resident entities have formed an Australian tax consolidated group with effect from 1 July 2003 and are therefore taxed as a single entity from that date. The head entity within the tax consolidated group is IEL. Entities within the tax consolidated group have entered into a tax funding arrangement and a tax sharing agreement with IEL. The members of the tax consolidated group are identified in Note 25. IEL and its controlled entities in the tax consolidated group continue to account for their own current and deferred tax amounts.
Current tax
Current tax expense is calculated by reference to the amount of income taxes payable or recoverable in respect of the taxable profit or tax loss for the period. It is calculated using tax rates and tax laws that have been enacted or substantively enacted by the reporting date. Current tax for current and prior periods is recognised as a liability (or asset) to the extent that it is unpaid (or refundable).
Deferred tax
Deferred tax expense is accounted for using the comprehensive balance sheet liability method in respect of temporary differences arising from differences between the carrying amount of assets and liabilities in the financial statements and the corresponding tax base of those items.
Deferred tax liabilities are recognised for all taxable temporary differences. Deferred tax assets are recognised for deductible temporary differences, carried forward unused tax assets and unused tax losses, to the extent it is probable that future taxable amounts will be available to utilise them.
Deferred tax assets and liabilities are measured at the tax rates that are expected to apply to the year when the asset is realised or the liability is settled, based on tax rates and tax laws that have been enacted or substantively enacted by the reporting date.
Deferred tax is recognised for taxable temporary differences at reporting date between accounting carrying amounts and tax bases of assets and liabilities except for the following:
• Where they arise from the initial recognition of assets and liabilities (other than as a result of a business combination) and at the time of the transaction, affect neither taxable profit or loss nor accounting profit;
• Where they relate to investments in subsidiaries, associates and joint ventures:
− Deferred tax liabilities are not recognised if the timing of the reversal of the temporary differences can be controlled and it is probable that the temporary differences will not reverse in the foreseeable future.
− Deferred tax assets are not recognised if it is probable that the temporary differences will not reverse in the foreseeable future and there will be insufficient taxable profits against which to realise the benefit.
A deferred tax liability is not recognised in relation to taxable temporary differences arising from goodwill.
Current and deferred tax is recognised as an expense or income in the income statement, except when it relates to items credited or debited directly to equity, in which case the deferred tax is also recognised directly in equity.
Offsetting deferred tax balances
Deferred tax assets and liabilities are offset when they relate to income taxes levied by the same taxation authority and the Group or the individual entity intends to settle its current tax assets and liabilities on a net basis.
Key estimate: deferred tax assets
The Group currently has significant tax losses in Australia and in relation to its foreign operations. Tax losses in the Australian business have been recognised as a deferred tax asset on the basis that it is expected the business will generate sufficient taxable earnings to fully utilise those losses.
The Group is required to make significant judgements and assessments in relation to the future recoverability of tax losses that have been recognised as deferred tax assets. The assessment of future taxable income to support utilisation of tax losses in the Australian business is based on the long‑term forecasts used for assessing asset impairment (refer to Note 11 for key assumptions) and consideration of many future events and outcomes that are uncertain.
Deferred tax assets are recognised for deductible temporary differences and unused tax losses only if it is probable that future taxable amounts will be available to utilise those temporary differences and losses. The carrying amount of deferred tax assets is reviewed at each reporting date and reduced to the extent that it is no longer probable that sufficient taxable profit will be available to utilise them. Currently, only Australian tax losses have been brought to account as deferred tax assets.
65

NOTES TO THE CONSOLIDATED FINANCIAL STATEMENTSPERFORMANCE FOR THE YEAR (Continued)
6. Earnings per share/unit
a) Basic earnings per share:
Infigen Energy Group Infigen Energy Trust Group
2016 Cents per
security
2015 Cents per
security
2016 Cents
per unit
2015 Cents
per unit
Parent entity share
From continuing operations 1.1 (2.3) – –
From discontinued operations1 (0.3) (37.2) – –
Total basic earnings per share attributable to the parent entity shareholders 0.8 (39.5) – –
Stapled security
From continuing operations 0.9 (2.4) 3.7 (26.8)
From discontinued operations1 (0.3) (37.2) – –
Total basic earnings per security attributable to the stapled securityholders 0.6 (39.6) 3.7 (26.8)
b) Diluted earnings per share:
Infigen Energy Group Infigen Energy Trust Group
2016 Cents per
security
2015 Cents per
security
2016 Cents
per unit
2015 Cents
per unit
Parent entity share
From continuing operations 1.0 (2.3) – –
From discontinued operations1 (0.3) (37.2) – –
Total diluted earnings per share attributable to the parent entity shareholders 0.7 (39.5) – –
Stapled security
From continuing operations 0.9 (2.4) 3.7 (26.8)
From discontinued operations1 (0.3) (37.2) – –
Total diluted earnings per security attributable to the stapled securityholders 0.6 (39.6) 3.7 (26.8)
1 The number of performance rights/units outstanding has not been included in the calculation of diluted EPS for discontinued operations as they are anti‑dilutive. Refer to Note 32 for the number of performance rights/units outstanding.
66 INFIGEN ENERGY ANNUAL REPORT 2016

NOTES TO THE CONSOLIDATED FINANCIAL STATEMENTSPERFORMANCE FOR THE YEAR (Continued)
c) Reconciliation of earnings used in calculating earnings per share/unit
The earnings and weighted average number of shares/units used in the calculation of basic and diluted earnings per share/unit are as follows:
Infigen Energy Group Infigen Energy Trust Group
2016 $’000
2015$’000
2016 $’000
2015$’000
Earnings attributable to the parent entity shareholders
From continuing operations 8,112 (17,847) – –
From discontinued operations (2,547) (285,171) – –
Total earnings attributable to the parent entity shareholders 5,565 (303,018) – –
Earnings attributable to the stapled securityholders
From continuing operations 7,033 (18,432) 28,628 (205,989)
From discontinued operations (2,547) (285,171) – –
Total earnings attributable to the stapled securityholders 4,486 (303,603) 28,628 (205,989)
d) Weighted average number of securities used as the denominator
Infigen Energy Group Infigen Energy Trust Group
2016 No. ’000
2015 No. ’000
2016 No. ’000
2015 No. ’000
Weighted average number of shares/units for the purposes of basic earnings per share/unit 771,643 767,428 771,643 767,428
Weighted average number of shares/units for the purposes of diluted earnings per share/unit 776,225 767,428 776,225 767,428
Calculation of earnings per share
Basic earnings per share/unit is calculated by dividing the profit attributable to equityholders of the Group or the Trust, excluding any costs of servicing equity other than ordinary shares, by the weighted average number of ordinary shares/units outstanding during the financial year, adjusted for bonus elements in ordinary shares/units issued during the year.
Diluted earnings per share/unit adjusts the figures used in the determination of basic earnings per share/unit to take into account the after income tax effect of interest and other financing costs associated with dilutive potential ordinary shares/units and the weighted average number of shares/units that would have been outstanding assuming the conversion of all dilutive potential ordinary shares/units.
The number of performance rights/units outstanding has not been included in the calculation of diluted EPS for discontinued operations as they are anti‑dilutive. Refer to Note 32 for the number of performance rights/units outstanding.
67

NOTES TO THE CONSOLIDATED FINANCIAL STATEMENTSOPERATING ASSETS AND LIABILITIES
OPERATING ASSETS AND LIABILITIES
7. Trade and other receivables
Infigen Energy Group Infigen Energy Trust Group
2016 $’000
2015$’000
2016 $’000
2015$’000
Current
Trade receivables 15,740 15,483 – –
Prepayments 4,377 1,313 – –
Other receivables 252 55,760 – –
20,369 72,556 – –
Non-current
Amounts due from related parties (Note 31) 1,019 842 568,446 538,000
Prepayments 2,750 3,321 – –
3,769 4,163 568,446 538,000
a) Past due but not impaired
There were no trade receivables in the Group that were past due but not impaired as at 30 June 2016 and 30 June 2015.
There were no other classes within trade and other receivables of the Group that contained impaired assets and are not past due. Based on the credit history of these other classes, it is expected that these amounts will be received when due. The Group or the Trust does not hold any collateral in relation to these receivables.
b) Impairment of trade and other receivables
There were no impaired trade receivables for the Group as at 30 June 2016 or 30 June 2015.
For the year ended 30 June 2016, the Trust recognised $29.3 million for the unwinding of the discount on the loan receivable from related parties recognised in 30 June 2015. As part of the long‑term funding arrangements within the stapled structure, IET has loans due from other Group entities totaling $744.4 million. The sale of the US wind business had the effect of extending the expected time to full repayment of these loans. While IET is expected to receive the full $744.4 million contractual face value of the loans, the term of the loan has increased and this has reduced the net present value. The forecast undiscounted cash flows of the assets of the continuing operations still support the carrying value of these loans as they exceed $744.4 million.
c) Other receivables
These amounts generally arise from transactions outside the usual operating activities of the Group or the Trust. As at 30 June 2015, a $55.4 million (US$42.6 million) receivable was recognised from the sale of the US solar development pipeline assets.
d) Foreign exchange and interest rate risk
Information about the Group’s and the Trust’s exposure to foreign currency risk and interest rate risk in relation to trade and other receivables is provided in Note 18.
e) Fair value and credit risk
Due to the nature of the receivables, it is assessed that their carrying amount approximates their fair value. The maximum exposure to credit risk at the reporting date is the carrying amount of each class of receivables mentioned above. Refer to Note 18 for more information on the risk management policy of the Group or the Trust and the credit quality of the Group’s or the Trust’s trade receivables.
f) Prepayment
Current and non‑current prepayments include $4,377,000 (2015: $1,313,000) and $2,750,000 (2015: $3,321,000) of prepaid operational expenses.
Recognition and measurement
Loans and trade receivables
Trade receivables, loans and other receivables are recorded at amortised cost less impairment. Trade receivables are generally due for settlement within 30 days.
Receivables are stated exclusive of the amount of GST receivable unless the GST incurred is not recoverable from the taxation authority. The net amount of GST recoverable from the taxation authority is included within other receivables.
68 INFIGEN ENERGY ANNUAL REPORT 2016

NOTES TO THE CONSOLIDATED FINANCIAL STATEMENTSOPERATING ASSETS AND LIABILITIES (Continued)
8. Inventory
Infigen Energy Group
2016 $’000
2015$’000
Environmental certificates 20,620 12,695
Recognition and measurement
Environmental certificates or Large-scale Generation Certificates (LGCs)
LGCs held in inventory are valued at the lower of cost and net realisable value. Upon sale, the difference between the sale price and the book value of inventory is recorded as a component of revenue.
9. Property, plant and equipment
Infigen Energy Group
Plant and Equipment $’000
At 30 June 2014
Cost 2,564,312
Accumulated depreciation (668,903)
Net book value 1,895,409
Year ended 30 June 2015
Opening net book value 1,895,409
Additions 5,736
Depreciation expense (113,364)
Assets of disposal group classified as held for sale (1,188,668)
Net foreign currency exchange differences 231,054
Closing net book value 830,167
At 30 June 2015
Cost 1,159,258
Accumulated depreciation (329,091)
Net book value 830,167
Year ended 30 June 2016
Opening net book value 830,167
Additions 1,987
Depreciation expense (46,524)
Transfers to intangible assets (1,811)
Closing net book value 783,819
At 30 June 2016
Cost 1,159,434
Accumulated depreciation (375,615)
Net book value 783,819
69

NOTES TO THE CONSOLIDATED FINANCIAL STATEMENTSOPERATING ASSETS AND LIABILITIES (Continued)
Recognition and measurement
Property, plant and equipment
The value of property, plant and equipment such as wind turbines and associated plant is measured as the cost of the asset less accumulated depreciation and impairment. The cost of the asset includes expenditure that is directly attributable to the acquisition of the item and may also include transfers from equity of any gains/losses on qualifying cash flow hedges of foreign currency purchases of property, plant and equipment. In the event that settlement of all or part of the purchase consideration is deferred, cost is determined by discounting the amounts payable in the future to their present value as at the date of acquisition.
Subsequent costs, including replacement parts, are included in the asset’s carrying amount or recognised as a separate asset as appropriate only when it is probable that future economic benefits associated with the item will flow to the Group and the cost of the item can be measured reliably. The carrying amount of the replaced part is recognised as a separate asset.
An asset’s carrying amount is written down immediately to its recoverable amount if the asset’s carrying amount is greater than its estimated recoverable amount.
Decommissioning
The Group’s policy is to provide for the future costs relating to the decommissioning of wind turbines and associated plant if the amounts are expected to result in an outflow of economic benefits. The cost of decommissioning wind turbines and associated plant is reviewed at the end of each annual reporting period.
Derecognition
An item of property, plant and equipment is derecognised when it is replaced, sold or otherwise disposed of. Gains and losses on disposal of an item of property, plant and equipment are determined by comparing the proceeds from the disposal with the carrying amount of property, plant and equipment and are included in the income statement. All other repairs and maintenance are charged to the income statement during the reporting period in which they are incurred.
Depreciation
Depreciation on property, plant and equipment is calculated on a straight‑line basis over their estimated useful lives outlined below to allocate their cost or revalued amounts, net of their residual values, over their estimated useful lives. The estimated useful lives, residual values and depreciation method are reviewed at the end of each annual reporting period.
Key estimate: useful lives of assets
Wind turbines and associated plant 25 years1
Solar panels and associated plant 30 years
Fixtures and fittings 10‑20 years
Computer equipment 3‑5 years
1 It is possible that these assets will have total useful economic lives in excess of 25 years in which case additional revenues will be received without a matching depreciation charge.
70 INFIGEN ENERGY ANNUAL REPORT 2016

NOTES TO THE CONSOLIDATED FINANCIAL STATEMENTSOPERATING ASSETS AND LIABILITIES (Continued)
10. Intangible assets
Infigen Energy Group
Goodwill $’000
Development assets $’000
Project-related agreements and licences
$’000Total
$’000
At 30 June 2014
Cost 15,136 33,070 336,168 384,374
Accumulated amortisation and impairment ‑ ‑ (127,250) (127,250)
Net book value 15,136 33,070 208,918 257,124
Year ended 30 June 2015
Opening net book value 15,136 33,070 208,918 257,124
Additions ‑ 2,589 52 2,641
Transfers ‑ ‑ ‑ ‑
Amortisation expense ‑ ‑ (13,824) (13,824)
Impairment expense ‑ (1,898) ‑ (1,898)
Assets of disposal group classified as held for sale ‑ (3,509) (141,281) (144,790)
Net foreign currency exchange differences ‑ ‑ 27,570 27,570
Closing net book value 15,136 30,252 81,435 126,823
At 30 June 2015
Cost 15,136 32,150 112,500 159,786
Accumulated amortisation and impairment ‑ (1,898) (31,065) (32,963)
Net book value 15,136 30,252 81,435 126,823
Year ended 30 June 2016
Opening net book value 15,136 30,252 81,435 126,823
Additions ‑ 1,693 ‑ 1,693
Transfers ‑ (2,831) 2,831 ‑
Transfers from property, plant and equipment ‑ ‑ 1,811 1,811
Amortisation expense ‑ ‑ (5,426) (5,426)
Write‑down of development assets from share sale ‑ (2,230) ‑ (2,230)
Closing net book value 15,136 26,884 80,651 122,671
At 30 June 2016
Cost 15,136 26,884 117,434 159,454
Accumulated amortisation and impairment ‑ ‑ (36,783) (36,783)
Net book value 15,136 26,884 80,651 122,671
71

NOTES TO THE CONSOLIDATED FINANCIAL STATEMENTSOPERATING ASSETS AND LIABILITIES (Continued)
Recognition and measurement
Goodwill
Goodwill represents the excess of the cost of acquisition over the fair value of the Group’s share of the net identifiable assets, liabilities and contingent liabilities acquired at the date of acquisition. Goodwill acquired in business combinations is not amortised but tested for impairment annually and whenever there is an indication that the goodwill may be impaired. Any impairment is recognised immediately in the income statement and is not subsequently reversed. Goodwill on acquisitions of subsidiaries is included in intangible assets.
Goodwill is allocated to the Australian cash‑generating unit (CGU) for the purpose of impairment testing.
Project-related agreements and licences
Project‑related agreements and licences include the following items:
• licences, permits and approvals to develop and operate a wind farm, including governmental authorisations, land rights and environmental consents;
• interconnection rights; and
• power purchase agreements.
Project‑related agreements and licences are carried at cost less accumulated amortisation and impairment expenses. Amortisation is calculated using the straight‑line method to allocate the cost of licences over their estimated useful lives, which are based on the useful life of the related wind farm.
Development assets
Development assets represent development costs incurred prior to commencement of construction for wind and solar farms. Development assets are not amortised, but are transferred to plant and equipment and depreciated from the time the asset is held ready for use on a commercial basis.
Key estimate: useful economic lives of intangible assets
The Group amortises project‑related agreements and licences over 25 years which is the estimated minimum useful economic life of these assets, based on current evaluations. It is possible that some of these assets will have total useful economic lives in excess of 25 years in which case additional revenues will be received without a matching amortisation charge.
72 INFIGEN ENERGY ANNUAL REPORT 2016

NOTES TO THE CONSOLIDATED FINANCIAL STATEMENTSOPERATING ASSETS AND LIABILITIES (Continued)
11. Valuation of non-financial assets
Testing for impairment of intangible assets
At each reporting date, the Group reviews the carrying amounts of its tangible and intangible assets to determine whether there is any indication that the carrying values are impaired.
If any such indication exists, the recoverable amount of the asset is estimated in order to determine the extent of the impairment (if any). Where the asset does not generate cash flows that are independent from other assets, the Group has estimated the recoverable amount of the CGU to which the asset belongs.
The Group determines the recoverable amount of the CGU based on value‑in‑use calculations. In assessing value in use, the estimated future cash flows are discounted to their present value using a discount rate that reflects current market assessments of the time value of money and the risks specific to the asset for which the estimates of future cash flows have not been adjusted.
If the recoverable amount of an asset (or CGU) is estimated to be less than its carrying amount, the carrying amount of the asset (or CGU) is reduced to its recoverable amount. Such impairment loss is recognised in the income statement immediately.
Key estimate: recoverable amounts of the development assets
The Group holds renewable energy development assets in Australia. The recoverable amounts of the development assets are dependent upon internal valuations, which consider how advanced the development projects are, and the current, or expected future, market demand for these assets.
Impairment tests for cash-generating units containing goodwill
For the purposes of impairment testing, goodwill is allocated to the Australian segment which represents the lowest level within the Group at which goodwill is monitored for internal management purposes.
Infigen Energy Group
2016 $’000
2015$’000
Australia 15,136 15,136
Total goodwill 15,136 15,136
73

NOTES TO THE CONSOLIDATED FINANCIAL STATEMENTSOPERATING ASSETS AND LIABILITIES (Continued)
Key assumptions for value-in-use calculations
The Group determines the recoverable amount of the CGU based on value‑in‑use calculations. The calculations use cash flow projections covering the total life of the wind farms, which is greater than or equal to 25 years.
The Group makes assumptions around expected wind resource, availability, prices, operating expenses and discount rates in calculating the value‑in‑use of its CGU. Variations in the estimates and assumptions may have a significant risk of causing a material variation to the calculated recoverable amount of assets and liabilities.
The Group uses production estimates to reflect the expected performance of the assets throughout the forecast period. The forecast period reflects the useful life of the assets held by the CGU. Production estimates are based on independent technical consultants’ assessments.
Pricing assumptions are based on the contractual terms of power purchase agreements and LGC supply agreements where applicable, and third party assessments of merchant electricity and environmental certificate prices over the forecast period. The Australian CGU has utilised a third party assessment of merchant electricity and LGC forward pricing that excludes any component for carbon pricing or an equivalent scheme but is founded on the Renewable Energy Target (RET) as currently legislated.
In performing value‑in‑use calculations for Australia, the Group has applied post‑tax discount rates to discount the forecast future attributable post‑tax cash flows. The equivalent pre‑tax discount rates are disclosed below.
Pre-tax discount rates
2016 2015
Australia 10.6% 11.7%
The discount rates used reflect specific risks of the country in which the Group has operations. For some wind farms with power purchase agreements, future revenue growth forecasts are based on the contractual escalation provisions. For wind farms subject to market prices, future revenue forecasts are based on long‑term third party independent consultant projections.
Sensitivity to changes in assumptions
The recoverable amount of the CGU is greater than the carrying value as at 30 June 2016. Variations to the key assumptions used to determine the recoverable amount would result in a change in the assessed recoverable amount. If the variation in assumptions had a negative impact on recoverable amount it could indicate a requirement for an additional impairment expense.
The estimation of the recoverable amount of the Australian CGU was tested for sensitivity using reasonably possible changes in key assumptions. These changes include increases and decreases in the discount rates of up to 1% with all other assumptions remaining constant.
Separate sensitivity tests are also conducted to measure the impact of varying future cash flows for increases and decreases of up to 10% in market prices, 5% in production, and 10% in operating costs, respectively.
None of these tests resulted in the carrying amount of the Australian CGU exceeding its recoverable amount.
74 INFIGEN ENERGY ANNUAL REPORT 2016

NOTES TO THE CONSOLIDATED FINANCIAL STATEMENTSOPERATING ASSETS AND LIABILITIES (Continued)
12. Trade and other payables
Infigen Energy Group Infigen Energy Trust Group
2016 $’000
2015$’000
2016 $’000
2015$’000
Current
Trade payables and accruals 5,780 8,225 – –
Goods and services and other taxes payable 9,977 7,652 – –
Amount due to related parties1 – – 4,858 4,179
Other 1,599 13,104 – –
17,356 28,981 4,858 4,179
1 Refer to Note 31 for further information relating to loans to related parties. IET does not have the unconditional right to defer settlement; however, based on past experience, the relevant amount due is not expected to be settled within 12 months.
Recognition and measurement
Trade payables are recognised when the Group or the Trust becomes obliged to make future payments resulting from the purchase of goods and services. The amounts are unsecured and are usually paid within 30 days of recognition.
Trade payables are stated exclusive of the amount of GST payable unless the GST incurred is not recoverable from the taxation authority which in this case would be recognised as part of the cost of acquisition of the asset. The net amount of GST payable to the taxation authority is included in goods and services and other taxes payable.
Other payables include accruals for wages and salaries (including non‑monetary benefits), annual leave and sick leave expected to be settled within 12 months of the reporting date in which employees render the related service. They are measured at the amounts expected to be paid when the liabilities are settled. The entire obligation for annual leave is presented as current because the Group does not have an unconditional right to defer payment.
13. Provisions
Infigen Energy Group
2016 $’000
2015$’000
Current
Employee benefits 2,900 1,588
2,900 1,588
Non-current
Employee benefits 665 592
Decommissioning and restoration 7,756 7,637
8,421 8,229
11,321 9,817
75

NOTES TO THE CONSOLIDATED FINANCIAL STATEMENTSOPERATING ASSETS AND LIABILITIES (Continued)
A reconciliation of the carrying amounts of provisions is set out below:
Infigen Energy Group
Decommissioning and restoration
$’000
Employee benefits
$’000Total
$’000
Year ended 30 June 2015
Carrying amount at start of the year 18,591 3,391 21,982
Provision reversed during the year ‑ (1,211) (1,211)
Recognition and unwinding of discount 264 ‑ 264
Effect of movements in foreign exchange rates 2,519 ‑ 2,519
Provision of disposal group classified as held for sale (13,737) ‑ (13,737)
Carrying amount at the end of the year 7,637 2,180 9,817
Year ended 30 June 2016
Carrying amount at start of the year 7,637 2,180 9,817
Additional provisions recognised during the year ‑ 1,385 1,385
Recognition and unwinding of discount 119 ‑ 119
Carrying amount at the end of the year 7,756 3,565 11,321
Recognition and measurement
Provisions are recognised when:
• the Group or the Trust has a present legal or constructive obligation as a result of past events; and
• it is probable an outflow of resources will be required to settle the obligation; and
• the amount of the provision can be measured reliably.
Provisions are not recognised for future operating losses.
When some or all of the economic benefits required to settle a provision are expected to be recovered from a third party, the receivable is recognised as an asset if it is probable that recovery will be received and the amount of the receivable can be measured reliably.
Key estimate: discounting
Provisions are measured at the present value of the expenditure required to settle the obligation at the reporting date, taking into account the risks and uncertainties surrounding the obligation. The discount rate used to determine the present value reflects current market assessments of the time value of money and the risks specific to the liability.
Decommissioning and restoration
The decommissioning and restoration provision represents estimates of future expenditure relating to dismantling and removing of wind turbines and associated plant, and restoration of wind farm sites.
Employee benefits
Provision for employee benefits represents provision for short‑term incentives, long service leave and termination benefits. For long service leave it covers all unconditional entitlements where employees have completed the required period of service and also those where employees are entitled to pro‑rata payments in certain circumstances.
76 INFIGEN ENERGY ANNUAL REPORT 2016

NOTES TO THE CONSOLIDATED FINANCIAL STATEMENTSCAPITAL MANAGEMENT
Long service leave
The liability for long service leave is recognised in the provision for employee benefits and measured as the present value of expected future payments to be made in respect of services provided by employees up to the reporting date. Expected future payments are discounted using market yields at the reporting date on national corporate bonds with terms to maturity and currency that match, as closely as possible, the estimated future cash outflows. Consideration is given to expected future wage and salary levels, experience of employee departures and periods of service.
The obligations are presented as current liabilities in the balance sheet if the Group does not have an unconditional right to defer settlement for at least 12 months after the balance date, regardless of when the actual settlement is expected to occur.
Termination benefits
Termination benefits are payable when employment is terminated before the normal retirement date, or when an employee accepts voluntary redundancy in exchange for these benefits. The Group recognises termination benefits when it is demonstrably committed to either terminating the employment of current employees according to a detailed formal plan without possibility of withdrawal or providing termination benefits as a result of an offer made to encourage voluntary redundancy. Benefits falling due more than 12 months after reporting date are discounted to present value.
Short-term incentive plans
The Group recognises a liability and an expense for short‑term incentives and takes into consideration the performance of the Group for the corresponding period. The Group recognises a provision where contractually obliged or where there is a past practice that has created a constructive obligation.
CAPITAL MANAGEMENT
14. Cash and cash equivalents
Cash and cash equivalents at the end of the financial year as shown in the cash flow statement is reconciled to the related items in the balance sheet as follows:
Infigen Energy Group Infigen Energy Trust Group
2016 $’000
2015$’000
2016 $’000
2015$’000
Cash and cash equivalents 147,602 45,182 405 399
Recognition and measurement
Cash and cash equivalents comprise cash on hand, deposits held at call with financial institutions, and other short‑term, highly liquid investments with original maturities of three months or less that are readily convertible to known amounts of cash and that are subject to insignificant risk of changes in value, net of outstanding bank overdrafts. Bank overdrafts are shown within borrowings in current liabilities in the balance sheet.
Cash flows are presented on a gross basis. The GST components of cash flows arising from investing or financing activities, which are recoverable from, or payable to, the taxation authority, are presented as operating cash flows.
Restricted cash balances
As at 30 June 2016, $10.6 million (2015: $10.2 million) of cash was held by the Group in accordance with the minimum cash requirements for Australian Financial Services Licence (AFSL) compliance and the Woodlawn project finance facility debt service reserve account.
77

NOTES TO THE CONSOLIDATED FINANCIAL STATEMENTSCAPITAL MANAGEMENT (Continued)
15. Borrowings
Infigen Energy Group
2016 $’000
2015$’000
Current
Secured
Global Facility 69,506 35,452
Project Finance Debt – Woodlawn 4,095 10,807
73,601 46,259
Non-current
Secured
Global Facility 638,148 712,529
Project Finance Debt – Woodlawn 35,803 34,595
Capitalised loan costs (5,062) (6,500)
668,889 740,624
Total borrowings 742,490 786,883
Borrowings associated with sale of discontinued operations1
Current
Global Facility – 245,278
Total group borrowings 742,490 1,032,161
1 Relates to amounts that were expected to be repaid upon the sale of discontinued operations. Refer to Note 24 for details of discontinued operations.
a) Reconciliation of borrowings
Infigen Energy Group
2016 $’000
2015$’000
Opening balance 786,883 1,075,045
Debt repayments – Global Facility (50,958) (61,459)
Debt repayments – Woodlawn (5,504) (4,590)
Net loan costs expensed/(capitalised) 1,438 4,213
Borrowings of discontinued operations (Union Bank) – (57,274)
Net foreign currency exchange differences 10,631 76,226
Total group borrowings 742,490 1,032,161
Borrowings associated with sale of discontinued operations – (245,278)
Total borrowings 742,490 786,883
78 INFIGEN ENERGY ANNUAL REPORT 2016

NOTES TO THE CONSOLIDATED FINANCIAL STATEMENTSCAPITAL MANAGEMENT (Continued)
b) Borrowings by currency
The total value of funds that have been drawn down by currency, converted to Australian dollars (AUD) at the year‑end exchange rate, is presented in the following table:
Infigen Energy Group
Total Borrowings
(Local Currency)
$’000
Total Borrowings
(AUD) $’000
As at 30 June 2016
Australian dollars (AUD) – Global Facility 531,027 531,027
Australian dollars (AUD) – Woodlawn 39,898 39,898
Euro (EUR) – Global Facility 14,009 20,834
US dollars (USD) – Global Facility 116,175 155,793
Gross borrowings 747,552
Less capitalised loan costs (5,062)
Total borrowings 742,490
As at 30 June 2015
Australian dollars (AUD) – Global Facility 531,027 531,027
Australian dollars (AUD) – Woodlawn 45,402 45,402
Euro (EUR) – Global Facility 21,171 30,834
US dollars (USD) – Global Facility 142,940 186,120
Gross borrowings 793,383
Less capitalised loan costs (6,500)
Total borrowings 786,883
As at 30 June 2015
Borrowings associated with sale of discontinued operations
Euro (EUR) – Global Facility 43,127 62,812
US dollars (USD) – Global Facility 140,133 182,466
Total borrowings associated with sale of discontinued operations 245,278
Recognition and measurement
Borrowings
Borrowings are initially recognised at fair value, net of transaction costs incurred. Borrowings are subsequently measured at amortised cost. Any difference between the proceeds (net of transaction costs) and the redemption amount is recognised in the income statement over the period of the borrowings using the effective interest method.
Borrowings are removed from the balance sheet when the obligation specified in the contract is discharged, cancelled or expired. The difference between the carrying amount of a financial liability that has been extinguished or transferred to another party and the consideration paid, including any non‑cash assets transferred or liabilities held, is recognised in other income or other expenses.
Borrowings are classified as current liabilities unless the Group or the Trust has an unconditional right to defer settlement of the liability for at least 12 months after the reporting date.
Borrowing costs
Borrowing costs incurred for the construction of any qualifying assets are capitalised during the period of time that is required to complete and prepare the asset for its intended use or sale. Other borrowing costs are expensed.
79
NOTES TO THE CONSOLIDATED FINANCIAL STATEMENTSCAPITAL MANAGEMENT (Continued)
Global Facility
The Group’s corporate debt facility (the Global Facility) is a multi‑currency facility that matures in 2022. The Global Facility is a syndicated facility among a group of Australian and international lenders.
The Global Facility delineates between those Infigen group entities that comprise the Global Facility borrower group (Borrower Group) and those Infigen group entities that are not within the Borrower Group. The latter are generally referred to as “Excluded Companies”.
In broad terms, the Borrower Group comprises IEL and substantially all of its subsidiaries, with the exception that none of the following fall within the Borrower Group:
• IET;
• IEBL; and
• Infigen Energy Holdings Pty Limited and its subsidiaries, which primarily include Woodlawn Wind Pty Limited (which owns Woodlawn wind farm) and the Group’s Australian development pipeline project entities.
Excluded Companies
Excluded Companies:
• are not entitled to borrow under the Global Facility;
• must deal with companies within the Global Facility Borrower Group on arm’s length terms; and
• are not subject to, or the subject of, the representations, covenants or events of default applicable to the Borrower Group.
Amounts outstanding under the Global Facility
Amounts outstanding under the Global Facility are in Euro, United States dollars and Australian dollars. The base currency of the Global Facility is the Euro.
Principal repayments under the Global Facility
Subsequent to 30 June 2010 and for the remaining term of the Global Facility (expiring December 2022), all surplus cash flows of the Borrower Group, after taking account of working capital requirements, are required to be used to make repayments under the Global Facility on a semi‑annual basis (Cash Sweep). The net disposal proceeds of any disposals by Borrower Group entities must also be applied to debt repayments under the Global Facility.
During the year ended 30 June 2016 repayments of $260,726,749 and $50,957,674 were made. This represented net proceeds from the sale of the disposal group including US$6.74 million that was released from escrow and surplus operating cash flow of the Borrower Group. The remaining balance of the US$10 million in escrowed funds was utilised to settle the relevant operating issues and to pay associated legal expenses.
Interest payments
The Group pays interest each six months based on the EURIBOR (Euro drawings), BBSY (Australian dollar) or LIBOR (United States dollar) rate, plus a margin. It is the Group’s policy and a requirement of the Global Facility to use financial instruments to fix the interest rate for a portion of the borrowings (refer to Note 18).
Financial covenant
During the period of the Cash Sweep, the only financial covenant that applies under the Global Facility is a leverage ratio covenant. The leverage ratio is determined by taking the quotient of Net Debt and EBITDA of entities that are within the Borrower Group. EBITDA represents the consolidated earnings of the Borrower Group entities before finance charges, unrealised gains or losses on financial instruments and material items of an unusual or non‑recurring nature.
This covenant is based on the results of each 12‑month period ending 30 June and 31 December and is as follows:
• Through to June 2016: not more than 8.5 times;
• July 2016 to June 2019: not more than 6.0 times;
• July 2019 to expiry of the facility (December 2022): not more than 3.0 times.
Review events
A review event would occur if the shares of IEL were removed from the official list of the Australian Securities Exchange or were unstapled from units of IET and shares of IEBL. Such an event would require assessment of the effect on the Global Facility and, if necessary, agreement of an action plan.
80 INFIGEN ENERGY ANNUAL REPORT 2016

NOTES TO THE CONSOLIDATED FINANCIAL STATEMENTSCAPITAL MANAGEMENT (Continued)
Security
The Global Facility has no asset level security; however, each borrower under the Global Facility is a guarantor of the facilities. In addition, lenders have first ranking security over the issued share capital of, or other ownership interest in:
• the borrowers (other than Infigen Energy Limited); and
• the direct subsidiaries of the borrowers, which are holding entities of each operating wind farm in Infigen’s portfolio (other than Woodlawn wind farm).
Global Facility lenders have no security over Excluded Companies.
Project Finance Facility – WWCS Finance Pty Ltd (Woodlawn wind farm)
WWCS Finance Pty Ltd, the immediate parent company of Woodlawn Wind Pty Ltd (which in turn owns Woodlawn wind farm), is the borrower under a $51.7 million syndicated term facility. The syndicate lenders are Westpac Banking Corporation (Tranche A) and Clean Energy Finance Corporation (Tranche B). The Tranche A and Tranche B loans are of equal amounts, with maturity in September 2018 and September 2023 respectively.
Principal repayments
The borrower is required to make debt repayments on a quarterly basis following a set repayment schedule for both Tranche A and Tranche B loans. During the year ended 30 June 2016 net repayments of $5,504,311 (2015: $4,590,333) were made.
Interest payments
Interest is payable on a quarterly basis. Tranche A interest is calculated on the BBSY (Australian dollar) rate plus a margin and the Tranche B interest is fixed for 10 years at 3.7575% plus a margin. Interest obligations for the Tranche A loan have been hedged with interest rate caps of 3.9790% (September 2014 to September 2018) and 5.7850% (September 2018 to March 2023).
Security
The lenders under the Project Finance facility hold security over the shares in, and assets and undertaking of, WWCS Finance Pty Ltd and Woodlawn Wind Pty Ltd.
16. Other financial assets and liabilities
Infigen Energy Group
2016 $’000
2015$’000
Current assets
At fair value: Electricity options 355 –
At fair value: Production hedge – 566
355 566
Non-current assets
At fair value: Electricity options 124 –
At fair value: Interest rate caps 8 53
132 53
Current liabilities
At fair value: Electricity options 23 –
At fair value: Interest rate swaps 25,429 30,698
At fair value: Foreign currency swaps 229 –
25,681 30,698
Non-current liabilities
At fair value: Electricity options 124 –
At fair value: Interest rate swaps 74,995 68,648
75,119 68,648
Financial liabilities associated with sale of discontinued operations1
Current liabilities
At fair value: Interest rate swaps – 32,310
– 32,310
1 Relates to amounts that were expected to be repaid upon the sale of discontinued operations. Refer to Note 24 for details of discontinued operations.
81

NOTES TO THE CONSOLIDATED FINANCIAL STATEMENTSCAPITAL MANAGEMENT (Continued)
Recognition and measurement
Derivative financial instruments
The Group enters into a variety of derivative financial instruments to manage its exposure to interest rate and foreign exchange rate risk, including forward foreign exchange contracts, interest rate caps, interest rate swaps, and cross currency swaps. Derivative financial instruments are also used to manage exposure to electricity and environmental commodity price and production risks.
Derivatives are initially recognised at fair value on the date a derivative contract is entered into and are subsequently re‑measured to their fair value at each reporting date. The resulting gain or loss is recognised in the statement of other comprehensive income as the derivatives are designated and effective as a hedging instrument; in which event the timing of the recognition in the income statement depends on the nature of the hedge relationship. The company’s risk management strategies and hedge documentation are aligned with the requirements of AASB 9 and the derivative contracts are thus treated as continuing hedges.
17. Fair value hierarchy
The Group measures and recognises the following assets and liabilities at fair value on a recurring basis:
• Derivative financial instruments
• Investment in financial assets
To provide an indication about the reliability of the inputs used in determining fair value, the Group has classified its financial instruments into the following three levels prescribed under the accounting standards:
Level 1: the fair value of financial instruments traded in active markets is based on quoted market prices (unadjusted) at the end of the reporting period. The Group does not hold Level 1 financial instruments.
Level 2: the fair value of financial instruments that are not traded in active markets is determined using valuation techniques which maximise the use of observable market data and rely as little as possible on entity‑specific estimates. All significant inputs required to fair value an instrument are observable. This is the case for the Group’s derivative financial instruments.
Level 3: one or more of the significant inputs to determine the fair value of financial instruments are not based on observable market data (unobservable inputs).
The following tables present the Group’s financial assets and financial liabilities measured and recognised at fair value.
Level 1 $’000
Level 2 $’000
Level 3 $’000
Total $’000
As at 30 June 2016
Recurring fair value measurements
Assets
Derivative financial instruments
Interest rate caps – Woodlawn – 8 – 8
Derivative margins – 80 – 80
Electricity options – 399 – 399
Total assets – 487 – 487
Liabilities
Derivative financial instruments
Interest rate swaps – Global Facility – 100,800 – 100,800
Total liabilities – 100,800 – 100,800
As at 30 June 2015
Recurring fair value measurements
Assets
Derivative financial instruments
Interest rate cap – Woodlawn – 53 – 53
Production hedge – – 566 566
Total assets – 53 566 619
Liabilities
Derivative financial instruments
Interest rate swaps – Global Facility – 99,346 – 99,346
Total liabilities – 99,346 – 99,346
82 INFIGEN ENERGY ANNUAL REPORT 2016

NOTES TO THE CONSOLIDATED FINANCIAL STATEMENTSCAPITAL MANAGEMENT (Continued)
There were no transfers between Levels 1 and 2, and between Levels 2 and 3 financial instruments for recurring fair value measurements during the year. The Group did not measure any financial assets or financial liabilities at fair value on a non‑recurring basis as at 30 June 2016.
The Group’s policy is to recognise transfers into and transfers out of fair value hierarchy levels at the end of the reporting period.
a) Valuation techniques used to determine Level 2 fair values
Specific valuation techniques used to value financial instruments include:
• The use of quoted market prices or dealer quotes for similar instruments;
• The fair value of interest rate swaps calculated as the present value of the estimated future cash flows based on observable yield curves; and
• Using Black‑Scholes valuation models in conjunction with quoted market prices or dealer quotes for similar instruments.
Where such information is not available, the Group considers information from a variety of sources including:
• Discounted cash flow projections based on reliable estimates of future cash flows; and/or
• Capitalisation rate derived from an analysis of market evidence.
b) Fair value measurements using significant unobservable inputs (Level 3)
The following table presents the changes in Level 3 items. It is not possible to determine the fair value of these financial instruments using quoted prices or observable market data.
2016 $’000
2015$’000
Production hedge
Opening balance at 1 July 566 –
Acquisitions – 755
Amortisation (566) (189)
Closing balance at 30 June – 566
Key estimate: fair value
The fair value of the financial assets and financial liabilities must be estimated for recognition and measurement or for disclosure purposes.
The fair value of financial instruments that are not traded in an active market (for example, over‑the‑counter derivatives) is determined using valuation techniques. The Group or the Trust uses a variety of methods and makes assumptions that are based on market conditions existing at each balance date. The fair value of interest rate swaps is calculated as the present value of the estimated future cash flows. The fair value of forward exchange contracts is determined using forward exchange market rates at the balance sheet date. These instruments are classified in the Level 2 fair value hierarchy (refer to Note 17 (a)).
The carrying amounts of trade receivables and payables are assessed to approximate their fair values due to their short‑term nature. The fair value of financial liabilities for disclosure purposes is estimated by discounting the future contractual cash flows at the current market interest rate that is available to the Group or the Trust for similar financial instruments.
83

NOTES TO THE CONSOLIDATED FINANCIAL STATEMENTSCAPITAL MANAGEMENT (Continued)
18. Financial risk management
The Group and the Trust are exposed to the following key financial risks.
Risk Exposure arising from Risk monitoring Management
1) Market risk – interest rate risk
Long‑term non‑hedged borrowings at floating interest rates
Cash flow forecasting Sensitivity analysis
Interest rate derivatives
2) Market risk – electricity and environmental certificate price risk
Trading of electricity and environmental certificates
Sensitivity analysis Power purchase agreements and contracted environmental certificate agreements
Electricity derivatives (ASX futures, options)
3) Foreign exchange risk Investments and borrowings denominated in USD and EUR
Sensitivity analysis Foreign exchange derivatives
Foreign currency prepayments of foreign denominated debts
USD and EUR denominated cash holdings
4) Credit risk and counterparty risk
Cash and cash equivalents; deposits with banks; derivative financial instruments; trade receivables; forward contracts
Credit ratings
Ageing analysis
Letters of credit; diversification of the customer portfolio which comprises contracted and non‑contracted electricity; liquid funds held with large financial institutions with high credit ratings; credit monitoring
5) Liquidity risk Long‑term borrowings and other liabilities
Monitoring actual and forecast cash flows
Matching maturity profiles of financial assets and liabilities
Maintaining adequate reserves, banking and borrowing facilities
6) Capital risk Invested capital Debt covenant ratio forecasting and sensitivity analysis
Dividend and distribution policy
The Group’s and the Trust’s risk management is carried out by a central treasury function (Corporate Treasury). The Group’s or the Trust’s Corporate Treasury:
• operates under the treasury policies approved by the Board which provide a framework for managing and mitigating the overall financial risks of the Group or the Trust;
• identifies, evaluates and hedges certain financial risks in close co‑operation with the Group’s or the Trust’s operating units; and
• focuses on the unpredictability of financial markets and seeks to manage potential adverse effects on the financial performance of the Group or the Trust.
The Group’s or the Trust’s treasury policy specifically does not authorise any form of speculative trading. Derivatives are exclusively used for risk management or hedging purposes, not as trading or other speculative instruments.
There have been no changes to the type or class of financial risks the Group is exposed to since the prior year.
84 INFIGEN ENERGY ANNUAL REPORT 2016

NOTES TO THE CONSOLIDATED FINANCIAL STATEMENTSCAPITAL MANAGEMENT (Continued)
1) Market risk – interest rate risk
Nature of interest rate risk
The Group’s income and operating cash flows are exposed to the risk of changes in market interest rates primarily relating to the Group’s unhedged debt obligations that have floating interest rates.
Interest rate risk management
To manage interest rate exposure, the Group fixes a portion of the floating rate borrowings by entering into interest rate swaps in which the Group agrees to exchange the difference between fixed and floating rate interest amounts calculated on agreed notional principal amounts, and interest rate caps in which the Group protects itself from rates increasing above a cap whilst still benefitting from lower interest rates under a cap. In undertaking this strategy the Group is willing to forgo a percentage of the potential economic benefit that would arise in a falling interest rate environment, in order to partially protect against downside risks of increasing interest rates and to secure a greater level of predictability for cash flows.
The effect on the Group’s net result is largely due to the Group’s exposure to interest rates on its non‑hedged variable rate borrowings. The effect on hedge reserve is due to the effective portion of the change in fair value of derivatives that are designated as cash flow hedges.
A high percentage of the face value of debt in each of the relevant currencies is hedged using interest rate derivatives. The table below shows a breakdown of the Group’s notional principal amounts.
The Trust has a small amount of cash balances. Interest earnings on these cash balances are affected when interest rates move.
Exposure
As at reporting date, the Group had the following financial assets and liabilities, with exposure to interest rate risk. There was no ineffectiveness to be recorded from the cash flow hedges.
Outstanding pay fixed/receive floating interest rate hedging
Average contracted fixed interest rate
Notional principal amount Fair value
2016 %
2015 %
2016 $’000
2015$’000
2016 $’000
2015$’000
Fixed swap – AUD – Global Facility 6.82 6.82 394,912 411,886 (67,353) (83,733)
Fixed swap/cap – AUD – Woodlawn 3.98 3.98 14,804 16,496 8 53
Fixed swap – US dollar – Global Facility 5.36 5.33 138,814 173,846 (30,541) (15,613)
548,530 602,228 (97,886) (99,293)
Bank debt
Global Facility debt is denominated in AUD, USD and EUR and the floating rate debt is re‑priced every six months.
• AUD debt is priced using the six‑month BBSY rate plus the defined facility margin.
• EUR debt is priced using the six‑month EURIBOR rate plus the defined facility margin.
• USD debt is priced using the six‑month LIBOR rate plus the defined facility margin.
50% of the Woodlawn Project Finance debt is re‑priced quarterly using the three‑month BBSY (AUD) rate plus the defined facility margin, and 50% is fixed for 10 years at 3.7575% plus the defined facility margin.
The current debt rates detailed in the tables below are not inclusive of the facility margins.
Floating rate debt
Average floating interest rate Debt principal amount
2016 %
2015 %
2016 $’000
2015$’000
AUD debt – Global Facility 2.53 2.31 136,115 119,141
AUD debt – Woodlawn 2.37 2.20 4,659 6,205
EUR debt – Global Facility (0.04) 0.05 20,834 30,834
USD debt – Global Facility 0.83 0.45 16,980 12,274
178,588 168,454
85

NOTES TO THE CONSOLIDATED FINANCIAL STATEMENTSCAPITAL MANAGEMENT (Continued)
Fixed rate debt
Average fixed interest rate Debt principal amount % of debt hedged
2016 %
2015 %
2016 $’000
2015$’000
2016 %
2015 %
AUD debt – Global Facility 6.82 6.82 394,912 411,886 74 78
AUD debt – Woodlawn 3.85 3.10 35,239 39,197 88 86
USD debt – Global Facility 5.36 5.33 138,813 173,846 89 93
568,964 624,929
Total debt 6.28 6.17 747,552 793,383 76 79
The current average interest rate (floating rate debt and fixed rate debt), pre‑margin across all facilities is 6.29% (2015: 6.17%). The current average margin across all facilities is 126 basis points (2015: 127 basis points).
Sensitivity
The Group’s sensitivity of net result before tax and equity to interest rate movement has been determined based on the exposure to interest rates at the reporting date. A sensitivity of 100 basis points has been selected across the three currencies to which the Group is exposed to floating rate debt: AUD, EUR and USD. The 100 basis points sensitivity is determined to be reasonable as it is assessed to be flat across the yield curve.
The Trust’s sensitivity of net loss before tax and equity to interest rate movement has been determined based on the exposure to interest rates at the reporting date. A sensitivity of 100 basis points has been selected. The 100 basis points sensitivity is determined to be reasonable as it is assessed to be flat across the yield curve.
Infigen Energy Group
2016 AUD $’000
AUD +100 bps
AUD –100 bps
EUR +100 bps
EUR –100 bps
USD +100 bps
USD –100 bps
Effect on income statement
Cash AUD 21,880 219 (219) – – – –
USD 107,250 – – 1,073 (1,073) – –
EUR 18,472 – – – – 185 (185)
147,602
Borrowings AUD 531,027 (1,361) 1,361 – – – –
EUR 20,834 – – (208) (9) – –
USD 155,793 – – – – (170) 142
Woodlawn AUD 39,898 (47) 47 – – – –
747,552
Capitalised loan cost AUD 3,032 30 (30) – – – –
USD 2,030 – – – – 20 (20)
5,062
86 INFIGEN ENERGY ANNUAL REPORT 2016

NOTES TO THE CONSOLIDATED FINANCIAL STATEMENTSCAPITAL MANAGEMENT (Continued)
2015 AUD $’000
AUD +100 bps
AUD –100 bps
EUR +100 bps
EUR –100 bps
USD +100 bps
USD –100 bps
Derivatives – interest rate swaps
AUD 67,353 674 (674) – – – –
USD 30,541 – – – – 305 (305)
97,894
Derivatives – interest rate caps
AUD 8 – – – – – –
Total income statement (485) 485 865 (1,082) 340 (368)
Effect on hedge reserve
Derivatives – interest rate swaps
AUD 394,912 3,949 (3,949) – – – –
USD 138,814 – – – – 1,388 (1,388)
Total hedge reserve 3,949 (3,949) – – 1,388 (1,388)
Total effect on equity 3,464 (3,464) 865 (1,082) 1,728 (1,756)
2015 AUD $’000
AUD +100 bps
AUD –100 bps
EUR +100 bps
EUR –100 bps
USD +100 bps
USD –100 bps
Effect on income statement
Cash AUD 16,648 166 (166) – – – –
EUR 19,619 – – 196 (10) – –
USD 8,915 – – – – 89 (40)
45,182 – – – – – –
Borrowings AUD 531,027 (1,191) 1,191 – – – –
EUR 30,834 – – (308) 15 – –
USD 186,120 – – – – (123) 55
Woodlawn AUD 45,402 (62) 62 – – – –
Capitalised loan cost AUD 4,036 – – – – – –
USD 2,464 – – – – – –
799,883 – – – – – –
Derivatives – interest rate swaps AUD 83,733 1,491 (1,491) – – – –
USD 15,613 – – – – – –
Derivatives – interest rate caps AUD 53 111 (46) – – – –
Total income statement 515 (450) (112) 5 (34) 15
Effect on hedge reserve
Derivatives – interest rate swaps
AUD 411,886 15,168 (16,137) – – – –
USD 173,846 – – – – 9,006 (9,656)
Total hedge reserve 15,168 (16,137) – – 9,006 (9,656)
Total effect on equity 15,683 (16,587) (112) 5 8,972 (9,641)
87

NOTES TO THE CONSOLIDATED FINANCIAL STATEMENTSCAPITAL MANAGEMENT (Continued)
Infigen Energy Trust Group
AUD $’000
AUD +100 bps
AUD –100 bps
2016
Impact on income statement
Cash 405 4 (4)
2015
Impact on income statement
Cash 399 4 (4)
2) Market risk – electricity and environmental certificates price risk
Nature of price risk
The Group’s electricity and environmental certificates are exposed to the risk of changes in the market prices arising from the sale of electricity and environmental certificates to utility companies, an industrial customer and to wholesale markets in the regions it operates and sells in Australia. A decrease in the electricity or environmental certificate price reduces revenue earned.
Price risk management
To mitigate the financial risks of electricity and environmental certificate prices falling, the Group has entered into power purchase agreements and green product purchase agreements to partially contract the sale price of the electricity and environmental certificates it produces.
In undertaking this strategy of contracting a percentage of its electricity and environmental certificate sales, the Group is willing to forgo a percentage of the potential economic benefit that would arise in an increasing electricity and environmental certificate price environment, to protect against downside risks of decreasing electricity and environmental certificate prices; thereby securing a greater level of predictability of cash flows.
Sensitivity
The following table details the Group’s pre‑tax sensitivity to a 10% change in the electricity and environmental certificate price, with all other variables held constant as at the reporting date, for its exposure to the electricity and environmental certificates markets.
A sensitivity of 10% has been selected given the current level of electricity and environmental certificate prices and the volatility observed on an historical basis and market expectations for future movement.
Consolidated AUD $’000
Electricity and LGC
Price +10%
Electricity and LGC
Price –10%
2016
Income statement 8,550 (8,550)
2015
Income statement 4,799 (4,799)
88 INFIGEN ENERGY ANNUAL REPORT 2016

NOTES TO THE CONSOLIDATED FINANCIAL STATEMENTSCAPITAL MANAGEMENT (Continued)
3) Foreign exchange risk
Nature of foreign exchange risk
The Group is exposed to the following foreign exchange risk.
USD debt foreign exchange risk
A decline in value of the AUD versus the USD would increase the AUD equivalent value of the Group’s USD debt. The Group has residual USD debt of US$116 million (FY15: US$143 million) that is not offset by earnings from any operational USD assets, although in the short term the Group maintains a USD cash balance of US$79.9 million.
EUR debt foreign exchange risk
A decline in value of the AUD versus the EUR would increase the AUD equivalent value of the Group’s EUR debt. The Group has residual EUR debt of €14 million (FY15: €21 million) that is not offset by earnings from any operational EUR assets, although in the short term the Group maintains a EUR cash balance of €12.4 million.
Foreign exchange risk management and exposure
The table below splits out the P&L and equity movements of the EUR and USD exposure:
EUR exposure
USD exposure1
Foreign exchange gain/loss
movementGain taken
to P&L
Gain equity – hedge
accounted
EUR €’000 USD $’000 AUD $’000 AUD $’000 AUD $’000
2016
Global Facility debt (14,009) (116,175) (4,955) (4,955) –
Cash 12,420 79,976 3,497 3,497 –
(1,589) (36,199) (1,458) (1,458) –
2015
Global Facility debt (64,298) – (542) (542) –
Cash from discontinued operations 43,127 – – – –
Cash 13,471 – 114 114 –
(7,700) – (428) (428) –
1 In FY15 Infigen US debt exposure was mitigated by its US operations. The sale of the US business in FY16 has resulted in USD exposure.
The Group has a multi‑currency corporate debt facility and where practicable aims to ensure the majority of its debt and expenses are denominated in the same currency as the associated revenue and investments. The Group’s balance sheet exposure to foreign currency risk at the reporting date is shown below. This represents the EUR and USD assets and liabilities the Group holds translated to the AUD functional currency.
2016 2015
Foreign currency (AUD $’000) EUR USD EUR USD
Cash 18,472 107,250 19,491 8,829
Short‑term intercompany loans – – 46,011 62,270
Interest rate swap – (40,231) – –
Net investment in foreign operations – – 9,860 403,344
Trade payables – – – (443)
Borrowings (20,834) (155,793) (30,835) –
Total exposure (foreign currency AUD $’000) (2,362) (88,774) 44,527 474,000
89

NOTES TO THE CONSOLIDATED FINANCIAL STATEMENTSCAPITAL MANAGEMENT (Continued)
Sensitivity
The following table details the Group’s pre‑tax sensitivity to a 10% change in the AUD against the USD and the EUR, with all other variables held constant, as at the reporting date, for its unhedged foreign exchange exposure.
A sensitivity of 10% has been selected as this is determined to be a reasonable measure for assessing the effect of exchange rate movements.
Consolidated AUD’000
AUD/EUR +10 %
AUD/EUR –10%
AUD/USD +10%
AUD/USD –10%
2016
Income statement (236) 236 (4,854) 4,854
Foreign currency translation reserve – – – –
2015
Income statement (3,467) 3,467 (7,065) 7,065
Foreign currency translation reserve (986) 986 (40,334) 40,334
4) Credit risk and counterparty risk
Nature of credit risk
The Group’s risk that a counterparty will default on its contractual obligations resulting in financial loss to the Group and the Trust arises from cash and cash equivalents, derivative financial instruments and deposits with banks, as well as credit exposures to customers.
Credit risk management
The Group’s exposure is regularly monitored and the aggregate value of transactions is spread among creditworthy counterparties. The Group’s credit risk on liquid funds and derivative financial instruments is limited because the counterparties are:
• banks with high credit ratings assigned by international credit‑rating agencies at above investment grade; or
• utilities with appropriately enforced and sized trading limits having regard to international credit ratings and performance security.
90 INFIGEN ENERGY ANNUAL REPORT 2016

NOTES TO THE CONSOLIDATED FINANCIAL STATEMENTSCAPITAL MANAGEMENT (Continued)
Exposure
The Trust has credit risk exposure to other members of the Group.
The Group does not have any significant credit risk exposure to any single counterparty or any group of counterparties due to contracts being settled on a monthly and quarterly basis.
The carrying amount of financial assets, recorded in the financial statements, represents the Group’s maximum exposure to credit risk.
The Trust’s carrying amount of financial assets recorded in the financial statements, net of any allowances for losses, represents its maximum exposure to credit risk.
Infigen Energy Group
Consolidated
Within credit terms $’000
Past due but not
impaired $’000
Impaired $’000 Description
2016
Bank deposits 147,602 – – Credit rating investment grade
Trade receivables 15,740 – – Small number of Australian off‑take counterparties
Other current receivables 252 – – Sale settlement period
Amounts due from related parties (associates)
1,019 – – Loan to associated entities
2015
Bank deposits 43,710 1,4721 – Credit rating investment grade
Trade receivables 15,483 – – Small number of Australian off‑take counterparties
Other current receivables 55,760 – – Sale settlement period
Amounts due from related parties (associates)
842 – – Loan to associated entities
Infigen Energy Trust Group
Consolidated
Within credit terms $’000
Past due but not
impaired $’000
Impaired $’000 Description
2016
Bank deposits 405 – – Credit rating investment grade
Loans to related parties – – 568,4462 Amount receivable at the discount rate after the unwinding of discount
405 – 568,446
2015
Bank deposits 399 – – Credit rating investment grade
Loans to related parties – – 743,300 Due from Group members (other than IET)
Impairment – – (205,300) Impairment arising from discontinued operations
399 – 538,000 Amount receivable at the discount rate
1 Cash held in escrow in relation to German wind asset sale.2 Refer to Note 31 for the contractual amount due from Group members other than IET.
91

NOTES TO THE CONSOLIDATED FINANCIAL STATEMENTSCAPITAL MANAGEMENT (Continued)
5) Liquidity risk
Nature of liquidity risk
The Group’s risk that its assets cannot be traded quickly enough in the market to prevent a loss or make a profit stems primarily from long‑term borrowings and derivative contracts.
Liquidity risk management
The Group and the Trust manage liquidity risks by maintaining adequate reserves and banking facilities by regularly monitoring forecast and actual cash flows and matching the maturity profiles of financial assets and liabilities.
Exposure
The tables below set out the Group’s and the Trust’s financial assets and financial liabilities at balance sheet date and place them into relevant maturity groupings based on the remaining period at balance sheet date to the contractual maturity date. The amounts disclosed in the tables are the contractual undiscounted cash flows.
The tables include the Group’s forecast contractual repayments under the Global Facility and the Woodlawn Project Finance facility. From 1 July 2010 the Global Facility terms provide that net cash flows from the entities included in the Global Facility borrower group be applied to repay amounts outstanding under the Global Facility. WWCS Finance Pty Ltd, an Excluded Company for the purposes of the Global Facility, is the borrower under the Woodlawn Project Finance facility.
For interest rate swaps and interest rate caps, the cash flows have been estimated using forward interest rates applicable at the reporting date.
Infigen Energy Group
Up to 12 months
$’0001 to 5 years
$’000
Over 5 years $’000
Total contractual cash flows
$’000
2016
Global Facility debt and interest 87,928 231,922 406,792 726,642
Woodlawn facility debt and interest 6,514 28,365 15,259 50,138
Interest rate swaps payable – Global Facility 25,429 48,048 30,417 103,894
Interest rate cap receivable – 6 2 8
Trade and other payables (Note 12) 17,356 – – 17,356
2015
Global Facility debt and interest 53,093 288,106 528,317 869,516
Woodlawn facility debt and interest 13,317 31,664 9,407 54,388
Interest rate swaps payable – Global Facility 31,160 61,875 11,997 105,032
Interest rate cap receivable – (31) (28) (59)
Trade and other payables (Note 12) 28,981 – – 28,981
Liabilities associated with sale of discontinued operations
Global Facility debt and interest 246,199 – – 246,199
Interest rate swaps payable – Global Facility 32,310 – – 32,310
Infigen Energy Trust Group
Consolidated
Up to 12 months
$’0001 to 5 years
$’000
Over 5 years $’000
Total contractual cash flows
$’000
2016
Amounts due to related parties 4,858 – – 4,858
2015
Amounts due to related parties 4,179 – – 4,179
92 INFIGEN ENERGY ANNUAL REPORT 2016

NOTES TO THE CONSOLIDATED FINANCIAL STATEMENTSEQUITY
6) Capital risk
Nature of capital risk
The Group’s and the Trust’s risk that they may lose all or part of capital invested stems from the Group’s ability to meet debt repayments and other financial obligations. The capital structure of the Group consists of debt finance facilities as listed in Note 15, and equity, comprising issued capital, reserves and retained earnings as listed in Notes 19, 20 and 21 respectively.
Capital risk management
The Group’s and the Trust’s objectives when managing capital are to safeguard the Group’s ability to continue as a going concern, so that it can generate value for securityholders and unitholders and benefits for other stakeholders and to maintain an appropriate capital structure to minimise the cost of capital.
In order to maintain or adjust the capital structure, the Group and the Trust may adjust the amount of distributions or dividends paid to securityholders/unitholders, return capital to securityholders, buy back existing securities, issue new securities or sell assets to reduce debt, subject to any restrictions in the Group’s debt facilities.
Through the year to 30 June 2016, the Group has had to maintain the following ratios in regards to compliance with its various facilities:
• Global Facility – Leverage ratio, Net Debt/EBITDA1; and
• WWCS Finance Pty Ltd, Woodlawn project finance facility – Debt Service Coverage Ratio (DSCR).
The Group has maintained its various banking financial covenant ratios during FY16 and FY15.
1 Refer to Note 15(i) – Borrowings.
EQUITY
19. Contributed equity
Infigen Energy Group Infigen Energy Trust Group
2016 No.
2016 $’000
2015 No.
2015$’000
2016 No.
2016 $’000
2015 No.
2015$’000
Fully paid stapled securities/units
Opening balance 767,888 763,169 764,993 762,460 767,888 754,603 764,993 753,894
Issue of securities 4,581 1,145 2,895 709 4,581 1,145 2,895 709
Closing balance 772,469 764,314 767,888 763,169 772,469 755,748 767,888 754,603
2016 $’000
2015$’000
Attributable to:
Equity holders of the parent 2,305 2,305
Equity holders of the other stapled securities (non‑controlling interests) 762,009 760,864
764,314 763,169
Stapled securities are classified as equity. Holders of stapled securities are entitled to receive dividends from IEL and IEBL, distributions from IET, and are entitled to one vote per stapled security at securityholder meetings. The holder is also entitled to participate in the proceeds on winding up of the stapled entities in proportion to the number of and amounts paid on the securities held.
93

NOTES TO THE CONSOLIDATED FINANCIAL STATEMENTSEQUITY (Continued)
20. Reserves
Infigen Energy Group
2016 $’000
2015$’000
Foreign currency translation – (6,774)
Hedging (62,622) (70,239)
Acquisition (47,675) (47,675)
Share‑based payment 3,846 4,207
(106,451) (120,481)
Attributable to:
Equity holders of the parent (106,451) (120,481)
Equity holders of the other stapled securities (non‑controlling interests) – –
(106,451) (120,481)
a) Foreign currency translation reserve
Infigen Energy Group
2016
$’0002015
$’000
Balance at beginning of financial year (6,774) (45,867)
Movements increasing/(decreasing) recognised:
Translation of foreign operations 6,774 39,093
Balance at end of financial year – (6,774)
Exchange differences arising on translation of foreign currency of foreign controlled entities are taken to the foreign currency translation reserve. The reserve is recognised in profit and loss when the net investment is disposed of.
b) Hedging reserve
Infigen Energy Group
2016 $’000
2015$’000
Balance at beginning of financial year (70,239) (102,301)
Movement increasing/(decreasing) recognised:
Interest rate swaps 1,451 31,593
Foreign exchange contracts (86) –
Deferred tax arising on hedges 6,252 469
7,617 32,062
Balance at end of financial year (62,622) (70,239)
The hedging reserve is used to record movements on a hedging instrument in a cash flow hedge that are recognised directly in equity. The gain or loss from re‑measuring the hedging instruments at fair value is deferred in equity in the hedging reserve, to the extent that the hedge is effective, and reclassified into profit and loss when the hedged interest expense is recognised. The ineffective portion is recognised in the income statement immediately.
94 INFIGEN ENERGY ANNUAL REPORT 2016

NOTES TO THE CONSOLIDATED FINANCIAL STATEMENTSEQUITY (Continued)
c) Acquisition reserve
Infigen Energy Group
2016 $’000
2015$’000
Balance at the beginning and end of the financial year (47,675) (47,675)
The acquisition reserve relates to the acquisition of non‑controlling interests in entities over which the Group already exerted control. Therefore, the acquisition of these non‑controlling interests did not result in a change of control but was an acquisition of the interests held by minority shareholders.
These transactions are treated as transactions between owners of the Group. The difference between the purchase consideration, and the amount by which the non‑controlling interest is adjusted, has been recognised in the acquisition reserve.
d) Share-based payments reserve
Infigen Energy Group
2016 $’000
2015$’000
Balance at beginning of financial year 4,207 3,622
Share‑based payments expense 536 720
Issue of shares/bonus provision transfer (897) (135)
Balance at end of financial year 3,846 4,207
The share‑based payments reserve is used to recognise the fair value of performance rights/units issued to employees but not vested. Refer to Note 32 for further detail.
21. Retained earnings
Infigen Energy Group Infigen Energy Trust Group
2016 $’000
2015$’000
2016 $’000
2015$’000
Balance at beginning of financial year (381,784) (78,181) (220,383) (14,394)
Net profit/(loss) attributable to stapled securityholders 4,486 (303,603) 28,628 (205,989)
Balance at end of financial year (377,298) (381,784) (191,755) (220,383)
Attributable to:
Equity holders of the parent (353,125) (358,690) (191,755) (220,383)
Equity holders of the other stapled securities (non‑controlling interests) (24,173) (23,094) – –
(377,298) (381,784) (191,755) (220,383)
22. Distributions
Infigen Energy Group
Ordinary shares
Final and interim distributions in respect of the years ended 30 June 2015 and 30 June 2016 were nil cents per stapled security.
Franking credits
The parent entity has franking credits of $6,228,093 as at 30 June 2016 (2015: $6,228,093).
Infigen Energy Trust Group
Distributions in respect of the years ended 30 June 2015 and 30 June 2016 were nil.
95

NOTES TO THE CONSOLIDATED FINANCIAL STATEMENTSGROUP STRUCTURE
GROUP STRUCTURE
23. Investment in associates and joint ventures
Infigen Energy Group
2016 $’000
2015$’000
a) Movements in carrying amounts
Carrying amount at the beginning of the year 452 96,292
Additions 781 –
Share of profits/(losses) after income tax 25 12,726
Distributions received – (9,129)
Effects of exchange rate changes – 20,794
Investment in associates and joint ventures of discontinued operations – (120,231)
Carrying amount at the end of the year 1,258 452
Place of business/ country of incorporation
Ownership interest1 %Nature of
relationshipMeasurement
method30 June 2016 30 June 2015
30 June 2016
Australian associate and joint venture entities
Australia 32%‑50% 32%‑50% Associates and joint ventures
Equity method
1 Share capital consists solely of ordinary shares, which are held directly by the Group.
The Australian associate and joint venture entities hold interests in renewable energy development projects.
From 22 December 2015, the Group holds 50% of the shares in Bodangora Wind Farm Pty Ltd and Forsayth Wind Farm Pty Ltd.
All associates and joint ventures are private entities and therefore no quoted security prices are available.
b) Contingent liabilities in respect of associates and joint ventures
There are no contingent liabilities in respect of associates and joint ventures as at 30 June 2016 (30 June 2015: nil).
Recognition and measurement
The Group’s investment in associates and joint ventures is accounted for in the consolidated financial statements using the equity method. Under this method, the investment in associates and joint ventures is carried in the consolidated balance sheet at cost.
c) Summarised financial information of associates and joint ventures
The Group’s share of the results of its associates and joint ventures is as follows:
Group’s share of:
Net assets $’000
Revenues $’000
Share of profit $’000
Year ended 30 June 2016
Australian associate and joint venture entities 1,258 – 25
1,258 – 25
Year ended 30 June 2015
Australian associate and joint venture entities 452 – (66)
452 – (66)
96 INFIGEN ENERGY ANNUAL REPORT 2016
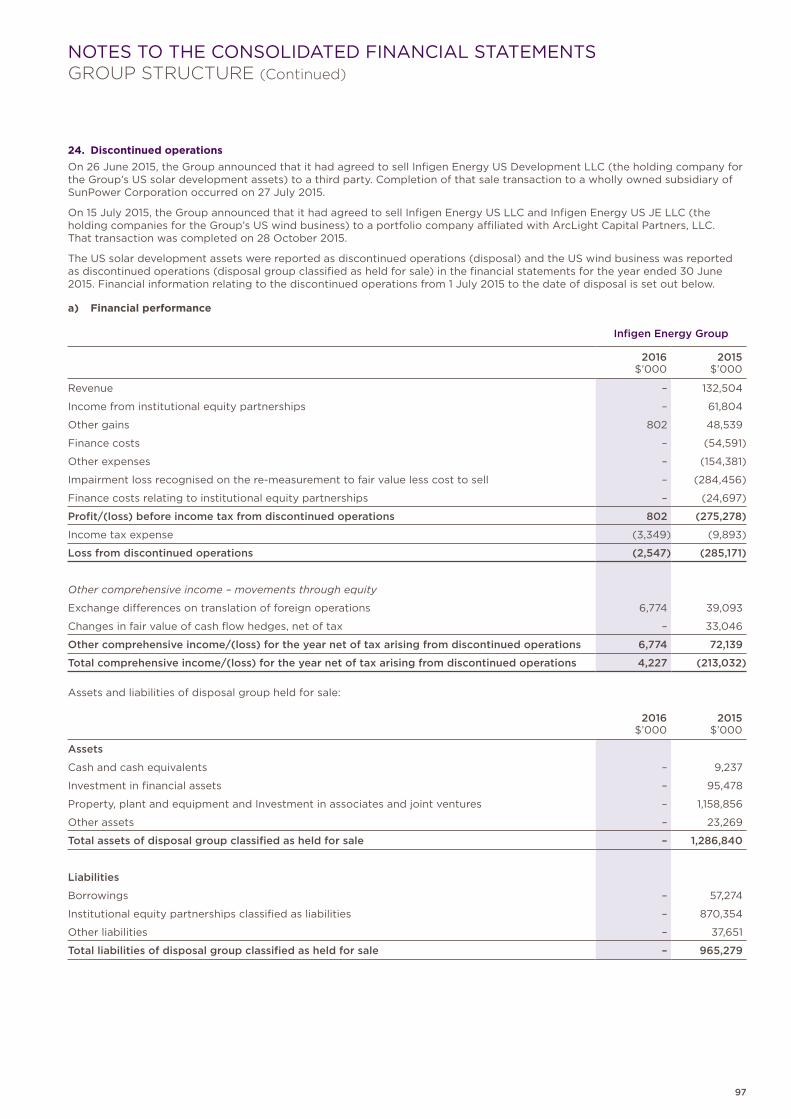
NOTES TO THE CONSOLIDATED FINANCIAL STATEMENTSGROUP STRUCTURE (Continued)
24. Discontinued operations
On 26 June 2015, the Group announced that it had agreed to sell Infigen Energy US Development LLC (the holding company for the Group’s US solar development assets) to a third party. Completion of that sale transaction to a wholly owned subsidiary of SunPower Corporation occurred on 27 July 2015.
On 15 July 2015, the Group announced that it had agreed to sell Infigen Energy US LLC and Infigen Energy US JE LLC (the holding companies for the Group’s US wind business) to a portfolio company affiliated with ArcLight Capital Partners, LLC. That transaction was completed on 28 October 2015.
The US solar development assets were reported as discontinued operations (disposal) and the US wind business was reported as discontinued operations (disposal group classified as held for sale) in the financial statements for the year ended 30 June 2015. Financial information relating to the discontinued operations from 1 July 2015 to the date of disposal is set out below.
a) Financial performance
Infigen Energy Group
2016 $’000
2015$’000
Revenue – 132,504
Income from institutional equity partnerships – 61,804
Other gains 802 48,539
Finance costs – (54,591)
Other expenses – (154,381)
Impairment loss recognised on the re‑measurement to fair value less cost to sell – (284,456)
Finance costs relating to institutional equity partnerships – (24,697)
Profit/(loss) before income tax from discontinued operations 802 (275,278)
Income tax expense (3,349) (9,893)
Loss from discontinued operations (2,547) (285,171)
Other comprehensive income – movements through equity
Exchange differences on translation of foreign operations 6,774 39,093
Changes in fair value of cash flow hedges, net of tax – 33,046
Other comprehensive income/(loss) for the year net of tax arising from discontinued operations 6,774 72,139
Total comprehensive income/(loss) for the year net of tax arising from discontinued operations 4,227 (213,032)
Assets and liabilities of disposal group held for sale:
2016 $’000
2015$’000
Assets
Cash and cash equivalents – 9,237
Investment in financial assets – 95,478
Property, plant and equipment and Investment in associates and joint ventures – 1,158,856
Other assets – 23,269
Total assets of disposal group classified as held for sale – 1,286,840
Liabilities
Borrowings – 57,274
Institutional equity partnerships classified as liabilities – 870,354
Other liabilities – 37,651
Total liabilities of disposal group classified as held for sale – 965,279
97

NOTES TO THE CONSOLIDATED FINANCIAL STATEMENTSGROUP STRUCTURE (Continued)
25. Subsidiaries
Subsidiaries are all those entities over which the Group or the Trust has the power to govern the financial and operating policies, generally accompanying a shareholding of more than one‑half of the voting rights. The existence and effect of potential voting rights that are currently exercisable or convertible are considered when assessing whether the Group or the Trust controls another entity. Following completion of the sale of the US business on 28 October 2015, the US subsidiaries that have been classified as discontinued operations are no longer part of the Group.
Name of entityCountry of
incorporation
Ownership interest
2016 2015
Parent entity
* Infigen Energy Limited Australia
Other stapled entities
Infigen Energy (Bermuda) Limited Bermuda
Infigen Energy Trust Australia
Subsidiaries of the parent and other stapled entities
BBWP Holdings (Bermuda) Limited Bermuda 100% 100%
* Bogan River Solar Farm Pty Ltd Australia 100% –
* Capital East Solar Pty Limited Australia 100% 100%
* Capital Solar Farm Pty Limited Australia 100% 100%
* Capital Wind Farm (BB) Trust Australia 100% 100%
* Capital Wind Farm 2 Pty Limited Australia 100% 100%
*# Capital Wind Farm Holdings Pty Limited Australia 100% 100%
* Cherry Tree Wind Farm Pty Ltd Australia 100% 100%
* CREP Land Holdings Pty Limited Australia 100% 100%
* CS CWF Trust Australia 100% 100%
* Flyers Creek Wind Farm Pty Ltd Australia 100% 100%
Infigen Energy (Malta) Limited Malta 100% 100%
* Infigen Energy (US) Pty Limited Australia 100% 100%
* Infigen Energy (US) 2 Pty Limited Australia 100% 100%
* Infigen Energy Custodian Services Pty Limited Australia 100% 100%
* Infigen Energy Development Holdings Pty Limited Australia 100% 100%
* Infigen Energy Development Pty Ltd Australia 100% 100%
* Infigen Energy Europe Pty Limited Australia 100% 100%
* Infigen Energy Europe 2 Pty Limited Australia 100% 100%
* Infigen Energy Europe 3 Pty Limited Australia 100% 100%
* Infigen Energy Europe 4 Pty Limited Australia 100% 100%
* Infigen Energy Europe 5 Pty Limited Australia 100% 100%
* Infigen Energy Finance (Australia) Pty Limited Australia 100% 100%
* Infigen Energy Finance (Germany) Pty Limited Australia 100% 100%
Infigen Energy Finance (Lux) SARL Luxembourg 100% 100%
* Infigen Energy Germany Holdings Pty Limited Australia 100% 100%
* Infigen Energy Germany Holdings 2 Pty Limited Australia 100% 100%
* Infigen Energy Germany Holdings 3 Pty Limited Australia 100% 100%
* Infigen Energy Holdings Pty Limited Australia 100% 100%
Infigen Energy Holdings SARL Luxembourg 100% 100%
* Infigen Energy Investments Pty Limited Australia 100% 100%
* Infigen Energy Markets Pty Limited Australia 100% 100%
* Infigen Energy Niederrhein Pty Limited Australia 100% 100%
* Infigen Energy RE Limited Australia 100% 100%
* Infigen Energy Services Holdings Pty Limited Australia 100% 100%
* Infigen Energy Services Pty Limited Australia 100% 100%
98 INFIGEN ENERGY ANNUAL REPORT 2016

NOTES TO THE CONSOLIDATED FINANCIAL STATEMENTSGROUP STRUCTURE (Continued)
Name of entityCountry of
incorporation
Ownership interest
2016 2015
* Infigen Energy T Services Pty Limited Australia 100% 100%
Infigen Energy US Corporation USA 100% 100%
Infigen Energy US Holdings LLC USA 100% 100%
~ Infigen Energy US Development Corporation USA 100% –
* Infigen Energy US Holdings Pty Limited Australia 100% 100%
Infigen Energy US Partnership USA 100% 100%
*# Lake Bonney Holdings Pty Limited Australia 100% 100%
* Lake Bonney 2 Holdings Pty Limited Australia 100% 100%
* Lake Bonney Wind Power Pty Limited Australia 100% 100%
* Lake Bonney Wind Power 2 Pty Limited Australia 100% 100%
* Lake Bonney Wind Power 3 Pty Limited Australia 100% 100%
* Manildra Solar Farm Pty Limited Australia 100% 100%
* NPP LB2 LLC USA 100% 100%
* NPP Projects I LLC USA 100% 100%
* NPP Projects V LLC USA 100% 100%
* NPP Walkaway Pty Limited Australia 100% 100%
* NPP Walkaway Trust Australia 100% 100%
* Renewable Energy Constructions Pty Limited Australia 100% 100%
*# Renewable Power Ventures Pty Ltd Australia 100% 100%
* RPV Investment Trust Australia 100% 100%
* Walkaway (BB) Pty Limited Australia 100% 100%
* Walkaway (CS) Pty Limited Australia 100% 100%
*# Walkaway Wind Power Pty Limited Australia 100% 100%
* Woakwine Wind Farm Pty Ltd Australia 100% 100%
* Woodlawn Wind Pty Ltd Australia 100% 100%
* WWCS Finance Pty Limited Australia 100% 100%
* WWCS Holdings Pty Limited Australia 100% 100%
*# WWP Holdings Pty Limited Australia 100% 100%
Subsidiaries of the Trust
CS Walkaway Trust Australia 100% 100%
Walkaway (BB) Trust Australia 100% 100%
* Denotes a member of the IEL tax consolidated group.# Entered into a class order 98/1418 and related Deed of Cross Guarantee with Infigen Energy Limited removing the requirement for the preparation of separate financial
statements where preparation of a separate financial statement is required (refer to Note 26).~ Incorporated on 8 June 2015.
99

NOTES TO THE CONSOLIDATED FINANCIAL STATEMENTSGROUP STRUCTURE (Continued)
26. Deed of Cross Guarantee
Set out below is a consolidated statement of comprehensive income and balance sheet, comprising Infigen Energy Limited and its controlled entities which are parties to the Deed of Cross Guarantee (refer to Note 25), after eliminating all transactions between parties to the Deed.
The Deed of Cross Guarantee was executed on 18 June 2012.
a) Consolidated statements of comprehensive income
Infigen Energy Group
2016 $’000
2015$’000
Revenue from continuing operations 71,896 75,888
Operating expenses (15,091) (13,659)
Depreciation and amortisation expense (23,127) (21,320)
Impairment expense – (254,300)
Interest expense (19,970) (21,932)
Other finance costs (4,845) (17,801)
Net profit/(loss) before income tax 8,863 (253,124)
Income tax expense (10,435) (5,804)
Net profit/(loss) after income tax (1,572) (258,928)
Loss from discontinued operations – –
Net profit/(loss) for the year (1,572) (258,928)
Other comprehensive income – movements through equity
Changes in the fair value of cash flow hedges, net of tax – –
Total comprehensive income/(loss) for the year, net of tax (1,572) (258,928)
100 INFIGEN ENERGY ANNUAL REPORT 2016

NOTES TO THE CONSOLIDATED FINANCIAL STATEMENTSGROUP STRUCTURE (Continued)
b) Consolidated balance sheets
Infigen Energy Group
2016 $’000
2015$’000
Current assets
Cash and cash equivalents 9 9
Trade and other receivables 16,489 15,900
Inventory 9,794 1,703
Total current assets 26,292 17,612
Non-current assets
Receivables 923,076 648,232
Shares in controlled entities 30,318 28,559
Property, plant and equipment 353,779 374,274
Deferred tax assets 48,544 53,746
Intangible assets 57,382 59,614
Total non-current assets 1,413,099 1,164,425
Total assets 1,439,391 1,182,037
Current liabilities
Trade and other payables 1,052 7,866
Total current liabilities 1,052 7,866
Non-current liabilities
Payables 1,666,880 1,402,960
Provisions 3,938 3,878
Total non-current liabilities 1,670,818 1,406,838
Total liabilities 1,671,870 1,414,704
Net assets (232,479) (232,667)
Equity
Contributed equity 2,305 2,305
Reserves (21,245) (23,005)
Retained earnings (213,539) (211,967)
Total equity (232,479) (232,667)
101

NOTES TO THE CONSOLIDATED FINANCIAL STATEMENTSGROUP STRUCTURE (Continued)
27. Parent disclosures
a) Summary financial information
Infigen Energy Limited
2016 $’000
2015$’000
Assets and liabilities
Current assets – 675
Non‑current assets 670,524 610,410
Total assets 670,524 611,085
Current liabilities – 395
Non‑current liabilities 945,403 880,239
Total liabilities 945,403 880,634
Shareholders’ equity
Issued capital 2,305 2,305
Retained earnings (277,184) (271,854)
(274,879) (269,549)
Loss for the year (5,330) (268,518)
Total comprehensive loss (5,330) (268,518)
Due to the stapled structure of IEL, IET and IEBL, the summary financial information of the parent entity shows a net liability as at 30 June 2016. When combined with the other stapled entities, the parent has positive net current assets and net total assets. Non‑current liabilities of IEL are principally $594,975,000 of long‑term funding provided by IET.
b) Deed of Cross Guarantee
IEL has entered into a Deed of Cross Guarantee with the effect that the company guarantees debts in respect of certain of its subsidiaries. Further details of the Deed of Cross Guarantee and the subsidiaries subject to the deed are disclosed in Notes 25 and 26.
Parent entity financial information
The financial information for the parent entity has been prepared on the same basis as the consolidated financial statements.
102 INFIGEN ENERGY ANNUAL REPORT 2016
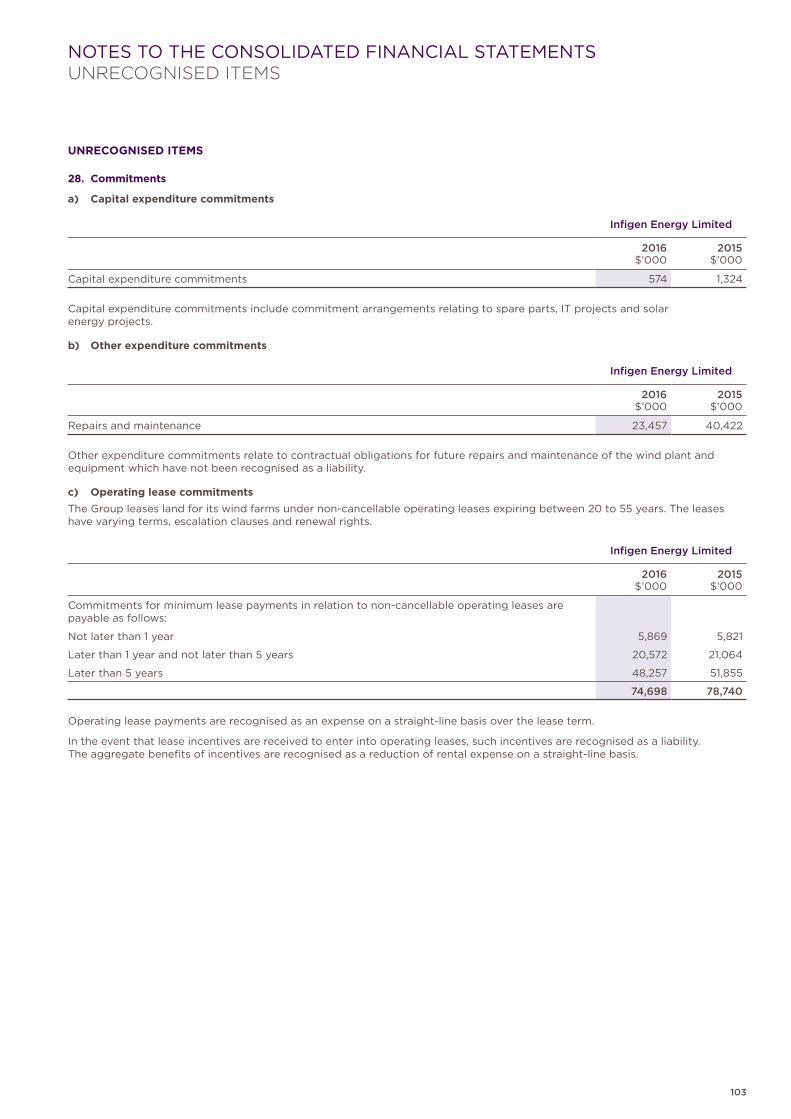
NOTES TO THE CONSOLIDATED FINANCIAL STATEMENTSUNRECOGNISED ITEMS
UNRECOGNISED ITEMS
28. Commitments
a) Capital expenditure commitments
Infigen Energy Limited
2016 $’000
2015$’000
Capital expenditure commitments 574 1,324
Capital expenditure commitments include commitment arrangements relating to spare parts, IT projects and solar energy projects.
b) Other expenditure commitments
Infigen Energy Limited
2016 $’000
2015$’000
Repairs and maintenance 23,457 40,422
Other expenditure commitments relate to contractual obligations for future repairs and maintenance of the wind plant and equipment which have not been recognised as a liability.
c) Operating lease commitments
The Group leases land for its wind farms under non‑cancellable operating leases expiring between 20 to 55 years. The leases have varying terms, escalation clauses and renewal rights.
Infigen Energy Limited
2016 $’000
2015$’000
Commitments for minimum lease payments in relation to non‑cancellable operating leases are payable as follows:
Not later than 1 year 5,869 5,821
Later than 1 year and not later than 5 years 20,572 21,064
Later than 5 years 48,257 51,855
74,698 78,740
Operating lease payments are recognised as an expense on a straight‑line basis over the lease term.
In the event that lease incentives are received to enter into operating leases, such incentives are recognised as a liability. The aggregate benefits of incentives are recognised as a reduction of rental expense on a straight‑line basis.
103

NOTES TO THE CONSOLIDATED FINANCIAL STATEMENTSOTHERS
29. Contingent liabilities
Infigen Energy Group
Infigen Energy Limited
2016 $’000
2015$’000
Letters of credit 1,964 1,964
Letters of credit generally relate to wind farm construction, operations and decommissioning and represent the maximum exposure. No liability was recognised by the parent entity of the Group in relation to these letters of credit, as their combined fair value is immaterial.
Deed of Cross Guarantee
Under the terms of ASIC Class Order 98/1418, certain wholly owned controlled entities are granted relief from the requirement to prepare audited financial reports. Infigen Energy Limited has entered into an approved deed of indemnity for the cross‑guarantee of liabilities with those controlled entities listed in Note 25.
Infigen Energy Trust Group
There are no contingent liabilities for the Trust as at 30 June 2016 (2015: nil).
Key estimate
The Group or the Trust has made estimates and assumptions in relation to its contingent liabilities. By their nature, the exact value of these contingent liabilities is uncertain and the Group has made estimates of their value based on the facts and circumstances known at the reporting date.
30. Events occurring after the reporting period
Since the end of the financial year, in the opinion of the Directors of IEL and IERL as Responsible Entity of IET, there have not been any transactions or events of a material or unusual nature likely to affect significantly the operations or affairs of IEL and IET in future financial periods.
OTHERS
31. Related party transactions
Infigen Energy Group
At the year end the Group was owed an amount of $1,019,156 (2015: $842,452) from an associate, RPV Developments Pty Ltd.
Infigen Energy Trust Group
For the year ended 30 June 2016, the Trust recognised $29.3 million (2015: nil) for the unwinding of the discount of the loan receivable from related parties recognised on 30 June 2015. As part of the long‑term funding arrangements within the stapled structure, IET has loans due from other Group entities totaling $744.4 million. The sale of the US wind business had the effect of extending the expected time to full repayment of these loans. While IET is expected to receive the full $744.4 million contractual face value of the loans, the term of the loan has increased and this has reduced the net present value. The forecast undiscounted cash flows of the assets of the continuing operations still support the carrying value of these loans as they exceed $744.4 million.
Under the Trust’s constitution, the Responsible Entity (“RE”) is entitled to a management fee of 2% per annum of the value of the gross assets of the Trust. The RE, Infigen Energy RE Limited, is a wholly owned subsidiary of IEL. The RE had previously exercised its right under the constitution to waive the fee referred to above such that it is paid a fixed fee that is increased by CPI annually. During the year ended 30 June 2016, the Trust incurred fees of $678,326 (2015: $668,301) from the RE.
104 INFIGEN ENERGY ANNUAL REPORT 2016

NOTES TO THE CONSOLIDATED FINANCIAL STATEMENTSOTHERS (Continued)
The Trust owed the following amounts to other members of the Infigen Energy Group:
2016 $’000
2015$’000
Infigen Energy RE Limited 4,857 4,179
The Infigen Energy Trust Group was owed the following amounts by other members of the Infigen Energy Group:
2016 $’000
2015$’000
Infigen Energy Limited 594,975 593,850
Infigen Energy (Bermuda) Limited 691 691
Capital Wind Farm Holdings Pty Limited 12,960 12,960
Infigen Energy Holdings Pty Limited 105,790 105,790
Infigen Energy (US) 2 Pty Limited 30,009 30,009
Total receivables from related parties 744,425 743,300
Receivables from related parties are disclosed in Note 7. Payables to related parties are disclosed in Note 12.
Substantial shareholders
Mr P Green, a Non‑Executive Director of the Group, is a partner of TCI Advisor Services LLP (“TCI”), an advisor to an entity which has a substantial shareholding of Infigen stapled securities. Mr P Green has advised the Group that he does not have a relevant interest in those Infigen stapled securities.
32. Share-based payments
The Group provides share‑based compensation benefits to certain executives of the Group via the Infigen Energy Equity Plan (“Equity Plan”).
Recognition and measurement
The fair value of performance rights/units granted under the Equity Plan is measured at grant date and is recognised as an employee benefit expense over the period during which the executives become unconditionally entitled to the performance rights/units, with a corresponding increase in equity.
Expenses arising from share-based payment transactions
Total expenses arising from share‑based payment transactions recognised during the period as part of employee benefit expense were as follows:
Infigen Energy Limited
2016
$’0002015
$’000
LTI Performance rights expense in the current year 571 657
Deferred STI expense in the current year (deferred in performance rights) 365 350
Write‑back prior years’ long‑term share‑based incentive expense allocation (400) (287)
536 720
105

NOTES TO THE CONSOLIDATED FINANCIAL STATEMENTSOTHERS (Continued)
Additional information on award schemes
Long Term Incentive (LTI) – Employee Equity Plan
LTI Equity Plan arrangements
Senior Managers have received long‑term incentive grants under the Equity Plan for FY14, FY15 and FY16.
Performance conditions of LTI awards granted under the Equity Plan
• In each of FY14, FY15 and FY16, plan participants received 100% performance rights or units in two tranches of equal value (Tranche 1 and Tranche 2).
The measures used to determine performance and the subsequent vesting of performance rights/units are Total Shareholder Return (TSR) and an operational performance (EBITDA) test. The vesting of Tranche 1 of the performance rights/units is subject to the TSR condition, while the vesting of Tranche 2 of the performance rights/units is subject to the Operational Performance condition. The Operational Performance condition is determined by an earnings before interest, taxes, depreciation and amortisation (EBITDA) test. The FY13 Tranche 1 portion is currently being re‑tested as per the scheme rules in the FY16 period.
Performance rights Performance units Period
2014Tranche 1 TSR condition TSR condition 1 July 2013 – 30 June 2016
Tranche 2 Operational Performance condition Operational Performance condition 1 July 2013 – 30 June 2016
2015Tranche 1 TSR condition TSR condition 1 July 2014 – 30 June 2017
Tranche 2 Operational Performance condition Operational Performance condition 1 July 2014 – 30 June 2017
2016Tranche 1 TSR condition TSR condition 1 July 2015 – 30 June 2018
Tranche 2 Operational Performance condition Operational Performance condition 1 July 2015 – 30 June 2018
TSR condition (applicable to Tranche 1 performance rights or units): TSR measures the growth in the price of securities plus cash distributions notionally reinvested in securities. In order for the Tranche 1 performance rights to vest, the TSR of Infigen will be compared to companies in the S&P/ASX 200 index (excluding financial services and the materials/resources sectors). For the purpose of calculating the TSR measurement, the security prices of each company in the S&P/ASX 200 index (as modified above) and of Infigen will be averaged over the 30 trading days preceding the start and end date of the performance period.
The percentages of the Tranche 1 performance rights that vest under the LTI plans are as follows:
Infigen Energy’s TSR performance compared to the relevant peer group
FY14, 15 and 16 Grant Percentage of Tranche 1 Performance Rights that vest
0 to 49th percentile Nil
50th percentile 25% of the Tranche 1 Performance Rights will vest
51st to 75th percentile 27% to 75% (i.e. for every percentile increase between 51% and 75% an additional 2% of the Tranche 1 Performance Rights will vest)
76th to 95th percentile 76.25% to 100% (i.e. for every percentile increase between 76% and 95% an additional 1.25% of the Tranche 1 Performance Rights will vest)
96th to 100th percentile 100%
Operational Performance condition (applicable to Tranche 2 performance rights/units): the vesting of the Tranche 2 performance rights or units is subject to an Operational Performance condition.
The Operational Performance condition will test the multiple of EBITDA to Capital Base, with the annual target being a specified percentage increase in the multiple over the year. The Capital Base will be measured as equity (net assets) plus net debt. Both the EBITDA and Capital Base are measured on a proportionately consolidated basis to reflect Infigen’s economic interest in all investments.
106 INFIGEN ENERGY ANNUAL REPORT 2016

NOTES TO THE CONSOLIDATED FINANCIAL STATEMENTSOTHERS (Continued)
The percentages of the Tranche 2 performance rights that vest under the LTI plans are as follows:
Infigen Energy’s EBITDA performanceFY14, FY15 and FY16 Grant Percentage of Tranche 2 Performance Rights that vest
0% < 90% of the cumulative target Nil
90% ≤ 110% of the cumulative target5% to 100% (i.e. for every 1% increase between 90 and 110% of target an additional 5% of the Tranche 2 Performance Rights will vest)
Set out below are summaries of performance rights that have been granted and are on issue under the Equity Plan:
Deemed grant date
Balance at start of the year
Granted during the year
Vested during the year
Cash settled during the year
Lapsed during the year
Balance at end of the year
Number Number Number Number Number Number
FY13 LTI Grant1 5,610,531 – (2,805,265) – – 2,805,266
FY14 LTI Grant 3,675,889 – – – – 3,675,889
FY14 Deferred STI Grant 4,458,304 – (4,458,304) – – –
FY15 LTI Grant 3,846,154 – – – – 3,846,154
FY15 Deferred STI Grant – 1,810,857 – – – 1,810,857
FY16 LTI Grant – 3,159,814 – – – 3,159,814
Total 17,590,878 4,970,671 (7,263,569) – – 15,297,980
1 The FY13 plan is currently in retest for the Tranche 1 TSR condition.
Fair value of performance rights granted under the LTI plan
Grant dateFair value of
performance rights per share ($)
2014Tranche 1 2 Dec 13 0.098
Tranche 2 2 Dec 13 0.275
2015Tranche 1 21 Nov 14 0.098
Tranche 2 21 Nov 14 0.275
2016Tranche 1 13 Nov 15 0.128
Tranche 2 13 Nov 15 0.358
The fair values of performance rights/units at grant date are determined using market prices and a model that takes into account the exercise price, the term of the performance right/unit and the security price at grant date.
The model inputs for performance rights/units granted include:
• Performance rights/units are granted for no consideration and vest in accordance with the TSR condition and the Operational Performance condition outlined above for Tranche 1 and Tranche 2, respectively. Performance rights/units have a nil exercise price and vest automatically as stapled securities for rights and as cash for units.
• Grant dates: 2 December 2013 (FY14 plan); 21 November 2014 (FY15 plan); 13 November 2015 (FY16 plan).
• Security price at grant date: $0.22 (FY13 plan), $0.275 (FY14 plan), $0.275 (FY15 plan), $0.36 (FY16 plan).
Where performance rights/units are issued to employees of subsidiaries within the Group, the expense in relation to these performance rights/units is recognised by the relevant entity with the corresponding increase in stapled securities.
Deferred short-term incentive granted as performance rights (Deferred STI)
• From FY13 Senior Management have received 50% of their short‑term incentive allocation as performance rights, deferred for 12 months.
• The Deferred STI has a forfeiture condition relating to continued employment.• The Deferred STI is recognised as a Share‑Based Payment expense over the two financial periods.• 4,458,304 securities were issued to satisfy the FY14 Deferred STI obligation that vested on 15 September 2015.• The grant dates for the FY15 Deferred STI were 7 October and 13 November 2015 and 14 April 2016.• The number of units issued under the FY15 Deferred STI was 1,810,857.• The weighted average security price at the grant dates for the FY15 Deferred STI was $0.41.
107

NOTES TO THE CONSOLIDATED FINANCIAL STATEMENTS(Continued)
33. Key management personnel disclosures
Key management personnel remuneration
Detailed remuneration disclosures are provided in the Remuneration Report of this annual report designated as audited and forming part of the Directors’ Report.
Key management personnel (KMP) are not remunerated by the Trust. Payments made by the Trust to the responsible entity do not include any amounts attributable to the remuneration of KMPs. Non‑Executive directors of IERL are remunerated by IERL. Other KMP of the Group are remunerated by the Group.
The aggregate remuneration of KMP of the Group and the Trust is set out below:
2016 $
2015 $
Short‑term employee benefits1 3,109,964 2,965,255
Post‑employment benefits (superannuation) 127,250 129,237
Other long‑term benefits and equity‑based incentive expense allocation2 1,170,941 1,215,193
Write‑back prior year’s long‑term share‑based incentive expense allocation (400,000) (287,000)
Total 4,008,155 4,022,685
1 Includes short‑term incentives accrued in respect of the current period.2 Share‑based incentive expense allocations are subject to performance rights and units vesting in the future. FY16 equity‑settled incentive expense is adjusted for FY15
deferred STI granted in the period.
a) Loans to key management personnel and their personally related entities
No loans have been made by the Group or the Trust to KMP or their personally related entities during the years ended 30 June 2016 and 30 June 2015. There are no other transactions with KMP.
34. Remuneration of auditors
During the year the following fees were paid or are payable for services provided by the auditor of the Group and the Trust for their related practices and non‑related audit firms:
Infigen Energy Group Infigen Energy Trust Group
2016 $
2015 $
2016 $
2015 $
Audit services by:
PricewaterhouseCoopers
Australia
Audit and review of the financial statements 201,000 617,000 20,000 20,500
Audit and review of subsidiaries’ financial statements 158,000 73,000 – –
United States – discontinued operations
Audit and review of the financial statements – 146,500 – –
Audit and review of subsidiaries’ financial statements – 488,000 – –
359,000 1,324,500 20,000 20,500
Other services by:
PricewaterhouseCoopers
Australia and Europe
Taxation compliance and advisory services 61,065 143,950 – –
Other assurance services 75,228 189,000 – –
United States – discontinued operations
Accounting advisory services – 68,000 – –
136,293 400,950 – –
Total remuneration of auditors 495,293 1,725,450 20,000 20,500
108 INFIGEN ENERGY ANNUAL REPORT 2016

NOTES TO THE CONSOLIDATED FINANCIAL STATEMENTS(Continued)
35. New and amended accounting standards
a) New and amended standards adopted by the Group or the Trust
Commencing 1 July 2015, the Group and the Trust have early adopted and applied AASB 9 Financial Instruments. AASB 9 replaces the provisions of AASB 139 that relate to the recognition, classification and measurement of financial assets and financial liabilities; derecognition of financial instruments; impairment of financial assets; and hedge accounting. AASB 9 also significantly amends other standards dealing with financial instruments such as AASB 7 Financial Instruments: Disclosures.
Reclassification of financial instruments on adoption of AASB 9
Infigen Energy Group
On the date of initial application, 1 July 2015, the interest rate swaps of the Group that were previously non‑hedge accounted are now hedge accounted under AASB 9.
In accordance with the transitional provisions in AASB 9, comparative figures have not been restated as this amendment is applied prospectively.
Infigen Energy Trust Group
Changes arising out of the early adoption of AASB 9 relating to the changes in the classification and measurement of financial assets and liabilities have had no material effect on the financial reporting of the Infigen Energy Trust Group.
b) New standards and interpretations not yet adopted by the Group or the Trust
Certain new accounting standards and interpretations have been published that are not mandatory for 30 June 2016 reporting periods and have not been early adopted by the Group or the Trust. The Group’s or the Trust’s assessment of the impact of these new standards and interpretations is set out below.
(i) AASB 15 Revenue from Contracts with Customers replaces AASB 118 Contracts for Goods and Services and AASB 111 Construction Contracts. The standard is mandatory for financial years commencing on or after 1 January 2018. Under this new standard, the principle that revenue is recognised when control of a good or service transfers to a customer replaces the notion of risks and rewards. The standard permits a modified retrospective approach which allows entities to recognise transitional adjustments in retained earnings on the date of initial application without restating the comparative period. The new rules are likely to affect the Group’s or the Trust’s revenue as a result of changes to measurement and timing of revenue recognition. The Group will make more detailed assessments of the effect over the next 12 months. The expected date of adoption by the Group and the Trust is 1 July 2018.
(ii) IFRS 16 Leases is mandatory for adoption for financial years commencing on or after 1 January 2019. Released on 13 January 2016, this new standard introduces fundamental changes to accounting for leases such as:
• all leases – except short‑term and low‑value leases – will be recognised on the balance sheet as a lease liability and a corresponding “right of use” asset;
• the right to use the leased item (the asset) and the financial liability to pay rentals are recognised;
• measurements of the leases are defined more broadly under this standard compared to the previous standard;
• the income statement is affected by higher expense in the earlier years of a lease and lower in later years, similar to a principal and interest loan. Additionally, operating expense will be replaced with interest and depreciation; and
• more disclosures required, both qualitative and quantitative, to assist investors/analysts to better understand an entity’s rights and obligations under lease arrangements.
The new rules are likely to affect the Group’s key metrics such as the EBITDA (and therefore affecting the debt covenant), and also lease negotiations (to minimise lease liabilities, shorter leases may be preferred by the lessor). A more detailed assessment of the effects will need to be made prior to the Group’s and the Trust’s mandatory adoption date of 1 July 2019.
There are no other standards that are not yet effective and that are expected to have a material impact on the entity in the current or future reporting periods and on foreseeable future transactions.
109

DIRECTORS’ DECLARATION
DIRECTORS’ DECLARATIONIn the opinion of the Directors of Infigen Energy Limited (“IEL”) and the Directors of the Responsible Entity of Infigen Energy Trust (“IET”), Infigen Energy RE Limited (“IERL”) (collectively referred to as “the Directors”):
a) the financial statements and notes of Infigen Energy Group and the Infigen Energy Trust Group set out on pages 49 to 109 are in accordance with the Corporations Act 2001, including:
(i) complying with Accounting Standards, the Corporations Regulations 2001 and other mandatory professional reporting requirements; and
(ii) giving a true and fair view of Infigen Energy Group’s and Infigen Energy Trust Group’s financial position as at 30 June 2016 and of their performance for the financial year ended on that date;
b) there are reasonable grounds to believe that both Infigen Energy Group and Infigen Energy Trust Group will be able to pay their debts as and when they become due and payable; and
c) the financial statements also comply with International Financial Reporting Standards as issued by the International Accounting Standards Board.
The Directors have been given the declarations by the Chief Executive Officer and the Chief Financial Officer required by section 295A of the Corporations Act 2001.
This declaration is made in accordance with a resolution of the Directors pursuant to section 295(5) of the Corporations Act 2001.
On behalf of the Directors of IEL and IERL:
M Hutchinson M George Chairman Managing Director
Sydney, 29 August 2016
110 INFIGEN ENERGY ANNUAL REPORT 2016

INDEPENDENT AUDITOR’S REPORT
Independent auditor’s report to the stapled security holders of Infigen Energy Group and unit holders of Infigen Energy Trust Group
Report on the financial reportWe have audited the accompanying financial report which comprises:
• the consolidated statement of financial position as at 30 June 2016, the consolidatedstatement of comprehensive income, consolidated statement of changes in equity andconsolidated cash flow statement for the year ended on that date, a summary of significantaccounting policies, other explanatory notes and the directors’ declaration for Infigen EnergyGroup, being the consolidated stapled entity (“Infigen Energy Group”). The Infigen EnergyGroup, comprises Infigen Energy Limited and the entities it controlled at year’s end or fromtime to time during the financial year.
• the consolidated statement of financial position as at 30 June 2016, the consolidatedstatement of comprehensive income, consolidated statement of changes in equity andconsolidated cash flow statement for the year ended on that date, a summary of significantaccounting policies, other explanatory notes and the directors’ declaration for Infigen EnergyTrust Group. The Infigen Energy Trust Group, comprises Infigen Energy Trust and theentities it controlled at year’s end or from time to time during the financial year.
Directors responsibility for the financial reportThe directors of the Infigen Energy Limited and the directors of Infigen Energy RE Limited, the responsible entity of Infigen Energy Trust (collectively referred to as “the directors”) are responsible for the preparation of the financial report that gives a true and fair view in accordance with Australian Accounting Standards and the Corporations Act 2001 and for such internal control as the directors determine is necessary to enable the preparation of the financial report that is free from material misstatement, whether due to fraud or error. The directors also state, in accordance with Accounting Standard AASB 101 Presentation of Financial Statements, that the financial statements comply with International Financial Reporting Standards.
Auditor’s responsibilityOur responsibility is to express an opinion on the financial report based on our audit. We conducted our audit in accordance with Australian Auditing Standards. Those standards require that we comply with relevant ethical requirements relating to audit engagements and plan and perform the audit to obtain reasonable assurance whether the financial report is free from material misstatement.
An audit involves performing procedures to obtain audit evidence about the amounts and disclosures in the financial report. The procedures selected depend on the auditor’s judgement, including the assessment of the risks of material misstatement of the financial report, whether due to fraud or error. In making those risk assessments, the auditor considers internal control relevant to the consolidated entity’s preparation and fair presentation of the financial report in order to design audit procedures that are appropriate in the circumstances, but not for the purpose of expressing an opinion on the effectiveness of the entity’s internal control. An audit also includes evaluating the appropriateness of
PricewaterhouseCoopers, ABN 52 780 433 757 Darling Park Tower 2, 201 Sussex Street, GPO BOX 2650, SYDNEY NSW 1171T: +61 2 8266 0000, F: +61 2 8266 9999, www.pwc.com.au
Liability limited by a scheme approved under Professional Standards Legislation.
111

INDEPENDENT AUDITOR’S REPORT (Continued)
accounting policies used and the reasonableness of accounting estimates made by the directors, as well as evaluating the overall presentation of the financial report.
We believe that the audit evidence we have obtained is sufficient and appropriate to provide a basis for our audit opinion.
Independence In conducting our audit, we have complied with the independence requirements of the Corporations Act 2001.
Auditor’s opinionIn our opinion, the financial report of Infigen Energy Group and Infigen Energy Trust Group is in accordance with the Corporations Act 2001, including:
(a) giving a true and fair view of Infigen Energy Group and Infigen Energy Trust Groups financial position as at 30 June 2016 and performance for the year ended on that date; and
(b) complying with Australian Accounting Standards and the Corporations Regulations 2001.
(c) the financial report and notes also comply with International Financial Reporting Standards.
Report on the Remuneration ReportWe have audited the remuneration report included in pages 35 to 47 of the directors’ report for the year ended 30 June 2016. The directors of the company are responsible for the preparation and presentation of the remuneration report in accordance with section 300A of the Corporations Act 2001. Our responsibility is to express an opinion on the remuneration report, based on our audit conducted in accordance with Australian Auditing Standards.
Auditor’s opinionIn our opinion, the remuneration report of Infigen Energy Group for the year ended 30 June 2016 complies with section 300A of the Corporations Act 2001.
PricewaterhouseCoopers
Marc Upcroft SydneyPartner 29 August 2016
112 INFIGEN ENERGY ANNUAL REPORT 2016

ADDITIONAL INVESTOR INFORMATION
BERMUDA LAW ISSUESIncorporation: Infigen Energy (Bermuda) Limited (IEBL) is incorporated in Bermuda.
Takeovers: Unlike IEL and IET, IEBL is not subject to the sections in Chapter 6 of the Corporations Act dealing with the acquisition of shares (including substantial holdings and takeovers).
Bermuda company law does not have a takeover code which effectively means that a takeover of IEBL will be regulated under Australian takeover law. However, Section 103 of the Bermuda Companies Act provides that where an offer is made for shares of a company and, within four months of the offer the holders of not less than 90% of the shares which are the subject of such offer accept, the offeror may by notice require the non‑tendering shareholders to transfer their shares on the terms of the offer.
Dissenting shareholders may apply to the court within one month of the notice, objecting to the transfer. The test is one of fairness to the body of the shareholders and not to individuals, and the burden is on the dissentient shareholder to prove unfairness, not merely that the scheme is open to criticism.
STAPLED SECURITIESEach Stapled Security is made up of one IEL share, one IET unit and one IEBL share which, under each of the Constitutions and Bye‑Laws respectively, are stapled together and cannot be traded or dealt with separately. In accordance with its requirements in respect of listed stapled securities, ASX reserves the right to remove any or all of IEL, IEBL and IET from the Official List if, while the stapling arrangements apply, the securities in one of these entities cease to be stapled to the securities in the other entities or one of these entities issues securities which are not then stapled to the relevant securities in the other entities.
FURTHER INVESTOR INFORMATIONFurther information required by the Australian Securities Exchange and not shown elsewhere in this Report is as detailed below. The information is current as at 1 September 2016.
NUMBER OF STAPLED SECURITIES AND HOLDERSOne share in each of IEL and IEBL, and one unit in IET, have been stapled together to form a single IFN stapled security. The total number of IFN stapled securities on issue as at 1 September 2016 is 780,577,365 and the number of holders of these stapled securities is 18,841.
SUBSTANTIAL SECURITYHOLDERSThe names of substantial IFN securityholders who have notified IFN in accordance with section 671B of the Corporations Act 2001 are set out below.
IFN stapled securities
Substantial IFN securityholder
Date of notice Number %
The Children’s Investment Fund Management (UK) LLP
6 July 2012 249,603,481 32.74
VV & SS Sethu 22 August 2014 47,000,000 6.13
Ausbil Investment Mgt
31 August 2016 39,248,516 5.08
VOTING RIGHTSIt is generally expected that General Meetings of shareholders of IEL, shareholders of IEBL and unitholders of IET will be held concurrently where proposed resolutions relate to all three Infigen entities. At these General Meetings of IEL, IEBL and IET the voting rights outlined below will apply.
Voting rights in relation to General Meetings of IEL and IEBL:
• on a show of hands, each shareholder of IEL and IEBL, who is present in person and each other person who is present as a proxy, attorney or duly appointed corporate representative of a shareholder, has one vote; and
• on a poll, each shareholder of IEL and IEBL, who is present in person, has one vote for each share they hold. Also each person present as a proxy, attorney or duly appointed corporate representative of a shareholder has one vote for each share held by the shareholder that the person represents.
Voting rights in relation to General Meetings of IET:
• on a show of hands, each unitholder who is present in person and each other person who is present as a proxy, attorney or duly appointed corporate representative of a unitholder has one vote; and
• on a poll, each unitholder who is present in person has one vote for each one dollar of the value of the units in IET held by the unitholder. Also, each person present as proxy, attorney or duly appointed corporate representative of a unitholder has one vote for each one dollar of the value of the units in IET held by the unitholder that the person represents.
113

ADDITIONAL INVESTOR INFORMATION (Continued)
STAPLED SECURITIES THAT ARE RESTRICTED OR SUBJECT TO VOLUNTARY ESCROWThere are currently no IFN stapled securities which are restricted or subject to voluntary escrow.
ON-MARKET SECURITY BUY-BACKThere is no current on‑market buy‑back of IFN stapled securities.
DISTRIBUTION OF IFN STAPLED SECURITIESThe distribution of IFN stapled securities amongst IFN securityholders as at 1 September 2016 is set out below.
Category Securityholders Securities
100,001 and over 155 709,117,840
10,001 – 100,000 1,417 38,647,341
5,001 – 10,000 1,342 10,050,114
1,001 – 5,000 7,534 18,961,818
1 – 1,000 8,393 3,800,252
Total 18,841 780,577,365
As at 1 September 2016, the number of securityholders holding less than a marketable parcel of IFN stapled securities was 5,097.
TWENTY LARGEST IFN SECURITYHOLDERSThe 20 largest IFN securityholders as at 1 September 2016 are set out below.
Rank IFN securityholder
IFN stapled securities held
Number Percentage
1 HSBC Custody Nominees (Australia) Limited 307,700,661 39.42%
2 J P Morgan Nominees Australia Limited 120,177,179 15.40%
3 Citicorp Nominees Pty Limited 101,866,966 13.05%
4 National Nominees Limited 72,998,579 9.35%
5 BNP Paribas Noms Pty Ltd 12,178,823 1.56%
6 HSBC Custody Nominees (Australia) Limited – A/C 2 8,628,636 1.11%
7 Pacific Custodians Pty Limited 8,108,219 1.04%
8 Kolley Pty Ltd 4,913,599 0.63%
9 HSBC Custody Nominees (Australia) Limited – NT‑Comnwlth Super Corp A/C 4,531,155 0.58%
10 Pacific Custodians Pty Limited 4,401,887 0.56%
11 UBS Nominees Pty Ltd 3,337,948 0.43%
12 Tappet Holdings Pty Ltd 3,150,000 0.40%
13 Citicorp Nominees Pty Limited 2,717,194 0.35%
14 ABN Amro Clearing Sydney Nominees Pty Ltd 2,630,971 0.34%
15 Cambrose Pty Limited 2,000,000 0.26%
16 Bryn Investment Co Pty Limited 1,719,243 0.22%
17 Owen Investment Co Pty Limited 1,719,243 0.22%
18 Huw Investment Co Pty Limited 1,719,243 0.22%
19 CS Fourth Nominees Pty Limited 1,547,258 0.20%
20 Bond Street Custodians Ltd 1,541,469 0.20%
Total top 20 671,300,731 1,266,729
Total of other securityholders 109,276,634 1,266,729
Total of IFN stapled securities 780,577,365 1,179,000
114 INFIGEN ENERGY ANNUAL REPORT 2016

ADDITIONAL INVESTOR INFORMATION (Continued)
KEY ASX RELEASESThe key releases lodged with the Australian Securities Exchange (ASX) and released to the market throughout FY16 are listed below. Dates shown are when releases were made to the ASX.
2015
2 July Change of Director’s interest notice
3 July Infigen confirms interim Audit Committee structure
15 July Infigen announces sale of US business
28 July Completion of US solar development pipeline sale
31 July Fourth quarter FY15 production and revenue
17 August Sale of US wind business – Global Facility lender consent granted
31 August FY15 full year results
18 September Annual General Meeting date
29 September Corporate Governance Statement 2015
30 September Extended leave of absence for non‑executive director
6 October Change of substantial holding
29 October Infigen completes sale of US wind business
30 October First quarter FY16 production and revenue
13 November Annual General Meeting 2015, presentation and results
23 December Extended leave of absence for non‑executive director
31 December Change of director’s interest notice
2016
29 January Second quarter FY16 production and revenue
25 February FY16 interim results
29 February Director return from leave of absence
4 March Change of director’s interest notice
18 April Infigen appoints new independent director
29 April Change of substantial holding
29 April Third quarter FY16 production and revenue
11 May Change of substantial holding
12 May Change of substantial holding
17 May Response to media reporting
18 May Notice of ceasing to be a substantial holder from Kairos
The above list does not include all releases made to the ASX. A comprehensive list and full details of all publications can be found on the Infigen website: www.infigenenergy.com, and the ASX website: www.asx.com.au.
115

ASX Australian Securities Exchange Limited (ABN 98 008 624 691) or Australian Securities Exchange as the context requires.
CAPACITY The maximum power that a wind turbine was designed to produce.
CAPACITY FACTOR
A measure of the productivity of a wind turbine, calculated by the amount of power that a wind turbine produces over a set time period, divided by the amount of power that would have been produced if the turbine had been running at full capacity during that same time period.
CLIMATE CHANGE
According to the United Nations Framework Convention on Climate Change (UNFCCC) definition, a change of climate attributed directly or indirectly to human activity that alters the composition of the global atmosphere, and which is in addition to natural climate variability observed over comparable time periods.
CO2e Carbon dioxide equivalent. The universal unit of measurement used to indicate the global warming potential of the different greenhouse gases.
DEVELOPMENT PIPELINE
Infigen’s prospective renewable energy projects that are in various stages of development prior to commencing construction. Stages of development include: landowner negotiations; wind monitoring, project feasibility and investment evaluation; community consultation, cultural heritage, environmental assessment; design, supplier negotiations and connection.
DISTRIBUTIONS Distributions of cash or stapled securities under the DRP made by Infigen to securityholders.
DWA Dispatch weighted average (electricity prices). The average realised price from selling electricity into the wholesale market.
EBITDA Earnings before interest, taxes, depreciation and amortisation.
FINANCIAL YEAR A period of 12 months starting on 1 July and ending on 30 June in the next calendar year.
GRID The network of power lines and associated equipment required to deliver electricity from generators to consumers.
GW Gigawatt. One billion watts of electricity.
IEBL Infigen Energy (Bermuda) Limited (ARBN 116 360 715).
IEL Infigen Energy Limited (ABN 39 105 051 616).
IERL Infigen Energy RE Limited (ACN 113 813 997) (AFSL 290 710), the responsible entity of IET.
IET Infigen Energy Trust (ARSN 116 244 118).
IFN The code for the trading of listed IFN stapled securities on the ASX.
INFIGEN Infigen Energy, comprising IEL, IEBL, IET and their respective subsidiary entities from time to time.
LGC Large‑scale Generation Certificate. The certificates are created by large‑scale renewable energy generators and represent 1 MWh of renewable generation.
LLC Limited liability companies formed under US law.
LRET Large‑scale Renewable Energy Target. Legislated Australian target effective 1 January 2011 to 31 December 2030. The rate of liability for LRET established by the Renewable Power Percentage (RPP) is used to determine how many LGCs need to be surrendered each year. The RPP for the 2016 calendar year is 12.75%. It is equivalent to approximately 21.43 million LGCs and represents a proportion of total estimated Australian electricity consumption for the 2016 year.
MW Megawatt. One million watts of electricity.
OCC Operations Control Centre. A centrally located business function within Infigen that monitors and directs the operations of Infigen’s wind and solar farms.
OPERATING EBITDA
Operating EDITBA excludes corporate costs, non‑operating costs and non‑operating income.
GLOSSARY
116 INFIGEN ENERGY ANNUAL REPORT 2016

CORPORATE DIRECTORY
INFIGEN ENERGY
Level 22, 56 Pitt Street Sydney NSW 2000 Australia +61 2 8031 9900 www.infigenenergy.com
DIRECTORS
Michael Hutchinson (Non-Executive Chairman) Miles George (Managing Director) Philip Green (Non-Executive Director) Fiona Harris (Non-Executive Director) Ross Rolfe AO (Non-Executive Director) Sylvia Wiggins (Non-Executive Director)
COMPANY SECRETARY
David Richardson
ANNUAL GENERAL MEETING
Infigen Energy’s 2016 Annual General Meeting will be held on 17 November 2016 at 3.00pm at the Radisson Blu Plaza Hotel, 27 O’Connell Street, Sydney, Australia.
IFN STAPLED SECURITIES
Each stapled security in Infigen Energy, tradable on the Australian Securities Exchange under the “IFN” code, comprises:
• one share of Infigen Energy Limited, an Australian public company;
• one share of Infigen Energy (Bermuda) Limited, a company incorporated in Bermuda; and
• one unit of Infigen Energy Trust, an Australian registered managed investment scheme.
RESPONSIBLE ENTITY FOR INFIGEN ENERGY TRUST
Infigen Energy RE Limited Level 22, 56 Pitt Street Sydney NSW 2000 Australia +61 2 8031 9900
REGISTRY
Link Market Services Limited Locked Bag A14 Sydney South NSW 1235 +61 1800 226 671 (toll free within Australia) Fax: +61 2 9287 0303 [email protected] www.linkmarketservices.com.au
AUDITOR
PricewaterhouseCoopers Darling Park Tower 2 201 Sussex Street Sydney NSW 2650 Australia
DISCLAIMER
This publication is issued by Infigen Energy Limited (IEL), Infigen Energy (Bermuda) Limited (IEBL) and Infigen Energy RE Limited as responsible entity for Infigen Energy Trust (collectively Infigen). To the maximum extent permitted by law, Infigen and its respective related entities, Directors, officers and employees (collectively Infigen Entities) do not accept, and expressly disclaim, any liability whatsoever (including for negligence) for any loss howsoever arising from any use of this publication or its contents. This publication is not intended to constitute legal, tax or accounting advice or opinion. No representation, warranty or other assurance is made or given by or on behalf of the Infigen Entities that any projection, forecast, forward-looking statement or estimate contained in this publication should or will be achieved. None of the Infigen Entities or any member of the Infigen Energy Group guarantees the performance of Infigen, the repayment of capital or a particular rate of return on Infigen stapled securities.
IEL and IEBL are not licensed to provide financial product advice. This publication is for general information only and does not constitute financial product advice, including personal financial product advice, or an offer, invitation or recommendation in respect of securities, by IEL, IEBL or any other Infigen Entities. Note that, in providing this publication, the Infigen Entities have not considered the objectives, financial position or needs of the recipient. The recipient should obtain and rely on its own professional advice from its tax, legal, accounting and other professional advisers in respect of the recipient’s objectives, financial position or needs. All amounts expressed in dollars ($) in this Annual Report are Australian dollars, unless otherwise specified.

@infigen
linkedin.com/company/infigen-energy
facebook.com/infigen
www.infigenenergy.com
INF
IGE
N E
NE
RG
Y | A
NN
UA
L R
EP
OR
T 20
16