renewable energy in the countryside: rewards & risks · v the two policies that provide...
TRANSCRIPT

Renewable Energy in the Countryside: Rewards & Risks
A study for CPRE Devon
12 September 2011

Renewable Energy in the Countryside: Rewards and Risks
Renewable Energy Foundation
A study for CPRE Devon
12 September 2011

© Renewable Energy Foundation 2011
DisclaimerThe following study has been provided on request to CPRE Devon to inform that charity’s development of views on renewable energy in the countryside.
The document is provided for background information only and does not constitute investment advice. It is hoped that any reader will !nd it interesting and thought-provoking, but it is not to be regarded, or used, as a substitute for the reader’s own researches and investigations. The authors and the Renewable Energy Foundation to the full extent permissible by law disclaim all responsibility for any damages or losses (including, without limitation, !nancial loss, damages for loss in business projects, loss of pro!ts or other consequential losses) arising in contract, tort or otherwise from the use of this document and the information and analysis it contains.

Contents
Summary 5Introduction 7United Kingdom Targets for Renewable Energy 7UK Progress Towards Targets 8Renewable Energy Subsidy Costs and Costs of Meeting Targets 9
Economic Sustainability of Subsidies 10Technology Costs and Characteristics 11
Capital Costs of the Di"erent Energy Generation Technologies 13Renewables Obligation Generator Performance 15FiT Generator Performance 17
Actual Generation Data is Unavailable but has been Estimated by REF 18Feed-in Tari" Generation Levels 19FiT contribution toward targets 20
Costs of CO2 Abatement 21Distributed Generation and Local Grid Issues 21Overview and Conclusions 22Appendix 1: De!nitions of the Renewable Energy Generator Types in the
Renewables Obligation Bands 25Appendix 2: ROCs per MWh for Renewable Energy Generator Types in the
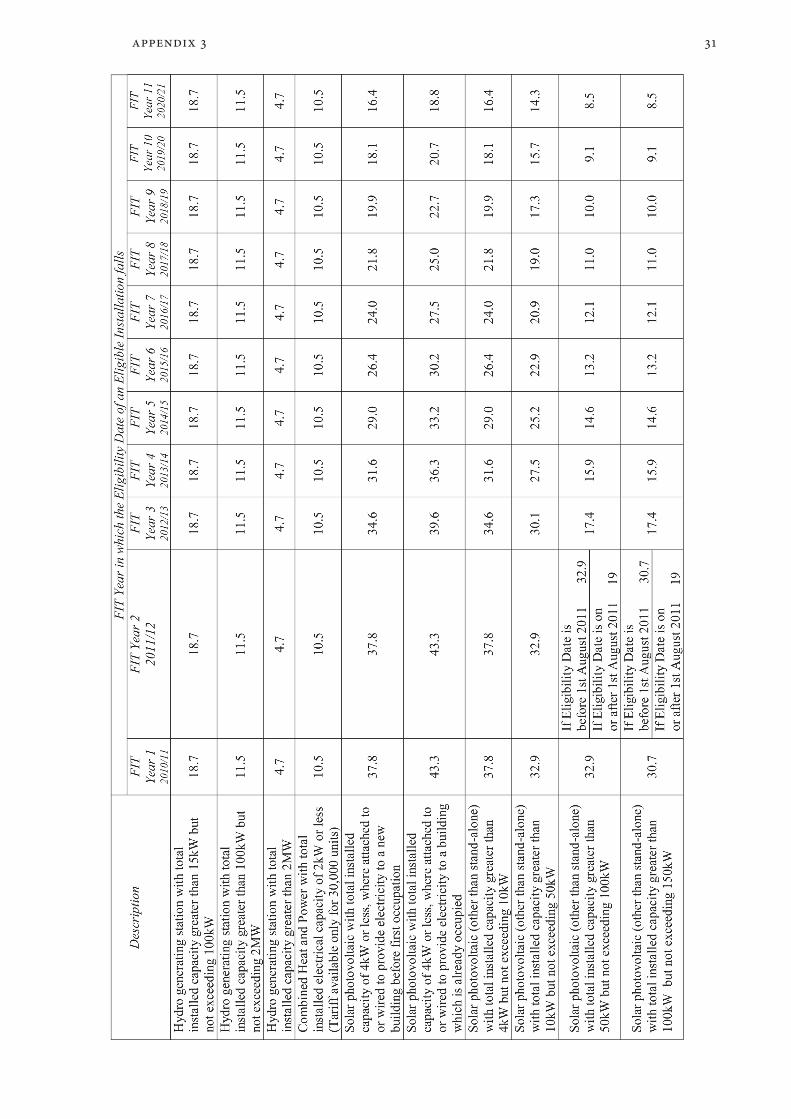
Renewables Obligation Bands 29Appendix 3: Feed-in Tari" Payment Rates 30

About the Renewable Energy Foundation
The Renewable Energy Foundation is a registered charity promoting sustainable development for the bene!t of the public by means of energy conservation and the use of renewable energy.
REF is supported by private donation and has no political a#liation or corporate membership. In pursuit of its principal goals REF highlights the need for an overall energy policy that is balanced, ecologically sensitive, and e"ective.
We aim to raise public awareness of the issues and encourage informed debate regarding a struc-tured energy policy that is both ecologically sensitive and practical. The issues of climate change and security of energy supply are complex and closely intertwined. REF contributes to the debate surrounding these issues by commissioning reports to provide an independent and authoritative source of information.
$%&%'()*% +&%,-. /& 01% 234&0,.5/6%: $%'(,65 7 $/585 9
Summary
The EU renewable energy target for 2020 requires the UK to obtain 15% of UK !nal energy consumption from renewables. This would require over 30% of UK electricity to be of renewable origin. Government appears to be committed to this ambition, but the 2010 target of 10% of UK electricity was missed by a large margin, in spite of a consumer cost of £5.6 billion, with only 6.5% being generated from renewable sources. Consequently, the feasibility and a"ordability of the 2020 target must be regarded as questionable.
The two policies that provide subsidies to renewable energy plant are the Renewables Obli-gation (RO) for large-scale and the Feed-in Tari" (FiT) for domestic-scale generators. DECC anticipates the RO subsidy burden on consumers to be approximately ten times that of the FiT: speci!cally, in 2014, the subsidies for the RO are predicted to be approximately £3.2 billion per annum and those for the FiT £350 million.
Both subsidy mechanisms provide 20 years support (25 years for solar photovoltaic). Conse-quently, there are increasing subsidy on-costs as more renewable energy generation is built. While the costs 2002 to 2010 have amounted to approximately £5.6 billion, and stand at over £1 billion a year at present, we estimate the costs to reach £6 billion per annum in 2020 for the RO, and the total cost 2002 to 2020 to be approximately £39 billion. Even if no more genera-tion is added a:er that point, the contracted payments to existing installations will amount to £60 billion in the period 2020-2030.
We note that the levelised costs of wind (onshore: £90/MWh; o"shore: £149/MWh), though high, understate their probable cost to the system, with integration costs such as grid expansion and system balancing and the cost of support plant to regulate wind intermittency adding perhaps as much as £70/MWh to such generation.
In spite of the potential subsidies available, a number of renewable energy technologies are not being developed in large numbers. Of the 26 technology types supported under the RO, only ten are present in signi!cant quantities, and of the technologies supported under the Feed-in Tari" the very large growth in solar PV is not matched by other domestic-scale technologies. We conclude that the existing policies are failing to encourage innovation in the sector.
We present, in Tables 1 and 2, the government’s most recent estimates of electricity generation costs for conventional and renewable electricity for the major technology types. It should be noted that these costs specify the carbon penalty costs imposed on the fossil fuelled generators. If these costs are subtracted the relative cheapness of conventional generation becomes apparent (CCGT: £59/MWh; Advanced Supercritical Coal: £48/MWh; Integrated Gasi!cation Combined Cycle Coal: £68/MWh; Nuclear: £74/MWh);, and serves as a useful reminder that any reduction in the UK’s commitment to the low carbon agenda would make subsidised renewable energy generators highly unattractive.
The average annual load factors per renewable energy technology type and the spread of these values are given in Tables 3 and 4. The range for most technologies is large, con!rming the view that quality of installation is crucial. Some of the under-developed technologies, including small-scale biomass with and without combined heat and power (CHP), small scale hydro, and anaerobic digestion (AD), are capable, if designed and managed rigorously, of respectable
1 To indicate the scale of these !gures, the UK average domestic rate for electricity in June 2011 was £132 per MWh or 13.2p per kWh. See comparative electricity prices on Europe’s Energy Portal at http://www.energy.eu/#Domestic-Elec

< $%&%'()*% +&%,-. /& 01% 234&0,.5/6%: $%'(,65 7 $/585
outputs. For wind, site-speci!c factors clearly result in substantial di"erences in performance, and generic assumptions would not be used as the basis for an investment decision.
The subsidy costs of abating CO2 via the di"erent renewable mechanisms are listed in Table 5 and vary from £46 a tonne (co!ring of biomass) to £800 per tonne (small scale solar PV) depending on the renewable energy technology. These are very high abatement costs, and would be further increased by integration costs. In view of this, renewables appear to be unattractive as an emissions reduction mechanisms, relative to unsubsidized lower or low carbon alterna-tives (for example, gas and nuclear), and are particularly vulnerable to any reduction in the low carbon agenda.
While the EU targets and existing UK policies o"er opportunities to landowners, these are not without dangers. The renewables support mechanisms imply very high consumer costs, and must be regarded as having signi!cant political risks increasing the likelihood of policy change, resulting in stranded and distressed assets. However, modest adoption of smaller-scale renew-ables using despatchable and dense energy sources (biomass for heat, biomass for electricity, hydro, anaerobic digestion) are likely to be best able to weather the economic downturn, and are less likely to be the target of cost-cutting exercises seeking to reduce the macro-economic burden of the subsidies.

=&0,364>0/3& ?
IntroductionThere is currently a very substantial drive to develop renewable energy projects in the UK. This demand and the subsidies available are very persuasive factors for landowners seeking new sources of revenue from their land. While consideration obviously needs to be given to the technical risks and environmental impacts associated with particular renewable technology options, the political risk associated with the UK and EU energy policies is also relevant, though harder to pin down.
This report considers renewable energy in the context of these policies and the UK targets. The following section describes the targets and reviews progress towards them. We then discuss overall costs to the consumer of the current renewables policies and, with this background information in place, address the following speci!c questions: 1. How do the costs, including subsidies, of electricity compare for the di"erent generator types,
both conventional and renewable? 2. How well do the di"erent renewable energy generators perform? 3. What are the costs of abating CO2 emissions using the di"erent energy technologies? 4. Are there risks associated with local grid connections?
United Kingdom Targets for Renewable EnergyThe United Kingdom is required by the European Union’s Renewable Energy Directive to produce 15% of its Final Energy Consumption (that is, energy used at the point of consumption, for example in a light, or as delivered into a fuel tank) from renewable sources in 2020. UK Final Energy Consumption is currently approximately 1,745 TWh per year. The government optimistically expects this to fall by 2020, in spite of a predicted increase in population and a return to economic growth. Accepting this !gure, however, it follows that increasing the renewable fraction of electricity, heating, and transport must deliver approximately 260 TWhs, which government estimates will result in a requirement for 120 TWhs from the electricity sector. This is a very ambitious target. For scale it should be appreci-ated that UK total electricity generation is at present 390 TWhs.
The UK’s small landmass limits the use of cheap biomass for heating, and the government expects much of the burden of the Renewable Energy target to fall on the electricity supply industry. The following chart, calculated by REF from DECC’s National Renewable Energy Action Plan (2010), reveals the scales of growth required for energy as a whole and its constituent sectors in order to meet the EU 2020 target.
2.5%6.0% 3.0%
12.5%
24.0%
11.0% 7.0%
1.0%0%
10%
20%
30%
40%
Energy Electricity Heat Transport
20202010
Figure 1: Required percentage increases in UK renewable energy to meet EU 2020 targets. The yellow rectangles represent the quantity achieved in 2010, and the blue the additional energy required in 2020 to
meet the targets. Source: DECC, National Renewable Energy Action Plan (2010), REF calculations.

@ $%&%'()*% +&%,-. /& 01% 234&0,.5/6%: $%'(,65 7 $/585
The feasibility of these targets can be assessed by examining the UK’s progress to the now superseded 2010 target for 10% of electricity.
Electricity Generated towards the 2010 TargetThe United Kingdom failed to meet the 2010 target of generating 10% of electricity from renewable sources set by the 2001 EU Renewables Directive. In point of fact, renewables accounted for only approximately 6.5% of all electricity demand in 2010.A
Renewables were responsible for approximately 25 TWh compared with the 10% target of 38 TWh.B The contributions of the various technologies can be seen in the following !gure:
Renewable Generation Technology Share of 2010 Target
Offshore Wind8%
Missed share of 2010 target35%
Hydro9%
Landfill Gas13%
Waste4%
AD0.2%
Sewage Gas2%
Co-firing6%
Dedicated Biomass5%
Onshore Wind18%
Figure 2: Electricity generated towards the 2010 target is shown broken down by the actual contribution from each technology, with the shortfall indicated by the white sector.
Source: REF calculations from Ofgem and DECC data.
The scale of the shortfall for the 2010 target, in spite of the very high subsidy levels discussed below, suggests that the target was unreachable from the outset.
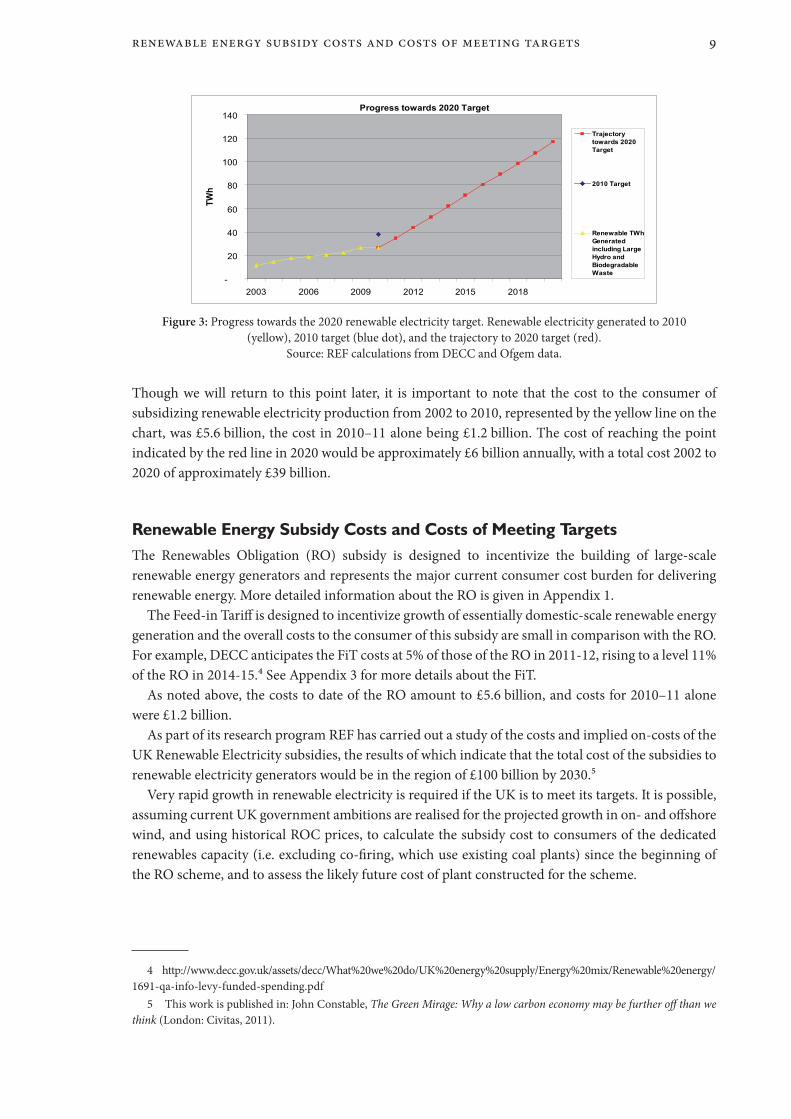
Furthermore, the 2010 target shortfall strengthens arguments that the approximately 30% target for renewable electricity implicit in the UK’s compliance with the 2020 EU Renewable Energy Directive is also infeasible, as can be inferred from the following chart. This plots renewable electricity produc-tion from 2002 to 2010 (yellow line), shows the 2010 target level (blue dot), and indicates the trajec-tory necessary to reach the target levels believed by the UK government to obtain in 2020 in order to contribute to the 2020 target of 15% of renewables in Final Energy Consumption.
2 Source: http://www.decc.gov.uk/en/content/cms/statistics/publications/trends/trends.aspx. Also, REF publishes detailed monthly load factors for all generators subsidized under this scheme. This data is freely available from the REF website: www.ref.org.uk.
3 Energy Trends March 2011 www.decc.gov.uk.
$%&%'()*% +&%,-. C4)5/6. 23505 (&6 23505 3D E%%0/&- F(,-%05 G
Progress towards 2020 Target
-
20
40
60
80
100
120
140
2003 2006 2009 2012 2015 2018
TWh
Trajectorytowards 2020Target
2010 Target
Renewable TWhGeneratedincluding LargeHydro andBiodegradableWaste
Figure 3: Progress towards the 2020 renewable electricity target. Renewable electricity generated to 2010 (yellow), 2010 target (blue dot), and the trajectory to 2020 target (red).
Source: REF calculations from DECC and Ofgem data.
Though we will return to this point later, it is important to note that the cost to the consumer of subsidizing renewable electricity production from 2002 to 2010, represented by the yellow line on the chart, was £5.6 billion, the cost in 2010–11 alone being £1.2 billion. The cost of reaching the point indicated by the red line in 2020 would be approximately £6 billion annually, with a total cost 2002 to 2020 of approximately £39 billion.
Renewable Energy Subsidy Costs and Costs of Meeting TargetsThe Renewables Obligation (RO) subsidy is designed to incentivize the building of large-scale renewable energy generators and represents the major current consumer cost burden for delivering renewable energy. More detailed information about the RO is given in Appendix 1.
The Feed-in Tari" is designed to incentivize growth of essentially domestic-scale renewable energy generation and the overall costs to the consumer of this subsidy are small in comparison with the RO. For example, DECC anticipates the FiT costs at 5% of those of the RO in 2011-12, rising to a level 11% of the RO in 2014-15.H See Appendix 3 for more details about the FiT.
As noted above, the costs to date of the RO amount to £5.6 billion, and costs for 2010–11 alone were £1.2 billion.
As part of its research program REF has carried out a study of the costs and implied on-costs of the UK Renewable Electricity subsidies, the results of which indicate that the total cost of the subsidies to renewable electricity generators would be in the region of £100 billion by 2030.I
Very rapid growth in renewable electricity is required if the UK is to meet its targets. It is possible, assuming current UK government ambitions are realised for the projected growth in on- and o"shore wind, and using historical ROC prices, to calculate the subsidy cost to consumers of the dedicated renewables capacity (i.e. excluding co-!ring, which use existing coal plants) since the beginning of the RO scheme, and to assess the likely future cost of plant constructed for the scheme.
4 http://www.decc.gov.uk/assets/decc/What%20we%20do/UK%20energy%20supply/Energy%20mix/Renewable%20energy/ 1691-qa-info-levy-funded-spending.pdf
5 This work is published in: John Constable, The Green Mirage: Why a low carbon economy may be further o! than we think (London: Civitas, 2011).

JK $%&%'()*% +&%,-. /& 01% 234&0,.5/6%: $%'(,65 7 $/585
These are shown in the following chart:
Figure 4: Cost and projected cost of the Renewables Obligation to UK consumers. Source: REF calculations from empirical Ofgem data. Projected costs assume a ROC price of £50.
The empirical portion of the chart shows that the cost to date, from 2002 to 2010, amounts to approxi-mately £5 billion. The annual costs follow an upwards trend towards £6 billion a year in 2020, with the total cost 2011 to 2020 being approximately £39 billion.
These !gures are consistent with estimates given by the Department of Energy and Climate Change in their response to the Treasury’s recent Control Framework for DECC Levy-funded Spending.L Even if we assume that a:er 2020 no further e"orts are made to expand capacity, but that, as is reasonable and expected by the industry, subsidies are maintained for capacity already installed under the RO, the annual cost is around £6 billion a year, and consequently a further £60 billion cost is incurred over that decade. Thus the total cost of the scheme from 2002 to 2030 would amount to approximately £100 billion.
While these are estimates, they are grounded in reasonable assumptions and on the government’s own projections. Since, for the purposes of this estimate, we make the assumption that renewables capacity will cease to grow in 2020, and that no further attempt will be made to attain higher renewa-bles targets, the cost !gure of £100 billion to 2030 can be regarded as conservative.
Furthermore, we note that our annual cost !gure of £6 billion a year post 2020 is consistent with the estimates of the government’s own independent advisor, the Committee on Climate Change. Their estimates imply an additional cost of approximately £6.5 billion a year, with the range being £3.6 billion to £7.2 billion.M
Economic Sustainability of SubsidiesWhen answering questions in the House of Commons on the Fourth Carbon Budget on 17.05.11 the Secretary of State for Energy and Climate Change, Mr Huhne, made repeated references to the importance of ensuring that the environmental policies returned ‘value for money’, presumably to
6 HMT, Control Framework for DECC Levy-funded Spending (2011). See http://www.hm-treasury.gov.uk/psr_controlf-ramework_decc.htm.
7 http://www.ref.org.uk/publications/238-the-probable-cost-of-uk-renewable-electricity-subsidies-2002-2030
F%>1&3*3-. 23505 (&6 21(,(>0%,/50/>5 JJ
the subsidizing consumer, or, in the case of the Renewable Heat Incentive, the taxpayer. This is a new emphasis, and is consistent with increasing signs that the Treasury is taking a !rm grasp of the burdens imposed by instruments such as the Renewables Obligation and the Feed-in Tari", speci!-cally with the Control Framework for DECC Levy-funded Spending (March 2011).N
HMT’s interest in this matter is understandable, since premiums of this level on primary inputs to industry are incompatible with any strategy for growth that government might entertain. Fossil fuel prices would have to rise to extremely high levels to make the cost levels entertained comparatively attractive, which is unlikely, and suggestions that the EU 2020 target will bu"er the UK against rising fossil fuel prices are implausible in any case since even if the required 15% of Final Energy Consump-tion is provided, the remaining 85% must still be secured, largely from fossil sources. It is therefore more likely that the UK would face both the very high renewables premiums, including system inef-!ciency, and rising fossil fuel prices. In such circumstances it is probable that there will be increasing political emphasis on cutting avoidable cost, and renewables subsidies will be a prime target, !rstly because they can be reduced at the stroke of a pen, and secondly because in the context of rising fossil prices a plausible political case can be made for requiring the sector to compete without public support.
Technology Costs and CharacteristicsThe Government introduced banding to the RO in 2009, thus providing di"ering reward levels for the various technologies. Co-!ring now receives 0.5 of a Renewables Obligation Certi!cate (ROC) per MWh generated or approximately £25 per MWh in subsidy, given current ROC prices. At the other end of the scale, anaerobic digestion and new o"shore wind farms are subsidized more generously and receive 2 ROCs or a subsidy of approximately £100 per MWh.
The following graph shows along the horizontal axis the renewable electricity generated in 2010 by each technology starting from the technologies with the least subsidy and progressing to those enjoying the highest subsidy level. The cost per MWh of the electricity generated is indicated on the vertical axis, and for the purposes of this chart the value of one ROC is assumed to be £50.O
Co-!ring of biomass in coal power stations produced approximately 2,000 GWhs at a subsidy cost to the consumer of about £25 per MWh. It should be noted that the proportion of co-!red renewable energy used to meet a supplier’s obligation is capped at 12.5% (10% for 2009/2010). Following the introduction of banding, which reduced the support for co-!ring, only one supplier made maximum use of the allowable limit, signalling a marked reduction in interest in co-!ring from the generators who previously made full use of the co-!ring allowance.;P This might suggest that co-!ring, which is a comparatively economical contributor to the renewable energy target, is currently under-incentivized.
‘Large’ hydro denotes those hydro plants built before 2002 and in excess of 20 MW installed capacity that do not receive subsidy under the RO. Similarly, a fraction of incinerated municipal waste is deemed to be biodegradeable, and thus counts toward the renewable energy target. This also does not receive a subsidy.
8 See: http://hm-treasury.gov.uk/d/control_framework_decc250311.pdf. For DECC’s comments see: http://www.decc.gov.uk/assets/decc/What%20we%20do/UK%20energy%20supply/Energy%20mix/Renewable%20energy/1691-qa-info-levy-funded-spending.pdf.
9 For ROC prices achieved at auction see: http://www.e-roc.co.uk/trackrecord.htm.10 Ofgem, Renewables Obligation: Annual Report 2009-2010 (2011).

JQ $%&%'()*% +&%,-. /& 01% 234&0,.5/6%: $%'(,65 7 $/585
O"shore wind farms receive 1, 1.5 or 2 ROCs per MWh depending on when they were built, with the newest being in the highest band. As more o"shore wind comes online, the subsidy cost will rise above the 2010 average o"shore level of £73 per MWh.
RO Subsidy Cost per MWh generated in 2010 per Renewable Technology Output
-
20
40
60
80
100
120
- 5,000 10,000 15,000 20,000 25,000 30,000Renewable Energy GWh
Subs
idy
Cost
£/M
Wh
Sewage Gas
Onshore Wind Hydro
Offshore Wind
Dedicated Biomass
Anaerobic Digestion
Landfill Gas
Co-firing
Lg HydroWaste
Figure 5: 2010 Renewables Obligation subsidy cost and energy output by technology. Source: REF calculations from Ofgem data.
While it is clear that banding of the Obligation has succeeded in producing a more diversi!ed portfolio of technologies, which is desirable from the point of technological experimentation, it is questionable whether this aim should be combined with the meeting of targets for renewable energy generation. A diversi!ed experimental portfolio which is also expanded to meet arbitrary energy targets inevitably results in much higher costs to the consumer than the least cost portfolio.
From Figure 5 we can see that a least cost portfolio might consist of signi!cantly increasing the contribution from unsubsidized energy from biodegradeable waste, and from low-cost co-!red biomass, for example, which would also result in useful savings in systems integration and grid expansion costs.
It is also interesting to note that the portfolio of RO technologies is not as diversi!ed as policy would suggest is desired. The following graph shows the number of RO installations for each of the technologies that are supported. Of the 26 technologies listed, only 10 could be considered signi!-cantly represented in the whole renewables portfolio.

F%>1&3*3-. 23505 (&6 21(,(>0%,/50/>5 JR
00
000
0000
011
122
21016
17182129
131
403
316218
Advanced Pyrolysis
Co-firing of Biomass with CHP
Co-firing of Energy Crops with CHP
Energy from Waste with CHP
Geopressure
Geothermal
Standard Gasification
Standard Pyrolysis
Tidal Barrage
Tidal Lagoon
Co-firing of Energy Crops
Dedicated Energy Crops with CHP
Wave
Advanced Gasification
Dedicated Energy Crops
Tidal Stream
Co-firing of Biomass
Solar Photovoltaic
Offshore Wind
Dedicated Biomass with CHP
Anaerobic Digestion
Dedicated Biomass
Sewage Gas
Hydro
Onshore Wind
Landfill Gas
Figure 6: Number of projects for each of the renewable energy technologies. Source: REF calculations from Ofgem data.
Capital Costs of the Different Energy Generation TechnologiesRenewable energy generation technologies are generally more capital intensive than other technolo-gies, costing more per MW of capacity installed. Thus, in spite of low running costs, principally because there is no fuel cost to pay, the cost per MWh at the power station boundary (the so-called ‘levelised cost’) is as a rule still higher than conventional plant.
The government’s most recent assessment of the capital costs of conventional generation was published in August 2011, and was conducted by PB Power.;; We provide details of these costs for a selected number of technologies in Table 1. Government’s most recent estimates for the costs of renewables are found in a study by Arup published in June 2011.;A Table 2 selects the principal tech-nologies of interest to the current study from Appendix D of that study:
11 PB Power, Electricity Generation Cost Model: 2011 Update, Revision 1. http://www.decc.gov.uk/assets/decc/11/meeting-energy-demand/nuclear/2153-electricity-generation-cost-model-2011.pdf.
12 Arup, Review of the Generation Costs and deployment potential of renewable electricity technologies in the UK (DECC: June 2011), pp286–287.

JS $%&%'()*% +&%,-. /& 01% 234&0,.5/6%: $%'(,65 7 $/585
Table 1: PB Power estimate of generation costs.
Table assumes 10% discount rate. 2011 Project start, mixture of First of a Kind (FOAK) and Nth of a Kind (NOAK)
Levelised costs £/MWh
Gas CCGT
Gas CCGT with
CCS (FOAK)
Coal ASC NOAK
Coal ASC with CCS (FOAK)
Coal IGCC (FOAK)
Coal IGCC with CCS (FOAK)
Nuclear (FOAK)
Capital Costs 9.0 35.0 22.2 59.6 39.0 85.0 55.5Fixed operating costs 2.9 5.5 5.1 9.6 7.2 11.0 11.0Variable operating costs
0.1 0.6 1.0 2.5 1.0 2.9 0.6
Carbon costs 18.1 2.4 47.8 5.7 58.5 5.6 -Fuel costs 46.5 57.5 19.3 23.1 20.5 22.5 5.0Decommissioning and waste fund
- - - - - - 2.0
CO2 transport and storage
- 3.8 - 7.8 - 7.8 -
Total 76.6 104.8 95.4 108.3 126.2 134.8 74.1Total minus carbon costs
58.5 102.4 47.6 102.6 67.7 129.2 74.1
Data Source: PB Power, Electricity Generation Cost Model: 2011 Update, Revision 1 (DECC: August, 2011), 16. CCGT = Combined Cycle Gas Turbine; CCS = Carbon Capture and Storage;
ASC = Advanced Super-Critical; IGCC = Integrated Gasi!cation Combined Cycle.
Table 2: Arup estimates of selected renewable electricity costs.
Table assumes 10% discount rate. 2011 Project start, mixture of First of a Kind (FOAK) and Nth of a Kind (NOAK).
Levelised costs £/MWh
Dedicated Biomass
5–50 MW
O!shore Wind
Round 3
Onshore wind
> 5 MW
Onshore wind
< 5 MW
Solar > 50 kW
Bioliquids/Biodiesel
Co-"ring (Conven-
tional)
Hydro (0–5 MW)
AD 5 MW
Capital costs 55 99 71 85 292 25 5 116 65Fixed operating costs 18 50 17 16 22 20 4 8 47Variable operating costs
5 - 3 4 - 5 1 7 20
Carbon costs - - - - - - - - -Fuel costs 50 - - - - 256 64 - -Decommissioning and waste fund
- - - - - - - - -
CO2 transport and storage
- - - - - - - - -
Total 128 149 90 105 314 306 75 131 105
Data Source: Arup, Review of the Generation Costs and deployment potential of renewable electricity technologies in the UK (DECC: June 2011). p286-287
Studying the costs of conventional generators in Table 1, it is particularly important to note that the supposed carbon costs are a very large proportion of the total cost per MWh of both coal and gas generation. Should UK commitment to the low carbon agenda wane, as is entirely conceivable in the
$%&%'()*%5 T)*/-(0/3& U%&%,(03, V%,D3,W(&>% J9
current global economic distress, then these costs would become irrelevant, and the fundamental economic attractiveness of an electricity supply industry composed of a spread portfolio of CCGT, ASC Coal, and nuclear would become apparent.
The most striking result here is the very low cost of Advanced Super-Critical Coal in the absence of the carbon cost penalty suggesting that it would be the surprise winner from any relaxation of carbon emissions standards.
Comparison of Table 1 for conventional generators with Table 2 for renewables shows that even with carbon costs taken into account, the levelised costs of CCGT and ASC Coal and Nuclear are competitive with all renewables, with the exception of conventional co-!ring, which is a very cheap means of generating green electricity.
Furthermore, there are known weaknesses in the levelised cost method when comparing fully controllable conventional generators with randomly intermittent generators such as wind power. Namely, uncontrollable generation imposes system management costs, including grid expansion, system balancing, and residual system ine#ciencies, that are not captured by the levelised cost methodology.
We have taken advice on this point from an advisor to REF who referred us to work in progress of his that suggests that the integration costs described above could increase the cost per MWh of onshore wind from ca. £100 to ca. £170, with a similar increase for o"shore wind. It is our view that these calculations are broadly correct, and that the integration costs of uncontrollable renewables have been greatly underestimated by government. When they are taken into account the relative cheapness of nuclear generation, CCGT with or without CCS, and ACS coal, with or without CCS, becomes considerable.
Thus the political risks for investments in large-scale renewables in a period of prolonged economic downturn are signi!cant.
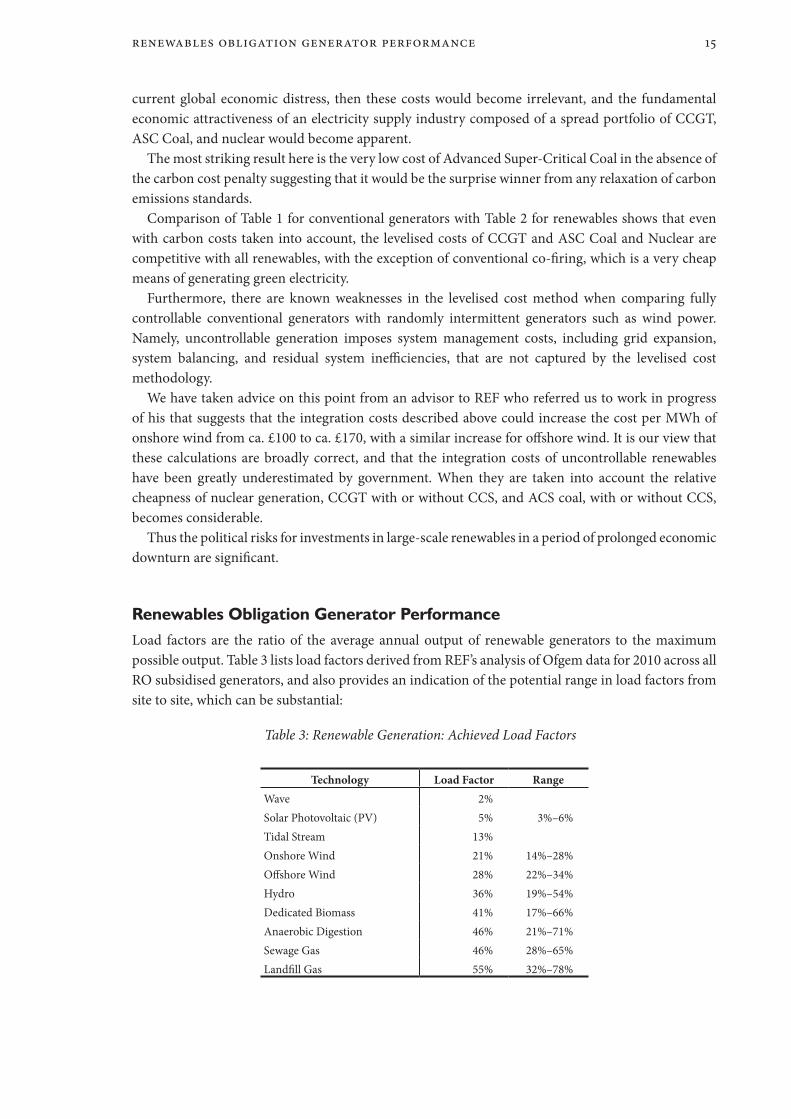
Renewables Obligation Generator PerformanceLoad factors are the ratio of the average annual output of renewable generators to the maximum possible output. Table 3 lists load factors derived from REF’s analysis of Ofgem data for 2010 across all RO subsidised generators, and also provides an indication of the potential range in load factors from site to site, which can be substantial:
Table 3: Renewable Generation: Achieved Load Factors
Technology Load Factor RangeWave 2%Solar Photovoltaic (PV) 5% 3%–6%Tidal Stream 13%Onshore Wind 21% 14%–28%O"shore Wind 28% 22%–34%Hydro 36% 19%–54%Dedicated Biomass 41% 17%–66%Anaerobic Digestion 46% 21%–71%Sewage Gas 46% 28%–65%Land!ll Gas 55% 32%–78%

J< $%&%'()*% +&%,-. /& 01% 234&0,.5/6%: $%'(,65 7 $/585
While indicatively useful, we advise caution concerning these averages when considering investing in any renewable technology for a particular site, since a much more accurate estimate of potential load factor can be determined by checking the on-line REF database of existing RO generators for genera-tors of similar size and type and close to the proposed site.;B An appropriate comparator will give a better idea of output that the annual averages above.
The load factor data is indicative only with many factors inXuencing speci!c !gures. For example, the reduced average wind speeds across the UK in 2010 reduced wind farm output signi!cantly. The following chart shows that the UK average onshore wind farm load factor dropped to 21% in 2010, as against approximately 27% in 2009. However, the o"shore Xeet was not as signi!cantly a"ected, and had an average load factor of 29%.
UK Onshore and Offshore Load Factors by Year
20%
22%
24%
26%
28%
30%
32%
34%
2003 2004 2005 2006 2007 2008 2009 2010Year
Load
Fac
tor
OnshoreOffshore
Figure 7: UK onshore and o"shore load factors by year. Source: REF calculations from Ofgem data.
Year on year variations of the scale observed for onshore wind have real signi!cance for project economics, particularly Internal Rate of Return (IRR), and may have a bearing on future cost of capital.
Note also the following !gure, which compares the 2009 and 2010 wind farm load factors for o"shore and the di"erent countries in the United Kingdom which shows that geographical and annual variation can be substantial.
Load Factor 2009 and 2010
18%
20%
22%
24%
26%
28%
30%
32%
Offshore England N. Ireland Scotland Wales
LF 2009
2010
Figure 8: O"shore and onshore wind load factors in 2009 and 2010 compared.
The impact of low winds in 2010 is signi!cant for Scotland, and particularly so for Wales, which has previously been considered a high wind region. Lower winds in 2010 clearly had a less signi!cant
13 See REF Large Scale Green Generator data at http://www.ref.org.uk/energy-data.
Y/F U%&%,(03, V%,D3,W(&>% J?
impact on the o"shore Xeet, suggesting that the marine wind regime may be more stable at an annual level, an important consideration for investors and government energy planners alike.
Reduced average annual wind speeds also reduce the load factors for hydro stations since less wind results in lower rainfall and reduced water Xow in streams and rivers. Run of river hydro schemes that do not have storage reservoirs only generate when river levels are su#ciently high, and thus there are marked seasonal variations in load factor for these plants.
The range in load factors for land!ll gas sites reXects the fact that these sites are being gradually worked out as the gas within individual sites is depleted.
Anaerobic digestion (AD) producing methane for electricity generation can deliver excellent load factors if all the technical di#culties are anticipated from the outset and the plant and feedstock supply is very carefully managed. However, technical problems with AD can lead to complete failure requiring the digester to be cleaned out and started afresh which can erode performance for some months. Nonetheless, when correctly operated AD does not have the intermittency problems of wind, nor its seasonal variations, and thus has particular potential.
The low average load factor for dedicated biomass generators in the table above disguises the fact that the best performers do well and consistently well. Again, feedstock supply needs to be carefully managed to get the most out of the technology. Biomass generators can be managed to deliver elec-tricity on demand and consequently, will be appealing for grid management reasons.
If suitable demand for steam and/or hot water in the vicinity can be identi!ed, then combined heat and power (CHP) biomass plants can receive an extra 0.5 ROC taking the subsidy up to £100 per MWh.
FiT Generator PerformanceThe Feed-in Tari" (FiT) scheme, designed by the Government to incentivize small-scale renewable electricity generation, commenced on 01.04.10. Generators of less than 5 MW installed capacity are eligible, and the following technologies are supported: anaerobic digestion, small hydro, small combined heat and power generators, solar photovoltaic and small wind turbines. There are 24 tari" bands ranging from 9.4p/kWh to 43.3p/kWh, with an extra potential of 3.1p/kWh being negoti-able for the fraction of generated electricity exported to the grid. Appendix 3 lists the FiT tari" rates e"ective from 1 August 2011.
Following a Freedom of Information (FoI) request by REF in December 2010, Ofgem agreed to publish, on a quarterly basis, data on registered FiT installations and levelisation payments. The precise location of the individual FiT installations is withheld, to protect personal privacy, but the le:-most part of the postcode of each installation has been released, so that it is possible to gain some insight into the geographic distribution of registered generators.
Unfortunately, Ofgem does not collect data on the quantities of energy actually generated by each installation over a period, so precise calculations of FiT generator performance are not possible. Instead we have had to estimate the performance !gures we cite below.
REF has criticized the fact that actual electricity generation !gures for individual FiT installa-tions are not publically available. We believe this frustrates reasonable attempts by government or the public to assess value for money from the Feed-in Tari" scheme and e#cacy in meeting climate change targets.;H
14 http://www.ref.org.uk/press-releases/216-missing-!t-data-makes-value-checking-impossible

J@ $%&%'()*% +&%,-. /& 01% 234&0,.5/6%: $%'(,65 7 $/585
Estimating Feed-in Tariff Generator OutputHistoric electricity generation data does exist for some of those FiT subsidised generators originally registered under the Renewables Obligation. However, this data is not available for many of the smallest generators, since their output was managed by agents, who aggregated the total output from their portfolio of clients and made only a single annual claim for Renewables Obligation Certi!cates.
Another source of data available from Ofgem is Renewable Energy Guarantee of Origin (REGO) information. REGOs are also certi!cates issued for renewable electricity generated, and are used to comply with an EU requirement and facilitate the mandatory reporting of Fuel Mix by electricity suppliers. Ofgem manages the issuing and register of the REGO certi!cates in the same way as it does the Renewable Obligation Certi!cates. Until 05.12.10, one REGO was issued for every kilowatt hour (kWh) of renewable energy generated, but since that date, the regulations have changed so that one REGO is issued per megawatt hour (MWh).
There is much more REGO-based data for the small generators than ROC data, and the period when one REGO was equal to 1 kWh is at a usefully !ne level of granularity to enable reasonable accuracy in determining annual load factors. We have used the REGO data to determine average annual load factors for the small generators, as listed in the table below. The load factors are given for each of the FiT subsidy bands, and we have only included generators where a complete year’s genera-tion data is available. The Ofgem accounting year, which runs from April to March, is used in this analysis, so that the latest available data is the year ending March 2010.
Table 4: Average Annual Load Factors derived from REGO data for Small Renewable Generators in FiT tari! bands.
Hydro
Band Average Annual Load Factor Standard Deviation0–15 kW 36% 21%15–100 kW 53% 18%100–2,000 kW 40% 18%
PV
Band Average Annual Load Factor Standard Deviation0–4 kW 10% 3%4–10 kW 9% 2%10–100 kW 7% 3%100–5,000 kW 6%
Wind
Band Average Annual Load Factor Standard Deviation0–1.5 kW;I 13%1.5–15 kW 13% 9%15–100 kW 13% 11%100–500 kW 18% 7%500–1500 kW 26% 8%
15 There is insu#cient coverage of data for the band 0–1.5kW, so we have arbitrarily used the load factor for the next band up in size.
Y/F U%&%,(03, V%,D3,W(&>% JG
There is, as yet, only a limited amount of data available for small anaerobic digestion plants. We estimate that a load factor of 50% is a reasonable assumption for such plants.
It is important to note that the load factors for small hydro vary over a wide range, and it is clear that further work could usefully be done on revealing the underlying causes of this matter. It is also interesting to note that larger solar installations seem to have lower load factors than small installa-tions, a counterintuitive !nding. One possible explanation is that this is a statistical anomaly arising from the fact that there are relatively few of these sites, which just happen to be poor, but an examina-tion of aerial photographs shows that these sites include some with roof-mounted solar panels that are o:en installed in ways that fail to maximize orientation to the south. It is possible that early installers did not appreciate the importance of achieving optimal orientation to maximize returns.
The inverter in the solar PV installation (which is necessary to convert the DC current from the solar panels into mains-useable AC) may also reduce the load factors apparently achieved if its capacity does not match the number of solar panels. For example, the output of a solar array of, say, 2.7 kW may have its output capped by an inverter with a limit of 2.3 kW.
Load factors for solar PV and small-scale wind are both low, the latter much lower than those for large-scale wind power (which is unsurprising given the tower height of 2 MW wind turbines).
Feed-in Tariff Generation LevelsThe quantities of energy generated by FiT eligible generators are small at present, and likely to remain so; they have little or no relevance to progress towards the EU targets. Paradoxically, this makes them more likely to remain in place under distressed policy correction than other projects, since the consumer cost, while high per kWh generated, will not be politically visible.
Using the load factors we have derived from the REGO data, and the installed capacities published in the FiT register, it is possible to make a reasoned estimate of the quantities of renewable electricity generated, and this is illustrated in the following !gure. Readers should note that the chart is based on average annual load factors, so seasonal variations have been smoothed out. This is a limitation of the data available to us.
Also shown is the increase in installed capacity of FiT generators over the same period. It can be seen from the second graph that growth in the installation of PV dwarfs growth in the other technologies.
However, the comparatively low average annual load factor of PV results in a rather less impressive performance in terms of electricity generated, as one can see from Figure 9. Furthermore, the higher average annual load factor of small hydro results in an energy contribution disproportionate to its installed capacity.
Encouraging further growth in small hydro would seem to be a sensible strategy for government and landowners with useful watercourses who could develop small hydro should be alert to its potential.
In spite of dramatic growth in solar PV the total energy generated amounts to little more than 8.5 GWhs, which is 0.002% of the UK’s electrical needs.;L
16 See Electricity Supply and Consumption data at the following website. 2010 Total Electricity Demand is given as 384,003 GWh. http://www.decc.gov.uk/en/content/cms/statistics/energy_stats/source/electricity/electricity.aspx

QK $%&%'()*% +&%,-. /& 01% 234&0,.5/6%: $%'(,65 7 $/585
-
1,000
2,000
3,000
4,0005,000
6,000
7,000
8,000
9,000
Mar-10 May-10 Jul-10 Sep-10 Nov-10 Jan-11 Mar-11 May-11
MW
h
HydroPVWindADCHP
Figure 9: Estimated energy generation from feed-in tari" registered generators, March 2010 to June 2011. Note that the output is estimated on the basis of annualized load factors (the only data available), so that
seasonal variations have been smoothed out.
0
20
40
60
80
100
120
140
Mar-10 May-10 Jul-10 Sep-10 Nov-10 Jan-11 Mar-11 May-11
Inst
alle
d C
apac
ity (M
W)
HydroPVWindADCHP
Figure 10: Growth in Installed Capacity of FiT generators. Source: REF calculations from Ofgem data.
FiT contribution toward targetsThe overall contribution of the current FiT generators towards the renewable targets is modest. By our estimates, all of the FiT generators installed at 30 June 2011 would generate approximately 210 GWh per annum. This represents 0.6% of the 38 TWh required to meet the target of 10% electricity from renewables in 2010.;M
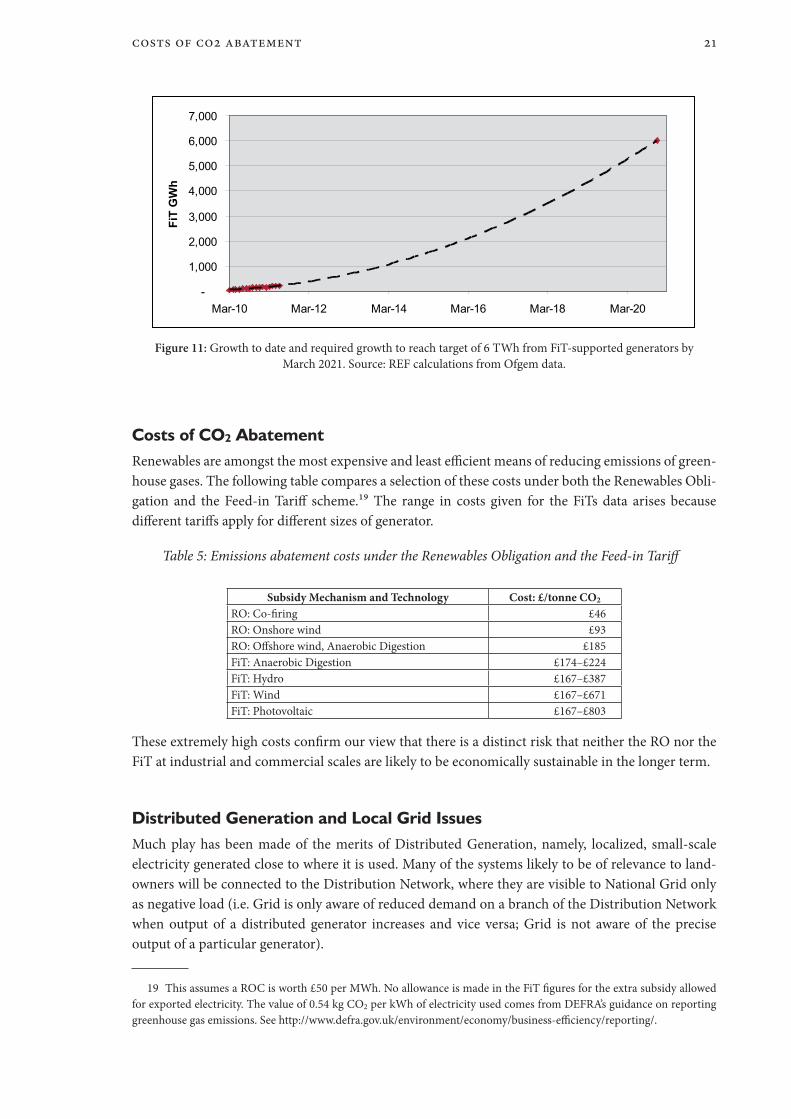
However, the Government aspiration is relatively modest for FiT-supported schemes with a projec-tion that they will deliver 6 TWh of renewable electricity in 2020.;N Nonetheless, the following graph shows how steep the growth rate will need to be to achieve this goal.
17 See http://www.ref.org.uk/publications/229-renewables-output-in-2010.18 See DECC, Impact Assessment of Feed-in Tari"s for Small-Scale, Low Carbon, Electricity Generation (01.02.10)
(URN10D/536), available from: http://www.decc.gov.uk/assets/decc/Consultations/Renewable%20Electricity%20Financial %20Incentives/1_20100204103559_e_@@_FITsImpactAssessmentaccompanyingGovernmentResponse.pdf.
23505 3D 2TQ Z)(0%W%&0 QJ
-
1,000
2,000
3,000
4,000
5,000
6,000
7,000
Mar-10 Mar-12 Mar-14 Mar-16 Mar-18 Mar-20
FiT
GW
h
Figure 11: Growth to date and required growth to reach target of 6 TWh from FiT-supported generators by March 2021. Source: REF calculations from Ofgem data.
Costs of CO2 AbatementRenewables are amongst the most expensive and least e#cient means of reducing emissions of green-house gases. The following table compares a selection of these costs under both the Renewables Obli-gation and the Feed-in Tari" scheme.;O The range in costs given for the FiTs data arises because di"erent tari"s apply for di"erent sizes of generator.
Table 5: Emissions abatement costs under the Renewables Obligation and the Feed-in Tari!
Subsidy Mechanism and Technology Cost: £/tonne CO2
RO: Co-!ring £46RO: Onshore wind £93RO: O"shore wind, Anaerobic Digestion £185FiT: Anaerobic Digestion £174–£224FiT: Hydro £167–£387FiT: Wind £167–£671FiT: Photovoltaic £167–£803
These extremely high costs con!rm our view that there is a distinct risk that neither the RO nor the FiT at industrial and commercial scales are likely to be economically sustainable in the longer term.
Distributed Generation and Local Grid IssuesMuch play has been made of the merits of Distributed Generation, namely, localized, small-scale electricity generated close to where it is used. Many of the systems likely to be of relevance to land-owners will be connected to the Distribution Network, where they are visible to National Grid only as negative load (i.e. Grid is only aware of reduced demand on a branch of the Distribution Network when output of a distributed generator increases and vice versa; Grid is not aware of the precise output of a particular generator).
19 This assumes a ROC is worth £50 per MWh. No allowance is made in the FiT !gures for the extra subsidy allowed for exported electricity. The value of 0.54 kg CO2 per kWh of electricity used comes from DEFRA’s guidance on reporting greenhouse gas emissions. See http://www.defra.gov.uk/environment/economy/business-e#ciency/reporting/.

QQ $%&%'()*% +&%,-. /& 01% 234&0,.5/6%: $%'(,65 7 $/585
While there are virtues in having generation at the fringes of the network, including avoided expansion costs, it is still not clear that the costs of upgrading the distribution network to accept larger capacities of such generation will not outweigh the bene!ts, or how these upgrade costs will be paid for.
Furthermore, we understand from information published by Grid that generators embedded on the Distribution Network can be curtailed forcibly without compensation in the event of a system management emergency; this has already happened, and may become more frequent as more localized generation is built. For generators able to store fuel for a few hours or more, for example anaerobic digestion, this will be relatively trivial, but for others, wind being the most prominent case, the lost income may be signi!cant.
It should be noted that distributed generation is still connected to the overall UK grid, and is not to be confused with self-contained private networks. While it is commonplace for the generation of, say, a PV panel or a wind turbine to be described as serving the needs of the house or farm, as a matter of physical fact much of this energy will Xow back up into the main system due to insu#cient local load, and much of the instantaneous load of the house or farm will be met by the grid since the microgen-erators are unavailable at the time of need.
So long as the quantities of such generators are at a low level the system management implications of this behaviour are of little signi!cance, but this could change if large capacities are built.
Given the di#culties in managing a system with an increasing volume of ‘invisible and unpredict-able generation’ mixed in with normal customer demand, it is unsurprising that there are increasing calls for improved electronic data reporting by local generators. This will inevitably increase costs to some extent.
In our view, the increasing complexity of system management on top of consumer cost may persuade government to taper o" and !nally limit the Feed-in Tari"s in order to prevent the build out of a large and costly uncontrollable microgeneration Xeet.
Overview and Conclusions
In spite of the planned contribution from o"shore wind and imported biomass, government’s plans to meet UK renewable energy targets rely on a state-directed transformation of a large part of the rural economy.
Landowners are being asked to host and sometimes invest in a large variety of renewable energy generation technologies, ranging from biomass heating systems to industrial onshore wind farms.
None of these technologies is currently economically independent of direct subsidy or socialized management costs,AP and there is no short-term prospect for them to become so.
Due to the high capital cost of industrial-scale renewables and engineering complexity, land-owners will normally be compelled to share the subsidy rent of any development on their land with an external investor and developer, who will thus acquire rights over the retained land, rights that are in most cases fully assignable.
20 Socialized management costs include such things as the cost of networking dispersed electricity generators into the electricity system and providing sources of backup generation to cope with intermittent electricity supplies. These costs are incorporated into the costs of electricity and thus paid for by consumers.
T[%,[/%' (&6 23&>*45/3&5 QR
The subsidy costs of these policies are extremely high; those for electricity adding around £6 billion a year annually on the bill in 2020, and the Renewable Heat Incentive implying a £2 billion a year !scal burden.
System integration costs for electricity, particularly for wind, where grid expansion, system balancing, and residual plant ine#ciency are major problems, are very di#cult to calculate but are known to be signi!cant and increasingly thought to be high. REF’s own calculations suggest that the annual costs of integration may be equivalent to or even greater than the subsidy per MWh.
While the subsidy costs indicate the scale of the opportunity available to landowners, they are also an indication of the fragility of the schemes, since consumer dissatisfaction is likely to result in the cost of the renewable schemes becoming a political issue. Abrupt termination of subsidy is not inconceivable, and likelihood of stranded assets is signi!cant
The targets for renewables are infeasible, as performance hitherto clearly shows, and it is unlikely that future governments will be able to gather public support for costly but unsuccess-ful attempts to achieve compliance. Target suspension or revocation is conceivable, albeit politi-cally embarrassing.
There are already signs that government has become concerned about the costs, and Her Majesty’s Treasury has, in little publicized documents, already made it clear that it intends to cap the Department of Energy and Climate Change’s levy-funded spending on renewables.
However, revisions to the Feed-in Tari" show that while government is willing to disappoint larger scale commercial interests, they are reluctant to reduce support to smaller investors.
The combination of infeasible targets, subsidy dependence, high consumer costs, and the involvement of external parties, makes the renewable energy package o"ered to landowners by government simultaneously exciting and risk-laden.
Landowners may be well advised to respond to this situation by limited and experimental commitment to renewable energies of kinds that do not threaten very high consumer costs, particularly through the cost of system integration, and which are of a scale that might survive any distressed policy correction.
Modest adoption of smaller-scale renewables using dense energy sources (biomass for heat, biomass for electricity, hydro) may be able to weather the coming storm.


$%&%'()*% +&%,-. /& 01% 234&0,.5/6%: $%'(,65 7 $/585 Q9
Appendix 1: Definitions of the Renewable Energy Generator Types in the Renewables Obligation Bands
The following de!nitions have been extracted from RO Guidance for Generators issued by Ofgem.A;
Hydro-electricElectricity generated by a hydro generating station;
A hydro generating station means a generating station which is wholly or mainly driven by water (other than a generating station driven by tidal Xows, waves, ocean currents, geothermal sources or using a di"erence in tidal levels) and the generating station extends to all turbines supplied by the same civil works, except that any turbine driven by a compensation Xow supplied by those civil works where there is a statutory obligation to maintain such compensation Xow in a natural water course shall be regarded as a separate hydro generating station.
NB The current restrictions on pre-existing hydro above 20 MW in capacity will continue to apply.
Onshore WindElectricity generated from wind by a generating station that is not o"shore (see o"shore de!nition below).
Offshore WindElectricity generated from wind by a generating station that is o"shore;
O"shore, in relation to a generating station which generates electricity from wind, means a gener-ating station which has its wind turbines situated wholly in o"shore waters, and is not connected to dry land by means of a permanent structure which provides access to land above the mean low water mark.
WaveElectricity generated from the capture of the energy created from the motion of naturally occurring waves on water.
Tidal StreamElectricity generated from the capture of the energy created from the motion of naturally occurring tidal currents in water.
Tidal Impoundment – Tidal BarrageElectricity generated by a generating station driven by the release of water impounded behind a barrier using the di"erence in tidal levels where the barrier is connected to both banks of a river and the generating station has a declared net capacity of less than 1 gigawatt.
Tidal Impoundment - Tidal LagoonElectricity generated by a generating station driven by the release of water impounded behind a barrier using the di"erence in tidal levels where the barrier is not a tidal barrage and the generating station has a declared net capacity of less than 1 gigawatt.
Solar PhotovoltaicElectricity generated from the direct conversion of sunlight into electricity.
21 http://www.ofgem.gov.uk/Sustainability/Environment/RenewablObl/Documents1/RO%20Generator%20Guidance%20May%202011%20!nal.pdf

Q< $%&%'()*% +&%,-. /& 01% 234&0,.5/6%: $%'(,65 7 $/585
GeothermalElectricity generated using naturally occurring subterranean heat.
GeopressureElectricity generated using naturally occurring subterranean pressure.
Electricity generated from Landfill GasElectricity generated from gas formed by the digestion of material in a land!ll.
Land!ll has the meaning given in article 2(g) of the Land!ll Directive (1999/31/EC).
Electricity generated from Sewage GasElectricity generated from gas formed by the anaerobic digestion of sewage (including sewage which has been treated or processed).
Energy from Waste with CHPElectricity generated from the combustion of waste (other than a fuel produced by means of anaerobic digestion, gasi!cation or pyrolysis) in a qualifying combined heat and power generating station in a month in which the station generates electricity only from renewable sources and those renewable sources include waste which is not biomass.
Gasification / Pyrolysis—Gasi"cation is the substoichiometricAA oxidation or steam reformation of a substance to produce a gaseous mixture containing two or all of the following: oxides of carbon, methane and hydrogen.—Pyrolysis is the thermal degradation of a substance in the absence of any oxidising agent (other than that which forms part of the substance itself) to produce char and one or both of gas and liquid.
The technology type is then split into Advanced/ Standard and pre banded dependent on the prop-erties of the fuel (gas or liquid) produced by the gasi!cation or pyrolysis process and used within the generating station:
Standard gasificationElectricity generated from a gaseous fuel which is produced from waste or biomass by means of gasi!cation, and has a gross calori!c value when measured at 25 degrees Celsius and 0.1 mega-pascals at the inlet to the generating station which is at least 2 megajoules per metre cubed but is less than 4 megajoules per metre cubed;Advanced gasificationElectricity generated from a gaseous fuel which is produced from waste or biomass by means of gasi!cation, and has a gross calori!c value when measured at 25 degrees Celsius and 0.1 mega-pascals at the inlet to the generating station of at least 4 megajoules per metre cubed;Standard pyrolysisElectricity generated from a gaseous fuel which is produced from waste or biomass by means of pyrolysis, and has a gross calori!c value when measured at 25 degrees Celsius and 0.1 megapas-cals at the inlet to the generating station which is at least 2 megajoules per metre cubed but is less than 4 megajoules per metre cubed;Advanced pyrolysisElectricity generated from a liquid or gaseous fuel which is produced from waste or biomass by means of pyrolysis, and in the case of a gaseous fuel, has a gross calori!c value when measured
22 i.e. less oxygen is available in the chemical reaction than would be needed to convert the fuel completely to CO2 and H2O.

Z\\%&6/] J Q?
at 25 degrees Celsius and 0.1 megapascals at the inlet to the generating station of at least 4 mega-joules per metre cubed, and in the case of a liquid fuel, has a gross calori!c value when measured at 25 degrees Celsius and 0.1 megapascals at the inlet to the generating station of at least 10 megajoules per kilogram;
Anaerobic DigestionThis is abbreviated to AD in the Order and means electricity generated from gas formed by the anaerobic digestion of material which is neither sewage or material in a land!ll.
Co-firing of BiomassElectricity generated from regular biomass in a month in which the generating station generates elec-tricity partly from fossil fuel and partly from renewable sources.Article 2 of the RO de!nes regular biomass as biomass other than (a) sewage gas, (b) land!ll gas (c) energy crops, (d) fuel produced by means of anaerobic digestion, gasi!cation or pyrolysis.
Co-firing of Energy CropsElectricity generated from energy crops in a month in which the generating station generates electric-ity partly from fossil fuel and partly from renewable sources.Article 2 of the RO de!nes energy crop as a plant crop planted a:er 31st December 1989 which is grown primarily for the purpose of being used as fuel or which is one of the following:
(a) miscanthus giganteus (a perennial grass);(b) salix (also known as short rotation coppice willow); or(c) populus (also known as short rotation coppice poplar).
Co-firing of Biomass with CHPElectricity generated from regular biomass by a qualifying combined heat and power generating station in a month in which it generates electricity partly from fossil fuel and partly from renewable sources, and where the fossil fuel and regular biomass have been burned in separate boilers or engines.
Co-firing of Energy Crops with CHPElectricity generated from energy crops by a qualifying combined heat and power generating station in a month in which it generates electricity partly from fossil fuel and partly from renewable sources, and where the fossil fuel and energy crops have been burned in separate boilers or engines.
Dedicated BiomassElectricity generated from regular biomass in a month in which the generating station generates elec-tricity only from regular biomass or only from biomass.
Dedicated Biomass with CHPElectricity generated from regular biomass by a qualifying combined heat and power generating station in a month in which the generating station generates electricity only from regular biomass or only from biomass.
Dedicated Energy CropsElectricity generated from energy crops in a month in which the generating station generates electric-ity only from energy crops or only from biomass.

Q@ $%&%'()*% +&%,-. /& 01% 234&0,.5/6%: $%'(,65 7 $/585
Dedicated Energy Crops with CHPElectricity generated from energy crops by a qualifying combined heat and power generating station in a month in which the generating station generates electricity only from energy crops or only from biomass.

Z\\%&6/] Q QG
Appendix 2: ROCs per MWh for Renewable Energy Generator Types in the Renewables Obligation Bands
Generator Type ROCs per MWhLand!ll Gas 0.25Sewage Gas 0.5Co-!ring of Biomass 0.5Onshore Wind 1Hydro 1Co-!ring of Energy Crops 1Energy from Waste with CHP 1Geo-pressure 1Co-!ring of Biomass with CHP 1Standard Gasi!cation 1Standard Pyrolysis 1Dedicated Biomass 1.5Co-!ring of Energy Crops with CHP 1.5O"shore Wind23 1.5–2O"shore Wind (01.04.10–31.03.14) 2Wave 2Tidal Stream 2Advanced Gasi!cation 2Advanced Pyrolysis 2Anaerobic Digestion 2Dedicated Energy Crops 2Dedicated Biomass with CHP 2Dedicated Energy Crops with CHP 2Solar Photovoltaic 2Geothermal 2Tidal Barrage 2Tidal Lagoon 2
23 O"shore wind granted full accreditation between 01.04.10 and 31.03.14 or additional capacity added in that period only receives 2 ROCs per MWh; new o"shore wind accredited a:er that date will receive 1.5 ROC per MWh

RK $%&%'()*% +&%,-. /& 01% 234&0,.5/6%: $%'(,65 7 $/585
App
endi
x 3:
Fee
d-in
Tar
iff P
aym
ent
Rat
esAs
at 1
Aug
ust 2
011:
see h
ttp://
www.
ofge
m.go
v.uk/
Susta
inab
ility
/Env
ironm
ent/!
ts/Pa
ges/!
ts.as
px.
* Ann
ex 2
, Not
e 4 o
f the
Mod
i!ca
tions
to th
e Sta
ndar
d Co
nditi
onso
f Elec
tricit
y Sup
ply L
icenc
es.
Z\\%&6/] R RJ

RQ $%&%'()*% +&%,-. /& 01% 234&0,.5/6%: $%'(,65 7 $/585

21 John Adam Street, London WC2N 6JGwww.ref.org.uk