renewable energy grid integration · •strong and growing partnerships with national and...
TRANSCRIPT

Hawai‘i Natural Energy InstituteSchool of Ocean & Earth Science & Technology
University of Hawaii at Manoa
1680 East-West Road, POST 109
Honolulu, Hawaii 96822
Renewable Energy Grid Integration
APEC EGNRET
Capacity Building on Renewable EnergyMarch 20, 2018
Honolulu, Hawai‘i
• Serves to integrate into the operating power grid other HNEI
technology areas: biomass and biofuels, fuel cells and hydrogen,
energy efficiency, renewable power generation
• Strong and growing partnerships with national and international
organizations including Asia-Pacific nations.
Established to develop and test advanced grid architectures, new
technologies and methods for effective integration of renewable
energy resources, power system optimization and enabling policies.
Lead for many public-private demonstration projects
2

Core Team Members:
Richard Rocheleau Director, HNEI
Leon Roose * Specialist & Chief Technologist
Mark Glick * Specialist, Energy Policy
Marc Matsuura * Senior Smart Grid Program Manager
Kanoa Jou * Power Systems Engineer
Staci Sadoyama * Power Systems Engineer Thai Tran Junior Power System Engineer
Silas Oliviera de Toledo Junior Power System Engineer
Brian Chee Communications & IT System Analyst
John Cole * Senior Policy Strategist
James Maskrey * Energy Efficiency Program ManagerDax Mathews Renewable Energy Resources Forecasting
Sharon Chan GIS Specialist
Kevin Davies Assistant Researcher
Saeed Sepasi Assistant Researcher
Abdul Motin Howlader Post-Doctoral Fellow
Sharif Muhammad Uddin Post-Doctoral Fellow
* Prior electric utility company senior management and staff
* Prior Commissioner of the Hawaii State Public Utilities Commission
* Prior Administrator of the Hawaii State Energy Office
Team members combine for 75+ years of utility, policy and regulatory experience
3

Hawaii’s Nene Curve
4
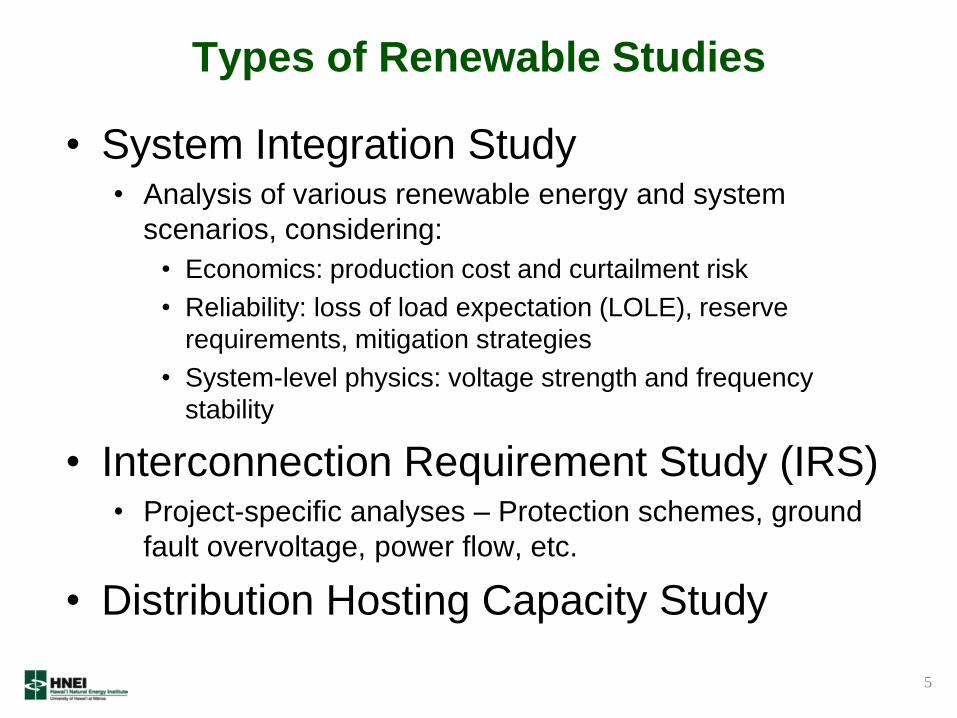
Types of Renewable Studies
• System Integration Study• Analysis of various renewable energy and system
scenarios, considering:
• Economics: production cost and curtailment risk
• Reliability: loss of load expectation (LOLE), reserve
requirements, mitigation strategies
• System-level physics: voltage strength and frequency
stability
• Interconnection Requirement Study (IRS)• Project-specific analyses – Protection schemes, ground
fault overvoltage, power flow, etc.
• Distribution Hosting Capacity Study
5

Evaluate high renewable options to identify technology and cost drivers
• Different resource mixes (wind, central & distributed solar, biomass, other)
• Different grid configurations (independent or connected, micro and smart grids)
• Alternative fuels (LNG, hydrogen)
• Changes in loads (energy efficiency, demand response, EVs, storage)
• Changes in grid operation (unit cycling, reduced min run)
• Changes in generation mix (unit retirement, new units, new technology)
Robust analysis to identify optimal operations and inform policy
System Integration Studies
Validate
System
Models
Production
Cost
Modeling
Select
Mitigations
Reporting,
Dissemination
Identify
Shortcomings
Develop and
Implement
Scenarios
Dynamic Modeling
Variability Analysis
Load Flow
Modeling
6

-50 -40 -30 -20 -10 0 10 20 30 40 500
5
10
15
20
25
30
35
40
45
50
Farm power (MW per interval)
Fre
quency (%
)
100MW Oahu + 200MW Lanai + 200MW Molokai
0.1% percentile (1min) = -12.27
0.1% percentile (5min) = -31.336
0.1% percentile (10min) = -49.305
Negative most (1min) = -22.479
Negative most (5min) = -54.9215
Negative most (10min) = -90.258
99.9% percentile (1min) = 11.7685
99.9% percentile (5min) = 33.0615
99.9% percentile (10min) = 54.0865
Positive most (1min) = 22.5425
Positive most (5min) = 65.0885
Positive most (10min) = 95.845
Interval = 1min
Interval = 5min
Interval = 10min
1 day1 min 1 hr 1 wk10 min1 sec
Governor
Response
Governor
Response Automatic
Generation
Control
AGC Regulation
Economic
Dispatch
EconomicDispatch
ArbitragePlanning
Governor
ResponseInertiaInertia
Positive Sequence
Load Flow (GE PSLFTM)
Interhour Renewables
Variability AnalysisTM
Long-term Dynamic
Simulations (AGC)TM
Multi-Area Production
Simulation (GE MAPSTM)
Governor
ResponseSupport
Voltage
Statistical Wind Power
Variability Assessments
-0.25 -0.2 -0.15 -0.1 -0.05 0 0.05 0.1 0.15 0.2 0.250
10
20
30
40
50
Power ramp (pu per interval)
Fre
quency (
%)
0% percentile (10min) = -0.14
0% percentile (60min) = -0.45
0.1% percentile (10min) = -0.09
0.1% percentile (60min) = -0.27
99.9% percentile (10min) = 0.10
99.9% percentile (60min) = 0.31
100% percentile (10min) = 0.18
100% percentile (60min) = 0.48
Interval = 10min
Interval = 60min
-150 -100 -50 0 50 100 1500
10
20
30
40
50
Power ramp (MW per interval)
Fre
quency (
%)
0% percentile (10min) = -82.85
0% percentile (60min) = -269.05
0.1% percentile (10min) = -54.90
0.1% percentile (60min) = -163.16
99.9% percentile (10min) = 60.11
99.9% percentile (60min) = 183.45
100% percentile (10min) = 105.95
100% percentile (60min) = 289.31
Interval = 10min
Interval = 60min
2008
Develop rigorous
analytic models of
electricity grids
Analyze impact of new
energy systems
including renewable
generation, end-use
energy efficiency, and
transportation systems
Analyze solutions to
address system
integration issues
• Advanced
controls
• Forecasting
• Demand control
• Storage
• Smart grids
Renewable Energy Grid Integration Studies
Tools are used together to assess the challenges and provide information needed for advanced energy solutions
7

8
Why is Hawaii Unique?
Large Single Contingency
Low Number of Synchronous Generators
Isolated grids
High Level of Renewable Penetration (DPV especially)
Must be prepared for the loss of AES coal plant, which can be up to
30% of the grid’s supply
Oahu has few synchronous generators online and available to
provide primary frequency response
Islands cannot rely on neighbors during emergency events for
support
High renewable penetration displaces conventional generation and
some of the ancillary services they provide.
A shared experience with other islanded power systems
Novel solutions are required to maintain grid stability with high wind and solar
penetration

System Integration TasksData Requirements
• Existing infrastructure:
• Thermal fleet: heat rate curves, min/max operation, ramp rates and
startup/shutdown time, maintenance intervals and outage rates
• Transmission and distribution: topology, thermal limits, efficiencies
• Supporting equipment: synchronous condensers, energy storage, etc.
• Existing plans: Capacity expansion and decommissioning
• Loads: Typical profiles and ramp rates, uncertainty, and annual
growth
• Renewable energy: Typical metrological year (TMY) profiles,
uncertainty, and annual variability (all location dependent)
• Commitment and dispatch: Operating constraints and
strategies (reserves, PPAs, etc.), SCADA data
• Economics: Current and projected cost of fuel, renewable
energy, and supporting technology
9

System Integration TasksScenario Development
• Driven by society/political goals, available and
future technology, and economics
• Iterative process – changes in driving factors
• Should involve all stakeholders – policymakers,
utility, developers, public representatives – but
let the data drive the outcomes
• Balance between the current and ideal future
state of the grid
10

System Integration TasksProduction Cost Modeling
• Sub-hourly optimal commitment and dispatch, subject to
operational constraints
• Initially, validate against existing operations
• Then, evaluate system operations and economics with increasing
levels of wind, solar, and energy storage
11

System Integration Tasks
Dynamic Modeling
• Used to analyze frequency stability under contingency
events
58.5 Hz
57.8 Hz
Grid Collapse
Sh
ed
L
oa
dExample Generator Trip Contingency
12

System Integration Tasks
Dynamic Modeling
• Over-frequency can also occur due to load rejection
61.8 Hz
61.3 Hz
Example Load Rejection Contingency
13

System Integration TasksDynamic Modeling
Sys
tem
Ris
k
• Dynamic simulation requires more effort than production cost simulation, so
we use production cost to select challenging periods to evaluate further
• We fit and validate a metric that quantifies system risk based on multiple
factors: thermal unit commitment, largest generator contingency, legacy
DPV, and up reserves online
14

Use this equation to
estimate frequency
response throughout
the year
Process repeated for
load-rejection
contingencies
Generator Trip Contingency
System Integration Tasks
Dynamic Modeling
15

Over-frequency droop
utility scale & distributed
Over-frequency droop
utility scale RE
Fre
qu
en
cy A
pe
x (
Hz)
Load Rejection Contingency
System Integration Tasks
Dynamic Modeling
16

System-Level Mitigating Technologies• Selecting the right type of new generation technology for
expected load growth
• Upgrades to existing thermal fleet: Reduced minimum operating
levels, improved ramp rates and efficiencies
• Energy storage technologies:
• Wide range from high power, low energy (synchronous condensers,
flywheels) to low power, high energy (pumped hydro, hydrogen); batteries
are somewhere in the middle depending on chemistry and design
• Depending on technology, implementation, and controls, can provide a
variety of services: fast frequency response (FFR), operative reserves,
energy shifting, etc.
• Demand response and distributed energy resource (DER)
controls: can provide FFR, reserves, and energy shifting just like
energy storage technologies
• Improved communications, controls, visibility, and prediction:
• Particularly needed for DER (e.g., rooftop PV)
• Wind and solar forecasting can optimize reserve requirements by predicting
resource availability over multiple time horizons from seconds to days17

photos courtesy of Altairnano
Grid Scale BESS Projects (HNEI)
Upolu Point, Hawaii Island (1MW, 250kWh)
• Modeling showing benefit completed in 2007
• Frequency regulation and wind smoothing
• 3.3 GWh over 3yrs, > 6000 full cycles
Molokai Secure Renewable Microgrid (2MW)
• Operating reserves (fault management), frequency regulation,
• Fast response decision and control (<50ms response)
Campbell Park industrial feeder with high penetration (1MW)
• Power smoothing, voltage and VAr support, and frequency
regulation
Laboratory testing of single cells
• Novel technique to characterize state-of-health
• Performance models to predict lifetime of grid scale BESS
Demonstrate optimized BESS operating strategies for high value grid
applications
18

Grid Scale BESS Projects (HNEI)
Select Results
1MW BESS reduces Big
Island frequency
variability up to 40%
Wind smoothing:
Significant reduction 1 min
ramp rates
• Reduce battery cycling while maintaining grid benefit
• Integrate with other technologies for longer events
• Analysis of utility value
19

Molokai Excess Energy Issue
20

21
Molokai Excess Energy Issue

Maui Wind Integration Study
Scenarios
• Scenario 1
30 MW, Plant 1 (Existing)
• Scenario 2
30 MW, Plant 1
22.5 MW, Plant 2
• Scenario 3
30 MW, Plant 1
21 MW, Plant 3
• Scenario 4
30 MW, Plant 1
22.5 MW, Plant 2
21 MW, Plant 3
22

Wind Delivered With MECO System
“As-Is” Today
Available and Delivered Wind Energy
Delivered Energy for Plant 3 was
insufficient to finance the project
23

Candidate Mitigation Strategies
24

Effectiveness of Mitigation
Measures to Increase Wind
Energy Delivered
BESS Function
• 10MW / 20MWh
• Manual and AGC Dispatch
• Aggressive Overfrequency Response
• Ramp Rate Limit within a limited SOC
Range
MECO Operations
• Include 10MW of BESS in Up Reserve
• Reduce Down Reserve of M14 & M16 by 1.5MW
• Reduced Operation of K1 and K2
• 50MW Up-Reserve Limit
25

Interconnection Requirements
and
Distribution Circuit Hosting Capacity
26

DG PV Interconnection Requirements
• IEEE 1547a-2014 / UL1741 Certification
• Active anti-islanding
• Transient overvoltage mitigation
• Low/High voltage ride-through
• Low/High frequency tide-through
• Advanced Inverter Functions• Volt-watt
• Frequency-watt
• Volt-var
• Fixed power factor
• Ramp rate – normal and soft start
• Remote disconnect capability
27

Anti-Islanding
• Active anti-islanding schemes typically drive frequency out of the ride-through region when disconnected from the grid.
• With active anti-islanding, islanding has not proven to be an issue, even at high penetration levels using standard anti-islanding techniques.
• Studies done by Sandia National Lab determined that if there is a mismatch of more than 1% between the VAR load and the VAR sources on the circuit, the inverters will not form an island.
28

Transient Overvoltage
Source: “Inverter Load Rejection Over-Voltage Testing”, NREL & SolarCity Corporation,
NREL/TP-5D00-63510, Feb 201529

Avoiding Transient Overvoltage
Conditions
30

Frequency Ride-Through
31

Voltage Ride-Through
32

Under Frequency Load Shedding
Impacts
33

Distribution Hosting Capacity
• Assumes interconnection requirements are met
• Develop PV growth scenarios
• Assess circuit loading impacts
• Assess circuit voltage impacts
• Assess voltage flicker impacts
34

Circuit Overload and Voltage Impacts:Location of DG Impacts Circuit Loading and
Voltage
SUBSTATION
Voltage
Distance
Heavy Load No DG
Heavy Load(DG at High Output)
End
ANSI C84.1 Lower Limit (114 volts)
Light Load (DG at High Output)
ANSI C84.1 Upper
Limit (126 volts)
LTC Large DG exports large amounts of power up feeder
IDG
Feeder (with R and X)
IEEE 1547 trip Limit (132 Volts)
35

Circuit Overload and Voltage Impacts:Location of DG Impacts Circuit Loading and
Voltage
Vo
ltag
e
Distance
Heavy Load No DG
Heavy Load with DG
End
ANSI C84.1 Lower Limit (114 volts)
Light Load No DG
SUBSTATION
Exporting DG “shields” the substation LTC controller from the feeder current. The LTC sees less current than there is and does not boost voltage adequately.
LTC
Large DG (many MW)
DG Supports most of feeder loadCT
Line drop compensator LTC Controller
ANSI C84.1Upper Limit(126 volts)
36

May result in power quality
issues such as flicker at the
circuit level
Interconnecting a large amount of
fluctuating generation such as PV
(for example) on a circuit
The GE Flicker Curve
(IEEE Standard 141-1993 and 519-1992)
Power Quality -
Flicker
37

Feeder Hosting Ability
• Two Sources
• Station TC1 Bus A
• Station TD Bus A
• Incremented PV at
three different
locations
38

Example - Feeder Hosting Results
• Existing PV: 0 kW
• Planned PV: 1403.5 KW
39

Voltage Control: Excessive voltage regulator
tap operations with variable DG
40

Ground Fault Overvoltage
Neutral
Vcn
Van
Vbn
Before the Fault
Neutral
Voltage Increases on Van, Vbn
Vbn
Van
Vcn
During the Fault
Neutral and earth return path
Phase A
Phase B
Phase C
Source Transformer (output side)
X1 R1
FaultVbn
Van
Vcn
X1 R1
X1 R1
X0 R0
Voltage swell during ground fault
V(t)
(t)
Ground Fault overvoltage can result in damaging overvoltages on unfaulted phases of up to roughly 170% of the normal maximum system voltage!
Effective grounding limits the voltage
rise on the unfaulted phases to about
125% of nominal during L-G fault on 4-
wire multi-grounded neutral systems
41

Short Circuit Ratio
The majority of inverter-based control systems rely on the
voltage magnitude and angle at their terminals to not be
largely affected by the current injection of the resource for
stable operation. In this context, electrical system strength
refers to the sensitivity of the resource’s terminal voltage to
variations of current injections. In a strong system, this
sensitivity is low; in a weak system, this sensitivity is higher.
The most basic and easily applied metric to determine the
relative strength of a power system is short circuit ratio (SCR)
“Plain” SCR is a simple calculation, but
does not account for multiple inverter
interactions. An SCR of 3 is considered
adequate. Some inverter manufacturers
can operate with an SCR as low as 2.
42

Simple SCR Example
Source: MISO Planning Subcommittee August 15, 2017 43

Short Circuit Ratio Calculation Methods
Source: “Integrating Inverter Based Resources into Weak Power Systems, Reliability Guideline”, NERC, June 2017
http://www.nerc.com/pa/RAPA/rg/ReliabilityGuidelines/Reliabilty_Guideline_-_Integrating_VER_into_Weak_Power_Systems.pdf
44

Installed PV Capacity - HECO Companies(2005 to 2017)
45

Complexity of DER Utilization
Circuit DER utilization potential depends on:
• Time of day and weather for PV
• Available resource capacity for Distributed Energy Resource
(DER), i.e. BESS, EV, DR, etc.
• DER may also have competing use cases to consider
46

Maui Advanced Solar Initiative
~800 customers
~300 PV systems = 2MW
MDL = 976kW
% Penetration = 𝟐𝑴𝑾
𝟗𝟕𝟔𝒌𝑾= 𝟐𝟎𝟎%
300 PV locations
totaling 2MW
US DOE & ONR funded, HNEI led project to develop and demonstrate
advanced PV inverter functionality in a smart grid environment
47

Field Performance & Data Mining
48

0
1
2
3
4
5
6
1 2 3 4
Vo
ltag
e
VARs
Sends Volt-VAR or Volt-Watt curve to Smart
Inverter to adjust inverter VAR or Watt
injections into the grid
Smart Inverter receives
curve, senses system
voltage
VAR
WVAR
W
Software sends control curves to adjust inverter
1
PC
(Honolulu)
0
1
2
3
4
5
6
1 2 3 4
Vo
lta
ge
Watts
2 Smart Inverter adjusts VAR or Watt
output based on curves to respond to
system voltage fluctuations
3
2-way data flow
Wireless communications
Server Translator
Device
Cell
Network
49

Voltage Along the Feeder
7pm-11pm
10am-3pm
Voltage Profile with Distributed PV
50

Reactive Power & Voltage
51
Reactive Power (kVAR)
Real Power (kW)
Reactive Power (kVAR)
Real Power (kW)
Capacitive Inductive
SCADA
Distr Tsf
Inverter
Voltage Voltage
SCADA
Distr Tsf
Inverter

Reducing Voltage Fluctuations Across
Distribution Feeder
ΔV = 1.68V
ΔV = 0.10V
𝑘𝑊𝐿𝑂𝐴𝐷 & 𝑘𝑉𝐴𝑅𝐿𝑂𝐴𝐷
Voltage at Service Transformer Secondary (VT)
Improves energy efficiency and reduces peak
demand by lowering voltage (within ANSI
limits) on the feeder lines that run from
substations to end-use loads.
Smart inverters can be
controlled to manage voltage
52

Advanced Conservation Voltage Reduction (CVR) Field Demonstration
PQubeCustom
CVR Feeder
Controller
Voltage
Regulator M
M
M
M
M
M
M
To Utility
Transformer
DER Control
(No communication
required)
M
Data Collection
Collaborating with an international partner
to provide equipment installation support
53

Understanding Power Meters
Fundamental
Reactive
Power
Non Active
Power
Computation of reactive power differs across meters
54

Advanced Inverter Standardization
• Control curve
– Number of points
– Steepness of curves
• Inverter response time
• Interaction between multiple inverters
Moderate Curve Steep Curve
55

HECO Advanced Inverter Function Settings
Advanced Inverter Functions
Frequency-watt
Volt-var
Volt-watt
Fixed power factor
56

Ongoing DER Research
HNEI Power Meter
PV & Load Data Synthesis
Distribution Modeling
Predictive Distribution Operator PV & Load Data Forecasting
57

Summary
• System Integration Studies
• Analysis of various renewable energy and system
scenarios, considering economics, reliability, and system-
level characteristics
• Interconnection Requirements and Circuit
Hosting Capacity
• Applying industry best practices for interconnection
requirements enables high penetrations of DER today
• Distributed Energy Resources (DER)
• Rapidly growing and viable resource
• More research and development is required to effectively
utilize advanced capabilities of power electronic devices
(e.g., PV inverters)
58

Expertise & Focus:
Renewable Energy Grid Integration
Smart Grid Planning & Technologies
Power Systems Planning
Power Systems Operation
Power Systems Engineering and Standards
Communications Design and Testing
Data Center and Cloud infrastructure
Energy Policy
Project Management and Execution
59

Mahalo!(Thank you)
For more information, contact:
Leon Roose
Hawaii Natural Energy Institute
School of Ocean & Earth Science & Technology
University of Hawaii at Manoa
1680 East-West Road, POST 109
Honolulu, Hawaii 96822
Office: (808) 956-2331
Mobile: (808) 554-9891
E-mail: [email protected]
Website: www.hnei.hawaii.edu
60