renewable energies in germany - status quo and future ... filesolar biomass iii. related business...
TRANSCRIPT
© a
lph
a v
en
tus/R
EP
ow
er
20
09
Renewable Energies in Germany -
Status Quo and Future Business Potential
Esther Frey
Manager Renewable Energies & Resources
09.11.2012

www.gtai.com
I. Germany´s Energy Transformation
II. Renewable Energies in Germany
Wind
Solar
Biomass
III. Related business fields
Grid expansion, Storage, Smart Metering
Agenda
09.11.2012 2
09.11.2012 | www.gtai.com
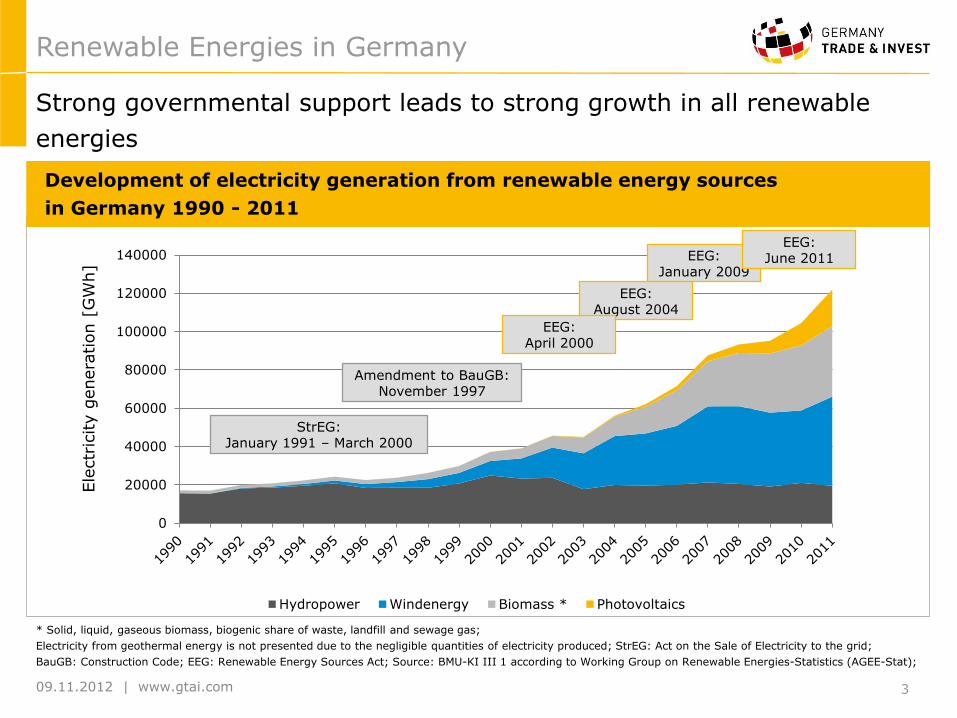
Renewable Energies in Germany
Strong governmental support leads to strong growth in all renewable
energies
* Solid, liquid, gaseous biomass, biogenic share of waste, landfill and sewage gas;
Electricity from geothermal energy is not presented due to the negligible quantities of electricity produced; StrEG: Act on the Sale of Electricity to the grid;
BauGB: Construction Code; EEG: Renewable Energy Sources Act; Source: BMU-KI III 1 according to Working Group on Renewable Energies-Statistics (AGEE-Stat);
0
20000
40000
60000
80000
100000
120000
140000
Hydropower Windenergy Biomass * Photovoltaics
Ele
ctr
icity g
enera
tion [
GW
h]
EEG: January 2009
EEG: August 2004
EEG: April 2000
Amendment to BauGB: November 1997
StrEG: January 1991 – March 2000
3
EEG: June 2011
Development of electricity generation from renewable energy sources
in Germany 1990 - 2011

09.11.2012 | www.gtai.com
Main Objectives
The New Energy Concept (2010)
Energy efficiency measures
Increase in energy productiveness 2.1% p.a.
Reduction of energy consumption -50% (2050 vs. 2008)
Reduction of electricity consumption -25% (2050 vs. 2008)
Renovation rate 2% p.a.
Reduction of energy for transportation -40% (2050 vs. 2005)
Climate protection measures 2020 2050
CO2 cuts vs. 1990 -40% -80%
Renewable share of… 2020 2050
Total energy consumption 18% 60%
Electricity consumption 35% 80%
Heat generation 14% 60%
4
www.gtai.com
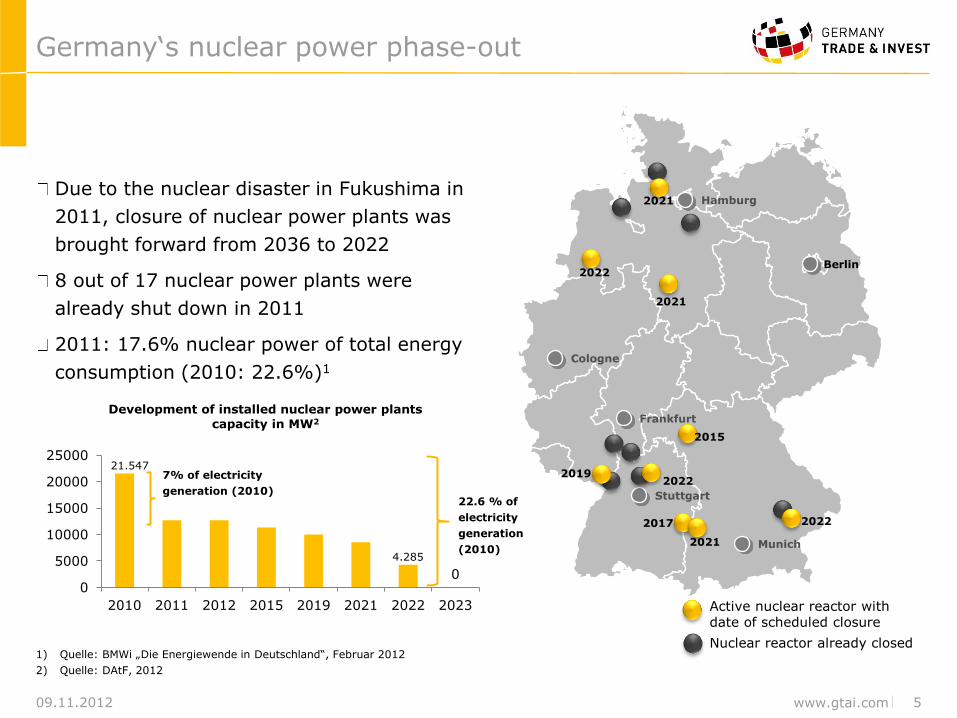
Due to the nuclear disaster in Fukushima in
2011, closure of nuclear power plants was
brought forward from 2036 to 2022
8 out of 17 nuclear power plants were
already shut down in 2011
2011: 17.6% nuclear power of total energy
consumption (2010: 22.6%)1
Germany‘s nuclear power phase-out
1) Quelle: BMWi „Die Energiewende in Deutschland“, Februar 2012
2) Quelle: DAtF, 2012
09.11.2012 5
Active nuclear reactor with date of scheduled closure
Nuclear reactor already closed
Berlin
Hamburg
Cologne
Munich
Stuttgart
Frankfurt
2021
2022
2021
2021
2017 2022
20192022
2015
21.547
4.285
0 0
5000
10000
15000
20000
25000
2010 2011 2012 2015 2019 2021 2022 2023
Development of installed nuclear power plants
capacity in MW2
7% of electricity
generation (2010) 22.6 % of
electricity
generation
(2010)

09.11.2012 | www.gtai.com
Faster expansion of renewable energies
Integration of renewable energies into the overall energy system
Central component: wind energy
Increase energy R&D levels - up to €0.5 bn will be made available
Expansion of electricity and smart grids as well as energy storage capacity
Restructuring the fossil power plant park towards more flexible power stations
Increase energy efficiency (particularly in buildings)
Cost efficiency and efficient procurement
European initiatives for energy efficiency
Measures for implementing the new energy policy after the decision
taken on the gradual phase-out of nuclear power by 2022
Source: http://www.bmu.de/energiewende/beschluesse_und_massnahmen/doc/47892.php
The Federal Energy Concept
6

www.gtai.com
I. Germany´s Energy Transformation
II. Renewable Energies in Germany
Wind
Solar
Biomass
III. Related business fields
Grid expansion, Storage, Smart Metering
Agenda
09.11.2012 7

www.gtai.com
The German Wind Energy Market
Structure of Electricity Production from
Renewable Energies in Germany 20111)
of renewable energies Prognosis of
yearly installed offshore capacity (in
GW)1)
Renewable Energies have a share of 20% of the German electricity
consumption. The biggest part comes from wind energy.
Sources 1) BMU 2012: Entwicklung der EE in Deutschland in 2011 2) BMU 2012 – Langfristszenarien und Strategien für den Ausbau der EE in Deutschland
09.11.2012
Wind Energy
38,10%
Hydro Power
16,00%
Photo-voltaics
15,60%
Biogas 14,40%
Biomass 9,30%
Waste 4,10%
Others 2,50%
Prognosis of Electricity Production (in
TWh/a) from Wind in Germany2)
8 27 38 63 82 91
101 118
132
8
33 61
89
115 128
0
50
100
150
200
250
300
350
400
450
Hydro Power Wind - Onshore
Wind - Offshore PV
Biomass Geothermal
8

www.gtai.com
Offshore Wind
255
182
300
500
563
680
900
1.339
2.400
3.000
5.178
6.000
10.000
13.000
0 2.000 4.000 6.000 8.000 10.000 12.000 14.000
others
Sweden
Greece
Poland
Estonia
Belgium
Finland
Denmark
Irland
Spain
Netherlands
France
Germany
UK
Political targets for offshore wind in Europe until 2020 (in MW)
Germany and UK offshore wind markets are strongly backed up by
political targets.
Source: WAB 2011
09.11.2012 9
www.gtai.com
Offshore Wind
Approved offshore wind projects - not yet under construction - in Europe at the end
of 2011 (in GW)
Germany is leading the current offshore wind project pipeline with
around 8.1 GW of approved projects.
Source: EWEA 2012
09.11.2012 10
0,9
0,9
0,9
1,08
1,26
1,98
2,16
8,1
0 1 2 3 4 5 6 7 8 9
UK
Belgium
Finland
Sweden
Estonia
Ireland
Netherlands
Germany
www.gtai.com
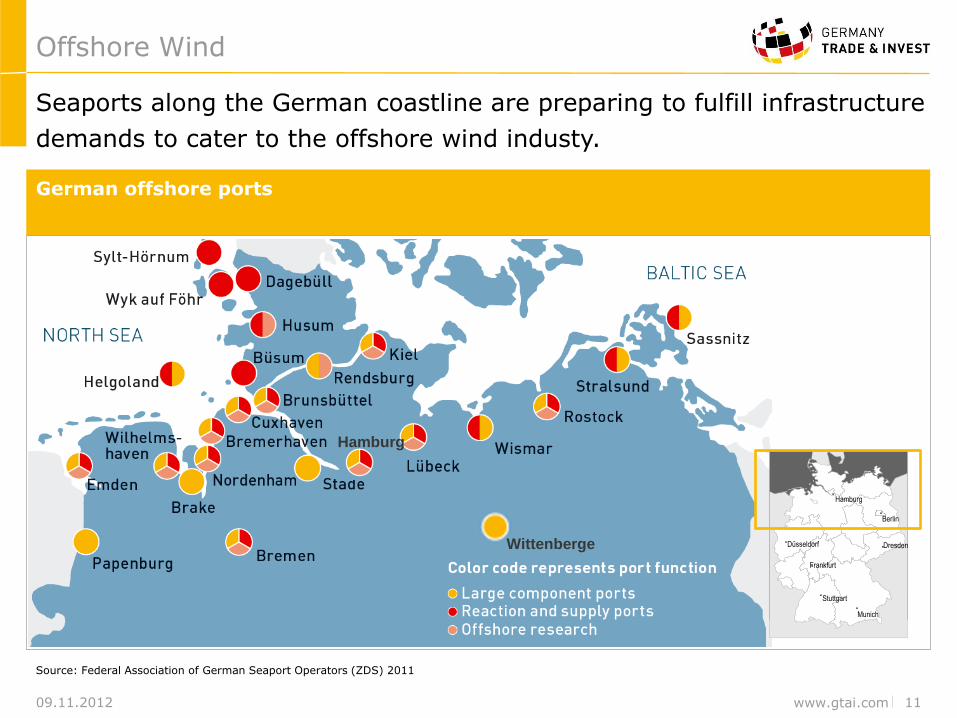
Seaports along the German coastline are preparing to fulfill infrastructure
demands to cater to the offshore wind industy.
Source: Federal Association of German Seaport Operators (ZDS) 2011
Offshore Wind
09.11.2012
German offshore ports
Stuttgart
Munich
Düsseldorf
Berlin
Dresden
Hamburg
Frankfurt
11
Hamburg
Wittenberge

www.gtai.com
Planning reliability through new legislation on liability
If Germany’s transmission system operators fail
to complete connections in time, delaying the
energy production, the damage will be
compensated.
90% of the original Feed-in-tariff from the 11th
day on.
The TSO can allocate the costs to the end
customer if not acting grossly negligent or
intentional.
New law to facilitate and accelerate offshore grid connections through binding
grid development plan and new liability rules.
Financing to be shouldered by more investors.
What‘s next?
Source: Federal Ministry for the Environment, Nature Conservation and Nuclear Safety, 2012
Offshore Wind
09.11.2012 12 R&D Support
Financing bottleneck to be solved
Mitsubishi and TenneT to partner for specific
grid connections
Allianz and Munich Re consider taking part in
German offshore grid. This is an save
investment as the Federal Network Agency
ensures an equity return 9%.
www.gtai.com
Repowering
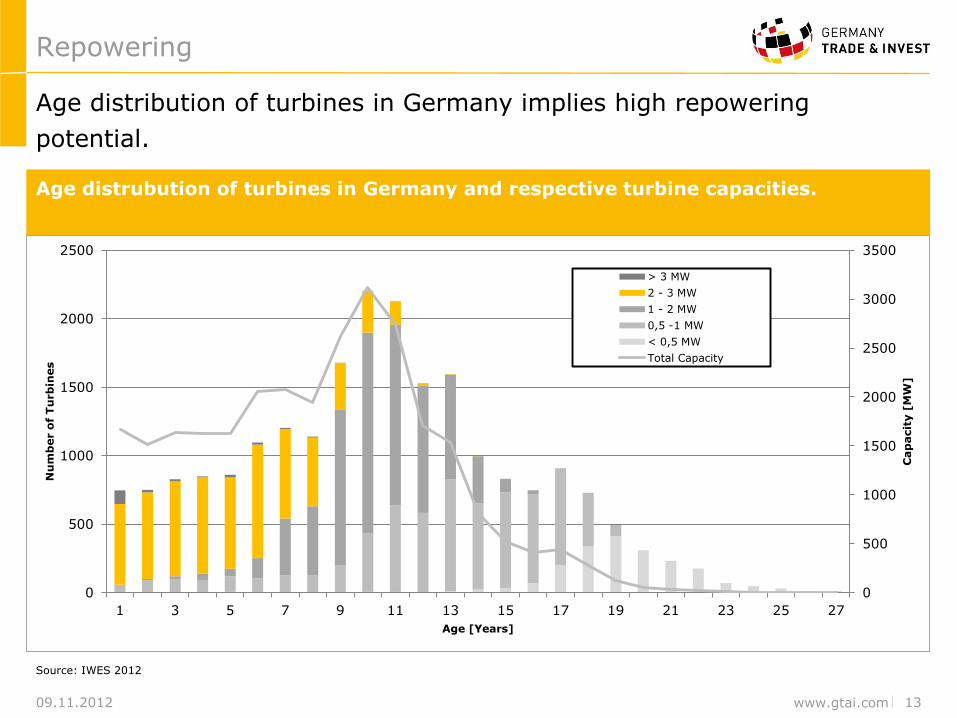
Age distrubution of turbines in Germany and respective turbine capacities.
Age distribution of turbines in Germany implies high repowering
potential.
Source: IWES 2012
09.11.2012 13
0
500
1000
1500
2000
2500
3000
3500
0
500
1000
1500
2000
2500
1 3 5 7 9 11 13 15 17 19 21 23 25 27
Cap
acit
y [
MW
]
Nu
mb
er o
f T
urb
ines
Age [Years]
> 3 MW
2 - 3 MW
1 - 2 MW
0,5 -1 MW
< 0,5 MW
Total Capacity
www.gtai.com
I. Germany´s Energy Transformation
II. Renewable Energies in Germany
Wind
Solar
Biomass
III. Related business fields
Grid expansion, Storage, Smart Metering
Agenda
09.11.2012 14
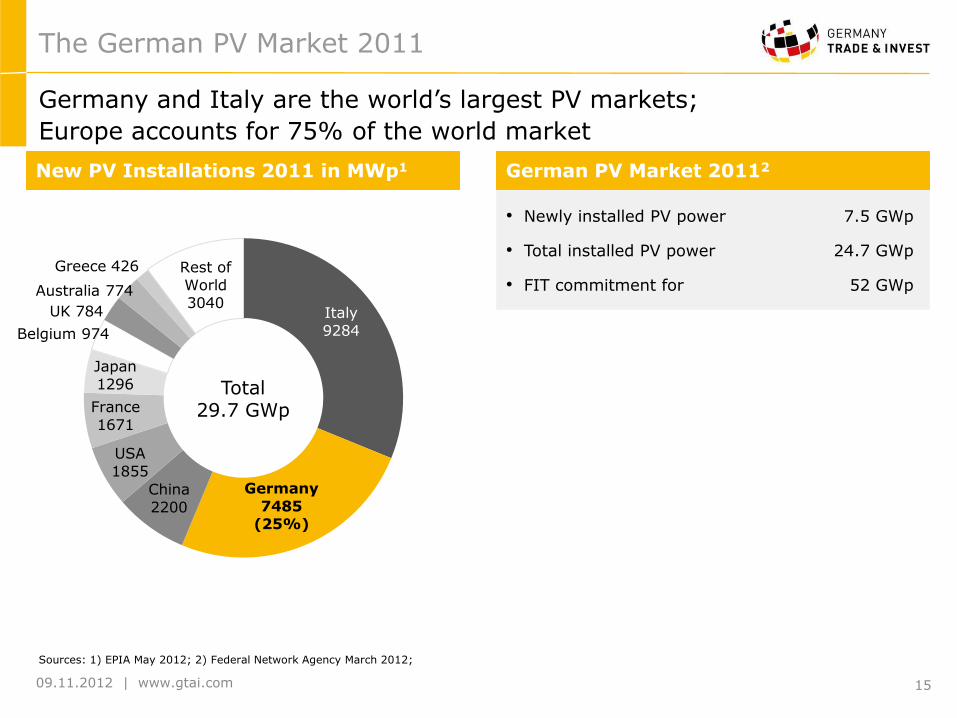
09.11.2012 | www.gtai.com 15
Germany
7485 (25%)
Italy
9284
China
2200
Japan
1296
France
1671
USA
1855
Rest of
World 3040
Greece 426
Australia 774
Total 29.7 GWp
The German PV Market 2011
Germany and Italy are the world’s largest PV markets;
Europe accounts for 75% of the world market
German PV Market 20112 New PV Installations 2011 in MWp1
Sources: 1) EPIA May 2012; 2) Federal Network Agency March 2012;
• Newly installed PV power 7.5 GWp
• Total installed PV power 24.7 GWp
• FIT commitment for 52 GWp
UK 784
Belgium 974
www.gtai.com
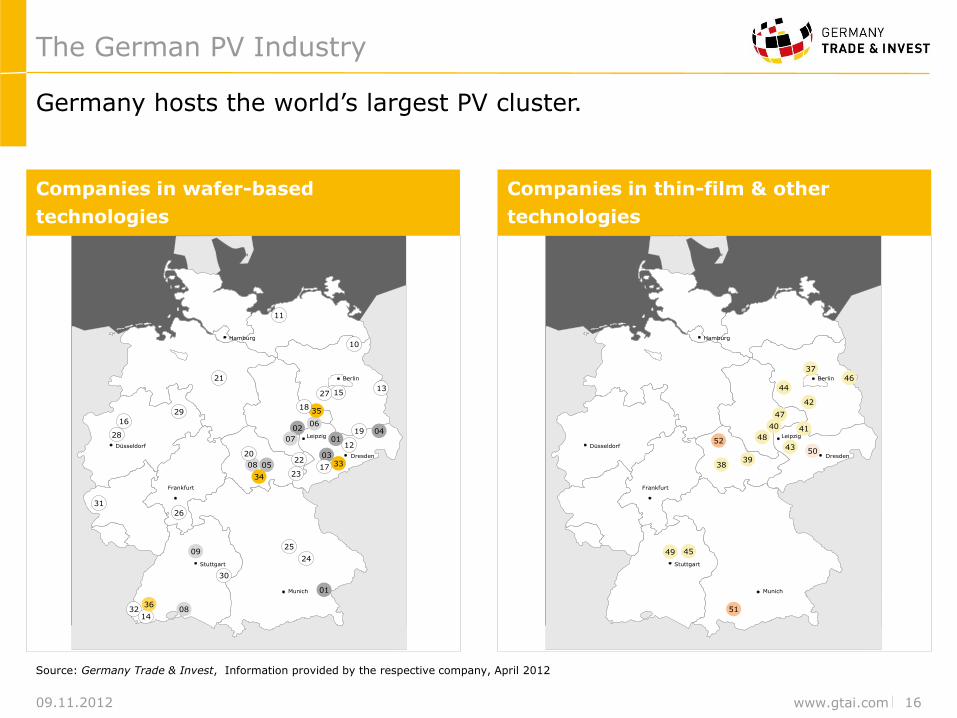
The German PV Industry
Companies in wafer-based
technologies
of renewable energies Prognosis of
yearly installed offshore capacity (in
GW)1)
Germany hosts the world’s largest PV cluster.
Source: Germany Trade & Invest, Information provided by the respective company, April 2012
09.11.2012
Leipzig
Frankfurt
Stuttgart
Munich
Hamburg
Düsseldorf
Berlin
Dresden
Frankfurt
Leipzig0402
01
01
05
09
08
07
06
08
30
35
34
16
32
15
12
11
10
21
20
19
18
22
25
29
26
27
31
28
033317
24
13
14
23
36
Companies in thin-film & other
technologies
Leipzig
Frankfurt
Stuttgart
Munich
Hamburg
Düsseldorf
Berlin
Dresden
Frankfurt
Leipzig
38
37
39
47
46
52
50
51
40
42
41
44
43
45
48
49
16
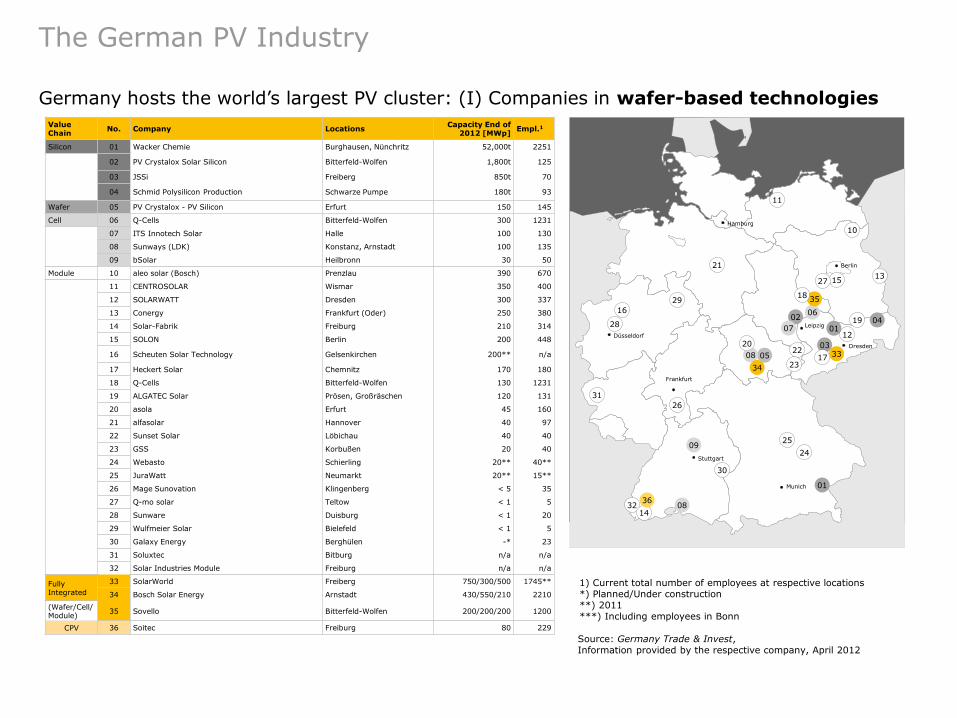
Germany hosts the world’s largest PV cluster: (I) Companies in wafer-based technologies
1) Current total number of employees at respective locations *) Planned/Under construction **) 2011 ***) Including employees in Bonn
The German PV Industry
Source: Germany Trade & Invest, Information provided by the respective company, April 2012
Value Chain
No. Company Locations Capacity End of
2012 [MWp] Empl.1
Silicon 01 Wacker Chemie Burghausen, Nünchritz 52,000t 2251
02 PV Crystalox Solar Silicon Bitterfeld-Wolfen 1,800t 125
03 JSSi Freiberg 850t 70
04 Schmid Polysilicon Production Schwarze Pumpe 180t 93
Wafer 05 PV Crystalox - PV Silicon Erfurt 150 145
Cell 06 Q-Cells Bitterfeld-Wolfen 300 1231
07 ITS Innotech Solar Halle 100 130
08 Sunways (LDK) Konstanz, Arnstadt 100 135
09 bSolar Heilbronn 30 50
Module 10 aleo solar (Bosch) Prenzlau 390 670
11 CENTROSOLAR Wismar 350 400
12 SOLARWATT Dresden 300 337
13 Conergy Frankfurt (Oder) 250 380
14 Solar-Fabrik Freiburg 210 314
15 SOLON Berlin 200 448
16 Scheuten Solar Technology Gelsenkirchen 200** n/a
17 Heckert Solar Chemnitz 170 180
18 Q-Cells Bitterfeld-Wolfen 130 1231
19 ALGATEC Solar Prösen, Großräschen 120 131
20 asola Erfurt 45 160
21 alfasolar Hannover 40 97
22 Sunset Solar Löbichau 40 40
23 GSS Korbußen 20 40
24 Webasto Schierling 20** 40**
25 JuraWatt Neumarkt 20** 15**
26 Mage Sunovation Klingenberg < 5 35
27 Q-mo solar Teltow < 1 5
28 Sunware Duisburg < 1 20
29 Wulfmeier Solar Bielefeld < 1 5
30 Galaxy Energy Berghülen -* 23
31 Soluxtec Bitburg n/a n/a
32 Solar Industries Module Freiburg n/a n/a
Fully Integrated
33 SolarWorld Freiberg 750/300/500 1745**
34 Bosch Solar Energy Arnstadt 430/550/210 2210
(Wafer/Cell/Module)
35 Sovello Bitterfeld-Wolfen 200/200/200 1200
CPV 36 Soitec Freiburg 80 229
Leipzig
Frankfurt
Stuttgart
Munich
Hamburg
Düsseldorf
Berlin
Dresden
Frankfurt
Leipzig0402
01
01
05
09
08
07
06
08
30
35
34
16
32
15
12
11
10
21
20
19
18
22
25
29
26
27
31
28
033317
24
13
14
23
36

Germany hosts the world’s largest PV cluster: (II) Companies in thin-film & other technologies
The German PV Industry
Source: Germany Trade & Invest, Information provided by the respective company, April 2012
1) Current total number of employees at respective locations *) Planned/Under construction **) 2011
Value Chain No. Company Locations Capacity End of 2012
[MWp] Empl.1
Thin Film 37 Inventux Berlin 100 220
a-Si 38 Masdar PV Ichtershausen 80 200
a-Si/μc-Si 39 SCHOTT Solar Thin Film Jena n/a n/a
40 Q-Cells Bitterfeld-Wolfen 135 1231
41 AVANCIS Torgau 120 400
CIS 42 Nanosolar Luckenwalde 115 90
CIGSSe 43 Solarion Leipzig, Zwenkau 20 90
CIGS 44 Bosch Solar CIS Tech Brandenburg 15 150
45 Manz Schwäbisch Hall 6 120
46 First Solar Frankfurt (Oder) 560 n/a
CdTe 47 Calyxo (Q-Cells) Bitterfeld-Wolfen 80 160
48 Second Solar Century Halle -* -*
GaAs 49 Azur Space Solar Power Heilbronn 350 150
OPV 50 heliatek Dresden 2 75
PV & Thermal 51 Solarzentrum Allgäu Altdorf-Biessenhofen 20 80
52 Heli Solar Blankenburg n/a n/a
Leipzig
Frankfurt
Stuttgart
Munich
Hamburg
Düsseldorf
Berlin
Dresden
Frankfurt
Leipzig
38
37
39
47
46
52
50
51
40
42
41
44
43
45
48
49

09.11.2012 | www.gtai.com 19
The German PV Market - Grid-Parity in 2011
* Model calculation for rooftop systems >30 kWp, <100 kWp; based on 802 kWh/kWp (Frankfurt), 100% financing, 6% interest rate, 20 year term, 2% p.a. O&M costs
Sources: Feed-in Tariffs: BMU June 2012; System Prices: BSW 2012; System Price Forecast: EPIA 2011; Model Calculation: Deutsche Bank 2010; Electricity Prices 2007-2011: Eurostat 2012 [Private households with annual consumption >2500 kWh, <5000 kWh]; Electricity Price Forecast 2011-2015: Prognos 2012 [Price Forecat 2016: 28,20 €ct./kWh]
“… PV can develop within a few years from the most expensive to one of the cheapest types of power generation from renewables.” (BMU 2011)
EEG Amendement April 2012
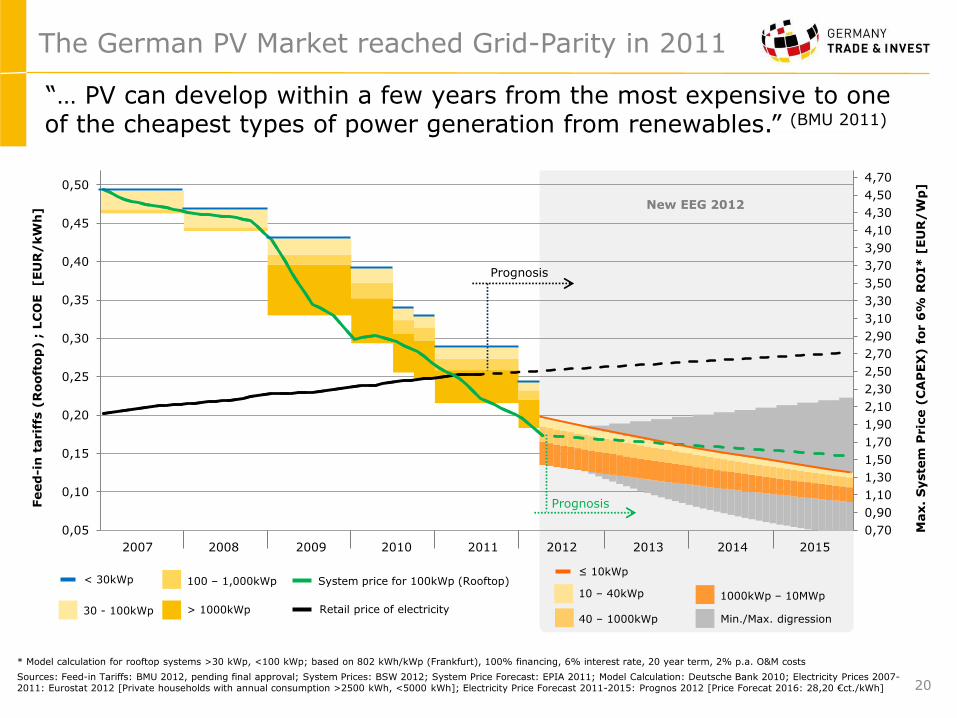
09.11.2012 | www.gtai.com 20
The German PV Market reached Grid-Parity in 2011
* Model calculation for rooftop systems >30 kWp, <100 kWp; based on 802 kWh/kWp (Frankfurt), 100% financing, 6% interest rate, 20 year term, 2% p.a. O&M costs
Sources: Feed-in Tariffs: BMU 2012, pending final approval; System Prices: BSW 2012; System Price Forecast: EPIA 2011; Model Calculation: Deutsche Bank 2010; Electricity Prices 2007-2011: Eurostat 2012 [Private households with annual consumption >2500 kWh, <5000 kWh]; Electricity Price Forecast 2011-2015: Prognos 2012 [Price Forecat 2016: 28,20 €ct./kWh]
System price for 100kWp (Rooftop) < 30kWp
> 1000kWp Retail price of electricity
100 – 1,000kWp
30 - 100kWp
Feed
-in
tarif
fs (
Rooft
op
) ;
LC
OE [EU
R/
kW
h]
2007 2008 2009 2010 2011 2012 2013 2014 2015
Max.
Syste
m P
ric
e (
CA
PEX
) f
or 6
% R
OI*
[EU
R/
Wp
]
Min./Max. digression
1000kWp – 10MWp
≤ 10kWp
New EEG 2012
40 – 1000kWp
10 – 40kWp
0,70
0,90
1,10
1,30
1,50
1,70
1,90
2,10
2,30
2,50
2,70
2,90
3,10
3,30
3,50
3,70
3,90
4,10
4,30
4,50
4,70
4,90
0,05
0,10
0,15
0,20
0,25
0,30
0,35
0,40
0,45
0,50
0,55
Prognosis
Prognosis
“… PV can develop within a few years from the most expensive to one of the cheapest types of power generation from renewables.” (BMU 2011)

09.11.2012 | www.gtai.com 21
The Principle of „Own-Consumption“
Wattage
Time of day
0h 3h 6h 9h 12h 15h 18h 21h 24h
Feed-in tariff: 13.50 to 19.50 €ct/kWh1
Energy from grid: Costs ~25 €ct/kWh2
Major income through cost savings on electricity from the grid, Feed-in tariff only for surplus electricity:
PV Energy
Energy Demand
„Own-Consumption“ of PV Energy
(saves ~25 €ct./kWh²)
Notes: 1) Depending on size of system according to feed-in tariff classification | 2) Depending on electricity retail price of respective utility company.
09.11.2012 | www.gtai.com 21
09.11.2012 | www.gtai.com 22
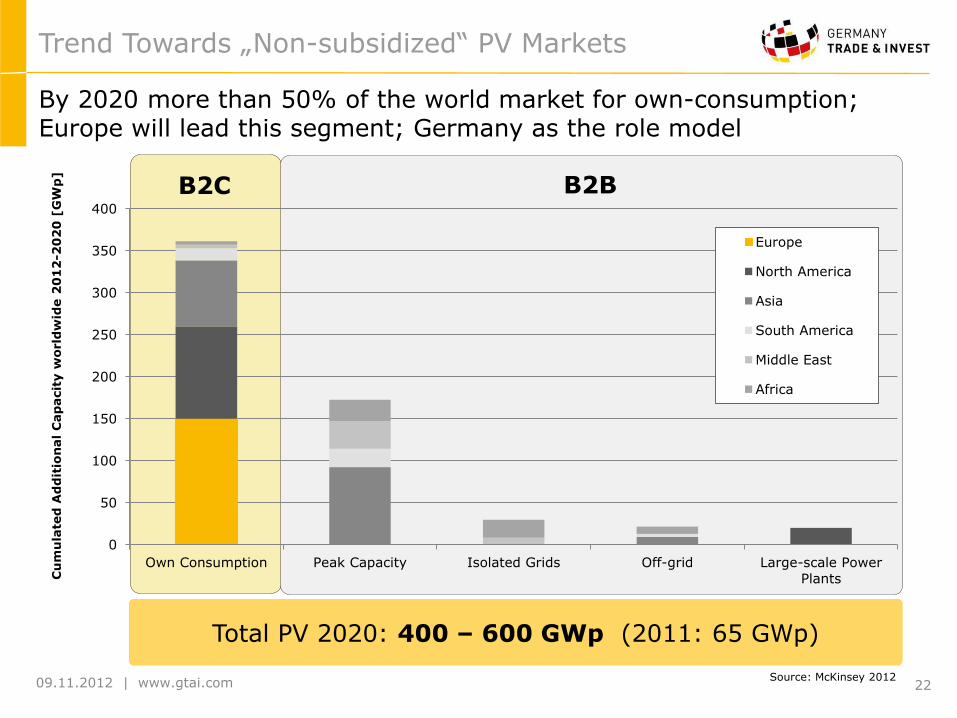
By 2020 more than 50% of the world market for own-consumption; Europe will lead this segment; Germany as the role model
Trend Towards „Non-subsidized“ PV Markets
B2C B2B
Cu
mu
late
d A
dd
itio
nal
Cap
acit
y w
orld
wid
e 2
01
2-2
02
0 [
GW
p]
0
50
100
150
200
250
300
350
400
Own Consumption Peak Capacity Isolated Grids Off-grid Large-scale Power
Plants
Europe
North America
Asia
South America
Middle East
Africa
Source: McKinsey 2012
Total PV 2020: 400 – 600 GWp (2011: 65 GWp)

www.gtai.com
I. Germany´s Energy Transformation
II. Renewable Energies in Germany
Wind
Solar
Biomass
III. Related business fields
Grid expansion, Storage, Smart Metering
Agenda
09.11.2012 23
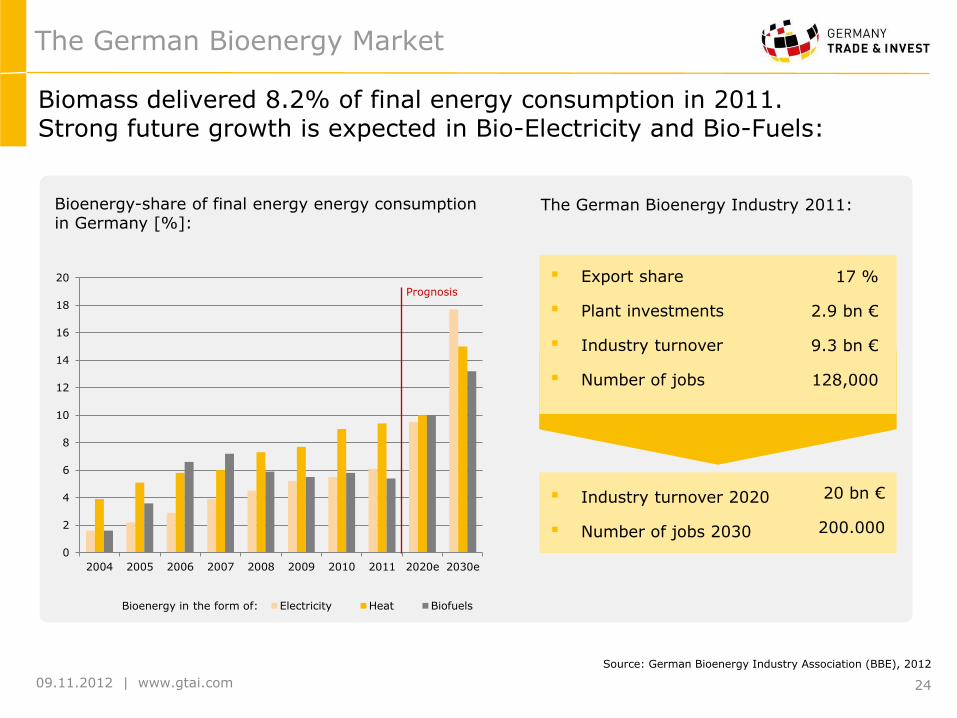
09.11.2012 | www.gtai.com 24
Biomass delivered 8.2% of final energy consumption in 2011. Strong future growth is expected in Bio-Electricity and Bio-Fuels:
Bioenergy-share of final energy energy consumption in Germany [%]:
The German Bioenergy Market
Source: German Bioenergy Industry Association (BBE), 2012
Bioenergy in the form of:
0
2
4
6
8
10
12
14
16
18
20
2004 2005 2006 2007 2008 2009 2010 2011 2020e 2030e
Electricity Heat Biofuels
Prognosis
▪ Export share
▪ Plant investments
▪ Industry turnover
▪ Number of jobs
17 %
2.9 bn €
9.3 bn €
128,000
The German Bioenergy Industry 2011:
▪ Industry turnover 2020
▪ Number of jobs 2030
20 bn €
200.000

09.11.2012 | www.gtai.com 25
0
1000
2000
3000
4000
5000
6000
7000
8000
0
500
1000
1500
2000
2500
3000
3500
4000
4500
Num
ber
of
pla
nts
(centr
al bar)
Insta
lled e
lectr
ical capacity (
Mw
el)
63%
32%
7%
Biogas plant
Biomass combustion plant
Vegetable Oil (heating) power plant
Bioenergies in Germany
Structure of biomass-based electricity supply in Germany in 2010:
Total electricity generation (net) of
biomass 2010: ca. 25,7 TWhel
Source: German Ministry for Environment (BMU), 2012
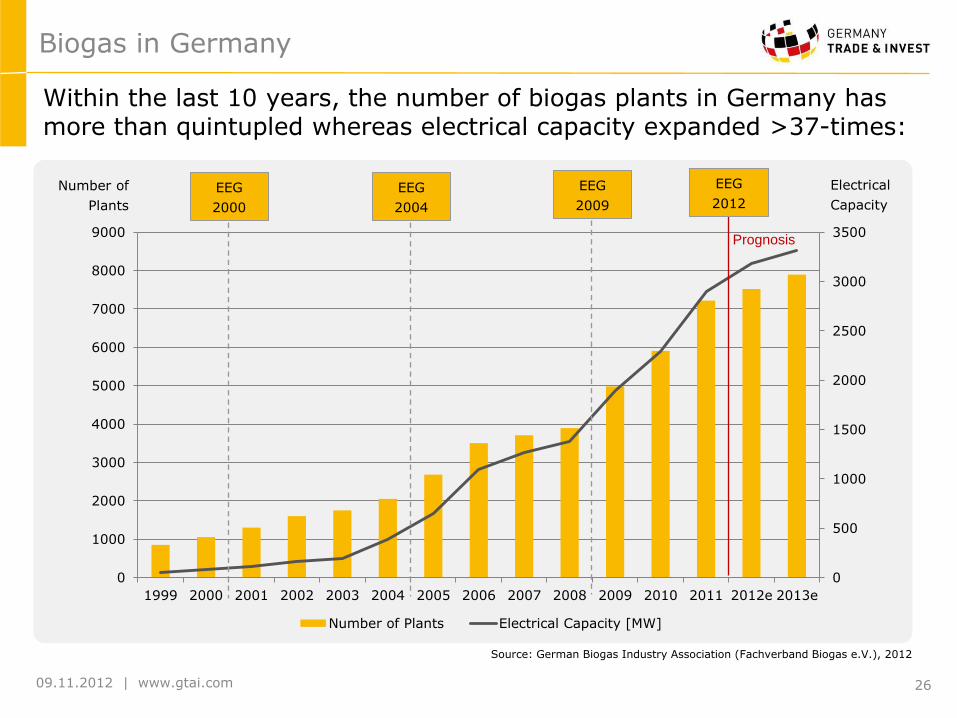
09.11.2012 | www.gtai.com 26
0
500
1000
1500
2000
2500
3000
3500
0
1000
2000
3000
4000
5000
6000
7000
8000
9000
1999 2000 2001 2002 2003 2004 2005 2006 2007 2008 2009 2010 2011 2012e 2013e
Number of Plants Electrical Capacity [MW]
Source: German Biogas Industry Association (Fachverband Biogas e.V.), 2012
Within the last 10 years, the number of biogas plants in Germany has more than quintupled whereas electrical capacity expanded >37-times:
Prognosis
Number of
Plants
Electrical
Capacity
EEG
2004
EEG
2009
EEG
2012 EEG
2000
Biogas in Germany
09.11.2012 | www.gtai.com 27
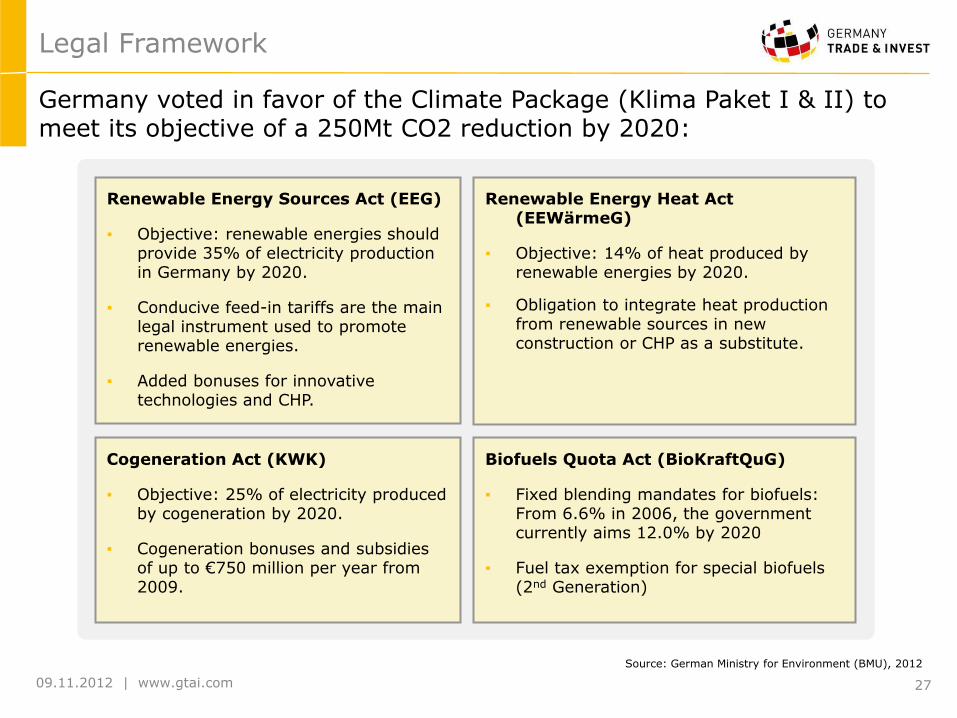
Legal Framework
Germany voted in favor of the Climate Package (Klima Paket I & II) to meet its objective of a 250Mt CO2 reduction by 2020:
Renewable Energy Sources Act (EEG)
▪ Objective: renewable energies should provide 35% of electricity production in Germany by 2020.
▪ Conducive feed-in tariffs are the main legal instrument used to promote renewable energies.
▪ Added bonuses for innovative technologies and CHP.
Renewable Energy Heat Act (EEWärmeG)
▪ Objective: 14% of heat produced by renewable energies by 2020.
▪ Obligation to integrate heat production from renewable sources in new construction or CHP as a substitute.
Cogeneration Act (KWK)
▪ Objective: 25% of electricity produced by cogeneration by 2020.
▪ Cogeneration bonuses and subsidies of up to €750 million per year from 2009.
Biofuels Quota Act (BioKraftQuG)
▪ Fixed blending mandates for biofuels: From 6.6% in 2006, the government currently aims 12.0% by 2020
▪ Fuel tax exemption for special biofuels (2nd Generation)
Source: German Ministry for Environment (BMU), 2012

09.11.2012 | www.gtai.com 28
No. Name Ort
Agro
nom
y
Fore
str
y
Oth
er
bio
m.
resourc
es
Bio
fuels
1G
Bio
fuels
2G
Com
bustion
engin
es
Bio
mass
com
busiton
Bio
gas
Gasific
ation
Bio
mass fuel
cells
CH
P
technolo
gie
s
1 ATZ Entwicklungszentrum Sulzbach-Rosenberg x x x x
2 Fraunhofer UMSICHT Oberhausen x x x x
3 Fraunhofer ICT Pfinztal x
4 Federal Agricultural Research Center (FAL) Braunschweig x x
5 University of Frankfurt - Institut for Molecular Bio Sciences Frankfurt x
6 Leibniz Institut for Agricultural Engineering (ATB) Potsdam x x
7 Technical University Munich - Chair for Biogen Raw Material (TUM) Munich x x x
8 Research Center Karlsruhe Karlsruhe x
9 Institute for Wood Chemistry und Chemical Technology of Wood (BFH) Hamburg x x
10 Institute for Energy and Environment (IE Leipzig) Leipzig x x x x x x x x x
11 CUTEC-Institut GmbH Clausthal-Zellefeld x x
12 Deutsches Biomasse Forschungszentrum (DBFZ) Leipzig x x x x x x x x x
13 Technical University Freiberg Freiberg x x
14 Institute for Farm Management, Food Sciences and Biotechnology Stuttgart x x x
15 Institute of Crop Science (INK) Kassel x x
16 University of Applied Sciences in Eberswalde Eberswalde x x
17 Technologie- und Förderzentrum (TFZ) Straubing x x x x x x
18 RWTH Aachen - Tailor-Made Fuels from Biomass (TMFB) Aachen x x x
19 Öko-Institut Freiburg x x x x x
20 KTBL Darmstadt x x
21 Thüringer Landesanstalt für Landwirtschaft (TLL) Jena x x
22 ISET Hanau x x
23 C.A.R.M.E.N. Straubing x x x x x
24 Forschungs-und Studienzentrum Landwirtschaft und Umwelt (ZLU) Göttingen x
25 ZSW Stuttgart x x x x
26 Fachhochschule Weihenstephan Weihenstephan x
27 FNR Gülzow x x x x x
28 Johann Heinrich von Thünen-Institut für NawaRo (vTI) Braunschweig x x x x x
29 European Institute for Energy Research (EIFER) Karlsruhe x x x x x x
30 Fachhochschule Ingolstadt Ingolstadt x
31 Zentrum für nachwachsende Rohstoffe (ZNR) Bad Sassendorf x x x x x
32 Institut für Getreideverarbeitung GmbH (IGV) Nurthetal x
33 Fachhochschule Südwestfalen Soest x x x
34 Bioenergie Beratung Bornim GmbH Potsdam x x x
35 Kuratorium für Waldarbeit und Forsttechnik e.V. Groß-Umstadt x x
36 Wuppertal Institut Wuppertal x x x
37 Fachhochschule Flensburg - Institute for Chemical Technologies Flensburg x x x
38 Institut für Technikfolgenabschätzung und Systemanalyse (ITAS) Karlsruhe x x x x x x x x
39 Institut für Energie- und Umweltforschung Heidelberg GmbH (IFEU) Heidelberg x x x x
40 Institut für Maschinenmesstechnik und Kolbenmaschinen (IMKO) Magdeburg x x
41 HAWK - Hochschule für angewandte Wissenschaft und Kunst Hildesheim x x x x x
42 Nordwestdeutsche Forstliche Versuchsanstalt Göttingen x x
43 Landwirtschaftliches Technologiezentrum Augustenberg (LTZ) Augustenberg x x x
44 Pilot Pflanzenöltechnologie Magdeburg Magdeburg x
45 Forschungsstelle für Energiewirtschaft (FfE) Munich x
46 Institut für umweltgerechte Landbewirtschaftung (IfUL) Müllheim x x x x
47 Kompetenzzentrum Biomassenutzung Kiel x x x x
48 Fachhochschule Münster Steinfurt x x x
49 Universität Bonn Bonn x
50 Waldzentrum Münster Münster x x x
51 Fachhochschule Köln Köln/Gummersbach x x x x
52 Bundesforschungsantalt für Getreide-, Kartoffel- & Fettforschung Detmold x x x x
53 Brandenburgische Technische Universität Cottbus Cottbus x x x x
54 Hochschule Bremen Bremen x
55 Bremer Energie Institut Bremen x x x x
56 Technologie-Transfer-Zentrum Bremerhaven Bremerhaven x
57 Internationales Holzinstitut Dresden x x
58 Technische Universität Dresden - Institut für Energietechnik Freiberg x x x x x x
59 Institut für Forstwirtschaft Tharadt x
60 Internationales Hochschulinstitut Zittau (IHI) Zittau x x
61 Technische Universität Darmstadt Darmstadt x
62 Fachhochschule Nordhausen Nordhausen x x
63 Justus-Liebig-Universität Giessen Giessen x
64 Fachhochschule Gießen-Friedberg Giessen x
65 Universität Kassel Kassel x x x x
66 Philipps-Universität Marburg Marburg x x
67 Humboldt-Universität Berlin Berlin x x x x x
68 Technische Universität Berlin Berlin x x x x x
69 Leibnitz-Zentrum für Agrarlandforschung (ZALF) Müncheberg x
70 Technische Fachhochschule Wildau Wildau x
71 Institut für ökologische Wirtschaftsforschung (IÖW) Berlin x
72 Technische Universität Kaiserslautern Kaiserslautern x x
73 University of Applied Sciences Bingen (FH-Bingen) Bingen x x x x
74 Institut für Mikrotechnik Mainz GmbH (IMM) Mainz x
75 Fachhochschule Trier - InfAR/IfaS/Fuel Cell Centre Rhineland-Palatinate Trier/Birkenfeld x x x x x x x x x
76 RLP Agroscience GmbH Neustadt a.d.W. x x x
77 Prüf- und Forschungsinstitut Pirmasens e.V , PFI Pirmasens x x x
78 Institut für ZukunftsEnergieSysteme (IZES) Saarbrücken x x x x
…by collaborating with first-class Bioenergy R&D institutes:
The Development of Cutting-edge Technologies
STUTTGART
MUNICH
HANOVER
DÜSSELDORF
BREMEN
BERLIN
DRESDEN
FRANKFURT
1 14 23
22
8
19
5
9
7
2
4
21
11
10
12
3
13
6
15
16
18
20
17
24
25
26
27
28
29 30
31
32
33
35
36
37
38
39
40 34
41
42
43
44
45
46
47
48
49
50
51
52 53
54 55
56
57
58 59
60
61
62
63 64
65
66
67 68 69
70
71
72
73 74 75
76
77 78
www.gtai.com
I. Germany´s Energy Transformation
II. Renewable Energies in Germany
Wind
Solar
Biomass
III. Related Business Fields
Grid Expansion, Storage, Smart Metering
Agenda
09.11.2012 29

09.11.2012 | www.gtai.com
Power balance 2012
New power structure in 2022 will lead to bottle necks in Germany
Offshore- Wind parks
Grid Expansion
Power balance 2022
Source: Netzentwicklungsplan 2012
30

09.11.2012 | www.gtai.com
Grid Expansion
Expansion requirements for the transmission and distribution grid
Grid expansion of 3,800km (2100km DC, 1700 AC) is required by 2020.
Baseline scenario with overhead lines requires:
20 bn. €
The connection of the offshore-grid is estimated to
10-12 bn. €
Transmission grid
By 2030, the expansion of the distribution grid requires investments of
€ 25 bn
Distribution grid
31
Sources: VKU, 2012; Netzentwicklungsplan 2012

09.11.2012 | www.gtai.com
State of the art 2040
PV - Own consumption 0.4% of the overall generated PV power is used for own consumption
2025: 20% of PV generated power for own consumption (35% in 2040).
Control reserve Required control reserve of ~14-17 GW
In 2025 the demand for control reserve increases by 50% to 2010 and by 70% in 2040.
Surplus energy Storage demand for a surplus of 150 GWh (2010)
Storage necessity 2025-2030: 3.5-8 TWh 2040-2050: 40 TWh
Potential for Energy Storage in Germany
Sources: DB Research 2012, BCG 2011, DENA Netzstudie II 2011, BAFA, Bundesnetzagentur, BMU Leitstudie 2011
32
Expected: Investment of € 25 - 30 billion in storage capacity until 2030
09.11.2012 | www.gtai.com
Intelligent Grids and Metering - EnWG
In 2011, the German Federal Law on the Energy Industry (EnWG) was
supplemented by specifications for metering elements e.g. smart meters,
smart meter installations and requirements (§ 21b, § 21d, § 21e, § 21 f, §
21i)
Smart meters are obligatory for: new constructions and complete
refurbishments, consumer loads of over 6000 kWh/Year and plant
operators under the renewable energy act (EEG) and in accordance with the
cogeneration act (KWKG) of over 7 KW (§ 21c para. 1 and 2 EnWG)
-> this would require the change of 3,5 million meters (Germany total: 43
million meters)
Smart meter legal amendment and roll-out in Germany
33

09.11.2012 | www.gtai.com
Source: Own draft according to Frost & Sullivan 2011
Expected Smart Meter Roll-Out in Germany
The market is expected to grow substantially with overall CAGR of 71.7% from 2010-
2017
2007 2008 2009 2010 2011 2012 2013 2014 2015 2016 2017
Revenues (€ Mio.) 1 3 12 17 23 33 162 409 499 721 731
Units 0,01 0,02 0,1 0,14 0,2 0,3 1,5 4 5,2 8,2 9
0
1
2
3
4
5
6
7
8
9
10
0
100
200
300
400
500
600
700
800
Un
its (
millio
n)
Reven
ue (
€ m
illio
n)
Revenues (€ Mio.)
Units
Smart meter market: unit and revenue forecast Germany
34
09.11.2012 | www.gtai.com
Automotive Clusters Focus
1 Transport Technology Systems Network new drive systems and e-mobility, et al. 2 Center for Transportation & Logistics Neuer Adler logistics, telematics, automotive, drive systems 3 NoAE Network of Automotive Excellence infotainment, navigation, CO2 reduction, construction 4 ITS Niedersachsen communication- and driver assistance systems, et al. 5 SafeTRANS embedded systems 6 Automotive Competence Bergisches City Triangle concept vehicle "EVE“, et al. 7 Competence Center Automotive CAR vehicle systems, electronic components 8 Mobile & Satellite Communication Technology automotive wireless-communications 9 GEOkomm networks geo-data infrastructures, et al.
Model Regions for E-mobility
1 Model region Hamburg multimodal mobility offers 2 Model region Bremen/ Oldenburg personal mobility center, new traffic concepts 3 Model region Berlin/ Potsdam ÖPNV, tourism, city-logistics 4 Model region Rhein-Ruhr new mobility concepts in the private transportation 5 Model region Rhein-Main modular concepts to e-mobility lifestyles 6 Model region Saxony ÖPNV, especially hybrid buses 7 Model region Stuttgart infrastructure, business models, mobility concepts 8 Model region Munich EV-research, charging infrastructure
Model Regions for E-Energy
1 eTelligence – Model region Cuxhaven intelligent system integration 2 RegModHard – Model region Harz Smart Grids for EVs 3 E-DeMa – Model region Rhein-Ruhr decentralized energy systems 4 Smart Watts – Model region Aachen smart grid billing systems 5 Modellstadt Mannheim – Model region Rhein-Neckar virtual energy market place 6 MEREGIO – Model region Baden-Württemberg Grid integration of EVs
R&D-Projects for E-mobility ICT
1 eE-Tour Allgäu communication-enabled charging infrastructure 2 e-mobility charging-, control- and accounting infrastructure 3 Future Fleet renewable energy in smart grids 4 GridSurfer information- and communication systems 5 Harz.EE-mobility intelligent power grid control 6 MeRegioMobil mobile energy storage 7 Smart Wheels ICT-services for smart grid integration
2
3
4
5
6
7
9
3
4
5
2
6
1
6
3
2
1
3
1
4
5
7
2
8
6
8
1 4
5
7
Intelligent electric grid meets intelligent storage devices
Smart Grid Projects in Germany
Source: GTAI Research, 2009
35

www.gtai.com
Mumbai Office Tokyo Office
Berlin - Headquarters
Mr. Tobias Homann Senior Manager Photovoltaics T. +49 30 200 099-391 [email protected]
Mr. Thomas Grigoleit Director Renewable Energies & Resources T. +49 30 200 099-224 [email protected]
Mr. Tobias Rothacher Senior Manager Photovoltaics and Bioenergy T. +49 30 200 099-225 [email protected]
Contact Data – GTAI Investment Consulting
Mr. Markus Hempel China Representative Beijing, China T. +86 10 6539 6725 F. +86 10 6590 6167 [email protected]
North America
Europe
Asia-Pacific
© 2012 Germany Trade & Invest All information provided by Germany Trade & Invest has been put together with the utmost care. However, we assume no liability for the accuracy of the information provided.
Mr. Iwami Asakawa Japan Representative Tokyo, Japan T. +81 3 5275 2072 F. +81 3 5275 2012 [email protected]
Mr. Claus Habermeier Director New York, USA T: +1 212 584 9715 F: +1 212 262 6449 [email protected]
Ms. Angelika Geiger Director San Francisco, USA T: +1 415 248 1246 F: +1 415 627 9169 [email protected]
Ms. Flérida Regueira Cortizo Senior Manager Environmental Technologies T. +49 30 200 099-230 [email protected]
Ms. Asha-Maria Sharma India Representative Mumbai, India T. +91 22 66 65 21 80 [email protected]
New York Office San Francisco Office
Beijing Office
Renewable Energy and Resources Division:
Mr. Heiko Staubitz Senior Manager Energy Storage / Smart Grid T. +49 30 200 099-226 [email protected]
Mr. Jonas Rabe Manager Wind T. +49 30 200 099-228 [email protected]
Ms. Esther Frey Manager Wind T. +49 30 200 099-253 [email protected]
36 09.11.2012
Ms. Anne Bräutigam Manager Wind T. +49 30 200 099-228 [email protected]