renewable auction design in theory and practice · mme brazil’s ministry of energy and mines;...
TRANSCRIPT
April 2018
OIES Paper: EL 28
Renewable Auction Design in Theory and Practice: Lessons from the Experiences of Brazil and Mexico
Michael Hochberg &
Rahmatallah Poudineh
i
The contents of this paper are the authors’ sole responsibility. They do not
necessarily represent the views of the Oxford Institute for Energy Studies or any of
its members.
Copyright © 2018
Oxford Institute for Energy Studies
(Registered Charity, No. 286084)
This publication may be reproduced in part for educational or non-profit purposes without special
permission from the copyright holder, provided acknowledgment of the source is made. No use of this
publication may be made for resale or for any other commercial purpose whatsoever without prior
permission in writing from the Oxford Institute for Energy Studies.
ISBN 978-1-78467-106-8
DOI: https://doi.org/10.26889/9781784671068
ii
Renewable Auction Design in Theory and Practice: Lessons from the Experiences of Brazil and Mexico
Michael Hochberg
OIES- Saudi Aramco fellow, Oxford Institute for Energy Studies, Oxford, UK
Rahmatallah Poudineh
Lead Senior Research Fellow, Oxford Institute for Energy Studies, Oxford, UK
Abstract
Competitive tendering has become one of the preferred methods of contracting renewable energy
generation capacity internationally. As of early 2015, at least 60 countries had adopted renewable
energy tenders, compared to just six countries in 2005. However, there are limited country-specific
comparisons which research the subject considering the importance and prominence of the issue. The
aim of this study is to fill this research gap by examining the Brazilian and Mexican experiences in
developing renewables and how their tendering programmes interact with the market and institutional
frameworks in which they exist. Fundamentally, our study seeks to shed light on two simple questions:
what auction design issues may serve as barriers to renewable development, and how can auctions be
improved further? We provide a historical assessment of renewable and generation capacity
development policies in both Brazil and Mexico, review auction design and results in both countries,
and offer recommendations for the future design and implementation of renewable energy policy tools,
and auctions in particular.
Keywords: Renewable auction, auction design, electricity market, renewable policy, Brazil, Mexico

iii
Acknowledgement
The authors of this paper are thankful to David Robinson from OIES, Rolando Fuentes of the King
Abdullah Petroleum Studies and Research Center, Jim Heidell of PA Consulting Group and Alexandre
Viana Pacific Hydro for their invaluable comments and insights on the earlier version of this paper.
iv
Glossary
ACL Brazil’s Free Contracting Environment; Ambiente de Contratação Livre
ACR Brazil’s Regulated Contracting Environment; Ambiente de Contratação Regulada
ANEEL Brazil’s National Agency of Electric Energy; Agência Nacional de Energia Elétrica
AURES Auctions for Renewable Energy Support
BNDES Brazilian Development Bank; Banco Nacional do Desenvolvimento
CC Mexico’s Compensation Chamber; Cámara de Compensación
CCEE Brazil’s Market Operator; Câmara de Comercialização de Energia Elétrica
CELs Clean Energy Certificates; Certificados de Energía Limpia
CENACE Mexico’s National Center for Energy Control; Centro Nacional de Control de
Energía
CFE Mexican Federal Electricity Commission; Comisión Federal de Electricidad
CMSE Brazil’s Electricity Sector Monitoring Committee; Comitê de Monitoramento do
Setor Elétrico
COD Commercial Operation Date
CRE Mexican Energy Regulatory Commission; Comisión Reguladora de Energía
EPE Brazil’s Energy Research Company; Empresa de Pesquisa Energética
FECs Firm Energy Certificates; Garantias Fisicias
FiT Feed in Tariff
IPP Independent Power Producer
IRENA International Renewable Energy Agency
kW Kilowatt
LAERFTE Law for the Development of Renewable Energy and Energy Transition Financing;
Ley para el Aprovechamiento de Energías Renovables y el Financiamiento de la
Transición Energética
LCOE Levelised Cost of Energy
LMP Locational Marginal Price
LSE Load Serving Entity
LSPEE Public Electricity Service Law; Ley del Servicio Público de Energía Eléctrica
MDA Day Ahead Market; Mercado del Día en Adelanto
MEM Mexico’s Wholesale Electricity Market; Mercado Eléctrico Mayorista
MME Brazil’s Ministry of Energy and Mines; Ministério de Minas e Energia
MW Megawatt
MWh Megawatt hour
v
OFTO Offshore Transmission Owner
ONS Brazil’s National Electric System Operator; Operador Nacional do Sistema
Elétrico
PROINFA Incentive Program for Alternative Electricity Sources; Programa de Incentivo às
Fontes Alternativas de Energia Elétrica
SENER Mexico’s Secretary of Energy; Secretaría de Energía
SRMC Short Run Marginal Cost
TSO Transmission System Operator
vi
Contents
Abstract .................................................................................................................................................. ii
Acknowledgement ............................................................................................................................... iii
Glossary ................................................................................................................................................ iv
Contents ................................................................................................................................................ vi
Figures and Tables ............................................................................................................................. vii
1. Introduction ....................................................................................................................................... 1
2. Electricity Auction Design................................................................................................................ 2
2.1 Electricity auctions in context ........................................................................................................ 2
2.2 Auction design ............................................................................................................................... 4
2.2.1 Auction classifications ............................................................................................................. 4
2.2.2 Auction and bid design options ............................................................................................... 5
2.2.3 Technology-specific, multi-technology and technology-neutral auctions ............................... 6
2.2.4 Auction products ..................................................................................................................... 7
2.2.5 Auction volume ....................................................................................................................... 8
2.2.6 Auction frequency ................................................................................................................... 9
2.2.7 Lead time between auctions and commercial operation date ................................................ 9
2.2.8 Auction prequalification and penalties .................................................................................. 10
2.2.9 Grid connections ................................................................................................................... 11
2.2.10 Balancing responsibilities ................................................................................................... 12
2.2.11 Curtailment risk ................................................................................................................... 12
3. Brazil and Mexico: power sectors in context ............................................................................... 12
3.1 Power reform and Brazil’s path to competitive tendering ........................................................... 14
3.1.2 Privatisation .......................................................................................................................... 15
3.1.3 Thermal Priority Program ...................................................................................................... 15
3.1.4 Incentive Programme for Alternative Electricity Sources (PROINFA) .................................. 16
3.1.5 Brazil’s second power market reform: introduction of competitive auctions ......................... 17
3.2 Overview of Brazil’s auctions and wholesale power market ....................................................... 17
3.3 Electricity auction design in Brazil ............................................................................................... 19
3.3.1 Prequalification and bid bonds.............................................................................................. 19
3.3.2 Bidding .................................................................................................................................. 20
3.3.3 Volume setting ...................................................................................................................... 21
3.3.4 Special provisions for renewables ........................................................................................ 21
3.3.5 Penalties and compensations for over- and underproduction .............................................. 21
3.3.6 Penalties for delays and non-completion .............................................................................. 22
3.4 Mexico’s path to competitive tendering ....................................................................................... 22
3.4.1 The Mexican Energy Reform ................................................................................................ 23
3.5 Overview of Mexico’s auctions and wholesale power market..................................................... 23
3.5.1 Nodal Market and Auctions for financial transmission rights (FTRs) .................................... 24
3.5.2 Market Participants ............................................................................................................... 24
3.5.3 Short-term energy market ..................................................................................................... 25
3.5.4 Capacity market .................................................................................................................... 25
3.5.5 Clean energy certificate market ............................................................................................ 25
3.5.6 Mid-term energy auctions ..................................................................................................... 26
3.5.7 Long-term energy auctions ................................................................................................... 26
3.6 Electricity auction design in Mexico ............................................................................................ 27
3.6.1 Prequalification and bid bonds.............................................................................................. 27
3.6.2 Bidding process .................................................................................................................... 28
3.6.3 Locational pricing .................................................................................................................. 29
3.6.4 Special provisions for renewables ........................................................................................ 29
3.6.5 Penalties and compensations ............................................................................................... 30
vii
4. Evaluating electricity auction design ............................................................................................ 30
4.1 High-level assessment of auctions ............................................................................................. 30
4.1.1 Brazil’s experience summarised ........................................................................................... 31
4.1.2 Mexico’s experience summarized ........................................................................................ 33
4.1.3 Areas for improvement ......................................................................................................... 35
5. Recommendations and considerations ........................................................................................ 36
5.1. Pricing rules ............................................................................................................................... 36
5.1.1 Pay-as-bid vs. uniform pricing .............................................................................................. 36
5.2 Technology-specific, multi-technology and demand response participation in auctions ............ 40
5.2.1 Brazil ..................................................................................................................................... 41
5.2.2 Mexico ................................................................................................................................... 41
5.2.3 Demand response as an eligible auction participant ............................................................ 42
5.3 Determining auction product(s) ................................................................................................... 42
5.3.1 Brazil ..................................................................................................................................... 42
5.3.2 Mexico ................................................................................................................................... 43
5.4 Determining auction frequency, volume and lead time between auctions and commercial
operation ........................................................................................................................................... 43
5.4.1 Frequency and volume ......................................................................................................... 43
5.4.2 Volume setting ...................................................................................................................... 45
5.4.3 Lead time .............................................................................................................................. 45
5.5 Penalties ..................................................................................................................................... 46
5.6 Grid connection regulatory model ............................................................................................... 47
6. Conclusions ..................................................................................................................................... 47
References ........................................................................................................................................... 49
Figures and Tables
Figure 1: Representation of basic auction classifications ....................................................................... 5 Figure 2: Representation of Technology Participation Trade-Offs.......................................................... 7 Figure 3: Auction Design Foundations Pyramid ................................................................................... 14 Figure 4: Brazil’s market design for long-term electricity auctions........................................................ 19 Figure 5: Auction administration ........................................................................................................... 19 Figure 6: Contracts between generators and load serving entities via the Compensation Chamber... 27 Figure 7: Representation of economic surplus factor used in bid selection ......................................... 28 Figure 8: Auction prices in Brazil .......................................................................................................... 32 Figure 9: Sum of global horizontal irradiation per year in Mexico ......................................................... 35
Table 1: Auction characteristics summary ............................................................................................ 31 Table 2: Pricing from Brazil’s December 2017 long-term electricity auctions ....................................... 32 Table 3: Accepted purchase bid summary of Mexico’s third long-term auction (A3)............................ 34
1
1. Introduction
Auctions provide governments with a market-based framework and an efficient allocation tool to meet
policy objectives such as renewable deployment, tariff reduction, reliability improvements, carbon
emissions control, economic development and increased foreign investment. While a variety of policies
exist to promote the development of renewable energy, competitive auctions1 have emerged as a
preferred policy for utility-scale renewable energy development. Auctions can be designed to result in
procurement of a specific quantity of electricity (or capacity to be built) at a strike price. Renewable
procurement schemes can also be designed with a fixed budget, allowing quantity to be determined by
the market. Auction volume can be set in a number of ways. In Mexico, volume is set by demand
according to the quantities submitted in purchase bids; similarly, in Brazil’s principal auctions, it is set
by the distribution companies which pool together demand to determine total auction volume.
This approach to renewable procurement is often called a reverse auction as lowest-priced bids are
most competitive, with investors underbidding one another (per unit of electricity, capacity, and/or other
products) to win the right to develop their generation technology. To qualify for the auction, project
developers must meet specific predetermined criteria related to development experience, technical
specifications and financial standing. After bids are submitted, the offtaker (often a utility on behalf of
the government) accepts winning bids, usually based on price. Additional criteria can also be considered
when selecting winning bids, such as energy technology, local content and project location. Project
developers then have a timeline, often from two to five years (depending on the generation technology,
project size and market needs) to attain permitting and bring the project to commercial operation. The
competitive nature of auctions helps drive down prices, which are ultimately passed on to end users,
and the regulatory structure of auctions guarantees bidders with long-term contracts, which helps
facilitate financing by ensuring long-term revenue streams for project developers.2
Latin America has been a global leader in implementing these auctions, with Argentina, Belize, Brazil,
Chile, Costa Rica, El Salvador, Guatemala, Honduras, Mexico, Nicaragua, Panama, Peru and Uruguay
having developed electricity procurement tender programs (IRENA, 2016).3 While these countries have
gained experience in auction design, implementation and renewable deployment to meet policy
objectives, specific tendering structures tend to vary significantly from auction to auction, often even
within the same country. The need to learn from the past and evaluate the successes and failures of
these auctions is ongoing, and necessary to address the degree to which auctions satisfy government
policy objectives and societal needs. While at least 13 Latin American nations have experience with
renewable development through competitive tendering, for the purposes of this study, Brazil and Mexico
will be the countries of focus. They are the region’s largest economies, with the largest populations, and
also lead in hydrocarbon production, installed power generation capacity and CO2 emissions. Brazil
and Mexico are also the top regional destinations for renewable energy investment (IRENA, 2016).
Brazil was the first country to introduce both long-term electricity auctions (2004) and renewable specific
auctions (2007) replacing its feed in tariff (FiT) scheme. Mexico, on the other hand, is one of the most
recent nations to implement auctions in general and for renewable support (2015). The two cases make
for an interesting point of comparison. As a pioneer, Brazil developed its auctions without an exact
1 A note on terminology: auctions, tenders, tendering and competitive procurement are used interchangeably in the literature on
renewable energy auctions. 2 Depending on the design, contracts with successful bidders can only guarantee the price but not purchase of electricity. This
depends on the electricity market structure. In non-liberalized or partially liberalized markets, successful bidders often sign a
Power Purchase Agreement (PPA) with an offtaker utility. In some European countries, on the other hand, successful bidders
are responsible for selling their electricity in the wholesale market. If sold, they are often entitled to a guaranteed fixed payment
irrespective of market price (sometimes on top of market price). 3 In March 2018, Colombia’s Ministry of Mines and Energy issued a decree permitting the long-term contracting of renewable
energy, setting the legal framework for the introduction of renewable energy auctions.
2
reference model, while Mexico enjoyed a last-mover advantage, with the choice of many international
cases on which to base its auctions.
There is considerable academic literature on renewable energy policy in Latin America, some of which
has focused on history, policy, market structures, procurement mechanisms and environmental features
of conventional and renewable power in Brazil and Mexico. There is also practitioner literature, mostly
from professional service firms, which focuses on country-specific corporate strategy and investment
opportunities. Building on these foundations, this paper provides a comparison of the experiences of
the two nations in developing schemes for generation capacity procurement, with a focus on auctions
and renewable energy in particular. To our knowledge, this work is the first academic study which
compares electricity auction design as it relates to renewable energy development exclusively in Brazil
and Mexico. As Mexico’s electricity auctions began in 2016, this is also perhaps the first academic study
that provides a detailed yet broad evaluation of Mexico’s electricity auction design and wholesale market
structure. This paper complements other publications related to renewable energy and competitive
tendering in Latin America as a whole, and country studies focused exclusively on either Brazil, or
Mexico.
We aim to offer insight into the current functioning of wholesale electricity markets and long-term
procurement auctions in Brazil and Mexico, and the issues and options for auction design in these
countries, with a particular focus on renewables. However, as renewable generation often competes
with conventional technologies in auctions, and all generation technologies operate within the same
market contexts and wholesale markets, the paper discusses electricity auctions in general, as well as
renewable specific mechanisms and auctions. This report also aims to provide a solid informational
foundation for deeper research into the specific market mechanisms and topics discussed in this paper.
Section 2 outlines the fundamentals of electricity auctions design, explaining the features of salient
design elements and their associated trade-offs. Section 3 of the study outlines the Brazilian and
Mexican experiences in the power sector reform that have led to competitive generation and tendering.
This assessment is necessary to fully understand auction design, its influences, and the contextual
factors which facilitate or preclude specific design features. Section 3 also evaluates the current
structure and functioning of the wholesale power markets in each country, and auction design in Brazil
and Mexico. Section 4 briefly examines the effectiveness of the auctions in terms of meeting
government objectives and fulfilling societal needs. Section 5 makes recommendations in terms of
auction administration and design, providing suggestions to help correct deficiencies. Section 6
concludes.
2. Electricity Auction Design
2.1 Electricity auctions in context
In the liberalised electricity markets, reverse tendering for long-term contracts is the result of regulatory
intervention often implemented in response to the absence of efficient short-term market price signals
(in non-liberalised markets it is a step forward to introduce market mechanism for generation
investment). Liberalised markets were initially designed with the expectation that market price signals
alone encourage sufficient long-term investment in generation and coordination of an adequate
generation mix. Roques and Finon (2017) provide several reasons why the market cannot always
deliver adequate supply in the long-term.
The foundations of the security of supply issue are rooted in two phenomena. First, a lack of price-
reactive demand (Roques and Finon, 2017). The fundamental need for scarcity pricing is created by
the current limited ability of electricity consumers to react to real time spot market prices (Cramton,
2017). Access to real time electricity prices in the context of a well-designed demand response
programme would, in theory, increase the price elasticity of demand. Such a situation would in turn
allow consumers to react more quickly to reduce demand peaks and avoid extreme peaks. Second, the
readiness with which policymakers adopt security of supply measures (i.e. reserve margin) creates
3
uncertainty around the belief that the (energy only) market is capable of meeting administratively set
security of supply requirements and providing resource adequacy on its own (Roques and Finon, 2017).
More specifically, the “missing money” problem presents a major issue with respect to security of
supply. Spot market price caps to prevent electricity prices which are perceived as unacceptably high
(usually for political reasons, to help mitigate market power or to support other policy goals) can lead to
revenue shortages for generators, which may depend on price spikes to recover large portions of their
fixed costs. Even in cases without price caps, generators may be disinclined to depend entirely on short-
term markets to recover fixed and variable costs and earn a rate of return on large capital investments.
These issues are compounded by increasing penetration of zero marginal cost intermittent renewable
energy generation, which increases price volatility in the short-term markets, especially at peak demand
and for peaking units. In addition to long-term security of supply, Roques and Finon (2017) suggest that
short-term energy prices may be insufficient to support decarbonisation objectives and an adequate
generation mix.4 They contend that ‘out-of-market’ mechanisms within the hybrid market5 may help
provide long-term risk sharing to lower the cost of capital and hurdle rates for investors, and encourage
a more diverse generation mix. They also note that emerging economies have been quicker to adopt
long-term arrangements, due to the stronger need for capacity investment when compared to developed
economies.
The inefficiency of short-term markets in providing long-term investment signals is amplified for
renewable technologies, due to intermittency and the inverse relationship between renewable dispatch
and wholesale power prices. When renewable generators sit idle and baseload generation is relatively
low, wholesale power prices are likely to rise, yet renewable generators will not claim these high prices
if they are not available for dispatch. Yet when weather conditions permit high penetration of renewable
energy dispatch, the low marginal cost of renewable technologies will cause peaking plants and some
generation technologies with higher marginal costs to be uncompetitive on that particular dispatch
curve. Accordingly, renewable technologies claim the unit on the margin of the dispatch curve which
sets the marking clear price, which is lower during times of significant renewable production. Long-term
electricity auctions therefore represent an important complement to short-term markets and have
become increasingly popular as a means of coordinating and ensuring resource adequacy through a
competitive, albeit interventionist mechanism. For renewables in particular, isolation from short-term
markets through long-term power purchase agreements (PPA) helps facilitate project financing and
reduces the cost of capital, which should translate into lower power costs.6
As a result of these issues, auctions have become increasingly popular, and have proven effective in
stimulating competitive resource allocation and price formation through systematic procurement
frameworks. While resources are expended on the part of buyers in preparing bids, and on the part of
governments in establishing regulatory support regimes and tender rules, auctions provide a structure
to answer a simple yet significant question, which Rego and Parente (2013) express as “who gets the
goods, and at what price?” The ‘goods’ in electricity auctions can be energy (MWh), capacity (MW),
certificates to support clean energy or other policy goals, financial transmission rights and ancillary
services.
Electricity auctions could encourage aggressive pricing among project developers eager to take
advantage of public tendering to enter new geographies, or to expand their presence in existing
markets. For example, Mexico’s second generation procurement auction produced record-low prices
regionally with an average of $33/MWh for solar, $36/MWh for wind, and $33.47/MWh as the overall
average for all clean energy technologies. Its third auction resulted in even lower prices, with energy +
4 The scope of this paper does permit the detailed evaluation of this subject, which is covered in the literature. 5 Hybrid markets combine traditional short-term markets with a long-term component (i.e. competitive tenders). 6 Interventionist policies, however, may adversely impact the short-term market and the ability of existing conventional generators
to recover all of their fixed costs.
4
clean energy certificates clearing at an average price of just over $20/MWh. In one of Brazil’s most
recent auctions, wind averaged prices of less than $30/MWh. As a consequence of low price outcomes
internationally, FiT schemes are being replaced by auctions. The number of countries with FiTs fell 22
percent from 2014 to mid-2016 (Warren, 2016).
The types of auctions employed and specific design elements within each auction category can produce
wide-ranging outcomes. In addition to pricing, auction design affects the diversity of market participants,
project realisation rates, and determines which energy technologies are developed. Design shapes the
geographical distribution of projects and the level of local economic development, among other
important results. Auction type and design also determine the likelihood of collusive behaviour and
predatory practices within the auctions.
Design elements interact with one another, creating continual trade-offs between reducing the likelihood
of unwanted outcomes and achieving auction success.7 For example, severe noncompliance penalties
or large bid bonds may increase the probability that winning projects are built; however, they also may
reduce the number of participating bidders and increase the risk premium on the cost of capital, leading
to less competitive bidding and higher electricity prices. Design elements also interact with the larger
market and policy frameworks in which auctions exist. For example, if project developers are required
to submit bids according to their short run marginal cost of generation, does the wholesale market have
sufficient mechanisms for capacity or ancillary services to cover fixed costs for generators?
Alternatively, if generators bid on their long-run marginal costs or levelised cost of energy (LCOE), does
it lead to foreclosure of short-term markets?
2.2 Auction design
It is necessary to review the principal auction design concepts that impact results, beginning with the
types of auctions used for electricity procurement.
2.2.1 Auction classifications
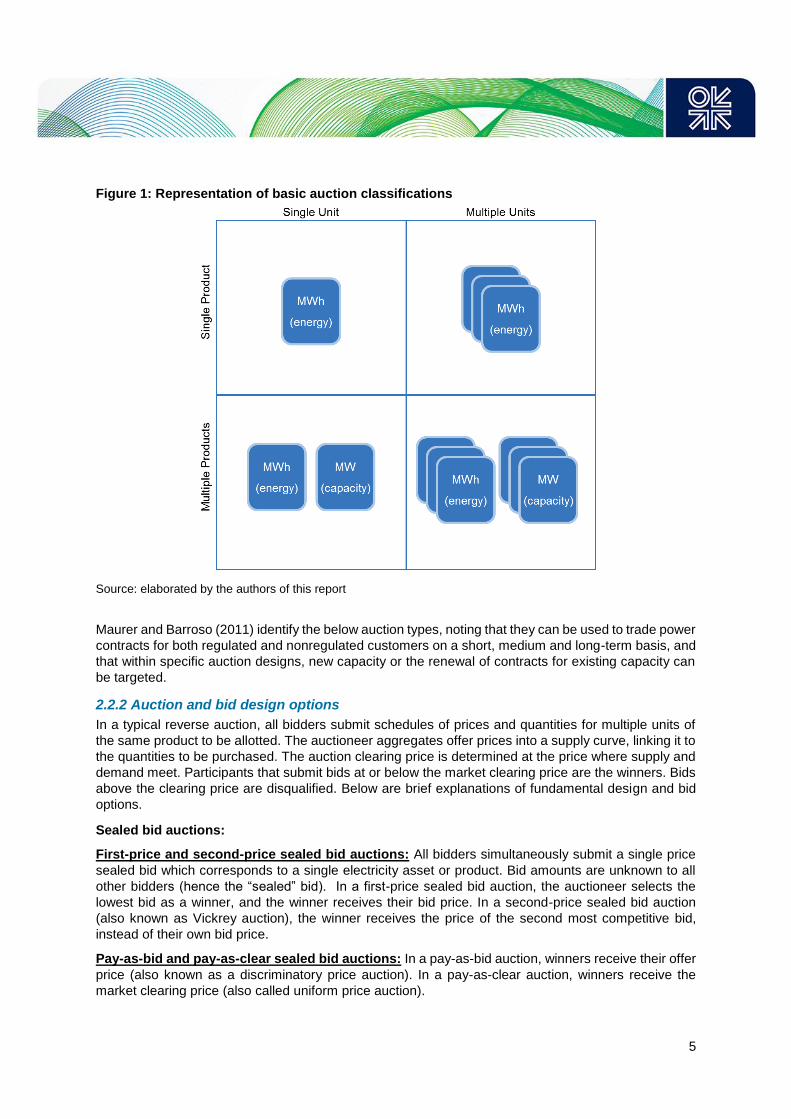
As seen in Figure 1 below, auctions can be single-unit or multi-unit, meaning that either a single project
or multiple projects are awarded to satisfy auctioned demand. At the same time, auctions are either
single product or multiple product contests, depending on the number of distinct products offered in the
auction. Single-unit, single product auctions are the simplest and easiest to design and participate in,
yet in terms of renewables deployment, they offer less opportunity for new capacity development and
complementary products. Multi-unit, multiple product auctions afford more opportunity for significant
renewable capacity development and contributory products, yet are more complex for both the
auctioneer in terms of design and implementation, and for bidders in terms of participation. Importantly,
this auction design decision has significant implications for the most efficient clearing rules, in terms of
using a pay-as-bid method (also known as discriminatory pricing) or applying a pay-as-clear scheme
(also known as uniform pricing). This issue is discussed in detail in the conclusions section of this paper.
7 An auction is successful if it achieves efficient price discovery (prices that reflect costs plus a reasonable rate of return) and the
realisation of projects without causing market distortions or unintended outcomes. While evaluating auction efficiency is a more
common approach, efficiency traditionally considers that the bidders with the lowest costs win, and that the resulting projects
correspond to the most competitive technologies. Auction efficiency does not however consider important factors such as the
trade-off between competitive price outcomes and project realisation rates.
5
Figure 1: Representation of basic auction classifications
Source: elaborated by the authors of this report
Maurer and Barroso (2011) identify the below auction types, noting that they can be used to trade power
contracts for both regulated and nonregulated customers on a short, medium and long-term basis, and
that within specific auction designs, new capacity or the renewal of contracts for existing capacity can
be targeted.
2.2.2 Auction and bid design options
In a typical reverse auction, all bidders submit schedules of prices and quantities for multiple units of
the same product to be allotted. The auctioneer aggregates offer prices into a supply curve, linking it to
the quantities to be purchased. The auction clearing price is determined at the price where supply and
demand meet. Participants that submit bids at or below the market clearing price are the winners. Bids
above the clearing price are disqualified. Below are brief explanations of fundamental design and bid
options.
Sealed bid auctions:
First-price and second-price sealed bid auctions: All bidders simultaneously submit a single price
sealed bid which corresponds to a single electricity asset or product. Bid amounts are unknown to all
other bidders (hence the “sealed” bid). In a first-price sealed bid auction, the auctioneer selects the
lowest bid as a winner, and the winner receives their bid price. In a second-price sealed bid auction
(also known as Vickrey auction), the winner receives the price of the second most competitive bid,
instead of their own bid price.
Pay-as-bid and pay-as-clear sealed bid auctions: In a pay-as-bid auction, winners receive their offer
price (also known as a discriminatory price auction). In a pay-as-clear auction, winners receive the
market clearing price (also called uniform price auction).
6
Example: Sealed bid auctions are typical when there is a single auction asset or product allotted to a
single winner, such as concession for a new or existing generation or transmission asset.
Advantages: The simplicity of the auctions lowers the costs of participation, bid preparation and
auctioneer administration. The possibility of retaliation or collusion among bidders is low, as participants
are unable to use bidding to signal or communicate.
Disadvantages: There is risk of significant over or underbidding due to weak price discovery, as
participants are unable to condition bids based on competitor bidding.
Descending clock auction (also known as an iterative auction):
The auctioneer begins the process by announcing a price that is considered high. Bidders reveal the
quantities which they wish to offer at the stated price. If the quantity surpasses the procurement target,
the auctioneer announces a lower price, and bidders reveal the quantities which they wish to offer at
the new lower price. The process continues until supply meets demand, forming the clearing price. The
winners receive payment equal to their offered quantities multiplied by the auction clearing price.
Example: Descending clock auctions can be used to auction a single product, or multiple products
through concurrent auctions, i.e., to win the right to sell power for specific time-blocks. In this example,
concurrent auctions for different time-blocks may permit bidders to shift offers from one auction / product
to another as the bidding rounds progress.
Advantages: A distinct advantage of descending clock auctions is transparent price discovery, as
bidders have the ability to view price formation through multiple rounds. Descending clock auctions are
also less prone to corruption on the part of the auctioneer, as bids are conducted openly.
Disadvantages: Disadvantages include an increased chance of collusion among bidders, who can use
tacit signalling via bids to communicate, increasing auction prices and bidder profits (Maurer and
Barroso 2011).
Design in practice: In practice, auction designs routinely represent a hybrid structure, combining
features of both sealed bid and descending clock auctions to meet policy objectives. Both Brazil and
Mexico employ the method of combining features from different auction designs to fashion solutions
that best fit their country-specific objectives and institutional frameworks.
2.2.3 Technology-specific, multi-technology and technology-neutral auctions
A second key design feature that affects auction outcomes is technology eligibility. Auctions include
rules regarding technology participation, and depending on objectives, policymakers may seek to
encourage a specific generation technology (technology-specific auctions), stimulate competition
among a specific group of technologies (multi-technology auctions), or permit full competition across all
energy technologies (technology-neutral auctions). Technology participation rules involve trade-offs in
terms of cost, competition and other auction outcomes (AURES 2016c).
Technology-specific auctions are typically used to help provide the foundation for nascent or non-
existent technologies to prove themselves viable and compete in future auctions. For example, to help
expand the use of biomass and wind, Brazil held exclusive auctions for these two technologies in 2008
and 2009, respectively. Beyond supporting emerging technologies, technology-specific auctions can
help diversify the generation mix, support the development of local industry and encourage diversity of
market participants (AURES 2016d). While providing maximum control over generation mix
development, the absence of competition among different technologies also precludes the development
of least-cost generation. However, specific auction design according to particular technologies could
have positive externalities, as pre-qualification requirements, regulatory procedures and other factors
vary by technology. Accordingly, tailoring auction design for a single technology could enhance auction
efficiency when technologies are at different stages of maturity.

7
Multi-technology auctions for renewable energy allow two or more generation technologies to compete
with one another. Auctions can be restricted to specific renewable energy sources, or can include
specific renewable energy sources as well as conventional technologies. The auctions may also include
demand bands, in which different technologies are allocated proportions of the auction’s total capacity.
Allowing the participation of multiple (yet not all) technologies provides policymakers control while
maintaining competition (AURES 2016c).
In technology neutral auctions, all energy technologies and resources compete directly with one
another. This can also include demand-side resources like energy efficiency and demand response,
which may bid into the market as well (if they can demonstrate that savings are achieved or generation
is offset during peak periods). These auctions increase the likelihood of the development of least-cost
technologies, yet reduce or eliminate government control over which technologies are developed. If
held when technologies are not at the same level of maturity, technology neutral auctions can
sometimes lead to surprises and unintended consequences. Further, technology neutral auctions that
include both conventional and green technologies could reduce the likelihood of meeting renewable
energy targets (AURES 2016c).
The choice between technology-neutral and technology-specific auctions involves trade-offs among
various goals such as cost efficiency and government control (see Figure 2). Achieving renewables
targets and creating a market for immature technologies may also be considered. While the dollar per
unit cost of electricity is likely to be higher in technology-specific auctions, this metric does not consider
grid integration costs according to technology, local development benefits, generation mix diversity or
resource adequacy (AURES 2016c). Accordingly, the ideal mix of technology-specific, multi-technology
and technology neutral auctions depends largely on specific market and societal needs.
Figure 2: Representation of Technology Participation Trade-Offs
Source: elaborated by the authors of this report
2.2.4 Auction products
While the most common products offered through the auctions are energy and capacity contracts, the
specific products made available for purchase and sale depend on market design and conditions.
Energy only markets are feasible if energy payments cover all fixed and variable costs of generation
Co
st E
ffic
ien
cy (
$ /
MW
h)
Government Control
Technology Participation Trade-Offs
Technology Neutral Multi-Technology Technology Specific
8
projects, and simultaneously incentivise new investment in generation to cover the given reserve
margin. Generators are typically required to bid into the wholesale market at their short run marginal
cost (SRMC) of generation, and therefore recover the marginal cost of fuel (which makes up about 90
percent of the SRMC for conventional generation) plus variable operations and maintenance costs.
Generators might not recover their fixed costs through pure energy payments if the market does not
produce sufficiently high scarcity pricing; this is a particular problem for peaker plants which generate
electricity for just a few hours per year. Establishing a capacity market, and offering capacity as a
product in electricity auctions, is one way of permitting generators to recover fixed costs. However,
relatively well functioning energy only markets do exist (such as New Zealand, and ERCOT in Texas),
which include scarcity pricing and other mechanisms to recover fixed costs (although this depends on
generation mix and level of penetration of renewables in the generation mix).
Additional products can be offered in long-term procurement auctions depending on market rules and
specific policy goals. For example, Mexico offers clean energy certificates (CELs) as a product in its
long-term procurement auctions as a means of supporting clean energy targets. Brazil offers firm energy
certificates (FECs), a quasi-product that functions to provide signals regarding the country’s supply-
demand balance, in lieu of a formal capacity market. Financial transmission rights and ancillary services
can also be offered through generation procurement tenders, but these products are typically traded
through separate auctions for the sake of simplicity.
2.2.5 Auction volume
Auction volume, which can be determined according to forecasted demand plus a reserve margin, plays
a central role in the level of competition in auctions. Determining the ideal volume to offer in a given
auction is therefore a critical decision for policymakers. Auctioning large volumes through a single
tender may lead to rapid development of new capacity, yet it could reduce competition and lead to
higher prices. As bid prices are in large part a function of supply and demand, volume caps may be
implemented in order to ensure that the volume offered in a given auction remains below the total
volume that the market can absorb. Volume caps set below the total estimated market volume can
therefore lead to lower bid prices due to limited supply and fiercer competition (AURES, 2015).
Disclosure of auction volume impacts competition. Revealing the auction volume in advance can raise
interest among investors and project developers in the auction. Yet full disclosure could facilitate
strategic behaviour if bidders seek to win all or the majority of offered capacity to gain market share,
potentially leading to artificially low prices. Predatory pricing to gain market share could lead to project
non-realisation, market power issues and the deployment of less efficient economic resources.
Auction volume can be set in terms of capacity (MW), energy (MWh) or budget ($).
Volume as a function of capacity: Auction volume is set in capacity to be installed, with the
option to assign different proportions of the total capacity to different technologies. Project
developers bid to provide a specific amount of installed capacity by a predetermined date.
Advantages: Setting volume as a function of capacity facilitates electricity system planning.
It also provides greater certainty and reduces risk to project developers, when compared with
setting volume in generation, and supports the monitoring (and potentially the achievement)
of renewable energy targets. In addition, it provides the clearest indication to manufacturers
and developers about the future market size.
Disadvantages and considerations: Volume as a function of capacity does not ensure
generation. There is less certainty regarding total project costs when compared with volume
setting according to budget (which sets a maximum budget for products), yet this risk can be
mitigated through establishing a ceiling price (AURES, 2016e).
9
Volume as a function of energy: Auction volume is set according to generation over a
specified timeframe, and project developers bid to provide a specific amount of generation
during the corresponding timeframe. This can also include generation blocks, in which project
developers commit to provide a specified number of MWh during a particular time block (i.e.
17:00 to 22:00).
Advantages: It facilitates electricity system planning, and supports the monitoring (and
potentially the achievement) of renewable energy targets.
Disadvantages: There is less certainty regarding total project costs when compared with
volume set according to budget, yet this risk can be mitigated through establishing a ceiling
price. Generation commitments present additional risk to project developers, as market,
seasonal and weather conditions that impact dispatch can vary. Generation commitments
also become problematic if future market conditions create a need to amend rules regarding
priority dispatch (AURES, 2016e). Further, time block auctions could limit the ability of
intermittent technologies to participate, depending on how the time blocks are set.
Volume as a function of budget: Auctioned volume is set according to a maximum budget
determined by the auctioneer or government, yet the auction product is still set in generation
or capacity. There are two approaches to volume as a function of budget. The auctioneer can
define a maximum price per MW or MWh, or the auctioneer can define an aggregate budget
without specifying total volume or prices.
Advantages: It sets a maximum for the prices paid for auctioned products, providing
additional certainty regarding costs for end users.
Disadvantages: The level of capacity or generation to be acquired ex-ante can be uncertain,
which can negatively impact system planning and the achievement of clean energy targets.
Upward adjustments to volume caps are common in electricity auctions. If overall offered volume is
received at prices that the auctioneer interprets as highly competitive and thus beneficial for the given
market and its consumers, the auctioneer may decide to increase the volume cap. Further, the volume
cap may be increased in anticipation of project non-realization rates (AURES, 2015).
2.2.6 Auction frequency
Auctions should be held consistently at predetermined intervals in order to prevent irregular auction
patterns. Setting regularly held auctions helps facilitate market predictability for investors, and could
lead to lower bid prices. Further, increased certainty regarding the future and frequency of auctions is
beneficial for renewable energy supply chains internationally and locally, and can be an advantage for
local manufacturing. The signal to the market is fortified further when implemented in concert with clear
long-term targets (set by law) with respect to renewable energy investment and decarbonisation. Exact
auction frequency depends on the specific market, yet at least one auction per year is considered
consistent. However, auctions should not be held simply for the sake of maintaining regular auction
intervals. If a market is unprepared for an auction, due to oversupply, transmission constraints or other
foreseeable issues, it is preferable to deviate from a regular auction schedule.
2.2.7 Lead time between auctions and commercial operation date
Lead time between announcing auction winners and corresponding deadlines for commercial operation
can significantly impact auction efficacy and competition. Lead time should depend on the auctioned
technology and the corresponding time to build, the urgency of resource adequacy needs, and consider
any transmission constraints. It should also be set to allow project developers enough time to secure
all necessary permitting and interconnection agreements to bring the project to a shovel ready stage
and eventually to commercial operation. At the same time, it should be set to prevent project developers
10
from bidding at “highly competitive” prices in order to observe market and technology price
developments before making a final investment decision.8
If too little lead time is provided, the risk of missing development related deadlines increases. Missed
deadlines frequently result in mutual blaming on the parts of project developers and governments.
Unrealistic deadlines also result in penalties for project developers, or the avoidance of payment if
project developers are able to successfully shift blame to the government. In either case auction efficacy
is diminished.
If too much lead time is provided, however, project developers may bid at excessively low prices in
order to take a “wait and see” approach. If market conditions and technology price reductions become
favourable, investors would go ahead with the project; if not, investors could cancel it. This issue is
compounded when penalties for project non-realisation are low, or project developers feel that they can
be avoided. Such was the case in Germany’s 2017 offshore wind auction, in which bid prices were far
lower than expected. This was partially a result of the expectation of the cost of offshore wind technology
declining significantly by 2025 (when the projects are required to begin commercial operation),
combined with low penalties for project non-realisation. In this situation, the option value of maintaining
the right to build may outweigh penalties in the case of project withdrawal, at least for some project
developers (NERA, 2017).
A situation in which an auction is turned into an option for bidders is the result of the inevitable trade-
off the auction designer faces between the probability of delivery and contestability. Increasing penalties
for non-compliance with auction commitments and tightening prequalification criteria increases the
probability of delivery but at the same time reduces competition due to the reduction of eligible bidders.
The resulting “option to build” is an unintended consequence of this trade off, not the intention of the
auction designer.
2.2.8 Auction prequalification and penalties
Prequalification and penalties greatly impact auctions in terms of overall efficacy. Bidders normally
apply for prequalification, submitting official applications including a fee for application review and the
purchase of auction rules. Bidders must demonstrate a relevant project development track record,
submit a bid bond and comply with other legal and technical requirements.
Ensuring serious bids from competent project developers depends on the design and implementation
of prequalification and penalties, as do project realisation and project delay rates. Penalties for non-
realisation should be strict enough to dissuade investors from taking a post-auction “wait and see”
approach. Harsh penalties should also reduce underbidding in auctions, as very low or negative returns
can negatively impact project realisation rates.
As with most auction design elements, however, the severity of penalties imply a trade-off. Requiring
bidders to post large bid bonds as collateral, and / or introducing strict penalties increases the risk
premium on the cost of capital, applying upward pressure on bid prices and potentially limiting actor
diversity. Prequalification requirements face a similar trade-off. While strict requirements regarding
developer experience, financial wherewithal and other factors increase the likelihood of project
realisation and decrease the probability of delays, strict prerequisites also reduce the number of eligible
project developers, and decrease actor diversity. Regarding enforcement, the payment of penalties
increases risk for project developers and adds a premium to the cost of capital in future auctions. Yet
successful evasion of penalty payments undermines the credibility of auction rules, increases moral
hazard and can lead to project developers missing deadlines with impunity.
8 The purpose of renewable auctions is to create investment incentives for the deployment of renewables. Auctions are not
meant to create a market in which firms may purchase options to deploy renewables in the future.
11
2.2.9 Grid connections
The grid connection regulatory model determines the distribution of interconnection costs between
parties, and can play a significant role in renewable investment incentives, impacting the
competitiveness of renewables versus conventional technologies. There are four principal methods of
connection cost allocation.
1. Generator model: Project developers are responsible for the entire grid connection cost, including
any grid reinforcements corresponding to the connection. This is also known as “deep cost” allocation.
In this model, project developers are incentivised to seek out a cost efficient connection, and ensure
that the connection is viable without system upgrades prior to bidding. Under this approach, generators
also typically avoid ongoing use of system charges (Stennett 2010). The generator model considerably
increases investment costs for project developers and can have a disproportionately negative impact
on renewable generators when competing directly with conventional technologies in auctions.9 As the
site selection for renewable projects is limited by the availability of sun, wind or other naturally occurring
resources, grid connection locations are equally limited. This can be an issue if optimal sites for
renewable generation are far from the grid, or are in locations that are likely to cause system reliability
issues if intermittent generation is absorbed in that particular area. Conversely, conventional generators
do not face such site selection restrictions, and generally have more options to build assets in locations
suited for cost efficient grid connection. Renewable technologies may need to increase bid prices to
compensate for the estimated connection cost, and to avoid uncompensated risk for potential grid
reinforcement costs, which can be uncertain. In a generator connection model, conventional generators
factor the same risks into their bid prices, but can better manage connection cost uncertainty and are
likely to face lower costs.
2. Transmission system operator (TSO) model: The TSO is responsible for the entire grid connection
cost, including any grid reinforcements. The TSO model equalizes the risk associated with connection
costs between renewable and conventional generators, and represents a substantial boon for
renewable developers. However, this approach potentially reduces social welfare, as renewables are
not exposed to full economic costs (costs of generation technology and connection). If grid connection
costs are socialised, welfare is not maximised as project developers do not have an incentive to
consider cost efficient connections when siting projects. As a result, investment in renewable generation
will not occur in locations that promote economic efficiency and reduce system costs. Further, under
the TSO model, generators are typically subject to ongoing use of system charges (Stennett 2010).
3. Hybrid model: The generator is responsible for connection costs and the TSO is responsible for grid
reinforcement costs. This is also known as “shallow cost” allocation. There are various ways of
implementing the hybrid model. For example, connection charges can be split by the generator and the
TSO while the TSO assumes reinforcement costs. Conversely, the generator may be responsible for
connection charges and a percentage of reinforcement costs. If connection charges are shallow, more
of the costs are initially covered by the TSO and then socialised. If the charges are deep, the generator
is responsible for more of the cost.
4. Third-party model: In the case of offshore wind in the United Kingdom, a tender is held to select a
third party to build, own and operate the connection asset between the offshore wind generation and
land. This model entitles the winner of the tender, the offshore transmission owner (OFTO), to a 20-
year revenue stream, paid by the transmission operator. The OFTO is remunerated for keeping the
connection asset available, and revenue therefore does not depend on output or wind farm
9 While potentially disadvantaging renewable development, it likely provides an incentive to locate where transmission costs are
minimal.
12
performance. The third-party model is advantageous in that it permits the competitive entry of new
market participants, and can therefore deliver grid connections more rapidly and efficiently. However,
this approach is also more complex, involving various parties, a tender process and new regulation
(Brown et al., 2015).
In each of the four regulatory models final users ultimately bear the costs of interconnection. Yet they
vary in terms of overall costs, efficiency, support for renewables and alignment with broader energy
policy goals (Brown et al., 2015).
2.2.10 Balancing responsibilities
To maintain reliable power supply, the supply-demand equilibrium of the system must be perfectly
balanced in real time to ensure stable grid frequency. If combined output from all generators does not
meet demand, frequency decreases; if combined output is greater than demand, frequency increases.
Either case can result in serious consequences for generators and grid reliability. Balancing
responsibilities of non-dispatchable renewables like wind and solar also impact the competitiveness of
these resources, as their operational costs will differ based on these obligations. Balancing
responsibility in this context means that renewable generators are obliged to stick with the schedule
they submit to the market operator. Those who deviate from the schedule will be penalized with an
imbalance price on the amount of their deviation. Balancing responsibility encourages renewable
generators to improve their quality of forecast but at the same time it increases costs, because
renewables need to contract with flexible resources to match their forecast, or be exposed to their
imbalance costs. In locations where renewables are balancing responsible, additional costs that result
from balancing obligations must be factored into bids in competitive auctions.
2.2.11 Curtailment risk
Curtailment risk occurs as a result of a constrained grid or other technical constraints that endanger
operational security of the power system. While generators should be dispatched according to marginal
cost, system operators must guarantee that the dispatched generation works reliably within system
constraints. Accordingly, if, for example, generation resources with identical marginal costs face limited
transmission capacity, some of this generation may be curtailed by the system operator (Gimon, Orvis,
Aggarwal, 2015). As PPAs are paid out according to a set price for power generated, curtailment can
be a serious risk for project developers, who would have less cash to provide return on equity or cover
debt. Curtailment risk can be allocated fully to the buyer, the project developer, or be shared. If
developers are required to bear all or a portion of curtailment risk, financing cost may significantly
increase and would ultimately be passed through to be included in the bid price in a competitive auction.
3. Brazil and Mexico: power sectors in context
At different times and under different circumstances, both Brazil and Mexico have restructured their
electricity sectors toward market liberalisation and competition. While specific reasons for power sector
reform and deregulation differ, the underlying motives are the same: leverage competition to achieve
efficient, reliable power generation, incentivise private investment in the sector and provide end users
with electricity at the lowest possible cost. In terms of fundamental reasons for deregulation, both
countries also became increasingly mindful of the limits of relying exclusively on government resources
to fulfil electricity sector investment needs. In turn, the necessity of guaranteeing reliable, least-cost
power helped curb energy sector nationalism and lay the theoretical foundations for market
liberalisation.
Private sector participation in the Brazilian and Mexican electricity sectors, however, dates back to the
early twentieth century, when the electric industries of both countries were dominated by private, mostly
foreign investors from the United States and Canada. Disputes regarding issues including high tariffs
led to government rate controls, which initiated private sector retreat. In response, the respective federal
governments began playing increasingly prominent roles in sector regulation and expansion, ultimately
13
leading to power sector nationalisation10 (Tankha, 2008; Center for Energy Economics, 2013). For
example, in 1934 the Brazilian government capped return on investment for electricity generators and
distributors, and began regulating electric rates, ultimately leading to the private sector’s sale of
electricity assets to the government. While nationalisation programs oversaw electric network
expansion and increased electricity access, financial crises and macroeconomic instability limited the
ability of both national governments to ensure security of supply through generation capacity
investment.
Following decades of limited private investment in generation, both Brazil and Mexico came to reform
their electric sectors to encourage private participation, including renewable energy and technology-
specific procurement processes. As part of the push towards introducing market mechanisms, both
countries have chosen competitive tendering schemes as their mainstays of power generation capacity
development, including renewables.
Renewable procurement programmes in Brazil and Mexico, however, were introduced at different
stages of their respective market liberalisation processes, and were implemented for reasons different
from the renewable procurement policies realised in developed countries. In the 1990s, power sector
reforms in developed countries aimed to achieve efficiency gains and encourage private sector
investment. In the early 2000s, developed countries began to implement renewable policies to promote
sustainability, not in order to ensure sufficient reserve margin and increase security of supply.
In the early to mid-1990s in Brazil, privatisation in generation, transmission (on a limited basis) and
distribution was employed to increase security of supply and to help the government clear its debts.
Efficiency gains were also a driver of the initial reform. At this stage in Brazil, the focus was on thermal
generation development to diversify the country’s energy mix away from hydro; intermittent renewables
were not considered. As a result of Mexico’s 1992 power sector reform, private investment in generation
was permitted on a limited basis to ensure security of supply; renewables were not explicitly considered.
In both countries, however, renewable energy later became part of the supply security solution, and
power sector reform was designed around incentivizing investment in generation capacity in general,
with special provisions made to encourage non-hydro renewable generation.
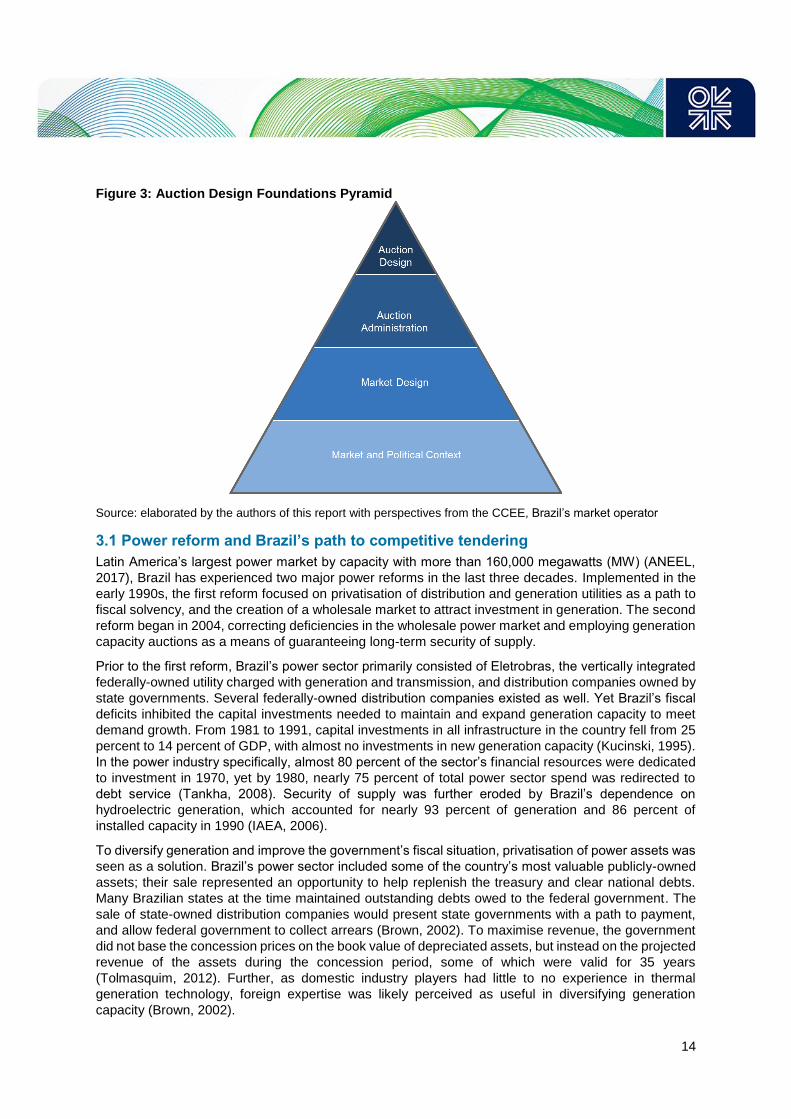
To appreciate current auction administration and design in both Brazil and Mexico, it is necessary to
understand the foundations on which auctions are designed and implemented (see Figure 3). Auctions
do not exist in a vacuum but are the result of market and contextual factors including the history and
politics surrounding power sector reform. Auctions and their stakeholders, including policymakers and
project developers, therefore interact with these foundations as they pursue their auction related aims.
10 The Mexican government officially nationalized the electric sector with a constitutional amendment in 1960, which established
that “it is the exclusive responsibility of the nation to generate, transmit, transform, distribute and provide electricity which will be
utilized as a public service.” However, the national utility began purchasing private electricity assets on large scale as early as
1944 (Center for Energy Economics, 2013). In Brazil, the government created the state-owned utility in in 1962, yet began
increasing the government share of installed capacity as early as 1952 (Silva, 2011).
14
Figure 3: Auction Design Foundations Pyramid
Source: elaborated by the authors of this report with perspectives from the CCEE, Brazil’s market operator
3.1 Power reform and Brazil’s path to competitive tendering
Latin America’s largest power market by capacity with more than 160,000 megawatts (MW) (ANEEL,
2017), Brazil has experienced two major power reforms in the last three decades. Implemented in the
early 1990s, the first reform focused on privatisation of distribution and generation utilities as a path to
fiscal solvency, and the creation of a wholesale market to attract investment in generation. The second
reform began in 2004, correcting deficiencies in the wholesale power market and employing generation
capacity auctions as a means of guaranteeing long-term security of supply.
Prior to the first reform, Brazil’s power sector primarily consisted of Eletrobras, the vertically integrated
federally-owned utility charged with generation and transmission, and distribution companies owned by
state governments. Several federally-owned distribution companies existed as well. Yet Brazil’s fiscal
deficits inhibited the capital investments needed to maintain and expand generation capacity to meet
demand growth. From 1981 to 1991, capital investments in all infrastructure in the country fell from 25
percent to 14 percent of GDP, with almost no investments in new generation capacity (Kucinski, 1995).
In the power industry specifically, almost 80 percent of the sector’s financial resources were dedicated
to investment in 1970, yet by 1980, nearly 75 percent of total power sector spend was redirected to
debt service (Tankha, 2008). Security of supply was further eroded by Brazil’s dependence on
hydroelectric generation, which accounted for nearly 93 percent of generation and 86 percent of
installed capacity in 1990 (IAEA, 2006).
To diversify generation and improve the government’s fiscal situation, privatisation of power assets was
seen as a solution. Brazil’s power sector included some of the country’s most valuable publicly-owned
assets; their sale represented an opportunity to help replenish the treasury and clear national debts.
Many Brazilian states at the time maintained outstanding debts owed to the federal government. The
sale of state-owned distribution companies would present state governments with a path to payment,
and allow federal government to collect arrears (Brown, 2002). To maximise revenue, the government
did not base the concession prices on the book value of depreciated assets, but instead on the projected
revenue of the assets during the concession period, some of which were valid for 35 years
(Tolmasquim, 2012). Further, as domestic industry players had little to no experience in thermal
generation technology, foreign expertise was likely perceived as useful in diversifying generation
capacity (Brown, 2002).
15
3.1.2 Privatisation
In 1993, the federal government began preparing the sector for reform by permitting utilities to raise
rates (via a cost-reflective tariff) which had been kept low artificially as a means of curbing inflation, and
eliminating the uniform tariff across all customer classes which had provided an industry-wide cross
subsidy.11 Brazil’s treasury also absorbed $23 billion USD of sector debts to help lay sound foundations
for reform (Rosa et al., 2013). From 1995 to 1998, regulations for independent power producers (IPPs)
and private participation in public services in general were introduced, bilateral contracts between
utilities and large customers were permitted (Tankha, 2008), an energy regulator and independent
system operator were created, and the wholesale power market was launched. During this same period,
Eletrobras was unbundled (Vagliasindi et al., 2013). In 1995, prior to the establishment of an energy
regulator or finalised regulatory regime, privatisation began in practice, with a tender held for the sale
of Escelsa, the first distribution company concession awarded to the private sector (Rosa et al., 2013;
Viana 2018).
Privatisation occurred downstream first. Transforming insolvent and poorly managed distribution
companies into productive and fiscally sound enterprises would provide generators with bankable
offtakers for their power. Under the reform, PPAs between generators and distribution companies were
required (Tolmasquim, 2012). This bottom-up approach would then facilitate privatisation further up the
electricity value chain. At the time, the distribution network industry was perceived to be in poor
condition. The state-level distribution companies often failed to adequately function in their service
territories, experiencing high non-technical losses, lack of maintenance and overstaffing. As such, there
was likely room for “quick wins” in terms of efficiency improvements (Brown, 2002).12
Through concessions awarded via auctions, private sector participation in the distribution segment
reached approximately 60 percent in 1998 (Vagliasindi and Besant-Jones, 2013), with investors
accepting existing regulated network tariffs. The decreased market risk that resulted from regulated
tariffs and captive customers helped make the distribution companies attractive investments. As for
transmission, private concessions were only accepted for new capacity, which would require approval
from the grid operator and regulator (Rosa et al., 2013). Transmission was also a regulated business,
with concession awards based on the largest discount on the maximum annual revenue, which thus
translated into the lowest tariffs. The regulated tariffs were also indexed to inflation.
The reform was unsuccessful in incentivising sufficient generation to keep pace with growing demand.
Investment was undermined by macroeconomic instability and the devaluation of the Brazilian real in
1999, wholesale market design failures, and the inability of thermal generation to compete in a hydro-
dominated system with no gas market. For example, Mendonça and Dahl (1999) cite a 1998
government expansion plan which indicated that the marginal cost of adding new generation capacity
was $45 USD / MWh, 50 percent higher than power prices at the time. In addition, the cost of capital in
Brazil was high, and project developers were not offered any indexing mechanism to hedge currency
risk (Mendonça and Dahl, 1999). Additional obstacles on Brazil’s path to attract private investment in
generation are described further below.
3.1.3 Thermal Priority Program
Recognising the ineffectiveness of the initial generation privatisation effort, in 1999 the Ministry of Mines
and Energy (MME) launched a new scheme to encourage private investment in thermal plants. Under
11 In 1977 the federal government began restricting increases in electricity rates in order to limit inflation given the importance of
electricity as input for production of goods and services. The policy of equalizing electricity prices and cross subsidizing was
meant to help manage costs of expensive government infrastructure projects and to help parts of the economy with their electricity
bill, yet it also reduced any incentives for efficiency gains in the power industry. Both policies helped contribute to the insolvency
of Brazil’s electric companies. 12 The underlying reason for privatization was to raise the funds to finance state and federal government balance sheets (Viana,
2018).
16
the programme the Brazilian Development Bank provided long-term, low interest financing. Eletrobras,
which still dominated transmission, served as the offtaker, and Petrobras, the state-owned oil and gas
company, provided the gas (Oliveira et al., 2005). The plan aimed to encourage about 19,000 MW of
gas-fired generation power plants by 2003.
However, developing a nascent thermal generation industry in a market dominated by hydropower
proved difficult. First, the marginal costs of thermal gas-fired generation are much higher than
hydroelectric generation, which limits thermal plant dispatch to demand peaks, drought years and other
irregular occurrences. Second, Brazil’s natural gas market was undeveloped, lacking a spot market or
a pipeline capacity market; accordingly, gas was sold exclusively on a take-or-pay basis (Oliveira et al.,
2005).13
The inflexible nature of gas supply, along with the dispatch risk associated with a hydro-dominated
market, reduced the attractiveness of investment in gas-fired generation. As Brazil’s hydro generation
was equipped with ample pondage, short-term hydro scarcity and a subsequent increase in spot price
was perceived as unlikely due to the prospect of heavy rain years. Volatile spot prices further
exacerbated prospects for investment (Viana, 2018). Ultimately, the market did not send the appropriate
signal to investors to build out significant thermal capacity. The programme resulted in about 9,000 MW
of thermal generation, well below the approximately 19,000 MW target (Association of Brazilian Gas
Distributors, 2015).14
3.1.4 Incentive Programme for Alternative Electricity Sources (PROINFA)
In 2001, Brazil experienced an electricity supply crisis, as years of demand growth outpacing
investments in generation caused dam levels to fall to just 32 percent of their capacity. With limited
dispatchable resources to call upon, the government responded with a rationing programme, mandating
all power consumers to reduce their consumption by 20 percent (Lund, 2017).
The supply crisis provided further impetus to diversify generation, beginning with PROINFA, the first
major effort to develop mainly non-hydro renewable energy capacity in Brazil. Launched in 2002,
PROINFA sought to encourage 3,300 MW of wind, biomass and small hydro build (split equally between
technologies). Eletrobras served as the offtaker, buying power via technology-specific feed in tariffs
(FiTs), which were set at preferential prices and guaranteed for 20 years ($150/MWh for wind, $96/MWh
for small hydro and $70/MWh for biomass). The costs were absorbed by ratepayers through an
additional charge (Barroso, 2012). PROINFA, which has been defunct since 2011, resulted in the
deployment of almost 2,600 MW of capacity, of which 1,118 MW corresponded to small hydro, 936 MW
to wind and 520 MW to biomass (Luomi, 2014).15
While PROINFA provided initial momentum in Brazil’s renewable energy industry, it suffered from
design flaws which helped lead to its premature discontinuation. The programme included a 60 percent
local content requirement, which led to delays due to the lack of a domestic industry (Brazil had just
one wind manufacturer) (Barroso, 2012). Furthermore, the mandated equal division of capacity
development across energy technologies did not result in least-cost development. Importantly, within
the technology quotas, projects were selected according to the date of issuance of environmental
permits, with older permits taking priority. This project development merit order led to an environmental
permit black market, which helped distort the economics of project development, resulting in excessive
transaction costs and legal cases. While the FiT continued to attract project developers, the introduction
of competitive tenders in 2004 and in particular renewable technology-specific tenders in 2007
13 The Brazilian gas market is still underdeveloped, particularly Petrobras’ monopoly (Viana, 2018). 14 The data regarding thermal generation built vs. the Thermal Priority Program’s target varies by approximately 2,000 MW
depending on the source, yet actual thermal build under the programme falls below 50 percent of the target in all cases analyzed. 15 While PROINFA was replaced by auctions, PROINFA era contracts are valid until 2026 (Viana, 2018).
17
effectively created a competing renewable procurement scheme, which likely served to further erode
PROINFA’s efficacy.
3.1.5 Brazil’s second power market reform: introduction of competitive auctions
Following the rationing crisis, energy became a significant issue in Brazil’s 2002 presidential election.
Then presidential candidate Lula de Silva campaigned to ensure security of supply, remove the risk of
rationing and lower electricity rates. President Lula won the election, and in 2004 Brazil began the
process of restructuring its electricity sector for the second time, introducing competitive auctions for
generation procurement. The reform included a law requiring distribution utilities to contract 100 percent
of forecasted load through purchasing electricity via public auctions, in order to serve regulated
customers (Rosa, et al., 2013). The reform also updated the sector’s regulatory bodies and wholesale
market rules, and ultimately established a comprehensive auction system, including separate auctions
for the contracting of new capacity, existing capacity, alternative energy sources and technology-
specific capacity.
Brazil has contracted almost 80,000 MW of generation capacity since 2004. 60,000 MW of this total
correspond to clean energy capacity, including large hydro generation (Lund, 2017). Brazil’s auction
process and design are discussed in detail in the next section of this report.
3.2 Overview of Brazil’s auctions and wholesale power market
The primary objectives of Brazil’s electricity auctions are to guarantee security of supply through
attracting new generation capacity, encourage a diversified generation mix and promote competition
and efficiency in generation to achieve cost reductions. Additional objectives include encouraging the
participation of renewables in the country’s generation matrix, and promoting transparency and effective
price discovery in the generation procurement process.
Auctions are led by the regulator, the National Agency of Electric Energy (ANEEL), with an auction
committee comprised of four government agencies distributing tasks and executing primary auction
responsibilities. Within this committee, the Ministry of Energy and Mines (MME), which is responsible
for the formulation and implementation of all energy policy, defines auction guidelines. The CCEE
(market operator) assumes significant responsibility, and is charged with calculating distribution tariffs,
contract settlement and overall auction administration among other specific duties. The Energy
Research Company (EPE), which operates under the direction of the MME, provides energy sector
planning support. This committee defines all aspects of the auctions.
Brazil’s wholesale power market is comprised of the Regulated Contracting Environment (ACR), the
Free Contracting Environment (ACL) and the energy reserve market. Power purchases on behalf of
regulated customers occur via auctions as part of the ACR, in which generators, distribution utilities and
power marketers participate. Distribution utilities submit their 5-year load forecasts to the EPE, which
then determines total auction volume (Rosa et al., 2013). Project developers also submit their technical
specifications to the EPE. The MME ultimately announces the qualifying projects (Tolmasquim, 2012).
In the ACR, there are auctions for existing and new capacity. Brazil’s first auction was designed for
energy procurement from existing generation, to first account for existing capacity and then facilitate
new investment. Auctions for existing capacity are referred to as A-1, as supply is expected to begin
one year following the tender (Tolmasquim, 2012). New generation capacity auctions, known as A-3
and A-5 for their respective three year and five year commercial operations deadlines, are convened
annually. A-3 auctions normally correspond to quick-build technologies like wind, solar and small-hydro,
while A-5 auctions are used for conventional technologies with longer lead times. In 2017 Brazil added
A-4 and A-6 auctions to provide further flexibility regarding commercial operation deadlines. These
auctions permit Brazil’s distribution utilities, the auction offtakers, to cover the forecasted demand of
regulated customers with long-term power purchase agreements (forward contracts in MWh) (AURES,
2016). Contract durations are typically 30 years for large hydro and 20 years for small hydro, wind,
biomass and solar.
18
Winning auction bidders sign contracts with participating distribution utilities. Total procured energy is
divided among distribution utilities in proportion to each company’s contracted share of purchased
volume. In this pooled system, distribution utility demand is aggregated, with each generator receiving
a contract with every distribution utility. This model may reduce market risk for both generators and
distribution utilities, as risk of non-delivery (in the case of generator), or non-payment (in the case of the
distribution utility), is spread among all parties (Araujo et al., 2008). Once contracts between bidders
and offtakers have been signed, generators close financing, typically with the Brazilian Development
Bank (BNDES) which provides concessionary financing for auction winners (Eberhard, 2016). As a
balancing mechanism for the ACR, adjustment auctions exist, allowing distributors to buy and sell
shorter-term contracts to account for updated demand forecasts. The adjustment auction contracts
typically range from three to 24 months (CCEE, 2017b).
The ACR functions in tandem with the ACL, in which power consumers with demand of more than 3
MW, generators and power marketers can freely negotiate bilateral contracts. These customers must
also contract 100 percent of forecasted load and are not eligible to participate in auctions, yet they may
opt to continue under the ACR, buying power from a distribution utility (Rosa et al., 2013). Power
marketers participate in the ACL as well.
All contracts must be backed by firm energy certificates (FECs). FECs represent the maximum amount
of energy that can be offered through contracts, and are issued by the MME to every generator
connected to the national grid. According to Alexandre Viana, former Auctions & Regulated Market
Executive Manager at the CCEE, "the FEC of a plant is the maximum volume of energy that can be
sold through contracts, and establishes the reliability assured by the generator backing up the contract."
Compliance is verified “by comparing the volume of energy sold in a contract with the amount of FECs
held by the seller…any shortfall is penalised at a maximum value between the cost of new energy and
the spot price” (Viana, 2017).
The certificates provide a physical coverage requirement for generators and other market agents,
helping track and ensure security of supply.16 The number of FECs awarded to each plant depends on
technology, and the total number of FECs must correspond to total contracted capacity.17 FECs are
procured by distribution companies, which determine the number of FECs needed according to their
load forecasts. Free customers also purchase FECs through bilateral contracts. All contracts must be
covered by FECs, and market participants can face heavy fines for noncompliance.
Contracts signed in both free and regulated environments are registered with the CCEE (market
operator), which calculates distribution tariffs. The National Agency of Electric Energy (ANEEL) uses
the CCEE’s tariff to calculate final rates for regulated customers. The CCEE also administers the spot
market, accounting for differences between contracted and produced electricity, with financial
settlements made monthly. PPAs in the ACR are regulated by ANEEL, which has regulatory oversight
over the CCEE, as well as generation, transmission, distribution, commercialization and tariffs (Araujo
et al., 2008).
Reserve auctions were introduced in 2009, and are convened as needed in order to increase the electric
system’s reserve margin. CCEE administrates the reserve auctions and acts as the offtaker, recovering
an energy reserve charge from all customers connected to the national electric grid (AURES, 2016).
New and existing generation capacity are eligible to participate in these auctions, which do not require
FEC coverage (CCEE, 2017). In terms of system operation, generation dispatch and transmission
coordination is controlled by The National Electric System Operator (ONS). The regulatory regime also
16 FECs do not take into account water availability variations 17 For non-dispatchable generation technologies, the FECs are calculated by using the maximum energy that can be generated
in a year (Porrua, et al., 2010)
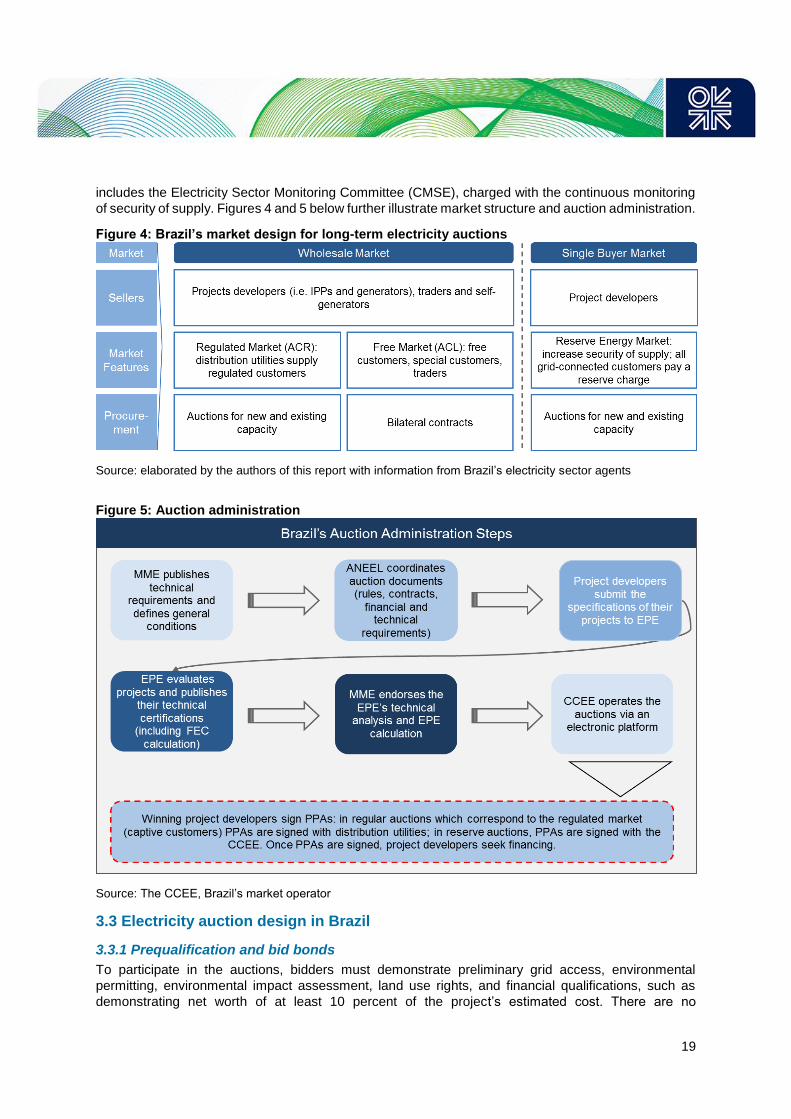
19
includes the Electricity Sector Monitoring Committee (CMSE), charged with the continuous monitoring
of security of supply. Figures 4 and 5 below further illustrate market structure and auction administration.
Figure 4: Brazil’s market design for long-term electricity auctions
Source: elaborated by the authors of this report with information from Brazil’s electricity sector agents
Figure 5: Auction administration
Source: The CCEE, Brazil’s market operator
3.3 Electricity auction design in Brazil
3.3.1 Prequalification and bid bonds
To participate in the auctions, bidders must demonstrate preliminary grid access, environmental
permitting, environmental impact assessment, land use rights, and financial qualifications, such as
demonstrating net worth of at least 10 percent of the project’s estimated cost. There are no
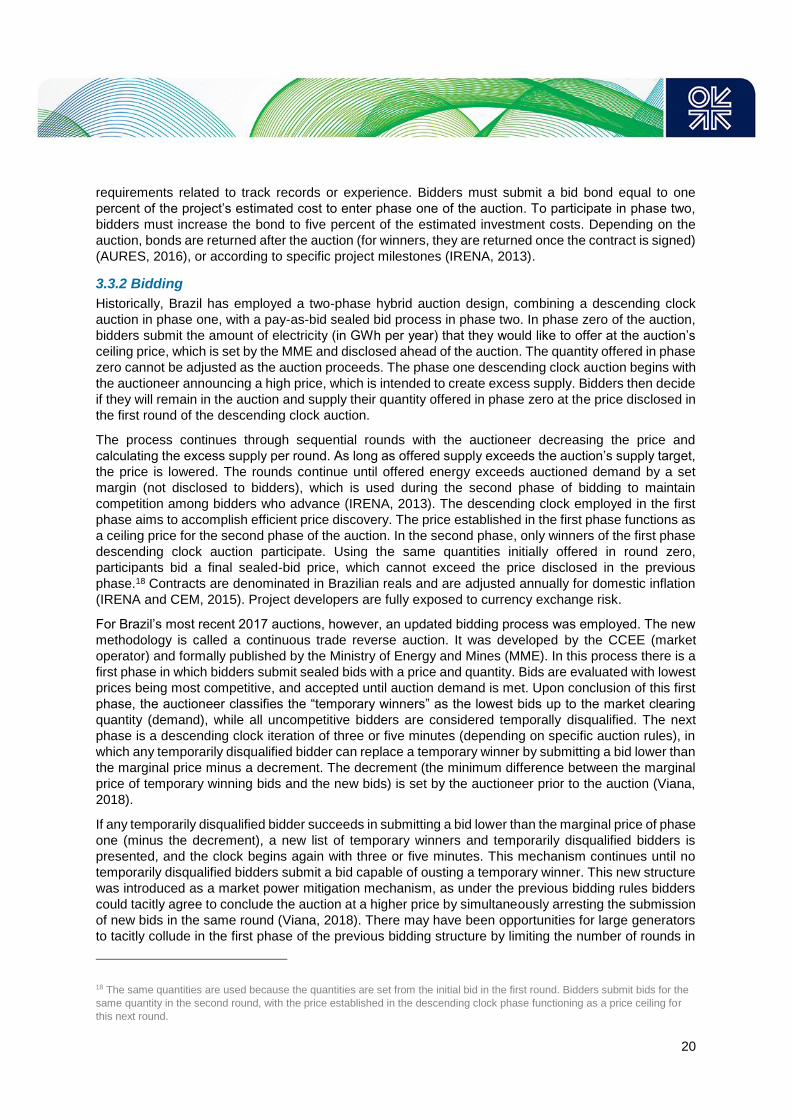
20
requirements related to track records or experience. Bidders must submit a bid bond equal to one
percent of the project’s estimated cost to enter phase one of the auction. To participate in phase two,
bidders must increase the bond to five percent of the estimated investment costs. Depending on the
auction, bonds are returned after the auction (for winners, they are returned once the contract is signed)
(AURES, 2016), or according to specific project milestones (IRENA, 2013).
3.3.2 Bidding
Historically, Brazil has employed a two-phase hybrid auction design, combining a descending clock
auction in phase one, with a pay-as-bid sealed bid process in phase two. In phase zero of the auction,
bidders submit the amount of electricity (in GWh per year) that they would like to offer at the auction’s
ceiling price, which is set by the MME and disclosed ahead of the auction. The quantity offered in phase
zero cannot be adjusted as the auction proceeds. The phase one descending clock auction begins with
the auctioneer announcing a high price, which is intended to create excess supply. Bidders then decide
if they will remain in the auction and supply their quantity offered in phase zero at the price disclosed in
the first round of the descending clock auction.
The process continues through sequential rounds with the auctioneer decreasing the price and
calculating the excess supply per round. As long as offered supply exceeds the auction’s supply target,
the price is lowered. The rounds continue until offered energy exceeds auctioned demand by a set
margin (not disclosed to bidders), which is used during the second phase of bidding to maintain
competition among bidders who advance (IRENA, 2013). The descending clock employed in the first
phase aims to accomplish efficient price discovery. The price established in the first phase functions as
a ceiling price for the second phase of the auction. In the second phase, only winners of the first phase
descending clock auction participate. Using the same quantities initially offered in round zero,
participants bid a final sealed-bid price, which cannot exceed the price disclosed in the previous
phase.18 Contracts are denominated in Brazilian reals and are adjusted annually for domestic inflation
(IRENA and CEM, 2015). Project developers are fully exposed to currency exchange risk.
For Brazil’s most recent 2017 auctions, however, an updated bidding process was employed. The new
methodology is called a continuous trade reverse auction. It was developed by the CCEE (market
operator) and formally published by the Ministry of Energy and Mines (MME). In this process there is a
first phase in which bidders submit sealed bids with a price and quantity. Bids are evaluated with lowest
prices being most competitive, and accepted until auction demand is met. Upon conclusion of this first
phase, the auctioneer classifies the “temporary winners” as the lowest bids up to the market clearing
quantity (demand), while all uncompetitive bidders are considered temporally disqualified. The next
phase is a descending clock iteration of three or five minutes (depending on specific auction rules), in
which any temporarily disqualified bidder can replace a temporary winner by submitting a bid lower than
the marginal price minus a decrement. The decrement (the minimum difference between the marginal
price of temporary winning bids and the new bids) is set by the auctioneer prior to the auction (Viana,
2018).
If any temporarily disqualified bidder succeeds in submitting a bid lower than the marginal price of phase
one (minus the decrement), a new list of temporary winners and temporarily disqualified bidders is
presented, and the clock begins again with three or five minutes. This mechanism continues until no
temporarily disqualified bidders submit a bid capable of ousting a temporary winner. This new structure
was introduced as a market power mitigation mechanism, as under the previous bidding rules bidders
could tacitly agree to conclude the auction at a higher price by simultaneously arresting the submission
of new bids in the same round (Viana, 2018). There may have been opportunities for large generators
to tacitly collude in the first phase of the previous bidding structure by limiting the number of rounds in
18 The same quantities are used because the quantities are set from the initial bid in the first round. Bidders submit bids for the
same quantity in the second round, with the price established in the descending clock phase functioning as a price ceiling for
this next round.
21
which supply exceeded demand. By colluding to ensure that supply offered equalled pre-set demand
after only a few rounds (instead of perhaps many more rounds), a higher ceiling price could be set for
phase two, which would lead to extra income. This is thought to have occurred when many bidders
stopped submitting new bids in the same round (Viana, 2018).
3.3.3 Volume setting
In renewable energy auctions, two methods are employed to set auction volume. The first is a demand
function, which regulates total offered volume to ensure a suitable supply-demand ratio, with the aim of
safeguarding competition. For example, a demand function of 1.3 requires that the auction’s supply be
30 percent higher than the total offered volume. The auction’s volume is reduced if supply is insufficient.
The second method allots total volume to different renewable energy technologies, according to the
proportion of bids that corresponded to each technology in the first round of bidding. For example, if
total auction volume is 400 MW, and first round bids are 1,000 MW of wind, 700 MW of solar and 100
MW of biomass, auction volume would be distributed as 250 MW for wind, 175 MW for solar and 25
MW for biomass.
For solar and biomass, a separate ‘reference factor’ is used to determine the maximum share that these
technologies can represent in an auction; this essentially represents a cap on the proportion of these
two technologies. If the volume allocated to solar or biomass (in the process described above) exceeds
the cap, the proportion of the technology which exceeds the cap is reduced, and the least-cost
technology participating in the auctions makes up the difference in order to achieve the total auction
volume. In the above example, solar represents 43.8 percent of total volume. If a cap on solar is set for
30 percent of total auction volume, solar participation would be reduced to 30 percent, and wind (which
typically is the least-cost renewable technology in Brazil), would increase its participation by 13.8
percent. While the processes for determining auction volume are made available to auction participants,
the specific functions are not disclosed. Total auction volume is also kept undisclosed with the aim of
inhibiting collusion (IRENA and CEM, 2015).
3.3.4 Special provisions for renewables
Renewable energy technologies receive discounts on transmission and distribution tariffs, with
biomass, small hydro, and wind receiving a 50 percent discount, and solar PV receiving an 80 percent
discount. 19 In addition, non-firm renewable generation is subject to settlement rules to accommodate
intermittency. The settlement occurs through an adjustment factor to account for the time value of
generation in relation to spot prices. For intermittent technologies that generate electricity when the spot
price is high, an adjustment factor is applied, creating additional compensation. Yet when intermittent
technologies generate electricity when the spot price is low, the adjustment takes the form of a penalty.
By using the bidder’s generation profile and the CCEE’s spot price projection, an adjustment factor,
either positive or negative, is applied to the bid price (IRENA and CEM, 2015).
3.3.5 Penalties and compensations for over- and underproduction
Penalties depend on the type of auction and the specific renewable energy technology. In auctions for
new generation, if there is more than a 10 percent difference between contracted energy and annual
generation a penalty is applied. The generator is subject to a payment which equals either a) the
average spot price in the year of underperformance times the undelivered quantity, or b) the contract
price multiplied by the undelivered quantity – whichever is higher. Production is also assessed on a
four-year basis for intermittent energy technologies. If average generation over the four-year period is
less than energy contracted in the corresponding auction, the generator must pay either a) the average
spot price during the four-year period times the undelivered energy, or b) the contract price increased
by six percent times the undelivered quantity – whichever is higher. Compensation for additional
unanticipated generation is also provided by permitting generators to sell excess generation to the spot
19 Solar PV commissioned after 2017 will receive a 50 percent discount
22
market. The quantity of excess generation eligible for sale on the spot market depends on the
technology and production year (IRENA and CEM, 2015).
In reserve auctions, the same 10 percent difference between contracted energy and annual generation
is applied, yet the penalty requires the generator to purchase the missing electricity at six percent more
than the contract price. Conversely, if the reserve auction upper limit of 115 percent of contracted
energy is surpassed, excess generation is eligible for purchase at a 30 percent discount from the
contracted price.
3.3.6 Penalties for delays and non-completion
Winning bidders are required to submit a bond worth five percent of the estimated value of the project’s
cost. Delay penalties use the methodology for under-production described in section 3.3.5, and
assumes that 100 percent of the contracted energy has not been delivered. If project delays extend
beyond one year, the government may cancel the contract and keep the bid bond (IRENA and CEM,
2015).
3.4 Mexico’s path to competitive tendering
Mexico’s experience reforming its power sector to introduce competitive tendering is more
straightforward than Brazil’s. Whereas Brazil engaged in two separate electricity market reforms almost
a decade apart from one another, Mexico undertook only one comprehensive reform, which began in
2013. While sector restructuring that resembles Mexico’s 2013 market liberalisation was proposed by
the Mexican executive branch in both 1999 and 2001, the reform packages did not pass muster in the
Mexican Congress (Center for Energy Economics, 2013). Beginning its electricity sector reform twenty
years after Brazil’s initial reform, Mexico enjoyed a wealth of international experience from which to
draw upon, and privatised generation in a world in which competitive tendering schemes were
commonplace.
Mexico’s first contemporary private sector investments in power generation began in 1992, with the
reform of the Public Electricity Service Law (LSPEE). While the original 1975 law established that
electric service is a public service and the exclusive responsibility of the state, by the early 1990s
electricity consumption in Mexico was growing at four percent annually (SENER, 2013), yet the Federal
Energy Commission (CFE, the public utility) and the Mexican state lacked the financial wherewithal to
fund projects. To mitigate the risk of a supply crisis, the 1992 amendment permitted private investment
in generation, excluding five categories of generators from the definition of public service: self-supply,
import and export, cogeneration, small production and independent power production for exclusive sale
to CFE. Under this scheme, CFE was responsible for central planning, including volume setting, and
convening pay-as-bid auctions in which IPPs would compete to build, own and operate new generation.
IPPs were awarded long-term PPAs with a two-part payment structure: one payment for firm capacity
offered to CFE and a second payment to ensure recovery of dispatch related variable costs (Maurer et
al, 2011).
To enable gas supply for electric generation, the 1995 reforms created a semi-competitive gas market
through sanctioning the private ownership and operation of natural gas transmission, distribution and
storage. To oversee this new market, the Energy Regulatory Commission (CRE) was created (Center
for Energy Economics, 2013). Despite these efforts, initial response to the 1992 reform was limited,
with investors requesting a firm guarantee to finance projects. In 1997, the federal government created
the Long-Term Productive Infrastructure Projects (PIDIREGAS) programme, which provided a
sovereign guarantee to investors from the federal government (Cámara de Diputados, 2003). The
programme helped drive the success of the 1992 reform, with major generation companies developing
mostly gas-fired combined cycle plants throughout the country (Maurer et al, 2011).
Further yet limited measures were taken to support renewable capacity development under the
regulatory structure of LSPEE. In 2001, CRE established regulation requiring CFE to give priority grid
access to solar, wind and small hydro power, and required CFE to provide transmission and connection
23
discounts to renewable systems of more than 500 kW (IEA, 2013). In 2008, the Law for the Development
of Renewable Energy and Energy Transition Financing was passed, creating a fund to help finance
renewable energy and energy efficiency projects. From its creation to 2013, the fund received $668
million of federal funds, $150 million of which was dedicated to renewable energy financing, with the
remainder used for energy efficiency measures (IEA, 2015).
In 2009, national energy plans outlined greenhouse gas emissions reduction targets and renewable
capacity and generation goals. Yet beyond permitting private investment under limited circumstances,
no price, quantity or budget-based incentive schemes were implemented to encourage private
investment in renewable energy or electric generation capacity in general. As a result, by 2014 nearly
24 percent of installed generation capacity (12,851 MW) in Mexico corresponded to IPPs, yet only four
percent of this private generation was renewable energy capacity (511 MW of wind) (CFE, 2014).
3.4.1 The Mexican Energy Reform
The Mexican power market has experienced profound change since 2013 as it has transformed from a
monopoly with a single vertically integrated utility charged with generation, transmission and
distribution, to a partially-liberalised market, with functioning wholesale and retail markets open to
private investment. The changes are a product of the 2013 Mexican energy reform, which amended the
country’s constitution and provided secondary legislation to end monopolies in both the power and
hydrocarbon sectors, permitting large-scale private investment in energy for the first time since 1937.
For the power sector, the government’s aim is to lower power costs and increase renewable generation
capacity.
The power sector reform created major overhauls in the organisation and regulatory structure of the
sector. The Federal Energy Commission (CFE), the state-owned vertically integrated utility which has
controlled most of Mexico’s electricity business since its creation in 1937, has been divided into nine
separate subsidiaries in order to end the company’s monopoly in electricity generation. Six of these
enterprises are dedicated to generation, with the remaining three split between transmission,
distribution and retail. Transmission and distribution continue to operate as a monopoly, yet private
sector participation is now permitted for related infrastructure investments. The new structure should
also contribute to scaling back electricity subsidies for residential and agricultural customers (IEA,
2017). In 2017, the state paid 119 billion Mexican pesos ($6.2 billion USD) in domestic electricity
subsidies alone (Rodriguez, 2017).
The reform also created an independent system operator, the National Centre for Energy Control
(CENACE). Importantly, the reform mandates that auctions are held to contract energy, capacity and
clean energy certificates (CELs), and that an escalating proportion of generation is derived from clean
energy sources. Mexico’s three long-term auctions held to date under the new structure have achieved
highly competitive prices resulting in long-term contracts for new clean generation. Yet there are
numerous aspects of auction outcomes unrelated to price that must be evaluated to determine auction
efficacy. To effectively evaluate auctions, however, the market and energy policy contexts in which they
exist must be understood.
3.5 Overview of Mexico’s auctions and wholesale power market
As in Brazil, the specific objectives of Mexico’s electricity auctions depend on the type of auction held,
i.e., short vs. medium vs. long-term auctions, vs. auctions for financial transmission rights. General
objectives include the creation and maintenance of a contract market to allow retailers to meet their
supply obligations, the promotion of investment in renewable energy generation and power price
reductions. To support auctions, an entirely new wholesale electricity market (MEM) and regulatory
structure has been created.
In the new MEM, generation dispatch is controlled by the power system operator, the National Centre
for Energy Control (CENACE). CENACE also convenes, organises and coordinates Mexico’s electricity
auctions. The Federal Energy Commission (CFE, the public utility) previously controlled the dispatch of
24
generation units, but this function was removed from CFE to allow transparency, private sector
competition and reduce conflicts of interest. The regulatory regime also includes the Secretary of
Energy (SENER), charged with energy policy, and the Energy Regulatory Commission (CRE), which
regulates the wholesale market, as well as transmission and distribution.
3.5.1 Nodal Market and Auctions for financial transmission rights (FTRs)
The wholesale market is cost-based, with CENACE operating the market through the dispatch of
generation units based on nodal pricing or locational marginal prices (LMPs). In the nodal market,
electricity is injected into the grid by generators, and withdrawn from the grid by offtakers, at points on
the grid known as nodes, with each node assigned its own LMP. In Mexico, CENACE sets the nodes,
and reports the hourly LMPs for more than 2,300 nodes across the country (NERA, 2016).
The nodal market structure is more efficient than the pre-liberalisation dispatch formula, as the LMP
reflects the costs of energy, congestion and losses, and therefore encourages investors to build new
generation capacity in areas which lessen costs to the grid. The MEM is also comprised of a short-term
energy market, a balancing capacity market, a clean energy certificate market, medium and long-term
auctions (for energy, capacity and clean energy certificates) and auctions for financial transmission
rights (FTRs).
FTRs are financial instruments that provide wholesale market participants with a hedge against nodal
price variations (namely congestion price risks associated with the nodal market) (IEA, 2017). FTRs
provide a means of hedging nodal price variations, through which the holder of the FTR receives the
price difference between the delivery and withdrawal nodes. FTRs awarded through auctions are valid
for trimesters, the remainder of the auction year, a full year or three years (SENER, 2017). In Mexico’s
long-term auctions the delivery point is the point of interconnection, so the bidders do not bear any
congestion cost risk. In the mid-term auction, the bid is for a point of delivery, so the seller bears
congestion cost risk (Heidell, 2018). The long and mid-term auctions are described in greater detail
below.
3.5.2 Market Participants
MEM participants are generators, power marketers, large load customers and small load customers.
Large load customers, known in the Mexican market as “qualified users,” are permitted to participate
directly in the MEM to purchase electricity and related products, or exercise their retail choice via
“qualified suppliers” (retail service providers)20. Participating directly in the MEM permits the purchase
of electricity in day ahead and real-time (spot) markets via contracts with generators, which means that
CFE (state-owned utility) competes with independent power producers for qualified users. Direct MEM
participation, however, requires a permit from the CRE (regulator), and a connection agreement from
CENACE. Qualified user eligibility status was initially reserved for customers with aggregate demand
of at least 3 MW, yet this requirement was reduced to 2 MW in August 2016 and has since been reduced
to just 1 MW of aggregate demand.
Customers that do not meet the 1 MW requirement are considered “basic users,” and must purchase
power from “basic service providers.” Basic users purchase power at a regulated rate. Currently, CFE’s
retail subsidiary is the only basic service provider, however interested parties may apply for a CRE-
permit to provide basic service (also known as “basic supply”). Additional wholesale market participants
include “last resort suppliers” and “non-supplying brokers.” Last resort suppliers maintain electric
service reliability in the event that qualified suppliers fail to perform their functions. Non-supplying
brokers may engage in the power retail business without supplying physical power or the backing of
physical assets.
20 Electricity retailers are “qualified” under law to buy electricity from the wholesale market and sell electricity to “qualified
customers” or large customers.
25
3.5.3 Short-term energy market
The short-term energy market is characteristic of most power markets, in that plants are dispatched in
a merit order based on short-term marginal costs. Generators receive payment for the market clearing
price, which is the generation unit on the margin. Fixed costs are covered through other products
including capacity payments and clean energy certificates, which generators must offer to the market.
Correspondingly, electricity consumers and their suppliers are required to purchase clean energy
certificates and capacity.
Within the short-term energy market, there is a day-ahead market (MDA) as well as real-time trading
functions. The purpose of the MDA is to help determine generation, dispatch and demand on a 24 hour
forward basis by providing a framework for buyers and sellers to agree on the supply of power for the
following day at a predetermined price. As generators are dispatched based on forecasts of demand
and generation availability, the real-time market provides a method to ensure that differences between
contractual obligations and actual demand/supply are settled. Prices are established for each node of
the grid, reflecting the LMPs.
3.5.4 Capacity market
The capacity market serves to permit investors to recover fixed costs (as energy payments correspond
to the short-run marginal cost of generation) and increases system reliability by maintaining physical
production availability, and incentivising sufficient investment in generation capacity. Qualified users
and load serving entities are required to purchase capacity, with specific quantities determined by the
CRE (IEA, 2017). Capacity can be purchased bilaterally (exclusive to qualified suppliers), via medium
and long-term auctions, as well as through the capacity balancing market (Heidell et al., 2017). The
capacity balancing market facilitates the buying and selling of capacity among market participants which
have not met their assigned capacity requirements through the auctions. Accordingly, it permits market
participants to sell excess capacity, or alternatively, to cover capacity requirements (CENACE, 2017b).
Capacity payments, however, are limited to capacity that is available during the 100 “critical hours” of
the year.21 Intermittent generators are eligible for capacity payments based on average generation
during the 100 critical hours (PWC, 2015).
3.5.5 Clean energy certificate market
Clean energy certificates (CELs) provide a market mechanism for Mexico to meet its clean energy
policy goals of 25 percent of electric generation deriving from clean sources by 2018, 35 percent by
2024, 40 percent by 2035, and 50 percent by 2050. To support these targets, SENER created clean
energy consumption requirements of five percent of total electricity consumption deriving from clean
sources by 2018, 7.4 percent by 2020, 10.9 percent by 2021 and 13.9 percent by 2022. (SEGOB,
2017b). Hydro, nuclear, wind, solar, geothermal that were in place before the law count toward the total
clean energy requirement, however they do not get CELS (Heidell, 2018). Qualified suppliers (retailers)
and large load customers are subject to these targets and are required to comply, through the purchase
of CELs. Failure to purchase the required number of CELs will result in fines.
Generators receive one CEL for each MWh of clean energy produced (CRE, 2016), defined as power
deriving from wind, solar (in any form), tidal, geothermal, biomass, hydro, nuclear, waste to energy,
carbon capture and efficient cogeneration (SENER, 2017b). Generation technologies that use both
clean energy and fossil fuels will only be awarded CELs for the corresponding percentage of fossil fuel
free generation, as determined by the CRE. CELs are awarded through the Clean Energy Certificate
and Compliance Management System (the system), and generators which fulfil the system’s
requirements are awarded CELs by the CRE.
21 In 2016 and 2017, the 100 critical hours are the 100 hours of greatest demand nationally. In 2018 and beyond, the term
corresponds to the 100 hours when reserve margin is lowest (CENACE, 2017c).
26
Once CELs have been awarded, generators may offer their CELs to the market. Under the supervision
of the CRE, large load consumers can purchase CELs via bilateral contracts with generators, monthly
auctions held by CENACE or in an annual liquidation process (CRE, 2016). Yet basic service providers
purchase CELs in long-term auctions, and are awarded 20-year contracts. Qualified suppliers may
participate in the long-term auctions and / or procure CELs via bilateral contracts. In long-term auctions,
purchase bids include the quantity of desired CELs per year for 20 years, and the maximum price the
buyer would pay. The offer bids include the quantity of CELs that can be delivered for 20 years. As
such, a functioning market for CELs has been created.
3.5.6 Mid-term energy auctions
Mid-term auctions are run by CENACE and aim to reduce or eliminate spot market exposure for LSEs
by using auctions as a means to cover mid-term energy and capacity needs (CELs are not traded via
these auctions). Contracts must begin one year following the auction, with contract durations of three
years (SEGOB, 2017). The mid-term auctions are effectively a financial hedge against the price
uncertainty of the short-term markets.
3.5.7 Long-term energy auctions
Auctions for long-term energy, capacity and CEL contracts are the cornerstone of Mexico’s power sector
reform in terms of opportunities for private sector investment. These auctions offer 15-year contracts
for energy and capacity, and 20-year contracts for CELs. As the auctions guarantee long-term contracts,
they are fundamental in facilitating financing for project developers. Auctions are held once a year, with
CENACE reserving the right to convene additional auctions, and the CRE establishing ceiling prices for
energy, capacity and CELs. Projects must enter into commercial operation three years following the
conclusion of the auction, which favours wind and solar PV, which have shorter construction lead times
than other technologies (IEA, 2017).
In the first two auctions, CFE (the public utility) was the only buyer, which provided project developers
with an investment grade offtaker with a long history and an implied guarantee from the Mexican
government. In the third auction, and moving forward, a new clearing house, the Compensation
Chamber (CC) serves as the wholesale intermediary between project developers and offtakers.
All LSEs, including qualified suppliers, basic service suppliers, last resort suppliers and non-supplying
brokers may participate in the third and future auctions via the CC (see Figure 6 below). The CC will
match bid sale prices from generators with the bid purchase offers from LSEs, and each generator and
LSE will sign a single PPA with the CC. However, the CC will not act as a contract guarantor, but will
administer contracts, and perform credit analysis on each LSE. While each generator and LSE will only
have one PPA, the electricity trading system is pooled. Each LSE will purchase electricity from each
generator, according to the proportion of generation capacity that each generator has won the right to
build, and the proportion of capacity that each LSE has won the right to purchase.
This pooled system creates risk sharing between market participants. The cost of any unrecoverable
payments will be absorbed among all generators, proportional to respective outstanding balances from
the unrecoverable payment. The cost of undelivered electricity or other products will be absorbed by all
LSEs proportional to their payment obligations for the corresponding undelivered products (CENACE,
2017).
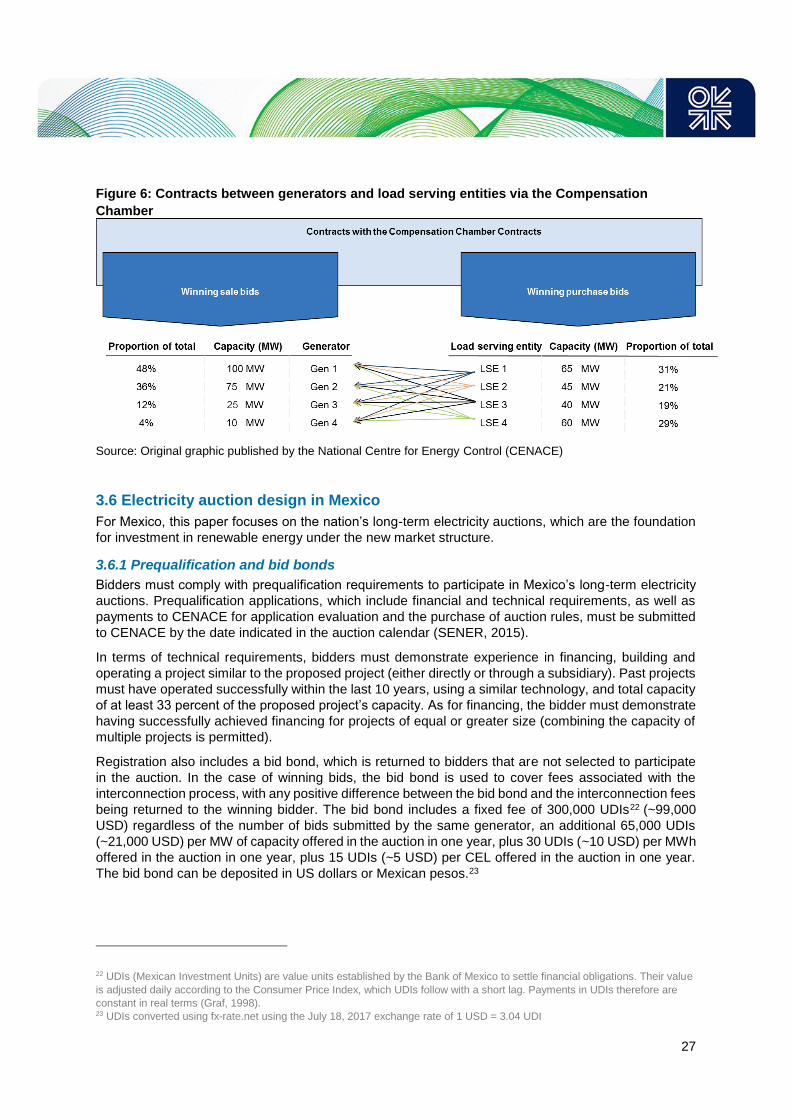
27
Figure 6: Contracts between generators and load serving entities via the Compensation
Chamber
Source: Original graphic published by the National Centre for Energy Control (CENACE)
3.6 Electricity auction design in Mexico
For Mexico, this paper focuses on the nation’s long-term electricity auctions, which are the foundation
for investment in renewable energy under the new market structure.
3.6.1 Prequalification and bid bonds
Bidders must comply with prequalification requirements to participate in Mexico’s long-term electricity
auctions. Prequalification applications, which include financial and technical requirements, as well as
payments to CENACE for application evaluation and the purchase of auction rules, must be submitted
to CENACE by the date indicated in the auction calendar (SENER, 2015).
In terms of technical requirements, bidders must demonstrate experience in financing, building and
operating a project similar to the proposed project (either directly or through a subsidiary). Past projects
must have operated successfully within the last 10 years, using a similar technology, and total capacity
of at least 33 percent of the proposed project’s capacity. As for financing, the bidder must demonstrate
having successfully achieved financing for projects of equal or greater size (combining the capacity of
multiple projects is permitted).
Registration also includes a bid bond, which is returned to bidders that are not selected to participate
in the auction. In the case of winning bids, the bid bond is used to cover fees associated with the
interconnection process, with any positive difference between the bid bond and the interconnection fees
being returned to the winning bidder. The bid bond includes a fixed fee of 300,000 UDIs22 (~99,000
USD) regardless of the number of bids submitted by the same generator, an additional 65,000 UDIs
(~21,000 USD) per MW of capacity offered in the auction in one year, plus 30 UDIs (~10 USD) per MWh
offered in the auction in one year, plus 15 UDIs (~5 USD) per CEL offered in the auction in one year.
The bid bond can be deposited in US dollars or Mexican pesos.23
22 UDIs (Mexican Investment Units) are value units established by the Bank of Mexico to settle financial obligations. Their value
is adjusted daily according to the Consumer Price Index, which UDIs follow with a short lag. Payments in UDIs therefore are
constant in real terms (Graf, 1998). 23 UDIs converted using fx-rate.net using the July 18, 2017 exchange rate of 1 USD = 3.04 UDI
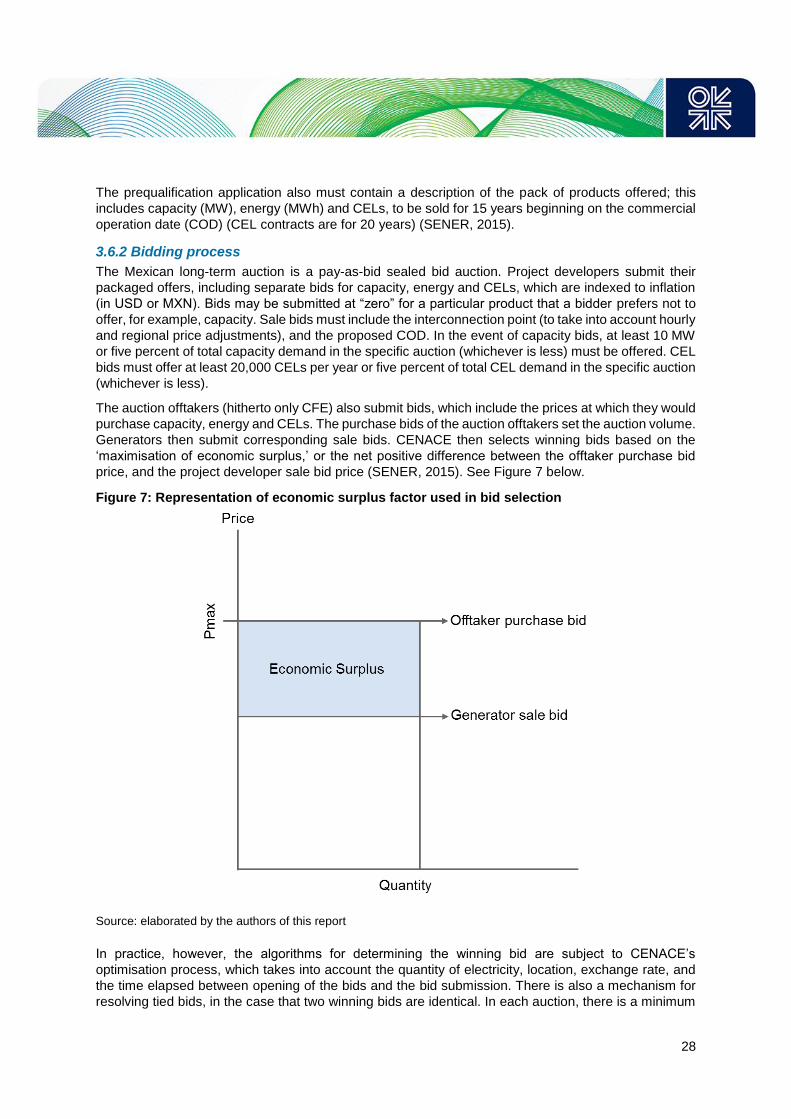
28
The prequalification application also must contain a description of the pack of products offered; this
includes capacity (MW), energy (MWh) and CELs, to be sold for 15 years beginning on the commercial
operation date (COD) (CEL contracts are for 20 years) (SENER, 2015).
3.6.2 Bidding process
The Mexican long-term auction is a pay-as-bid sealed bid auction. Project developers submit their
packaged offers, including separate bids for capacity, energy and CELs, which are indexed to inflation
(in USD or MXN). Bids may be submitted at “zero” for a particular product that a bidder prefers not to
offer, for example, capacity. Sale bids must include the interconnection point (to take into account hourly
and regional price adjustments), and the proposed COD. In the event of capacity bids, at least 10 MW
or five percent of total capacity demand in the specific auction (whichever is less) must be offered. CEL
bids must offer at least 20,000 CELs per year or five percent of total CEL demand in the specific auction
(whichever is less).
The auction offtakers (hitherto only CFE) also submit bids, which include the prices at which they would
purchase capacity, energy and CELs. The purchase bids of the auction offtakers set the auction volume.
Generators then submit corresponding sale bids. CENACE then selects winning bids based on the
‘maximisation of economic surplus,’ or the net positive difference between the offtaker purchase bid
price, and the project developer sale bid price (SENER, 2015). See Figure 7 below.
Figure 7: Representation of economic surplus factor used in bid selection
Source: elaborated by the authors of this report
In practice, however, the algorithms for determining the winning bid are subject to CENACE’s
optimisation process, which takes into account the quantity of electricity, location, exchange rate, and
the time elapsed between opening of the bids and the bid submission. There is also a mechanism for
resolving tied bids, in the case that two winning bids are identical. In each auction, there is a minimum
29
threshold established for the net positive difference, which is calculated by CENACE. Failing to reach
the minimum threshold triggers an iterative process in which bidders must successively lower their bid
prices.
The CRE has the ability to set a price cap for each auction product, yet to date has not done so. As a
result, maximum prices have been set by CFE’s highest bids for each product. Sale bids that exceed
this maximum price or come within 10 percent of it are automatically disqualified (SENER, 2015).
3.6.3 Locational pricing
Each individual auction sets its own generation zones, which take into account the locational value of
electricity, and are comprised of sub-zones including interconnection, sub-exportation and exportation
zones. The locational value is determined by the difference between the LMP of the generation zone in
which the electricity is delivered, and the average of all LMPs in the country. These ‘expected
differences’ are published by SENER prior to the auction and are used to compare and weigh bids in
the auctions. The generation zones are also used to help determine hourly generation adjustments
(which depend partly on location), and to limit energy and capacity acquisition and generation build in
certain exportation and interconnection zones (as a means of correcting supply / demand imbalances).
Interconnection zones signal the capacity for interconnection available in a specific geographic area,
and exportation zones limit the amount of energy that can be purchased in a specific area. The capacity
for interconnection in each interconnection zone corresponds to the total interconnection capacity of
the zone minus the interconnection capacity already utilised or accounted for. Exportation capacity of
each exportation zone is calculated in the same way (total exportation capacity minus the exportation
capacity already utilised or accounted for). The zones can be as limited as one substation, and as large
as deemed necessary by CENACE. Sub-zones within these zones may also be created to provide a
more granular approach to balancing supply and demand. As the supply-demand ratios are constantly
evolving, specific zones are defined in the rules of each separate auction.
Generators which have interconnection contracts, either through pre-reform legacy rights, or via
obtaining new interconnection contracts through the application process, make up portions of the
interconnection and exportation already accounted for, and are therefore not subject to the zonal limits
mentioned above. Yet generators who do not have interconnection contracts must essentially pass
through these zonal filters for their bids to be considered in the auctions (SENER, 2015).
Generation projects are required to dispatch electricity to the node that corresponds to their specific
location and generation zone. Generators include specific interconnection points in their bids, with each
point corresponding to a node with its own reference price. When considered by CENANCE in the
auctions, bid prices are adjusted either upwards or downwards depending on location, aiming to correct
supply and demand disparities. However, this adjustment is only used to help CENACE allocate winning
projects in locations to correct supply and demand imbalances. In the case of winning bids, bidders
receive their auction bid price regardless of any locational adjustments considered by CENACE. The
calculation of the expected differences in price per generation region, and the hourly adjustment
factors24 which depend on technology and location, are estimated and published by the SENER prior
to the auctions (SENER, 2015). Locational pricing played an important role in the first Mexican auction,
as explained further below.
3.6.4 Special provisions for renewables
Intermittent technologies are subject to an adjustment factor in order to reflect the time value of
generation. Intermittent generators receive monthly adjustments (either positive or negative) equal to
the product of the hourly adjustment factor and MWh generated in each hour. The positive or negative
24 Unlike locational adjustments, winning bidders of intermittent sources are either rewarded or penalized in the $ / MWh
amount paid.
30
adjustments result from multiplying the hourly quantity produced by the hourly adjustment factor for the
corresponding month, hour and location during the year. Further, while firm electricity generators are
required to deliver specific amounts of power hourly (according to individual bid specifications),
intermittent generators may deliver electricity at any time (SENER, 2015).
3.6.5 Penalties and compensations
Penalties for non-realisation of projects include the withholding of the bid bond (as described in section
3.6.1). Further, a delay in the COD would result in financial penalties for the project developer.
4. Evaluating electricity auction design
Standardised measures of auction success have been developed in the literature. Auctions for
Renewable Energy Support (AURES), the world’s only research outfit focused exclusively on renewable
energy auctions, developed a set of seven criteria to assess renewable energy tenders in 2015. The
International Renewable Energy Agency (IRENA), and other independent academic studies have also
developed their own sets of evaluation criteria. Building on these foundations, we evaluate auction
design according to two benchmarks: official government policy objectives of Brazil and Mexico and
additional criteria that build on the literature, tailored by the authors of this report and applied specifically
to Brazil and Mexico.
4.1 High-level assessment of auctions
In both Brazil and Mexico the auction process seems to have led to efficient price discovery through
transparent, competitive processes that have attracted billions of dollars in investment, enhancing
security of supply through clean energy. However, the key features of auctions in the two countries
differ (see Table 1 on following page).
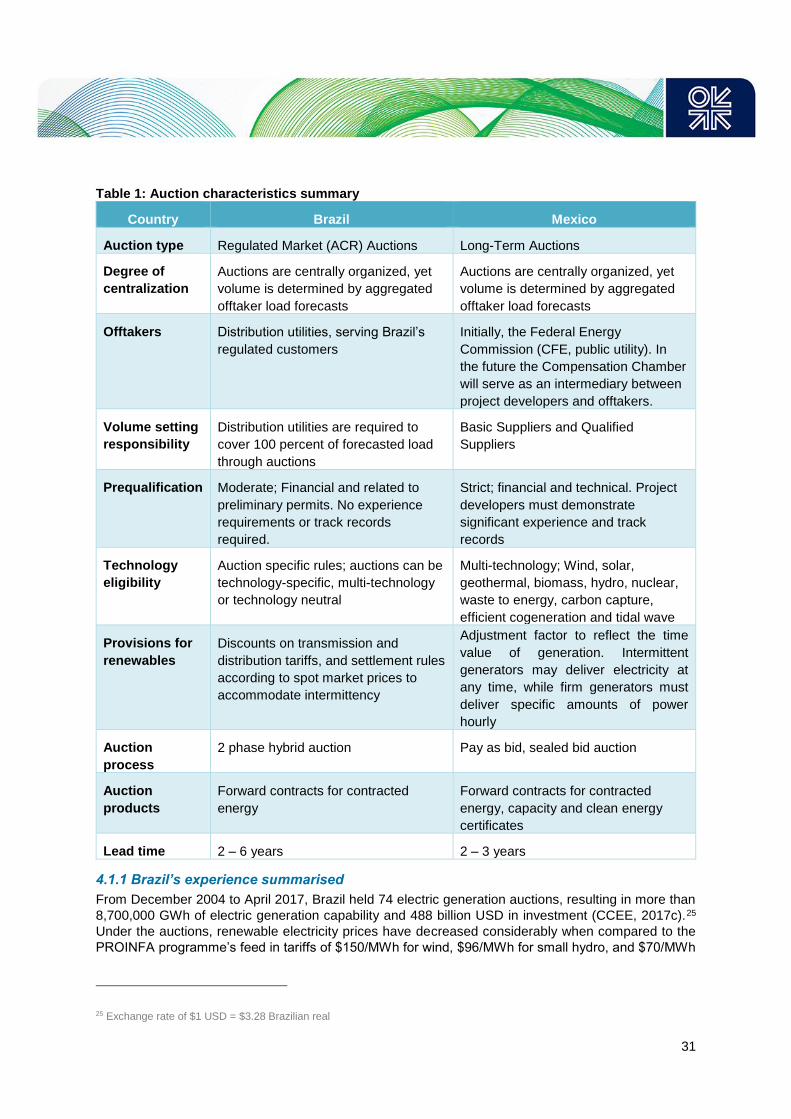
31
Table 1: Auction characteristics summary
Country Brazil Mexico
Auction type Regulated Market (ACR) Auctions Long-Term Auctions
Degree of
centralization
Auctions are centrally organized, yet
volume is determined by aggregated
offtaker load forecasts
Auctions are centrally organized, yet
volume is determined by aggregated
offtaker load forecasts
Offtakers Distribution utilities, serving Brazil’s
regulated customers
Initially, the Federal Energy
Commission (CFE, public utility). In
the future the Compensation Chamber
will serve as an intermediary between
project developers and offtakers.
Volume setting
responsibility
Distribution utilities are required to
cover 100 percent of forecasted load
through auctions
Basic Suppliers and Qualified
Suppliers
Prequalification Moderate; Financial and related to
preliminary permits. No experience
requirements or track records
required.
Strict; financial and technical. Project
developers must demonstrate
significant experience and track
records
Technology
eligibility
Auction specific rules; auctions can be
technology-specific, multi-technology
or technology neutral
Multi-technology; Wind, solar,
geothermal, biomass, hydro, nuclear,
waste to energy, carbon capture,
efficient cogeneration and tidal wave
Provisions for
renewables
Discounts on transmission and
distribution tariffs, and settlement rules
according to spot market prices to
accommodate intermittency
Adjustment factor to reflect the time
value of generation. Intermittent
generators may deliver electricity at
any time, while firm generators must
deliver specific amounts of power
hourly
Auction
process
2 phase hybrid auction Pay as bid, sealed bid auction
Auction
products
Forward contracts for contracted
energy
Forward contracts for contracted
energy, capacity and clean energy
certificates
Lead time 2 – 6 years 2 – 3 years
4.1.1 Brazil’s experience summarised
From December 2004 to April 2017, Brazil held 74 electric generation auctions, resulting in more than
8,700,000 GWh of electric generation capability and 488 billion USD in investment (CCEE, 2017c).25
Under the auctions, renewable electricity prices have decreased considerably when compared to the
PROINFA programme’s feed in tariffs of $150/MWh for wind, $96/MWh for small hydro, and $70/MWh
25 Exchange rate of $1 USD = $3.28 Brazilian real
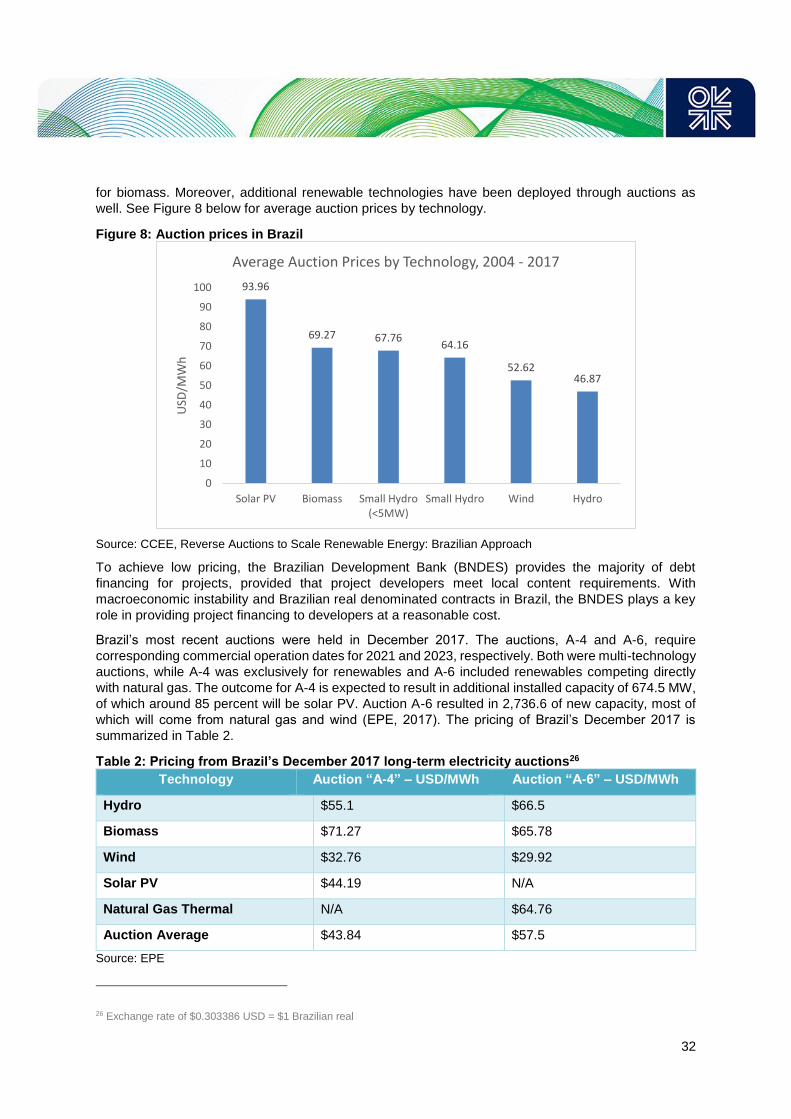
32
for biomass. Moreover, additional renewable technologies have been deployed through auctions as
well. See Figure 8 below for average auction prices by technology.
Figure 8: Auction prices in Brazil
Source: CCEE, Reverse Auctions to Scale Renewable Energy: Brazilian Approach
To achieve low pricing, the Brazilian Development Bank (BNDES) provides the majority of debt
financing for projects, provided that project developers meet local content requirements. With
macroeconomic instability and Brazilian real denominated contracts in Brazil, the BNDES plays a key
role in providing project financing to developers at a reasonable cost.
Brazil’s most recent auctions were held in December 2017. The auctions, A-4 and A-6, require
corresponding commercial operation dates for 2021 and 2023, respectively. Both were multi-technology
auctions, while A-4 was exclusively for renewables and A-6 included renewables competing directly
with natural gas. The outcome for A-4 is expected to result in additional installed capacity of 674.5 MW,
of which around 85 percent will be solar PV. Auction A-6 resulted in 2,736.6 of new capacity, most of
which will come from natural gas and wind (EPE, 2017). The pricing of Brazil’s December 2017 is
summarized in Table 2.
Table 2: Pricing from Brazil’s December 2017 long-term electricity auctions26
Technology Auction “A-4” – USD/MWh Auction “A-6” – USD/MWh
Hydro $55.1 $66.5
Biomass $71.27 $65.78
Wind $32.76 $29.92
Solar PV $44.19 N/A
Natural Gas Thermal N/A $64.76
Auction Average $43.84 $57.5
Source: EPE
26 Exchange rate of $0.303386 USD = $1 Brazilian real
93.96
69.27 67.7664.16
52.6246.87
0
10
20
30
40
50
60
70
80
90
100
Solar PV Biomass Small Hydro(<5MW)
Small Hydro Wind Hydro
USD
/MW
h
Average Auction Prices by Technology, 2004 - 2017
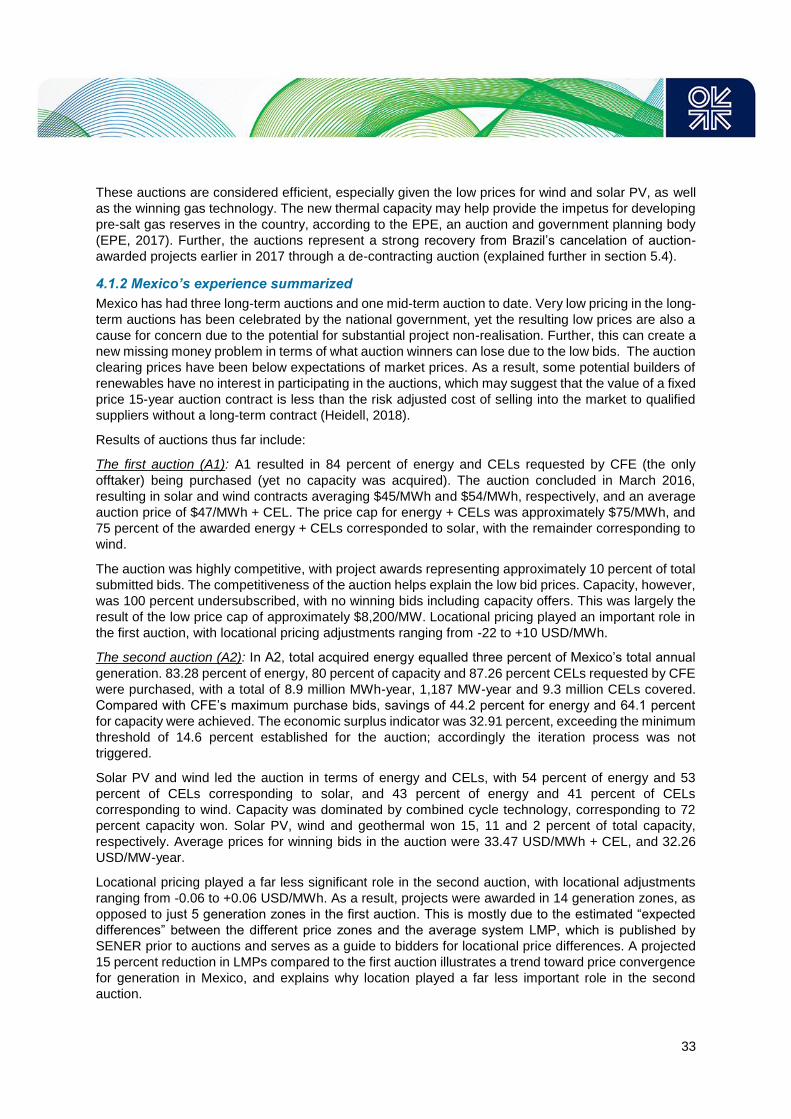
33
These auctions are considered efficient, especially given the low prices for wind and solar PV, as well
as the winning gas technology. The new thermal capacity may help provide the impetus for developing
pre-salt gas reserves in the country, according to the EPE, an auction and government planning body
(EPE, 2017). Further, the auctions represent a strong recovery from Brazil’s cancelation of auction-
awarded projects earlier in 2017 through a de-contracting auction (explained further in section 5.4).
4.1.2 Mexico’s experience summarized
Mexico has had three long-term auctions and one mid-term auction to date. Very low pricing in the long-
term auctions has been celebrated by the national government, yet the resulting low prices are also a
cause for concern due to the potential for substantial project non-realisation. Further, this can create a
new missing money problem in terms of what auction winners can lose due to the low bids. The auction
clearing prices have been below expectations of market prices. As a result, some potential builders of
renewables have no interest in participating in the auctions, which may suggest that the value of a fixed
price 15-year auction contract is less than the risk adjusted cost of selling into the market to qualified
suppliers without a long-term contract (Heidell, 2018).
Results of auctions thus far include:
The first auction (A1): A1 resulted in 84 percent of energy and CELs requested by CFE (the only
offtaker) being purchased (yet no capacity was acquired). The auction concluded in March 2016,
resulting in solar and wind contracts averaging $45/MWh and $54/MWh, respectively, and an average
auction price of $47/MWh + CEL. The price cap for energy + CELs was approximately $75/MWh, and
75 percent of the awarded energy + CELs corresponded to solar, with the remainder corresponding to
wind.
The auction was highly competitive, with project awards representing approximately 10 percent of total
submitted bids. The competitiveness of the auction helps explain the low bid prices. Capacity, however,
was 100 percent undersubscribed, with no winning bids including capacity offers. This was largely the
result of the low price cap of approximately $8,200/MW. Locational pricing played an important role in
the first auction, with locational pricing adjustments ranging from -22 to +10 USD/MWh.
The second auction (A2): In A2, total acquired energy equalled three percent of Mexico’s total annual
generation. 83.28 percent of energy, 80 percent of capacity and 87.26 percent CELs requested by CFE
were purchased, with a total of 8.9 million MWh-year, 1,187 MW-year and 9.3 million CELs covered.
Compared with CFE’s maximum purchase bids, savings of 44.2 percent for energy and 64.1 percent
for capacity were achieved. The economic surplus indicator was 32.91 percent, exceeding the minimum
threshold of 14.6 percent established for the auction; accordingly the iteration process was not
triggered.
Solar PV and wind led the auction in terms of energy and CELs, with 54 percent of energy and 53
percent of CELs corresponding to solar, and 43 percent of energy and 41 percent of CELs
corresponding to wind. Capacity was dominated by combined cycle technology, corresponding to 72
percent capacity won. Solar PV, wind and geothermal won 15, 11 and 2 percent of total capacity,
respectively. Average prices for winning bids in the auction were 33.47 USD/MWh + CEL, and 32.26
USD/MW-year.
Locational pricing played a far less significant role in the second auction, with locational adjustments
ranging from -0.06 to +0.06 USD/MWh. As a result, projects were awarded in 14 generation zones, as
opposed to just 5 generation zones in the first auction. This is mostly due to the estimated “expected
differences” between the different price zones and the average system LMP, which is published by
SENER prior to auctions and serves as a guide to bidders for locational price differences. A projected
15 percent reduction in LMPs compared to the first auction illustrates a trend toward price convergence
for generation in Mexico, and explains why location played a far less important role in the second
auction.
34
The third auction (A3): At an average price of $20.57 USD/MWh + CEL, A3 resulted in some of the
world’s lowest electricity auction prices ever seen, and record-low prices for Latin America. Solar and
wind were the two winning technologies for the energy + CEL product, capturing 55 and 45 percent of
contracts, respectively. Gas (which won only capacity) accounted for approximately 84 percent of sold
capacity, while solar and wind accounted for about 14 percent and 2 percent, respectively. The winning
bids are estimated to represent nearly 2.4 billion USD in investment in 15 electric generation facilities,
and the auction was highly competitive, with at least 46 submitted bids, and only 15 bids preliminarily
selected (CENACE, 2017d).
Importantly, buyers other than CFE Basic Supply (the national utility’s retail business) were permitted
to submit purchase bids in the auction through the recently established Compensation Chamber.
Iberdrola Clientes and Menkent (on behalf of CEMEX, a Mexican multinational cement company)
purchased a combined 126 MW of capacity and more than 540 thousand MWh + CELs (CENACE,
2017e). While this represents less than 10 percent of the total purchased, it marks the opening of the
competitive auction process to large energy consumers, which should ultimately make the process more
competitive and permit large consumers to achieve lower prices. Table 3 presents the accepted
purchase bid summary of Mexico’s third auction.
Table 3: Accepted purchase bid summary of Mexico’s third long-term auction (A3)
Product CFE Basic Supply Iberdrola Clientes MENKENT (CEMEX)
Capacity (MW) 1288 122.17 3.84
Energy (MWh) 5,546,896 526,136 16,500
CELs 5,546,896 526,136 16,500
Source: CENACE, Presentation of the Verdict of the 2017 Long-Term Auction
Yet what explains the seemingly excessively low pricing? While less than 10 percent of winning
purchase bids derived from new players, this additional competition may have contributed to helping
drive down prices. Mexico also has great fundamentals for renewables investment. Figure 9 on the
following page illustrates that much of Mexico receives more than two thousand kWh per square meter
of solar irradiation year to year; these are very favourable conditions. Germany’s sun conditions are
only about half as favourable (Davis & Irastorza, 2017), yet the country consistently ranks in the top
three nations globally in MW of installed solar capacity. Mexico’s prime solar locations are also mostly
available, as only negligible solar capacity existed prior to the recent energy reform.
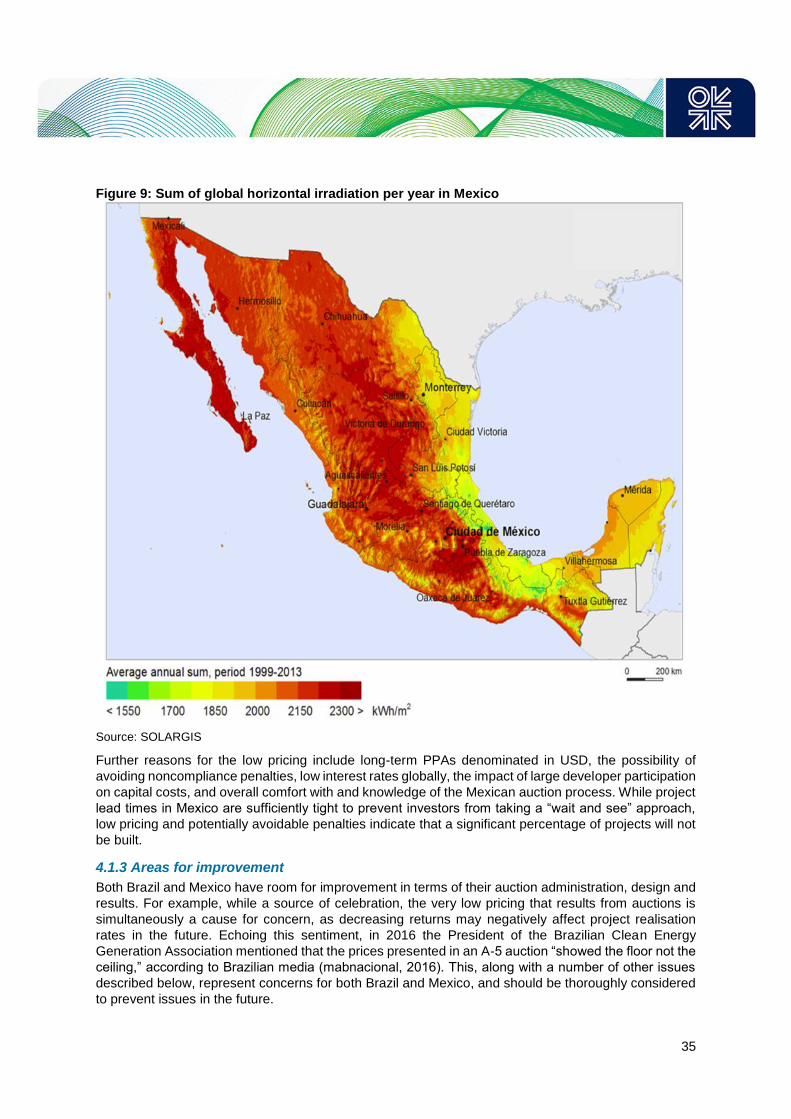
35
Figure 9: Sum of global horizontal irradiation per year in Mexico
Source: SOLARGIS
Further reasons for the low pricing include long-term PPAs denominated in USD, the possibility of
avoiding noncompliance penalties, low interest rates globally, the impact of large developer participation
on capital costs, and overall comfort with and knowledge of the Mexican auction process. While project
lead times in Mexico are sufficiently tight to prevent investors from taking a “wait and see” approach,
low pricing and potentially avoidable penalties indicate that a significant percentage of projects will not
be built.
4.1.3 Areas for improvement
Both Brazil and Mexico have room for improvement in terms of their auction administration, design and
results. For example, while a source of celebration, the very low pricing that results from auctions is
simultaneously a cause for concern, as decreasing returns may negatively affect project realisation
rates in the future. Echoing this sentiment, in 2016 the President of the Brazilian Clean Energy
Generation Association mentioned that the prices presented in an A-5 auction “showed the floor not the
ceiling,” according to Brazilian media (mabnacional, 2016). This, along with a number of other issues
described below, represent concerns for both Brazil and Mexico, and should be thoroughly considered
to prevent issues in the future.
36
5. Recommendations and considerations
The below recommendations are initial observations of the authors of this report regarding the potential
for improvements to current auction design in Brazil and Mexico. They are not meant to identify and
outline the concrete steps, including the specific studies, legislation and regulatory approvals that would
be necessary to amend auction design. The complexities of auction design reform implementation go
beyond the scope of this report. Instead, the recommendations are an initial step in providing detailed
qualitative analysis regarding aspects of theory, design features and auction implementation that
warrant serious consideration and regular review. The recommendations examine specific design
issues and auction elements that could be amended or further developed in order to improve auction
outcomes. These recommendations are not mutually exclusive, and could be applied concurrently to
achieve optimal results.
5.1. Pricing rules
In terms of auction pricing theory, the revenue equivalence theorem suggests that payments or
revenues deriving from the differing auction pricing methods, including pay-as-bid and uniform pricing,
should be identical. Accordingly, if revenue equivalence reflected the reality of auction price outcomes,
the selection of pricing rules implemented in Brazil and Mexico would be irrelevant. However, revenue
equivalence depends on equal risk appetite and information symmetry among bidders, particularly
regarding the value of the auctioned goods and the costs of competitors (Oren, 2004). Literature on the
subject (Engelbrecht-Wiggans, 1988) indicates that in addition to the above requisites, revenue
equivalence between pricing methods only applies to single unit auctions. Under these conditions, both
the auctioneer and bidders should be indifferent regarding the auction pricing method employed, as any
method would yield equal results.
However, the revenue equivalency theorem is unlikely to hold true in the cases examined in this paper,
as risk appetites vary widely among investors and there can be significant information asymmetry in
electricity procurement auctions. Further, as multi-unit auctions are utilised in both Brazil and Mexico,
neither country meets the revenue equivalence requisite of only auctioning single units. The issue of
implementing a pay-as-bid or uniform price (also known as pay-as-clear) pricing rule is therefore
significant for renewable procurement in both countries, as the two methods can result in different
outcomes in terms of pricing and support costs, actor diversity, market competition, sector innovation
and efficient resource allocation.
Selecting a pricing rule in a multi-unit auction setting involves trade-offs and depends on auction
environment parameters and the specific objectives of the auctioneer. The pricing rule decision is thus
an empirical question at its root. As such, there is no single answer or consensus on the best pricing
rule in the corresponding literature, yet given its importance, the issue is worth exploring in terms of
implications for auctions in both Brazil and Mexico. The below considerations provide a qualitative
theoretical overview of pay-as-bid vs. uniform pricing.
5.1.1 Pay-as-bid vs. uniform pricing
Currently pay-as-bid pricing rules are in place in both Brazil and Mexico. Yet uniform pricing has several
benefits when compared to pay-as-bid pricing, and is therefore worth considering.
As pay-as-bid auctions imply that project developers receive the price of their own bid, there is
significant incentive to attempt to estimate the market clearing price in order to bid the highest price
while remaining competitive enough to be the unit on the margin of the supply curve. In a pay-as-clear
auction (also referred to as a uniform price auction), all winning bidders receive the clearing price at
which aggregate supply meets demand, or alternatively, the price bidders receive can be set to equal
the highest rejected bid27 (known as a second-price auction or Vickrey auction). In this case, when there
27 The bid directly above the market clearing price, which is the lowest uncompetitive bid.
37
is enough competition, any single bidder is unable to impact the market clearing price unilaterally thus
he is incentivised to bid at his lowest acceptable price to increase the chances of clearing in the auction.
A rational investor would therefore bid at cost, plus a reasonable rate of return. This incentive differs
greatly from that of a pay-as-bid auction, where rational investors are incentivised to guess the market
clearing price, and bid at or right below that price.
Theory suggests that pay-as-bid auctions could result in higher prices than their uniform price
counterparts, because pay-as-bid auctions incentivise bidders to bid above cost (Pfeifenberger et al.,
2017). However, this may only hold true if perceived competition is low. If competition among bidders
is perceived as high, the incentive to bid at (or just below) the estimated market clearing price may not
result in higher prices when compared with pay-as-clear auctions, as the estimated market clearing
price may be very low.
Actor diversity
Consequently, pay-as-bid pricing may disadvantage small project developers, as profits largely depend
on the bidder’s capacity to accurately estimate the clearing price. Large developers, which often enjoy
significant resources and experience, may guess clearing prices more precisely than their smaller
counterparts. Auction design that limits actor diversity could have long-term implications for the market
and sector as a whole, as providing a level playing field between large and small participants would be
more likely to lead to the inclusion of both, which has positive implications for competition and
innovation. Pay-as-bid pricing can also limit actor diversity due to favouritism for market incumbents
and excessively low pricing (discussed further below).
Alternatively, some auctioneers may perceive that it is advantageous to create circumstances which
favour large project developers with long track records and ample financial resources, under the
presumption that prospects of project realisation increase with developer experience and resources.
Yet design issues like penalties for noncompliance and lead times are more likely to help shape project
realisation rates than the size of the project developer.
Strategic behaviour
Beyond actor diversity, pay-as-bid pricing can encourage strategic behaviour as project developers are
incentivised to expend excessive amounts of time, financial resources and human capital to guess bid
prices. Walking the line between revenue maximisation and bid competitiveness can be risky, as project
developers may overestimate the maximum winning bid and lose the auction. However, pay-as-bid
auctions still provide a strong incentive for price guessing. For example, in a pay-as-bid auction, if the
highest accepted bid for energy is $75/MWh, a project developer that bid $40/MWh would leave an
additional $35/MWh on the table. Using this example, a project that wins five million MWh in an auction
would forego hundreds of millions dollars over the lifetime of the project. Accordingly, the incentive to
expend resources on guessing the auction bid prices is high.
There are indications that such behaviour may be taking place. In an investor presentation, one project
developer mentions its success in being awarded wind projects in four auctions in Brazil from 2013 –
2015, with the second highest bid in all four auctions in Brazil, and the highest capacity factors in each
auction. The auction types included A-3 (new capacity to be brought online with three years) and
reserve auctions. Winning the second-best price in four auctions with the best capacity factors implies
a savvy bid team that have developed a method of estimating the highest bid price in different types of
auctions. Low capacity factors would normally imply a higher bid price in order to make up for fewer
MWh produced. Yet in this case, profits associated with the second highest price are further increased
by the highest capacity factors in the auction (more than 50 percent and in some cases almost 60
percent) (Rio Energy, 2017).
There is nothing illegitimate or dishonest associated with such behaviour; rather, it is a for profit
enterprise doing its job well. The pay-as-bid approach that results in higher economic rents for savvy
investors could also have positive unintended consequences. For example, it can be inferred that teams
38
with the know-how to maximize profits in such a manner are equally astute and meticulous during
project development in terms of managing the regulatory process, bringing the project online
sustainably and on schedule, and operating in a mutually beneficial manner (the project developer
alluded to above has invested more than $2 million USD in programmes supporting local services). The
higher economic rents provide further incentive to bring the project to fruition.
There are also opportunities to behave strategically under uniform price auctions, especially if multiple
units are auctioned. For example, developers which bid for multiple units in a uniform price auction
could bid in such a way to ensure that a maximum number of its units (projects) clear the auction, while
attempting to guess and subsequently bid the highest possible competitive price with an additional unit.
While a single project developer could conceivably have multiple units in an auction and set the market
clearing price while bidding all projects at cost plus a rate of return, the developer may also be able to
coordinate bid prices to maximise its number of winning units and the market clearing price which those
units will claim. Thus, it can be argued that pay-as-bid pricing may be more apt for multi-unit auctions
in certain situations.
Further opportunities for strategic behaviour in uniform price auctions are likely limited and less
complex. For instance, a bidder could conceivably offer an excessively low price in order to ensure a
winning bid, predicting that the market clearing price (or lowest rejected bid) would ensure cost recovery
and return on investment.28 Yet if implemented on a wide scale, bidders would risk applying excessive
downward pressure on the clearing price, undermining their own strategy and the economics of their
projects (AURES, 2016b). Accordingly, rational investors would likely avoid this approach due to
excessive risk.
Low pricing and the winner’s curse
Pay-as-bid schemes may make bidders more susceptible to the winner’s curse, the phenomenon of
bidders unintentionally bidding below their costs. In this case, a winning bidder may receive a project
award as a result of unrealistic estimations of unknown costs. The winner’s curse, in a way, is the
inverse of the strategic behaviour phenomenon, which causes bidders to submit optimal (deliberately
high) bid prices that correspond to their capabilities (price estimation) and business needs (profit
maximisation). Conversely, for project developers with different business needs (i.e. increased market
share or guaranteed market presence even at lower returns), the desire to win the right to build a project
can inspire aggressive bidders to bid excessively low prices.
Very low pricing, as seen in Mexico, can be positive and is typically viewed this way and even
celebrated, as auctions appear to be fulfilling their role in encouraging high levels of competition and
least-cost power. However, underbidding can lead to underbuilding, as overly aggressive pricing may
result in investors exposing themselves to excessively low or even negative returns, which can lead to
higher non-completion rates for projects, or cause insolvency at some point in the project lifecycle. The
competitiveness of auctions has led a ‘race to the bottom’ phenomenon in which project developers bid
record low prices to win PPAs. Very low bids are partially a result of cost reductions for intermittent
renewable sources; from 2010 to 2015, the LCOE of solar PV declined 58 percent (BMI Research,
2016). Low pricing, even if truly feasible under the economic conditions in which the auction occurs,
provides a low margin for error, and could quickly become unviable due to fluctuations in currency value,
credit access, cost of capital or other macroeconomic issues. While some of the projects awarded under
aggressive pricing will be built and provide low cost electricity, it is likely that a percentage of projects
will “race through the bottom” and never be realised.
Lastly, low pricing is likely to limit actor diversity in the auctions, by favouring large project developers,
especially market incumbents. In addition to greater economies of scale and more development
experience, large project developers typically have cheaper and easier access to financing.
28 This happened in the second round of CfD auctions in the UK.
39
Accordingly, it can be difficult for smaller or local developers to compete. For example, in Mexico’s first
two long-term auctions, the lowest bid in each auction was either claimed by a large multinational
developer, or a smaller developer backed by an experienced and established private equity firm. Such
has been the case in Brazil, where small project developers seem to have been at least partially
excluded from auctions due to low prices. A 2012 statement from Desenvix Energias Renováveis, a
leading project developer at the time, mentioned that “the returns are far too low for us,” and accordingly
did not participate in a 2012 auction (Deutsche Bank, 2012).
Pay-as-bid auctions tend to favour incumbents over new developers even if economies of scale, access
to capital and financing issues, and all other factors are equal. As incumbents have accumulated
information about bid offers, and likely have experience estimating bid prices based on the specific
market conditions, new players can face additional difficulty in entering the market (Pfeifenberger et al.,
2017), which has negative implications for competition and innovation in the long-term.
Impact on provisions for renewables and social welfare
Pay-as-bid pricing can also be misaligned with other renewable cost incentives provided by
policymakers. In the case of Brazil, wind receives a 50 percent discount and solar PV receives an 80
percent29 discount on grid tariffs. Yet as developers are not encouraged to bid at cost under the pay-
as-bid scheme, the grid discount provision may serve to increase investor returns without translating
into less expensive electricity for end users. This effectively creates a subsidy in the case that there are
special provisions to reduce the cost of renewables for the project developer. Further, uniform price
auctions provide benefits by incentivising investors to bid at their lower acceptable price (so end users
are more likely to enjoy the benefit of the grid tariff provision, as in the case of Brazil).
As the market clears the lowest cost generation mix under uniform pricing, social costs (expense to
society as a whole) are also reduced, which in turn reduces end user costs in the long-term. Equalising
the value of identical products also provides incentive for investors to innovate to achieve cost
reductions and efficiency improvements as they compete with their peers (Pfeifenberger et al., 2017).
On the other hand, pay-as-bid auctions may encourage inefficient resource allocation if low-cost
resources bid too high and do not clear, causing higher-cost resources to take their place. These
inefficiencies can drive higher system and end user costs in the long-run (Pfeifenberger et al., 2017).
Institutional preferences
In Brazil there is an institutional preference for pay-as-bid auctions. The assumption is that pay-as-bid
auctions yield lower rents from project developers and thus lower electricity prices, as auction winners
are paid their specific price, as opposed to the market clearing price. While such thinking is intuitive, it
ignores fundamental marginal pricing theory and overlooks the potential for bid prices to increase if
auction participants win their offer price. Perhaps most importantly, such institutional preferences fail to
recognise the promotion of long-term competition and innovation as a pivotal issue in pricing rule
design. According to Alexandre Viana who served as the Auctions and Regulated Market Executive
Manager at Brazil’s market operator (CCEE) where he worked for more than 18 years, “Brazilian
policymakers and control entities, such as The State Compliance Court (TCU – Tribunal de Contas da
União), have a passion for pay-as-bid,” for the reasons described above. Dr. Viana believes that any
effort to alter the pay-as-bid approach would be met with great resistance (Viana, 2018).
Pay-as-bid vs. uniform pricing: considerations
The above considerations indicate that the uniform pricing rule is better suited in most long-term
electricity auctions, including renewable energy auctions. The most important factor that tips the
balance in favour of uniform pricing (under most circumstances) is the fostering of long-term competition
and innovation through the encouragement of new (and perhaps small) market entrants. However, this
29 Solar PV commissioned after 2017 will receive a 50 percent discount.
40
does not suggest that the uniform pricing rule is always ideal. For example, Ausubel et al. 2014 indicates
that pay-as-bid pricing can be optimal in settings with symmetric bidders30 and flat demands in terms of
efficiency and revenue maximization for bidders, and may also be optimal in symmetric information
environments with decreasing linear marginal utility. While Brazil and Mexico may not face these
circumstances, the auctioneer must make an informed decision regarding pricing rules given the trade-
offs and the given objectives of the auction. Auction designers should seriously consider uniform pricing,
and only abandon this pricing strategy when there is sufficient evidence that the auction environment is
not suitable for this pricing rule.
Power Auctions LLC (2016), a consultancy hired by Mexico’s SENER also recommended that a uniform
pricing structure “makes bidding easier by reducing the need to guess what others will bid…the key
advantage of a uniform price rule is that bidders can spend more time focusing on the minimum price
they need to provide capacity, energy or CELs and less time focusing on what the other bidders are
going to bid.” Similarly, the Brattle Group (2017), a consultancy, identified some of the abovementioned
advantages and disadvantages (in the context of capacity markets) and identified uniform pricing
auctions as the “evolving as best-practice approach based on international experience” and are
“expected to achieve lowest societal costs and lowest customer costs in long-run.”
To adopt a uniform price auction in Brazil under the two phase-hybrid auction that was employed until
2017, only phase two of the current auction structure would change. Phase one of the auction, in which
a descending clock scheme is employed to phase out less competitive bids and determine the celling
price for phase two, would remain the same. Phase two, a pay-as-bid sealed bid process, would change
to a uniform pricing sealed bid process. Under Brazil’s new continuous trade reverse auction, the
structure appears compatible with uniform pricing as is, yet uniform pricing could change the incentives
associated with replacing the temporarily disqualified bids. Further analysis would be required regarding
uniform pricing and the replacement bid scheme. In Mexico, the first phase of the auction, which also
operates as pay-as-bid sealed bid structure, would be replaced with a pay-as-clear sealed bid process,
in which sale bids and purchase bids are matched the same way as under the current structure. The
iterative process, which is only triggered if the minimum level of economic surplus is not reached, would
remain the same. In the above cases, auction winners could receive the lowest rejected bid (the bid
directly above the market clearing price, which is the first uncompetitive bid), or the market clearing
price.
If Latin America’s two largest economies seek to limit strategic behaviour and non-completion rates, as
well as hold inclusive auctions that encourage dynamic efficiency and innovation, the specific trade-offs
between pay-as-bid and uniform pricing in each respective market should be considered.
5.2 Technology-specific, multi-technology and demand response participation in auctions
A combination of technology-specific and multi-technology auctions have worked well in Brazil, and
Mexico’s multi-technology auctions have functioned as well. However, both countries could benefit from
additional (yet limited) technology-specific auctions to further diversify generation. For example, a
greater proportion of technology-specific, or targeted multi-technology auctions, may help Brazil to
further diversify its generation mix, which is still overly dependent on hydro. While Mexico’s multi-
technology auctions are encouraging the deployment of significant solar and wind generation, further
diversity among winning auction technologies could be beneficial, particularly for dispatchable
renewables.
While technology eligibility requirements may present one opportunity to help both countries diversify
renewable generation, further support for specific technologies should be implemented on a select
30 Symmetric bidders in this case alludes to cases in which all bidders obtain their bid values from an identical probability
distribution
41
basis. Limiting auctions to several specific technologies can help immature technologies to become
competitive and achieve carbon reduction targets, however, these same limits are not helpful for cost
reduction and innovation in the long-run, particularly when they support mature technologies.
Additionally, both Brazil and Mexico could benefit from including demand response as an eligible
participant in auctions.
5.2.1 Brazil
In 2007, Brazil held a multi-technology auction for biomass and small-hydro. Based on the success of
this 2007 auction, Brazil held its first true technology-specific tender in 2008, exclusive to biomass, and
held technology-specific auctions for wind in 2009 and 2010. Technology-specific auctions provided the
opportunity for biomass and wind to develop in Brazil and become important components of the
generation mix. For example, in a 2011 multi-technology auction, wind and biomass competed against
conventional technologies, resulting in lower average prices than natural gas generation. With 10,434
MW and 11,404 MW now installed respectively, wind and biomass make up more than fifteen percent
of Brazil’s installed capacity. Overall, Brazil has succeeded in increasing the competitiveness of once-
nascent technologies and integrating them into its generation mix.
However, hydro generation, at 98,730 MW, still represents 65 percent of Brazil’s installed capacity, and
typically accounts for more than 70 percent of electric generation. This makes Brazil the world’s second
largest hydro generator behind China. Overdependence on hydro inhibits security of supply, as seen in
south-eastern Brazil in the 2012 – 2015 drought period, when reservoirs reached their lowest levels in
35 years, and water rationing and blackouts became the norm in major cities in the region. During this
period, the Brazilian government spent more than $5 billion to subsidize distribution utilities, which
substituted hydro generated power with more expensive fossil-fuel generation. While generation
diversification should be driven by overall system planning and expansion of transmission capacity,
limiting hydro’s eligibility to participate in auctions could be useful in helping Brazil to diversify its
generation matrix and bolster security of supply.
5.2.2 Mexico
While a variety of clean generation sources were eligible to participate in Mexico’s two auctions, wind
and solar represented more than 90 percent of winning energy, capacity and CELs in the first two
auctions. In the third auction, wind and solar made up 14 of the 15 winning projects. Solar is highly
underdeveloped compared to its potential in the country, and there is ample room for further wind
development as well. The auctions created a path to significant wind and solar build at low prices,
despite the lack of technological diversity among winners (and doubts related to the financial feasibility
of projects which yielded very low returns).
Yet in addition to solar and wind, there are at least eight clean energy technologies eligible to participate
in the auctions, including geothermal, biomass, hydro, nuclear, waste to energy, carbon capture,
efficient cogeneration and tidal wave. In the first auction, only solar and wind won projects, while in the
second auction, geothermal, small hydro and efficient combined cycle plants represented a minority of
winning projects. In the third auction, only one non-wind or solar project (gas) submitted a winning bid
(winning only capacity, with no accompanying energy or CELs).
To further encourage baseload renewable technologies such as biomass, biogas or geothermal, Mexico
can consider holding technology-specific auctions for these individual generation sources, or holding
multi-technology auctions for baseload renewables (as Brazil did in the early days of its auctions).
Providing a framework for these technologies to prove themselves competitive in Mexico would
contribute to system reliability, as dispatchable renewables complement intermittent technologies.
Technology-specific or exclusive multi-technology auctions for baseload renewable energy sources
would also provide a means of helping these technologies to take advantage of Mexico’s abundant
resources (for example, the country has an estimated 13.5 GW of geothermal potential, yet currently
has only around 900 MW of installed capacity) (NREL, 2017). While holding auctions for these
42
technologies may not encourage least-cost development in the short-term, maximising all of Mexico’s
renewable energy sources may increase efficiency, enhance system reliability and create more long-
term economic opportunity.
5.2.3 Demand response as an eligible auction participant
Demand-side resources like energy efficiency and demand response can participate in capacity market
auctions, through bidding a per MW price for offset generation. Reducing demand through load
shedding or energy efficiency can reduce the short-term price of electricity and result in long-term
avoided costs of generation, as well as transmission and distribution. As such, consumers which
effectively respond to price signals or implement efficiency measures provide value to the overall
system by increasing available capacity and reducing system costs. These consumers should be
entitled to compensation for the value they provide to the grid. Including a remuneration mechanism to
provide consumers with an economic incentive to offer these grid services could help reduce system
costs and increase efficiency.
While implementing such a mechanism is complex, it is feasible. Markets in the United States and the
United Kingdom have such mechanisms in place. In the short-term, Mexico is more equipped to
implement the market participation of demand-side resources, as it has a functioning capacity market,
and is already planning to implement demand response services in 2018. Brazil would first need to
establish a formal capacity market (discussed further below), and then establish and implement a
regulatory framework for demand-side resources, part of which would include their eligibility for
participation in capacity auctions. Both countries would also benefit from demand-side resource
aggregators, which could participate in the capacity auctions on the behalf of consumers. The
aggregation service could be provided by existing energy service companies who wish to enter a new
business, or new companies.
5.3 Determining auction product(s)
While Brazil’s complex market mechanisms have worked well to increase installed capacity and improve
reliability, security of supply remains uncertain. Including a formal capacity product and a corresponding
market may help resolve this issue. Conversely, Mexico has offered three products in its long-term
auctions: energy, capacity and clean energy certificates (CELs). This approach has worked well for
Mexico thus far, though its mid-term auction requires corrective action, but given the market’s short
track record it may still be too early to make a proper evaluation. Further, the products sold through
Mexico’s mid-term auction can be utilized more efficiently.
5.3.1 Brazil
While forward contracts and firm energy certificates (FECs) may somewhat resemble capacity market
features, currently energy is the only official product in Brazil’s long-term auctions. The specific energy
products are forward contracts which cover the distribution companies’ load forecasts, which helps
reduce risk for generators, and increases security of supply. Further, in an energy + capacity bundle,
auction winners receive firm energy certificates (FECs), which are required to cover their contracts, and
are tradable. The FECs serve to monitor and maintain the nation’s supply-demand balance, and as
each participant is in charge of its own load, FECs and contracts, the certificates are essentially a
decentralised mechanism to secure supply.
The introduction of a proper capacity market may help encourage investment in capacity and mitigate
the likelihood of supply shocks. In fact, according to Alexandre Viana, former Executive Manager of
Auctions and the Regulated Market in Brazil’s Chamber for the Commercialisation of Electric Energy
(CCEE), there is discussion within the CCEE of creating a separate capacity market. To this end, a
proposal was sent to the Brazilian Congress with the objective to create a capacity market by 2021.
The initiative could unbundle capacity and energy, and possibly introduce renewable certificates. The
capacity market would potentially include centralised auctions five years ahead of project delivery, with
43
costs shared by all customers. The mechanism would operate under the management of the CCEE
(Viana, 2017).
Instating a capacity market based on international best practices with auctions as the capacity allocation
mechanism would achieve several ends. First, replacing the FEC scheme with a proper capacity
mechanism would provide investors with a familiar market framework in which to operate, particularly
considering that the FEC calculation method is quite complex, and varies significantly depending on the
generation technology. Second, providing investors with an additional source of income to include on
their balance sheets may help installed capacity keep up with demand growth. For example, annual
demand growth of 4.24 percent from 2011 – 2013 exceeded the expansion of installed capacity, which
increased just 3.79 percent in the same period. Coupled with drought, this helped lead to a supply crisis,
causing widespread rationing in Brazil. Lastly, a traditional capacity market could help lower the cost of
capital for generators, and increase the diversity of auction participants. Existing generators should be
eligible for any capacity market mechanism implemented if they do not already receive any other form
of subsidy. If more capacity is built, wholesale power prices could fall, so existing generators will require
extra remuneration through the new capacity markets to avoid revenue shortfalls or, in the extreme
case, a stranded asset situation.
5.3.2 Mexico
Mexico’s tri-product system in long-term auctions seems to be functioning successfully in terms of
creating demand for and auctioning the three products in long-term auctions. Most notably, the
government has successfully created demand and a marketplace for CELs. Part of the reason for the
success of the CEL market to date is its simplicity. While Mexico’s CELs and Brazil’s FECs serve
different functions, one reason Brazil may choose to move away from FECs and migrate closer to a
traditional capacity market is the complexity of the system. Conversely, the CEL market is quite
straightforward, with clean energy generators receiving one CEL per MWh of output, and the CEL
requirements mirroring national clean energy goals.
However, Mexico’s first mid-term auction which offers products of its own proved inefficient, and should
be improved to encourage making the best use of its products. The mid-term auctions serve as a market
hedge for load serving entities which seek to offload uncontracted energy and /or capacity in advance.
The results for Mexico’s first mid-term auction were released in late February 2018, however no
electricity or capacity contracts (the auction’s only two products) were awarded. This was the result of
a significant mismatch between demand bid prices and supply bid prices.
The mid-term auctions cause generators to face a trade-off between locking in contracts through this
mid-term hedge market, or selling directly into the short-term markets. In the auction, demand submitted
very low purchase bids, perhaps with the prices of the long-term auctions in mind. Yet the two contests
offer very different products; long-term auctions serve to allocate the right to build and secure financing,
while mid-term auctions offer a hedge for existing generators. Demand may have failed to recognize
this distinction. The mid-term auctions represent a meaningful opportunity for load serving entities to
secure contracts with end users. Auction participants on the demand side should fully recognize the
purposes of each type of auction to avoid submitting unrealistically low bids based on expectations from
a different type of contest. To avoid inefficient outcomes in the future, the auctioneer should also ensure
that auction participants are fully aware of such distinctions.
5.4 Determining auction frequency, volume and lead time between auctions and commercial operation
5.4.1 Frequency and volume
Both Brazil and Mexico maintain regular auction patterns, which helps decrease market uncertainty for
investors, can lead to lower bid prices, and has other secondary benefits for supply chains and local
industry. Since 2005, Brazil has typically held three to four auctions per year. Mexico held its first
auctions in 2016, yet is on track to convene two to three auctions per year. While increasing the
44
predictability of auctions through exact auction intervals would be ideal, such timing is also unrealistic
given system and administrative constraints and realities. Accordingly, Brazil and Mexico are both
largely efficient in terms of the frequency with which they hold auctions (in Mexico, it still may be early
to make a proper evaluation).
However, tenders should only be held when a market is able to absorb the auctioned generation and is
prepared to facilitate project development. Recession in Brazil has led to weaker demand growth than
expected, and an excess of power supply. Accordingly, in 2017 Brazil held a de-contracting auction to
cancel projects (mostly solar PV and wind) that it had awarded in reserve energy auctions in 2014 and
2015. Beyond the recession, it is likely that delays related to project finance, permitting and other
administrative issues were responsible for significant project delays, which led to a backlog of projects.
Combined with the economic downturn, this provided the government with the pretext to cancel auctions
and start fresh.
Winners of the de-contracting auction avoided non-completion fines and forfeiture of their project bonds.
The auction functioned as an ascending auction, where bidders place progressively higher bids with a
starting price of approximately $10 USD /MWh. The bid value is then multiplied by the electricity that
would have been delivered during one year of the contract. For example, at the auction’s starting price
a generator with a 1 MW plant would pay 1MW x 8760 hours x 10/MWh = $87,600 USD. Each generator
therefore had the opportunity to evaluate whether it made more economic sense to relinquish the five
percent project bond and pay the penalty fee of one year of electricity at contract price, or participate in
the auction. For the majority of generators, participating in the auction proved a better option.
While this de-contracting mechanism was innovative and resolved the issue, it may have simultaneously
created a degree of moral hazard, as project developers were able to avoid full penalties. Project
developers may assume the same mechanism will be available in the future if a similar situation arises.
Further, the mechanism required significant time and effort to develop on the part of the Brazilian
government. The exact opportunity cost of this time and effort is unknowable, however if Brazil had not
contracted too much capacity, the time and effort could have been better spent. Lastly, cancelling
projects across the board from multiple auctions negatively impacts investor confidence, which could
affect the cost of capital and bid prices.
This example serves as a lesson for Brazil, Mexico and other markets which use centralised auctions
for power procurement. Due to macroeconomic conditions in Brazil, typical annual demand growth of
approximately four percent dropped to 0.9 percent in 2016 and is forecast as 2 percent for 2017. When
determining auction dates and volumes, governments should take into account worst-case demand
scenarios, and develop precautionary measures, or a means to cope with excessive capacity if demand
unexpectedly drops due to external factors. For example, policymakers can start with minimum demand
and correct this estimation in subsequent re-configuration auctions. Governments should also ensure
that a certain number of projects from the most recent auction are making tangible progress toward
development before holding a follow up auction.31
For example, instituting a requirement for a percentage of projects to achieve certain milestones before
holding a follow up auction would reduce project backlog. If 50 percent of projects from the first auction
were required to have achieved project financing and permits before holding a second auction,
bottlenecks would be reduced. Allowing additional time between auctions would allow for initial projects
to develop while demand scenarios play out. Increasing the likelihood that the market is able to absorb
the auctioned capacity and that developers are able to achieve project milestones can also be achieved
through decreasing auction volumes. Fewer project developers pursuing financing, permitting,
interconnection agreements and other project milestones may facilitate quicker development.
31 This issue is further complicated in Brazil by industry lobbies which seek to increase the demand of the specific technologies,
and apply political pressure for new auctions even when the distribution companies do not necessarily require them (Viana, 2018).
45
5.4.2 Volume setting
In both Brazil and Mexico, volume is set by the expected demand of the offtakers, which is self-reported
by offtakers in both countries. Offtakers have much better insight into their future short- and long-term
energy needs than policymakers do, and have an economic incentive to procure the amount of
electricity and related products that correspond to their business needs. 32 Accordingly, this is the
appropriate approach. Policymakers should intervene to reduce the offered demand if the expected
supply in the auction is expected to be less than the aggregate demand of the offtakers, in order to
ensure a competitive process. Further, one factor that increases the risk of errors in demand forecasting
is the penetration of distributed generation. While offtakers include such variables in their demand
forecasts, policymakers can attempt to facilitate a more precise calculation of distributed generation
penetration through full disclosure of upcoming distributed generation policy and legislation, and by
ensuring that government studies on the subject are made public.
5.4.3 Lead time
The moral hazard associated with evading penalties is amplified by long project lead times, as described
in section 2.2.7 of this paper. Mexico requires that projects reach commercial operation by January 1
of the third calendar year, after the initial date of the request for proposal (RFP). For bids that are
submitted in the calendar year after the RFP, commercial operation must be achieved within two years
of bid submission. Two to three years of lead time, combined with enforceable noncompliance penalties,
is reasonable and should not provide project developers the luxury of bidding in the present, only to
“wait and see” how market trends develop before making a final investment decision.
Brazil typically implements auctions with project lead times of three and five years, yet held a multi-
technology auction in December 2017 with a lead time of six years (A-6). The six-year lead time, with
projects not required to reach commercial operation until 2023, is Brazil’s longest yet. The majority of
the auction capacity was claimed by gas (56 percent) and wind (36 percent), with biomass and small
hydro making up the remainder (CCEE, 2017). Prices averaged approximately $30 USD for wind, and
from $64 to $67 for the remaining technologies.
The project development process in Brazil likely requires slightly more lead time than in Mexico. At
160,000 MW of installed capacity, Brazil’s power system is more than double Mexico’s 73,500 MW, and
also covers a much larger area, serving more people. Further, Brazil’s system is more fragmented, with
many transmission and distribution companies, and depends heavily on non-drought hydrology
conditions, which add complexity to system planning. Still, six years of lead time between auctions and
commercial operation may be excessive, particularly given the timing.
Instating Brazil’s longest lead time immediately following the de-contracting auction may cause project
developers to bid in the auction without committing to a final investment decision. The December 2017
A-6 auction may have resulted in highly competitive pricing for wind, for example, with the expectation
that some technology prices will fall before projects are shovel ready. Long-term assumptions regarding
fuel prices, project financing, electricity demand and other trends may also help drive down bid prices.
In Brazil’s December A-4 auction, projects must reach commercial operation two years sooner than the
A-6, and prices were about $3 USD/MWh higher. Long-term pricing and market assumptions could be
the reason. If project developers view the risk-reward profile of submitting uncommitted bids as
favourable, they are incentivised to take this approach. For example, if estimated lifetime profitability of
a project at the price of the uncommitted bid exceeds the estimated penalty (in a de-contracting auction
or otherwise) by millions of dollars, project developers may decide to take the “wait and see” approach.
32 This statement generally holds true, except in situations in which the offtaker is a system operator that is responsible for
security of supply; this may lead to a tendency to over-procure.
46
5.5 Penalties
Prequalification requirements and the prospect of harsh penalties in the case that project developers
do not fulfil their plans is essential to auction efficiency. While both Brazil and Mexico have established
prequalifying requisites and harsh penalties, further steps should be taken to ensure that penalties are
implemented and institutionalised. Opportunities for non-compliant project developers to recover their
bid bonds or avoid additional penalties outlined in the auction rules should therefore be limited.
For example, as Power Auctions LLC (2016) points out in its study for SENER, winning bidders in
Mexico may be able to avoid paying penalties by shifting blame to the Mexican government, highlighting
the possibility that “a winning bidder might be able to avoid all penalties for having a non-operational
plant even if only a very small part of the delay was caused by the government not fulfilling some of its
own deadlines.” Specifically, the consultancy emphasises that it may be easy for project developers to
avoid penalties if initial social and environmental impact studies are rejected by the government.
Power Auctions LLC suggests performance standards as a means of dealing with this issue, which may
include a CENACE-enforced restriction in which project developers are limited in their ability to delay a
project’s commercial operation date due to social and environmental impact studies. If a project must
be delayed due to legitimate reasons, CENACE could create a scheme in which project developers can
declare their contracts void, with the quantity of electricity products under the contract available for
purchase to the same project developer in the next auction. This would allow the project developer to
continue with the initial project under revised dates. Yet if the project developer does not declare the
contract void, the initial bid and contract terms would remain, with any delays resulting in penalties
(Power Auctions LLC, 2016). Under this scheme, there would be a process for limited force majeure
requests (i.e. transmission delays).
The above approach certainly creates additional risk for project developers, who risk losing the projects
outright in the follow up auction once initial contracts are declared void. However, under the current
structure in both Brazil and Mexico, there may be scope for project developers to continuously delay
projects for business reasons, such as lack of available financing, or waiting for technology costs to
decline further. If delays are avoidable, project developers should be held accountable, and should not
be afforded the opportunity to shift blame to the government. Brazil’s recent de-contracting auction, in
which project developers that offered the highest price avoided non-completion penalties, while at least
somewhat punitive, may still be a form of amnesty for noncompliant investors.
In addition, in terms of prequalification, Mexico’s bid bond calculation methodology may result in
relatively low bid bonds. For example, to be able to win a project in Brazil, bidders are required to submit
bonds worth five percent of the project’s estimated investment costs. In Mexico, on the other hand, the
bond includes a fixed fee of about $99,000 (regardless of the number of bids submitted by the same
generator), approximately $21,000 per MW of capacity offered in the auction in a year, plus $10/MWh
and $5/CEL (Clean Energy Certificates) offered in the auction in a year. Auction participants can reduce
this bid bond up to 50 percent by securing an early interconnection agreement. Depending on
technology and country-specific capital costs and specific offers, Mexico’s bid bond may prove low
when compared with a fixed percentage of estimated project costs (particularly if no capacity product is
offered).
For the 14 winning solar and wind projects in Mexico’s third auction, the average bid bond submitted
was 11 percent (nearly 900,000 USD) lower than it would have been under Brazil’s 5 percent of
investment cost methodology (not including any discounts from early interconnection agreements).
Including the one winning gas project (which won capacity only) increases this difference to 13 percent,
more than 1.3 million USD lower than under the 5 percent methodology. The design of the bid bond in
Mexico is not fixed and highly sensitive to offer capacity offers; this could be an intentional attempt to
encourage lower financial commitments from intermittent renewables which may be less likely to seek
winning significant capacity in the auctions. However, lower bid bonds can also result in lower project
realization rates and increase speculative bidding among auction participants.
47
5.6 Grid connection regulatory model
The grid connection regulatory model is extremely important for generation development, and for
renewables in particular. In Brazil, developers are exposed to most costs associated with
interconnection, including any necessary improvements to grid infrastructure like substations (Viana,
2017). In Mexico, CENACE (the system operator) publishes a list of substations with available capacity,
yet it is still the responsibility of the bidders to pay for the interconnection. Accordingly, in both Brazil
and Mexico, bidders could be liable for significant system upgrade costs if they must connect to a
substation that does not have available capacity.
If renewable generators are exposed to deep cost allocation, meaning the full costs of interconnection,
this can put renewable developers at a disadvantage when competing with conventional resources. Site
selection for renewables is already reduced by the availability of sunlight, wind and other natural
resources, and could be limited further if prospective areas are far from the grid or so remote the grid
is nonexistent. However, from a social welfare perspective, it can be argued that renewables should be
exposed to their full economic costs, including integration and grid interconnection. If renewables avoid
full cost exposure through inefficient siting, welfare is not maximised, as renewable investment would
occur where it is uneconomical.
Special provisions for renewable interconnection costs in Brazil and Mexico do not appear necessary.
While such provisions could help reduce risk, lower the cost of capital, and open a variety of additional
renewable siting opportunities, the two nations are already experiencing success in auctioning
renewables under their respective models, and achieving very low prices. Accordingly, their deep cost
allocation models appear sufficient.
6. Conclusions
Auctions are an efficient policy instrument for allocating renewable energy resources and risk among
parties, while encouraging price formation through a competitive competition. Yet fundamentally, the
institution of these auctions is due to the shortcomings of market liberalisation and the originally planned
short-term, time-differentiated markets in providing adequate investment signals for renewable energy
investment, appropriate generation mixes and resource adequacy (in non-liberalised markets auctions
are a step forward towards improving efficiency by introducing a market mechanism). Still, competitive
auctions are likely the most effective out-of-market mechanism to encourage renewable deployment
and related policy objectives.
While exploring the ins and outs of auction design and policy is necessary for policymakers, investors
and other practitioners, it is important to note the overarching question surrounding the future role of
auctions: are they a permanent feature of future electricity sectors, or a temporary patch that allows
governments to lower the costs of achieving certain policy objectives? This question remains quite
open-ended and uncertain. The development and reform of short-term markets (or lack thereof) to
provide more effective investment signals for renewable energy technologies will ultimately provide an
answer.
This paper contributes to the continuous review of auction design in Latin America’s two largest
economies and power markets. Through our overview and analysis:
1) We clarify the relationship between long-term electricity procurement auctions and the markets and
policy frameworks in which they exist. We also interpret specific auction design elements and illustrate
how these design elements interact with one another and create trade-offs within and among the major
auction design elements.
2) We present our understanding of how the histories of both Brazil and Mexico led each nation to
ultimately pursue auctions as their principal mechanisms of contracting electric generation and
renewables in particular. We also present our understanding of the functioning of the wholesale power
48
markets and long-term electricity procurement in these two nations, the auction design and procedure,
and the interaction between markets and the auctions.
3) We outline recommendations for both Brazil and Mexico with respect to markets, auction design and
process. Auctions are complex and must be planned and administered with prudence and
judiciousness, reviewing the successes and mishaps of others as well as the existing literature. While
there is no single model which serves as a reference, several successful models should be considered
when designing auctions, with specific best practices moulded and applied to meet the needs of a
particular geography and market.
In summation, successful auctions that meet the goals of both policymakers and society are a constant
balancing act, which includes weighing the trade-offs between specific design elements, and
simultaneously ensuring that auction procedures are apt for the electricity market design and context in
which it exists. Ultimately, auction design seeks to be consistent with the broader market context, while
spreading risk efficiently among primary auction participants so as to ensure that the auction trade-offs
do not weigh too heavily in favour of, or against, one particular class of auction participants (i.e.
investors, government, rate-payers). There are numerous trade-offs along every step of the auction
design process that impact the per-unit price of electricity resulting from the auction, the generation
technology employed and resulting carbon emissions, as well as other critical outcomes such as local
content, investor confidence and the likelihood of project completion.
Accordingly, there is no one-size-fits-all auction design mechanism or policy. Each country
implementing auctions must consider the broader market design and context as well as the myriad of
trade-offs that appear along each step of auction design, from determining what type of auction to hold,
to deciding lead times and penalties. There is no correct answer to these or other auction design
decisions. As seen in the cases of Brazil and Mexico, auctions came about in each country in their own
way and time.
Electricity markets and contexts are constantly and rapidly changing, and new auctions will breed new
short-term results and long-term outcomes. As auctions gradually become the mainstays of generation
procurement in an increasing number of nations, and more auctions are held, new innovations, design
flaws and unintended consequences will emerge. Therefore, auction administration and design must
be constantly reviewed and when necessary, updated or amended.
49
References
Agência Nacional de Energia Elétrica (2017), ‘Capacidade de Geração do Brasil,’
http://www2.aneel.gov.br/aplicacoes/capacidadebrasil/capacidadebrasil.cfm [Accessed July 2017]
Araujo, Joao Lizardo R. Hermes de; Costa, Agnes Maria de Aragao da, Correia, Tiago; Melo, Elbia,
(2008), ‘Reform of the Reforms in Brazil: Problems and Solutions,’ Competitive Electricity Markets:
Design, Implementation Performance, Elsevier Ltd.
Association of Brazilian Gas Distributors (2015), ‘A integração truncada das termelétricas a gás
natural no setor elétrico brasileiro,’ http://www.abegas.org.br/Site/?p=51538 [Accessed November
2017]
Assunção, Juliano; Chiavari, Joana; Szerman, Dimitri (2014), ‘Misreporting in wind power contracts:
Evidence from a feed-in tariff in Brazil,’ Climate Policy Initiative, https://climatepolicyinitiative.org/wp-
content/uploads/2014/05/Misreporting-in-Wind-Power-Contracts-Executive-Summary.pdf [Accessed
June 2017]
AURES (2015), ‘Overview of Design Elements for RES-E Auctions,’
http://auresproject.eu/sites/aures.eu/files/media/documents/design_elements_october2015.pdf
[Accessed August 2017]
AURES (2016), ‘Auctions for Renewable Energy Support in Brazil: Instruments and lessons learnt,’
http://www.auresproject.eu/files/media/countryreports/pdf3_brazil.pdf [Accessed June 2017]
AURES (2016b), ‘Pricing rules,’ http://auresproject.eu/pricing-rules [Accessed August 2017]
AURES (2016c), ‘Recommendations on the role of auctions in a new renewable energy directive,’
http://orbit.dtu.dk/files/131992872/AURES_redii_memo_final.pdf [Accessed August 2017]
AURES (2016d), ‘Auctions for Renewable Energy Support: Lessons Learnt from International
Experiences,’ http://www.auresproject.eu/files/media/documents/aures_wp4_synthesis_report.pdf,
[Accessed August 2017]
AURES (2016e), ‘Auction Volume,’ http://auresproject.eu/auction-volume [Accessed August 2017]
Baltaduonis, Rimvydas; Bonar, Samuel; Carnes, John; Mastrangelo, Erin (2017), ‘Risk and Abnormal
Returns in Markets for Congestion Revenue Rights,’ Federal Energy Regulatory Commission (FERC)
https://papers.ssrn.com/sol3/papers.cfm?abstract_id=2946987 [Accessed July 2017]
Barroso, Luis (2012), ‘Renewable Energy Auctions: the Brazilian Experience,’ Workshop on Energy
Tariff based Mechanisms, IRENA, PSR,
https://www.irena.org/DocumentDownloads/events/2012/November/Tariff/4_Luiz_Barroso.pdf
[Accessed June 2017]
BMI Research (2016), ‘Renewables auctions: Aggressive bidding creates feasibility risk, encourages
consolidation,’ http://www.bmiresearch.com/articles/renewables-auctions-aggressive-bidding-creates-
feasibility-risk-encourages-consolidation [Accessed July 2017]
Brown, Ashley C. (2002), ‘The Privitiazation of Brazil’s Electricity Industry: Sector Reform, or
Restatement of the Government’s Balance Sheet?’
https://www.hks.harvard.edu/hepg/Papers/ACB%20brazil%20update%2021%20Jan.pdf [Accessed 08
June 2017]
50
Brown, Craig; Poudineh, Rahmat and Foley, Benjamin (2015), ‘Achieving a cost-competitive offshore
wind power industry: What is the most effective policy framework?,’ The Oxford Institute for Energy
Studies.
Cámara de Diputados (2003), El financiamiento privado de electricidad a través de los esquemas
Pidiregas, http://www.diputados.gob.mx/sedia/sia/se/SIA-DEC-44-2003.pdf [Accessed July 2017]
CCEE (2017), Câmara de Comercialização de Energia Elétrica, ‘Tipos de Leilãos,’
https://www.ccee.org.br/portal/faces/pages_publico/o-que-
fazemos/como_ccee_atua/tipos_leiloes_n_logado?_afrLoop=641451692610348#%40%3F_afrLoop%
3D641451692610348%26_adf.ctrl-state%3D131jiy834o_4 [Accessed July 2017]
CCEE (2017b), Câmara de Comercialização de Energia Elétrica, ‘Nº 002 – 26th New Energy Auction
(A-6) – December, 20th 2017,’ [Accessed December 2017]
CCEE (2017c), Reverse Auctions to Scale Renewable Energy, Brazilian Approach, June 6, 2017,
https://d2oc0ihd6a5bt.cloudfront.net/wp-
content/uploads/sites/837/2017/06/4_Auctions_Renewables_Brazilian_Approach.pdf [Accessed
August 2017]
CENACE (2017), Centro Nacional de Control de Energía, ‘Guía Operativa de la Cámara de
Compensación para las Subastas de Largo Plazo,’
http://www.cenace.gob.mx/Paginas/Publicas/MercadoOperacion/SubastasLP.aspx [Accessed July
2017]
CENACE (2017b), Mercado para el Balance de Potencia,
http://www.cenace.gob.mx/Paginas/Publicas/MercadoOperacion/MercadoBalancePotencia.aspx
[Accessed July 2017]
CENACE (2017c), Reporte de las 100 Horas Criticas,
http://www.cenace.gob.mx/Docs/MercadoOperacion/CalculoAcrReqPotencia/Reporte%202016%20S
1%20100%20hs%20Cr%C3%ADticas%20y%20Nivel%20Reserva%20Gen%20v2016-10-10.pdf
[Accessed July 2017]
CENACE (2017d), ‘Anuncian SENER y CENACE resultados preliminares de la Tercera Subasta de
Largo Plazo,’ https://www.gob.mx/cenace/prensa/anuncian-sener-y-cenace-resultados-preliminares-
de-la-tercera-subasta-de-largo-plazo-141668 [Accessed December 2017]
CENACE (2017e), ‘Presentation of the Verdict of the 2017 Long Term Auction,’ November 22, 2017,
http://www.cenace.gob.mx/Docs/MercadoOperacion/Subastas/2017/54%20Presentaci%C3%B3n%20
del%20Director%20General%20del%20CENACE%20en%20Fallo%20de%20la%20Subasta%20de%
20Largo%20Plazo%20SLP%20No.1%202017%20Versi%C3%B3n%20final.pdf [Accessed December
2017]
Center for Energy Economics (2013), in the Bureau of Economic Geology at the Jackson School of
Geosciences, The University of Texas at Austin, ‘Una Guía a la Industria Eléctrica en México’,
http://www.beg.utexas.edu/energyecon/2013%20S.pdf [Accessed June 2017]
CFE (2014), Comision Federal de Electricidad, ‘Informe Anual 2014,’
http://www.cfe.gob.mx/inversionistas/style%20library/assets/pdf/informeanual.pdf [Accessed July
2017]
51
Cramton, Peter (2017), Electricity Market Design, Oxford Review of Economic Policy, Volume 33,
Number 4, 2017, pp. 589–612, http://www.cramton.umd.edu/papers2015-2019/cramton-electricity-
market-design.pdf
CRE (2017), Comisión Reguladora de Energía, ‘Preguntas frecuentes sobre la nueva regulación en
temas eléctricos,’ http://www.cre.gob.mx/documento/faq-regulacion-electricos.pdf [Accessed June
2017]
Davis, Luas; Irastorza, Veronica, ‘Are Mexican Renewables Really this Cheap?’, Energy Institute as
HAAS, December 2017, https://energyathaas.wordpress.com/2017/12/04/are-mexican-renewables-
really-this-cheap/ [Accessed December 2017]
Deutsche Bank (2012), ‘Emerging Markets Leading Clean Energy Markets,’
https://www.db.com/cr/en/docs/Emerging_Markets-Leading_Clean_Energy_Markets.pdf, [Accessed
June 2017]
Eberhard, Anton; Gratwick, Katharine; Morella, Elvira; Antmann, Pedro (2016), ‘Independent Power
Projects in Sub-Saharan Africa: Lessons from Five Key Countries,’ World Bank Group,
https://openknowledge.worldbank.org/bitstream/handle/10986/23970/9781464808005.pdf?sequence=
2&isAllowed=y [Accessed June 2017]
Empresa de Pesquisa Energetica, Informe Leilões de Geração de Energia Elétrica, December 28,
2017, http://epe.gov.br/sites-pt/publicacoes-dados-
abertos/publicacoes/PublicacoesArquivos/publicacao-268/Informe%20Leil%C3%B5es%202017%20-
%20Portugues.pdf [Accessed December 2017]
Engelbrecht-Wiggans, R., (1988), ‘Revenue equivalence in multi-unit objects,’ Economic letters,
volume 26, Issue 1, 1988, Pages 15-19, https://doi.org/10.1016/0165-1765(88)90044-4
Gimon, Eric; Orvis, Robbie; Aggarwal, Sonia, ‘Renewables Curtailment: What We Can Learn from
Grid Operations in California and the Midwest,’ GTM, March 23, 2015,
https://www.greentechmedia.com/articles/read/renewables-curtailment-in-california-and-the-midwest-
what-can-we-learn-from#gs.W2W7Fks [Accessed July 2017]
Graf, Pablo (1998), ‘Policy responses to the banking crisis in Mexico,’ Bank for International
Settlements, http://www.bis.org/publ/plcy06f.pdf [Accessed July 2017]
Heidell, Jim (2018), PA Consulting Group Energy & Utilities Director & Mexican Power Market Expert,
direct correspondence
Heidell, Jim; Paterno, Ethan; Repsher, Mark (2017), Mexico’s Capacity Market—Demystifying the
Riddle, http://www.paconsulting.com/newsroom/expert-opinion/power-finance-risk-mexicos-capacity-
marketdemystifying-the-riddle-2-december-2016/ [Accessed July 2017]
IAEA (2006), International Atomic Energy Agency, ‘Brazil,’ http://www-
pub.iaea.org/MTCD/Publications/PDF/CNPP2012_CD/countryprofiles/Brazil/Brazil.htm [Accessed
July 2017]
IEA (2013), ‘Grid interconection contract for renewable energy,’
https://www.iea.org/policiesandmeasures/pams/mexico/name-22675-en.php [Accessed July 2017]
IEA (2015), ‘Fund for the Energy Transition and Sustainable Electricity Use,’
https://www.iea.org/policiesandmeasures/pams/mexico/name-148713-en.php [Accessed July 2017]
52
IEA (2017), ‘Mexico 2017,’
https://www.iea.org/publications/freepublications/publication/EnergyPoliciesBeyondIEACountriesMexi
co2017.pdf [Accessed August 2017]
IRENA (2016), ‘Renewable Energy Market Analysis: Latin America’. IRENA, Abu Dhabi.
http://www.irena.org/DocumentDownloads/Publications/IRENA_Market_Analysis_Latin_America_201
6.pdf [Accessed June 2017]
IRENA and CEM (2015), ‘Renewable Energy Auctions: A Guide to Design’
http://www.irena.org/DocumentDownloads/Publications/Renewable_Energy_Auctions_A_Guide_to_D
esign.pdf [Accessed June 2017]
Kucinski, Bernardo (1995), Latin American Information Services, Inc., ‘The Privatization of Brazil’s
Electricity Sector,’ http://kucinski.com.br/pdf/livros_PrivatizationeletricityWeb.pdf [Accessed 08 June
2017]
Lund, Louisa (2017), ‘Harvard Kennedy School (HKS) Energy Policy Seminar Series: The Brazilian
Power Sector’, https://www.hks.harvard.edu/m-rcbg/cepr/Tolmasquim%20summary%20final.pdf
[Accessed June 2017]
Luomi, Mari (2014), ‘Sustainable Energy in Brazil: Reversing Past Achievements or Realizing Future
Potential,’ The Oxford Institute for Energy Studies, https://www.oxfordenergy.org/wpcms/wp-
content/uploads/2014/08/SP-34.pdf [Accessed June 2017]
Mabnacional (2016), ‘ANEEL faz novo leilão de energia com altos preços de contratação,’
http://www.mabnacional.org.br/noticia/aneel-faz-novo-leil-energia-com-altos-pre-os-contrata
[Accessed July 2017]
NERA Economic Consulting (2016), ‘Mexican Wholesale Electricity Market Report,’
http://www.nera.com/content/dam/nera/publications/2016/PUB_Mexican_Electricity_Market_Report_1
016_Rev.pdf [Accessed July 2017]
NERA Economic Consulting (2017), ‘Method or Madness: Insights from Germany’s Record-Breaking
Offshore Wind Auction and Its Implications for Future Auctions,’
http://www.nera.com/content/dam/nera/publications/2017/PUB_Offshore_EMI_A4_0417.pdf
[Accessed August 2017]
NREL (2017), ‘Mexico’s Geothermal Market Assessment Report,’
https://www.nrel.gov/docs/fy17osti/63722.pdf [Accessed 08 June 2017]
Oliveira, Adilson de; Woodhouse,Erik J.; Losekann, Luciano; Araujo, Felipe V.S. (2005), ‘The IPP
Experience in the Brazilian Electricity Market,’ Program on Energy and Sustainable Development,
Center for Environmental Science and Policy, Stanford University,
https://pesd.fsi.stanford.edu/sites/default/files/Brazil_IPP.pdf [Accessed 08 June 2017]
Oren, Shmuel, ‘When is a Pay-as Bid Preferable to Uniform Price in Electricity Markets’, University of
California at Berkeley, http://www.ieor.berkeley.edu/~oren/pubs/PayasBid2004.pdf [Accessed August
2017]
Pfeifenberger, Johannes P.; Lueken, Roger; Spees, Kathleen; Mwalenga, Lily (2017), ‘Uniform Price
vs. Differentiated Payment Auctions: A Discussion of Advantages and Disadvantages,’ The Brattle
Group
53
Porrua, Fernando; Bezerra, Bernardo; Barroso, Luis; Lino, Priscila; Ralston, Francisco; Pereira, Mario
(2010), ‘Wind Power Insertion Through Energy Auctions in Brazil,’ PSR – Energy Consulting and
Analytics
Power Auctions LLC (2016), ‘Evaluation of Auctions and Capacity Market Design for Electric Power,’
https://www.gob.mx/cms/uploads/attachment/file/196108/PA_Auction_Opinion_for_SENER.pdf
[Accessed July 2017]
PWC, 2015, Resumen de las Bases del Mercado Eléctrico, http://energiaadebate.com/wp-
content/uploads/2015/09/PwCResumendelasBasesdelMercadoElectrico.pdf [Accessed July 2017]
Riley, John G.; Samuelson, William F. (1981), ‘Optimal Auctions,’ The American Economic Review,
Vol. 71, No. 3 (Jun., 1981), pp. 381-392, ttp://www.jstor.org/stable/1802786
Rodriguez, Daniel (2017), ‘Mexico Seeks to Cut Power Subsidies, Launch 21.7 GW Solar Plan,’ S&P
Platts Global, https://www.platts.com/news-feature/2017/oil/commodities-in-mexico/cut-power-
subsidies-solar-plan-050517 [Accessed February, 2018]
Roques, F. & Finon, D. (2017). ‘Adapting electricity markets to decarbonisation and security of supply
objectives: Toward a hybrid regime?’, Energy Policy, 105 584–96.
http://doi.org/10.1016/j.enpol.2017.02.035
Rosa, Luis Pinguelli; Silva, Neilton Fidelis da; Pereira, Marcio Giannini; Losekann, Luciano Dias,
(2013), ‘The Evolution of Brazilian Electricity Market,’ Evolution of Global Electricity Markets: new
paradigms, new challenges, new approaches, Elsevier Inc.
SEGOB (2017), Secretaría del Gobierno, Manual de Subastas de Mediano Plazo,
http://www.dof.gob.mx/nota_detalle.php?codigo=5486350&fecha=12/06/2017 [Accessed July 2017]
SEGOB, (2017b), Secretaría del Gobierno, ‘AVISO por el que se da a conocer los requisitos para la
adquisición de Certificados de Energías Limpias en 2020, 2021 y 2022 establecidos por la Secretaría
de Energía,’ http://www.dof.gob.mx/nota_detalle.php?codigo=5478190&fecha=31/03/2017 [Accessed
June 2017]
SENER (2013), ‘Prospectiva del Sector Eléctrico 2013-2027,’
https://www.gob.mx/cms/uploads/attachment/file/62949/Prospectiva_del_Sector_El_ctrico_2013-
2027.pdf [Accessed August 2017]
SENER (2015), ‘Manual de Subastas a Largo Plazo,’
http://www.cenace.gob.mx/Docs/MercadoOperacion/Subastas/01%20Manual%20de%20Subastas%2
0de%20Largo%20Plazo%20DOF%202015%2011%2019.pdf [Accessed July 2017]
SENER (2017), Secretaría de Energía, ‘Derechos Financieros de Transmisión: Implementación en
México’ https://www.hks.harvard.edu/hepg/Papers/2016/Pavlovic.%20CEPG.%20Mexico.pdf
[Accessed July 2017]
SENER (2017b), Secretaría de Energía, ‘Preguntas Frecuentes sobre los Certificados de Energías
Limpias,’ http://www.gob.mx/cre/articulos/preguntas-frecuentes-sobre-los-certificados-de-energias-
limpias [Accessed June 2017]
Silva, Bruno Gonçalves Da, ‘Evolução do Setor Elétrico Brasileiro no contexto econômico nacional:
uma análise histórica e econométrica de longo prazo,’ Universidade de São Paulo,
file:///C:/Users/NYCMH2/Desktop/BrunoSilvaRevisada.pdf [Accessed November 2017]
Stennett, Aidan (2010), ‘Renewable Energy – Grid Connection,’ Research and Library Service
Briefing Paper, Northern Ireland Assembly
54
Tankha, Sunil (2008), ‘From market to plan: Lessons from Brazilian power reforms on reducing risks
in the provision of public services’, Policy and Society, 27:2, 151-162
http://www.tandfonline.com/doi/pdf/10.1016/j.polsoc.2008.09.002?needAccess=true [Accessed June
2017]
Tolmasquim, Mauricio Tiomno (2012), ‘Power Sector Reform in Brazil,’ Synergia Editora
Vagliasindi, Maria; Besant-Jones, John (2013), ‘Power Market Structure: Revisiting Policy Options,’
Direction in Development, Washington, DC: World Bank
Viana, Alexandre (2017), Auctions & Regulated Market Executive Manager, CCEE, email
correspondences, 2017
Viana, Alexandre (2018), Auctions & Regulated Market Executive Manager, CCEE, direct
correspondences
Warren, Chris (2016), ‘As Feed-In Tariffs Wane, Auctions Are Enabling the Next Wave of Solar Cost
Improvements’ GTM, https://www.greentechmedia.com/articles/read/as-feed-in-tariffs-wane-auctions-
are-causing-the-next-wave-of-solar-cost-im#gs.TEFQMXM [Accessed June 2017]