renault sa company report - run: página …run.unl.pt/bitstream/10362/15390/1/bouigeon_2015.pdf ·...
TRANSCRIPT
THIS REPORT WAS PREPARED BY “VINCENT BOUIGEON”, A MASTERS IN FINANCE STUDENT OF THE NOVA SCHOOL OF BUSINESS AND
ECONOMICS, EXCLUSIVELY FOR ACADEMIC PURPOSES. THIS REPORT WAS SUPERVISED BY ROSÁRIO ANDRÉ WHO REVIEWED THE
VALUATION METHODOLOGY AND THE FINANCIAL MODEL. (SEE DISCLOSURES AND DISCLAIMERS AT END OF DOCUMENT)
See more information at WWW.NOVASBE.PT Page 1/30
MASTERS IN FINANCE
EQUITY RESEARCH
We initiate the coverage of Renault S.A. with a HOLD
recommendation. The price Target for the FY15 is 62.90€, which
represents an upside of 3.91% against the current price. Including
the expected dividends of 6.33€, the total expected return will be
14.37%
International market slow down : The international sales
of Renault are slowing down due to a weak international market.
Economic recovery in Europe: Renault’s results have
been kept steady despite the bad performances in the international
market due to a strong recovery of the European market.
Currency depreciation: Renault’s results for the
international market have been highly impacted by the depreciation
of the major currencies. Indeed, the Russian Ruble, the Argentinian
Peso and the Brazilian Real have depreciated against the euro
causing a significant impact on revenues.
Cost savings: Through workforce adjustments and other
costs saving, Renault S.A. will see an increase in margins and
further profitability.
Attractiveness of the models: the Dacia Duster and the
new Renault Clio successes offered strong sales results to the
company.
Company description
Renault SA designs, manufactures, markets, and repairs passenger cars and light commercial vehicles. The company also offers financing and service solutions, including credit for new and used vehicles. Although Renault’s shares are mostly detained by public investors, the French Government has an important stake at 15.01%.
“RENAULT SA” COMPANY REPORT
“AUTOMOTIVE SECTOR” 02 JANUARY 2015
STUDENT: VINCENT BOUIGEON [email protected]
A shifting industry
Improve operating margin in a contrasted environment
Recommendation: HOLD
Price Target FY15: 62.90 €
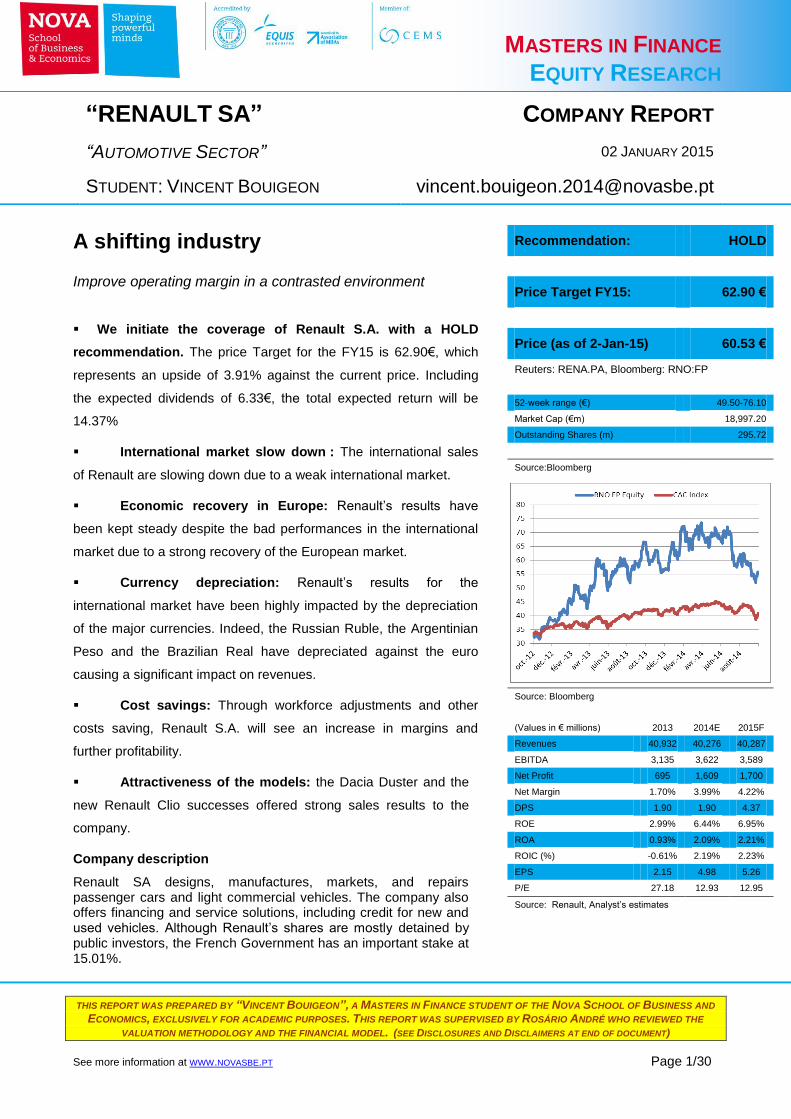
Price (as of 2-Jan-15) 60.53 €
Reuters: RENA.PA, Bloomberg: RNO:FP
52-week range (€) 49.50-76.10
Market Cap (€m) 18,997.20
Outstanding Shares (m) 295.72
Source:Bloomberg
Source: Bloomberg
(Values in € millions) 2013 2014E 2015F
Revenues 40,932 40,276 40,287
EBITDA 3,135 3,622 3,589
Net Profit 695 1,609 1,700
Net Margin 1.70% 3.99% 4.22%
DPS 1.90 1.90 4.37
ROE 2.99% 6.44% 6.95%
ROA 0.93% 2.09% 2.21%
ROIC (%) -0.61% 2.19% 2.23%
EPS 2.15 4.98 5.26
P/E 27.18 12.93 12.95
Source: Renault, Analyst’s estimates

“RENAULT S.A.” COMPANY REPORT
PAGE 2/30
Table of Contents
Executive summary .....................................................................................................................................3
Company overview ......................................................................................................................................4 Company description ............................................................................................................................................. 4 Shareholder structure ........................................................................................................................................... 5 Recent restructuration .......................................................................................................................................... 5
Key Drivers .....................................................................................................................................................6 Car ownership rate and demography .............................................................................................................. 6 Economic Growth..................................................................................................................................................... 6
Macroeconomic analyses ...........................................................................................................................7 GDP Growth ............................................................................................................................................................... 7 Currency appreciation ........................................................................................................................................... 7 Oil Prices ..................................................................................................................................................................... 8
Market overview ...........................................................................................................................................9 Industry and market evolution .......................................................................................................................... 9 Different market segments ................................................................................................................................11 Complexity and cost pressure ...........................................................................................................................12 Regulations and risk management .................................................................................................................12 M&A activities .........................................................................................................................................................12 Regional specificities ...........................................................................................................................................13
Competition ................................................................................................................................................. 16 Competitors .............................................................................................................................................................16 Competitive advantages/disadvantages .......................................................................................................16 Financial Characteristics ....................................................................................................................................17
International Revenues ........................................................................................................................... 18 Europe Region ........................................................................................................................................................18 Eurasia Region ........................................................................................................................................................19 Euromed Region .....................................................................................................................................................20 Americas Region ....................................................................................................................................................20 Asia-Pacific Region ................................................................................................................................................21 Global Renault Group’s revenues ....................................................................................................................22
Valuation ...................................................................................................................................................... 23 Discounted Cash-Flow ..........................................................................................................................................23 WACC methodology...............................................................................................................................................23
Financials ..................................................................................................................................................... 25
Multiples analysis ...................................................................................................................................... 27
Appendix ...................................................................................................................................................... 27
Disclosures and Disclaimer ................................................................................................................... 30

“RENAULT S.A.” COMPANY REPORT
PAGE 3/30
Executive summary
This report has the objective of developing a comprehensive analysis of the
company Renault S.A. and providing an investment recommendation based on
the actual price and the possible return in the period of 12 months. Our valuation
implies an upside potential of 14.37% leading to a HOLD recommendation. We
used a DCF valuation to reach this result. Moreover, we decided to forecasts
future performances for the entire company instead of using a sum of the part
approach. Indeed, we believe that the financing segment is not materially
relevant in terms of value (it represents less than 5% of total revenues) and our
calculations confirmed that it would not significantly impact our valuation.
Through our analysis we have identified the main sources of growth and value for
Renault. We believe that emerging markets would be the main source of new
profits in the next few years. This is mainly due to their low car ownership rates
and to the size of their populations. In 2020, these countries will represent almost
half of Renault’s revenues. Although Europe is not the next source of growth for
the industry, it will stay the biggest market for Renault in term of revenues.
Therefore, the future economic situation in the region will be a strong driver of the
company’s performances.
The regional breakdown is not the only information to take into consideration
when estimating future opportunities for automakers. Indeed, the market is
fragmented into 3 segments; entry segment, value segment and premium
segment1. Each segment will grow at a different pace and Renault does not
operate in the premium segment. However, it has a strong position in the entry
segment, which is expected to be the major part of the growing demand in
emerging markets.
The automotive sector does not only evolve with its customers’ expectations, it
needs to adapt to new regulations and new safety rules. With the global warming
and pollution problems, governments want to reduce their emissions. Cars play a
big part in this game and the manufacturers will have to be particularly focused
on new technologies that would create more efficient and cleaner vehicles. In
order to follow the fast pace of innovation in the industry, Renault has created a
strategic alliance with Nissan. Moreover, it developed its M&A activities to gain
access to new markets or to reduce its production costs.
Finally and to conclude we have reach a price for Renault S.A. for FY2015 of
€62.90 per share.
1 We will explain the composition of each segment latter in this report
“RENAULT S.A.” COMPANY REPORT
PAGE 4/30
Company overview
Company description
Renault S.A. is a French multinational vehicle manufacturer founded in 1899.
The company is engaged in the manufacture of automobiles but also in the
provision of related services. The company is structured into two segments: the
Automotive division which handles the manufacture, marketing and design of
passenger cars and light commercial vehicles under 3 brands: Renault, Renault
Samsung Motors and Dacia brands, and the Sales Financing division, which
provides financial and commercial services related to the Company’s sales
activities and is comprised of RCI Banque and its subsidiaries. Renault owns
Automobile Dacia (Romania’s leading automaker) and possesses two associated
companies: Nissan in which it holds 43.3% and AvtoVAZ with a stake of 35.91%.
The Renault-Nissan alliance aims to create 2.9 billion euros in savings from
synergies. It also cooperates with Daimler to develop smart cars and new
technologies (Renault owns 1.55% of DAIMLER AG)2.
The company’s core market is Europe and especially France. The group is
present in 128 countries with approximately 40 manufacturing facilities spread
around the world and more than 120 thousands employees. Currently, the
Renault-Nissan alliance stands as the fourth-largest automotive group.
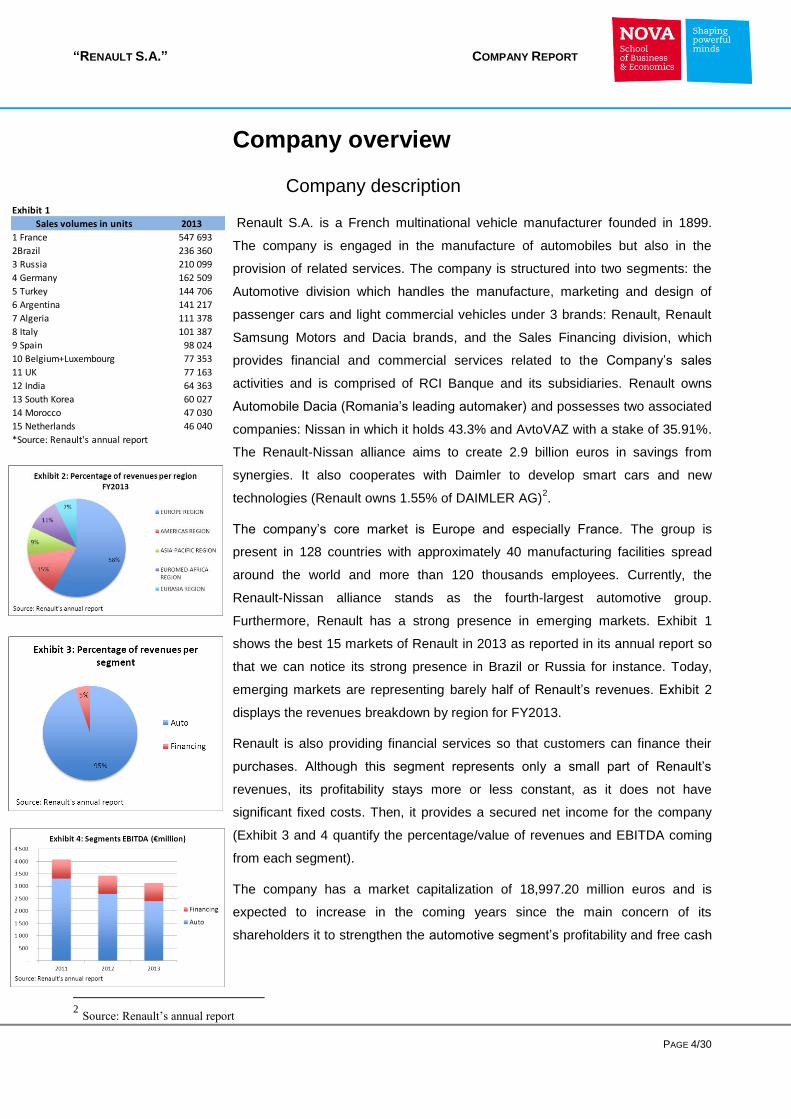
Furthermore, Renault has a strong presence in emerging markets. Exhibit 1
shows the best 15 markets of Renault in 2013 as reported in its annual report so
that we can notice its strong presence in Brazil or Russia for instance. Today,
emerging markets are representing barely half of Renault’s revenues. Exhibit 2
displays the revenues breakdown by region for FY2013.
Renault is also providing financial services so that customers can finance their
purchases. Although this segment represents only a small part of Renault’s
revenues, its profitability stays more or less constant, as it does not have
significant fixed costs. Then, it provides a secured net income for the company
(Exhibit 3 and 4 quantify the percentage/value of revenues and EBITDA coming
from each segment).
The company has a market capitalization of 18,997.20 million euros and is
expected to increase in the coming years since the main concern of its
shareholders it to strengthen the automotive segment’s profitability and free cash
2 Source: Renault’s annual report
Exhibit 1
Sales volumes in units 2013
1 France 547 693
2Brazil 236 360
3 Russia 210 099
4 Germany 162 509
5 Turkey 144 706
6 Argentina 141 217
7 Algeria 111 378
8 Italy 101 387
9 Spain 98 024
10 Belgium+Luxembourg 77 353
11 UK 77 163
12 India 64 363
13 South Korea 60 027
14 Morocco 47 030
15 Netherlands 46 040
*Source: Renault's annual report

“RENAULT S.A.” COMPANY REPORT
PAGE 5/30
flows available. This would pass through costs saving gains with the increasing
production in the emerging markets and restructuring of existing plants.
Shareholder structure
The company has three main different shareholders the French state with
15.01%, Nissan with 15.00% and Daimler AG with 3.10%. Moreover, 2.61%
stake is hold by employees and 1.28% is held in treasury. The remaining stake of
63.00% is free-floated and traded in the Euronext index. This capital structure did
not change in the last few years.
We believe that the significant stake of the French government in Renault plus
the important number of workers involved could create difficulties for Renault to
adjust its salary expenditures. If Renault would release a job-cutting plan, the
government could intervene in the process and negotiate with Renault to save as
many jobs as possible.
The management team of Renault has been stable in the last decade, its
Chairman and CEO, Carlos Ghosn, holds his position since April 2002. He is also
President and CEO of Nissan Motor Co Ltd and Director of AVTOVAZ. With
255,200 Renault’s shares in his portfolio he has a big incentive to improve the
company’s value3.
After the 2007 crisis, it is possible to note a reduction in the dividend payment to
shareholders. It has been a way to increase the liquidity of Renault and improve
its ability to face the adverse conjecture. We believe that it was an appropriate
reaction about the challenges faced by the company. Exhibit 6 displays the
variation of the cash available in relation to the dividend payments.
Recent restructuration
The company has started in 2013 a restructuration of its workforce in France.
The company announce that it will remove 7,500 employees from 2013 to 2015
by not renewing employees leaving for retirement. In 2012, Renault spent 5.8
billion euros for its 127,086 employees. We can notice on exhibit 8 that at YE-
2013 Renault has already reduced its personal expenses at 5.5 billion euros due
to the loss of 5,000 employees. If Renault respects its restructuration plan, the
number of employees should decrease to around 119,000 people in the next 2
years, which will reduce the personal expenses to around 5.3 billion euros for
2014 and 2015. The company also announced that it will hire new employees in
3 Source: Renault’s anual report
Stable corporate governance…

“RENAULT S.A.” COMPANY REPORT
PAGE 6/30
2016 if the automotive market situation is favourable. This is why we expect
Renault to increase its personal expenses afterwards (not necessarily in France).
Key Drivers
Car ownership rate and demography
The main growth possibility in the sector is to consider how well a country is
equipped with automobiles (car ownership rate). With this variable, we can
analyse which countries show the biggest growth opportunities and to appreciate
what is the strategy of Renault for each of them. The second most important
factor is the demography of the countries. Indeed, a huge country such as China
with a small car ownership rate could offer a bigger market size than a small
country with a considerable car ownership rate such as Luxembourg.
Then, to accurately estimate the markets opportunities of Renault, we created a
model that takes into consideration the growth in the number of cars per 1,000
inhabitants and the growing demography4 per country and per region according
to Renault’s regional breakdown5 (see exhibit 8).
This model represents the number of vehicles in the country, but did not
represent the number of new car sold every year. Nevertheless, it is valuable
information to forecast the future sales as the increase in the car ownership rate
will pass through the selling of new cars.
In our forecasts, we did not implement a cap for the emerging markets because
their car ownership rates are so far behind the developed nations that they will
never reach a rate of over 500 per 1,000 in the next 10 years.
Economic Growth
To analyse the impact of GDP growth to the car ownership rate growth we
displayed on different graphs both historical data for several regions and/or
countries. For instance, exhibit 9 displays this information for the European
region. We can notice that GDP and car ownership rates seem to be correlated.
Therefore, we assumed that economic development and car ownership rate are
positively correlated. This is why we took into consideration the expected GDP
growth to forecast the future number of cars per 1,000.
To summarize our model works as follow: first, we estimated the future markets
size in which Renault is operating (based on historical Renault’s regional
4 Source : World database
5 The regional breakdown is displayed in Renault’s annual report

“RENAULT S.A.” COMPANY REPORT
PAGE 7/30
breakdown). To do so we used historical data and a combination of both the
expected number of cars per 1,000 (calculated with the forecasted GDP growth
from IMF) and the growing demography6. Second, using a peer analysis, we
assessed the market shares of Renault for each region to obtain the expected
number of cars sold per region. Finally, we calculated (based on historical data)
the future revenues per car sold adjusted to the exchange rates fluctuation to
obtain the total expected revenues.
Macroeconomic analyses
GDP Growth
As previously stated, we believe that GDP growth is a driver of the automotive
industry. We collected historical and forecasted GDP in the IMF database.
Moreover, we decided to analyse the GDP growth per region and for the 5
Renault’s biggest markets.
Regarding the 5 biggest markets, they all reached a negative GDP growth after
the 2008 crisis. Russia was significantly impacted with a negative 8% GDP
growth in 2008. We can also notice that they did not fully recover from the crisis;
their GDP growth expectations are below the pre-crisis levels. However, the IMF
expects that these countries will have stable positive GDP growth until 2019.
The GDP growths per region forecasts (exhibit 11) confirm our expectations
about the future drivers of the automotive industry. Indeed, we can notice that
Euromed countries and Africa will have an impressive growth in the coming
years. South America and Asia are slowing down but they will enjoy strong
growth until 2019. Finally, Europe will try to keep a constant GDP growth of
around 2%, in accordance with the ECB policies.
Currency appreciation
During the last two years, the international business units of the company have
seen their contribution to results diminishing as a consequence of the
appreciation of the Euro against the main emerging country currencies. Renault
displays its information by region so that it is very difficult to calculate the impact
of a specific currency on the results. Due to the lack of information we calculated
a trend based on forward exchange rates.
In Russia, the Ruble depreciated significantly during the last year and negatively
impacted the revenues of Renault although the sales performances improved.
6 Source: World Database

“RENAULT S.A.” COMPANY REPORT
PAGE 8/30
We believe that the future of the Ruble is uncertain for several reasons; the
political disagreement between Russia, the US and the European Union
concerning Ukraine, the embargos on Russia that could weaken its economy,
and the most important one, oil prices. Indeed, for many reasons Russia
estimated its national budget expecting that oil prices will never fall under a
certain level (around $72 per barrel). Unfortunately for Russia, the trading price
decreased significantly in 2014 (57$ per barrel as of 2 January 2015) and we do
not know where the decrease will stop. Analysts warned that Russia could default
if the barrel stays under $72 during several consecutive months. It could lead to a
further depreciation of the Ruble and weaker Results for Renault. Then we
estimated that the revenues per unit sold will weaken from €13,000 in 2014 to
€12,000 for the coming years.
The same occurs with the other major currencies from Renault’s best-selling
emerging countries which are the Argentinean Peso and the Brazilian Real.
Since the last default of Argentina the Peso did not depreciate even further.
Thus, we believe that the Peso would not significantly impact the revenues over
the next year. We cannot have this level of confidence for Brazil. Following the
last elections and the reelection of Dilma Rousseff the Real has depreciated
further because investors are not optimistic about her ability to keep a strong
economy in Brazil. However, a major part of the cars sold in the region are also
produce in the country. Indeed, Renault owns two factories in Brazil so that the
currency risk will be in part absorbed by the decrease in the production costs
translated in Euro. Then, for the Americas region, we estimated that revenue per
unit sold will decrease from 10,283 in 2014 to 10,000 for the coming years.
On the other hand, the depreciation of the Turkish Lira had a positive effect
because of exports to the Euro zone.
In the Euromed Africa and Asia Pacific regions, we believe that the currency risk
will not significantly impact the revenues so that we kept a steady revenue per
unit sold for the coming years.
Exhibit 18 to 21 displays the depreciation of these currencies against the Euro
with a trend of the last 2 years.
Oil Prices
Nowadays, a large majority of cars in the world are using combustion engines
that need oil to function. We already know that oil is not an unlimited source of
energy and that the future of the automotive industry will be driven by the
innovations in term of new energies or reduction of the oil consumption.
Innovations are expensive to develop and automakers need to invest a big part of
The Russian Ruble evolution is still uncertain…

“RENAULT S.A.” COMPANY REPORT
PAGE 9/30
their Capex in R&D if they want to sell vehicles using less or no oil. The biggest
risk for automaker is to implement this transition at the wrong time. For instance,
Renault developed electric vehicles hoping that regulations and oil prices will
strengthen giving an advantage to electricity/hybrid engines (cheaper to use and
respecting the new regulations). However, the oil prices fell a lot during the last
month (under 60$ per barrel) so that customers still have a strong incentive to
use their combustion engine cars over electric vehicles. If oil prices stay under
60$ per barrel for the next five years we can imagine that automakers will have
more difficulties to sell electric vehicles to redeem their expenditures in R&D
(project with negative return). This market timing is very important; if you enter
too early in a market you will face negative return because the demand will not
be aware of your product, if you enter too late, the competitors can gain market
shares and weaken your future position.
To conclude, we believe that oil prices will be a risk for Renault because of its
significant expenditures in new technologies.
Market overview
Industry and market evolution
Globally, the automotive industry has recovered from the economic crisis.
Industry profits in 2013 accounted for €58 billion with 60 million units sold against
€41 billion in 2007 with 50 million units sold7. By 2020, we believe that global
profits could increase to EUR 80 billion due to a significant increase in volume
sold. However, this benefit will not be distributed equally across the world or
types of cars; certain regions and segments will outperform the others.
In the recent past, the source of profits has significantly shifted and some figures
will help us to understand how important these changes are. In 2007, the
emerging countries accounted for 29% of global profit with €12 billion. In 2013,
these regions represented around 60% of global profit with €31 billion due to an
important rise in sales. More than half of this growth came from China alone.
During the first semester of 2014, China confirms its position with an increase of
11.2% in units sold in comparison to the first half of 2013. In 2014, China should
overpass 19 million units sold if it keeps this dynamic. The graph below (exhibit
16) displays the passenger cars production in the world (in units) in relation to
Chinese production. Concerning the development in Asia, Renault is behind the
leading brands in the industry because it did not invest in new production plants
7 Source: All the data comes from OICA Database (Organisation Internationale des Constructeurs Automobile / International
Organization of Motor Vehicle Manufacturers)
A shifting industry…
An industry driven by China…
Plunging oil prices jeopardize innovations in term of clean energy development…

“RENAULT S.A.” COMPANY REPORT
PAGE 10/30
in the continent while companies such as Volkswagen have already invested in
the region.
Europe did not follow this path: in 2007, the industry profits accounted for €15
billion while in 2013 it fell to a loss of under €1 billion. There are two main
reasons to explain the decline. Firstly, the number of vehicle produced in the
region declined by around three million units over this period at around 13 million
in 20138. Secondly and due to this huge decrease in production, Europe is now
suffering from overcapacity, which means that production capacity in Europe is
higher than the real production (all the production lines are not use so that all the
tangible assets are not used). This situation deteriorates the margin of
automakers as their fixed costs for the production stay constant.
Japan and South Korea are also showing weak performances. Both markets
suffered from the economic crises. 2012 was their first profitable year since the
2008 crisis.
North America was considerably impacted by the 2008 crisis. The production
plunged from 3.9 million units in 2007 to 1.4 million units in 2008. Nevertheless, it
recovered faster than Europe with 4.3 million units produced in 2013 representing
€23 billion of profit. This huge decrease in production during the crisis forced the
automakers to restructure their costs structures to improve their profitability. The
sales are expected to strengthen in the region during the next few years due to
the good economic situation. Unfortunately, Renault is not operating in North
America and will not take advantage of this strong recovery.
Besides, this shift toward the emerging countries will cause supply chain
complications for automakers. Indeed, with the cost pressure in the industry, they
will need to use local suppliers and create new production lines to avoid
transportation costs.
8 Source: OICA Database (Organisation Internationale des Constructeurs Automobile / International Organization of Motor Vehicle
Manufacturers)
The shifting industry creates
supply chain complexity…
Capacity reductions have been initiated in developed countries, especially in
Europe…
“RENAULT S.A.” COMPANY REPORT
PAGE 11/30
Different market segments
Global developments do not only differ by region but also by segment. All
automakers are not operating in the same segments and it is very important to
understand their main caracteristics. We can classify the automotive market
within 3 segments: The premium segment denotes cars that target high income
customers. There are generaly sold within the upper middle to high price range.
The value segment refers to the medium price range and targets lower middle
and upper middle income customer group. Finally, the entry segment denotes the
lower price range and targets low income to lower middle income customers.
Premium segment: The most important thing in this category is to keep a
premium perception by differentiation. In recent years, premium players
have responded to customer demands by creating more and more
derivatives of their original models. This segment has future growth
opportunities due to the development of rich individuals in emerging
countries.
Value segment: The prospects for the value segment vary from region to
region. In developed marketplaces such as Europe, Japan and South
Korea, the markets are suffering and barely profitable. Contrariwise, the
emerging markets experience sales increase and healthy profits due to
their recent development. Moreover, with the financial crisis and the
economic difficulties across developed countries, the entry segment is
expanding in the value segment. For instance, Dacia that was at the
beginning created for emerging markets has a strong growth in France
due to the economic difficulties.
Entry segment: it is the segment that offers the next growth opportunities.
Emerging markets account for 65 percent of entry segment production(in
units)9 and these are on a growth tendency. This trend presents a solid
growth opportunity for Renault with its Dacia brand that is already well
implanted across the emerging world. However, the competition is rising
with new market players such as Chinese automakers.
9 Source: OICA Database (Organisation Internationale des Constructeurs Automobile / International Organization of Motor Vehicle
Manufacturers)
The value segment is barely profitable in developed markets…
The entry segment is the next
growth opportunity…

“RENAULT S.A.” COMPANY REPORT
PAGE 12/30
Complexity and cost pressure
Two decades ago, major brands would build several models on a single
production line. But customers became more and more demanding, seeking for
differentiation and the feeling of personalized vehicles. To stay attractive,
automakers developed several derivatives of their standard models (for instance
Renault claims more than 100 derivation of its new Twingo). The growing
numbers of derivatives run on the same production line increase complexity.
Nevertheless, if automakers can manage this complexity, they could improve
profitability by producing higher volumes on fewer production lines. Indeed, they
would need fewer tangible assets to produce the same quantity, which would lie
to less depreciation and better results in the P&L.
Regulations and risk management
The increase in regulations either to respect the environment or to increase the
safety criteria will raise costs and increase complexity, as they need to be
managed differently in each country. Carbon dioxide regulation for instance, is
likely to continue to tighten as most of the leading countries in the world are
putting effort to reduce emissions. In Europe, the 2020 target seems difficult to be
reached without the development of new technologies. More electric or hybrid
motorisations should be used. To follow this transition, Automakers have two
main solutions: invest in R&D or create strategic alliances. Renault has already
created a strategic alliance with Nissan that allows both companies to develop
more efficient technologies. They have developed an electric engine through this
alliance, which is used in both Nissan and Renault’s vehicles.
Finally, automakers need to be prepared in case of country specific auto
regulations. For instance, in case of specific bans on importations (embargo,
international conflicts, etc.). This is particularly true in countries that are known to
be at risk (Russia, China, Iran, etc).
Renault is particularly at risk because Russia is its third biggest market with
210,099 units sold in 2013. In 2012, the loss of the Iranian market represented a
net loss of 100 thousand vehicles per year for Renault.
M&A activities
M&A activities are expected to stay active. The incentive of doing an M&A
transaction could come from different reasons: to access new markets and
customers, to create synergies and share technologies, to decrease raw material
costs pressure or labour costs pressure. The ability of the automakers to share
Reducing emissions will raise costs…

“RENAULT S.A.” COMPANY REPORT
PAGE 13/30
their markets or technologies will be an important factor in the competition. The
acquisition strategy of Renault did not follow this trend. Indeed, in 2013, 159
companies were included in its consolidated income statement against 153 in
2012.
Regional specificities
Europe Region
European economy has been severely damaged during the last couple of years.
The automotive sector is not an exception. However, car registration across the
region rebounded nicely in 2014 indicating that Europe is indeed in the middle of
a moderate recovery from its six-year consecutive decrease. Europe is a mature
market; its car ownership rate was 417 per 1,000 in 201110
and should reach 450
per 1,000 in 2014. We believe that Europe will not overpass the cap of 550
vehicles per 1,000 because most of the big cities aim to reduce the use of cars
by developing public transportation. For instance, in Paris in 2014, only 40% of
the adult population owns a car against 60% 3 years ago. Moreover, the
demography is not skyrocketing in the region, which known a 0.25% growth per
year during the last three years. We expect the demography to keep this steady
growth until 2020.
According to our forecasts, we expect European automakers to see assembly
reach 14.76 million units in 2014, which represents a 4% increase in comparison
to 2013. Nonetheless, Europe is still in crisis and these exceptional results do not
represent the evolution of the European market on the long run (this exceptional
results come from the fact that customers have postponed their car purchases
during the crisis). We believe that a 1.20% growth per year would be a more
appropriate figure for the region to reach around 15,800 thousands units sold in
2020.
Eurasia Region
The major part of this region consists of the largest country on earth: Russia. It
was Renault’s number-three market in 2013. The Russian market represented
2.6 million new vehicles sold in 2013 and we believe the yearly cap will be
reached when the market will be at 4 million vehicles (using mature market
standards). We expect such improvement because the car ownership rate in
Russia is half that of developed countries with around 250 vehicles per 1,000
inhabitants. Moreover, the overall car ownership rate in the Eurasia region is
around 160 per 1,000. The road network in the region suffers from the tough
10
Source: World Database
“RENAULT S.A.” COMPANY REPORT
PAGE 14/30
weather conditions, which means that car suspensions suffer too. This is why
SUVs are particularly appreciated. The demography has been stable in the
region during the last few years and we believe it will keep this pace. According
to our forecasts, the car ownership rate in the region will reach around 240
vehicles per 1,000 inhabitants in 2020, which implies that about 3.5 million
vehicles will be sold in 2020.
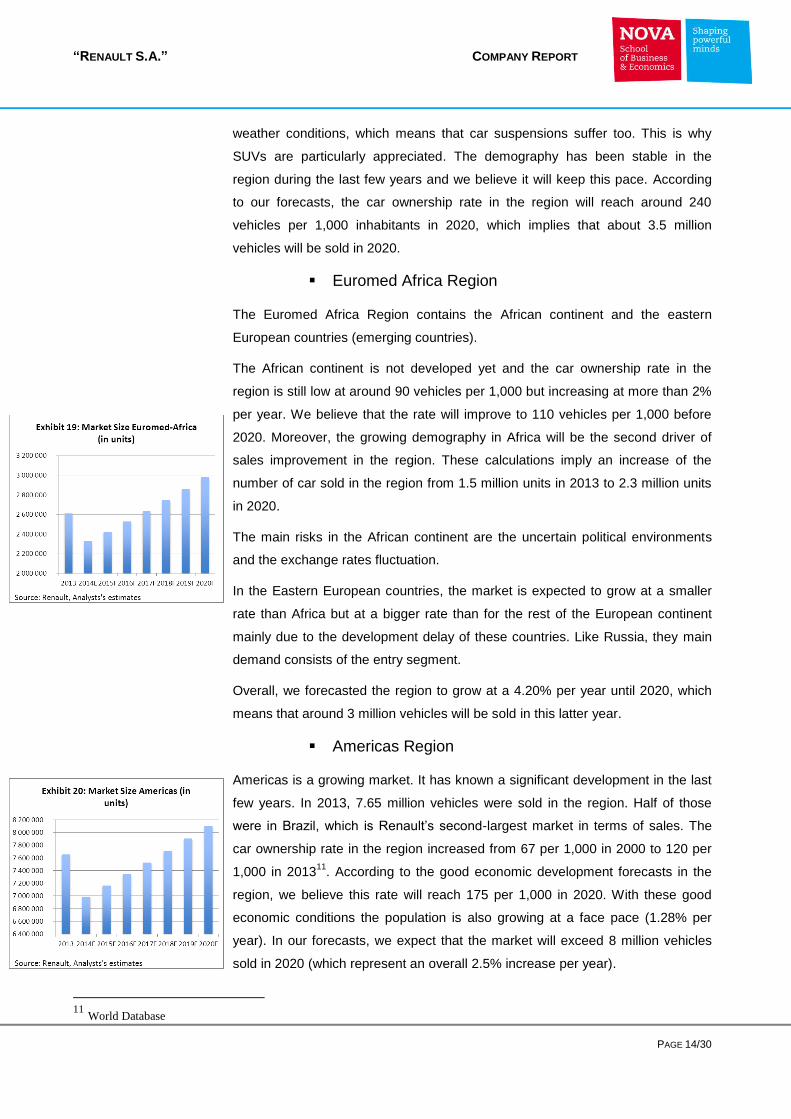
Euromed Africa Region
The Euromed Africa Region contains the African continent and the eastern
European countries (emerging countries).
The African continent is not developed yet and the car ownership rate in the
region is still low at around 90 vehicles per 1,000 but increasing at more than 2%
per year. We believe that the rate will improve to 110 vehicles per 1,000 before
2020. Moreover, the growing demography in Africa will be the second driver of
sales improvement in the region. These calculations imply an increase of the
number of car sold in the region from 1.5 million units in 2013 to 2.3 million units
in 2020.
The main risks in the African continent are the uncertain political environments
and the exchange rates fluctuation.
In the Eastern European countries, the market is expected to grow at a smaller
rate than Africa but at a bigger rate than for the rest of the European continent
mainly due to the development delay of these countries. Like Russia, they main
demand consists of the entry segment.
Overall, we forecasted the region to grow at a 4.20% per year until 2020, which
means that around 3 million vehicles will be sold in this latter year.
Americas Region
Americas is a growing market. It has known a significant development in the last
few years. In 2013, 7.65 million vehicles were sold in the region. Half of those
were in Brazil, which is Renault’s second-largest market in terms of sales. The
car ownership rate in the region increased from 67 per 1,000 in 2000 to 120 per
1,000 in 201311
. According to the good economic development forecasts in the
region, we believe this rate will reach 175 per 1,000 in 2020. With these good
economic conditions the population is also growing at a face pace (1.28% per
year). In our forecasts, we expect that the market will exceed 8 million vehicles
sold in 2020 (which represent an overall 2.5% increase per year).
11
World Database
“RENAULT S.A.” COMPANY REPORT
PAGE 15/30
North America has a significant influence on drivers’ habits. For instance,
Mexican people like automatic gear box and pick-up trucks.
The main risks in the region are the exchange rates instability (Argentinean
Peso) and the uncertain political environment (Brazilian riots).
Asia-Pacific Region
The Asia-Pacific region obviously includes Chinas, the Asean countries, Japan
and South Korea. But it also included India, Iran, and the Middle East.
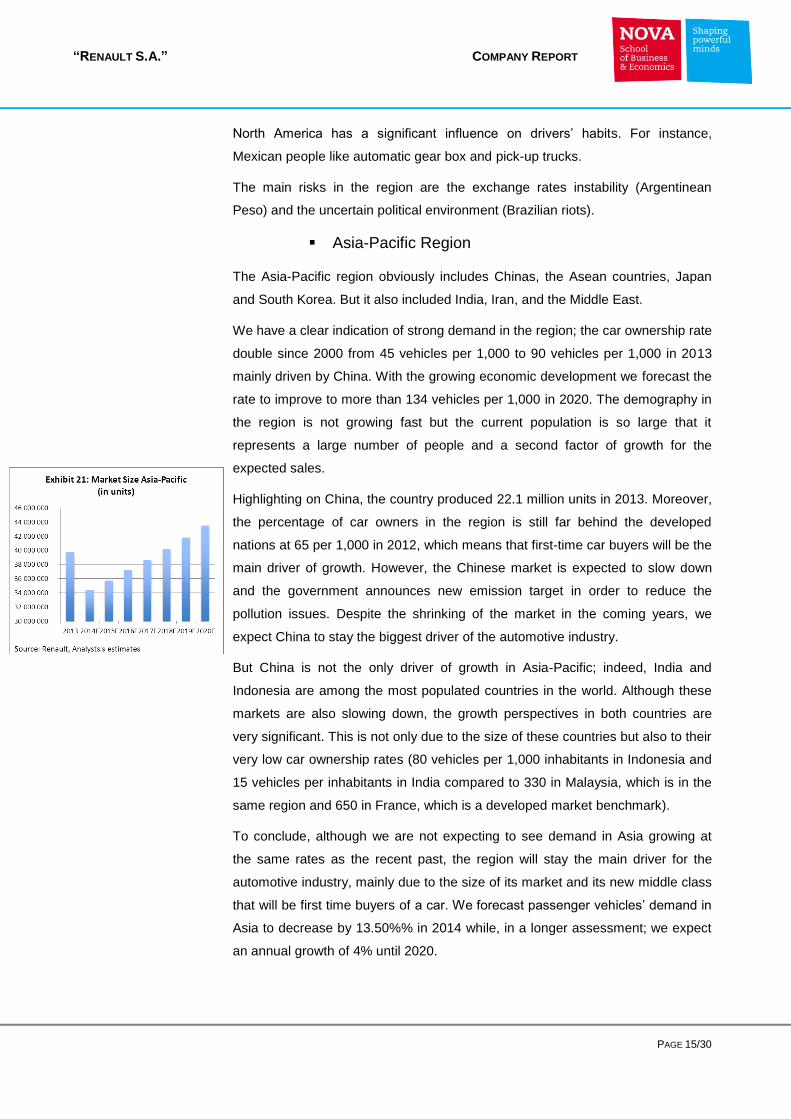
We have a clear indication of strong demand in the region; the car ownership rate
double since 2000 from 45 vehicles per 1,000 to 90 vehicles per 1,000 in 2013
mainly driven by China. With the growing economic development we forecast the
rate to improve to more than 134 vehicles per 1,000 in 2020. The demography in
the region is not growing fast but the current population is so large that it
represents a large number of people and a second factor of growth for the
expected sales.
Highlighting on China, the country produced 22.1 million units in 2013. Moreover,
the percentage of car owners in the region is still far behind the developed
nations at 65 per 1,000 in 2012, which means that first-time car buyers will be the
main driver of growth. However, the Chinese market is expected to slow down
and the government announces new emission target in order to reduce the
pollution issues. Despite the shrinking of the market in the coming years, we
expect China to stay the biggest driver of the automotive industry.
But China is not the only driver of growth in Asia-Pacific; indeed, India and
Indonesia are among the most populated countries in the world. Although these
markets are also slowing down, the growth perspectives in both countries are
very significant. This is not only due to the size of these countries but also to their
very low car ownership rates (80 vehicles per 1,000 inhabitants in Indonesia and
15 vehicles per inhabitants in India compared to 330 in Malaysia, which is in the
same region and 650 in France, which is a developed market benchmark).
To conclude, although we are not expecting to see demand in Asia growing at
the same rates as the recent past, the region will stay the main driver for the
automotive industry, mainly due to the size of its market and its new middle class
that will be first time buyers of a car. We forecast passenger vehicles’ demand in
Asia to decrease by 13.50%% in 2014 while, in a longer assessment; we expect
an annual growth of 4% until 2020.

“RENAULT S.A.” COMPANY REPORT
PAGE 16/30
Competition
Competitors
Renault is operating in a highly competitive market, which is the automotive
industry. This tough competition reduces the profitability of the automaker but it
also forces them to create Alliances and joint ventures to be more efficient. We
considered that the main competitors are PSA Peugeot Citroen, Volkswagen,
Ford Motor Company, Daimler AG, Toyota, Fiat and Honda. However, as we
have seen previously, these automotive companies are not obviously operating in
the same segments and/or same regions. Indeed, Renault does not have a
position in the premium segment, does not operate in North America and has a
relative minor presence in Asia (e.g. China), when compared to competitors.
Competitive advantages/disadvantages
In our point of view, one of the best advantages of Renault is the fact that it owns
3 brands. Renault, which has a good brand recognition in Europe, Dacia, which is
the fastest growing brand in Europe and in emerging countries, and Samsung
motors, which is well positioned in South Korea. Moreover, it owns Avtovaz,
which produces Lada cars and is the best-selling brand in Russia. Furthermore,
Renault invented the light commercial vehicles such as Kangoo and these
models know big success worldwide. Then, it has the capacity to meet a large
part of the international demand due to its large number of model available in
different price range (except in the premium segment).
Renault has strong market shares in Europe at 12% with a percentage of market
shares as follow for the leading European countries; 25% in France, 5.1% in
Germany, 7.2% in Italy, 13% in Belgium, 12.1% in Spain and 3.0% in the UK.
Concerning the international development, its alliance with Nissan allows better
technologies improvement and better access to the Asian market. The alliance
already deposed more than 60 patents for their electric vehicle.
In the last decade, Renault has been able to develop successful vehicles. The
best examples are the Dacia Duster and the Renault Clio, which stayed attractive
despite the economic crisis.
Conversely, we think that Renault has 4 main competitive disadvantages:
First, Renault does not operate in the premium segment so that it certainly loses
market opportunities. Moreover, Renault does not operate in North America. The
region is risky for European automakers, mainly because of the competition and

“RENAULT S.A.” COMPANY REPORT
PAGE 17/30
the preferences of the customers. Nevertheless, European brands such as
Volkswagen or BMW are successfully selling their models in the region focusing
on the premium perception. Their compact models are attractive because of their
better gas consumption. The management of Renault does not plan to develop in
the region in the coming years.
Second, we have seen that the next opportunities of growth will come from Asia.
However, Renault does not have a significant position in the region with only one
production plant in Chennai, India (and one in Korea but mainly producing for the
Korean market under the Samsung brand). It aims to take opportunities in the
region and in China but the management team did not release further
investments.
Third, Renault is highly dependent of the French market, which represents one
fifth of its sales. This poor diversification is risky for the company. A degradation
in the French economy will highly impact the company’s sales. Moreover, it owns
17 plants on the French territory and the protective labour law in the country
could weaken Renault’s flexibility to adapt to new market environments.
Finally, Renault’s revenues are highly dependent of risky markets such as
Russia, Brazil or Iran. Political decisions or international conflicts involving these
countries that are known to be at risk will directly impact the company.
Financial Characteristics
In order to better access the future position of Renault in relation to its peers, we
decided to compare their financial performances. We used an average of the
peers in comparison to Renault. All the results are displayed in exhibit 22 below.
Concerning the Gross Margin12
, Renault is in accordance with the industry with a
gross margin equal to 18.34%. However, when it comes to the Net margin13
,
Renault did not perform as well as its peers in 2013. Indeed, we remember the
Iranian case and the currencies depreciation that impacted the 2013 revenues
12
Gross margin = Revenues – Cost of goods 13
Net margin = Net income / Revenues
Exhibit 22: Peers financial analysis
Company Gross margin Net Margin ROA ROE Quick ratio Debt to Equity
Volkswagen AG 18,13% 5,59% 3,32% 12,31% 0,7716 1,44
Ford Motor Company 11,97% 4,25% 3,01% 26,50% 4,56
Daimler AG 22,10% 6,16% 4,40% 17,57% 0,8762 1,89
Toyota Motor Corp 19,44% 6,83% 4,35% 13,52% 0,9277 1,14
Fiat SpA 13,59% 1,62% 1,68% 12,27% 0,9172 3,22
Honda Motor Co Ltd 25,79% 4,34% 3,39% 10,51% 0,9036 1,00
Peers average 18,50% 4,80% 3,36% 15,45% 0,879 2,21
Renault SA 18,34% 3,47% 1,82% 5,55% 0,968 1,51
Source: Bloomberg
One fifth of revenues coming
from France only…
Renault is in accordance with the industry…

“RENAULT S.A.” COMPANY REPORT
PAGE 18/30
and led to a 3.47% net margin. However, considering the previous years Renault
was performing like its peers with a net margin of 5.02% in 2011 and 4.20% in
2012. This figure is important because it will be a good proxy to determine the
amount of cash that Renault will have in the next few years. A strong margin will
allow the company to invest more in its future development or to distribute more
money to its shareholders. Nevertheless, we believe that in 2014 Renault will be
able to improve its net margin to around 4% due to the end of the Iranian case, a
decreasing impact of currencies depreciation and its workforce restructuration.
The ROA gives an idea of how effectively the company is to convert the investing
money into net income. The higher the ROA, the more efficient the company is.
Like previously, as Renault had a small net income in 2013 its ROA is way
smaller than the average of the industry. Regarding the ROE, which gives an
idea of how profitable a company is relative to its equity, we have the same
observation than for the ROA. We believe that with the improvement of the net
income in 2014, both ratios will strengthen, which means that Renault will show
financial performances in accordance to the industry average. Therefore, we
think that the company will have the capacity to keep a competitive position in the
coming years.
A good indicator of a company’s short-term liquidity is the Quick ratio. It
measures a company’s ability to meet its short-term obligations with its most
liquid assets. With a Quick ratio close to 1, Renault is liquid and could meet its
short-term obligations. The average in the industry is under 1 at around 0.879.
Finally, it is interesting to analyse the financial structure of the different
automotive companies to know how they finance themselves. We can notice that
with the exception of Ford and Fiat, Renault is more indebted than its remaining
peers.
International Revenues
Europe Region
Renault has a strong market position in the region with market share at 9.20% in
2013 expecting to increase at 10.45% for 2014. This success is mainly due to the
development of new models like the new Clio, which is the best selling vehicle in
France. However, we think that in the long run Renault will not be able to keep its
exceptional results of 2013. We believe that Renault’s market share will fell to
10% in 2017, which assumed that the company would continue to develop
successful vehicles in the future. We know that Renault has already released the
new Twingo, which should be a commercial success. Furthermore, it is working
The Iranian case impacted the
2013’s ratios…

“RENAULT S.A.” COMPANY REPORT
PAGE 19/30
on other vehicles that would be released in the coming years. Thus, we expect
that its sales will overpass 1.5 million units in 2014. Afterwards, we believe that
sales will drop to around 1.45 million units in 2020.
To conclude, although the future growth in the automotive industry is not driven
by Europe, this market is still the most important for Renault. In 2020, more than
half of Renault’s revenues will come from this region with more than 24 billion
euros in revenues. For FY2014, we believe that the company will release 25.61
billion euros in revenues due to the exceptionally good performances in the
region.
Eurasia Region
Renault has a good market position in the Eurasia region with its Dacia duster,
which is attractive for Russian and eastern countries (cheap, reliable, adapted to
poor road conditions) and in Russia with the historical Lada brand.
To achieve its ambitious goal Renault can relies on its Moscow plant, which is the
fourth biggest in terms of production volume. It is also one of the most flexible in
terms of working hours14
. Then, the company is able to adjust its productivity to
meet the demand. We believe that Renault has an efficient implantation in the
region so that manufacturing difficulties should not occur.
But Russia is not the only market; the region shows strong results in other
countries such as Kazakhstan and Belarus (respectively 315% and 73% growth
in 2013).
The most challenging part for Renault in this region will be to maintain its pace of
production in order to stay cost-competitive and to continue improve the quality of
its product.
We believe that Dacia and Renault brands are offering vehicles in the price range
of customers’ expectation for the region so that it will be able to keep its market
share position. It will lead to a 215,719 vehicles sold in 2014 and 265,145 in 2020
according to market forecasts. Regarding revenues, the Ruble crisis could
weaken Dacia and Renault’s brands, as these cars are not obviously produce in
Russia. Therefore, we believe revenues will reach 2.87 billion euros in 2014 and
3.53 billion euros in 2020.
14
Renault’s annual report

“RENAULT S.A.” COMPANY REPORT
PAGE 20/30
Euromed Region
The Euromed Africa Region contains the African continent and the Eastern
European countries (emerging countries). Renault has historically been very
present in these markets (around 40% market shares in both Romania and
Morocco) with large manufacturing facilities (plants at Pitesti, Bursa, Casablanca
and Tangiers). Result is that Renault is considered as a local company in many
of these countries.
In 2013, Renault expended its plant in Tangiers to face the future demand in the
continent. Again, the new Clio and the Duster offer good results in Africa.
Despite its high brand recognition and its historical presence in the area, we
believe that Renault’s market share in existing market will reduce from 14.90% in
2013 to 14.16% in 2014 and afterwards. In 2014, the number of vehicles sold by
Renault in the region will be around 330,000 units. Africa is offering high growth
possiblities for French automarkers for two main reasons: first because they have
been present in the region for decades and they own facilities in the region.
Second, because France has historically a strong influence on Africa so that half
of the fastest growing country in the region are speaking French. Therefore, we
believe Renault’s sales will overpass 420,000 units in 2020. These expectations
will lead to 3.55 billion euros revenues at FY2014 that will grow to 4.55 billion
euros at FY2020.
Americas Region
Americas is growing market. It has known a significant development in the last
few years. Renault has been present for many decades in the region (more than
a century in Uruguay). The brand has a good recognition in South America with
several Renault car clubs and mythic models.
In 2013, 7 million vehicles were sold in the region. Half of those were in Brazil,
the Group’s second-largest market in terms of sales. We expect that this market
will exceed 8 million vehicles in 2020 (which represent a 2.5% increase per year).
The people in the region like SUVs and pick-ups. Renault has opportunities with
its Dacia and Captur models but it would have strong competition from the US
automakers that are offering cheap pick-up trucks and have a significant
influence on the drivers (for instance Mexico drivers preferences are very close to
the US: automatic gear box, pick-ups, SUVs etc.…).
In 2013, Renault increased its annual production capacity in the region. The
Curitiba plant can now produce 380,000 vehicles against 280,000 vehicles before

“RENAULT S.A.” COMPANY REPORT
PAGE 21/30
the restructuration. It will permit Renault to have the capability to meet the
increasing demand.
Despite the exchange rate instability, we believe Renault will keep its market
share position (6.55%) and continue to grow its network in Brazil and Mexico. It
will also keep effort on the Argentinian market in which the company is leader.
Sales will reach 458 thousand units in 2014 and grow to 526 thousand at
FY2020.
Concerning the revenues, they could be highly impacted by exchange rate
instability. In 2014, despite the exchange rates, we believe the company will
collect 4.71 billion euros in revenues. If the currencies in the region stay more or
less stable, Renault could reach 5.26 billion euros in revenues at FY2020.
Asia-Pacific Region
The opportunities for automakers in this region is undeniable with a high growth
and huge market potential. This is one of the reasons Renault has already signed
a partnership agreement in Jakarta with Indomobil and in other countries with
different local players. Nevertheless, we think that the company has only a tiny
exposure in the region with 0.61% market share in 2013. Moreover, Renault
signed agreement but did not present plans to invest further in Asia. Therefore,
we think that Renault will not become a big player of the Chinese market in the
next few years.
The last big market we need to talk about is Iran. In 2012, Renault is accused of
not respecting the embargo on the country imposed by the United States.
Renault’s 2013 results have been highly impacted by this case for two main
reasons, first because it provisioned around 514 million euros to cover the risk of
a fine, second because it lost a very profitable market. Indeed, before the
shutdown Renault was selling around 100 thousand units per year in Iran, which
represents a bigger market than Italy or Spain for instance. Moreover, it was
producing its Logan with an impressive gross margin thanks to this low labor cost
country. There are discussions between France, the US and Renault to avoid the
fine and to allow the company to operate again in the country.
If Renault is able to regain access to the Iranian market in the next few years its
revenue and gross margin could improve significantly. Otherwise, Renault should
not be impacted even more as we believe it has provisioned the expected
amount of the fine during the 2013 financial year. Nowadays we do not have
further information concerning the issue of this case.
“RENAULT S.A.” COMPANY REPORT
PAGE 22/30
To conclude, although we are not expecting to see demand in Asia growing at
the same rates of the recent past, the region will keep being the main driver for
the automotive industry, mainly due to the size of its market and its new middle
class that will be first time buyers of a car. We forecast passenger vehicles’
demand in Asia to decrease by 13.50%% in 2014 while, in a longer assessment;
we expect an annual growth of 4% until 2020. We believe that Renault will be
able to keep a position in the region, as its entry segment vehicles are consistent
with the demand. The company will have difficulties to increase its stake due to
the strong competition coming from the new Chinese automakers; however, we
believe that Renault will reach 0.70% market shares in 2018. Finally, with the
economic development, there are a growing number of rich individuals in the
region that are demanding for premium cars while Renault is not offering
premium vehicles.
With the 2014 slow down, revenues will decrease at 3.57 billion euros. On the
long run, which means at the year-end 2020, we believe that revenues will be
around 5.1 billion euros.
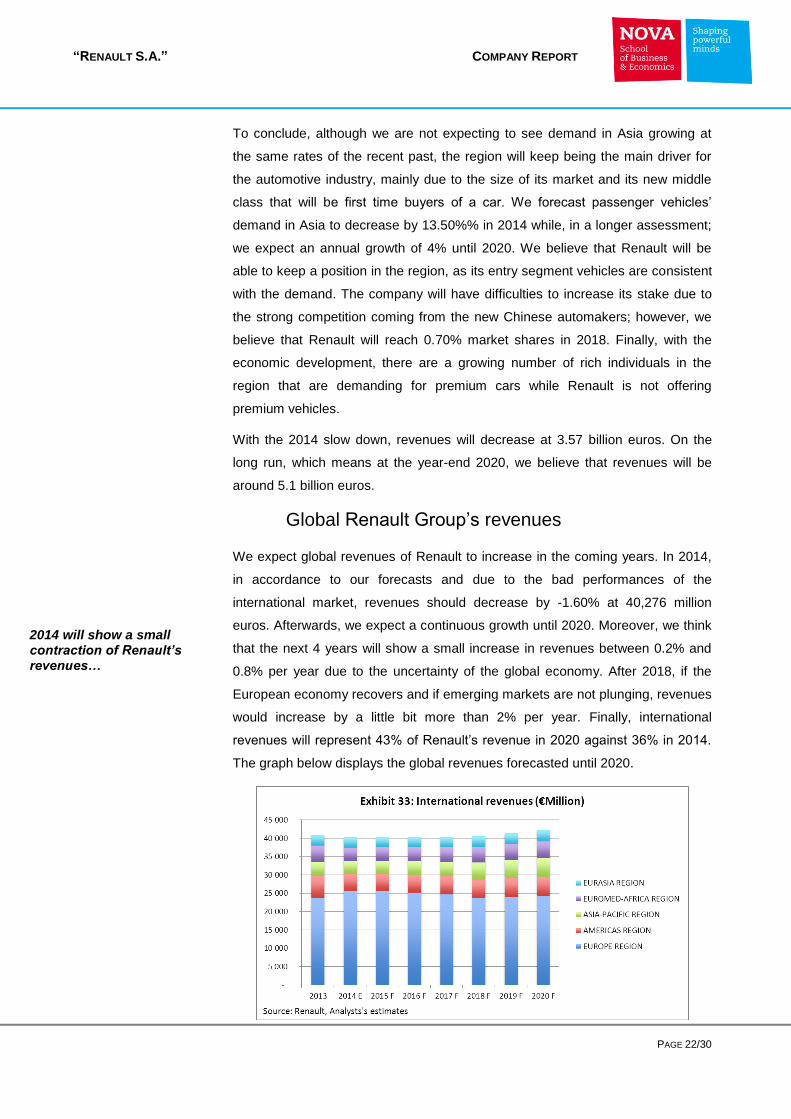
Global Renault Group’s revenues
We expect global revenues of Renault to increase in the coming years. In 2014,
in accordance to our forecasts and due to the bad performances of the
international market, revenues should decrease by -1.60% at 40,276 million
euros. Afterwards, we expect a continuous growth until 2020. Moreover, we think
that the next 4 years will show a small increase in revenues between 0.2% and
0.8% per year due to the uncertainty of the global economy. After 2018, if the
European economy recovers and if emerging markets are not plunging, revenues
would increase by a little bit more than 2% per year. Finally, international
revenues will represent 43% of Renault’s revenue in 2020 against 36% in 2014.
The graph below displays the global revenues forecasted until 2020.
2014 will show a small contraction of Renault’s revenues…

“RENAULT S.A.” COMPANY REPORT
PAGE 23/30
Valuation
As a result of our analysis, we are expecting Renault’s shares to reach a price
target of EUR62.90 at the year-end 2015, which represents an upside of 3.91%
against its current price of EUR60.53. However, with the expected dividends the
total return will reach 14.37%. Therefore, our final recommendation for Renault is
a HOLD position.
Discounted Cash-Flow
In order to access the value of Renault we decided to use the Discounted Cash
Flow valuation (DCF). We can use this methodology since the company displays
in its annual report that it will manage efficiently its financial structure by keeping
a constant debt to equity ratio. Through this approach, we discounted all Free
Cash flows of the company during the forecasted period (until 2020) to an
appropriate Weighted Average Cost of Capital (WACC).
WACC methodology
To compute the WACC15
there are three major values to estimate: the cost of
equity, the cost of debt, and the target debt to equity ratio.
Renault manages its financial structure to keep a constant debt to equity ratio.
We targeted future debt to equity ratio to be equal to 1.455.
In regards to the cost of debt, Renault can finance itself as a whole. Then, we
use a liquid bond issued by the company with the longest maturity, which yields
at 3.181%. To estimate the expected return of this bond we used the historical
probability of default and recovery rates given by Standard & Poor’s for a BB+
rated company, which correspond to 2.20% and 60% respectively. This
computation provides a cost of debt of 2.23%.
In regards to the cost of equity, we used the CAPM formula to make our
estimation. Therefore, we need the risk free rate, the levered Renault’s Beta and
the market risk premium.
As Renault’s major markets are in Europe, we used an AAA rated euro bonds
with the same maturity of Renault’s longest maturity bond (2021), which provides
us a risk free rate at 0.72%16
.
Market risk premium is assumed to be 5.80% in accordance with literature.
15
16
Source : ECB
The company manage efficiently its financial structure…

“RENAULT S.A.” COMPANY REPORT
PAGE 24/30
Renault is divided between its automotive and financing segments. Then, we
used two different betas to make our calculations. Our betas are calculated as an
average of both industries. We levered the betas using the targeted capital
structure of Renault. It gives us a levered beta of 1.77 for the automotive division
and 1.20 for the financing division. Finally, we calculated a weighted average
beta in accordance to the percentage of equity in each segment, which gave us a
1.70 beta for the entire company.
Having all the information needed to perform the CAPM, we estimated the cost of
equity to be equal to 10.564%
The effective marginal tax rate is estimated to be constant at 24% as historically
the company has developed an efficient fiscal management.
The appropriate WACC for Renault, which includes all our computations above,
is estimated to be 5.31%.
We define a 74% payout ratio according to the positive results that Renault
should disclose in the next few years.
We see risks on the valuation arising from the lack of information concerning the
financing segment. However, the free cash flows of this segment are relatively
low and should not have a significant impact on the valuation.
The graph below summaries the valuation method (exhibit 34).
Exhibit 34: Valuation summary
Growth rate in perpetuity = 3.80%
TODAY 0 1
(€ million) 2014 2015 2016
FCF 803 609
WACC 5,31% 5,31%
Value of Operations 22 862 23 466
Investments in associates 14 874 14 874
Non-current financial assets (note 22) 1 507 1 509
Deferred tax assets (note 8) 407 416
Current financial assets 1 080 1 081
Excess Cash 12 000 12 000
Deferred tax liabilities (note 8) 120 - 123 -
Provisions for pension and other long-term employee benefit obligations 1 672 - 1 729 -
Total Enterprise Value 50 936 51 494
Net Debt (@ market) 33 778 33 778 Equity (@ market) 17 158 17 716
Outstanding Shares (in thousands) 272 790 272 790
Current Share Price in € 60,53Expected Share Price (Price Target) in € 62,90 64,94Expected Capital Gain 3,91%
Shareholders' Cash In / Out (per share) in € 6,33 6,21 Expected "Cash" Gain 10,45%
Total Shareholders Expected Return 14,37%

“RENAULT S.A.” COMPANY REPORT
PAGE 25/30
Financials
Since the financial crisis in 2007, Renault faced two times a contraction on its
EBITDA. Following the crisis in 2009, it fell to a historically low at 2,191 million
euros. It recovered a first time due to France government actions to boost the
industry and reached 4,075 million euros in 2011. Indeed, at this time, the
government was offering a significant amount of money to customers eager to
change their old cars to buy new models, which boosted the selling of cars during
a two years period. It was also a way for the government to erase old and
polluting cars to its roads. At this time, Renault was on the way to the recovery
but unfortunately it has been impacted by the Iranian case in 2012. The loss of
this market plus the provision for the expected fine, are consequences that lead
to a fall in EBITDA at 3,135 million euros in 2013. We can notice that it declined
less than after the crisis due to the good recovery of the automotive industry. We
believe the company will recover from this declining trend in 2014. This will be
mainly generated by a bigger than foreseen recovery in the European market.
This recovery will also offset the slowing performances of the emerging markets.
However, we think that the company will not be able to perform as well as before
the crisis. We expect Renault to reach a 3,622 million euros EBITDA in 2014 due
to the end of the Iranian crisis, which will slowly growth at 3,759 million euros in
2020. This small growth over the next year is due to the uncertainty of the
European market and to the slowing down of the international market.
Concerning the operating items, in 2014, Renault aims to change its net working
capital requirement, which should result to an 800 million negative change in Net
Working Capital during the year. We took this information into consideration to
estimate FY2014 free cash flows. Renault does not indicate further modifications
in the coming years.
The company’s gamble on electric vehicle technology could provide a temporary
competitive advantage, but the investment cost is high. Moreover, it will need to
invest in new facilities and restructuration of its existing plants to adjust its
production to the shifting demand. Therefore, we expect Renault to keep a future
constant Capex to develop its international facilities. In 2013, the Capex was
smaller and we think that it will increase to a higher level in 2016 and stays
constant afterwards. We expect that the Capex will not return to a higher level
before 2016 because in the next two years Renault aims to achieve positive
automotive FCF.
The free cash flows in the industry are usually tight due to the high level of
investment required. However, with its restructuration, Renault should be able to
800 million negative change in NWC during 2014 financial year…

“RENAULT S.A.” COMPANY REPORT
PAGE 26/30
achieve positive free cash flows in the auto segment starting in 2015. Moreover,
its financing segment offers constant positive free cash flows. In the future and
with the increasing competition, we believe that Renault’s free cash flows will
grow at a 3.80% per year after 2020.
Return on investment capital has historically been under the WACC and is not
expected to overpass it due to the high level of investment required in the
industry. However, some automakers like Volkswagen succeed to reach a ROIC
higher than its WACC. Furthermore, we think that Renault’s ROIC will slowly
grow between 2014 and 2020.
With the crisis, automakers have seen their net incomes shrinking. Renault is not
an exception, after the crisis in 2009 it reported a negative net income of about 3
billion euros. In 2010, with the beginning recovery of the emerging markets and
with the political helps to the automotive industry, Renault released a net income
close to the pre-crisis level at 3.49 billion euros. With the slowing down of the
emerging markets, the end of the political helps to the industry and the loss of the
Iranian market, Renault’s net income decreased during 3 consecutive years at
695 million euros in 2013. With the end of the Iranian case, the small recovery of
Europe and the stabilisation of some foreign currencies, we expect that net
income will increase at 1.6 billion euros in 2014. Afterwards, net income will
improve, as the world automotive market will grow. However, we believe that with
the growing competition, net income will not reach its pre-crisis level (2 billion
euros of net income for FY2020).
Finally, we analysed future performances of Renault in term of margins. We have
already made a comparison with its peers previously in our report. We believe
that gross margin will improve in 2014 due to restructuration made in its
production facilities and the increasing production volumes. We forecasted gross
margin at 19% for 2014 and forwards. Concerning the EBITDA margin, we
assumed it would stay constant in relation to our assumption that the Capex will
also stays constant in the long run. Regarding the net income, we consider that it
will reach 4% in 2014 and will constantly grow afterwards at 4.74% in 2020. This
improvement will essentially come from the financial revenues of its associates
(Nissan and Avtovaz).

“RENAULT S.A.” COMPANY REPORT
PAGE 27/30
Multiples analysis
We performed a market multiples analysis to understand where Renault S.A. is
positioned in relation to its peers. We have considered two different multiples:
P/E and EV/EBITDA. All the information have been extracted at September 30th,
2014. We calculated Renault’s ratios to achieve a comparison with the average
of 7 peers. Regarding the P/E ratio, we can observe that Renault has a bigger
indicator than the industry average. In general, a high P/E ratio suggests that
investors are expecting higher earnings growth in the future compared to
companies with a lower P/E. However, in the Renault’s case, it seems that this is
because the earnings have been exceptionally low in 2013 (one year ago the P/E
ratio was equal to11.5).
The EV/EBITDA ratio shows how many years of EBITDA are needed to reach the
total enterprise value. We can notice that Renault will need more sustainable
years to reach its total enterprise value. In general, this is a characteristic of
growth companies. However, like previously stated, we believe that part of this
ratio is due to the exceptionally low earnings of last year. One year ago, the ratio
was equal to 9.
Using both ratios we can conclude that Renault is more expensive than its peers.
This could be due to the exceptionally low earnings of 2013.
Exhibit 41: Multiples analysis
Company Market capitalization P/E EV/EBITDA
Volkswagen AG 98 513 9,6 6,3
Ford Motor Company 57 363 15,0 11,9
Daimler AG 81 995 11,6 7,9
Toyota Motor Corp 185 607 12,7 8,5
Fiat SpA 11 729 12,1 3,4
Honda Motor Co Ltd 62 431 13,0 8,6
Audi AG 32 670 7,7 1,5
Peers average 75 758 11,7 6,9
Renault SA 19 705 13,5 9,4
Source: Bloomberg
“RENAULT S.A.” COMPANY REPORT
PAGE 28/30
Appendix
Financial Statements
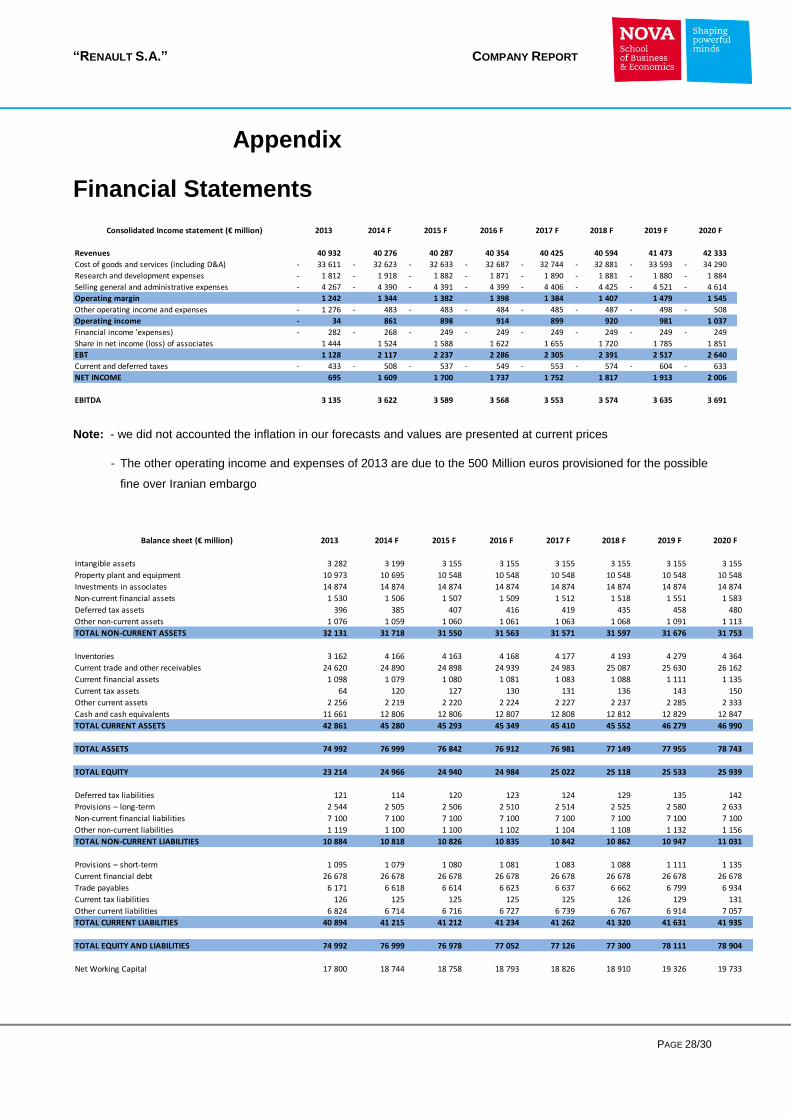
Note: - we did not accounted the inflation in our forecasts and values are presented at current prices
- The other operating income and expenses of 2013 are due to the 500 Million euros provisioned for the possible
fine over Iranian embargo
Consolidated Income statement (€ million) 2013 2014 F 2015 F 2016 F 2017 F 2018 F 2019 F 2020 F
Revenues 40 932 40 276 40 287 40 354 40 425 40 594 41 473 42 333
Cost of goods and services (including D&A) 33 611 - 32 623 - 32 633 - 32 687 - 32 744 - 32 881 - 33 593 - 34 290 -
Research and development expenses 1 812 - 1 918 - 1 882 - 1 871 - 1 890 - 1 881 - 1 880 - 1 884 -
Selling general and administrative expenses 4 267 - 4 390 - 4 391 - 4 399 - 4 406 - 4 425 - 4 521 - 4 614 -
Operating margin 1 242 1 344 1 382 1 398 1 384 1 407 1 479 1 545
Other operating income and expenses 1 276 - 483 - 483 - 484 - 485 - 487 - 498 - 508 -
Operating income 34 - 861 898 914 899 920 981 1 037
Financial income 'expenses) 282 - 268 - 249 - 249 - 249 - 249 - 249 - 249 -
Share in net income (loss) of associates 1 444 1 524 1 588 1 622 1 655 1 720 1 785 1 851
EBT 1 128 2 117 2 237 2 286 2 305 2 391 2 517 2 640
Current and deferred taxes 433 - 508 - 537 - 549 - 553 - 574 - 604 - 633 -
NET INCOME 695 1 609 1 700 1 737 1 752 1 817 1 913 2 006
EBITDA 3 135 3 622 3 589 3 568 3 553 3 574 3 635 3 691
Balance sheet (€ million) 2013 2014 F 2015 F 2016 F 2017 F 2018 F 2019 F 2020 F
Intangible assets 3 282 3 199 3 155 3 155 3 155 3 155 3 155 3 155
Property plant and equipment 10 973 10 695 10 548 10 548 10 548 10 548 10 548 10 548
Investments in associates 14 874 14 874 14 874 14 874 14 874 14 874 14 874 14 874
Non-current financial assets 1 530 1 506 1 507 1 509 1 512 1 518 1 551 1 583
Deferred tax assets 396 385 407 416 419 435 458 480
Other non-current assets 1 076 1 059 1 060 1 061 1 063 1 068 1 091 1 113
TOTAL NON-CURRENT ASSETS 32 131 31 718 31 550 31 563 31 571 31 597 31 676 31 753
Inventories 3 162 4 166 4 163 4 168 4 177 4 193 4 279 4 364
Current trade and other receivables 24 620 24 890 24 898 24 939 24 983 25 087 25 630 26 162
Current financial assets 1 098 1 079 1 080 1 081 1 083 1 088 1 111 1 135
Current tax assets 64 120 127 130 131 136 143 150
Other current assets 2 256 2 219 2 220 2 224 2 227 2 237 2 285 2 333
Cash and cash equivalents 11 661 12 806 12 806 12 807 12 808 12 812 12 829 12 847
TOTAL CURRENT ASSETS 42 861 45 280 45 293 45 349 45 410 45 552 46 279 46 990
TOTAL ASSETS 74 992 76 999 76 842 76 912 76 981 77 149 77 955 78 743
TOTAL EQUITY 23 214 24 966 24 940 24 984 25 022 25 118 25 533 25 939
Deferred tax liabilities 121 114 120 123 124 129 135 142
Provisions – long-term 2 544 2 505 2 506 2 510 2 514 2 525 2 580 2 633
Non-current financial liabilities 7 100 7 100 7 100 7 100 7 100 7 100 7 100 7 100
Other non-current liabilities 1 119 1 100 1 100 1 102 1 104 1 108 1 132 1 156
TOTAL NON-CURRENT LIABILITIES 10 884 10 818 10 826 10 835 10 842 10 862 10 947 11 031
Provisions – short-term 1 095 1 079 1 080 1 081 1 083 1 088 1 111 1 135
Current financial debt 26 678 26 678 26 678 26 678 26 678 26 678 26 678 26 678
Trade payables 6 171 6 618 6 614 6 623 6 637 6 662 6 799 6 934
Current tax liabilities 126 125 125 125 125 126 129 131
Other current liabilities 6 824 6 714 6 716 6 727 6 739 6 767 6 914 7 057
TOTAL CURRENT LIABILITIES 40 894 41 215 41 212 41 234 41 262 41 320 41 631 41 935
TOTAL EQUITY AND LIABILITIES 74 992 76 999 76 978 77 052 77 126 77 300 78 111 78 904
Net Working Capital 17 800 18 744 18 758 18 793 18 826 18 910 19 326 19 733

“RENAULT S.A.” COMPANY REPORT
PAGE 29/30
Cash flow map (€ million) 2013 2014 F 2015 F 2016 F 2017 F 2018 F 2019 F 2020 F
EBIT 34 - 861 898 914 899 920 981 1 037
(-) Notional Income Taxes 8 207 - 216 - 219 - 216 - 221 - 235 - 249 -
(+) Tax Adjustment 162 - - - - - - - -
NOPLAT 188 - 654 683 695 683 699 746 788
(+) Depreciation 3 169 2 761 2 691 2 654 2 654 2 654 2 654 2 654
Operating Gross Cash Flow 2 981 3 415 3 374 3 349 3 338 3 354 3 400 3 443
(-) Capex (PPE & Intangibles) 2 408 - 2 400 - 2 500 - 2 654 - 2 654 - 2 654 - 2 654 - 2 654 -
(-) Change in NWC 70 - 944 - 15 - 35 - 33 - 84 - 416 - 407 -
(-) Change in Operating Assets & Liabilities 20 3 - 0 0 0 0 1 1
(-) Change in operating provisions 345 112 - 56 - 51 - 51 - 42 - 21 20
Total Operating Free Cash Flow 868 43 - 803 609 600 573 351 402
FCF from various forms of financial aplications 148 192 1 351 1 381 1 411 1 445 1 444 1 496
(-) Change in pension & employee benefits 91 - 57 57 57 57 57 57 57
Non-Operating Free Cash Flow 745 249 1 408 1 438 1 468 1 502 1 501 1 553
Total Free Cash Flow to the Firm 1 613 206 2 211 2 047 2 068 2 076 1 852 1 955
(+) Change in Financial Debt (incl. Derivatives) 757 - - - - - - -
(-) Finance Cost 450 - 459 - 459 - 459 - 459 - 459 - 459 - 459 -
(+) Tax Shield 108 110 110 110 110 110 110 110
(+) Change in Equity 2 028 - 143 1 726 - 1 694 - 1 714 - 1 721 - 1 498 - 1 600 -
Total Cash Flow from Financing 1 613 - 206 - 2 075 - 2 043 - 2 063 - 2 070 - 1 847 - 1 949 -
Operating Invested Capital 29 931 30 628 30 507 30 593 30 676 30 802 31 196 31 583
ROIC -0,61% 2,19% 2,23% 2,28% 2,23% 2,28% 2,42% 2,53%
ROE 2,99% 6,44% 6,82% 6,95% 7,00% 7,23% 7,49% 7,73%
ROA 0,93% 2,09% 2,21% 2,26% 2,28% 2,36% 2,45% 2,55%
“RENAULT S.A.” COMPANY REPORT
PAGE 30/30
Disclosures and Disclaimer
Research Recommendations
Buy Expected total return (including dividends) of more than 15% over a 12-month period.
Hold Expected total return (including dividends) between 0% and 15% over a 12-month period.
Sell Expected negative total return (including dividends) over a 12-month period.
This report was prepared by Vincent Bouigeon, a student of the NOVA School of Business and Economics, following the Masters in Finance Equity Research – Field Lab Work Project, exclusively for academic purposes. Thus, the author, which is a Masters in Finance student, is the sole responsible for the information and estimates contained herein and for the opinions expressed, which reflect exclusively his/her own personal judgement. This report was supervised by professor Rosário André (registered with Comissão do Mercado de Valores Mobiliários as financial analyst) who revised the valuation methodology and the financial model. All opinions and estimates are subject to change without notice. NOVA SBE or its faculty accepts no responsibility whatsoever for the content of this report nor for any consequences of its use. The information contained herein has been compiled by students from public sources believed to be reliable, but NOVA SBE or the students make no representation that it is accurate or complete, and accept no liability whatsoever for any direct or indirect loss resulting from the use of this report or its content. The author hereby certifies that the views expressed in this report accurately reflect his/her personal opinion about the subject company and its securities. He/she has not received or been promised any direct or indirect compensation for expressing the opinions or recommendation included in this report. The author of this report may have a position, or otherwise be interested, in transactions in securities which are directly or indirectly the subject of this report. NOVA SBE may have received compensation from the subject company during the last 12 months related to its fund raising program. Nevertheless, no compensation eventually received by NOVA SBE is in any way related to or dependent on the opinions expressed in this report. The Nova School of Business and Economics, though registered with Comissão do Mercado de Valores Mobiliários, does not deal for or otherwise offers any investment or intermediation services to market counterparties, private or intermediate customers. This report may not be reproduced, distributed or published without the explicit previous consent of its author, unless when used by NOVA SBE for academic purposes only. At any time, NOVA SBE may decide to suspend this report reproduction or distribution without further notice.