remuneration report -...
TRANSCRIPT

n i b h o l d i n g s l i m i t e d22
REMUNERATION REPORTFor the year ended 30 June 2016
MESSAGE FROM THE BOARD
Dear Shareholder,
We are pleased to present our Remuneration Report for the financial year to 30 June 2016.
Our aim with remuneration is to retain, reward and incentivise our Executives to deliver short-and-long-term value creation that is aligned to our organisational culture, overall business strategy as well as shareholder interests.
The Board has spent considerable time bedding down a remuneration philosophy and framework that is fair to our people and is reasonable in the eyes of our shareholders. It’s therefore encouraging that our remuneration approach has been readily accepted by our shareholders, proxy advisors and other shareholder representative groups. At the 2015 Annual General Meeting, our shareholders voted more than 98% in favour of our Remuneration Report. We feel feedback is important and as in previous years, nib will seek to engage with our key stakeholders prior to this year’s AGM.
Like many companies we continue to face intense competition to attract and also retain Executive talent. Our remuneration structure sets a clear and meaningful link between performance and reward to ensure we continue to attract and retain the right people. We have previously explained to our shareholders that the Board’s Executive remuneration goal is to position our Executive team between the 50th and 75th percentile of benchmarked companies in terms of fixed remuneration. On a regular basis we engage an independent advisor to assist in benchmarking remuneration against a defined nib peer group which contains similar businesses of comparable size. This was done in May 2014 and again in May this year (for financial year 2017). As our shareholders have seen, the size, scope and complexity of nib has increased significantly in the last few years with the acquisition of nib New Zealand, World Nomads Group and the expansion of our international business operations. Our benchmarking in 2016 has shown that the Managing Director was below market and so TFR will be increased by 15% in 2017 to align with our targets and to remain competitive. Further information regarding Executive Remuneration, as well as total remuneration mix and performance against STI and LTI hurdles for FY16, can be found on pages 27 to 31 of the Annual Report.
Due to ongoing growth and diversification of the Group, Board succession planning and renewal remains a key focus for the nib Board. Ensuring we have the right skills mix, experience, diversity, independence and capacity is integral to nib’s ongoing success. With this central to our thinking, during the year nib appointed Mr Donal O’Dwyer as an Independent Non-Executive Director of the Board of nib. The appointment of Donal follows the announcement in November last year by Dr Annette Carruthers that she would not be seeking re-election as a Non-Executive Director of nib. We will not be seeking shareholder approval to Increase nib’s Non-Executive Director fee pool with 2017 Directors fees captured under our current fee pool.
Since listing on ASX in 2007, nib has continued to perform well against our stated business strategy. With that we have delivered strong returns for our shareholders, while being served by a very capable and experienced Executive team. We thank our Executives and their teams for their commitment to nib.
I would like acknowledge the contribution of my fellow nib Director, Christine McLoughlin who during the year moved from Chairman of our People and Remuneration Committee and will take up the role as Chairman of Risk and Reputation Committee. Christine’s, leadership has helped embed the effective remuneration philosophy we have at nib. As Chairman of our People and Remuneration Committee I look forward to building on the strong foundations we have in place.
As always, we welcome your feedback.
Yours sincerely
Lee AusburnChairman People and Remuneration Committee

a n n u a l r e p o r t 2 0 1 6 23
WHO THIS REPORT COVERSThis Report presents the remuneration arrangements for nib’s key management personnel.
Executive Director
Mark Fitzgibbon Managing Director/Chief Executive Officer (MD/CEO)
Other Executives
Michelle McPherson Deputy Chief Executive Officer/Chief Financial Officer (CFO/DCEO)
Rhod McKensey Group Executive Australian Residents Health Insurance (GEARHI)
Rob Hennin Chief Executive Officer – New Zealand (CEO NZ)
Brendan Mills Chief Information Officer (CIO)
Justin Vaughan Group Executive Benefits and Provider Relations (GEBPR)
David Kan Group Executive International and New Business (GEINB)
Independent Non-Executive Directors
Steve Crane Chairman
Lee Ausburn Member Risk and Reputation Committee , Member People and Remuneration Committee (until 29 February 2016), Chairman People and Remuneration Committee (1 March 2016 – 30 June 2016)
Harold Bentley Chairman Audit Committee, Chairman Board Audit Risk and Compliance Committee New Zealand, Director New Zealand subsidiaries, Member Investment Committee, and Risk and Reputation Committee
Annette Carruthers Chairman Risk and Reputation Committee, Director New Zealand subsidiaries and Member Audit Committee and Board Audit Risk and Compliance Committee New Zealand
Philip Gardner Chairman Investment Committee, Member Audit Committee and People and Remuneration Committee
Christine McLoughlin Chairman People and Remuneration Committee (until 29 February 2016), Member People and Remuneration (1 March 2016 – 30 June 2016), Member Risk and Reputation Committee
Donal O’Dwyer (commenced 22/3/2016)
Member People and Remuneration Committee, and Risk and Reputation Committee
CONTENTS
Key terms used in this Report 23
Who this Report covers 23
Performance drives remuneration at nib 24
Our remuneration governance 25
Actual remuneration received for the financial year ended 30 June 2016 26
Executive reward at nib 27
How reward was linked to performance this year 32
Terms of Executive contracts 34
Non-Executive Director remuneration 35
Detailed disclosure of Executive remuneration 36
Detailed disclosure of Non-Executive remuneration 40
Equity instruments held by key management personnel 41
KEY TERMS USED IN THIS REPORT
FY15 Financial year ended 30 June 2015
FY16 Financial year ended 30 June 2016
FY17 Financial year ended 30 June 2017
AGM Annual General Meeting
Group nib holdings limited consolidated entity
KMP Key Management Personnel (those Directors and Executives who have responsibility for planning, directing and controlling the activities of nib, either directly or indirectly)
KPI Key Performance Indicator
LTI Long-Term Incentive
LTIP Long-Term Incentive Plan
NPAT Net Profit After Tax
STI Short-Term Incentive
TFR Total Fixed Remuneration
TSR Total Shareholder Return
n i b h o l d i n g s l i m i t e d24
REMUNERATION REPORTCONTINUEDFor the year ended 30 June 2016
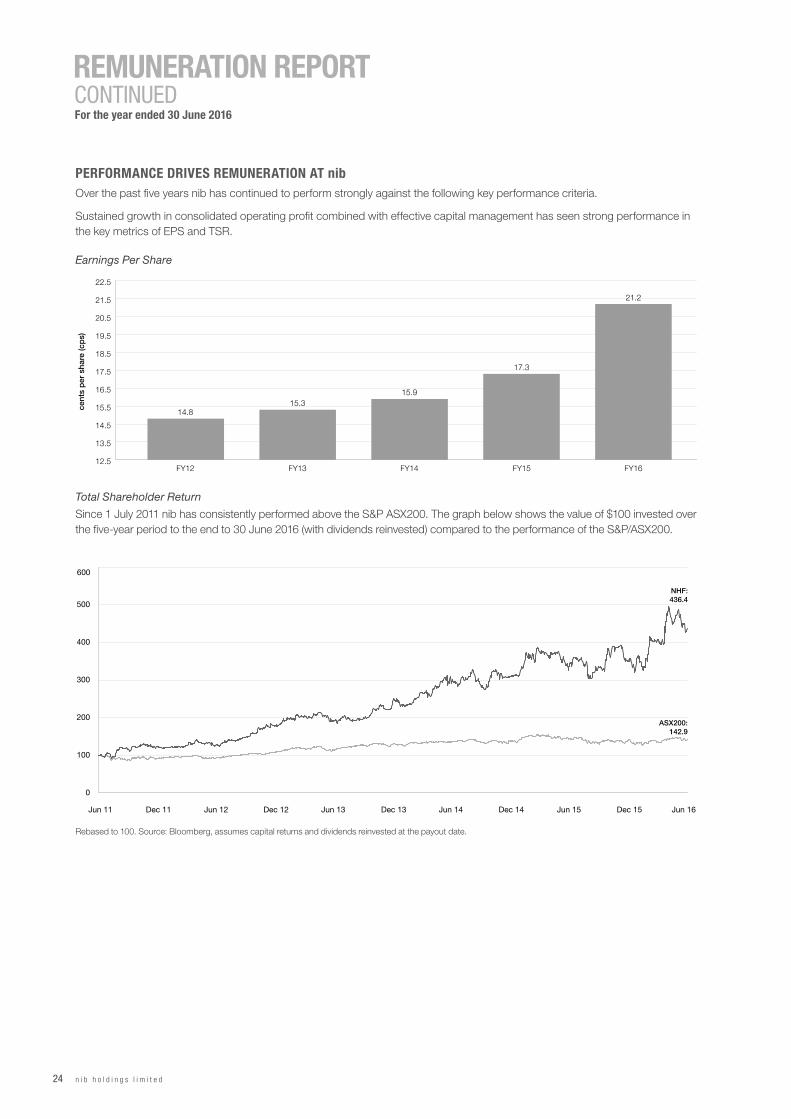
PERFORMANCE DRIVES REMUNERATION AT nibOver the past five years nib has continued to perform strongly against the following key performance criteria.
Sustained growth in consolidated operating profit combined with effective capital management has seen strong performance in the key metrics of EPS and TSR.
Earnings Per Share
cent
s p
er s
hare
(cp
s)
12.5
13.5
14.5
15.5
16.5
17.5
18.5
19.5
20.5
21.5
22.5
FY16FY15FY14FY13FY12
14.815.3
15.9
17.3
21.2
Total Shareholder Return
Since 1 July 2011 nib has consistently performed above the S&P ASX200. The graph below shows the value of $100 invested over the five-year period to the end to 30 June 2016 (with dividends reinvested) compared to the performance of the S&P/ASX200.
0
100
200
300
400
500
600
Jun 16Dec 15Jun 15Dec 14Jun 14Dec 13Jun 13Dec 12Jun 12Dec 11Jun 11
NHF:436.4
ASX200:142.9
Rebased to 100. Source: Bloomberg, assumes capital returns and dividends reinvested at the payout date.

a n n u a l r e p o r t 2 0 1 6 25
OUR REMUNERATION GOVERNANCEThe role of nib’s People and Remuneration Committee (Committee) is to make recommendations to the Board on the remuneration framework, ensuring our remuneration strategy is aligned and reflects the performance of the nib Group. As part of this process the Committee seeks advice and consults with a range of external remuneration consultants, specialists, major shareholders and shareholder advisory groups.
The Committee has responsibilities in the areas of remuneration and its link to nib’s culture and business strategy, diversity, human resources strategy, succession planning and employee development and engagement. The Committee Charter is available on the nib website (nib.com.au/shareholders). The Committee includes the following independent, Non-Executive Directors:
Lee Ausburn
Christine McLoughlin
Donal O’Dywer
Philip Gardner
Executive remuneration arrangements are set against a comparator group of organisations or peers, which nib determines in consultation with external remuneration advisors. In May 2014 (and again in May this year for financial year 2017) Guerdon Associates completed the benchmarking analyses. The scope of this work included reviewing and benchmarking remuneration arrangements against a relevant peer group of companies and working with the Committee to ensure any proposed changes are aligned to our remuneration philosophy. The May 2014 benchmarking analysis and supplementary data was utilised for the financial year 2016 reviews.
In determining nib’s peer group, companies from the following sectors and industries were considered:
• Health insurance companies;
• Other insurance companies;
• Other finance sector companies;
• Consumer discretionary; and
• Healthcare companies.
We have found it challenging to define a peer group in the Australian market of a similar size to nib. As a result comparator companies were chosen based on size and broad operational parameters. We also consider current market expectations within our sector in forming a view of benchmarking Executive remuneration.
The primary peer group contained 20 companies, and a further 25 companies were represented in the supplementary comparator group. The primary peer group was chosen based on market capitalisation and pre-tax profit broadly being between 50% and 200% of nib, with nib positioned around the middle of the group.
nib’s long-term goal is to set TFR for our Managing Director/ Chief Executive Officer and Executives competitively between the 50th and 75th percentiles of our benchmarked peer group. In FY16, adjustments were made to achieve this goal. Our increasing market capitalisation (which has increased approximately 230% over the five year period from 30 June 2011) together with the expanding scope and complexity of our business, has required us to review and change our peer group of 20 companies for FY17. This has resulted in further Executive remuneration adjustments for FY17. Our benchmarking in 2016 has shown that the Managing Director was below market and so TFR will be increased by 15% in 2017 to align with our targets and to remain competitive.
The Board’s view is that our current LTI performance hurdles being Earnings Per Share (EPS) and Total Shareholder Return (TSR) relative to S&P/ASX200 group of companies remain appropriate and aligned to our remuneration philosophy. We will continue to assess the appropriateness of these performance hurdles each year and consult with shareholders, proxy advisors and other shareholder representative groups regarding any future amendments to ensure they are aligned to shareholder interests.
n i b h o l d i n g s l i m i t e d26
REMUNERATION REPORTCONTINUEDFor the year ended 30 June 2016
ACTUAL REMUNERATION RECEIVED FOR THE FINANCIAL YEAR ENDED 30 JUNE 2016Actual remuneration for each Executive in FY16 included a fixed component, as well as a variable component made up of an STI payment and LTI award. The STI paid is determined by the performance of each Executive against set performance targets that include financial and non-financial metrics, and in some instances, strategic milestones. FY16 included the vesting of the FY12-FY15 LTI Plan for eligible participants, based on hurdles set (Earnings Per Share and Total Shareholder Return) with 50% of the FY12-FY15 LTI Plan vesting for participants.
A full breakdown of Executive remuneration details has been prepared in accordance with statutory requirements and accounting standards. This detailed disclosure is located on page 36 of this Report.
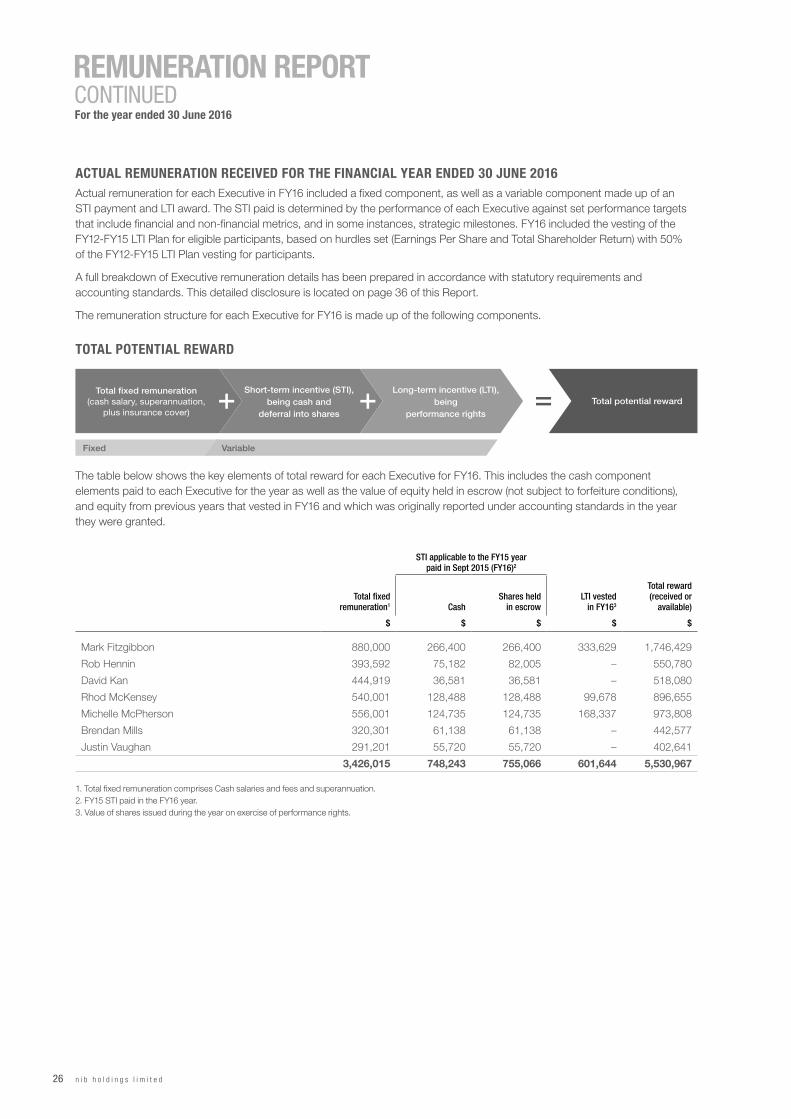
The remuneration structure for each Executive for FY16 is made up of the following components.
TOTAL POTENTIAL REWARD
Total fixed remuneration(cash salary, superannuation,
plus insurance cover)
Short-term incentive (STI),being cash and
deferral into shares
Fixed Variable
Long-term incentive (LTI),being
performance rights
Total potential reward
The table below shows the key elements of total reward for each Executive for FY16. This includes the cash component elements paid to each Executive for the year as well as the value of equity held in escrow (not subject to forfeiture conditions), and equity from previous years that vested in FY16 and which was originally reported under accounting standards in the year they were granted.
STI applicable to the FY15 yearpaid in Sept 2015 (FY16)2
Total fixed remuneration1 Cash
Shares held in escrow
LTI vestedin FY163
Total reward (received or
available)
$ $ $ $ $
Mark Fitzgibbon 880,000 266,400 266,400 333,629 1,746,429
Rob Hennin 393,592 75,182 82,005 – 550,780
David Kan 444,919 36,581 36,581 – 518,080
Rhod McKensey 540,001 128,488 128,488 99,678 896,655
Michelle McPherson 556,001 124,735 124,735 168,337 973,808
Brendan Mills 320,301 61,138 61,138 – 442,577
Justin Vaughan 291,201 55,720 55,720 – 402,641
3,426,015 748,243 755,066 601,644 5,530,967
1. Total fixed remuneration comprises Cash salaries and fees and superannuation.2. FY15 STI paid in the FY16 year.3. Value of shares issued during the year on exercise of performance rights.

a n n u a l r e p o r t 2 0 1 6 27
EXECUTIVE REWARD AT nibThe objective of Executive remuneration arrangements is to ensure that nib’s remuneration practices are clearly understood and appropriately aligned with shareholder value creation over the short and long term, and that these practices work to appropriately motivate, reward and retain Executives.
The remuneration framework provides a mix of fixed and variable remuneration with a blend of short-term and long-term incentives. There are three components of total remuneration:
• fixed remuneration, comprising base remuneration package, superannuation and insurance cover;
• short-term incentives based on predetermined Key Performance Indicator (KPI) targets established by the Board and an assessment of leadership; and
• longer-term incentives based on predetermined TSR and EPS performance established by the Board.
Executives only receive dividends on the deferred STI and LTI (including those subject to escrow) after they have been awarded or vested. Executives are not entitled to dividends on securities or performance rights which have not vested.
A significant portion of the Managing Director/Chief Executive Officer’s and Executives’ remuneration is performance based through STI and LTI arrangements. Claw-back arrangements are in place for the portion of STI deferred and LTI.
If the Board becomes aware of a material misstatement of our financial accounts or statements, and nib has awarded the Executive a remuneration increase, incentive payment or award (STI and LTI) having regard to misstatement, the Board may, (in its absolute discretion) require the Executive to:
• repay the Company any amount of remuneration, STI or LTI received by the Executive; or
• forfeit or cancel any remuneration increase, STI or LTI award (whether vested or unvested).
Our remuneration mixThe graph below illustrates the FY16 remuneration mix for our Executives. Any variations in target remuneration mix between Executive roles reflect position responsibilities.
% t
arge
t re
mun
erat
ion
opp
ortu
nity
Longer-term performance incentives opportunityShort-term performance incentives opportunity – deferred into shares
Short-term performance incentives opportunity – cashBase remuneration package and bene�ts
0%
10%
20%
30%
40%
50%
60%
70%
80%
90%
100%
GEINBGEBPRCIOCEO NZGEARHIDCEO/CFOMD/CEO
33%
48% 50% 50%
17%
14% 15% 15%
33%24% 20% 20%
17%
14% 15% 15%
53%
13%
21%
13%
53%
13%
21%
13%
53%
13%
21%
13%
n i b h o l d i n g s l i m i t e d28
REMUNERATION REPORTCONTINUEDFor the year ended 30 June 2016
EXECUTIVE REWARD AT nib continued
Fixed remunerationFixed remuneration for Executives is determined with reference to a benchmarking process, external market factors, competition to attract and retain talent, as well as consideration of the expertise of the individual in the role.
Fixed remuneration includes cash salary, superannuation and insurance cover. The fixed remuneration may be salary packaged at no additional cost to the Group.
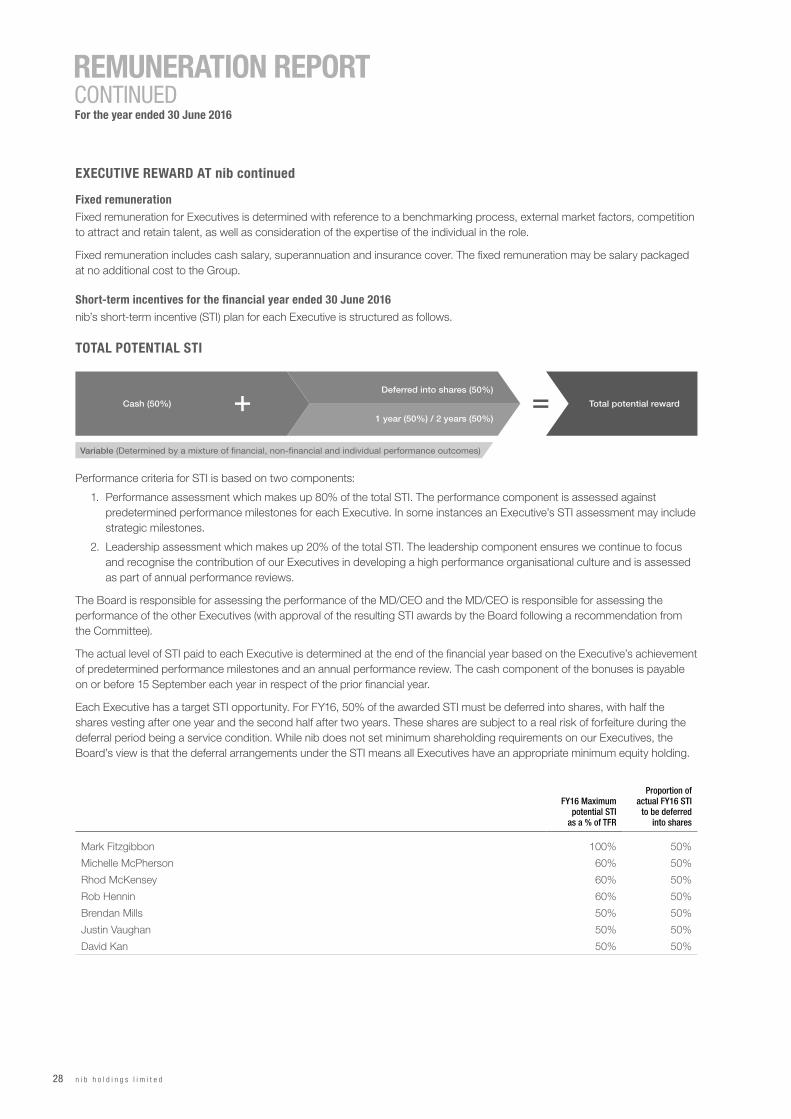
Short-term incentives for the financial year ended 30 June 2016nib’s short-term incentive (STI) plan for each Executive is structured as follows.
TOTAL POTENTIAL STI
Total potential reward
Deferred into shares (50%)
Cash (50%)
1 year (50%) / 2 years (50%)
Variable (Determined by a mixture of �nancial, non-�nancial and individual performance outcomes)
Performance criteria for STI is based on two components:
1. Performance assessment which makes up 80% of the total STI. The performance component is assessed against predetermined performance milestones for each Executive. In some instances an Executive’s STI assessment may include strategic milestones.
2. Leadership assessment which makes up 20% of the total STI. The leadership component ensures we continue to focus and recognise the contribution of our Executives in developing a high performance organisational culture and is assessed as part of annual performance reviews.
The Board is responsible for assessing the performance of the MD/CEO and the MD/CEO is responsible for assessing the performance of the other Executives (with approval of the resulting STI awards by the Board following a recommendation from the Committee).
The actual level of STI paid to each Executive is determined at the end of the financial year based on the Executive’s achievement of predetermined performance milestones and an annual performance review. The cash component of the bonuses is payable on or before 15 September each year in respect of the prior financial year.
Each Executive has a target STI opportunity. For FY16, 50% of the awarded STI must be deferred into shares, with half the shares vesting after one year and the second half after two years. These shares are subject to a real risk of forfeiture during the deferral period being a service condition. While nib does not set minimum shareholding requirements on our Executives, the Board’s view is that the deferral arrangements under the STI means all Executives have an appropriate minimum equity holding.
FY16 Maximum potential STI
as a % of TFR
Proportion of actual FY16 STI
to be deferred into shares
Mark Fitzgibbon 100% 50%
Michelle McPherson 60% 50%
Rhod McKensey 60% 50%
Rob Hennin 60% 50%
Brendan Mills 50% 50%
Justin Vaughan 50% 50%
David Kan 50% 50%

a n n u a l r e p o r t 2 0 1 6 29
The specific KPIs and weighting for FY16 for the Managing Director/CEO and Chief Financial Officer/Deputy CEO which constitutes 80% of their total STI are below (other executives have KPIs which are relevant to their roles).
KPI WeightingMark Fitzgibbon
(MD/CEO)
Michelle McPherson(CFO/DCEO)
Growth
Group premium revenue 10% –
Profitability
Group underlying profit 40% 40%
WNG underlying operating profit 10% –
Underlying EPS 20% 20%
Cost control
Group management expense ratio (excluding acquisition costs) – 30%
Customer satisfaction
arhi customer satisfaction 20% 10%
Short-term performance targets are set for achieving specific financial business and individual performance outcomes and awards are made relative to stretch performance.
Actual STIs awarded and forfeited (as a percentage of total STI) are set out below. A more detailed description of performance against STI performance hurdles for the CEO and CFO/DCEO is shown on page 32.
FY16 STI Bonus FY15 STI Bonus
Awarded Forfeited Awarded Forfeited
% % % %
Mark Fitzgibbon 87% 13% 83% 17%
Michelle McPherson 86% 14% 82% 18%
Rhod McKensey 87% 13% 90% 10%
Rob Hennin 92% 8% 85% 15%
Brendan Mills 85% 15% 79% 21%
Justin Vaughan 96% 4% 80% 20%
David Kan 82% 18% 75% 25%
Group average 88% 12% 70% 30%

n i b h o l d i n g s l i m i t e d30
REMUNERATION REPORTCONTINUEDFor the year ended 30 June 2016
EXECUTIVE REWARD AT nib continued
Long-term incentives for the financial year ended 30 June 2016nib’s long-term incentive (LTI) plan for each Executive is structured as follows.
TOTAL POTENTIAL LTI
LTI Issue of Rights4 year
performance period
Tranche 1 (50%):TSR
Tranche 2 (50%):EPS
LTI awarded
With 50% of total awardhaving 2 year escrow period
The purpose of the LTI is to balance short-term performance objectives with the creation of long-term shareholder value by focusing overall Group performance over a multi-year period.
The nib LTI is an incentive provided to eligible Executives if specific measures are met over a four-year period. LTI targets are set in the interests of creating long term shareholder value and to assist nib to attract, reward, motivate and retain Executives.
LTIP participants are granted performance rights that enable the Executive to acquire shares in nib for nil consideration if performance conditions are met and the employees are still employed by nib at the end of the vesting period. No dividends are received on unvested rights.
The vesting date may be accelerated at the Board’s discretion in the event of death of a participant, cessation of employment for other reasons; including total and permanent disablement, redundancy and retirement, on winding up, delisting, change of control and reconstruction or amalgamation.
Participation in the plan is at the Board’s discretion and no individual has a contractual right to participate in the plan or to receive any guaranteed benefits.
The performance hurdles for the nib LTI is Total Shareholder Return (TSR) relative to the S&P/ASX200 over four years and EPS growth over the performance period. The LTI is allocated in two equal tranches; 50% for TSR and 50% for EPS.
A condition of acceptance for each Executive in the LTI Plan is the requirement for 50% of the LTI to have a two-year escrow period. This escrow period extends beyond employment at nib ceasing, including termination.
nib LTI performance rights vest in accordance with the achievement of the following vesting conditions:
Vesting Condition 1 Vesting Condition 2
50% of the performance rights (Tranche 1) 50% of the performance rights (Tranche 2)
Total shareholder return targets (TSR Hurdle) for the relevant performance period are met
Earnings per share growth targets (EPS Hurdle) for the relevant performance period are met
TSR Hurdle (Tranche 1)The TSR Hurdle applies to half of the LTI allocation. The TSR Hurdle measures the groth in the price of nib securities plus nib cash distributions and compares this to the shareholder returns from the peer group of companies. In order for the Tranche 1 performance rights to vest, the TSR of nib will be compared to companies in the S$P/ASX 200 (the peer group) over the performance period.
The percentage of Tranch 1 performance rights that vest is determined as follows:
nib’s TSR performance compared to the relevant peer group Performance of Tranche 1 performance rights vesting
>= 75th percentile 100%
>= 50th percentile to 74th percentile Pro-rata straight line vesting between 50% and 74%
< 50th percentile 0%

a n n u a l r e p o r t 2 0 1 6 31
EPS Hurdle (Tranche 2)The EPS Hurdle applies to 50% of the LTI allocation. Vesting of performance rights is subject to nib holdings limited EPS hurdle as follows:
Percentage of performance
rights vesting
EPS Hurdle: CAGR from base EPS FY13-FY16 LTIP
EPS Hurdle:CAGR from base EPS FY14-FY17 LTIP
EPS Hurdle:CAGR from base EPS FY15-FY18 LTIP
EPS Hurdle:CAGR from base EPS FY16-FY19 LTIP
Base EPS 14.8 cps Base EPS 15.3 cps Base EPS 15.9 cps Base EPS 17.3 cps
100% 15% 25.8 cps 15% 26.8 cps 9% 22.4 cps 9% 24.4 cps
75% 12.5% 23.6 cps 10% 22.4 cps 7% 20.8 cps 7% 22.7 cps
50% 10% 21.6 cps 7% 20.1 cps 5.5% 19.7 cps 5% 21.0 cps
25% 7.5% 19.7 cps 3% 17.2 cps 4% 18.6 cps 3% 19.5 cps
0% <7.5% nil <3% nil <4% nil <3% nil
For the purpose of the calculation, 25% to 50% will be discrete thresholds, with performance above the 50% entitlement calculated on a pro rata basis to a maximum entitlement of 100%.
For the FY16-FY19 LTIP nib moved to set EPS hurdles and performance levels annually, instead for the four year period at the beginning at the performance period. This allows the Board to take into account regulatory pricing re-sets and a focus on performance sustainability over a long-term period. The main reason for this, and as can be seen from the graph (below), is that for incentive schemes to be effective they need to strike the right balance of being aspirational but also achievable. As the graph highlights, our previous approach to setting EPS targets for the four year period resulted in nil award of the EPS component for FY11 and FY12. For the FY13 and FY14 grants, cumulative average growth rate targets were updated to reflect the strategy and maturity of the business.
Variability in investment returns from year to year also impacts EPS, with EPS targets being set based on an assumption that on average over time investment returns will be in line with benchmark performance.
If vesting conditions are met, the performance rights will vest on 1 September following the end of the performance period. On the vesting date, Executives who hold vested performance rights will be either issued or transferred shares in nib for each vested performance right. There is no re-testing of performance.
One half of any shares awarded will be required to be held in escrow for a period of two years, even if termination of employment occurs during that period.
The graph below shows the EPS performance of nib for the past five years and demonstrates how challenging the EPS targets are for grants of LTI made in FY11 and FY12. For the FY13 and FY14 grants cumulative average growth rate targets were updated to reflect the strategy and maturity of the business. Variability in investment returns from year to year impacts EPS, with EPS targets being set based on an assumption that on average over time investment returns will be in line with benchmark performance.
0.0
5.0
10.0
15.0
20.0
25.0
30.0
35.0
FY19FY18FY17FY16FY15FY14FY13FY12FY11
25% vesting range 50% – 75% vesting range on a pro-rata basis 75% – 100% vesting range on a pro-rata basis
FY10 – FY12 LTIP100% vested
14.813.7
15.3 15.917.3
21.2
25% EPSCAGR
25% EPSCAGR
15% EPSCAGR15% EPS
CAGR
9% EPSCAGR
FY14 – FY17LTIP
FY15 – FY18LTIPFY13 – FY16
LTIP
FY11 – FY14 LTIPniil EPS vested
FY12 – FY15 LTIPnil EPS vested
EPS
FY09 – FY11 LTIP100% vested
EP
S (c
ps)
9% EPSCAGR
FY16 – FY19LTIP
There is no vesting event in respect of the FY13 result reflecting the move from three-year LTI targets to four-year LTI targets.

n i b h o l d i n g s l i m i t e d32
REMUNERATION REPORTCONTINUEDFor the year ended 30 June 2016
HOW REWARD WAS LINKED TO PERFORMANCE THIS YEARThe components of remuneration that are linked to performance are the STI and LTI plans. Set performance indicators determine 80% of the STI award, while 20% is assessed on the leadership of each Executive.
Commercially sensitive and strategic milestone targets were set for some of our Executives and these were dependent on the segment of our business they have responsibility for.
The following table shows the specific key performance indicators for the Managing Director/CEO and Chief Financial Officer/Deputy CEO over the last five years:
Financial results2016
$m2015
$m2014
$m2013
$m2012
$m
Growth
Group premium revenue 1,818.7 1,634.9 1,491.6 1,290.4 1,123.8
Profitability
nib Group underlying operating profit 132.0 85.2 77.3 75.5 70.0
WNG underlying operating profit 9.7 – – – –
Underlying EPS cps 22.9 18.3 16.8 16.3 15.0
Cost Control
Group underlying management expense ratio excluding acquisition costs % 6.3 5.9 6.0 5.6 5.9
Results against KPIs (excluding leadership component) are detailed in the table below.
KPI Result
Growth
Group premium revenue Group premium revenue up 11% to $1.8 billion, with 100% of maximum STI awarded for this target.
Profitability
nib Group underlying operating profit Group underlying operating profit up 49.9% to $132.0 million, with 100% of maximum STI awarded for this target.
WNG underlying operating profit WNG underlying operating profit was $9.7 million (11 month result), with approximately 70% of maximum STI awarded for this target.
Underlying EPS Underlying EPS of 22.9cps up 25.1%, with 100% of maximum STI awarded for this target.
Cost control
nib Group underlying management expense ratio excluding acquisition costs
Approximately 65% of maximum STI awarded for this target.
Customer satisfaction
arhi customer satisfaction A range of metrics are used to measure customer satisfaction, including lapse and NPS which resulted in approximately 50% of maximum STI awarded for this target.
The graph over illustrates the relationship between the amount (as a percentage) of total STI awarded and operating profit result. Executives received a lower STI (as a percentage) as operating profit has slowed from FY12. In recognition of the role and contribution of our Executives in establishing and integrating our new business segments (including nib New Zealand, International (Inbound) Health Insurance and World Nomads Group) the STI percentage awarded has improved in recent years.

a n n u a l r e p o r t 2 0 1 6 33
STI % awarded in respect of financial year
Operating profit($m)
Operating Pro�tSTI % awarded
0.0%
20.0%
40.0%
60.0%
80.0%
100.0%
FY16FY15FY14FY13FY12FY11
20.0
40.0
60.0
80.0
100.0
120.0
140.0
TERMS OF EXECUTIVE CONTRACTSExecutive contracts summarise employment terms and conditions, including remuneration arrangements and compensation.
A significant portion of the Managing Director/Chief Executive Officer’s and Chief Financial Officer/Deputy Chief Executive Officer’s remuneration is performance based through STI and LTI arrangements. Claw-back arrangements are in place for the portion of STI deferred and LTI.
The table below provides a summary of the agreements.
Service agreement effective Term of agreement Termination provision
Mark Fitzgibbon (MD/CEO) 1 July 2010 Open contract with notice periodThe agreement may be terminated early by nib health funds limited giving notice with immediate effect or by the relevant executive giving three months notice.
Michelle McPherson (CFO/DECO) 1 July 2010 Open contract with notice period
Rhod McKensey (GEARHI) 1 July 2014 Open contract with notice period
Rob Hennin (CEO NZ) 6 May 2013 Open contract with notice period
Brendan Mills (CIO) 1 June 2012 Open contract with notice period
Justin Vaughan (GEBPR) 1 August 2013 Open contract with notice period
David Kan (GEINB) 19 December 2014 Open contract with notice period
Termination paymentsFor our Australian Executives with open contracts effective pre August 2014, the Group may terminate the Executive’s contract with 12 months written notice and may make a payment in lieu of all or part of the notice period. For our Australian Executives with open contracts effective post August 2014, the Group may terminate the Executive’s contract with six months written notice and may make a payment in lieu of all or part of the notice period. In the case of a New Zealand Executive, the Group may terminate the Executive’s contract with nine months written notice and may make a payment in lieu of all or part of the notice period.
The Executive may also receive the following benefits upon termination:
• a pro-rata STI payment based on the period of the financial year during which the Executive was employed and the Board’s assessment of the Executive’s performance against the key performance indicators as at the date of termination; and/or
• the Board has discretion to determine that all or a portion of unvested performance rights of a participant of the LTIP are to be vested upon termination.
At the 2011 Annual General Meeting nib received shareholder approval for the payment of termination benefits which may exceed the 12 month salary limit on termination benefits under the Corporations Act 2001. In response to shareholder feedback, the Board has since determined that this approval will only be undertaken for Executives who held this position at the date of shareholder approval. The only current Executives this approval would be applicable to are Mark Fitzgibbon (MD/CEO), Michelle McPherson (Deputy CEO/CFO) and Rhod McKensey (Group Executive Australian Residents Health Insurance).

n i b h o l d i n g s l i m i t e d34
REMUNERATION REPORTCONTINUEDFor the year ended 30 June 2016
NON-EXECUTIVE DIRECTOR REMUNERATIONFees and payments to Non-Executive Directors reflect the Board role, market fee levels, and the objective of the Group to attract highly skilled and experienced Non-Executive Directors.
nib requires all Non-Executive Directors to hold a minimum of 50% of their first year’s total annual base Director’s fee in shares, which is to be accumulated within three years of appointment (based on the share price at the date of joining the Board). All current Non-Executive Directors comply with this requirement as at 30 June 2016.
Non-Executive Director feesOur Non-Executive Directors (NEDs) are paid a base fee, plus they also receive an additional fee for being members of other nib Board Committees. NED fees are reviewed annually by the Committee and approved by the Board. In 2014, nib engaged the services of Guerdon Associates to conduct a benchmarking and market remuneration analysis, which together with supplementary data was utilised this year.
NED fees are determined within the $1.5 million aggregate nib Directors fee pool limit, which was approved by shareholders at the 2013 Annual General Meeting. Directors’ fees and superannuation are paid out of this pool. Travel allowances, non-monetary benefits and retirement benefits are not included in this pool.
The following table shows the fees (inclusive of superannuation) for nib’s Australian boards and committees:
2016$
2015$
Base fees
Chairman 242,000 234,400
Other Non-Executive Directors 105,000 102,000
Additional fees*
Audit committee
Chairman 31,000 30,000
Member 12,500 12,000
Investment committee
Chairman 17,000 16,700
Member 10,000 9,900
Risk and Reputation committee
Chairman 25,000 24,100
Member 12,500 12,000
People and Remuneration committee
Chairman 25,000 24,100
Member 12,500 12,000
Nomination committee
Chairman – –
Member – –
* The Chairman of the Board does not receive additional fees for involvement in committees.
The following fees (inclusive of superannuation) for the New Zealand boards and committees have applied:
2016$
2015$
NZ Base fees
Chairman* 72,000 69,836
Member 37,000 35,600
NZ Board, Audit, Risk and Compliance committee
Chairman 9,000 8,900
Member – –
* The Chairman of the NZ Board is not a member of the nib holdings Board.

a n n u a l r e p o r t 2 0 1 6 35
Principle 2 of nib’s Corporate Governance Statement (which is available at www.nib.com.au/shareholders/company-profile/corporate-governance) includes the committee membership of each of nib’s NEDs.
Share ownership by Non-Executive Directorsnib’s NEDs are required to hold a minimum of 50% of their first year’s total annual base Director’s fee in shares, which is to be accumulated within three years of appointment (based on the share price at the date of joining the Board). All current Non-Executive Directors comply with this requirement as at 30 June 2016.
Retirement allowances for DirectorsThere are no retirement allowances for Non-Executive Directors other than for Directors appointed by nib health funds limited before 24 November 2005.
Annette Carruthers is the only current Non-Executive Director that is eligible for a retirement allowance.
Annette Carruthers is entitled to a lump sum retirement payment. The benefit is calculated based on 80% of the average Director’s fee (paid from any company in the Group) for the last three years multiplied by a factor based on years of service. The factor based on years of service was frozen at 24 November 2005. The factor for Annette Carruthers is 0.71.
At 30 June 2016, the following retirement benefits are provided for:
Annette Carruthers $90,958

n i b h o l d i n g s l i m i t e d36
REMUNERATION REPORTCONTINUEDFor the year ended 30 June 2016
DET
AILE
D D
ISCL
OSUR
E OF
EXE
CUTI
VE R
EMUN
ERAT
ION
Det
ails
of t
he re
mun
erat
ion
of th
e E
xecu
tives
of t
he n
ib h
oldi
ngs
grou
p ar
e se
t out
in th
e fo
llow
ing
tabl
es.
Shor
t-te
rm e
mpl
oyee
ben
efits
Post
-em
ploy
men
t ben
efits
Long
-ter
mbe
nefit
sTe
rmin
atio
nbe
nefit
sSh
are-
base
d pa
ymen
ts
Exec
utiv
es
Cash
sal
ary
and
fees
1 $Ca
sh b
onus $
Non-
mon
etar
y be
nefit
s3 $Su
pera
nnua
tion $
Retir
emen
t be
nefit
s $
Long
serv
ice
leav
e $
Term
inat
ion
bene
fits $
Bonu
s4 $
Perf
orm
ance
rig
hts $
Tota
l $
2016
Mar
k Fi
tzgi
bbon
828,
128
384,
560
10,9
9935
,000
–14
,699
–38
4,56
066
0,70
62,
318,
652
Mic
helle
McP
hers
on52
4,77
414
3,17
03,
871
24,8
47–
9,28
7–
143,
170
263,
960
1,11
3,07
9
Rho
d M
cKen
sey
516,
450
141,
210
3,75
925
,631
–9,
015
–14
1,21
017
9,47
21,
016,
747
Rob
Hen
nin
372,
636
110,
275
8,41
227
,370
––
–11
7,09
862
,067
697,
858
Bre
ndan
Mills
302,
839
67,7
432,
230
19,3
08–
5,35
0–
67,7
4352
,420
517,
633
Just
in V
augh
an27
3,01
869
,888
2,02
719
,308
––
–69
,888
43,5
7947
7,70
8
Dav
id K
an44
2,56
189
,544
3,09
819
,308
––
–89
,544
45,8
8568
9,94
0
3,26
0,40
61,
006,
390
34,3
9617
0,77
2–
38,3
51–
1,01
3,21
31,
308,
089
6,83
1,61
7
2015
Mar
k Fi
tzgi
bbon
752,
692
272,
495
11,3
5235
,000
–13
,326
–26
9,01
267
8,27
92,
032,
156
Mic
helle
McP
hers
on47
4,81
812
6,71
73,
673
24,3
22–
8,41
2–
125,
585
294,
442
1,05
7,96
9
Rho
d M
cKen
sey
439,
516
128,
488
3,45
530
,000
–7,
912
–12
8,48
816
8,43
790
6,29
6
Rob
Hen
nin
349,
186
85,6
617,
866
26,7
00–
––
82,0
7837
,865
589,
356
Bre
ndan
Mills
292,
770
61,1
382,
240
18,7
83–
5,13
1–
61,1
3834
,847
476,
047
Just
in V
augh
an27
9,59
855
,003
2,18
618
,783
––
–55
,413
24,3
1943
5,30
2
Dav
id K
an
(from
12/
1/20
15)2
181,
676
36,5
811,
385
9,01
2–
––
36,5
812,
167
267,
402
2,77
0,25
676
6,08
332
,157
162,
600
–34
,781
–75
8,29
51,
240,
356
5,76
4,52
8
1. I
nclu
des
cash
sal
ary
and
fees
and
sho
rt-t
erm
com
pens
ated
abs
ence
s, s
uch
as a
nnua
l lea
ve e
ntitl
emen
ts a
ccru
ed b
ut n
ot ta
ken
durin
g th
e ye
ar.
2. D
avid
Kan
was
app
oint
ed G
roup
Exe
cutiv
e In
tern
atio
nal a
nd N
ew B
usin
ess
on 1
2 Ja
nuar
y 20
15.
3. N
on-m
onet
ary
bene
fits
incl
udes
insu
ranc
e co
ver a
nd c
ost o
f ben
efits
and
ass
ocia
ted
Frin
ge B
enefi
ts T
ax.
4. I
nclu
des
bonu
s sh
are
right
s. R
efer
to S
hare
-bas
ed p
aym
ents
.

a n n u a l r e p o r t 2 0 1 6 37
Det
ails
of c
urre
nt L
TI a
lloca
tions
The
deta
ils o
f the
per
form
ance
righ
ts a
ffect
ing
rem
uner
atio
n in
this
repo
rtin
g pe
riod
are
belo
w:
FY12
to F
Y15
LTIP
FY13
to F
Y16
LTIP
FY14
to F
Y17
LTIP
FY15
to F
Y18
LTIP
FY16
to F
Y19
LTIP
Tota
l
Gra
nt d
ate1
21 D
ec 2
011
19 N
ov 2
012
29 N
ov 2
013
22 D
ec 2
014
for
KM
P
excl
udin
g D
avid
Kan
an
d 13
May
201
5 fo
r D
avid
Kan
22 J
an 2
016
Vest
ing
and
exe
rcis
e d
ate
1 S
ep 2
015
(FY
16)
1 S
ep 2
016
(FY
17)
1 S
ep 2
017
(FY
18)
1 S
ep 2
018
(FY
19)
1 S
ep 2
019
(FY
20)
Exp
iry
dat
e1
Sep
201
51
Sep
201
61
Sep
201
71
Sep
201
81
Sep
201
9E
xerc
ise
pri
ceni
lni
lni
lni
lni
l
Valu
e p
er p
erfo
rman
ce r
ight
at
gra
nt d
ate
1.13
131.
5437
1.98
302.
6689
(22
Dec
201
4)
3.22
89 (1
3 M
ay 2
015)
3.02
46P
erfo
rman
ce a
chie
ved
and
% v
este
d50
%Ve
stin
g da
te y
et to
occ
ur a
nd p
erfo
rman
ce n
ot y
et te
sted
% f
orf
eite
d50
%Ve
stin
g da
te y
et to
occ
ur a
nd p
erfo
rman
ce n
ot y
et te
sted
Num
ber
of
per
form
ance
rig
hts
yet
to v
est
at t
he
end
of
the
fina
ncia
l yea
r0
553,
236
559,
057
496,
883
628,
895
2,23
8,07
1
Vest
ing
hur
dle
(ref
er ta
ble
on p
ages
30-
31)
50%
4yr
EP
S /
50%
4yr
TS
R
50%
4yr
EP
S /
50%
4yr
TS
R
50%
4yr
EP
S /
50%
4yr
TS
R
50%
4yr
EP
S /
50%
4yr
TS
R
50%
4yr
EP
S /
50%
4yr
TS
R
Num
ber
$Nu
mbe
r$
Num
ber
$Nu
mbe
r$
Num
ber
$Nu
mbe
r$
Mar
k Fi
tzg
ibb
on
Num
ber
of p
erfo
rman
ce r
ight
s ye
t to
vest
at 1
Jul
y 20
1521
7,54
633
1,76
527
3,78
623
4,71
4–
1,05
7,81
1N
umbe
r an
d va
lue
at g
rant
dat
e of
per
form
ance
rig
hts
gran
ted
durin
g th
e ye
ar2
––
––
284,
320
859
,954
28
4,32
0N
umbe
r of
per
form
ance
rig
hts
vest
ed d
urin
g th
e ye
ar3
(108
,773
)–
––
–(1
08,7
73)
Num
ber
of p
erfo
rman
ce r
ight
s fo
rfeite
d du
ring
the
year
(108
,773
)–
––
–(1
08,7
73)
Num
ber
of p
erfo
rman
ce r
ight
s an
d m
axim
um to
tal v
alue
ye
t to
vest
at 3
0 Ju
ne 2
016
––
331,
765
1,40
0,04
827
3,78
61,
155,
377
234,
714
990,
493
284,
320
1,19
9,83
01,
124,
585
4,74
5,74
9D
ate
of e
xerc
ise
of p
erfo
rman
ce r
ight
s2
Sep
201
5n/
an/
an/
an/
aN
umbe
r of s
hare
s is
sued
and
val
ue o
n ex
erci
se o
f pe
rform
ance
righ
ts d
urin
g th
e ye
ar3
108
,773
33
3,62
9 n
/a
n/a
n/a
n/
a n
/a
n/a
n/a
n/
a 1
08,7
73
333,
629
Mic
helle
McP
hers
on
Num
ber
of p
erfo
rman
ce r
ight
s ye
t to
vest
at 1
Jul
y 20
1510
9,76
610
7,87
189
,060
74,0
81–
380,
778
Num
ber
and
valu
e at
gra
nt d
ate
of p
erfo
rman
ce r
ight
s gr
ante
d du
ring
the
year
2-
––
–89
,819
271
,667
89
,819
Num
ber
of p
erfo
rman
ce r
ight
s ve
sted
dur
ing
the
year
3(5
4,88
3)–
––
–(5
4,88
3)N
umbe
r of
per
form
ance
rig
hts
forfe
ited
durin
g th
e ye
ar(5
4,88
3)–
––
–(5
4,88
3)N
umbe
r of
per
form
ance
rig
hts
and
max
imum
tota
l val
ue
yet t
o ve
st a
t 30
June
201
6–
–10
7,87
145
5,21
689
,060
375,
833
74,0
8131
2,62
289
,819
379,
036
360,
831
1,52
2,70
7D
ate
of e
xerc
ise
of p
erfo
rman
ce r
ight
s2
Sep
201
5n/
an/
an/
an/
aN
umbe
r of
sha
res
issu
ed a
nd v
alue
on
exer
cise
of
perfo
rman
ce r
ight
s du
ring
the
year
3 5
4,88
3 16
8,33
7 n
/a
n/a
n/a
n/
a n
/a
n/a
n/a
n/
a 5
4,88
3 16
8,33
7

n i b h o l d i n g s l i m i t e d38
REMUNERATION REPORTCONTINUEDFor the year ended 30 June 2016
FY12
to F
Y15
LTIP
FY13
to F
Y16
LTIP
FY14
to F
Y17
LTIP
FY15
to F
Y18
LTIP
FY16
to F
Y19
LTIP
Tota
l
Num
ber
$Nu
mbe
r$
Num
ber
$Nu
mbe
r$
Num
ber
$Nu
mbe
r$
Rho
d M
cKen
sey
Num
ber
of p
erfo
rman
ce r
ight
s ye
t to
vest
at 1
Jul
y 20
1564
,995
75,0
1379
,437
55,7
44–
275,
189
Num
ber
and
valu
e at
gra
nt d
ate
of p
erfo
rman
ce r
ight
s gr
ante
d du
ring
the
year
2–
––
–69
,787
211
,078
69
,787
Num
ber
of p
erfo
rman
ce r
ight
s ve
sted
dur
ing
the
year
3(3
2,49
8)–
––
–(3
2,49
8)N
umbe
r of
per
form
ance
rig
hts
forfe
ited
durin
g th
e ye
ar(3
2,49
7)–
––
–(3
2,49
7)N
umbe
r of
per
form
ance
rig
hts
and
max
imum
tota
l val
ue
yet t
o ve
st a
t 30
June
201
6–
–75
,013
316,
555
79,4
3733
5,22
455
,744
235,
240
69,7
8729
4,50
127
9,98
11,
181,
520
Dat
e of
exe
rcis
e of
per
form
ance
rig
hts
2 S
ep 2
015
n/a
n/a
n/a
n/a
Num
ber
of s
hare
s is
sued
and
val
ue o
n ex
erci
se o
f pe
rform
ance
rig
hts
durin
g th
e ye
ar3
32,
498
99,6
78 n
/a
n/a
n/a
n/
a n
/a
n/a
n/a
n/
a 3
2,49
8 99
,678
Bre
ndan
Mill
s (c
omm
ence
d 1
June
201
2)N
umbe
r of
per
form
ance
rig
hts
yet t
o ve
st a
t 1 J
uly
2015
–38
,587
33,0
2036
,145
–10
7,75
2N
umbe
r an
d va
lue
at g
rant
dat
e of
per
form
ance
rig
hts
gran
ted
durin
g th
e ye
ar2
––
––
41,3
94 1
25,2
00
41,3
94N
umbe
r of
per
form
ance
rig
hts
vest
ed d
urin
g th
e ye
ar3
––
––
––
Num
ber
of p
erfo
rman
ce r
ight
s fo
rfeite
d du
ring
the
year
––
––
––
Num
ber
of p
erfo
rman
ce r
ight
s an
d m
axim
um to
tal v
alue
ye
t to
vest
at 3
0 Ju
ne 2
016
––
38,5
8716
2,83
733
,020
139,
344
36,1
4515
2,53
241
,394
174,
683
149,
146
629,
396
Dat
e of
exe
rcis
e of
per
form
ance
rig
hts
n/a
n/a
n/a
n/a
n/a
Num
ber
of s
hare
s is
sued
and
val
ue o
n ex
erci
se o
f pe
rform
ance
rig
hts
durin
g th
e ye
ar3
n/a
n/
a n
/a
n/a
n/a
n/
a n
/a
n/a
n/a
n/
a n
/a
n/a
Ro
b H
enni
n (c
omm
ence
d 6
May
201
3)N
umbe
r of
per
form
ance
rig
hts
yet t
o ve
st a
t 1 J
uly
2015
–57
,316
40,3
84–
97,7
00N
umbe
r an
d va
lue
at g
rant
dat
e of
per
form
ance
rig
hts
gran
ted
durin
g th
e ye
ar2
––
––
–
49,4
92 1
49,6
94
49,4
92N
umbe
r of
per
form
ance
rig
hts
vest
ed d
urin
g th
e ye
ar3
––
––
––
Num
ber
of p
erfo
rman
ce r
ight
s fo
rfeite
d du
ring
the
year
––
––
––
Num
ber
of p
erfo
rman
ce r
ight
s an
d m
axim
um to
tal v
alue
ye
t to
vest
at 3
0 Ju
ne 2
016
––
––
57,3
1624
1,87
440
,384
170,
420
49,4
9220
8,85
614
7,19
262
1,15
0D
ate
of e
xerc
ise
of p
erfo
rman
ce r
ight
sn/
an/
an/
an/
an/
aN
umbe
r of
sha
res
issu
ed a
nd v
alue
on
exer
cise
of
perfo
rman
ce r
ight
s du
ring
the
year
3 n
/a
n/a
n/a
n/
a n
/a
n/a
n/a
n/
a n
/a
n/a
n/a
n/
a
DET
AILE
D D
ISCL
OSUR
E OF
EXE
CUTI
VE R
EMUN
ERAT
ION
con
tinue
d
Det
ails
of c
urre
nt L
TI a
lloca
tions
continued

a n n u a l r e p o r t 2 0 1 6 39
FY12
to F
Y15
LTIP
FY13
to F
Y16
LTIP
FY14
to F
Y17
LTIP
FY15
to F
Y18
LTIP
FY16
to F
Y19
LTIP
Tota
l
Num
ber
$Nu
mbe
r$
Num
ber
$Nu
mbe
r$
Num
ber
$Nu
mbe
r$
Just
in V
aug
han
(com
men
ced
1 A
ugus
t 201
3)N
umbe
r of
per
form
ance
rig
hts
yet t
o ve
st a
t 1 J
uly
2015
––
26,4
3832
,859
–59
,297
Num
ber
and
valu
e at
gra
nt d
ate
of p
erfo
rman
ce r
ight
s gr
ante
d du
ring
the
year
2–
––
–37
,633
113
,825
37
,633
Num
ber
of p
erfo
rman
ce r
ight
s ve
sted
dur
ing
the
year
3–
––
––
–N
umbe
r of
per
form
ance
rig
hts
forfe
ited
durin
g th
e ye
ar–
––
––
–N
umbe
r of
per
form
ance
rig
hts
and
max
imum
tota
l val
ue
yet t
o ve
st a
t 30
June
201
6–
––
–26
,438
111,
568
32,8
5913
8,66
537
,633
158,
811
96,9
3040
9,04
5D
ate
of e
xerc
ise
of p
erfo
rman
ce r
ight
sn/
an/
an/
an/
an/
aN
umbe
r of
sha
res
issu
ed a
nd v
alue
on
exer
cise
of
perfo
rman
ce r
ight
s du
ring
the
year
3 n
/a
n/a
n/a
n/
a n
/a
n/a
n/a
n/
a n
/a
n/a
n/a
n/
aD
avid
Kan
(com
men
ced
12 J
anua
ry 2
016)
Num
ber
of p
erfo
rman
ce r
ight
s ye
t to
vest
at 1
Jul
y 20
15–
––
22,9
56–
22,9
56N
umbe
r an
d va
lue
at g
rant
dat
e of
per
form
ance
rig
hts
gran
ted
durin
g th
e ye
ar2
––
––
56,4
50 1
70,7
39
56,4
50N
umbe
r of
per
form
ance
rig
hts
vest
ed d
urin
g th
e ye
ar3
––
––
––
Num
ber
of p
erfo
rman
ce r
ight
s fo
rfeite
d du
ring
the
year
––
––
––
Num
ber
of p
erfo
rman
ce r
ight
s an
d m
axim
um to
tal v
alue
ye
t to
vest
at 3
0 Ju
ne 2
016
––
––
––
22,9
5696
,874
56,4
5023
8,21
979
,406
335,
093
Dat
e of
exe
rcis
e of
per
form
ance
rig
hts
n/a
n/a
n/a
n/a
n/a
Num
ber
of s
hare
s is
sued
and
val
ue o
n ex
erci
se o
f pe
rform
ance
rig
hts
durin
g th
e ye
ar3
n/a
n/
a n
/a
n/a
n/a
n/
a n
/a
n/a
n/a
n/
a n
/a
n/a
1. P
erfo
rman
ce ri
ghts
gra
nted
und
er th
e pl
an c
arry
no
divi
dend
or v
otin
g rig
hts.
2. T
he v
alue
at g
rant
dat
e ca
lcul
ated
in a
ccor
danc
e w
ith A
AS
B 2
Sha
re-b
ased
pay
men
t of p
erfo
rman
ce ri
ghts
gra
nted
dur
ing
the
year
as
part
of r
emun
erat
ion.
3.
Sha
res
will
be is
sued
or t
rans
ferr
ed o
n ex
erci
se o
f per
form
ance
righ
ts w
ithin
15
busi
ness
day
s af
ter t
he e
xerc
ise
date
. Sha
res
may
be
issu
ed o
r acq
uire
d on
-mar
ket a
t the
ele
ctio
n of
the
com
pany
.

n i b h o l d i n g s l i m i t e d40
REMUNERATION REPORTCONTINUEDFor the year ended 30 June 2016
DET
AILE
D D
ISCL
OSUR
E OF
NON
-EXE
CUTI
VE R
EMUN
ERAT
ION
Det
ails
of t
he re
mun
erat
ion
of th
e D
irect
ors
of th
e ni
b ho
ldin
gs g
roup
are
set
out
in th
e fo
llow
ing
tabl
es.
Shor
t-te
rm e
mpl
oyee
ben
efits
Post
-em
ploy
men
t ben
efits
Long
-ter
m b
enefi
tsTe
rmin
atio
n be
nefit
sSh
are-
base
d pa
ymen
ts
Non-
Exec
utiv
e Di
rect
ors
Cash
sal
ary
and
fees $
Cash
bon
us $
Non-
mon
etar
y be
nefit
s $Su
pera
nnua
tion $
Retir
emen
t be
nefit
s $Lo
ng s
ervi
ce le
ave $
Term
inat
ion
bene
fits $
Bon
us $Pe
rfor
man
ce ri
ghts $
Tota
l $
2016
Ste
ve C
rane
222,
692
––
19,3
08–
––
––
242,
000
Lee
Aus
burn
122,
527
––
11,6
40–
––
––
134,
167
Har
old
Ben
tley
169,
500
––
35,0
00–
––
––
204,
500
Ann
ette
Car
ruth
ers
163,
927
––
15,5
735,
390
––
––
184,
890
Phi
lip G
ardn
er13
4,24
7–
–12
,753
––
––
–14
7,00
0
Chr
istin
e M
cLou
ghlin
126,
332
––
12,0
02–
––
––
138,
334
Don
al O
’Dyw
er
(from
22/
3/20
16)
33,1
22–
–3,
147
––
––
–36
,269
972,
347
––
109,
423
5,39
0–
––
–1,
087,
160
2015
Ste
ve C
rane
215,
617
––
18,7
83–
––
––
234,
400
Lee
Aus
burn
111
7,80
8–
–11
,192
––
––
–12
9,00
0
Har
old
Ben
tley
163,
400
––
35,0
00–
––
––
198,
400
Ann
ette
Car
ruth
ers1
162,
283
––
15,4
177,
256
––
––
184,
956
Phi
lip G
ardn
er13
0,32
0–
–12
,380
––
––
–14
2,70
0
Chr
istin
e M
cLou
ghlin
126,
119
––
11,9
81–
––
––
138,
100
915,
547
––
104,
753
7,25
6–
––
–1,
027,
556
1. C
ash
sala
ries
and
fees
and
sup
eran
nuat
ion
in 2
015
for L
ee A
usbu
rn a
nd A
nnet
te C
arru
ther
s in
clud
e fe
es fo
r nib
Opt
ions
Med
ical
Adv
isor
y C
omm
ittee
mee
tings
of $
3,00
0 an
d $4
,000
resp
ectiv
ely.

a n n u a l r e p o r t 2 0 1 6 41
EQUITY INSTRUMENTS HELD BY KEY MANAGEMENT PERSONNEL
Performance rights holdingsThe numbers of performance rights over ordinary shares in the Company held during the financial year by each Executive of nib holdings limited are set out below.
2016Balance at start
of the yearGranted as
compensation Exercised Other forfeituresBalance at the
end of the yearVested and exercisable Unvested
Mark Fitzgibbon 1,057,811 284,320 (108,773) (108,773) 1,124,585 – 1,124,585
Michelle McPherson 380,778 89,819 (54,883) (54,883) 360,831 – 360,831
Rhod McKensey 275,189 69,787 (32,498) (32,497) 279,981 – 279,981
Rob Hennin 97,700 49,492 – – 147,192 – 147,192
Brendan Mills 107,752 41,394 – – 149,146 – 149,146
Justin Vaughan 59,297 37,633 – – 96,930 – 96,930
David Kan 22,956 56,450 – – 79,406 – 79,406
Total 2,001,483 628,895 (196,154) (196,153) 2,238,071 – 2,238,071
2015Balance at start
of the yearGranted as
compensation Exercised Other forfeituresBalance at the
end of the yearVested and exercisable Unvested
Mark Fitzgibbon 1,059,049 234,714 (117,976) (117,976) 1,057,811 – 1,057,811
Michelle McPherson 425,750 74,081 (59,527) (59,526) 380,778 – 380,778
Rhod McKensey 276,974 55,744 (28,765) (28,764) 275,189 – 275,189
Rob Hennin 57,316 40,384 – – 97,700 – 97,700
Brendan Mills 71,607 36,145 – – 107,752 – 107,752
Justin Vaughan 26,438 32,859 – – 59,297 – 59,297
David Kan – 22,956 – – 22,956 – 22,956
Total 1,917,134 496,883 (206,268) (206,266) 2,001,483 – 2,001,483
To date nib’s practice has been to source equity for remuneration awards from shares purchased on market. Accordingly, there was no dilution from Executive new issue equity awards in 2016.
Share holdingsThe number of shares in the Company held during the financial year by each Director of nib holdings limited and other Key Management Personnel of the Group, including their personally related parties, are set out below.
2016Balance at the
start of the year
Granted during the year as
compensationOther changes
during the yearBalance at the
end of the year
Ordinary shares
Directors of nib group
Steve Crane 200,000 – 50,000 250,000
Lee Ausburn 20,000 – 30,000 50,000
Harold Bentley 100,000 – – 100,000
Annette Carruthers 72,500 – – 72,500
Philip Gardner 125,000 – 25,000 150,000
Christine McLoughlin 97,500 – 12,500 110,000
Donal O’Dwyer – – 25,600 25,600
Other key management personnel of the Group
Mark Fitzgibbon 1,594,650 195,627 (7,000) 1,783,277
Michelle McPherson 512,498 95,550 – 608,048
Rhod McKensey 245,820 74,389 – 320,209
Rob Hennin 11,653 26,736 274 38,663
Brendan Mills 38,894 19,933 – 58,827
Justin Vaughan 5,890 18,166 – 24,056
David Kan – 11,926 – 11,926
n i b h o l d i n g s l i m i t e d42
REMUNERATION REPORTCONTINUEDFor the year ended 30 June 2016
EQUITY INSTRUMENTS HELD BY KEY MANAGEMENT PERSONNEL continued
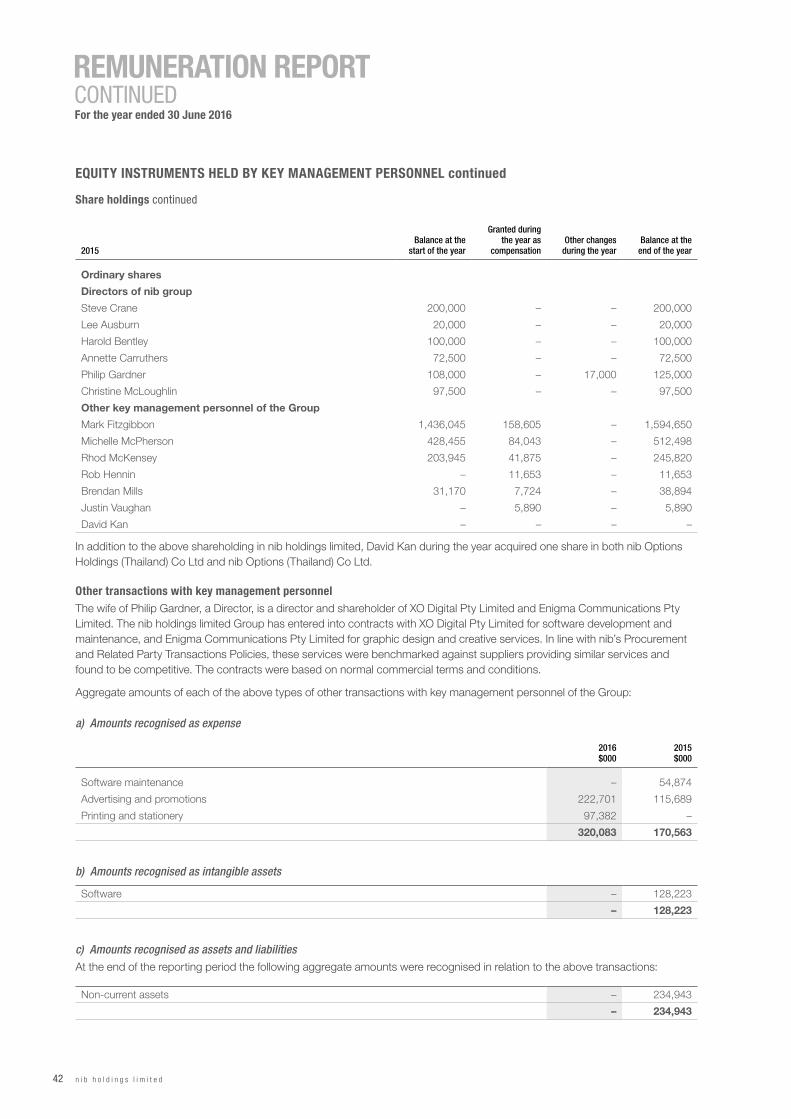
Share holdings continued
2015Balance at the
start of the year
Granted during the year as
compensationOther changes
during the yearBalance at the
end of the year
Ordinary shares
Directors of nib group
Steve Crane 200,000 – – 200,000
Lee Ausburn 20,000 – – 20,000
Harold Bentley 100,000 – – 100,000
Annette Carruthers 72,500 – – 72,500
Philip Gardner 108,000 – 17,000 125,000
Christine McLoughlin 97,500 – – 97,500
Other key management personnel of the Group
Mark Fitzgibbon 1,436,045 158,605 – 1,594,650
Michelle McPherson 428,455 84,043 – 512,498
Rhod McKensey 203,945 41,875 – 245,820
Rob Hennin – 11,653 – 11,653
Brendan Mills 31,170 7,724 – 38,894
Justin Vaughan – 5,890 – 5,890
David Kan – – – –
In addition to the above shareholding in nib holdings limited, David Kan during the year acquired one share in both nib Options Holdings (Thailand) Co Ltd and nib Options (Thailand) Co Ltd.
Other transactions with key management personnelThe wife of Philip Gardner, a Director, is a director and shareholder of XO Digital Pty Limited and Enigma Communications Pty Limited. The nib holdings limited Group has entered into contracts with XO Digital Pty Limited for software development and maintenance, and Enigma Communications Pty Limited for graphic design and creative services. In line with nib’s Procurement and Related Party Transactions Policies, these services were benchmarked against suppliers providing similar services and found to be competitive. The contracts were based on normal commercial terms and conditions.
Aggregate amounts of each of the above types of other transactions with key management personnel of the Group:
a) Amounts recognised as expense
2016$000
2015$000
Software maintenance – 54,874
Advertising and promotions 222,701 115,689
Printing and stationery 97,382 –
320,083 170,563
b) Amounts recognised as intangible assets
Software – 128,223
– 128,223
c) Amounts recognised as assets and liabilitiesAt the end of the reporting period the following aggregate amounts were recognised in relation to the above transactions:
Non-current assets – 234,943
– 234,943