removal of the natural organic matter in the different stages of the
TRANSCRIPT

���������������� ����������
������������
��������������� ���������������������������������������������������������������������
��� ������

Tampereen teknillinen yliopisto. Julkaisu 651 Tampere University of Technology. Publication 651 Anu Matilainen Removal of the Natural Organic Matter in the Different Stages of the Drinking Water Treatment Process Thesis for the degree of Doctor of Philosophy to be presented with due permission for public examination and criticism in Festia Building, Auditorium Pieni Sali 1, at Tampere University of Technology, on the 14th of February 2007, at 12 noon. Tampereen teknillinen yliopisto - Tampere University of Technology Tampere 2007

ISBN 978-952-15-1715-0 (printed) ISBN 978-952-15-1735-8 (PDF) ISSN 1459-2045

i
ABSTRACT
Surface waters in Finland contain usually a high amount of natural organic matter (NOM).Incomplete removal of NOM in the drinking water treatment has an adverse effect on thewater quality. Hence, it is desirable to reduce the concentration of the NOM from the drinkingwater. The quantification and characterization of the NOM in the different stages of thepurification process is important in order to improve and optimise various drinking watertreatment processes. In this study, the high-performance size-exclusion chromatography(HPSEC) fractionation with UV254 detection, and a number of conventional water qualityanalyses were used to measure the organic matter content and characteristics in water, andthe transformation of the organic matter during the purification process.
In this study, the removal of the NOM was monitored in three full-scale water treatmentprocesses. Besides the conventional unit operations (coagulation/flotation/sedimentation), theenhancement of NOM removal by activated carbon (AC) filtration and ozonation, followedby AC filtration, were evaluated. Moreover, two pilot-scale studies for the enhanced NOMremoval were conducted; nanofiltration (NF) as a refining phase after conventional treatment,as well as ozonation followed by AC filtration.
The conventional treatment processes (coagulation/flotation/sedimentation) removed the highmolar mass (HMM) organic matter almost completely (over 94%). The intermediate molarmass (IMM) matter was more difficult to be removed; 12-55% removal was obtained. Still,the hardest fraction to be removed was the low molar mass (LMM) organic matter, whichwere removed only by 3-14% from chemically coagulated water. The optimisation of thecoagulation/flotation process by selection of the proper coagulant improved the NOMremoval. The process modification by replacing the aluminium sulphate with ferric sulphateenhanced the NOM removal 10%. The greatest difference between the two coagulantsoccurred in the removal of the NOM that has molar mass of 1000-4000 g/mol (IMM). TheseIMM compounds were removed 25% more effectively with iron-based than with aluminium-based coagulant.
The AC filtration enhanced the removal of NOM. The HMM substances were not removedany further on the AC filtration, but 30% more of IMM matter was removed. The LMMmatter was also reduced slightly. However, occasionally the smallest fractions of NOM evenincreased in the AC filtration. Regeneration of the AC filters had a significant effect on NOMremoval. Immediately after regeneration the efficiency of the filter increased about 50%.However, the NOM removal efficiency was reverted to the approximate same level as beforeregeneration, after few months of operation.
The ozonation on the full-scale process removed primarily the smaller molar mass fractions ofNOM. Removal rates of 23% and 32% were observed, regarding IMM and LMM matter,respectively. Thus, it was concluded that the NOM was degraded to the really LMMcompounds, with little or non UV-absorption capacity, thus not showing in HPSEC-UV254
measurement. According to the pilot-scale ozonation study, the amount of assimilable organiccarbon, AOC, increased with increasing ozone dose, hence implicating that NOM wasdegraded. Nevertheless, the AC filtration after ozonation was effective in the removal ofproduced AOC.
The nanofiltration (NF), as a refining phase after conventional treatment, removed the HMMmatter completely and the reduction of the IMM matter was 52-100%, depending on the type

ii
of the membrane studied. The enhancement of the reduction of the LMM matter rangedbetween 43-79%. The NF membranes studied removed generally over 60% of the remainingorganic matter, measured as DOC and sum of peak heights in HPSEC, from the water afterconventional treatment process. From the organic matter removal processes studied the waterwith lowest organic matter were obtained by NF.

iii
TIIVISTELMÄ
Suomen pintavesissä esiintyy runsaasti luonnosta peräisin olevia eli eloperäisiä orgaanisiaaineita. Humus muodostaa suurimman osan eloperäisistä orgaanisista aineista. Humusaiheuttaa monia laatuongelmia juomaveteen, ja vaikeuttaa vedenpuhdistusprosessejavesilaitoksilla. Se aiheuttaa veteen mm. makua, hajua ja ruskeaa väriä sekä reagoidesinfioinnissa käytettyjen aineiden, lähinnä kloorin, kanssa muodostaen karsinogeenisiasivutuotteita. Näiden ongelmien vuoksi humuksen ja muiden eloperäisten orgaanistenaineiden vähentäminen juomavedestä on eräs tärkeimmistä asioista erityisesti pintavesienpuhdistuksessa. Niiden poistumista voidaan tehostaa puhdistusprosesseja kehittämällä jaoptimoimalla. Tähän kuitenkin tarvitaan lisää tietoa orgaanisten aineiden määrästä ja laadustapuhdistusprosessien eri vaiheissa. Tässä tutkimuksessa orgaanisten aineiden poistumista jarakenteiden muuttumista vedenpuhdistusprosessin eri vaiheissa seurattiinmolekyylikokojakauman muutoksena. Molekyylikokojakauman muutoksia tutkittiinkäyttämällä nestekromatografista määritystä, HPSEC-UV254 (high-performance size-exclusion chromatography, UV254 detektorilla). HPSEC-UV254 tuloksia vertailtiin perinteisestikäytettävillä orgaanisen aineen kokonaispitoisuuksia mittaavilla menetelmillä saatuihintuloksiin.
Tässä tutkimuksessa seurattiin eloperäisten orgaanisten aineiden määrää ja rakennetta kolmentäyden mittakaavan vedenpuhdistusprosessin eri vaiheissa. Perinteisen puhdistuksen elisaostuksen ja selkeytyksen lisäksi tutkittiin otsonoinnin ja aktiivihiilisuodattimien merkitystäorgaanisten aineiden poistamisessa. Lisäksi tutkittiin pienemmässä mittakaavassa, pilot-laitteistoilla, perinteisestä puhdistuksesta jäljelle jäävien orgaanisten aineiden poistontehostamista; otsonointia ja sen jälkeistä aktiivihiilisuodatusta sekä nanosuodatustapintavedenkäsittelyn viimeistelevänä vaiheena.
Perinteinen puhdistusprosessi eli kemiallinen saostus ja sen jälkeinen selkeytys poistitehokkaasti molekyylimassaltaan suuria yhdisteitä (yli 94% poistuu). Molekyylimassaltaankeskisuuret yhdisteet poistuivat kohtalaisesti (12-55%) mutta molekyylimassaltaan pienetyhdisteet eivät juurikaan poistuneet. Kemiallisella esikäsittelyllä saatiin poistettua vain 3-14%pienen molekyylimassan omaavia yhdisteitä. Optimoimalla saostusprosessia voitiinorgaanisten aineiden poistoa kuitenkin tehostaa. Saostuskemikaalin vaihto alumiinisulfaatistarautasulfaattiin lisäsi orgaanisten aineiden poistotehokkuutta 10%. Saostuskemikaalin vaihtovaikutti eniten keskisuurten molekyylien poistoon. Keskisuuret (1000-4000 g/mol) molekyylitpoistuivat 25% tehokkaammin rautasulfaattisaostuksella verrattuna alumiinisulfaattisaostukseen.
Aktiivihiilisuodatus tehosti orgaanisten aineiden poistoa. Se ei parantanut suurikokoistenmolekyylien poistoa, mutta keskisuurten yhdisteiden poistoa se tehosti noin 30%.Molekyylimassaltaan pienten yhdisteiden poisto oli hankalampaa. Itse asiassa kaikkein pieninmolekyylikokofraktio suureni aika ajoin aktiivihiilisuodatuksen yhteydessä. Aktiivihiilienregenerointi tutkimuksen aikana paransi sen tehoa huomattavasti. Välitön tehon paraneminenoli 50%, mutta tehokkuus tasaantui muutaman käyttökuukauden jälkeen lähes ennalleen.
Täyden mittakaavan vedenpuhdistusprosessissa otsonoinnilla saatiin poistettua lähinnämolekyylimassaltaan pienempiä orgaanisia yhdisteitä. Keskisuurten yhdisteiden poistuma oli23% ja pienien 32%. Orgaaninen aines oli todennäköisesti hajonnut hyvin pieniksiyhdisteiksi. Hyvin pienet orgaaniset yhdisteet eivät näy UV254 mittauksessa, jota käytettiinHPSEC menetelmän detektorina. Pilot-mittakaavan kokeissa huomattiin että bakteereille

iv
käyttökelpoinen hiili, AOC (assimilable organic carbon), lisääntyi otsoniannosta lisättäessä.Tämä viittaisi siihen että orgaaninen aines on hajonnut pienemmiksi yhdisteiksi. Vaikka AOClisääntyi voimakkaasti otsonoitaessa, otsonoinnin jälkeinen aktiivihiilisuodatus poistisyntyneen AOC määrän tehokkaasti.
Nanosuodatus pintavedenkäsittelyn viimeistelevänä vaiheena poisti molekyylimassaltaansuuret yhdisteet lähes kokonaan ja keskisuuriakin huomattavasti, 52-100% riippuentutkittavan kalvon laadusta. Pienen molekyylikoon yhdisteiden poistuma vaihteli 43-79%.Yleisesti, kemiallisesti esikäsiteltyyn veteen jääneiden eloperäisten orgaanisten aineidenpoistuma kaikilla tutkimuksessa olleilla nanosuodatuskalvoilla oli keskimäärin yli 60%.Verrattuna muihin vedenpuhdistusprosesseihin, nanosuodatus poisti parhaiten eloperäisetorgaaniset aineet tutkituista vesistä.

v
ACKNOWLEDGEMENTS
The experimental part of the study was carried out at the Institute of EnvironmentalEngineering and Biotechnology, Tampere University of Technology in the years 2000-2005.This study was financially supported by the Finnish graduate school in EnvironmentalScience and Technology (EnSTe) and Kemira Chemicals Ltd.
My sincere thanks are to my supervisor at Tampere University of Technology, ProfessorTuula Tuhkanen, for giving me the opportunity to start doctoral studies and especially, theopportunity to carry on doing them, in spite of circumstancies. Without the encouragementand support from her, I would not be in this situation. I also appreciate the advices fromProfessor Mika Sillanpää.
Special thanks are due to the pre-examiners Professor Egil Gjessing and Professor SimonParsons for reviewing this thesis and for their valuable comments.
I would like to thank the Tampere Waterworks and Oulu Waterworks for the opportunity tostudy their processes. Thanks to the laboratory staff in the Rusko and Hintta Water TreatmentPlants for analysis results and for taking the samples for our investigation over the years.Special thanks go to Mr. Matti Vaahtera and Mrs. Terttu Mäkinen in Rusko and Mrs. AnuVäänänen in Hintta, for their help and information.
I am sincerely grateful to Niina Vieno, for the valuable discussions and help during the study.Most sincere thanks belongs to all the people who worked at the Institute of EnvironmentalEngineering and Biotechnology, for pleasent working atmosphere. Special thanks go to HildaSzabo for all the help. I am grateful to Mikkeli Polytechnic, School of Engineering, for theopportunity to carry on my thesis, and the whole staff in the Environmental laboratory, forproviding a convivial and supportive atmosphere.
Special thanks for pleasent co-operation and for valuable contribution to the co-authors of myarticles, Mrs. Riina Liikanen, Professor Marianne Nyström, Mr. Pekka Iivari, Mr. JarmoSallanko and Mrs. Eeva Heiska.
I would like to dedicate my warmest and sincere thanks to my family: mother, father, Pia andJuha, Seija and Reino, Hanna and Tero, and Jussi, as well as to my friends, for giving mesupport and love during this long and sometimes hard period of life. Especially during thislast half year, finishing work with three little kids would not have been possible withoutpriceless baby-sitting help from my mother-in-law, aunt Liena and Maarit.
Last, but definately not the least, I owe my deepest and dearest gratitude to my husband Harri,for his loving encouregement and understanding during my study and to my loveliestdaughters Elli and Ilona, as well as my little sunshine, son Aatu, for giving me a lot ofhappiness and unconditional love, and also for keeping up my sense of reality.
Mikkeli, January 2007
Anu Matilainen

vi
TABLE OF CONTENTS
1 INTRODUCTION 1
1.1 Background 11.2 Research problem and objective 21.3 Research methods 3
2 THE CHARACTERISTICS OF NATURAL ORGANIC MATTERIN WATER 4
2.1 Natural organic matter 42.2 Structures of humic substances 52.3 Molecular sizes of humic substances 8
3 NOM IN THE WATER PURIFICATION PROCESS 9
3.1 Coagulation 93.2 Sorption on solid surfaces 103.2.1 Activated carbon (AC) filtration 103.2.2 Biologically activated carbon (BAC) filtration 113.2.3 Ion exchange resin filtration 113.3 Disinfection and oxidation 123.3.1 Chlorine-based disinfectants 123.3.2 Ozonation 133.3.3 Advanced oxidation processes (AOPs) 143.4 Membrane filtration 143.5 Summary of different processes for removal of NOM 15
4 DIFFERENT METHODS FOR CHARACTERIZATION OF AQUATICNOM 17
4.1 General parameters 174.2 Biological tests 174.3 Isolation and concentration 174.4 Fractionation of NOM 174.4.1 Resin fractionation 174.4.2 High-performance size-exclusion chromatography (HPSEC) 184.4.3 Ultrafiltration (UF) 204.5 Other analytical methods 21
5 AIMS OF THE STUDY 22
6 MATERIALS AND METHODS 23
6.1 Tampere Waterworks; Rusko Water Treatment Plant 236.1.1 AC filtration in the Rusko Water Treatment Plant 236.2 Oulu Waterworks; Hintta and Kurkelanranta Water Treatment Plants 246.2.1 Ozonation in Hintta and Kurkelanranta Water Treatment Plants 24

vii
6.2.2 AC filtration in Hintta and Kurkelanranta Water Treatment Plants 246.2.3 Pilot-scale ozonation 256.3 Other waterworks 266.3.1 Pilot-scale nanofiltration (NF) 276.4 Analysis 276.4.1 Sampling procedure 276.4.2 Basic water analysis at Rusko Water Treatment Plant 286.4.3 Basic water analysis at Hintta and Kurkelanranta Water Treatment Plants 286.4.4 HPSEC measurements 28
7 RESULTS AND DISCUSSION 30
7.1 Water quality in the Water Treatment Plants 307.1.1 Rusko Water Treatment Plant 307.1.2 Hintta and Kurkelanranta Water Treatment Plants 317.2 NOM removal at different stages in the treatment process based on DOC andother conventional quality parameters; A254 and turbidity 327.3 NOM characterization and removal at different stages in the treatmentprocess based on HPSEC-UV254 measurements 327.3.1 The MSD of NOM in the raw water 327.3.2 The effect of chemical coagulation on the MSD of NOM 337.3.3. The effect of ozonation on the MSD of NOM 357.3.4 The effect of AC filtration on the MSD of NOM 367.3.5 The removal of NOM during the entire treatment process 377.4 The effect of ozonation and AC filtration on NOM according to the pilot-scalestudy 387.4.1 DOC and other conventional quality parameters 387.4.2 AOC concentrations 387.4.3 HPSEC results 397.5 The effect of NF on the removal of NOM according to pilot-scale study 397.6. Evaluation of the performance of HPSEC-UV254 in the measurement ofNOM during water treatment process 41
8 CONCLUSIONS 42
9 REFERENCES 44
APPENDIX 1APPENDIX 2
ORIGINAL PAPERS

viii
LIST OF ORIGINAL PAPERS
This thesis is based on the following original papers referred in the text by their Romannumerals (Paper I-V):
I Matilainen, A., Lindqvist, N., Korhonen, S. and Tuhkanen, T. 2002. Removal of NOMin the different stages of the water treatment process. Environment International.28:457-465.
II Matilainen, A., Vieno, N. and Tuhkanen, T. 2006. Efficiency of the activated carbonfiltration in the natural organic matter removal. Environment International. 32:324-331
III Matilainen, A., Lindqvist, N. and Tuhkanen, T. 2005. Comparison of the efficiency ofaluminium and ferric sulphate in the removal of natural organic matter during drinkingwater treatment process. Environmental Technology. 26:867-857.
IV Matilainen, A., Iivari, P., Sallanko, J., Heiska, E. and Tuhkanen, T. 2006. The role ofozonation and activated carbon filtration in the natural organic matter removal fromdrinking water. Environmental Technology. 27:1171-1180
V Matilainen, A., Liikanen, R., Nyström, M., Lindqvist, N. and Tuhkanen, T. 2004.Enhancement of the natural organic matter removal from drinking water bynanofiltration. Environmental Technology. 25:283-291.
The Authors Contribution:
1. The author wrote the article and interpreted the results. She conducted the analysisand experiments in co-operation with N. Lindqvist.
2. The author wrote the article and interpreted the results. She conducted the analysis andexperiments in co-operation with N. Vieno.
3. The author wrote the article and interpreted the results. She conducted the analysis andexperiments in co-operation with N. Lindqvist.
4. The author wrote the article. She conducted the HPSEC analysis and interpreted theresults. P. Iivari was responsible for planning and conducting the pilot runs.
5. The author conducted the HPSEC analysis in co-operation with N. Lindqvist. Sheinterpreted the results. She wrote the manuscript in co-operation with R. Liikanen,who was responsible for planning and conducting the pilot runs.
ix
ABBREVIATIONS
AC Activated carbonAMM Apparent molar massAOC Assimilable organic carbonAOP Advanced oxidation processesAOX Adsorbable organic halogenBAC Biologically activated carbonBDOC Biodegradable dissolved organic carbonClO2 Chlorine dioxideDBP Disinfection by-productsDOC Dissolved organic carbonEBCT Empty bed contact timeESR Electron spin resonanceFFF Field flow fractionationGC-MS Gas chromatography-mass spectrometryHMM High molar massHPLC High-performance liquid chromatographyHPSEC High-performance size-exclusion chromatographyIMM Intermediate molar massIR InfraredLMM Low molar massMALS Multi-angle light scatteringMF MicrofiltrationMIEX Magnetic ion exchange resinMM Molar massMSD Molecular size distributionMWCO Molecular weight cut-offNF NanofiltrationNMWCO Nominal molecular weight cut-offNMR Nuclear magnetic resonanceNOM Natural organic matterPSS Polystyrene sulphonateRI Refractive indexRO Reverse osmosisSEC Size-exclusion chromatographySOPH Sum of peak heightsTHM TrihalomethanesTHMFP Trihalomethanes forming potentialTOC Total organic carbonUC UltracentrifugationUF UltrafiltrationUV254 Ultraviolet absorbance at wavelength of 254 nmVPO Vapor pressure osmometry

1
1. INTRODUCTION
1.1 Background
In the Northern hemisphere the amount of dissolved natural organic matter (NOM) in soil andsurface water is high due to the relatively thin soil cover and due to the climate. More thanhalf of the dry matter weight in the water in this region may be due to NOM. It is responsiblefor giving the water a distinct yellow-brown colour (Nordtest 2003). It has been noticed thatthe colour and to a lesser extend the dissolved organic carbon (DOC) in surface water inNorthern European countries have increased considerably during the past 1 1/2 decades(Eikebrokk et al. 2004). There is apparently an increase in the use of groundwater andartificial groundwater in Finland. Consequently the share of surface water is declining. Still,about 40% of the drinking water produced in Finland is from surface water sources, and alllarger water treatment facilities use surface water as a raw water source (Ympäristökeskus2004).
NOM causes problems in the production of drinking water. It has an adverse effect on theaesthetic water quality and may result in biofouling of pipelines with negative hygienicconsequences (Nordtest 2003). It has also been demonstrated that the NOM is the basis for theproduction of potentially hazardous disinfection by-products (DBPs) (Singer 1999). Thus, ishas to be removed from drinking water more efficiently. The most obvious solution to theenhanced removal of NOM from raw waters would be the improvement of the performance ofexisting processes; coagulation, flocculation and filtration. However, if the existing watertreatment process is considered insufficient, there are still unit operations for the removal ofthe residual organic matter and possible micro-pollutants from water; membrane techniquesand oxidization of organic matter followed by assimilation by micro-organisms. In general,the quality of the drinking water, supplied by the water treatment facilities in Finland, meetsthe standards (Ympäristökeskus 2004). Nevertheless, some improvements in the technical andaesthetic qualities of drinking water are still required. More data is needed for the riskassesment and selection of proper treatment technologies.
NOM can be removed from water by a number of different treatment processes (Jacangelo etal. 1995). The most common and economically feasible processes to remove NOM arecoagulation and flocculation followed by sedimentation/flotation and sand filtration. NOMwith high molar mass (HMM) is removed effectively from water in the chemical coagulationprocess (Ratnaweera et al. 1999a, Vik et al. 1985). However, a part of the organic matter ispassing through when this method is used. This part consists predominantly of intermediatemolar mass (IMM) and low molar mass (LMM) organic compounds. The NOM remainingafter coagulation can be further removed by advanced treatment processes, such as activatedcarbon (AC) filtration, biologically activated carbon (BAC) filtration and membrane filtration(Jacangelo et al. 1995). The intermediate molar mass (IMM) organic compounds and a part ofthe low molar mass (LMM) organic matter can be removed quite efficiently in the ACfiltration process (McCreary and Snoeyink 1980). However, a part of the LMM organicmatter fraction does not adsorb onto AC (Swietlik et al. 2002). Membrane filtration achievesthe highest removal capacity of NOM, especially as a last step of treatment after conventionalprocesses (Liikanen 2006). The costs of the membrane filtration processes, however, havebeen relatively high and its use, therefore, is restricted to special cases (Jacangelo et al. 1995,Liikanen 2006).

2
Disinfection of water with chlorine can lead to the formation of disinfection by-products,DBPs.Thus there is an increasing interest in using ozone as disinfectant. Ozone has also otherpositive effects on the NOM removal besides disinfection (Amy et al. 1991, Owen et al.1995). Still, the ozonation of NOM in water is not very well understood, because of thevariable structures and the different chemical groups attached to the NOM (Langlais et al.1991, Ho et al. 2002). Ozonation, combined with AC filtration, can enhance the removal ofNOM due to increasing biodegradation of NOM and hence an increased assimilation to AC(Langlais et al. 1991).
The amount of organic matter in water is determined usually by total organic carbon (TOC),dissolved organic carbon (DOC), UV-abs and colour measurements. However, in order toevaluate the impact of the different treatment-steps on the quality of the organic matter, high-performance size-exclusion chromatography (HPSEC) has proved to be very useful(Peuravuori and Pihlaja 1997, Nissinen et al. 2001, Myllykangas et al. 2002). It should bekept in mind, however, that the HPSEC method has its own limitations, particularly due to thefact that UV254 is often used as a detector. Small aliphatic compounds, do not for example,absorb UV light and are thus not indicated by the UV254 measurements. Still, the method hasbeen extensively used since the 80´s for the measurements of molecular size distribution(MSD) of NOM in water with good results (Miles and Brezonik 1983, Kronberg et al. 1985,Vartiainen et al. 1987, Knuutinen et al. 1988, Peuravuori and Pihlaja 1997, Miettinen et al.1998, Vuorio et al. 1998, Nissinen et al. 2001, Myllykangas et al. 2002, Hurst et al. 2004,Goslan et al. 2006).
1.2 Research problem and objective
Pure drinking water is essential for any society. Due to the water quality problems and stricterregulations for drinking water quality, more efficient and still economical methods for thepurification are needed. The need for more efficient removal of NOM necessitates moreknowledge of the matter. In Finland, there have been studies about NOM removal in drinkingwater processes (Tuhkanen et al. 1994, Kainulainen et al. 1995, Vuorio et al. 1998, Nissinenet al. 2001, Myllykangas et al. 2002), about the formation of the DBPs during the drinkingwater treatment process (Nissinen et al. 2002, Myllykangas et al. 2005) as well as microbialgrowth in drinking waters (Miettinen et al. 1999, Lehtola et al. 2001, Lehtola et al. 2002).However, the knowledge of the NOM quality and quantity in the actual drinking watertreatment train, and how is it removed during the process, needed to be studied more in longterm investigation.
The main objective was to monitor the drinking water purification process on full-scale at thewater treatment plant. In long-term follow-up the behaviour of NOM in all seasons withvarious raw water supplies was studied. Besides the conventional treatment methods, theadvanced treatment techniques, and especially how they are operating in Finnish conditions,was of interest; the enhancement of the NOM removal by the nanofiltration (NF) process as arefining surface water treatment phase and the effects of ozidation of NOM with ozone,followed by filtration with AC. The quantity of NOM is not the only parameter affecting thetreatment efficiency. Thus, the removal of the different molar mass (MM) fractions of NOMin the different purification processes was especially worth studing further.
The nature of organic matter is very complex and there is a need for a simple and rapidmethod to characterize NOM. One of the most common innovative method to characterizeNOM is the determination of the molecular size and molar mass distribution (MSD) of NOM

3
by high-performance size-exclusion chromatography (HPSEC). Thus, the use of HPSEC-UV254 method in the routine monitoring of the purification process needed to be evaluated.We also wanted to determine whether the HPSEC-UV254 method could yield any informationon the process beyond what could be gained by basic water quality measurements.
1.3 Research methods
The removal of NOM was monitored in full-scale drinking water treatment facilities, usinglake water as well as river water as water supplies. In addition, an advanced purificationprocess, NF as a refining treatment process after conventional purification, was studied inpilot scale. The use of ozonation, in combination with AC filtration, and its effects on NOMremoval was also investigated in pilot-scale as well as full-scale.

4
2. THE CHARACTERISTICS OF NATURAL ORGANIC MATTER INWATER
2.1. Natural organic matter
Natural organic matter (NOM) in aquatic environments can be derived from both the externalsources (allochthonous) and from sources within the aquatic ecosystem (autochtonous). Themain source of aquatic humic substances is however from the terrestrial vegetation and soilsin the watershed (McKnight and Aiken 1998). Climatic factors, such as precipitation andtemperature are important factors regulating the soil organic matter pool and carbon fluxes,including NOM dynamics (Aiken and Cotsaris 1995, Gjessing 2003).
Organic matter in natural waters can be divided into dissolved and particulate organic carbon.No natural cutoff exists between these two fractions and the distinction is operational.Filtration through a 0.45 µm filter has been arbitrarily established as the standard procedurefor separating dissolved and particulate components (Danielsson 1982). Researh of NOM inthe water has been almost exclusively concerned with dissolved fraction. Dissolved organiccarbon can be divided into six fractions: hydrophobic acids, bases and neutrals; andhydrophilic acids, bases and neutrals (Leenher 1981). NOM can be also divided into humicand non-humic fractions. The humic fraction is more hydrophobic in character and compriseshumic acids and fulvic acids. The nonhumic fraction is less hydrophobic in character andcomprises hydrophilic acids, proteins, amino acids and carbohydrates (Owen et al. 1995).Monomeric species such as simple sugars and amino acids may also be present in surfacewater, but they are less abundant because they are subject to relatively rapid biodegradation(Croue et al. 2000). Non-humic substances can be bound covalently to humic substances, thusmaking the separation of these two groups difficult (Peuravuori 1992). Different fractions andthe chemical groups involved are shown in Table 2.1.
Table 2.1 NOM fractions and chemical groups (in Edzwald 1993).
FRACTION CHEMICAL GROUPHYDROPHOBICacidsstrong humic and fulvic acids
HMM alkyl monocarboxylic and dicarboxylic acids,aromatic acids
weak phenols, tanninsIMM alkyl monocarboxylic and dicarboxylic acids
bases proteins, aromatic amines, HMM alkyl aminesneutrals hydrocarbons, aldehydes, HMM methyl ketones and alkyl alcohols,
ethers, furans, pyrroleHYDROPHILICacids hydroxy acids, sugars, sulfonics, LMM alkyl monocarboxylic and
dicarboxylic acidsbases amino acids, purines, pyridines, LMM alkyl aminesneutrals polysaccharides, LMM alkyl alcoholes, aldehydes and ketones

5
Humic substances are a complex mixture of both aliphatic and aromatic molecules with awide variety of chemical compositions and molecular sizes. The classification is thereforebased on an operational chemical characterization, which is often referenced to a solubilityscheme originally developed by soil scientists (Oden 1919). The soil science terminology wascarried over into the aquatic field at an early stage of the study of NOM and the terms are nowcommonly used (Aiken and Cotsaris 1995). The basic definitions of humic substances arebased on the procedure used for their isolation. Humic substances are defined in terms of theirsolubilities in aqeuous acids and bases – regardless of sources of samples. The insolubleorganic matter remaining after alkaline extraction is termed humin. The soluble fraction istreated with acid to low pH, and the material that precipitates is termed humic acid, while theorganic material remaining in solution is called fulvic acid (Figure 2.1) (Stevenson 1982).
HUMUS
HUMIN
HUMIC ACID FULVIC ACID
(insoluble) (soluble)
(precipitated) (soluble)
extract with alkaline solution
acidify
Figure 2.1. Scheme for the extraction of humic substances (adapted from Stevenson 1982).
Regardless of the isolation or definition scheme, humic and fulvic acids constitute a majorfraction of any aquatic NOM sample. They account for widely varying proportions of NOM,generally one-third to one-half of the DOC in water (Thurman and Malcolm 1981). Fulvicacids are probably more representative than humic acids, especially in the dissolved fraction(Malcolm 1985). In general, fulvic acids are more soluble, smaller in average molecularweight, less aromatic and more highly charged than humic acids. Fulvic acids typically alsohave higher oxygen content, with higher carboxylic acid (COOH) and lower aromatichydroxyl (ArOH) content than humic acids (Hayes et al. 1989b). At pH values typical ofnatural waters, a fulvic acid molecule has a net negative charge (Amy et al. 1992).
2.2 Structures of humic substances
Unlike synthetic polymers and many biological polymers, humic molecules are not comprisedof unique, highly reproducable monomeric building blocks. In many humic molecules, thegroup of similar building blocks are probably present, but the sequence and frequency ofoccurrence of the blocks differ. The exact structure of the regions between adjacent building

6
blocks is probably different in every humic molecule (Croue et al. 2000). Severalhypothetical structures have been proposed to account for the chemical composition andbehaviour of humic substances. The assumption that lignin is essential in humificationprocesses is common to most structural formulas. The proposed structural formulas consistmainly of highly condensed aromatic rings substituted with carboxylic, phenolic and methoxygroups (Hatcher and Spiker 1988, Peuravuori 1992, Amy et al. 1992). In general, two types ofstructures have been proposed. First type has random aggregates of highly substitutedaromatic and phenolic acids held together by weak interactions, such as hydrogen bonds. Thistype of structure has been proposed chiefly for fulvic acids. The other type consists of highlycross-linked networks of mainly aromatic and aliphatic structural components and this isapplied generally to humic acids (Hayes et al. 1989a, Peuravuori 1992). Figure 2.2 illustratesan example of proposed structure for humic acid. Structure suggested for fulvic acid moleculeis in Figure 2.3.
Figure 2.2 Example of proposed structure for humic acid in aqueous environment afterStevenson, 1982.
Figure 2.3 Average structure for fulvic acid after Buffle (1977) (in Peuravuori 1992).

7
Although there is some discussion about the most appropriate molecular model for theconformation of humic substances in solution, the random coil model is more likely toaccommodate the apparent irregularity of chemical structure and apparent lack of internalbonding and crosslinking (Swift 1989). Humic substances are polyelectrolytes and thereforecarry a substantial electrostatic charge in aqueous solution (Swift 1989, Peuravuori 1992).Ghosh and Schnitzer (1980) proposed a theory for the modelling of polyelectrolyte structureof humic substances. This structure is based on molecular coiling and uncoiling in response tochange in solution pH, ionic strength and organic solution concentration. According to thistheory, NOM exists as a flexible linear macromolecule at very low ionic strength, high pHand low solution concentration, when intramolecular charge repulsion is high and repulsive(Figure 2.4 A). At high ionic strength, low pH and high solution concentration NOM exist asa rigid, compact, spherocolloidal macromolecule (Figure 2.4 B) (Ghosh and Schnitzer 1980,Braghetta et al. 1997). This approach has been questioned in recent studies (Piccolo et al.1996, Conte and Piccolo 1999a and 1999b). Conte and Piccolo (1999a) suggested, based onstudies with HPSEC and cross-polarization magic angle spinning 13C NMR spectroscopy, thataquatic humic substances are loosely bound self-association of relatively small moleculesrather than having a macromolecule random coil structure. The predominant binding forces inthe structure are intermolecular hydrophobic interactions, which are affected by the ionicstrenght and pH (Piccolo et al. 1996, Conte and Piccolo 1999a).
(A) (B)
Figure 2.4 Conceptual sketch of hypothetical macromoleculer endpoints from polyelectrolytesolution theory: A) high pH, low ionic strength, low solute concentration; B) low pH, highionic strength, high solute concentration (Adapted from Braghetta et al. 1997).
The third approach, without chemical structural formula, for identification of the nature ofhumic substances is the utilization of different concepts of molecular conformations, whichalso has caused contradictory reactions (Varga et al. 2000). Wershaw (1993) has proposedthat humic molecules are amphiphilic, containing hydrophilic carboxylate or carbohydrateend and the hydrophobic part from the relatively unaltered plant polymer segments. Theseamphibilic molecules interact with soil mineral grains and formate a membrane-like coatingto the hydrous oxide surface of these grains. The hydrophobic interiors of the membranes andmicelles can serve as hydrophobic phases into which nonpolar compounds partition. Similarlythe charged exterior surfaces of the membranes and micelles act as separate ion exchangephases that interact with charged species (Wershaw 1993, Piccolo 1997, Wandruszka 1998).

8
2.3 Molecular sizes of humic substances
A number of analytical techniques have been used for measuring the molecular sizedistribution (MSD) of aquatic organic colloids and humic substances. These include high-performance size-exclusion chromatography (HPSEC) (Chin and Gschwend 1991, Pelekani etal. 1999), ultra membrane filtration (UF) (Aiken 1984), ultracentrifugation (UC) (Reid et al.1990), field flow fractionation (FFF) (Beckett et al. 1987, Pelekani et al. 1999), diffusivimetry(Egeberg et al. 2002), vapor pressure osmometry (VPO) (Aiken and Malcolm 1997) and lowangle X-ray scattering (Wershaw 1989). Reported molecular sizes for humic and fulvic acidsdetermined by these methodologies range from 500 to 1 000 000 g/mol. These reported MMmay or may not reflect the true size of the colloid because the sizing of these substances issubject to nuances unique to each method (Chin and Gschwend 1991). One reason for thevery large MM sometimes reported is the possibility that humic substances may aggregateeven to the extend of forming micelle-like structures (Beckett et al. 1987, Wershaw 1993, DePaolis and Kukkonen 1997). MM of humic and fulvic acids are a topic of major disagreementin the literature. Recent data has shown that MM of less than 10 000 g/mol is most abundantin aquatic environments (Amy et al. 1992, Peuravuori and Pihlaja 1997, Pelekani et al. 1999).
The size of the humic substances will affect nearly all environmental aspects of thesecompounds. The molecular size of various humic substance samples has been related todisinfection by-product formation (El-Rehaili and Weber 1987, Reckhow et al. 1990),coagulation efficiency and removal by commonly employed water treatment processes(Collins et al. 1986, El-Rehaili and Weber 1987), complexation of trace metals (Weber 1988,Pettersson 1992), adsorption of humic substances onto minerals and activated carbon(McCreary and Snoeyink 1980) and partitioning of organic pollutants (Chin et al. 1997).

9
3. NOM IN THE WATER PURIFICATION PROCESS
3.1 Coagulation
Coagulation is a process, where the repulsive potential of electrical double layer of colloids isreduced so that micro-flocs can be produced. These micro-flocs collide with each other andform larger structures (flocs) in flocculation process (Gregor et al. 1997). Chemicalcoagulation is achieved by addition of inorganic coagulants such as aluminium- or iron salts.Although coagulation is effective in precipitation of soluble NOM, it has also an importantobjective of removing other particles and pathogens. Pathogen removal is far more importantfrom a public health point of view compared to NOM, so the removal of NOM should not,therefore be done at the expense of particle- and pathogen removal (Edzwald and Tobiason1999). The coagulation process is optimized in order to add as little coagulants as possibleand at the same time remove maximum amount of NOM and other particles (Ratnaweera etal. 1999b).
The effectiveness of coagulation to remove NOM and particles depends on several factorsincluding type and dosage of coagulant, pH, temperature, particle and NOM properties, suchas size and hydrophobicity (Vrijenhoek et al. 1998, Jarvis et al. 2004). NOM is removedthrough a combination of charge neutralization, entrapment, adsorption and complexationwith coagulant metal ions into insoluble particulate aggregates. Further agglemeration ofthese micro-particles leads to the formation of flocs (Randtke 1988, Jarvis et al. 2004). Thehydrophobic fraction of NOM is removed in the coagulation process more efficiently thanhydrophilic fraction of NOM (Collins et al. 1986, Aiken and Cotsaris 1995, Kim and Yu2005, Kim et al. 2005, Sharp et al. 2006a and 2006b). HMM matter is probably morearomatic (consisting mostly humic acid) than IMM and LMM matter (consisting more fulvicacid), therefore rendering HMM fraction more hydrophobic. Thus, the HMM organic matteris easier to remove by coagulation processes than the LMM matter (Randtke 1988, Sharp etal. 2006a). LMM compounds posses a higher carboxylic acidity, and therefore thesemolecules with the highest content of acidic functional groups are the most difficult todestabilize by coagulation (Collins et al. 1986). According to the study of Lindqvist (2001),the LMM fraction was not removed properly even when the coagulation process wasoptimised with respect to organic matter removal. Optimisation of the coagulation processwas noticed to influence primarily the removal of the IMM part of the organic matter (Hooper1996, Lindqvist 2001). However, in the study by Lindqvist et al. (2004), almost 40 % removalof the smallest MM fraction was observed if anionic polyelectrolytes were used ascoagulation aids in the process. Cationic polymers were not observed to have any significantimprovements in removal rates of NOM during coagulation (Lindqvist et al. 2002, Jarvis et al.2006).
The most widely used coagulant in drinking water production is aluminium sulphate(Amirtharajah and O’Melia 1990) but recently the use of ferric salts has become morecommon. Many jar-test studies have been made to compare the effectiveness of one coagulantwith another (Crozes et al. 1995, Lovins et al. 2003, Budd et al. 2004, Lidqvist et al. 2004,Tuhkanen et al. 2004). According to these studies ferric-based coagulants have been noticedto remove NOM, measured by DOC or UV-absorbance, more effectively than aluminium-based ones. In the studies made by Lindqvist et al. (2004) and Tuhkanen et al. (2004) theIMM fraction of NOM was removed approximately 15% more efficiently with ferriccoagulants than with aluminium ones. Lovins et al. (2003), however, noticed in theirinvestigation, that the aluminium-based coagulants generally provided higher colour removal.

10
The ferric coagulants are suggested to perform more efficiently at higher doses, especially intreating elevated levels of organics, whereas aluminium coagulants are thought to be moreselective (Budd et al. 2004, Kastl et al. 2004, Jarvis et al. 2006). The removal mechanisms offerric and aluminium coagulants are suggested to be different. Ferric-based coagulants arereported to present roughly twice the number of active positive charges per dry weight unit ofcoagulant compared to aluminium-based (Grozes et al. 1995). Thus, because of its highcharge density, ferric coagulants may better be able to precipitate especially the IMMmolecules (MM range of 1000-4000 g/mol) which consist primarily from fulvic acids(Lindqvist et al. 2002). Moreover, the flocs formed during ferric coagulation, are noticed to beboth larger and more numerous than those formed during aluminium coagulation, thereforeincreasing the likehood of collisions and subsequent removal (Ratnaweera et al. 1999,Lindqvist 2001).
3.2 Sorption on solid surfaces
NOM can be bound in porous solid materials to a certain extent. Therefore, porous solidmaterials are used in technical sorption systems for drinking water treatment. However,sometimes removal of inorganic and organic pollutants, as well as taste- and odour-causingsubstances, is the main task. Effects of competitive sorption with NOM may then play animportant role. Sorption of dissolved substances from the aqeuous phase in solid surfacesoccurs in a variety of natural systems as a result of attractive interactions, mostly due to vander Waals forces, hydrogen bonding and electrostatic forces (Fettig 1999). Many differentapplications are applied in practice or have atleast been investigated in pilot scale. Theseapplications include activated carbon (AC) filtration, anion exchange resins, carbonaceousresins and metal oxides (Heijman et al. 1999, Fettig 1999).
3.2.1 Activated carbon (AC) filtration
AC adsorption is an effective adsorbent used widely in the removal of both man-made andnatural micropollutants such as pesticides, industrial chemicals, tastes and odours and algaltoxins (Newcombe 1999). AC is a relatively expensive water treatment process, but theoperating costs can be reduced by replacing the sand with AC in already existing rapid gravityfilter basins (Hyde et al. 1987). The AC filtration has only quite recently been taken into useat Finnish water treatment plants. It wasn’t untill the middle of the 1980’s, when thereplacement of sand filters with AC became more common in water purification in Finland(Vahala 1995).
NOM competes for adsorption sites on AC, decreasing the removal of other micropollutants.However, AC can also be considered as an additional treatment for the removal of NOM(Newcombe 1999). Different MM fractions of NOM adsorb on AC to different extents, theHMM fractions being least adsorbable (El-Rehaili and Weber 1987). The lower MMcompounds are more adsorbable on AC because more surface area is accessible for thesesubstances (McCreary and Snoeyink 1980). Also, because they are smaller in size, they areable to enter nanopores that would exclude macromolecules. This suggests that there is arelationship between MSD of NOM, carbon pore size distribution and the effectiveness ofadsorption for removal of NOM (El-Rehaili and Weber 1987). As the result of IMM andLMM matter removal, AC is effective in reducing DBP precursor compounds (Newcombe1999).

11
All adsorbents have a limited capacity and have to be replaced or recharged. In Europeanpractice of drinking water treatment AC is reactivated and reused several times (Boere 1992).The most common regeneration method for AC is thermal reactivation at temperatures above700˚C (Boere 1992, Cannon et al. 1993). According to the study by Hyde et al. (1987) therewas no evidence of a change in particle size as a result of regeneration. But still, when AC hasbeen in use for several years and AC has been subjected to numerous regenerations, adegradation of AC particles has been found to occur (Hyde et al. 1987). Metals, likealuminium, calcium, iron and manganese, can accumulate into the AC. These metals appearnaturally in waters or they may be added during chemical treatment (Cannon et al. 1993).These metals can be removed from AC only by acid washing. Calcium inside the used ACmay influence the AC pore size during regeneration. Still, if regeneration is performed underproper conditions, its virgin pore characteristics can be restored (Cannon et al. 1993).However, because change or regeneration of AC are the most expensive steps in the ACfiltration process, various alternatives have been investigated to expand the lifetime of carbon,e.g. preozonation (Langlais et al. 1991, Kainulainen et al. 1995).
3.2.2 Biologically activated carbon (BAC) filtration
Microbial re-growth in the distribution system has always been a major concern for waterutilities. The extent of re-growth depends on the substrate availability and the presence ofresidual disinfectants. One method of re-growth control is to limit nutrient concentration(Miettinen et al. 1999, Lehtola et al. 2002). These nutrients are naturally occurring or areproduced during oxidation processes like ozonation. Allowing some processes in thetreatment plant to become biologically active has been found to reduce the biodegradableorganic matter in water (Langlais et al. 1991, Miltner et al. 1992). AC colonized by aheterotrophic biomass reduces the proportion of easily assimilated and biodegradableelements, which are mainly LMM organic molecules (Boualam et al. 2003). The highestamount of microbial growth is found on the surface and top layer of AC filter (Kainulainen etal. 1995). Preozonation has been shown to increase the biodegradability (and henceassimilable organic carbon, AOC content) of organic matter (Langlais et al. 1991, Miettinenet al. 1998). The increased AOC content enhances the biological activity in the filter, and thusenhances the removal of NOM (Langlais et al. 1991, Van der Hoek et al. 1999). Mostozonation/biofiltration plants in the world use AC as biofilter medium, thus combiningadsorption and biofiltration (Odegaard et al. 1999). The effect of carbon regeneration onbiological activity of AC, and the removal efficiency of DOC and AOC, have been noticed tobe negligible (Van der Hoek et al. 1999). Thus, enhanced biological activity withpreozonation prolongs the running time of AC filters and reduces the costs of regeneration ofthe carbon (Langlais et al. 1991, Boere 1992, Van der Hoek et al. 1999).
3.2.3 Ion exchange resin filtration
Ion exchange is an effective method for removing NOM from drinking water. Since a largefraction of NOM can be characterized as anionic polyelectrolytes, macroporous ion exchangeresins are well-suited for NOM removal (Fettig 1999). Resins of open structure and highwater content are very efficient at removal of any charged material, including NOM, andespecially LMM NOM (Bolto et al. 2002a). Ion exchange resins are more homogeneous withrespect to the binding of NOM, compared to activated carbon (Fettig 1999). Ion exchangeresins can also be regenerated as much as 50 times, so the costs of the DOC removal are verylow compared to AC (Heijman et al. 1999).

12
Magnetic ion exchange resin, the MIEX® process, is quite recently developed in Australia(Orica Australia Pty, Ltd). The method is based on traditional ion exchange process. Incomparison with traditional process, MIEX® is microsize, having smaller sized resin particles(mean particle size 150 µm) than traditional resins. Moreover, the resin beads in the MIEX®process are dispersed as a slurry, in a stirred contactor with treated water, allowing formaximum surface area for adsorption (Drikas et al. 2004, Fearing et al. 2004). The magneticproperties of the resin promote aggregation of the resin particles, facilitating resin recovery(Drikas et al. 2004). This strong-base resin was developed for reversible removal ofnegatively charged organic ions, and specifically for the removal of DOC to minimize theformation of DBPs in drinking water supplies (Hammann et al. 2004, Drikas et al. 2004).Especially the IMM and LMM NOM are efficiently removed, thus reducing the DBPsforming potential of treated waters (Hammann et al. 2004). The negatively charged DOC isremoved from water by exchanging it with a chloride ion on active sites on the resin surface(Hammann et al. 2004). High NOM removals (85-90%) can be achieved with 10 to 20minutes contact times (Drikas et al. 2004). Moreover, MIEX® resin has been reported toachieve high NOM removal (46-87% and 53-100% for DOC and UV, respectively) as a resultof pre-treatment process before coagulation (Singer and Bilyk 2002, Fearing et al. 2004). Thisis because coagulants and ion exchangers are noticed to remove different kind of NOMcompounds. The preference of the coagulants are for larger molecules, and of the resins forthe smaller, highly charged compounds (Bolto et al. 2002b).
3.3 Disinfection and oxidation
The primary purpose for disinfection of drinking water is to destroy and eliminate pathogenicorganisms responsible for waterborne diseases. Commonly used disinfectants are chlorine,chlorine dioxide, chloramine and ozone. Also ultraviolet (UV) radiation and sodiumhypochlorite have been used in water disinfection. No single disinfection method alone isright for all circumstances. Water treatment facilities may use a variety of methods to meetoverall disinfection goals at treatment plants and to provide residual protection throughout thewhole distribution system. (CCC 2003)
3.3.1 Chlorine-based disinfectants
Although ozone was first recognized to disinfect polluted water in the late 19th century, afterWorld War I the use of chlorine became more popular (Langlais et al. 1991). Up until the late1970’s, chlorine was virtually the only disinfectant used to treat drinking water. Even today,chlorine is the most commonly used disinfectant, based on its proven characteristics;effectiveness against pathogens, ease to apply, control and monitore and reasonable cost(CCC 2003). However, humic substances react with chlorine to produce a number of differenthalogenated organics, such as trihalomethanes (THMs). Several of these compounds havebeen shown to cause cancers in laboratory animals (Singer 1999). The MM fractions <40 000g/mol are predominantly responsible for THM production during chlorination (El-Rehaili andWeber 1987). In Finland, high concentrations of chlorinated organic matter and highmutagenic activity were measured in the drinking water in the 1980s. The mutagenicitydecreased markedly from 1985 to 1994 in Finnish waterworks. This was due to thatparticularly prechlorination of drinking waters stopped and post-chlorination decreased inwater purification facilities. Waterworks have also improved their NOM removal processes(coagulation, AC fitration), and thus the amount of organic precursors for THM productionhas decreased (Nissinen et al. 2002).

13
Many drinking water utilities are changing from chlorine to alternative disinfectants such aschlorine dioxide and chloramines. Substitution of chlorine by any other disinfectants has beennoticed to decrease the mutagenicity and the concentration of THMs (Backlund 1990).Chloramine disinfection has been found to be one of the best treatment options for reducingmutagenicity and the DBPs formation (Nissinen 2002). However chloramines are relativelyweak as a disinfectant and almost never used as a primary disinfectant (CCC 2003). Chlorinedioxide is a strong disinfectant and a selective oxidant (CCC 2003). However, the disinfectionwith chlorine dioxide also generates by-products. These by-products are mainly inorganic(chlorites and chlorates), but also organic by-products formation are reported (Dabrowska etal. 2003). Thus, alternative disinfectants result in new problems. Source of raw waterconditions can affect the levels and types of DBP species formed, and a new type of DBPs isevolving (Richardson et al. 2002).
3.3.2 Ozonation
The disinfectant ability of ozone was recognized as early as in the late 19th century. However,it was not until after World War II, when ozonation became more common (Langlais et al.1991). Nowadays, ozonation is widely used in the drinking water treatment for disinfection,bleaching and taste and odor removal. Ozonation also results in decolorisation, as well asturbidity removal (Langlais et al. 1991). It has been reported of a 45 % and 43 % colour andturbidity removals, respectively, after ozonation (Tuhkanen et al. 1994). Ozonation reactionproducts are far more biodegradable than the original humic substances themselves (Odegaardet al. 1999). Thus, it is used also to enhance the removal of residual organic carbon byincreasing the biodegradability of recalcitrant NOM prior to biofilter medium, such as AC(Owen et al. 1995).
The ozonation of NOM in water is still not well understood as NOM consists of a diverserange of compounds with very different chemical properties (Ho et al. 2002). According toliterature (Owen et al. 1995), ozonation does not result as much in NOM destruction, butrather in transformation. It has been reported (Amy et al. 1992, Owen et al. 1995, Miettinen etal. 1998, Kim et al. 2005) that ozonation could convert NOM from higher to lower MMfractions as well as alter the hydrophobic compounds to more hydrophilic. In several studies,ozonation has been noticed to have a great impact on the different MM fractions of NOM, butit virtually has had no effects on the TOC content of the different waters studied (Langlais etal. 1991, Tuhkanen et al. 1994, Kainulainen et al. 1995, Nissinen et al. 2001, Myllykangas etal. 2002, Myllykangas et al. 2005). Slight decrease in HMM compounds fraction of NOM hasbeen detected, while LMM matter fraction has been noticed to increase. The organiccompounds of the IMM fraction developed either way, depending on ozone dose and generalconditions. Moreover, strong degradation of colour and UV absorbance has been noticed tooccur (Langlais et al. 1991, Amy et al. 1992). Ozonation is also noticed to be very effectivemethod for reducing the amount of DBPs (Kainulainen et al. 1995, Nissinen et al. 2002, Kimet al. 2005, Chin et al. 2005).
Oxidation of NOM with ozone results in the formation of several by-products, includingaldehydes and carboxylic acids (Kim et al. 2005, Kasprzyk-Hordern et al. 2005). These by-products contribute to a large extent to the amount of biodegradable organic carbon (BDOC)and assimilable organic carbon (AOC), which are easily used by microbes (Miettinen et al.1998, Miettinen et al. 1999). That is the reason why ozonation is usually followed bybiofiltration in order to remove BDOC and AOC from water. The removal of NOM byozonation followed by AC is attributed more to the biodegradation than adsorption by so

14
called biologically activated carbon (BAC) (Langlais et al. 1991, Odegaard et al. 1991). Bythis way the bacteria growth in the distribution system, as well as high disinfectant demand,can be prevented (Kasprzyk-Hordern et al. 2005).
3.3.3 Advanced oxidation processes (AOPs)
An alternative group of technologies that can be used to remove the NOM from drinkingwater and minimize the formation of DBPs are advanced oxidation processes (AOPs). AOPsare defined as near-ambient temperature processes that involve the generation of highlyreactive radical intermediates, especially the hydroxyl radicals (Glaze et al. 1987 and 1992).The hydroxyl radical has been reported to oxidise a range of organic compounds highlyefficiently (Tuhkanen et al. 1994). AOPs involve many different disinfectants used incombination with others, e. g. O3/H2O2, UV/H2O2, and O3/UV. Also Fenton’s and photo-Fenton processes have been studied (Murray and Parsons 2004, Goslan et al. 2006). Thesemethods have been used for the removal of pesticides, pharmaceuticals etc. from pollutedwater. Many studies have been made to evaluate these AOPs for control of NOM in drinkingwaters (Glaze et al. 1992, Tuhkanen et al. 1994, Wang et al. 2000, Murray and Parsons 2004,Chin and Bérubé 2005, Goslan et al. 2006). The formation of the DBPs and mutagenicity isusually lower than that found after the use of individual disinfectants. The titanium dioxide-based photocatalytic degradation is also one of the studied processes (Li et al. 2002). It isreported (Li et al. 2002) that photocatalytic oxidation is effective process for themineralization of NOM, even up to CO2, H2O and in-organic constituents.
3.4 Membrane filtration
Membranes used for NOM removal have relatively recently been taken into use to a greaterextent, although the technology has been available for several decades (Jacangelo et al. 1995).Pressure driven membrane processes include reverse osmosis (RO), nanofiltration (NF),ultrafiltration (UF) and microfiltration (MF) (Jacangelo et al. 1995). MF will remove turbidity(particulates and bacteria), but no dissolved compounds unless associated with colloids. UFwill, depending on the molecular weight cut off (MWCO) of the membrane, remove NOMpartially and viruses. NF will remove NOM and hardness almost completely (Schäfer et al.2001). NF has proven to be reliable for the removal of organic and inorganic compounds(Amy et al. 1990, Thorsen et al. 1999, Siddiqui et al. 2000, Liikanen 2006), with loweroperating pressures than RO and lower MWCO than UF (Her et al. 2000). Organic andinorganic compounds are removed by steric exclusion, electrostatic repulsion andhydrophobic interaction. Matter with MM larger than the membrane cut off is removedmainly by a sieving mechanism, and molecules with MM lower than the membrane cut off bydiffusion and charge repulsion based mechanism. Molecule polarity, charge, hydrophobicityand configuration may also affect the retention (Cho et al. 1999, Van der Bruggen et al. 1999,Chellam 2000). Polyhydroxy aromatics (hydrophobic acids) such as humic substances arebelieved to be rejected by negatively charged NF membranes (Her et al. 2000).
Much of the research has focused on a greater understanding of the membrane foulingpotential of surface water constituents (Maartens et al. 1998, Fan et al. 2001, Park et al. 2006)and better pre-treatment techniques (Vickers et al. 1995, Lin et al. 1999, Lin et al. 2000). Thefouling of membranes and the decline of flux have been reported to be some of the mainproblems related to membrane techniques. The extent of membrane fouling is dependent onwater quality, membrane properties and operational conditions (Her et al. 2000, Liikanen2006). Several studies indicate that NOM play an important role in membrane fouling.

15
Especially the hydrophobic and HMM fractions of NOM have shown to be responsible forthis membrane fouling (Childress and Elimelech 1996, Nilson and DiGiano 1996, Hong andElimelech 1997, Schäfer et al. 1998, Her et al. 2000). The NOM fouling of polymermembranes has been noticed to increase in the presence of divalent captions, at low pH and athigh ion content (Childress and Elimelech 1996, Braghetta et al. 1997, Hong and Elimelech1997, Schäfer et al. 1998, Her et al. 2000, Zander and Curry 2001). It should be borne in mindthat fouling changes the membrane properties as well as the characteristics of the foulants inthe fouling layer, and thus also affects membrane retention (Yoon et al. 1998, Cho et al. 1999,Schäfer et al. 2000).
NF process, as a refining step in surface water treatment, enhance the removal of residualorganic matter and bacteria to levels, which restrict the need for post-chlorination and limitsconsequent DBP formation and bacteria growth in distribution network (Liikanen et al. 2003).Still, very small LMM organic molecules pass through the NF membranes more easily thanhigher MM organics, and some post-chlorination is required to suppress microbial growth indistribution systems (Liikanen et al. 2003). However, in applications not requiring notablyimproved organic matter or ion removals, simpler and less costly process options, like ACfiltration and UF or coagulation and UF or MF may be more suitable process options than NF(Liikanen 2006). Consequently, membrane filtration has become a more common method toremove organic matter from drinking water. In the future, membrane filtration most probablywill increase its share in the water treatment industry with soft and coloured surface rawwaters, due to good and stable water quality obtained by this process (Thorsen 1999, Gorenfloet al. 2002).
3.5 Summary of different processes for removal of NOM
The interest in NOM removal is increasing among water treatment facilities because of morestringent regulations of drinking water quality, and moreover, because of a significantincrease in the amount of NOM observed in Nordic countries (Nordtest 2003). The mostcommon processes for NOM removal in Finland are coagulation and AC filtration orozonation combined with AC filtration. Recently developed processes are membrane (mostlyNF) filtration and MIEX®, which are not in full-scale use in Finland, atleast not yet. Therehave been few investigations about these novel techniques in Finnish conditions (Toivanenand Härmä 2004, Sallanko and Merisalo 2005, Liikanen 2006).
Enhanced NOM removal can be achieved by optimising the coagulation processes, but thisresults in higher costs because of increased coagulant doses and greater amount of sludge.Also the removal of the lowest MM organic compounds is not improved even whencoagulation is optimised (Lindqvist 2001). Advanced purification processes are usuallyexpensive and demand some process modifications. Still, if the NOM amount, and especiallythe LMM matter or DBP forming potential in treated water, needs to be reduced, theadvanced treatment techniques such as AC, NF and MIEX® have to be considered (Jacangeloet al. 1995, Hooper et al 1996, Drikas et al. 2004, Liikanen 2006). NF process has beenobserved to be superior as the refining phase after conventional treatment. Especially, theremoval of residual LMM organic matter has been improved (Liikanen 2006). MIEX®process has given very promising results on the removal of NOM. Combined with coagulationit can result in high NOM removal with reduced costs by lowering the demand forcoagulation agent, as well as other chemicals, thus reducing the amount of sludge andenhancing the performance of other unit operations (Toivanen and Härmä 2004). In spite ofthe excellent NOM removal capacity of these processes, they may include some problems;

16
e.g. the problems in the use of NF in surface water treatment include membrane fouling, lowprocess yields in comparison with conventional processes, high energy consumption, need forretentate and cleaning solution disposal, as well as overall costs and adverse environmentalimpact (Liikanen 2006). Process costs and efficiencies for NOM removal are always sitespecific; e.g. raw water quality varies from area to area . Moreover, small and medium sizewaterworks doesn’t usually have resources to invest in the best available drinking watertreatment techniques, and hence it is important to find the best possible solution for particularcases. However, some basic trends and comparisons of the different treatment processes canbe made. The various processes for NOM removal are summarized in Table 3.1.
Table 3.1 Qualitative summary of selected aspects of various technologies used for removalof NOM.
Treatmentprocess
NOM removalefficiency
Processcomplexity Reference
coagulation fair - good low - medium Jacangelo et al. 1995MIEX® excellent medium Toivanen and Härmä 2004, Drikas 2004,
Fearing 2004AC filtration very good medium - high Jacangelo et al. 1995ozonation/AC very good medium-high Van der Hoek et al. 1999, Iivari 2006nanofiltration excellent medium Liikanen 2006
Jacangelo et al. 1995

17
4. DIFFERENT METHODS FOR CHARACTERIZATION OF AQUATIC NOM
4.1 General parameters
In practice the concentration of NOM is usually characterized by sum parameters like TOC,DOC, UV-absorbance and COD (Chemical Oxygen Demand; oxidizability by K2CrO4 orKMnO4). NOM has also a major contribution to the amount of colour in water. These tests arefast and they can be automated. Still, these tests do not give any information about the qualityof NOM. They only measure the quantity of organic matter present.
4.2 Biological tests
Several biological tests have been developed to assess the level of biodegradable organicmatter in water. These bioassays are based on two concepts: (1) the assimilable organiccarbon (AOC), that measures the growth of bacterial inoculum in response to the amount ofnutrients in the water and (2) the biodegradable dissolved organic carbon (BDOC) thatmeasures the fraction of DOC assimilated and mineralised by heterotrophic microbes (Huck1990, Miettinen et al. 1999, Escobar and Randall 2001).
4.3 Isolation and concentration
The diversity of molecules that constitute NOM and the relative low concentration of NOM indrinking water sources posses some major difficulties in the characterization of NOM.Methods are needed that can either characterize NOM in dilute solutions or that can isolateNOM without altering its properties (Croue et al. 2000). Usually isolation and concentrationof aquatic NOM begin by separating the sample into dissolved and particulate fractions(Danielsson 1982). A widely accepted method is the filtration through a 0.45 µm filter.Hence, numerous isolation and concentration methods are available. The most commonlyused are vacuum distillation, freeze-drying and some sorption methods (Aiken 1985).
4.4 Fractionation of NOM
NOM molecules are all unique while also sharing many common properties. Fractionation ofNOM selects a sub-group of molecules from the mixture, that share a narrower range ofproperties, than the entire aggregate does (Croue et al. 2000). One of the major analyticaldifficulties in the characterization of aqeuous NOM is the lack of any fractionation procedurewhich will yield pure components which can be subsequently characterized by standardtechniques. Fractionation procedures cannot be clearly distinguished from isolationprocedures, because some of the isolation methods (e.g. adsorption chromatography) partlyalso fractionate aquatic NOM (Leenher 1985). Commonly used chemical fractionationmethods are precipitation, solvent extraction, and adsoption chromatography. Moreover, thephysical fractionation methods available are electrophoresis, ultrafiltration (UF), sizeexclusion chromatography (SEC) and ultracentrifugation (UC) (Leenher 1985).
4.4.1 Resin fractionation
The most common approach for distinguishing between hydrophobic and hydrophilicdissolved NOM is to define them as the organic matter that is adsorbable and non-adsorbable,respectively, on XAD resins. A method developed by Thurman and Malcolm (1981) for theconcentration and fractionation of NOM used a two-column adsorption technique. The

18
columns contained XAD-8 and XAD-4 Amberlite non-functional resins and the methodallowed for the isolation and separation of both the hydrophobic acid fraction and thehydrophilic acid fraction. The two-column method and its variations are widely used in NOMcharacterization studies (Malcolm and MacCarthy 1992, Krasner et al. 1996, Martin-Moussetet al. 1997, Goslan et al. 2001, Maurice et al. 2002, Goslan et al. 2004, Sharp et al. 2006a, band c).
Adsorptive methods, like XAD-resin adsorption, usually do not isolate 100% of dissolvedorganic matter and subject the NOM to extreme pH levels. It is not known how the extremechanges in pH during isolation and fractionation procedures alter the structure and naturalreactivity of NOM (Crum et al. 1996). Resin fractionation is also quite time-consuming andcreates considerable amounts of hazardous waste. Still the preparative NOM fractionation andits modifications can be used as a basis for quantitative and qualitative organic analysis ofwater. Fractionation procedures generate specific organic solute fractions, which can be thenused for chemical and biological testing (Leenher 1981).
4.4.2 High-performance size-exclusion chromatography (HPSEC)
The fractionation of NOM by size exclusion chromatography (SEC), using particularlySephadex gels, was introduced in the 1960´s (Ferrari and Dell’Agnola 1963, Posner 1963,Gjessing 1965). The exclusion theory in SEC is primarily based on differences in molecularsize. When a sample is applied to the SEC column the components are eluted in order ofdecreasing molecular sizes (Nobili et al. 1989). However, these soft gels had some majordisadventages (Swift and Posner 1971, Gjessing 1973, Hine and Bursill 1984). The separationwas time consuming and resolution was poor. Thus, more modern techniques were developed(Fukano et al. 1978, Saito and Hayano 1979). The characterization of NOM by high-performance liquid chromatography (HPLC) applied with SEC column became possible withintroduction of rigid, silica or polymer based hydrophilic stationary phases (Fukano et al.1978, Saito and Hayano 1979, Miles and Brezonik 1983, Becher et al. 1985). High-performance size-exclusion chromatography (HPSEC) method is non-destructive, relativelyfast and requires no sample pre-treatment. It also utilizes only small amounts of sample(Rausa et al. 1991). Thus, the most extensively used method during the last decade formolecular size distribution (MSD) determination of NOM from different sources is apparentlyHPSEC (Becher et al. 1985, Kronberg et al. 1985, Vartiainen et al. 1987, Knuutinen et al.1988, Rausa et al. 1991, Hongve et al. 1996, Peuravuori and Pihlaja 1997, Miettinen et al.1998, Pelekani et al. 1999, Conte and Piccolo 1999a and 1999b, Nissinen et al. 2001,Myllykangas et al. 2002, Hurst et al. 2004, Murray and Parsons 2004, Sharp et al. 2006a,Goslan et al. 2006).
In earlier years the HPSEC measurements were criticized because there were undesirableeffects due to solute-gel interactions (Miles and Brezonik 1983). Nowadays column materialshave developed and bonded silica and polymeric gels have as few reactive sites as possible.Thus HPSEC has become more reliable for MSD analysis (Conte and Piccolo 1999b, Pelekaniet al. 1999). However, the HPSEC column gels might still have some charge repulsion effects(Chin and Gschwend 1991, Peuravuori and Pihlaja 1997) as well as adsorption interactionswith the organic compounds (Chin and Gschwend 1991, Myllykangas et al. 2002). Differentsilica-based and polymer-based columns are used in HPSEC measurements and MSDdeterminations of aquatic NOM. These include columns like TSK (Becher et al. 1985,Vartiainen et al. 1987, Hongve et al. 1996, Peuravuori and Pihlaja 1997, Her et al. 2002, Wuet al. 2003), Biosep (Conte and Piccolo 1999b), Shodex (Rausa et al. 1991, Hongve et al.
19
1996), and Waters-Protein-Pak 125 (Chin et al. 1994, Pelekani et al. 1999, Zhou et al. 2000,Her et al. 2002).
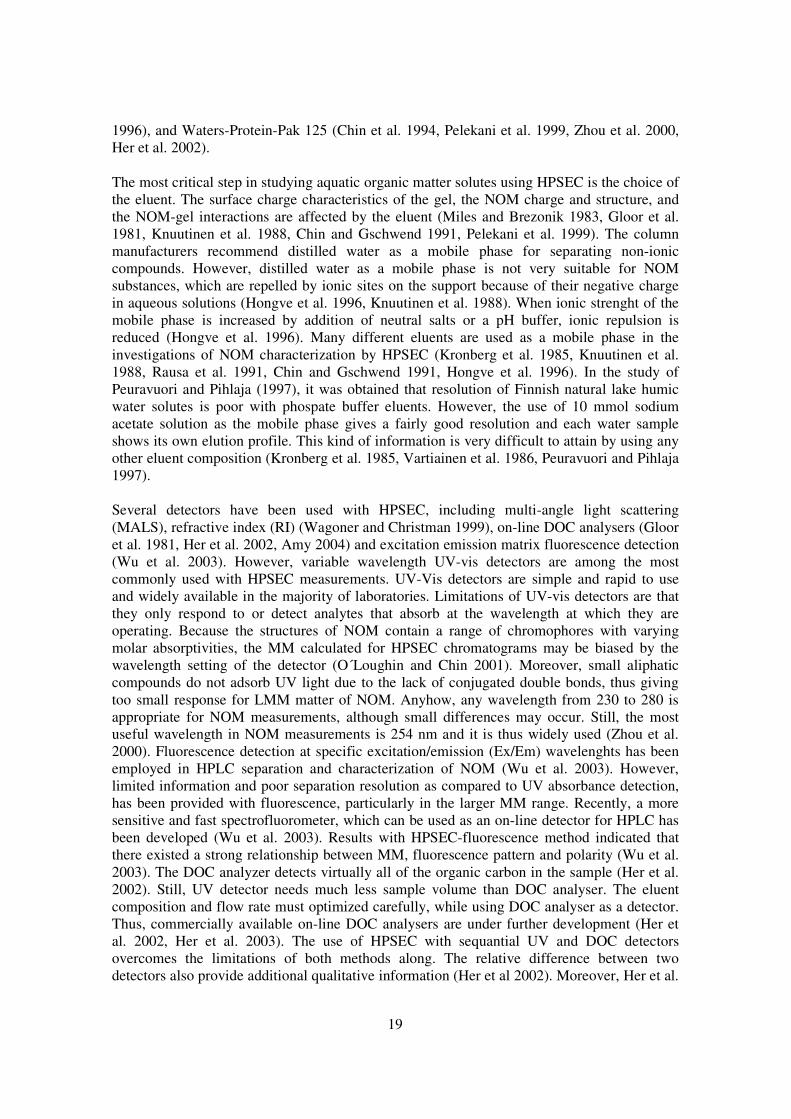
The most critical step in studying aquatic organic matter solutes using HPSEC is the choice ofthe eluent. The surface charge characteristics of the gel, the NOM charge and structure, andthe NOM-gel interactions are affected by the eluent (Miles and Brezonik 1983, Gloor et al.1981, Knuutinen et al. 1988, Chin and Gschwend 1991, Pelekani et al. 1999). The columnmanufacturers recommend distilled water as a mobile phase for separating non-ioniccompounds. However, distilled water as a mobile phase is not very suitable for NOMsubstances, which are repelled by ionic sites on the support because of their negative chargein aqueous solutions (Hongve et al. 1996, Knuutinen et al. 1988). When ionic strenght of themobile phase is increased by addition of neutral salts or a pH buffer, ionic repulsion isreduced (Hongve et al. 1996). Many different eluents are used as a mobile phase in theinvestigations of NOM characterization by HPSEC (Kronberg et al. 1985, Knuutinen et al.1988, Rausa et al. 1991, Chin and Gschwend 1991, Hongve et al. 1996). In the study ofPeuravuori and Pihlaja (1997), it was obtained that resolution of Finnish natural lake humicwater solutes is poor with phospate buffer eluents. However, the use of 10 mmol sodiumacetate solution as the mobile phase gives a fairly good resolution and each water sampleshows its own elution profile. This kind of information is very difficult to attain by using anyother eluent composition (Kronberg et al. 1985, Vartiainen et al. 1986, Peuravuori and Pihlaja1997).
Several detectors have been used with HPSEC, including multi-angle light scattering(MALS), refractive index (RI) (Wagoner and Christman 1999), on-line DOC analysers (Glooret al. 1981, Her et al. 2002, Amy 2004) and excitation emission matrix fluorescence detection(Wu et al. 2003). However, variable wavelength UV-vis detectors are among the mostcommonly used with HPSEC measurements. UV-Vis detectors are simple and rapid to useand widely available in the majority of laboratories. Limitations of UV-vis detectors are thatthey only respond to or detect analytes that absorb at the wavelength at which they areoperating. Because the structures of NOM contain a range of chromophores with varyingmolar absorptivities, the MM calculated for HPSEC chromatograms may be biased by thewavelength setting of the detector (O´Loughin and Chin 2001). Moreover, small aliphaticcompounds do not adsorb UV light due to the lack of conjugated double bonds, thus givingtoo small response for LMM matter of NOM. Anyhow, any wavelength from 230 to 280 isappropriate for NOM measurements, although small differences may occur. Still, the mostuseful wavelength in NOM measurements is 254 nm and it is thus widely used (Zhou et al.2000). Fluorescence detection at specific excitation/emission (Ex/Em) wavelenghts has beenemployed in HPLC separation and characterization of NOM (Wu et al. 2003). However,limited information and poor separation resolution as compared to UV absorbance detection,has been provided with fluorescence, particularly in the larger MM range. Recently, a moresensitive and fast spectrofluorometer, which can be used as an on-line detector for HPLC hasbeen developed (Wu et al. 2003). Results with HPSEC-fluorescence method indicated thatthere existed a strong relationship between MM, fluorescence pattern and polarity (Wu et al.2003). The DOC analyzer detects virtually all of the organic carbon in the sample (Her et al.2002). Still, UV detector needs much less sample volume than DOC analyser. The eluentcomposition and flow rate must optimized carefully, while using DOC analyser as a detector.Thus, commercially available on-line DOC analysers are under further development (Her etal. 2002, Her et al. 2003). The use of HPSEC with sequantial UV and DOC detectorsovercomes the limitations of both methods along. The relative difference between twodetectors also provide additional qualitative information (Her et al 2002). Moreover, Her et al.

20
(2003 and 2004) have analyzed organic matter samples with HPSEC-UV-fluorescence-DOCcombination, which detects highly efficiently different insights of NOM in the sample.However, this combination of detectors might not be economically possible in majority ofresearch laboratories.
MM of the organic matter fractions observed from the chromatogram can be determined usingstandards or ultrafiltration (UF) measurements (Pelekani et al. 1999, Ratnaweera et al. 1999a,Amy et al. 1987). The selection of the proper standards to characterize the MM of NOMfractions is determined by their hypothesized structure (Chin et al. 1994). A number ofinvestigators (Nissinen et al. 2001, Peuravuori and Pihlaja 1997, Vartiainen et al. 1987) haveused globular proteins as standards. However, it has been reported (Chin and Gschwend 1991,Reid et al. 1990, Beckett et al. 1987) that the proteins tend to over-predict the MM of NOMfractions by a factor of 5 or more. The use of random coil structure standards such aspolystyrene sulphonates (PSS) has lately been used in MM determinations (Swietlik et al.2002, O´Loughlin and Chin 2001, Zhou et al. 2000, Pelekani et al. 1999, Hongve et al. 1996).Although the NOM molecules may be random coil-like in shape, they may also be morebranched and cross-linked than PSS (Chin and Gschwend 1991). Still, the MM of NOMfractions measured by HPSEC under appropriate conditions are noticed to be comparable withthe values determined by established methods such as vapor pressure osmometry (VPO) andfield flow fractionation (FFF) (Pelekani et al. 1999, Chin et al. 1994)
4.4.3. Ultrafiltration (UF)
UF is a convenient procedure for fractionation of materials into different size ranges. NOMcan be separated into different nominal MM fractions and the separated fractions can becharacterized by other methods, e.g. TOC, UV or HPSEC (Gjessing 1973, Amy et al. 1987,Logan and Jiang 1990, Pelekani et al. 1999). UF is a membrane separation process used forconcentration and purification of macromolecular solutes and colloids. The solution is causedto flow under pressure across a membrane surface. Solutes and colloids are rejected at thesemi-permeable membrane barrier while solvents and micro solutes below the molecularweight cut-off (MWCO) pass through the membrane (Dickenson 1987). Migration ofmolecules through membranes is generally accomplished by a combination of adjective flowand molecular diffusion. The diffusivity of a molecule is primarily a function of molecularsize and secondarily of molecular shape. Smaller molecules diffuse more rapidly than largerones and spherical molecules more rapidly than linear ones of similar MM (Amy et al. 1987).In addition to molecular size, there are other factors that influence the diffusive and advectivetransport of organics through ultrafiltration membranes. These include membrane pore sizedistribution, water temperature, cell filtration pressure, solution pH and ionic strength, as wellas molecule shape and affinity for the different membrane materials (Amy et al. 1987, Loganand Jiang 1990, Ludwig et al. 1997). Membranes used are usually made of regeneratedcellulose or polyethenesulfone (Logan and Jiang 1990, Collins et al. 1986, Cai 1999). Eachmembrane has a characteristic nominal molecular weight cut-off (NMWCO) level, which isoperationally defined as the mass of a molecule whose retention is 90% on this membrane(Kuchler and Miekeley 1994). Commercial UF membranes are available with differentNMWCO, for example 500 g/mol, 1000 g/mol, 10 000 g/mol and 100 000 g/mol. The largeNMWCO membranes (> 3000 g/mol) are usually calibrated with proteins, while sugars andpolysaccharides are used in calibrating lower NMWCO membranes. As a result of differentstructures between NOM constituents and the standards used, the true size range for organiccompounds in NOM is not necessarily obtained (Pelekani et al. 1999). The choice ofmembrane can seriously affect the results. UF may yield results comparable with results

21
obtained by other methods, provided there is a proper choice of membrane (Egeberg et al.2002). A problem associated with the UF is that macromolecules can adhere to the sides ofthe membrane pores and markedly affect membrane permeability. An even more importantfactor is a flow restriction called concentration polarization. This is the deposition ofmacromolecules on the membrane surface, which results in a gel layer that becomes thedominant resistance to flow (Amy et al. 1987).
4.5 Other analytical methods
The different characteristics of NOM can be measured by a number of methods (Croue et al.2000). Elemental analysis provide general compositional information about NOM. Theaverage composition of the molecules can be determined by combustion or pyrolysis followedby final measurement e.g. pyrolysis/GC-MS (Huffman and Stuber 1985, Schulten 1999). Thefunctional group composition and some other structural features can be determined in severalways; potentiometric titration (Perdue 1985), solid state 13C nuclear magnetic resonance(NMR) spectroscopy (Mikita et al. 1981) and other spectroscopic methods like fluorescence,infrared (IR) and electron spin resonance (ESR) spectroscopy (MacCarthy and Rice 1985).
The “NOM-typing project” in Norway is screening a large number of methods for analysingand characterizing the properties of NOM in order to develop a protocol for the typing ofNOM (Gjessing et al. 1999, Abbt-Braun and Frimmel 1999, Frimmel and Abbt-Braun 1999,Gjessing et al. 1998).
Another approach for determining the properties of NOM are to investigate the potential ofNOM for DBP formation e.g. trihalomethane forming potential (THMFP) (Krasner et al.1996) or binding of NOM into the inorganic and organic micro-pollutants (Weber 1998, DePaolis and Kukkonen 1997, Mohan et al. 2000, Gjessing et al. 2007).

22
5. AIMS OF THE STUDY
The aim of the study was to monitor the drinking water purification process on full-scale atthe water treatment plants, as well as on pilot-scale. The purpose was to enhance theknowledge of removal of NOM in the different stages of the drinking water treatment train inorder to optimize and develop these processes. Particular attention was paid to the removal ofdifferent molecular size fractions of NOM (HMM, IMM and LMM fractions) by conventionaland advanced drinking water treatment methods. The efficient removal of NOM, andespecially the removal of IMM and LMM fractions of NOM, require either optimisation ofthe existing processes or investment in the additional advanced treatment units. In this studythe enhanced coagulation, ozonation, activated carbon (AC) filtration and membranetechniques were studied to improve NOM removal efficiency. Especially the varioustreatment techniques performance and optimisation in Finnish conditions, with high NOMcontent and temperature variation (0°-25°) was of interest. The characterisation of NOM helpsin the selection of proper treatment technologies.
The removal of NOM was determined with various methods. Besides the conventionalcharacterisation methods, like TOC, the aim of the study was to use HPSEC in routinemonitoring of the performance of the different treatment processes and also to determinewhether the HPSEC method, with UV254 detection, yielded any information on the processbeyond what could be gained by traditional analytical methods. The specific aims covered inthe present work are:
1. To study coagulation process in the NOM removal and how the removal can beenhanced by optimised coagulation and selection of the proper coagulant (Papers I andIII)
2. To study AC filtration and the effect of seasonal variation and time of regeneration onits efficiency (Paper II and IV).
3. To study ozonation and its effects on the efficiency of AC to remove NOM in thepurification process (Paper IV). Also to study biologically activated carbon (BAC) onthe NOM removal at the pilot-scale (Paper IV).
4. To study nanofiltration (NF) as the last removal stage of NOM after conventionaltreatment to obtain the enhancement of the removal of the residual LMM organicmatter in the treated water (Paper V).

23
6. MATERIALS AND METHODS
6.1 Tampere Waterworks; Rusko Water Treatment Plant
The Rusko Water Treatment Plant pumps its raw water from Lake Roine, seven kilometerssoutheast of the plant and produces 68% of the drinking water for the city of Tampere,Finland. The plant has a maximum treatment capacity of 55 000 m3/d and an average waterflow of about 1 400 m3/h.
The treatment process consists of lime and coagulant addition, flocculation and clarificationwith sedimentation (before modification) and flotation, chlorine dioxide disinfection, sandfiltration (after modification), AC filtration, and post-chlorination. The coagulant agent waschanged from aluminium sulphate to ferric sulphate during research period. Diagrams ofRusko Water Treatment Plant can be seen in Appendix 1 in Figures 1 and 2. More detailedinformation about the water purification processes during the studies can be found in Papers I,II and III.
6.1.1 AC filtration in the Rusko Water Treatment Plant
Rusko Water Treatment Plant has 14 AC filters, which are conventional one-layer filters.Each filter has a surface area of 30 m2 and a bed depth of about 115 cm. All similar instructure, the filters are so-called sand replacement filters, in which AC replaces sand. AC isregenerated every two years and changed after about three regenerations. In the first study(Paper I), one filter from sedimentation line (AC-A) and one from flotation line (AC-B) werestudied.
Because enhanced NOM removal was detected in the first study, some further investigationswere carried out with AC filters. In the second study (Paper II) the age and regenerationfrequency of the filters in respect to NOM removal was monitored. Four of the AC filterswere selected for the research. Table 1 in Paper II characterizes the filters used in this study.Filter A was of the type Aqva Sorb BG-09 and was regenerated twice. The type of the carbonsin filters B and C were Filtrasorb TL 820 and in filter D Filtrasorb 200. Carbons in filters Band D were changed to new ones before the study. Carbon in filter C was regenerated twiceand third regeneration was done during the study in May 2001 (Figure 6.1).

24
AC-A4/19985/2000
AC-B6/2000
AC-C4/19975/19995/2001
AC-D9/2000
AC-A4/19985/2000
AC-B4/19975/1999
water fromcoagulation/flocculation/sedimentation
water fromcoagulation/flocculation/flotation
water fromcoagulation/flocculation/flotation
(1) (2)
Figure 6.1 AC filters in Tampere Waterworks, Rusko Water Treatment Plant in (1) 8/1999-5/2000 and (2) 9/2000-9/2001 investigations, respectively. Time of AC replacement orregeneration is illustrated in the figure.
6.2 Oulu Waterworks; Hintta and Kurkelanranta Water Treatment Plants
Waterworks of Oulu, consisting of Hintta and Kurkelanranta Water Treatment Plants, wereobserved in the study concerning ozonation and AC filtration efficiency on NOM removal(Paper IV). The two plants produces drinking water for the city of Oulu, Finland. Raw wateris taken from River Oulu from about 4 meters depth and the two Water Treatment Plants aresituated on the opposite strands of the river. The capacities of the Treatment Plants are 900and 1200 m3/h for Kurkelanranta and Hintta, respectively. Treatment processes consists ofcoagulation with ferric sulphate, flocculation and flotation, sand filtration, ozonation,activated carbon filtration and disinfection (Kurkelanranta treatment process is illustrated inAppendix 1, Figure 3).
6.2.1 Ozonation in Hintta and Kurkelanranta Water Treatment Plants
The ozone dose in the full-scale treatment varied between 0.4 to 1.5 mg/l. Ozone feed washigher in the summer (0.9-1.5 mg/l) than in the winter (0.4-0.7 mg/l). Ozonation wasperformed primarily to enhance the biodegradability of NOM before AC filtration, but also toreduce the odour and taste problems as well as enhance possible pathogen removal.
6.2.2 AC filtration in Hintta and Kurkelanranta Water Treatment Plants
The performances of all four AC filters, in both Treatment Plants, were studied. The filters inKurkelanranta Treatment Plant were called AC-K1, AC-K2, AC-K3 and AC-K4. The filterswere in-line and water from the filter AC-K1 was filtered through AC-K2 and the water fromthe filter AC-K3 was filtered also through AC-K4 (Figure 6.1, see also Figure 3 in Appendix1). The first filter in-line was designed to act more as a biologically active AC filter (BAC)

25
and second as normal adsorption based AC process. The history of the carbons in the filterswas as follows: new carbon was placed on AC-K2 in November 2003 and the old carbon fromfilter AC-K2 was moved to AC-K1. Also during the study, in July 2005, carbon in filter AC-K2 was changed to new one and the old carbon was again moved to AC-K1. Regeneratedcarbon was changed on AC-K4 in July 2004, before the study was started, and the old carbonfrom filter AC-K4 was moved to AC-K3.
The filters in Hintta Treatment Plant were called AC-H1, AC-H2, AC-H3 and AC-H4 (Figure6.2). The filters were parallel and they were last regenerated or AC was changed to new asfollows: AC-H1 was changed in October 2000, AC-H2 was regenerated in July 2004, AC-H3was changed in September 2003 and AC-H4 was regenerated in September 2004.
AC-H110/2000
AC-H27/2004
AC-H39/2003
AC-H49/2004
AC-K1AC-K211/20037/2005
AC-K47/2004
AC-K3
(1) (2)
Figure 6.2 AC filters in Oulu Waterworks, (1) Kurkelanranta and (2) Hintta Water TreatmentPlants. The time of AC replacement or last regeneration is illustrated in the figure.
6.2.3 Pilot-scale ozonation
The pilot-scale experiments were performed at the Kurkelanranta Water Treatment Plant. Theozonation apparatus comprised ozone generator (Herrmann-laboratory-ozonator LO-50-1),continuous flow column (total volume 45 l; i.d. 0.17 m; height 2 m) and two AC filtrationcolumns (i.d. 0.25 m, height 1.5 m, carbon from the full-scale process from filters AC-K1 andAC-K2) (Figure 6.3). The AC columns were placed in-line as in the full-scale process atKurkelanranta Water Treatment Plant. The batch-test was conducted in a different column(total volume 10 l; i.d. 0.09 m; height 1.7 m). The water to the pilot was taken after chemicalcoagulation and flotation and sand filtration from the full-scale process (see Figure 3 inAppendix 1). Ozone containing gas was added at the bottom of the columns through a

26
ceramic diffuser. Ozone concentration in water varied between 0.3-1.2 mg O3/mg TOC(ozone feeding dose 2-7.5 mg O3/min).
The first phase of tests was conducted in a batch mode (volume of the column 10 l) withdifferent ozone doses. Other tests were carried out in continuous flow mode (volume 45 l) andthe water was lead through the system at 120-130 l/h. The contact time in ozonation was 18minutes and empty bed contact time (EBCT) of AC filters about 14 minutes per filter, overallresidence time being 28 minutes. Water samples were taken from feed water, ozonated waterand after the second AC filter.
Contactcolumn
AC 1
AC 2
O3
generator
sand filtratedwater fromfull-scaleprocess
Figure 6.3 A schematic picture of the pilot-scale ozonation apparatus
6.3 Other waterworks
Water samples from five different surface water treatment plants and one artificial groundwater treatment plant were collected in the NF study (Paper V). The surface water treatmentfacilities studied were Espoo, Tampere, Turku, Raisio-Naantali and Pietarsaari Waterworksand the artificial ground water treatment plant studied was Kotka Waterworks. Samples werecollected after a conventional water treatment train (coagulation/flotation and AC/sandfiltration), but before post-treatment (alkalization and disinfection). Ninety litres of eachsample was delivered to Lappeenranta University of Technology in filtration. The details ofthe treatment process in each studied water treatment plant are summarised in Table 2. inPaper V.

27
6.3.1 Pilot-scale nanofiltration (NF)
The study was carried out using a laboratory scale membrane filtration unit (Figure 6.4).Three cross-flow flat-sheet modules were run parallel with the same feed water. Themembrane area in each module was 46.0 cm2. The membranes studied in the parallelmembrane modules were Desal-5 DL, NF255 and NF270. The representative characteristicsof the membranes are presented in Table 1 in Paper V. All membranes were supplied as dry,rolled sheets and were stored as received at room temperature. More detailed informationabout the operation of NF process is given in Paper V.
Pressuremeter
Flow meter
Feed waterstorage tank Temperature
controlledfeed tank
High pressurepump
Flat-sheet membrane modules
Permeate
Adjustmentvalve
Retentatecirculation
Retentatedischarge
Figure 6.4 A schematic picture of the pilot-scale nanofiltration apparatus
6.4 Analysis
6.4.1 Sampling procedure
Samples were taken from the following stages of the treatment sequence: 1) raw water, 2)water after coagulation/flotation 3) water after different AC filters and 4) combined purewater from all AC filters before it was pumped in to the distribution system (Papers I, II, IIIand IV). In Hintta and Kurkelanranta Water Treatment Plants samples were taken also afterozonation. Basic water analyses were done at the same day as sampling. The 10 ml sampleswere collected and frozen until analysed with HPSEC and UV254.

28
6.4.2 Basic water analysis at Rusko Water Treatment Plant
UV254 absorbance was measured with a spectrophotometer. The raw water sample and thesamples after flotation and sedimentation were centrifuged before UV measurement. TOCsamples were filtered through 0.45 µm membrane and they were measured as DOC accordingto the SFS-EN 1484 standard and by using a Shimadzu TOC-5000A with a high sensitivitycatalyst. The total organic material was measured by the KMnO4 oxidation method accordingto the Finnish Society of Food Science and Technology guidelines. Hardness, alkalinity,turbidity and colour were measured according to the SFS 3003/-87, SFS 3005/-81, SFS-ENISO 7027/-00 and SFS-EN 7887/part 4/-95 standards, respectively.
6.4.3 Basic water analysis at Hintta and Kurkelanranta Water Treatment Plants
The basic water quality parameters were measured in the laboratory of the Oulu Waterworks,at Hintta Water Treatment Plant. TOC samples were measured according to the FinnishStandard SFS-EN 1484/-97 and by using a Shimadzu TOC-Vcph. Total organic material wasmeasured by the KMnO4 oxidation method according to the Finnish Standard SFS 3036/-81.Turbidity and colour were measured according to the Finnish Standards SFS-EN ISO 7027/-00 and SFS-EN ISO 7887/-95, respectively.
The content of assimilable organic carbon (AOC) was measured in National Public HealthInstitute, Kuopio, according to the modified method (Miettinen et al. 1999) of the standard byAPHA et al. (1992). In the AOC analyses maximum growth of Pseudomonas fluorescens P17and Aquaspirillum NOX in the water samples were transformed into the amount of AOC.Inorganic nutrients were added into the samples (N, P, K, etc.) to ensure that microbialgrowth in water samples was not limited by inorganic nutrients.
6.4.4 HPSEC measurements
The HPSEC samples were first filtered through a Gelman 0.45 µm membrane and then size-exclusion fractionated with a Hewlett-Packard HPLC 1100-series system, equipped with adiode array UV detector (λ=254) and a TSKgel G3000SW 7.5mm(ID) x 30 cm column. Pre-column was not used. Sodium acetate (0.01 M) was used as an eluent at a flow rate of 1ml/min. Injection volume was 30 �l. The method was selected on the basis of results fromearlier investigations (Kronberg et al. 1985, Vartiainen et al.1987, Peuravuori and Pihlaja1997, Vuorio et al. 1998, Nissinen et al. 2001).
Heights of the peaks in the HPSEC chromatogram were used in the data analysis. The heightof the peak refers to the amount of NOM in a specific molecular size fraction with a peakhaving the lowest retention time referring to the highest MM fraction of NOM and peakhaving the highest retention time to the lowest MM fraction of NOM. The sum of all peakheights (SOPH) represents the total amount of NOM in the sample.
The HPSEC method was evaluated by ultrafiltration. Stirred cell (Amicon, model 8400) wasused in UF experiments with membranes characterized by NMWCO of 500, 1000, 3000,5000, 10 000 and 30 000 g/mol (membranes YC05, PLAC, PLBC, PLCC, PLGC and PLTK;Millipore). Conductivity, TOC, UV254 and HPSEC of the fractions obtained from the processwere measured. Apparent molar masses (AMM) of the peak fractions in the HPSECchromatogram were roughly estimated using UF (Ratnaweera et al.1999a). The membranerejection in this study was considered using a method presented by Logan and Jiang (1990).

29
Figure 6.5 shows the remaining NOM after various UF membranes measured as the reductionof the heights of the peaks in the HPSEC chromatogram. The retention of the molecules in UFdepends on the pore size distribution of the membranes as well as the characteristics of themolecules, mainly the molecular volumes. Thus, the retention of the molecules on themembrane is not sharp but, for instance, the membrane with NMWCO value of 30 000 g/molretains molecules from all size ranges as can be seen in Fig. 6.5. The membrane cutoff valuesare usually defined as the mass of a molecule whose retention is 90% on this membrane.When this retention value of 90% is applied to different peaks in the HPSEC chromatogram,the following approximate AMMs for the different peaks can be presented 5 500 g/mol, 4 000g/mol, 3 500 g/mol, 2 000 g/mol and 500 g/mol for peaks I, II, III, IV and V, respectively.Because the individual peaks in the chromatogram do not present sharply just moleculeshaving one definite size, the more accurate way is to present the AMM ranges rather than thespecific MM. The ranges are >5 000 g/mol, 4 000-5 000 g/mol, 3 000-4 000 g/mol, 1 000-3000 g/mol and 500-1 000 g/mol for peaks I, II, III, IV and V, respectively.
0 %
10 %
20 %
30 %
40 %
50 %
60 %
70 %
80 %
90 %
100 %
100 1000 10000 100000
Apparent molecular weight (Da)
Rem
aini
ngof
peak
heig
hts
afte
rva
riou
sU
Fm
embr
anes
I II III IV V
Figure 6.5 The remainder of NOM after various UF membranes measured as the reduction ofthe heights of the peaks (I, II, III, IV and V) in HPSEC chromatogram.
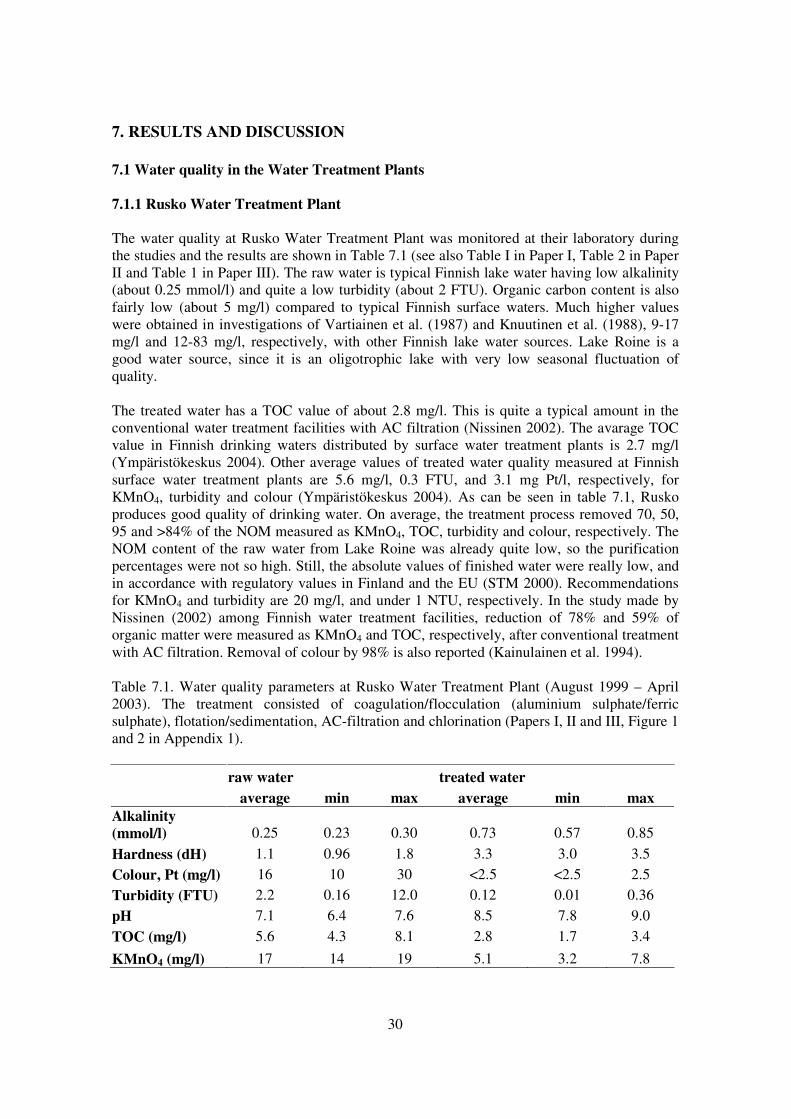
30
7. RESULTS AND DISCUSSION
7.1 Water quality in the Water Treatment Plants
7.1.1 Rusko Water Treatment Plant
The water quality at Rusko Water Treatment Plant was monitored at their laboratory duringthe studies and the results are shown in Table 7.1 (see also Table I in Paper I, Table 2 in PaperII and Table 1 in Paper III). The raw water is typical Finnish lake water having low alkalinity(about 0.25 mmol/l) and quite a low turbidity (about 2 FTU). Organic carbon content is alsofairly low (about 5 mg/l) compared to typical Finnish surface waters. Much higher valueswere obtained in investigations of Vartiainen et al. (1987) and Knuutinen et al. (1988), 9-17mg/l and 12-83 mg/l, respectively, with other Finnish lake water sources. Lake Roine is agood water source, since it is an oligotrophic lake with very low seasonal fluctuation ofquality.
The treated water has a TOC value of about 2.8 mg/l. This is quite a typical amount in theconventional water treatment facilities with AC filtration (Nissinen 2002). The avarage TOCvalue in Finnish drinking waters distributed by surface water treatment plants is 2.7 mg/l(Ympäristökeskus 2004). Other average values of treated water quality measured at Finnishsurface water treatment plants are 5.6 mg/l, 0.3 FTU, and 3.1 mg Pt/l, respectively, forKMnO4, turbidity and colour (Ympäristökeskus 2004). As can be seen in table 7.1, Ruskoproduces good quality of drinking water. On average, the treatment process removed 70, 50,95 and >84% of the NOM measured as KMnO4, TOC, turbidity and colour, respectively. TheNOM content of the raw water from Lake Roine was already quite low, so the purificationpercentages were not so high. Still, the absolute values of finished water were really low, andin accordance with regulatory values in Finland and the EU (STM 2000). Recommendationsfor KMnO4 and turbidity are 20 mg/l, and under 1 NTU, respectively. In the study made byNissinen (2002) among Finnish water treatment facilities, reduction of 78% and 59% oforganic matter were measured as KMnO4 and TOC, respectively, after conventional treatmentwith AC filtration. Removal of colour by 98% is also reported (Kainulainen et al. 1994).
Table 7.1. Water quality parameters at Rusko Water Treatment Plant (August 1999 – April2003). The treatment consisted of coagulation/flocculation (aluminium sulphate/ferricsulphate), flotation/sedimentation, AC-filtration and chlorination (Papers I, II and III, Figure 1and 2 in Appendix 1).
raw water treated wateraverage min max average min max
Alkalinity(mmol/l) 0.25 0.23 0.30 0.73 0.57 0.85
Hardness (dH) 1.1 0.96 1.8 3.3 3.0 3.5
Colour, Pt (mg/l) 16 10 30 <2.5 <2.5 2.5
Turbidity (FTU) 2.2 0.16 12.0 0.12 0.01 0.36
pH 7.1 6.4 7.6 8.5 7.8 9.0
TOC (mg/l) 5.6 4.3 8.1 2.8 1.7 3.4
KMnO4 (mg/l) 17 14 19 5.1 3.2 7.8

31
In this study no significant seasonal variations were noticed in measured values at thedifferent stages of the treatment process. Minor variation was observed in the study (Paper II)conducted on the performance of AC filters. Detailed information about the seasonal variationof UV254, TOC, KMnO4 and HPSEC results in Rusko Water Treatment Plant is presented inFigure 2. a-f in Paper I.
7.1.2 Hintta and KurkelanrantaWater Treatment Plants
The chemical characteristics of the raw and treated water at Hintta and Kurkelanranta WaterTreatment Plants during the study are presented in Table 7.2. The purification process in Ouluremoved NOM measured as TOC efficiently; the removal of TOC was 84%. KMnO4,turbidity and colour were reduced by approximately 70%, 94% and >84%, respectively. Theraw water temperature was very low in wintertime (0 °C) compared to summer (about 19 °C).
Table 7.2. Water quality at Hintta and Kurkelanranta Water Treatment Plants (December2004-August 2005). The treatment consisted of coagulation/flocculation (ferric sulphate),flotation, sand filtration, ozonation, AC-filtration and disinfection (Paper IV, Figure 3 inAppendix 1).
Raw Water Treated Water
Average min max Average Average
HINTTA KURKELANRANTA
Temperature °C 8 0 19
Colour mg/l Pt 87 60 140 <5 <5
pH 6.8 6.3 7.0 8.5 8.4
KMnO4 mg/l 51 42 74 3,9 3,2
TOC mg/l 12.2 10.0 17.2 2.0 2.1
Abs. 254nm* 1/m 49.7 38.6 70.9 1.8 1.8
Turbidity NTU 2.37 0.56 7.70 0.17 0.15
* measured 1.1.-30.6.2005
Even as the TOC value in raw water of Oulu (12.2 mg/l) was twice as high than in Tampere(5.6 mg/l), the finished water in Oulu had lower TOC concentration than Tampere; 2.0 mg/lvs. 2.8 mg/l, respectively.
At Hintta and Kurkelanranta Water Treatment Plants, the quality of raw water from RiverOulu fluctuated during the seasons. The highest values of the quality parameters weremeasured in the spring, (during April and May), when the river was flooding and the lowestduring the wintertime (Table 7.2). The catchment area of River Oulu is large (22 900 km2)(Wikipedia 2006). This causes increase in flow and an increase in organic matterconcentration during snow melting and heavy rains. Moreover, the catchment area of RiverOulu is rich with peatland and agriculture, thus increasing the amount of NOM in water(Wikipedia 2006). The increase in organic matter and turbidity may be controlled by adjustingthe coagulant dose. Both Water Treatment Plants in Oulu produce high quality drinkingwater, which meets Finnish and European standards for distributed drinking water (STM2000). According to literature (Sharp et al. 2006b) a number of UK and US water utilities

32
have reported about the same problems connected with the increased DOC levels duringautumn and winter periods, which results in a higher coagulant demands.
7.2 NOM removal at different stages in the treatment process based on DOC and otherconventional quality parameters; A254nm and turbidity
At Rusko Water Treatment Plant, the organic matter, measured as DOC, was removed withapproximately 51-59% efficiency (Papers I, II and III) after the entire treatment train. It wasshown that DOC reduced more efficiently with ferric sulphate compared to that withaluminium sulphate as a coagulation agent (Paper III, Table 2). Enhancement of removal was13% after the flotation and 9% after the entire treatment process. According to the literature(Lovins et al. 2003) the iron-based coagulants have been shown to remove approximately 10-15% more DOC than the aluminium-based coagulants, with maximum DOC removal valuesreaching 77% for ferric and 65% for aluminium sulphate. Our results are in agreement withthese results. The removal of NOM, based on DOC, was about 20% lower than measured asA254nm (and HPSEC). This indicates that the NOM that contains structures capable ofadsorbing UV light, i.e. large aromatic compounds, was removed effectively. Smalleraliphatic compounds which do not absorb UV light due to the lack of conjugated doublebonds are not properly shown by the UV254 measurements.
Turbidity, on the other hand, was removed about 7% more efficiently with aluminiumsulphate than with ferric sulphate, considering the entire treatment process; 93% and 86%respectively. Aluminium sulphate is reported to be more efficient in turbidity removal thanferric sulphate also in the jar-test study by Tuhkanen et al. (2004). The turbidity of the Ruskoraw water was the lowest in the winter, 0.2 NTU, but turbidity was found to increase in thecoagulation/flotation process in the wintertime (Figure 5 in Paper III). However, the increasein turbidity was compensated by the effective removal of turbidity in the sand filtration stagefollowing the flotation stage in the full-scale process. According to literature (Budd et al.2004), a shift to a higher optimum pH for turbidity removal was reported to occur in coldwater period. Because of this shift, the effective removal of both turbidity and DOC areharder to gain (Budd et al. 2004). After several jar-test studies (Morris and Knocke 1984,Haarhoff and Cleasby 1988), ferric coagulants have been found to be less sensitive to lowtemperatures than aluminium in regard of turbidity removal, although the flocs formed duringcold temperature conditions are smaller than those produced in higher temperatures also withferric coagulants (Hurst et al. 2004). This was, however, not confirmed by the jar-test study ofTuhkanen et al. (2004). They found that aluminium sulphate was performing better than ferricsulphate in cold water, which is also in agreement with our present study. The reason for thesimilar observations might be that the results were obtained by using the water from LakeRoine, as in the full-scale process studied in this thesis.
7.3 NOM characterization and removal at different stages in the treatment processbased on HPSEC-UV254 measurements
7.3.1 The MSD of NOM in the raw water
Five to seven different peaks were found in the HPSEC chromatograms of the raw watersstudied as can be seen in Figure 7.1 (see also Figure 3 in Paper I, Figure 2 in Paper II, Figure2 in Paper III and Figure 2 in Paper IV). Similar patterns of peaks of raw waters wereobserved also in other studies concerning Finnish surface waters (Vartiainen et al. 1987,Kainulainen et al. 1994, Vuorio et al. 1998, Nissinen et al. 2001). According to our study, the

33
SEC profile was dominated by highest MM fractions in both raw water supplies (Figure 7.1).However, in River Oulu HMM (>4000 g/mol) and IMM (4000-1000 g/mol) matter were moreabundant and the concentration of NOM as sum of peak heights (SOPH) was higher than inLake Roine (on average 33.6 mAU vs. 10.7 mAU). Thus there is a significant differencebetween river and lake water as raw water supplies. The amount of NOM is much higher inriver water. Nissinen et al. (2001) noticed the same phenomenon in their study, and suggestedthat sedimentation of the large molecules within lakes might be one explanation for this. Thewater flow in rivers probably prevents the sedimentation of large molecules. Moreover, thecatchment area of River Oulu is rich with peatland, thus increasing the load of NOM in RiverOulu water (Wikipedia 2006).
Figure 7.1. HPSEC chromatograms of the raw water from Lake Roine (blue) and River Oulu(red).
7.3.2 The effect of chemical coagulation on the MSD of NOM
Studies at Rusko Water Treatment Plant (Papers I, II, III) indicated that chemical treatmentfollowed by flotation or sedimentation removed the MM fraction >5000 g/mol completely andthe MM fraction 4000-5000 g/mol almost completely (over 90%). Thus the organic matter atthe size range of >4000 g/mol (HMM) was effectively removed. Flotation seemed to besomewhat more efficient than sedimentation especially in the removal of HMM matter. Alsoat Hintta and Kurkelanranta Water Treatment Plants, almost all of the HMM matter wasremoved during coagulation with ferric sulphate followed by flotation (Paper IV). HMMmatter removal was 98% in coagulation/flotation. No further removal was noticed in thefollowing process stages. It has been noticed in several investigations that high removal ratesof HMM compounds occur during coagulation (Vuorio et al. 1998, Chow et al. 1999,Nissinen et al. 2001, Parsons et al. 2002, Tuhkanen et al. 2004, Sharp et al. 2006a).
Change of coagulant from aluminium to ferric sulphate in the full-scale process at RuskoWater Treatment Plant had a significant effect on the removal of the NOM on size fraction of3000-4000 g/mol (Figure 7.2) (Paper III). The long-term investigation (August 1999-May

34
2002) show that 55-50% of NOM of this size fraction was removed from water incoagulation/flotation process when aluminium was used as coagulant (Papers I, II and III).Ferric sulphate coagulation removed 83% of MM fraction of 3000-4000 g/mol. Thus, thisfraction was removed 28% more efficiently with ferric sulphate than with aluminiumsulphate. Ferric sulphate coagulation removed MM fraction of 1000-3000 g/mol about 20%more efficiently. Hence the overall removal of the IMM matter (size range 1000-4000 g/mol)was 65% with ferric sulphate as coagulant, which is about 25% more efficient than withaluminium sulphate. According to several studies (Crozes et al. 1995, Bell-Ajy et al. 2000,Lindqvist et al. 2002, Lindqvist et al. 2004, Tuhkanen et al. 2004), the selection of coagulantparticularly affected the removal of the IMM of NOM; Ferric salts were noticed to be onaverage 15% more effective than aluminium salts especially in removing the NOM fractionwith MM less than 4000 g/mol.
Most of the IMM compounds were removed in Kurkelanranta and Hintta during coagulation,especially the MM fraction 3000-4000 g/mol, of which 90% was removed duringcoagulation/flotation. After all purification steps in the treatment plant the removal of this sizefraction (3000-4000 g/mol) was 94%. The MM fraction 1000-3000 g/mol was not removed aseffectively by coagulation. Only 55% of this fraction was removed after coagulation/flotation.The overall removal percent of this IMM fraction (1000-4000 g/mol) in treated water was80%. Although the removal percentages of NOM in Oulu were higher than in Rusko duringcoagulation, the organic matter content measured as sum of peak heights (SOPH) was nearlyequal after coagulation at both plants, especially with ferric sulphate as a coagulant agent. Itcan be concluded that even though Oulu had more organic matter in the raw water, bothplants were able to remove the NOM to equal level.
In Rusko, the removal of the LMM matter (< 1000 g/mol) was very poor with both aluminiumand ferric sulphate. Only about 10% of the LMM matter was removed from water after thecoagulation process with both coagulants (Figure 7.2). In Oulu, the removal of LMMcompounds was also marginal, only 6-13% was removed in coagulation/flotation. Theremaining organic matter after coagulation in the water is observed to be of LMM rangingabout 500-700 g/mol also by Chow et al. (1999). This LMM fraction is very hard to removeby coagulation. Parsons et al. (2002) has demonstrated that LMM fraction of NOM consistsprimarily of hydrophilic molecules, which were hard to remove (16% removal). Hydrophobicfraction of NOM was effectively removed. According to the jar-tests of Lindqvist et al.(2002), Tuhkanen et al. (2004) and Lindqvist et al. (2004) the LMM fraction was not removedany better even when the process was optimised in regard to NOM removal. However, in thestudy made by Lindqvist et al. (2004), almost 40% removal of the smallest MM fraction wasobtained when polyelectrolytes were used as coagulation aids.

35
0
20
40
60
80
100
120
>5000 4000-5000 3000-4000 1000-3000 <1000 SOPH
Rem
oval
ofN
OM
inco
agul
atio
n/fl
otat
ion
in% Aluminium Iron
Figure 7.2. Different MM fractions of NOM (according to the HPSEC measurements)removed after coagulation/flotation process with aluminium sulphate (May 2001-May 2002)and ferric sulphate (June 2002-April 2003) as the coagulation agent at the Rusko WaterTreatment Plant. Results are in percentages compared to the raw water results, and calculatedas averages.
7.3.3 The effect of ozonation on the MSD of NOM
The ozone dose feed in the full-scale treatment at Oulu Waterworks, Hintta and KurkelanrantaWater Treatment Plants, varied between 0.4 to 1.5 mg/l. Ozone feed was higher in thesummer (0.9-1.5 mg/l) than in the winter (0.4-0.7 mg/l). The HMM matter and the moleculeslarger than 3000 g/mol were not affected by ozonation, although in some cases the ozonationwas observed to increase the amount of HMM fraction. This fraction increased particularly inwinter and spring. This might be explained by polymerization of organic molecules duringozonation while using lower ozone doses. The same phenomenon was observed also in thepilot-scale studies (see chapter 7.5). Nevertheless, ozonation removed particularly the lowestMM compounds. The removal of the IMM matter fractions with size range of 3000-4000g/mol and 1000-3000 g/mol, respectively, enhanced from 89% to 93% and from 52% to 75%;total NOM removal after coagulation/flotation vs. after ozonation. The sand filtration aftercoagulation/flotation did not improve the removal of NOM, but sometimes even increased theamount of especially HMM NOM. The ozonation was obtained to remove effectivelyespecially the IMM NOM at full-scale treatment process by the study of Vuorio et al. (1998)in Helsinki Waterworks. However, in Oulu Waterworks, the LMM compounds were removedthe most effectively, from only 7-16% removed after coagulation/flotation to 38-49% removalduring ozonation. Thus, the removal of NOM was more effective in the LMM fraction than inthe HMM fraction. Still, this might be because the ozonated water included low amounts ofHMM matter left to be degradated, while IMM and LMM matter was more abundant aftercoagulation/flotation.

36
The better removal of LMM NOM in comparison with HMM matter is contradictory toliterature, since ozone is said to remove primarily HMM substances and convert them to theLMM compounds (Langlais et al. 1999). However, a strong decrease in UV absorption hasbeen noticed to occur in earlier studies (Kainulainen et al. 1995, Miettinen et al. 1998,Myllykangas et al. 2002, Myllykangas et al. 2003). This indicates that NOM is degraded intosmall MM compounds, which do not have any chromophores capable of UV absorption at254 nm; the same as used as detection wavelength in our HPSEC measurements. Accordingto the study by Kasprzyk-Hondern et al. (2005), the chromatograms of ozonated NOMrecorded at 220 nm indicate an increase in UV220 absorbance of molecules with MM lowerthan 200 g/mol (LMM). This can be connected with the decomposition of the HMM fractionsof NOM and also to the subsequent formation of LMM by-products. Moreover, in previousstudies made by Miettinen et al. (1998) and Lehtola et al. (2001), ozonation caused a majorincrease in the content of assimilable organic carbon (AOC), which indicates also that organicmatter has been converted into smaller compounds. In full-scale process at Hintta andKurkelanranta the AOC was noticed to rise during ozonation to little over 100 µg/l to as highas over 250 µg/l. Still, the AOC was removed efficiently in the AC filtration following pre-ozonation (Iivari 2006). Similar results were observed in the study of Lehtola et al. (2001),where ozonation was noticed to increase the AOC concentration in the various full-scaleprocesses studied to the level of over 200 µg/l and in one case almost to 400 µg/l. In the samestudy by Lehtola et al (2001), it was noticed that ozonation did not change the concentrationof TOC in full-scale treatment with ozone dose of 1.0-2.0 mg O3/l. The greatest decreasewhich was noticed was 0.2 mg/l TOC, which is in good agreement with our results (measuredTOC values were 2.3 mg/l and 2.0 mg/l, respectively, before ozonation and at treated water).
7.3.4 The effect of AC filtration on the MSD of NOM
In the water treatment train of Rusko Water Treatment Plant, AC filtration could not removeany more of the HMM substances but was feasible in reducing the amount of the IMM andthe LMM matter (Tables 2 and 3 in Paper I, Figures 3 and 5 in Paper II). The removal ofNOM after the coagulation/flocculation followed by AC filtration was over 90% for theHMM matter. The total removal percentages for different MM fractions were about 68%, 41-53%, and 38-51% for fractions 3000-4000 g/mol, 1000-3000 g/mol and 500-1000 g/mol,respectively, after AC. Similar removal percentages were achieved in the study of Nissinen etal. (2001). Swietlik et al. (2002) noticed that a part of the NOM present in the raw water wasaffected by ClO2 oxidation. The oxidation may have caused a break up of the larger moleculesto smaller ones (Swietlik et al. 2004). These LMM molecules were more polar in nature, andthus did not adsorb well on AC. This might explain the poor removal of the MM fractions<500 g/mol also in this study. Moreover, the LMM fraction of NOM was noticed tooccasionally increase in Rusko, especially during summer months. In some cases, the lowestMM peak fraction emerged only after AC fitration (Paper II). It was concluded that thisincrease might be the decomposition or metabolic products of the bacteria living in the filters(Vuorio et al. 1998, Boulam et al. 2003).
The NOM removal capacity of the AC filters is reduced with the aging. This was shown alsoin the study of Vahala (1995). In our study it was observed that the regeneration of the ACfilters improves the efficiency considerably, nearly 50%. Table 7.3 shows the removalcapacity improvement of regenerated filters at Rusko Water Treatment Plant. After aboutthree months operation the NOM removal capacity of the filters reverted almost to the samelevel as before regeneration. Other studies have indicated that the efficiency after reactivation

37
is equal to or superior to virgin AC (Hyde et al. 1987, Oxenford and Lykins 1991). Theremoval of different MM fractions after regeneration varied slightly.
Table 7.3. Enhancement of the capacity of filters AC-A in Paper I and filter AC-C in Paper IIto remove different MM fractions of NOM. Values are calculated comparing the average ofthe HPSEC values measured two months before and right after the regeneration.
MM fractions g/molfilters >5000 4000-5000 3000-4000 1000-3000 500-1000 <500AC-A 0 50 56 65 67AC-C 0 38 64 61 49 14
At both Hintta and Kurkelanranta Water Treatment Plants there is an ozonation stage prior toAC filtration. In Kurkelanranta, the AC filters were in-line, so that the first filter in-line wasdesigned to act as a biological filter and the second one as adsorption filter (Paper IV). TheNOM removal in AC filtrations at Hintta and Kurkelanranta Water Treatment Plants was alsodependent on the prior use of the different AC filters. The AC regeneration interval was about2-3 years.
In Hintta and Kurkelanranta Water Treatment Plants, the best removal rates with regard to ACwere observed on the MM ranges of 1000-3000 g/mol, and <1000 g/mo (LMM). The NOMremoval capacity of the filters with well used AC were on average 6%, 4% and 9% for theHMM, IMM and LMM matter, respectively, compared to the values after ozonation. The totalremoval after AC was 99%, 87% and 55%, respectively. One filter (AC-K2) was regeneratedduring the study and its removal efficiency was improved dramatically right afterregeneration. The removal percentages, compared to ozonation, were 68%, 76% and 83% forHMM, IMM and LMM matter, respectively; total removal being 100%, 97% and 93%,respectively. According to literature (McCreary and Snoeyink 1980), the LMM matter wasnoticed to be more amenable for adsorption than the HMM organic matter due to the sizeexclusion effect, which was seen also in this study. On the other hand, ozonation before ACfiltration also increases the biodegradability of NOM and hence the removal of NOM by ACmight be explained more by biodegradation than adsorption (Langlais et al. 1991). Theremoval capacity was slightly higher during summer months, and especially on LMM fractionof NOM, thus indicating some biological activity on the filters. This finding is supported alsoby the pilot-scale experiments conducted (Paper IV). The results of pilot-scale experimentsare summarized in chapter 7.4. There was an increase in AOC after ozonation, depending onthe dose. Also in the full-scale process at Hintta and Kurkelanranta, the AOC was noticed toincrease during ozonation (Iivari 2006). Still the AC filtration at both plants was effective inremoval of the formed AOC concentrations.
7.3.5 The removal of NOM during the entire treatment process
A summary of the percentage removal of the different MM fractions during the treatmentprocesses at Rusko, Hintta and Kurkelanranta Water Treatment Plants are shown in Tables 1,2 and 3, respectively, in Appendix 2. The HMM matter was removed from the water inpurification processes by over 95%. This was the case at all Water Treatment Plants studied.The treated water contained some IMM (4000-1000 g/mol) organic matter. Average removalof 46-68% and 87% was detected in Rusko and Oulu, respectively. However, the mostdifficult to remove was the LMM (<1000 g/mol) organic matter; 38-46% and 60% at Ruskoand Oulu, respectively, were removed. It is noteworthy that the substantially higher removal

38
efficiency of NOM in Oulu Waterworks is explained by the two times higher initial DOCconcentration of raw water; 5.6 mg/l vs. 12.2 mg/l. However, the amount of NOM in treatedwater measured as DOC was higher at Rusko than in Oulu, 2.8 mg/l and 2.0 mg/l,respectively. Likewise, the sum of peak height (SOPH) of treated water was slightly higher inRusko, thus implicating that the treatment process in Oulu is more efficient in regard of NOMremoval. In comparison to Rusko, the removal of NOM was more efficient during theozonation followed by AC filtration, as in Oulu, than during AC filtration along. Oneexplanation for the lower DOC and SOPH values of treated water in Oulu, than in Tampere,might be this difference in treatment processes.
7.4 The effect of ozonation and AC filtration on NOM according to the pilot-scale study
7.4.1 TOC and other conventional quality parameters
Pilot-scale ozonation and AC filtration experiments were conducted at Kurkelanranta WaterTreatment Plant. The water to the pilot came from full-scale process after chemicalcoagulation/flotation and sand filtration, where practically all the HMM matter and most ofthe IMM matter were already removed. More information on the test is given in the Paper IV.The addition of ozone was done in a continuous flow reactor with four different ozone dosesand with two stages AC filtration. The ozone doses in different test runs were 0.5 mg/l, 1.4mg/l, 2.9 mg/l and 4.0 mg/l. Samples were collected from the feed water, the ozonated waterand the AC filtered water after the second AC filter. The contact time with ozone in thecolumn was 18 minutes and EBCT 14 min in both AC filters; total of 28 min .
During the test, UV254 absorbance was clearly decreased, as the ozone dose was increased.AC filtration after the ozonation removed UV absorbing compounds even further and thegreatest reduction after AC (56%) was noticed with the highest ozone dose, which was 4.0mg/l; over twice as high as in full-scale treatment (1.5 mg/l). The total amount of NOM,measured as the SOPH in HPSEC, was reduced by 45%.
The reduction of TOC in the pilot-scale ozonation experiment was small. In the feed waterthe amount of TOC varied from 2.3 mg/l to 2.5 mg/l. After the ozonation the TOC value was2.3 mg/l and after the activated carbon filtration about 2.0 mg/l, the same as in treated waterafter full-scale treatment. Thus, the approximate TOC reduction in ozonation was 4% and inAC filtration 13%.
7.4.2 AOC concentrations
The AOC concentration determines the assimilable carbon content available for microbes.AOC was observed to increase as the ozone dose was increased. With the smallest ozone dose(0.5 mg/l), two-fold AOC values were measured. The maximum AOC (0.36 mg/l) wasachieved with a very high ozone dose of 4.0 mg/l (2.4 mg O3 /mg TOC). The amount of AOCwas ten times higher than in the original feed water sample (0.038 mg/l) (Figure 7 in PaperIV). The higher AOC concentrations were obtained with Aquaspirillum NOX than withPseudomonas Fluorescence P17. Similar observation has been made also in other studies(Langlais et al. 1991). However, according to Langlais et al. (1991), the maximum AOCproduction was reached by a specific amount of ozone, after which no more increase in AOCoccurred (suggestion for the limit of AOC production was 1.5-2.0 mg O3 /mg TOC).Nevertheless, the increase of AOC in ozonation depends not only on the TOC concentration,

39
but also on the raw water quality and especially the character of organic matter present inwater (Langlais et al. 1991).
Although the amount of AOC was high after the ozonation, the AC filtration removed theAOC content very efficiently. About 74% of the AOC was removed by AC filter with thelower ozone doses and 88% with the highest ozone dose (Figure 7 in Paper IV). According tothe study by Lehtola et al. (2002) the AC filtration removed 23% of TOC and 85% of AOCconcentration in water.
7.4.3 HPSEC results
The first ozonation test was conducted as a batch test (Ozone feeding 0.34 mgO3/min, 1.36mgO3/min and 3.9 mgO3/min; sampling with time intervals of 2min, 5min, 10 min and 20min). The amount of NOM was reduced in nearly all of the MM fractions when ozone dosewas increased, but moreover when ozone contact time with studied water was increased.However, quite opposite phenomena occured in the fraction of 4000-5000 g/mol (HMMfraction) (Figure 5 in Paper IV). The HMM matter was noticed to increase from time to time;especially with the lowest ozone doses (values were compared to the feed water). This can beexplained by polymerization of organic matter during ozonation. Hence, some by-productswith higher UV absorption capacity might have been produced during ozonation. Certainmolecules are resistant to the action of ozone or they may be transformed into products thatremain nonbiodegradable (Langlais et al. 1991). In other earlier studies (Ho et al. 2002, Boseet al. 1994) it has been noticed that the amount of HMM (measured as TOC and UV-absorbance) also increased in some cases.
In the second part of the test, the addition of ozone was done in a continuous flow reactorwith four different ozone doses (0.5 mg/l, 1.4 mg/l, 2.9 mg/l and 4.0 mg/l) and with twostages AC filtration. With the lowest ozone dose of 0.5 mg/l, the reduction of NOM waslower, but the following AC filtration was more effective, especially when the removal of theLMM fraction was considered (Figure 6 in Paper IV). The higher ozone doses (1.4 mg/l-4.0mg/l) resulted in higher removal of NOM on every MM fraction. However, the AC was notable to remove the NOM any further (Figure 6 in Paper IV). The ozonation with higher ozonedoses might have converted the NOM to the compounds with higher polarity and solubility.Hence they are unable to adsorb on to the AC and the removal of NOM by AC is reduced(Chang et al. 1995). Moreover, the HMM fraction increased slightly after the ozonation withthe lowest ozone doses, indicating possible polymerization of organic matter. Samephenomenon was also observed in the full-scale process, with ozone doses 0.4 mg/l - 0.7 mg/l(wintertime), as well as in the batch test.
7.5 The effect of NF on the removal of NOM according to the pilot-scale study
The efficiency of different nanofiltration (NF) membranes to remove various watercomponents, including NOM, from chemically pre-treated water samples, was studied inpilot-scale (Paper V). The membranes studied were Desal-5 DL, NF255 and NF270. Sixdifferent feed waters from five surface water treatment plants and one artificial ground watertreatment plant were collected. Samples were taken after conventional water treatment train,but before post-treatment (alkalinization and disinfection). In general, considering all thedifferent membranes studied, 49-100% removal of the remaining organic matter afterconventional treatment was obtained. The removal was in the most cases above 60%.Removal of the different molecular size fractions varied between 56-100%, 54-100% and 19-

40
88%, regarding the HMM, the IMM and the LMM organic matter, respectively. The bestremoval capacity was performed with “Desal-5 DL” membrane. Figure 7.3 summarizes theNOM removal capacities of the different NF filters studied. The NOM removal efficiency ofthe NF process according to the HPSEC measurements in detail can be seen in Table 4 inPaper V.
0
10
20
30
40
50
60
70
80
90
100
Desal-5 DL NF 255 NF 270
Rem
oval
ofN
OM
(%)
HMM IMM LMM All together
Figure 7.3. Removal of the different MM fractions of NOM during NF filtration with variousmembrane types studied. Values are averages from results on all the water treatment facilities(Espoo, Tampere, Turku, Kotka, Raisio-Naantali, and Pietarsaari).
The removal efficiencies of organic matter as DOC and UV254 by different NF membraneswere in general 47-100% (see Table 5 in Paper V) of the remaining organic matter inchemically pretreated waters. Several studies indicate that the NF is very effective in removalof organic matter from a variety of feed waters: DOC removals of 60-95%, UV254 removals of60-99% and DBP precursor removals of 41-100% have been reported (Amy et al. 1990,Chellam 2000, Schäfer et al. 2000, Siddiqui et al. 2000, Liikanen 2006). The NF was alsofound, by the study of Tuhkanen et al (1994), to be a highly effective method to removeprecursors of adsorbable organic halogens (AOX), mutagenicity as well as organic matter,colour and turbidity; the removal was 88%, 85%, 68%, 90% and 68%, respectively. It wasnoticed in the study by Liikanen et al. (2003) that although NF performed high bacteria andorganic matter removals, remarkable potential for microbial growth was showed in NFpermeate waters. Thus, post-chlorination with minor chlorine dosages is needed to suppressmicrobial growth in distribution systems (Liikanen et al. 2003).
When considering the performance of an NF membrane one should bear in mind that the aimis to achieve the required drinking water quality with the lowest possible costs. Accordingly,the membrane with the highest NOM removal capacity may not always be the best choice, asother membrane may result in sufficiently high water quality at a lower cost due to a higherproductivity (Liikanen 2006).

41
7.6 Evaluation of the performance of HPSEC-UV254 in the measurement of NOM duringwater treatment process
The sizes of different chemical fractions of NOM are found to influence various aspects ofNOM behaviour in water treatment. While NOM contains different molecular sizes, theHPSEC-UV254 method was able to clearly separate up to seven MM fractions present inFinnish surface water samples, hence giving the samples a “fingerprint” of organic matter.The HPSEC-UV254 method proved to be highly informative in measuring the transformationof molecular size distribution (MSD) of NOM during the different water treatment processes.The reduction and increase of these fractions during water treatment clearly demonstrates thetreatment process performance efficiency, with regard of apparent sizes of NOM fractions.The bulk parameters, like TOC or UV-absorbance, can give information about the totalconcentration of NOM, but not any specific knowledge of different fractions of NOM.However, if these, and other basic water quality parameters (like colour or KMnO4), are usedin combination with the HPSEC-UV254 method, the performance of unit operations could beeffectively monitored. Moreover, HPSEC-UV254 is a method which effectively characterizesaquatic NOM samples with no prior concentration or fractionation, thus leaving the sampleunaltered. Also, the HPLC apparatus, and especially with UV detector, is relatively commonin research and water quality laboratories, thus lowering the costs involved in using thismethod.
With HPSEC analysis, the compounds present in water sample can be roughly identified todifferent MM size ranges but the different charged groups of NOM can not be separated.Charge load originating from each fraction of NOM has been shown to vary and the majorityof the charge load has been noticed to come from the hydrophobic fraction of NOM (Sharp etal. 2006c). The hydrophilic and hydrophobic fractions of NOM, as well as humic and fulvicacid fractions, can be roughly separated by resin fractionation, although the method is quitetime consuming and labourous. On the contrary, by the separation with SEC, the fractionwith HMM includes humic acids, as well as other HMM compounds. Likewise, LMMfraction, can conclude fulvic acids, as well as other LMM organic compounds. Hence, thereare also other rapid methods under investigation for characterization of NOM, e.g.fluorescence spectroscopy (Goslan et al. 2004).
The limitations of the HPSEC method include the use of UV254 absorption as detectionmethod, thus under estimating the amounts of LMM organic matter with less UV-absorptivechromophores. Still, the UV254 is widely used and accepted for the measurements of NOM.Moreover, the charge repulsion and adsorption of column material with organic compoundsstudied are possible. In spite of these limitations, the column used in this study (TSKG30000SW), was able to separate efficiently different molecular size fractions from aquaticNOM samples. A similar column and other measurement parameters, as in our study, havebeen used for several years with good results. It has been reported to highlight the changes ofaquatic NOM in a highly visual manner (Kronberg et al. 1985, Vartiainen et al. 1987,Kainulainen et al. 1994, Peuravuori and Pihlaja 1997, Vuorio et al. 1998, Miettinen et al.1998, Nissinen et al. 2001, Myllykangas et al. 2002, Hurst et al. 2004). Especially the Finnishresearchers have used this method in various water quality investigations. Thus, thecomparison of results, gained from various studies, is possible, hence giving valuableinformation for Finnish water treatment facilities.

42
8. CONCLUSIONS
During the last two decades there have been huge investments in the improvement of drinkingwater quality. Still there is a pressure to further improve the quality and safety of drinkingwater. The most obvious solution would be the enhancement of the performance of theexisting processes; coagulation, flocculation and filtration. There are also unit operations forthe enhanced removal of NOM and possible micro-pollutants from water; membranetechniques as well as ozidation of organic matter followed by assimilation by micro-organisms. If the NOM in the raw water cannot be removed by conventional unit operations,the use of additional advanced and/or innovative processes are unavoidable. However,particularly the small waterworks don´t have resources to invest in additional unit operationsfor NOM removal. Thus, the enhancement of NOM removal and stable drinking water qualityshould be obtained also by process optimization and raw water source selection andprotection.
The full-scale study of NOM removal during water treatment included three surface watertreatment plants; Rusko Water Treatment Plant in Tampere (Papers I, II and III) and Hinttaand Kurkelanranta Water Treatment Plants in Oulu (Paper IV). All of the studied plantsproduced high quality drinking water, although the amount of raw water NOM in Oulu,measured as TOC and SOPH, was twice as high as in Tampere. Waterworks of Oulu usedriver water (River Oulu) as raw water source, while in Tampere raw water source was LakeRoine.
In the treatment processes studied, the removal efficiencies of the different molecular sizefractions of NOM varied significantly. The removal of the HMM matter was sufficient,almost 100%. The IMM and the LMM NOM were more difficult to remove than the HMMmatter (Papers I, II, III and IV).
The coagulation was effective in the removal of the HMM matter and reasonably effective inthe IMM matter removal. However, in the removal of the smallest molecular size fractions ofNOM, the coagulation was ineffective, only about 3-25% of this fraction was removed. Theselection of a proper coagulant for a particular raw water used was very important. Thereplacement of alum coagulant with a ferric coagulant at Rusko Water Treatment Plantenhanced the removal of NOM by 10%. Especially the removal of the IMM fraction wasimproved; as much as by 25% (Paper III).
The AC filtration improved the reduction of the NOM most effectively in the IMM organicmatter fraction. The IMM NOM removal was enhanced by about 30% (Papers II and III). Thereduction of the HMM matter was insignificant. LMM matter was removed poorly, dependingon the particular AC. On the contrary, the LMM matter was noticed to even increase fromtime to time, especially during summer months (Paper II). This increase might be due tomicrobiological activity and release of metabolites from the filter bed. The effectiveness ofthe AC filtration to remove NOM depended primarily on the regeneration history of theparticular filter (Papers I, II, III and IV). On average, the highest removal rates were observedfor the NOM molecules in the size range of < 3000 g/mol, especially when the AC was newor recently regenerated. In Oulu Waterworks, there was an ozonation step prior to ACfiltration, thus altering the NOM to more biodegradable form. The AC filters in Oulu weremore effective in removing LMM matter during summer, thus indicating that there mighthave been some biological activity on the filters (Paper IV).

43
Ozonation in the full-scale treatment in Oulu Waterworks (Paper IV) removed primarily thelower molar mass compounds. The IMM fraction of size range 1000-3000 g/mol and theLMM matter of size range > 1000 g/mol were further decreased by 23% and 32%,respectively, during ozonation. The HMM matter was either unaltered or increased. Thereason for the increase was suggested to be the polymerization of NOM and by-productsproduced during ozonation. This phenomenon was observed primarily in wintertime whenozonation dose was lower. Same was noticed to occur also during pilot-scale study with lowdoses of ozone. Moreover, ozonation removed primarily the LMM matter also in the pilot-scale studies. The amount of HMM compounds were almost constant, while the amount ofIMM and LMM matter was decreased. This is contradictory to previous studies, whereozonation is said to remove primarily the HMM matter and degrade it to the LMMcompounds. Nevertheless, according to the AOC measurements, the available assimilableorganic matter to microbes increased from 0.030 mg AOC /l to 0.1-0.3 mg AOC /l when theozone dose was increased. Hence, the NOM was degraded into smaller compounds. It can beconcluded that in the ozonation, the NOM was degraded into very small compounds, with noor little conjugated double bonds and, thus, not showing in the HPSEC-UV254 measurements.In spite of the high AOC concentration produced in the ozonation, the AC filtration after theozonation efficiently removed the AOC from water. The amount of TOC was reduced onlyslightly during the ozonation, even with the highest ozone doses. TOC was reduced from 2.3mg/l to 2.0 mg/l; being almost equal in full-scale as in pilot-scale investigations.�
NF removed residual NOM highly effectively (Paper V). High removal percentages aftertraditional pre-cleaning gave very high quality drinking water. The residual HMM NOM wasalmost completely removed and IMM matter diminished considerably. Also the LMM matterremoval was improved. The membrane quality: “Desal-5 DL” membrane gave the bestresults. The removal of NOM measured as both TOC and UV254 was also improved.
In spite of its limitations, HPSEC-UV254 proved to be a very informative method in themonitoring of the performance of the different treatment processes. It provided usefulinformation on the MSD of NOM in the water sample fast and relatively easily. Compared totraditional methods like TOC, it yielded additional information about the removal andespecially about the transformation of the MSD of NOM during the treatment train. TOCmeasurements could not give information about the quality of NOM, only about quantity, andfor example the amount of the biodegradable fraction which comprises mainly LMM organicmatter was difficult to predict in finished drinking water. The HPSEC-UV254 methodproduced especially valuable information of the performance of advanced techniques toremove the residual, IMM and LMM organic matter. Hence, the HPSEC-UV254 can be usedas a routine analysis method in combination with the basic water quality measurements inwater treatment plants in the follow-up of the performance and optimization of unitoperations.

44
9. REFERENCES
Abbt-Braun, G. and Frimmel, F. 1999. Basic characterization of Norwegian NOM samples- similarities anddifferences. Environment International. 25 :161-180
Aiken, G. R. 1984. Evaluation of ultrafiltration for determining molecular weight of fulvic acid. EnviromentalScience and Technology. 18:978-981
Aiken, G. R. 1985. Isolation and concentration techniques for aquatic humic substances. In: Aiken, G.,McKnight, D., Wershaw, R. and MacCarthy, P. (eds) Humic substances in soil, sediment and water. John Wiley& Sons. pp. 363-385
Aiken, G. and Cotsaris, E. 1995. Soil and hydrology: Their effect on NOM. Journal of American Water WorksAssociation. 87:36-45
Aiken, G. and Malcolm, R. 1997. Molecular weight of aquatic fulvic acids by vapor pressure osmometry.Geochimica et Cosmochimica Acta. 51:2177-2184
Amirtharajah, A. and O’Melia, C. 1990. Coagulation processes: destabilization, mixing and flocculation. In:Water Quality and Treatment: a handbook of Community Water Supplies. 4th Ed. McGraw Hill, Inc., New Yorkpp. 269-308
Amy, G., Collins, M., Kuo, C. and King, P. 1987. Comparing gel permeation chromatography and ultrafiltrationfor the molecular weight characterization of aquatic organic matter. Journal of American Water WorksAssociation. 79:43-49
Amy, G., Alleman, B., and Cluff, B. 1990. Removal of dissolved organic matter by nanofiltration. Journal ofEnvironmental Engineering. 116:200-205
Amy, G. L., Tan, L. and Davis, M. K. 1991. The effects of ozonation and activated carbon adsorption ontrihalomethane speciation. Water Research. 25:191-202
Amy, G. L., Sierka, R. A., Bedessem, J., Price, D. and Tan, L. 1992. Molecular size distributions of dissolvedorganic matter. Journal of American Water Works Association. 84:67-75
Amy, G. 2004. Size exclusion chromatography (SEC) with multiple detectors: a powerful tool in treatmentprocess selection and performance monitoring. . In: NOM research: Innovation and applications for drinkingwater treatment, Victor Harbor, Australia, March 2-5, pp. 7-10
APHA, American Public Health Association. 1992. Standard methods for the examination of water andwastewater. 18th edition. Eds. Greenberg A. E., Clesceri L. S. and Eaton E. D. Victor Graphics, Inc. Baltimore,USA
Backlund, P. 1990. Mutagenic activity and chlorinated by-products in disinfected waters. Doctoral thesis.Department of Organic Chemistry, Åbo Akademi.
Becher, G., Carlberg, G. E., Gjessing, E. T., Hongslo, J. K. and Monarca, S. 1985. High-performance sizeexclusion chromatography of chlorinated natural humic water and mutagenicity studies using microscalefluctuation assay. Envioronmental Science and Technology.19:422-426
Beckett, R., Jue, Z. and Giddings, J. 1987. Determination of molecular weight distributions of fulvic and humicacids using flow field-flow fractionation. Environmental Science and Technology. 21:289-295
Bell-Ajy, K., Abbaszadegan, M., Ibrahim, E., Verges, D. and LeChevallier, M. 2000. Conventional andoptimized coagulation for NOM removal. Journal of American Water Works Association. 92:44-58
Boere, J. 1992. Combined use of ozone and granular activated carbon (GAC) in potable water treatment; Effectson GAC quality after reactivation. Ozone Science & Engineering. 14:123-137

45
Bolto, B., Dixon, D., Eldridge, R., Kinf, S. and Linge, K. 2002a. Removal of natural organic matter by ionexchange. Water Research. 36:5057-5065
Bolto, B., Dixon, D., Eldridge, R. and King, S. 2002b. Removal of THM precursors by coagulation or ionexchange. Water Research. 36:5066-5073
Bose, P., Bezbarua, B. K. and Reckhow, D. A. 1994. Effect of ozonation on some physical and chemicalproperties of aquatic natural organic matter. Ozone Science & Engineering. 16:89-112
Boualam, M., Fass, S., Saby, S., Lahoussine, V., Cavard, J., Gatel, D. and Mathieu, L. 2003. Organic matterquality and survival of coliforms in low-nutritive waters. Journal of American Water Works Association.95:119-126
Braghetta, A. DiGiano, F. and Ball, W. 1997. Nanofiltration of natural organic matter: pH and ionic strengtheffect. Journal of Environmental Engineering. 123:628-640
Budd, G. C., Hess, A. F., Shorney-Darby, H., Neemann, J. J., Spencer, C. M., Bellamy, J. D. and Hargette, P. H.2004. Coagulation applications for the new treatment goals. Journal of American Water Works Association.96:102-113
Cai, Y. 1999. Size distribution measurements of dissolved organic carbon in natural waters using ultrafiltrationtechnique. Water Research. 33:3056-3060
Cannon, F., Snoeyink, V., Lee, R., Dagois, G. and DeWolfe, J. 1993. Effect of calcium in field-spent GACs onpore development during regeneration. Journal of American Water Works Association. 85: 76-89
CCC (Chlorine Chemistry Council). 2003. Drinking water chlorination. A review of disinfection practices andissues. Internet access: http://c3.orf (Cited on 26.11.2006)
Chang, E. E., Tiao, H. H., Ko, Y. W. and Chiang, P. C. 1995. Effects of preozonation on activated carbon andadsorption of organic precursors. Water Supply. 13:177-182
Chellam, S. 2000. Effects of nanofiltration on trihalomethane and haloacetic acid precursor removal andspeciation in waters containing low concentrations of bromide ion. Environmental Science and Technology.34:1813-1820
Chiang, P., Chang, E. and Liang, C. 2002. NOM characteristics and treatabilities of ozonation processes.Chemosphere. 46:929-936
Childress, A. and Elimelech, M. 1996. Effects of solution chemistry on the surface charge of polymeric reverseosmosis and nanofiltration membranes. Journal of Membrane Science. 119:253-268
Chin, A and Berube, P. R. 2005. Removal of disinfection by-product precursors with ozone-UV advancedoxidation process. Water Research. 39:2136-2144
Chin, Y. and Gschwend, P. 1991. The abundance, distribution and configuration of porewater organic colloids inrecent sediments. Geochimica et Cosmochimica Acta. 55:1309-1317
Chin, Y., Aiken, G. and O’Loughlin, E. 1994. Molecular weight, polydispersity and spectroscopic properties ofaquatic humic substances. Environmental Science and Technology. 28:1853-1858
Chin, Y., Aiken, G. and Danielsen, K. 1997. Binding of pyrene to aquatic and commercial humic substances: therole of molecular weight and aromaticity. Environmental Science and Technology. 31:1630-1635
Cho, J., Amy, G. and Pellegrino, J. 1999. Membrane filtration of natural organic matter: Initial comparison ofrejection and flux decline characteristics with ultrafiltration and nanofiltration membranes. Water Research.33:2517-2526
Chow, C., Leeuwen van, J., Drikas, M., Fabris, R., Spark, K. and Page, D. 1999. The impact of the character ofnatural organic matter in conventional treatment with alum. Water Science and Technology. 40:97-104

46
Collins, M., Amy, G. and Steelink, C. 1986. Molecular weight distribution, carboxylic acidity and humicsubstances content of aquatic organic matter: Implications for removal during water treatment. EnvironmentalScience and Technology. 20:1028-1032
Conte, P. and Piccolo, A. 1999a. Conformational arrangement of dissolved humic substances. Influence ofsolution composition on association of humic molecules. Environmental Science and Technology. 33:1682-1690
Conte, P. and Piccolo, A. 1999b. High pressure size exclusion chromatography (HPSEC) of humic substances:Molecular sizes, analytical parameters and column performance. Chemosphere. 38:517-528
Croue, J.-P., Korshin, G. V. and Benjamin, M. 2000. Characterization of natural organic matter in drinkingwater. AWWA research foundation and American Water Works Association, Denver, Colorado, 324 p.
Crozes, G., White, P. and Marshall, M. 1995. Enhanced coagulation: its effect on NOM removal and chemicalcosts. Journal of American Water Works Association. 87:78-89
Crum, R. H., Murphy, E. M. and Keller, C. K. 1996. A non-adsorptive method for the isolation and fractionationof natural dissolved organic carbon. Water Research. 30:1304-1311
Danielsson, L. G. 1982. On the use of filters for distinguishing between dissolved and particulate fractions innatural waters. Water Research. 16:179-182
Dawrowska, A., Swietlik, J. and Nawrocki, J. 2003. Formation of aldehydes upon ClO2 disinfection. WaterResearch. 37:1161-1169
De Paolis, F. and Kukkonen, J. 1997. Binding of organic pollutants to humic and fulvic acids: Influence of pHand the structure of humic material. Chemosphere. 34:1693-1704
Dickenson, C. 1987. Filters and filtration handbook. pp. 483-485
Drikas, M., Morran, J. Y., Cook, D. and Bursill, D. B. 2004. Comparison of MIEX© treatment and coagulationon NOM character. In: NOM research: Innovation and applications for drinking water treatment, Victor Harbor,Australia, March 2-5, pp. 59-64
Edzwald, J. 1993. Coagulation in drinking water treatment: particles, organics and coagulants. Water Scienceand Technology. 27:11:21-35
Edzwald, J. and Tobiason, J. 1999. Enhanced coagulation: US requirements and a broader view. Water Scienceand Technology. 40:63-70
Egeberg, P., Christy, A. and Eikenes, M. 2002. The molecular size of natural organic matter (NOM) determinedby diffusivimetry and seven other methods. Water Research. 36:925-932
Eikebrokk, B., Vogt, R. D. and Litved, H. 2004. NOM increase in Northern European source waters: impacts oncoagulation/contact filtration processes. In: NOM research: Innovation and applications for drinking watertreatment, Victor Harbor, Australia, March 2-5, pp. 21-25
El-Rehaili, A. and Weber, W. Jr. 1987. Correlation of humic substance trihalomethane formation potential andadsorption behavior to molecular weight distribution in raw and chemically treated waters. Water Research.21:573-582
Escobar, I. and Randall, A. 2001. Assimilable organic carbon (AOC) and biodegradable dissolved organiccarbon (BDOC): complementary measurements. Water Research. 35:4444-4454
Fan, L., Harris, J., Roddick, F. and Booker, N. 2001. Influence of the characteristics of natural organic matter onthe fouling of microfiltration membranes. Water Research. 35:4455-4463

47
Fearing, D. A., Banks, J., Guyetand, S., Eroles, C. M., Jefferson, B., Wilson, D., Hillis, P., Campbell, A. T. andParsons, S. A. 2004. Combination of ferric and MIEX® for the treatment of a humic rich water. Water Research.38:2551-2558
Ferrari, G. and Dell’Agnola, G. 1963. Fractionation of organic matter of soil by gel filtration. Soil Science.96:418-421
Fettig, J. 1999. Removal of humic substaces by adsorption/ion exchange. Water Science and Technology.40:173-182
Frimmel, F. and Abbt-Braun, G. 1999. Basic characterization of reference NOM from central Europe-similarities and differences. Environment International. 25:191-207
Fukano K., Komiya, K., Sasaki, H. and Hashimoto, T. 1978. Evaluation of new supports for high-pressureaqueous gel permeation chromatography: TSK-gel SW type columns. Journal of Chromatography. 166:47-54
Ghosh, K. and Schnitzer, M. 1980. Macromolecular structures of humic substances. Soil Science. 129:266-276
Gjessing, E. T. 1965. Use of Sephadex gels for estimation of humic substances in natural water. Nature(London). 208:1091-1092
Gjessing, E. T. 1973. Gel- and ultramembrane filtration of aquatic humus: a comparison of the two methods.SchweizerischeZeitschrift fur Hydrologie. 35:286-294
Gjessing, E., Alberts, J., Bruchet, A., Egeberg, P., Lydersen, E., McGown, L., Mobed, J., Munster, U.,Pempkowiak, J., Perdue, M., Ratnaweera, H., Rybacki, D., Takacs, M. and Abbt-Braun, G. 1998. Multi-methodcharacterization of natural organic matter isolated from water: characterization of reverse osmosis-isolates fromwater of two semi-identical dystrophic lakes basins in Norway. Water Research. 32:3108-3124
Gjessing, E., Egeberg, P. and Hähedal, J. 1999. Natural organic matter in drinking water- the NOM-typingproject, background and basic characteristics of original water samples and NOM isolates. EnvironmentInternational. 25:145-159
Gjessing, E., 2003. Short term and long term changes and variation in quality. Extended abstract submitted to theworkshop on changes in quality and quantity of dissolved NOM; Causes and Consequences, Atna 21-23 May2003. In NT Technical report available at http://www.nordtest.org/register/techn/tclickon.htm (Cited on11.6.2004).
Gjessing, E. T., Steiro, C., Becher, G. and Christy, A. 2007. Reduced analytical availability of polychlorinatedbiphenyls (PCB’s) in coloured surface water. Chemosphere. 66:644-649.
Glaze, W. H., Kang, J. W. and Chapin, D. H. 1987. The chemistry of water treatment processes involving ozone,hydrogen peroxide and ultraviolet radiation. Ozone Science & Engineering. 9:335-352
Glaze, W. H., Beltran, F., Tuhkanen, T. and Kang, J.-W. 1992. Chemical models of advanced oxidationprocesses. Water Pollution Research. J. Canada. 27:23-42
Gloor, R., Leidner, H., Wuhrmann, K. and Fleichmann, T. 1981. Exclusion chromatography with carbondetection. A tool for further characterization of dissolved organic carbon. Water Research. 15:457-462
Gorenflo, A., Velázquez-Padron, D. and Frimmel, F. H. 2002. Nanofiltration of German groundwater of highhardness and NOM content: performance and costs. Desalination. 151:253-265
Goslan, E., Fearing, D., Banks, J., Wilson, D., Hillis, P., Campbell, A. and Parsons, S. 2001. Seasonal variationin the disinfection by-product precursor profile of a reservoir water. AWWA WQTC, November 2001,Nashville, USA.
Goslan, E. M., Voros, S., Banks, J., Wilson, D., Hillis, P., Campbell, A. T. and Parsons, S. A. 2004. A model forpredicting dissolved organic carbon distribution in a reservoir water using fluorescence spectroscopy. WaterResearch. 38:783-791

48
Goslan, E. H., Gurses, F., Banks, J. and Parsons, S. A. 2006. An investigation into reservoir NOM reduction byUV photolysis and advanced oxidation processes. Chemosphere. 65:1113-1119
Gregor, J. E., Nokes, C. J. and Fenton, E. 1997. Optimising natural organic matter removal from low turbiditywaters by controlled pH adjustment of aluminum coagulation. Water Research. 31:2949-2958
Haarhoff, J. and Cleasby, J. L. 1988. Comparing aluminium and iron coagulants for in-line filtration of coldwater. Journal of American Water Works Association. 80:168-175
Hammann, D., Bourke, M. and Topham, C. 2004. Evaluation of a magnetic ion exchange resin to meet DBP regsat the village of Palm Springs. Journal of American Water Works Association. 96:46-50
Hatcher, P. and Spiker, E. 1988. Selective degradation of plant biomolecules. In: Frimmel, F. and Christman, R.(eds) Humic substances and their role in the environment. John Wiley & Sons. pp. 59-74
Hayes, M., MacCarthy, P., Malcolm, R. and Swift, R. 1989a. The search for the structure: Setting the scene. In:Hayes, M., MacCarthy, P., Malcolm, R. and Swift, R. (eds) Humic Substances II. In search of Structure. JohnWiley & Sons. pp. 4-30
Hayes, M., MacCarthy, P., Malcolm, R. and Swift, R. 1989b. Structures of humic substances: The emergence of‘forms’. In: Hayes M., MacCarthy P., Malcolm R. and Swift R. (eds) Humic Substances II. In search ofstructure. John Wiley & Sons. pp. 690-731
Heijman, S. G. J., van Paassen, A. M., van der Meer, W. G. J. and Hopman, R. 1999. Adsorptive removal ofnatural organic matter during drinking water treatment. Water Science and Technology. 40:183-190
Her, N., Amy, G. and Jarusutthirak, C. 2000. Seasonal variations of nanofiltration (NF) foulants: identificationand control. Desalination. 132:143-160
Her, N., Amy, G., Foss, D., Cho, J., Yoon, Y. and Kosenka, P. 2002. Optimization of method for detecting andcharacterizing NOM by HPLC- size exclusion chromatography with UV and on-line DOC detection.Environmental Science and Technology. 36:1069-1076
Her, N., Amy, G., McKnight, D., Sohn, J. and Yoon, Y. 2003. Characterization of DOM as a function of MW byfluorescence EEM and HPLC-SEC using UVA, DOC and fluorescence detection. Water Research. 37:4295-4303
Her, N., Amy, G., Park, H.-R. and Song, M. 2004. Characterizing algogenic organic matter (AOM) andevaluating associated NF membrane fouling. Water Research. 38:1427-1438
Hine, P. and Bursill, D. 1984. Gel permeation chromatography of humic acid: Problems associated withsephadex gel. Water Research. 11:1461-1465
Ho, L., Newcombe, G. and Croué, J.-P. 2002. Influence of the character of NOM on the ozonation of MIB andgeosmin. Water Research. 36:511-518
Hong, S. and Elimelech, M. 1997. Chemical and physical aspects of natural organic matter (NOM) fouling ofnanofiltration membranes. Journal of Membrane Science. 132:159-181
Hongve, D., Baann, J. and Becher, G. 1996. Characterization of humic substances by means of high-performancesize exclusion chromatography. Environment International. 22:489-494
Hooper, S., Summers, S., Solarik, G. and Owen, D. 1996. Improving GAC performance by optimisedcoagulation. Journal of American Water Works Association. 88:107-120
Huck, P. 1990. Measurement of biodegradable organic matter and bacterial growth in drinking water. Journal ofAmerican Water Works Association. 82:78-86

49
Huffman, Jr. E. and Stuber, H. 1985. Analytical methodology for elemental analysis of humic substances. In:Aiken, G., McKnight, D., Wershaw, R. and MacCarthy, R. (eds) Humic substances in soil, sediment and water.John Wiley & Sons. pp. 433-455
Hurst, A. M., Edwards, M. J., Chipps, M., Jefferson, B. and Parsons, S. A. 2004. The impact of rainstorm eventson coagulation and clarifier performance in potable water treatment. Science of the Total Environment. 321:219-230
Hyde, R., Hill, D., Zabel, T. and Burke, T. 1987. Replacing sand with GAC in rapid gravity filters. Journal ofAmerican Water Works Association. 79: 33- 38
Iivari, J.-P. 2006. Developement of ozonation in Oulu Water’s water treatment plants. Diploma Thesis.University of Oulu, Department of Process and Environmental Engineering.
Jacangelo, J., DeMarco, J., Owen, D. and Randtke, S. 1995. Selected processes for removing NOM: anoverview. Journal of American Water Works Association. 87:64-77
Jarvis, P., Jefferson, B. and Parsons, S. A. 2004. Characterising natural organic matter flocs. In: NOM research:Innovation and applications for drinking water treatment, Victor Harbor, Australia, March 2-5, pp. 55-58
Jarvis, P., Jefferson, B. and Parsons, S. A. 2006. Floc structural characteristics using conventional coagulationfor high DOC, low alkalinity surface water source. Water Research. 40 :2727-2737
Kainulainen, T., Tuhkanen, T., Vartiainen, T., Heinonen-Tanski, H. and Kalliokoski, P. 1994. The effect ofdifferent oxidation and filtration processes on the molecular size distribution of humic material. Water Scienceand Technology. 30:169-174
Kainulainen, T. K., Tuhkanen, T. A., Vartiainen, T. K. and Kalliokoski, P. J. 1995. Removal of residual organicsfrom drinking water by ozonation and activated carbon filtration: a pilot plant study. Ozone Science &Engineering. 17:449-462
Kastl, G., Sathasivan, A., Fisher, I. and Van Leeuwen, J. 2004. Modeling DOC removal by enhancedcoagulation. Journal of American Water Works Association. 96:79-89
Kasprzyk-Hordern, B., Raczyk-Stanislawiak, U., Swietlik, J. and Nawrocki, J. 2005. Catalytic ozonation ofnatural organic matter on alumina. Applied Catalysis. 62:345-358
Kim, H. and Yu, M. 2005. Characterization of natural organic matter in conventional water treatment processesfor selection of treatment processes focused on DBPs control. Water Reasearch. 39:4779-4789
Kim, K., Oh, B., Kang, J., Chung, D., Cho, W. and Choi, Y. 2005. Effect of ozone and GAC process for thetreatment of micropollutants and DPBs control in drinking water: Pilot scale evaluation. Ozone Science &Engineering. 27:69-79
Knuutinen, J., Virkki, L., Mannila, P., Mikkelson, P., Paasivirta, J. and Herve, S. 1988. High performance liquidchromatographic study of dissolved organic matter in natural waters. Water Research. 22:985-990
Krasner, S., Crouè, J., Buffle, J. and Perdue, E. 1996. Three approaches for characterizing NOM. Journal ofAmerican Water Works Association. 88:66-79
Kronberg, L., Holmbom, B. and Tikkanen, L. 1985. Fractionation of mutagenic compounds formed duringchlorination of humic water. The Science of the Total Environment. 47:343-347
Kuchler, I. and Miekeley, N. 1994. Ultrafiltration of humic compounds through low molecular mass cut-off levelmembranes. The Science of the Total Environment. 154:23-28
Langlais B., Reckhow D. A. and Brink, D. R. 1991. Ozone in water treatment: Application and engineering.Lewis publishers

50
Leenher, J. A. 1981. Comprehensive approuch to preparative isolation and fractionation of dissolved organiccarbon from natural waters and wastewaters. Environmental Science and Technology. 15:578-587
Leenher, J. A. 1985. Fractionation techniques for aquatic humic substances. In: Aiken, G., McKnight, D.,Wershaw, R. and MacCarthy, P. (eds) Humic substances in soil, sediment and water. John Wiley & Sons. pp.409-429
Lehtola, M. J., Miettinen, I. T., Vartiainen, T., Myllykangas, T. and Martikainen, P. J. 2001. Microbiallyavailable organic carbon, phosporus, and microbial growth in ozonated drinking water. Water Research.35:1635-1640
Lehtola, M. J., Miettinen, I. T., Vartiainen, T. and Martikainen, P. J. 2002. Changes in content of microbiallyavailable phosphorus, assimilable organic carbon and microbial growth potential during drinking water treatmentprocesses. Water Research. 36:3681-3690
Li, X. Z., Fan, C. M. and Sun, Y. P. 2002. Enhancement of photocatalytic oxidation of humic acid in TiO2
suspensions by increased cation strenght. Chemosphere. 48:453-460
Liikanen, R., Miettinen, I. and Laukkanen, R. 2003. Selection of NF membrane to improve quality of chemicallytreated surface water. Water Research. 37:864-872
Liikanen, R. 2006. Nanofiltration as a refining phase in surface water treatment. Doctoral thesis. Department ofCivil and Environmental Engineering, Helsinki University of Technology.
Lin, C., Huang, Y. and Hao, O. 1999. Ultrafiltration processes for removing humic substances: Effect ofmolecular weight fractions and PAC treatment. Water Research. 33:1252-1264
Lin, C., Lin, T. and Hao, O. 2000. Effects of humic substance characteristics on UF performance. WaterResearch. 34:1097-1106
Lindqvist, N. 2001. Optimized coagulation for natural organic matter removal. Diploma thesis. Department ofEnvironmental Engineering, Tampere University of Technology.
Lindqvist N., Korhonen S., Jokela J. and Tuhkanen T. 2002. Comparison of iron and aluminum based coagulantsand polymeric flocculant aids to enhance NOM removal. In: Chemical Water and Wastewater Treatment VII.Hahn H. H., Hoffmann E. and Ødegaard H. (ed.) IWA Publishing, London, pp. 133-142
Lindqvist N., Jokela J. And Tuhkanen T. 2004 Enhancement of coagulation by using polyelectrolytes ascoagulant or flocculant aids. In: Proc. of the 11th International Gothenburg Symposium on Chemical Treatmentof Water and Wastewater, November 8-11, Orlando, Florida, USA
Logan, B. and Jiang, Q. 1990. Molecular size distributions of dissolved organic matter. Journal ofEnvironmental Engineering. 116:1046-1062
Lovins III, W. A., Duranceau S. J., Gonzalez R. M. and Taylor J. S. 2003. Optimized coagulation assessment fora highly organic surface water supply. Journal of American Water Works Association. 95:94-108
Ludwig, U., Grischek, T., Neitzel, P. and Nestler, W. 1997. Ultrafiltration: a technique for determining themolecular-mass distribution of group parameters of organic pollutants in natural waters. Journal ofChromatography. 763:315-321
Maartens, A., Swart, P. and Jacobs, E. 1998. Humic membrane foulants in natural brown water: characterizationand removal. Desalination. 115:215-227
MacCarthy, P. and Rice, J. 1985. Spectroscopic methods (other than NMR) for determining functionality inhumic substances. In: Aiken, G., McKnight, D., Wershaw, R. and MacCarthy, R. (eds) Humic substances in soil,sediment and water. John Wiley & Sons. pp. 527-584
Malcolm, R. 1985. Humic substances in rivers and streams. In: Aiken, G., McKnight, D., Wershaw, R. andMacCarthy, P. (eds) Humic substances in soil, sediment and water. John Wiley & Sons. pp. 13-85

51
Malcolm, R. and MacCarthy, P. 1992. Quantitative evaluation of XAD-8 and XAD-4 resins used in tandem forremoving organic solutes from water. Environment International. 18:597-607
Martin-Mousset, B., Croue, J. P., Lefebvre, E. and Legube, B. 1997. Distribution and characterization ofdissolved organic matter of surface waters. Water Research. 31:541-553
Maurice, P., Pullin, M., Cabaniss, S., Zhou, Q., Namjesnik-Dejanovik, K. and Aiken, G. 2002. A comparison ofsurface water natural organic matter in raw filtered water samples, XAD and reverse osmosis isolates. WaterResearch. 36:2357-2371
McCreary, J. and Snoeyink, V. 1980. Characterization and activated carbon adsorption of several humicsubstances. Water Research. 14:151-160
McKnight, D. and Aiken, G. 1998. Sources and age of aquatic humus. In: Hessen, D. and Tranvik, L. (eds)Aquatic humic substances: Ecology and biogeochemistry. Springer-Verlag, 9-39
Miettinen, I. T., Vartiainen, T., Nissinen, T., Tuhkanen, T. and Martikainen, P. J. 1998. Microbial growth indrinking waters treted with ozone, ozone/hydrogen peroxide or chlorine. Ozone Science & Engineering. 20:303-315
Miettinen, I. T., Vartiainen, T. and Martikainen, P. J. 1999. Determination of assimilable organic carbon inhumus-rich drinking water. Water Research. 33:2277-2282
Mikita, M. A., Steelink, C. and Wershaw, R. L. 1981. Carbon-13 enriched nuclear magnetic resonance methodfor the determination of hydroxyl functionality in humic substances. Analytical Chemistry. 53:1715-1717
Miles, C. and Brezonik, P. 1983. High-performance size exclusion chromatography of aquatic humic substances.Journal of Chromatography. 259:499-503
Miltner, R. J., Shukairy, H. M. and Summers, R. S. 1992. Disinfection by-product rormation and control byozonation and biotreatment. Journal of American Water Works Association. 84:53-62
Mohan, S. V., Mohan, S. K. and Reddy, S. J. 2000. Determination of organic matter in water using organo-metalcompexes. Water Research. 34:3761-3764
Morris, J. K. and Knocke, W. R. 1984.Temperature effects on the use of metal-ion coagulants for watertreatment. Journal of American Water Works Association. 76:74-79
Murray, C. A. and Parsons, S. A. 2004. Removal of NOM from drinking water: Fenton’s and photo-Fenton’sprocesses. Chemosphere. 54:1017-1023
Myllykangas, T., Nissinen, T., Rantakokko, P., Martikainen, P. and Vartiainen, T. 2002. Molecular size fractionsof treated aguatic humus. Water Research. 36:3045-3053
Myllykangas, T., Nissinen, T. K., Hirvonen, A., Rantakokko, P. and Vartiainen, T. 2005. The evaluation ofozonation and chlorination on disinfection by-product formation for a high-bromide water. Ozone Science &Engineering. 27:19-25
Newcombe, G. 1999. Charge vs. porosity –Some influences on the adsorption of natural organic matter (NOM)by activated carbon. Water Science and Technology. 40:191-198
Nilson, J. and DiGiano, F. 1996. Influence of NOM composition on nanofiltration. Journal of American WaterWorks Association. 88:53-66
Nissinen, T., Miettinen, I., Martikainen, P. and Vartiainen, T. 2001. Molecular size distribution of naturalorganic matter in raw and drinking waters. Chemosphere. 45:865-873
Nissinen, T. 2002. The effect of ozonation on the chemical quality of drinking water. Publications of theNational Public Health Institute A7/2002

52
Nissinen, T., Miettinen, I., Martikainen, P. and Vartiainen, T. 2002. Disinfection by-products in Finnish drinkingwaters. Chemosphere. 48:9-20
Nobili, M., Gjessing, E. and Sequi, P. 1989. Sizes and shapes of humic substances by gel chromatography. In:Hayes, M., MacCarthy, P., Malcolm, R. and Swift, R. (eds) Humic Substances II. In search of Structure. JohnWiley & Sons. pp. 562-587
Nordtest 2003. Increase in colour and amount of organic matter in surface waters. Workshop on changes inquality and quantity of dissolved NOM; Causes and Consequences, Atna 21-23 May 2003. In NT Reportavailable at http://www.nordtest.org/register/position/pos9.pdf (Cited on 11.6.2004).
Odegaard, H., Eikebrokk, B. and Storhaug, R. 1999. Processes for the removal of humic substances from water –an overview based on Norwegian experiences. Water Science and Technology. 40:37-46
Oden. S. 1919. “Die Huminsaure” Kolloidchem. Beiheft 11:75-98.
O´Loughin, E. and Chin, Y. 2001. Effect of detector wavelength on the determination of the molecular weight ofhumic substances by high-pressure size exclusion chromatography. Water Research. 35:333-338
Oxenford, J. and Lykins, Jr., B. 1991. Conference summary: Practical aspects of the design and use of GAC.Journal American Water Works Association. 83:58-64
Owen, D., Amy, G., Chowdhury, Z., Paode, R., McCoy, G. and Viscosil, K. 1995. NOM characterization andtreatability. Journal American Water Works Association. 87:46-63
Park, N., Kwon, B., Kim, S. and Cho, J. 2006. Characterizations of the colloidal and microbial organic matterswith respect to membrane foulants. Journal of Membrane Science. 275:29-36
Parsons, S. A., Goslan, E. H., Jarvis, P. R., Hurst, A. M. and Fearing, D. A. 2002. NOM – The relationshipbetween character and treatability. In: International Conference on Natural Organic Matter Characterisation andTreatment, Cranfield, 15th May, UK.
Pelekani, C., Newcombe, G., Snoeyink, V., Hepplewhite, C., Assemi, S. and Beckett, R. 1999. Characterizationof natural organic matter using high performance size exclusion chromatography. Environmental Science andTechnology. 33:2807-2813
Perdue, E. 1985. Acidic functional groups of humic substances. In: Aiken, G., McKnight, D., Wershaw, R. andMacCarthy, R. (eds) Humic substances in soil, sediment and water. John Wiley & Sons. pp. 493-526
Pettersson, C. 1992. Properties of humic substances from groundwater and surface waters. Doctoral thesis.Department of Theme Research, Water and Environmental Studies, Linköping University
Peuravuori, J. 1992. Isolation, fractionation and characterization of aquatic humic substances. Does a distincthumic molecule exist? Doctoral thesis. Department of Chemistry, University of Turku
Peuravuori, J. and Pihlaja, K. 1997. Molecular size distribution and spectroscopic properties of aquatic humicsubstances. Analytica Chimica Acta. 337:133-149
Piccolo, A., Nardi, S. and Concheri, G. 1996. Micelle-like conformation of humic substancies as revealed bysize-exclusion chromatography. Chemosphere. 33:595-602
Piccolo, A. 1997. New insights on the conformational structure of humic substances as revealed by sizeexclusion chromatography. In: Drozd, J., Gonet, S., Senesi, N. and Weber, J. (eds) The role of humic substancesin the ecosystems and environmental protection. Proceedings of the 8th meeting of international humicsubstances society, Wroclaw, Poland, September 9-14, 1996
Posner, A. M. 1963. Importance of electrolyte in the determination of molecular weights by sephadex gel withspecial reference to humic acids. Nature (London). 198:1161-1163

53
Randtke, S. 1988. Organic contaminant removal by coagulation and related process combinations. Journal ofAmerican Water Works Association. 80: 40-56
Ranville, J. and Macalady, D. 1997. Natural organic matter in catchments. In: Saether, O. and de Caritat, P. (eds)Geochemical processes, weathering and groundwater recharge in catcments. pp. 263-303
Ratnaweera, H., Gjessing, E. and Oug, E. 1999a. Influence of physical-chemical characteristics of naturalorganic matter (NOM) on coagulation properties: an analysis of eight Norwegian water sources. Water Scienceand Technology. 40:89-95
Ratnaweera, H., Hiller, N. and Bunse, U. 1999b. Comparison of the coagulation behaviour of differentNorwegian aquatic NOM sources. Environment International. 25:347-355
Rausa, R., Mazzolari, E. and Calemma, V. 1991. Determination of molecular size distributions of humic acids byhigh-performance size-exclusion chromatography. Journal of Chromatography. 541:419-429
Reckhow, D. and Singer, P. 1990. Chlorination by-products in drinking waters: from formation potentials tofinished water concentrations. Journal of American Water Works Association. 82:173-180
Reckhow, D., Singer, P. and Malcolm, R. 1990. Chlorination of humic materials: Byproduct formation andchemical interpretations. Environmental Science and Technology. 24:1655-1664
Reid, P., Wilkinson, A., Tipping, E. and Jones, M. 1990. Determination of molecular weights of humicsubstances by analytical (UV scanning) ultracentrifugation. Geochimica et Cosmochimica Acta. 54:131-138
Richardson, S., Simmons, J and Rice, G. 2002. Disinfection by-products: The next generation. EnvironmentalScience and Technology. 36:1198A-20A
Saito, Y. and Hayano, S. 1979. Application of high-performance aqeuous gel permeation chromatography tohumic substances from marine sediment. Journal of Chromatography. 177:390-392
Sallanko, J. and Merisalo, V. 2005. Magneettisen ioninvaihtohartsin käyttömahdollisuudet talousvedenorgaanisen aineen poiston tehostamisessa. Rakennustekniikka & Rakennusinsinööri. 6:54-57
Schulten, H.-R. 1999. Analytical pyrolysis and computational chemistry of aquatic humic substancies anddissolved organic matter. Journal of Analytical and Applied Pyrolysis. 49:385-415
Schäfer, A., Fane, A. and Waite, T. 1998. Nanofiltration of natural organic matter: Removal, fouling and theinfluence of multivalent ions. Desalination. 118:109-122
Schäfer, A., Fane, A. and Waite, T. 2000. Fouling effects on rejection in the membrane filtration on naturalwaters. Desalination. 131:215-224
Schäfer, A., Fane, A. and Waite, T. 2001. Cost factors and chemical pretreatment effects in the membranefiltration of waters containing natural organic matter. Water Research. 35:1509-1517
Sharp, E. L., Jarvis, S. A., Parsons, S. A., and Jefferson, B. 2006a. Impact of fractional character on thecoagulation of NOM. Colloids and Surfaces A: Physicochemical and Engineering Aspects. 286:104-111
Sharp, E., Parsons, S. and Jefferson, B. 2006b. Seasonal variations in natural organic matter and its impact oncoagulation in water treatment. Science of the Total Environment. 363:183-194
Sharp, E. L., Parsons, S. A. and Jefferson, B. 2006c. The impact of seasonal variations in DOC arising frommoorland peat catchment on coagulation with iron aqnd aluminium salts. Environmental Pollution. 140:436-443
Siddiqui, M., Amy, G., Ryan, J. and Odem, W. 2000. Membranes for the control of natural organic matter fromsurface waters. Water Research. 34:3355-3370
Singer, P. 1999. Humic substances as precursors for potentially harmful disinfection by-products. Water Scienceand Technology. 40:25-30

54
Singer, P. C., and Bilyk, K. 2002. Enhanced coagulation using a magnetic ion exchange. Water Research.36:4009-4022
Stevenson, F. 1982. Humus chemistry. John Wiley & Sons, pp. 692
STM. 461/2000. Sosiaali- ja terveysministeriön asetus talousveden laatuvaatimuksista ja valvontatutkimuksista.Available on-line in: http://www.finlex.fi/fi/laki/alkup/2000/20000461 (Cited on 15.11.2006).
Swietlik, J., Raczyk-Stanislawiak, U., Bilozor, S., Ilecki, W. and Nawrocki, J. 2002. Adsorption of naturalorganic matter oxidized with ClO2 on granular activated carbon. Water Research. 36: 2328-2336
Swietlik, J., Dabrowska, A., Raczyk-Stanislawiak, U. and Nawrocki, J. 2004. Reactivity of natural organicmatter fractions with chlorine dioxide and ozone. Water Research. 38:547-558
Swift, R. S. and Posner, A. M. 1971. Gel chromatography of humic acid. Journal of soil science. 111:237-249
Swift, R. 1989. Molecular weight, size, shape and charge characteristics of humic substances: Some basicconsiderations. In: Hayes, M., MacCarthy, P., Malcolm, R. and Swift, R. (eds) Humic Substances II. In search ofStructure. pp. 450-465
Thorsen, T. 1999. Membrane filtration of humic substances – State of the art. Water Science and Technology.40 :105-112
Thurman, E. and Malcolm, R. 1981, Preparative isolation of aquatic humic substances. Environmental Scienceand Technology. 15 :463-466
Toivanen, E. and Härmä, V. 2004. Orgaanisen aineen poistokokeet MIEX-prosessilla. Vesitalous. 1:30-35
Tuhkanen, T. A., Kainulainen, T. K., Vartiainen, T. K. and Kalliokoski, P. J. 1994. The effect of preozonation,ozone/hydrogen peroxide treatment and nanofiltration on the removal of organic matter from drinking water.Ozone Science & Engineering. 16:367-383
Tuhkanen, T., Ketonen, A., Gillberg, L. and Jokela, J. 2004. Removal of different size fractions of naturalorganic matter in drinking water by optimized coagulation. In: Proc. of the 11th International GothenburgSymposium on Chemical Treatment of Water and Wastewater, November 8-11, Orlando, Florida, USA
Vahala, R. 1995. The use of activated carbon in the purification of drinking water (in Finland). Aktiivihiilenkäyttö talousveden puhdistuksessa. Vesitalous. 1:17-20
Van der Bruggen, B., Schaep, J., Wilms, D. and Vandecasteele, C. 1999. Influence of molecular size, polarityand charge on the retention of organic molecules by nanofiltration. Journal of Membrane Science. 156:29-41
Van der Hoek, J. P., Hoffman, J. A. M. H. and Graveland, A. 1999. The use of biological activated carbonfiltration for the removal of natural organic matter and organic micropollutants from water. Water Science andTechnology. 40:257-264
Varga, B., Kiss, G., Galambos, I., Gelencser, A., Hlavay, J. and Krivácsy, Z. 2000. Secondary structure of humicacids. Can micelle-like conformation be proved by aqeous size exclusion chromatography. EnvironmentalScience and Technology. 34:3303-3306
Vartiainen, T., Liimatainen, A. and Kauranen, P. 1987. The use of TSK size exclusion columns in determinationof the quality and quantity of humus in raw waters and drinking water. Science of the Total Environment. 62:75-84
Vickers, J., Thompson, M. and Kelkar, U. 1995. The use of membrane filtration in conjunction with coagulationprocesses for improved NOM removal. Desalination. 102:57-61
Vik, E., Carlson, D., Eikum, A. and Gjessing, E. 1985. Removing aquatic humus from Norwegian lakes. Journalof American Water Works Association. 77: 58-66

55
Vrijenhoek, E. M., Childress, A. E., Elimelech, M., Tanaka, T. S. and Beuhler, M. D. 1998. Removing particlesand THM precursors by enhanced coagulation. Journal of American Water Works Association. 90:139-150
Vuorio, E., Vahala, R., Rintala, J. and Laukkanen, R. 1998. The evaluation of drinking water treatmentperformed with HPSEC. Environment International. 24:617-623
Wagoner, D. and Christman, R. 1999. Molar mass and size of Norwegian aquatic NOM by light scattering.Environment International. 25:275-284
Wandruszka, R. 1998. The micellar model of humic acid: Evidence from pyrene fluorescence measurements.Soil Science. 163:921-930
Wang, G. S., Hsieh, S. T. and Hong, C. S. 2000. Destruction of humic acid in water by UV light-catalyzedoxidation with hydrogen peroxide. Water Research. 15:3882-3887
Weber, Jr. W. and Smith, E. 1986. Removing dissolved organic contaminants from water. EnvironmentalScience and Technology. 20:970-979
Weber, J. 1988. Binding and transport of metals by humic materials. In: Frimmel, F. and Christman, R. (eds)Humic substances and their role in the environment. John Wiley & Sons. pp. 165-178
Wershaw, R. 1989. Sizes and shapes of humic substances by scattering techniques. In: Hays, M., MacCarthy, P.,Malcolm, R and Swift, R. (eds) Humic substances II: In search of structure. pp. 545-560
Wershaw, R. 1993. Model for humus in soils and sediments. Environmental Science and Technology. 27:814-816
Wikipedia. 2006. Available on-line in: http:/fi.wikipedia.org/wiki/Oulujoki. (Cited on 12.12.2006).
Wu, F. C., Evans, R. D. and Dillon, P. J. 2003. Separation and characterization of NOM by high-performanceliquid chromatography and on-line three-dimensional excitation emission matrix fluorescence detection.Environmental Science and Technology. 37:3687-3693
Yoon, S., Lee, C., Kim, K. and Fane, A. 1998. Effect of calcium ion on the fouling of nanofilter by humic acid indrinking water production. Water Research. 32:2180-2186
Ympäristökeskus. 2004. Pintavesilaitosten jakaman veden laatu vuonna 1996. Available on-line:www.ymparisto.fi. Last modified on 29.12.2004. (Cited on 10.12.2006).
Zander, A. and Curry, N. 2001. Membrane and solution effects on solute rejection and productivity. WaterResearch. 35:4426-4434
Zhou, Q., Cabaniss, S. and Maurice, P. 2000. Considerations in the use of high-pressure size exclusionchromatography (HPSEC) for determining molecular weights of aquatic humic substances. Water Research.34:3505-3514

56
APPENDIX 1
CO 2
ALUMINIUMSULPHATE22-28 g/m 3
LIMEWATER ClO 2 CHLORINE
FLOCCULATION
FLOCCU LATION
FLOTATION
SEDIMENTATION
ACTIVATEDCARBON FILTERS
ACTIVATEDCARBON FILTERS
CLEARWATERBASINS
COLLECTIONBASIN
COLLECTIONBASIN
Raw WaterPipe, 7 km
Lake RoineTOC ≈ 5 mg/l
4 SEDIMENTATION LINES
3 FLOTATION LINES
PUMPINGTO THENETWORK
Sludge
To Sewer
DISPERSIONWATER
TOC ≈ 2.5 mg/lpH 8-9
pH 5.8 -5.9
pH 7-8
Figure 1. Schematic picture of the Rusko Waterworks in year 1999
mixing tower
ClO2ferric sulphate
lime water
Cl2
FLOCCULATION FLOTATION SAND FILTRATION- 6 basins
GAC FILTRATION- 8 basins
collection basincollection basin
treated water basin
raw waterLAKE ROINE
11
2
3 45
6
Figure 2. Schematic picture of the Rusko Waterworks in year 2002

57
AC-K2
Shore well Raw water basin mixing Flocculation/flotation Sand filtration
ozonation
Activated carbon filtration(4 basins)
Treated water basin
To the distributionsystem
Disinfection withsodiumhypochloriteandammoniumchloride
Lime water, CO2
Lime waterRiver Oulu
1
6
5
4
32 To pilot
AC-K1
AC-K4
AC-K3
Ferricsulphate
Figure 3. Diagram of the Kurkelanranta Water Treatment Plant. In Kurkelanranta AC filterswere paired so that two of them were in-line and pairs were parallel. In Hintta all AC filterswere parallel. Sampling points are illustrated in the figure by numbers 1-6.

58
APPENDIX 2.
Table 1. The removal percentages of different MM fractions of NOM during the watertreatment process at Rusko Water Treatment Plant. Results are averages from studies onPapers I and II (sedimentation n=12; AC-B, AC-D n=51, flotation, AC-A, AC-C n=63).
MM fractions g/mol>4000 3000-4000 1000-3000 <1000 <500
Sedimentation 95 48 12 3Flotation 96 55 20 14 19AC-A 95 65 41 39 21AC-B 94 68 48 43 26AC-C 95 66 44 38 38AC-D 95 70 53 51 21Treated water 96 68 46 46 38
Table 2. The removal percentages of different MM fractions of NOM during the watertreatment process at Hintta Water Treatment Plant.
MM fractions g/mol>4000 3000-4000 1000-3000 <1000 SOPH
Flotation 98 90 54 6 90Sand filtration 98 88 50 7 89Ozonation 98 92 72 38 93AC-H1 98 93 75 43 94AC-H2 98 94 81 62 96AC-H3 98 93 76 49 94AC-H4 99 95 74 65 97Treated water 98 94 80 57 95
Table 3. The removal percentages of different MM fractions of NOM during the watertreatment process at Kurkelanranta Water Treatment Plant.
MM fractions g/mol>4000 3000-4000 1000-3000 <1000 SOPH
Flotation 98 90 55 13 90Sand filtration 98 89 54 16 90Ozonation 98 93 77 49 94AC-K1 98 93 77 48 94AC-K2 99 95 82 64 96AC-K3 98 93 76 48 94AC-K4 98 94 79 57 95Treated water 98 94 82 63 95

I
Removal of NOM in the different stages of the water treatment process. Matilainen, A., Lindqvist, N., Korhonen, S. and Tuhkanen, T.
Environment International 28:457-465 (2002)
Reprinted with kind permission of Elsevier

Removal of NOM in the different stages of the water treatment process
Anu Matilainen, Niina Lindqvist, Susanna Korhonen, Tuula Tuhkanen*
Institute of Environmental Engineering and Biotechnology, Tampere University of Technology, P.O. Box 541, FIN-33101 Tampere, Finland
Received 30 May 2002; accepted 26 August 2002
Abstract
Natural organic matter (NOM) is abundant in natural waters in Finland and in many ways affects the unit operations in water purification.
In this study, the organic matter content in water in different stages of a full-scale treatment process over 1 year was measured. The full-scale
treatment sequence, studied at the Rusko water treatment plant in Tampere, Finland, consisted of coagulation, flocculation, clarification by
sedimentation or flotation, activated carbon (AC) filtration, and disinfection. High-performance size exclusion chromatography (HPSEC) was
used for separation to determine changes in the humic substances content during the purification process. In addition, total organic carbon
(TOC), KMnO4-number, and UV-absorbance at wavelength 254 nm (UV254) were measured. High molecular weight (HMW) matter was
clearly easier to remove in coagulation and clarification than low molecular weight (LMW) matter. Furthermore, depending on the
regeneration of the activated carbon filters, activated carbon filtration was effective to a degree but did not remove most of the lowest
molecular weight compounds. Significant correlation was established among HPSEC, KMnO4, UV254 absorbance, and TOC. HPSEC proved
to be a fast and relatively easy method to estimate NOM content in water and, in fact, gave more information than traditional methods on the
type of NOM in a water sample. It also helped the process performance follow-up.
D 2002 Elsevier Science Ltd. All rights reserved.
Keywords: High-performance size exclusion chromatography (HPSEC); Natural organic matter (NOM); Drinking water; Water purification
1. Introduction
Natural organic matter (NOM), defined as the complex
matrix of organic material present in natural waters, affects
significantly many aspects of water treatment, including the
performance of unit processes (i.e., oxidation, coagulation,
and adsorption), application of disinfectants, and biological
stability. As a result, NOM acts upon potable water quality
by contributing to disinfection by-products (DBP), biolog-
ical regrowth in the distribution system, colour, taste, and
odour (Owen et al., 1995). Various water treatment pro-
cesses can either directly or indirectly and, to varying
degrees, remove aquatic organic matter from raw water,
depending on their operational conditions and the specific
characteristics of the NOM such as molecular weight dis-
tribution (MWD), carboxylic acidity, and humic substances
content (Collins et al., 1985). High molecular weight (HMW)
NOM is more amenable to removal than low molecular
weight (LMW) NOM, particularly the fraction with an
MWof < 500 Dalton (Da). NOM with the highest carboxylic
acidity and hence the highest charge density are generally
difficult to remove by conventional treatment (Collins et al.,
1986). Water source with HMW (5000–10000 Da) humic
acids is a good candidate for chemical coagulation (Amy et
al., 1992). The LMW species are more adsorbable presum-
ably because more surface area is accessible to these sub-
stances (McCreary and Snoeyink, 1980).
High-performance size exclusion chromatography
(HPSEC) has been widely used to determine the MWD of
aquatic humic substances (Pelekani et al., 1999; Conte and
Piccola, 1999; Rausa et al., 1991; Knuutinen et al., 1988;
Amy et al., 1987; El-Rehaili and Weber, 1987; Miles and
Brezonik, 1983). In HPSEC analysis, humic molecules are
separated primarily on the basis of differing molecular size
so that the largest molecules are eluted first in the column,
while the smallest molecules are eluted last (Potschka, 1993).
Other factors such as charge, molecular structure, steric
effects, and hydrophobicity may also influence the result
(Wershaw and Aiken, 1985).
The objective of this study was to monitor the purifica-
tion process on full scale at a water treatment plant and to
evaluate the quality of the water with HPSEC in the differ-
ent stages of the process. A further aim was to use HPSEC
0160-4120/02/$ - see front matter D 2002 Elsevier Science Ltd. All rights reserved.
PII: S0160 -4120 (02 )00071 -5
* Corresponding author. Tel.: +358-3-3115-2850; fax: +358-3-3115-
2869.
E-mail address: [email protected] (T. Tuhkanen).
www.elsevier.com/locate/envint
Environment International 28 (2002) 457–465

to monitor the performance of the treatment process and to
determine if the method yielded any information on the
process beyond what could be gained by traditional methods
such as total organic carbon (TOC) measurement.
2. Materials and methods
2.1. Rusko waterworks
The Rusko waterworks pumps its raw water from Lake
Roine, 7 km southeast of the plant and produces 68% of the
distributed drinking water for the city of Tampere, Finland.
The plant has a maximum treatment capacity of 55000 m3/
day and an average water flow of about 1400 m3/h. Raw
water is typical Finnish lake water having low alkalinity
(about 0.25 mmol/l) and quite a low turbidity (about 2
FTU). Organic carbon content is fairly low (about 5 mg/l)
compared to typical Finnish surface waters. The treated
water has a TOC value of about 2.5 mg/l.
As shown in Fig. 1, the treatment process at Rusko
consists of chemical addition, coagulation and clarification,
disinfection, activated carbon filtration, and post-chlorina-
tion. After coagulant addition (Al2(SO4)3), the process is
branched into two separate lines, the older employing sedi-
mentation for clarification and the newer flotation. Sedi-
mentation line has four sedimentation basins and its total
design capacity is 28000 m3/day. The flotation line has three
basins with total capacity of 24000–32000 m3/day. After
clarification, the water passes through collection basins and
onto activated carbon filters. The activated carbon (AC) filters
are ordinary one-layer filters, 14 in all with 8 in the sedimenta-
tion line and6 in the flotation line.Each filter has a surface area
of30m2andabeddepthofabout115cm.Thefiltersare flushed
with water and air after about 40 h of use, and the AC is
regenerated every 2 years. Disinfection with chlorine dioxide
(ClO2) takes place in the collection basins, and post-chlorina-
tion is done with chlorine gas to yield a 0.3 mg/l free chlorine
residual in the purified water before it is pumped into the
distribution system.
One filter from both clarification lines was used to study
the efficiency of AC filters to remove organic matter. AC-A
Fig. 1. Diagram of Rusko drinking water treatment plant.
Table 1
Results on water quality at Rusko water treatment plant (August 1999–
August 2000)
Raw water Pure water
Average Min Max Average Min Max
Alkalinity (mmol/l) 0.25 0.24 0.25 0.73 0.68 0.80
Hardness (dH) 1.1 1.1 1.2 3.3 3.0 3.5
Colour, Pt (mg/l) 16 10 30 < 2.5 < 2.5 < 2.5
Turbidity (FTU) 2.3 0.58 5.5 0.13 0.06 0.36
pH 7.1 6.8 7.3 8.5 7.8 8.9
TOC (mg/l) 5.5 5.4 5.6 2.9 2.2 3.1
KMnO4 (mg/l) 17 14 19 5.0 3.8 6.4
A. Matilainen et al. / Environment International 28 (2002) 457–465458

(brand name Aqva Sorb BG-09) was taken in use in
sedimentation line in July 1995. It was manufactured in
China and made of bitumic coal. It was regenerated in April
1998 and May 2000. AC-B (brand name Filtrasorb TL820)
was in flotation line and it was taken in use in December
1994. It was manufactured in Belgium, made also of bitumic
coal and regenerated in April 1997 and May 1999.
2.2. Analysis
Water samples were taken from the following stages of
the treatment sequence once a month between the beginning
of August 1999 and the end of May 2000: raw water, after
sedimentation and flotation, after two different AC filters
(AC-A in the sedimentation line and AC-B in the flotation
line), and pure drinking water. These samples (V= 10 ml)
were frozen and analysed with HPSEC in the summer 2000.
The other parameters were measured on site upon sampling
(in Rusko waterworks laboratory). UV254 absorbance was
measured with a spectrophotometer. The raw water sample
and the samples after flotation and sedimentation were
centrifuged before UV measurement. TOC samples were
filtered through 0.45-Am membrane and they were measured
as dissolved organic carbon (DOC) according to the SFS-
EN 1484 standard and by using a Shimadzu TOC-5000A
with a high sensitivity catalyst. Total organic material was
measured by the KMnO4 oxidation method according to the
Finnish Society of Food Science and Technology guidelines.
Fig. 2. (A–F) Seasonal variation in organic matter content according to different measuring techniques. Results are relative amounts of organic matter
compared to the first value of measurement. (A) Raw water, (B) flotation, (C) sedimentation, (D) AC-A, (E) AC-B, (F) treated water.
A. Matilainen et al. / Environment International 28 (2002) 457–465 459

Hardness was measured according to the SFS 3003/-87,
alkalinity by the SFS 3005/-81, turbidity according to the
SFS-EN ISO 7027/-00, and colour according to the SFS-EN
7887/part 4/-95 standard.
From the beginning of June to the end of August 2000,
samples were taken every other week and measured at
Tampere University of Technology laboratories. UV254 ab-
sorption was measured with a Shimadzu UV-1601, UV–VIS
spectrophotometer.Beforemeasurement, therawwatersample
and the samples after flotation and sedimentationwere filtered
throughaGelman0.45-Ammembrane.TOCandKMnO4were
determined as described above. Sampleswere filtered through
0.45-Ammembrane.
HPSECmeasurements were done on the frozen samples in
June and July 2000 and on those taken in the summer upon
sampling. The samples were first filtered through a Gelman
0.45-Am membrane and then HPSEC fractionated with a
Hewlett-Packard HPLC 1100-series system, equipped with
a diode array UV detector (k = 254) and a TSKgel
G3000SW 7.5 mm(ID)� 30 cm column. Pre-column was
not used. Sodium acetate (0.01 M) was used as eluent at a
flow rate of 1 ml/min. Injection volume was 30 Al. Method
was selected based on results from earlier investigations
(Becher et al., 1985; Vartiainen et al., 1987; Vuorio et al.,
1998).
3. Results and discussion
3.1. Effect of freezing on the HPSEC samples
The effect of freezing was tested with raw water samples.
Samples were analysed after different times of freezing.
According to our study, results showed less than 8% relative
Fig. 2 (continued).
A. Matilainen et al. / Environment International 28 (2002) 457–465460
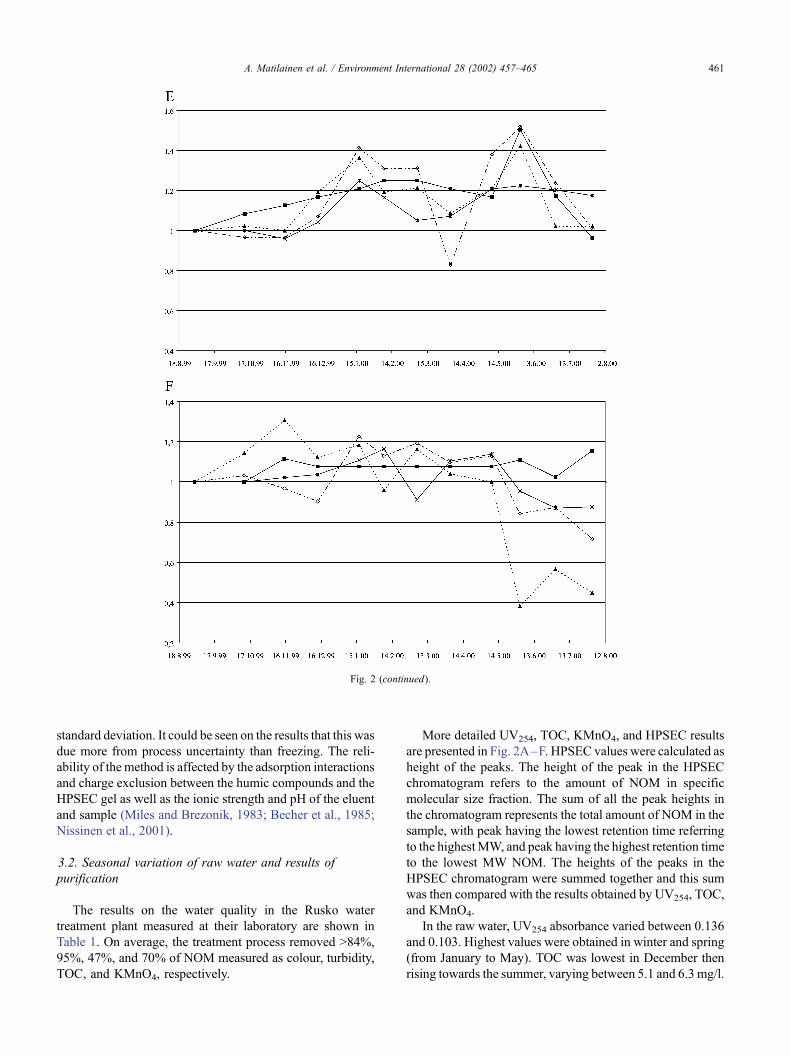
standard deviation. It could be seen on the results that this was
due more from process uncertainty than freezing. The reli-
ability of the method is affected by the adsorption interactions
and charge exclusion between the humic compounds and the
HPSEC gel as well as the ionic strength and pH of the eluent
and sample (Miles and Brezonik, 1983; Becher et al., 1985;
Nissinen et al., 2001).
3.2. Seasonal variation of raw water and results of
purification
The results on the water quality in the Rusko water
treatment plant measured at their laboratory are shown in
Table 1. On average, the treatment process removed >84%,
95%, 47%, and 70% of NOM measured as colour, turbidity,
TOC, and KMnO4, respectively.
More detailed UV254, TOC, KMnO4, and HPSEC results
are presented in Fig. 2A–F. HPSEC values were calculated as
height of the peaks. The height of the peak in the HPSEC
chromatogram refers to the amount of NOM in specific
molecular size fraction. The sum of all the peak heights in
the chromatogram represents the total amount of NOM in the
sample, with peak having the lowest retention time referring
to the highestMW, and peak having the highest retention time
to the lowest MW NOM. The heights of the peaks in the
HPSEC chromatogram were summed together and this sum
was then compared with the results obtained by UV254, TOC,
and KMnO4.
In the raw water, UV254 absorbance varied between 0.136
and 0.103. Highest values were obtained in winter and spring
(from January to May). TOC was lowest in December then
rising towards the summer, varying between 5.1 and 6.3 mg/l.
Fig. 2 (continued).
A. Matilainen et al. / Environment International 28 (2002) 457–465 461

KMnO4 varied between 14 and 17 mg/l in raw water without
a clear pattern. The highest values of HPSEC analysis in the
raw water occurred in spring and the lowest in summer.
According to the above results by different measurement
techniques, there was a slight increase in winter with all raw
water results, except those with TOC, which seemed to
increase during the investigation. Compared to the values
in the beginning of the measurements, the values in the fall
2000 were about 20% higher.
Results measured after sedimentation and flotation did not
show clear seasonal variation. KmnO4-number values were
higher in winter at flotation, while other results were constant.
Fig. 3. HPSEC chromatogram of raw (above) and treated (below) water from Lake Roine.
Fig. 4. Absolute peak heights in different stages of purification process. Results of period August 1999–August 2000 (n= 12) in averages with variations.
A. Matilainen et al. / Environment International 28 (2002) 457–465462

AC-B has strong peak inMaywhen all the results were higher
than usual. Also, in winter, results are slightly elevated. From
May onwards, the NOM removal efficiency of AC-A in the
sedimentation line was higher than the efficiency of AC-B in
the flotation line because the former had been regenerated in
the spring. The results were lower than the results from
treated water. AC-A removal efficiency, measured as
UV254, TOC, KMnO4, and HPSEC, improved by 15%,
10%, 24%, and 12%, respectively, compared to the situation
before regeneration. Compared to AC-B, the removal effi-
ciency was better by 24%, 22%, 32%, and 17%, respectively.
Thus, the regeneration of AC-A improved its capacity to
remove NOM significantly.
3.3. Effect of the purification process on HPSEC chromato-
grams
Five different peaks in the raw water were found (Fig. 3).
Peaks I and II are referred to HMW, peaks III and IV to
intermediate molecular weight (IMW), and peak V to LMW
organic matter. Further studies will determine the corre-
sponding molecular size for each fraction. Now, the method
is only a rough ‘‘fingerprint method’’. Other researchers
have found five to seven peaks in Finnish surface water
samples (Nissinen et al., 2001; Vuorio et al., 1998; Kainu-
lainen et al., 1994; Vartiainen et al., 1987). The chromato-
grams are always specific for different surface waters
because the nature of NOM is greatly affected by the
environment of the site. According to the chromatogram
(Fig. 3), the raw water consisted mostly of HMW and IMW
NOM. Fig. 3 shows also the chromatogram for the treated
water, in which HMW and partially the IMW NOM have
decreased after purification.
LMW fraction seems to bemore difficult to remove. LMW
fraction consists mostly from fulvic acids (Hayes et al.,
1989). Fulvic acids are more soluble, smaller in average
molecular weight, andmore highly charged than humic acids.
Fulvic acids also typically have higher oxygen content, with
higher carboxylic acid (COOH) and lower aromatic hydroxyl
(ArOH) content than humic acids (Hayes et al., 1989). They
are therefore more difficult to destabilize by aluminium
coagulation dosages commonly employed in water treatment
(Collins et al., 1986). Fig. 4 shows the relative changes in the
different molecular size fractions during treatment.
The average removal efficiencies of NOM are shown in
percentages in Table 2. Coagulation with aluminium sulphate
decreased the NOM content effectively and led to the total
disappearance of the first peak, i.e., the largest MW NOM.
After sedimentation, the heights of the second and third peaks
were reduced by 90% and 48% and after flotation by 93% and
55%, respectively, with flotation slightly more effective in
removing NOM. Flotation seemed somewhat more efficient
than sedimentation especially in the removal of HMWmatter.
The reduction in the sum of the peak heights was 71% and in
terms of TOC 51%. The results coincide with those of Vuorio
et al. (1998), who found that chemical treatment with sub-
sequent sand filtration decreased NOM effectively and
removed the largest MW NOM. No significant changes were
observed in their study in the amount of the lowest MW
NOM. Vuorio et al. (1998) observed that the sum of peak
heights decreased by 66%, while the TOC measurement
indicated only a 52% removal of NOM.
3.4. Effect of activated carbon filtration on the MWD of
NOM
Activated carbon filtration could remove no more of the
high molecular weight substances, but was instrumental in
reducing the amount of IMW and LMW matter. AC-A
reduced the height of the third, fourth, and fifth peak by
about 16%, 26%, and 33% and AC-B by about 6%, 17%,
and 21%, respectively. When AC-A was regenerated in the
spring (May 25, 2000), the two filters differed in perform-
ance immediately after the event (Table 3).
Table 2
Organic matter in different molecular size fractions removed from raw
water after each purification step compared to raw water results (yearly
average)
Peak number
I II III IV V
Sedimentation 100 90 48 12 3
Flotation 100 93 55 15 6
AC-A 100 92 64 38 36
AC-B 100 91 61 32 27
Treated water 100 90 65 42 38
Results are in percentage compared to the raw water results.
Table 3
Organic matter removal efficiency of activated carbon filters in 4 months
period, calculated in percentages compared to the values after clarification
processes
Peak number
I II III IV V
AC-A April 0 0 9 17 29
May 0 2 13 17 14
June 0 3 29 55 75
July 0 1 21 42 59
AC-B April 0 0 8 17 31
May 0 0 3 15 25
June 0 0 6 40 49
July 0 0 7 15 20
Table 4
Pearson correlation coefficients between different NOM measurements
(n= 106)
KMnO4 UV254 TOC
SEC (sum of peak heights) 0.961 0.986 0.959
KMnO4 0.972 0.943
UV254 0.965
A. Matilainen et al. / Environment International 28 (2002) 457–465 463

As shown in Table 3, AC-A was more efficient than AC-
B in the removal of NOM when calculated as the height of
the third, fourth, and fifth peak by 23%, 15%, and 26%,
respectively, right after regeneration. In July, the efficiencies
were a little lower, but still the AC-Awas better than AC-B.
In general, AC was the most important factor in removing
IMW and LMW organic matter.
3.5. Correlation between different techniques of NOM
measurement
The Pearson correlation coefficients among the different
NOM measurement techniques are shown in Table 4. As
expected, HPSEC and UV254 correlated best, and though
TOC yielded higher values than the other techniques, they yet
correlated well with each other. In general, TOC gave higher
results than the other techniques evidently because UV254
absorbance cannot detect all compounds present in the small-
est molecular weight fractions. This may lead to an under-
estimation of the NOM content measured as UV254 in
samples where LMW organic matter is prominent. In turn,
as the TOC analyzer may not be able to oxidize large
molecules, TOC concentration may be underestimated in
raw water.
Good correlation was also achieved in other studies
(Vuorio et al., 1998; Kainulainen et al., 1994; Vartiainen et
al., 1987), where TOC, KMnO4, and UVabsorbance showed
the strongest correlation with the mid-sized fractions of
NOM.
4. Conclusions
Even though little seasonal variation was detected in the
NOM content in raw water with different measurement
techniques, the treatment process is not affected by the
quality of raw water, and the quality of the treated water
remains fairly stable. Raw water sources in Finland are large
and residence times are long. They do not react to seasonal
variations so easily than river sources or small water systems.
Purified water is affected more by the functioning of the
treatment process than the quality of raw water.
LMW matter is more difficult to remove than HMW and
IMW NOM, which can be easily removed by coagulation.
However, the removal of the smallest molecular size frac-
tions can be enhanced by optimising the water treatment
process, e.g., by conditioning the AC filters. By enhancing
the LMW matter removal, the quality of water will improve
relating to, e.g., DBP formation and microbial regrowth in
the distribution line.
Size exclusion chromatography is a fast and relatively
easy method and provides useful information about the type
of NOM in the water sample. In comparison with tradi-
tional methods like TOC, it yields additional information
about the removal and transformation of NOM and can
hence be used as a tool for routine analysis in water
treatment plants especially in determining the function of
AC filters.
Acknowledgements
The authors wish to thank the laboratory staff at the
Rusko Water Treatment Plant for providing the analysis
results from the process. We also thank the Finnish graduate
school in Environmental Science and Technology (EnSTe)
and Kemira Chemicals for financial support.
References
Amy GL, Collins MR, Kuo CJ, King PH. Comparing gel permeation chro-
matography and ultrafiltration for the molecular weight characterization
of aquatic organic matter. J Amer Water Works Assoc 1987;1:43–9.
Amy GL, Sierka RA, Bedessem J, Price D, Tan L. Molecular size distri-
butions of dissolved organic matter. J Amer Water Works Assoc 1992;
84:67–75.
Becher G, Carlberg GE, Gjessing ET, Hongslo JK, Monarca S. High-per-
formance size exclusion chromatography of chlorinated natural humic
water and mutagenicity studies using the microscale fluctuation assay.
Environ Sci Technol 1985;19:422–6.
Collins MR, Amy GL, King PH. Removal of organic matter in water
treatment. J Environ Eng 1985;11:850–64.
Collins MR, Amy GL, Steelink C. Molecular weight distribution, carbo-
xylic acidity and humic substances content of aquatic organic matter:
implications for removal during water treatment. Environ Sci Technol
1986;20:1028–32.
Conte P, Piccola A. High pressure size exclusion chromatography (HPSEC)
of humic substances: molecular sizes, analytical parameters and column
performance. Chemosphere 1999;38:517–28.
El-Rehaili AM, Weber Jr WJ. Correlation of humic substance trihalome-
thane formation potential and adsorption behaviour to molecular weight
distribution in raw and chemically treated waters. Water Res 1987;21:
573–82.
Hayes MHB, MacCarthy P, Malcolm RL, Swift RS. The search for the
structure: setting the scene. Humic substances II. In search of structure.
Chichester: John Wiley & Sons; 1989. p. 4–30.
Kainulainen T, Tuhkanen T, Vartiainen T, Heinonen-Tanski H, Kalliokoski
P. The effect of different oxidation and filtration processes on the
molecular sizedistributionofhumicmaterials.WaterSciTechnol1994;30:
169–74.
Knuutinen J, Virkki L, Mannila P, Mikkelson P, Paasivirta J, Herve S.
High-performance liquid chromatographic study of dissolved organic
matter in natural waters. Water Res 1988;22:985–90.
McCreary JJ, Snoeyink VL. Characterization and activated carbon adsorp-
tion of several humic substances. Water Res 1980;14:151–60.
Miles CJ, Brezonik PL. High-performance size exclusion chromatography
of aquatic humic substances. J Chromatogr 1983;259:499–503.
Nissinen TK, Miettinen IT, Martikainen PJ, Vartiainen T. Molecular size
distribution of natural organic matter in raw and drinking waters. Che-
mosphere 2001;45:865–73.
Owen DM, Amy GL, Chowdhury ZK, Paode R, McCoy G, Viscosil K.
NOM characterization and treatability. J Amer Water Works Assoc
1995;87:46–63.
Pelekani C, Newcombe G, Snoeyink VL, Hepplewhite C, Assemi S, Beckett
R. Characterization of natural organic matter using high performance size
exclusion chromatography. Environ Sci Technol 1999;33:2807–13.
Potschka M. Mechanism of size-exclusion chromatography. J Chromatogr
1993;648:41–69.
Rausa R, Mazzolari E, Calemma V. Determination of molecular size dis-
A. Matilainen et al. / Environment International 28 (2002) 457–465464

tributions of humic acids by high-performance size-exclusion chroma-
tography. J Chromatogr 1991;541:419–29.
Vartiainen T, Liimatainen A, Kauranen P. The use of TSK size exclusion
columns in determination of quality and quantity of humus in raw
waters and drinking waters. Sci Total Environ 1987;62:75–84.
Vuorio E, Vahala R, Rintala J, Laukkanen R. The evaluation of drink-
ing water treatment performed with HPSEC. Environ Int 1998;24:
617–23.
Wershaw RL, Aiken GR. Molecular size and weight measurements of
humic substances. Humic substances in soil, sediment and water.
New York: Wiley-Interscience, John Wiley & Sons, Inc.; 1985. p.
477–92.
A. Matilainen et al. / Environment International 28 (2002) 457–465 465

II
Efficiency of the activated carbon fitration in the natural organic matter removal. Matilainen, A., Vieno, N. and Tuhkanen, T.
Environment International 32:324-331 (2006)
Reprinted with kind permission of Elsevier.
www.elsevier.com/locate/envint
Environment International 32 (2
Efficiency of the activated carbon filtration in the natural
organic matter removal
Anu Matilainen a,*, Niina Vieno b, Tuula Tuhkanen a
aTampere University of Technology, Institute of Environmental Engineering and Biotechnology, P.O. Box 541, FIN-33101 Tampere, FinlandbAbo Akademi University, Department of Organic Chemistry, Biskopsgatan 8, 20500 Abo, Finland
Received 15 March 2005; accepted 22 June 2005
Available online 8 August 2005
Abstract
The removal and transformation of natural organic matter were monitored in the different stages of the drinking water treatment train.
Several methods to measure the quantity and quality of organic matter were used. The full-scale treatment sequence consisted of coagulation,
flocculation, clarification by flotation, disinfection with chlorine dioxide, activated carbon filtration and post-chlorination. High-performance
size-exclusion chromatography separation was used to determine the changes in the humic substances content during the purification process;
in addition, a UV absorbance at wavelength 254 nm and total organic carbon amount were measured. A special aim was to study the
performance and the capacity of the activated carbon filtration in the natural organic matter removal. Four of the activated carbon filters were
monitored over the period of 1 year. Depending on the regeneration of the activated carbon filters, filtration was effective to a degree but did
not significantly remove the smallest molar mass organic matter fraction. Activated carbon filtration was most effective in the removal of
intermediate molar mass compounds (range 1000–4000 g/mol). Regeneration of the carbon improved the removal capacity considerably, but
efficiency was returned to a normal level after few months.
D 2005 Elsevier Ltd. All rights reserved.
Keywords: High-performance size-exclusion chromatography (HPSEC); Natural organic matter (NOM); Water purification; Activated carbon (AC) filtration
1. Introduction
Diverse organic compounds generated by the biological
processes both in a water body and in a surrounding
watershed are found in all surface waters. These compounds
are referred to as the natural organic matter (NOM). One
common approach for characterizing NOM is to divide the
mixture into the hydrophilic and hydrophobic fractions. The
hydrophilic fraction includes, e.g. carboxylic acids, carbo-
hydrates and proteins, while the hydrophobic fraction
includes so-called humic substances (HS) (Croue et al.,
2000). HS is a term referring to a broad class of interrelated
compounds, including, for example, humic and fulvic acids.
Compositions of HS vary from source to source with respect
0160-4120/$ - see front matter D 2005 Elsevier Ltd. All rights reserved.
doi:10.1016/j.envint.2005.06.003
* Corresponding author. Tel.: +358 15 3556 477; fax: +358 15 3556 323.
E-mail address: [email protected] (A. Matilainen).
to, e.g. solubility and reactivity (Aiken et al., 1985;
McCreary and Snoeyink, 1980).
NOM is important in a water treatment process due to its
role as precursor to the formation of chlorination by-products
as well as its role in the concentration and transport of
inorganic and organic pollutants (Collins et al., 1986). NOM
can be removed fromwater by traditional treatment processes
such as chemical coagulation, or by advanced techniques like
activated carbon adsorption and nanofiltration (NF) (Owen et
al., 1995). The high molar mass (HMM) matter is proved to
be more amenable to removal in the coagulation/flocculation
process than the low molar mass (LMM) material, partic-
ularly that fraction with an apparent molar mass (AMM) of
<500 g/mol (Matilainen et al., 2002; Collins et al., 1986).
Coagulation prior to the granular activated carbon (GAC)
filtration removes particles that might clog the GAC filter.
Coagulation also removes NOM, which reduces the loading
on the GAC filters (Jacangelo et al., 1995). Previous studies
006) 324 – 331

A. Matilainen et al. / Environment International 32 (2006) 324–331 325
have shown that coagulation can significantly increase both
bed life and the adsorptive capacity of NOM on GAC
(Semmens et al., 1986; Hooper et al., 1996).
GAC is an effective adsorbent used widely for drinking
water treatment. Its main use is the removal of micro-
pollutants such as pesticides, industrial chemicals, tastes and
odors and algal toxins (Newcombe, 1999). The adsorption
of compounds to the GAC is influenced by the structural
and the chemical characteristics of the carbon surface
(Newcombe, 1999; Karanfil et al., 1999). GAC adsorbs
NOM to some degree (Jacangelo et al., 1995). The
adsorption behaviour of NOM is particularly difficult to
understand due to its heterogeneous nature (Newcombe,
1999). McCreary and Snoeyink (1980) noticed that the
extent of adsorption of the HS decreased with increasing
total carboxyl groups. In many studies the LMM matter was
noticed to be more amenable for adsorption than the HMM
organic matter mainly due to size exclusion effect
(McCreary and Snoeyink, 1980; Karanfil et al., 1999;
Newcombe et al., 2002). According to study by Newcombe
et al. (2002) the adsorption of NOM is controlled predom-
inantly by the relationship between the molecular size
distribution (MSD) of NOM and the pore size distribution of
the carbon. The lifetime of the GAC filters can be expanded
by reactivation of the carbons (Hyde et al., 1987). However,
the thermal reactivation can result in an enlargement of the
macropores in the carbon because of burn-off effects and
increase the removal of the HMM organics and decrease the
LMM matter removal (Boere, 1992).
Chlorine dioxide (ClO2) is used in the water treatment
train mainly as preoxidant and disinfectant. The application
of GAC adsorption subsequent to water preoxidation by
ClO2 may lead to the formation of organic by-products due
to interactions between GAC, NOM and ClO2 (Swietlik et
al., 2002). Swietlik et al. (2004) noticed that ClO2 caused a
break-up of the large molecules and altered the MSD of
NOM towards smaller molecules. On the contrary, oxidation
with small doses of ClO2 can increase the molar masses
(MM) of some organic matter molecules (Swietlik et al.,
2002). Swietlik et al. (2002) also demonstrated that even a
small dose of ClO2 may significantly influence the
adsorptivity of the NOM onto GAC. They concluded that
after ClO2 oxidation the HMM NOM adsorbed on the GAC
filter to the higher level in comparison with the unoxidized
NOM. The adsorption of the LMM (<500 g/mol) NOM was
decreased after ClO2 oxidation. Their explanation was that
part of the LMM NOM was insignificantly affected by the
oxidant. Therefore this fraction was relatively polar and did
not absorb onto the carbon surface.
The aim of this study was to measure the organic matter
content and its transformation in the water treatment train.
The high-performance size-exclusion chromatography
(HPSEC) fractionation was used as the measuring techni-
que. In addition to HPSEC, also some conventional methods
were used. Special attention was paid to the monitoring of
the efficiency of the GAC filtration to remove NOM, and
the influence of the age and regeneration of the filters on the
NOM removal capacity.
2. Materials and methods
2.1. Rusko Water Treatment Plant
The raw water for the treatment plant is pumped from the Lake
Roine, 7 km southeast of the plant. Lake Roine is approximately 52
m2 wide and 25–35 m in depth. The raw water intake pipe goes to
the depth of 4–5 m, 200 m from the shore. The Rusko Water
Treatment Plant produces 65% of the distributed drinking water for
the city of Tampere, Finland. The maximum treatment capacity is
55000 m3/day and an average water flow is about 1400 m3/h. The
raw water source is fairly typical surface water source in Finland:
alkalinity is low (about 0.25 mmol/l), turbidity is fairly low (about
2 FTU) and the NOM content measured as total organic carbon
(TOC) is approximately 5 mg/l. The treated water has a TOC value
of about 2.5 mg/l.
The treatment process at Rusko consists of chemical addition
(Al2(SO4)3), which was added 25–33 g/m3, followed by floccu-
lation and clarification with flotation, chlorine dioxide (ClO2)
disinfection, GAC filtration, and post-chlorination (Fig. 1). The
purpose of the ClO2 addition is to disinfect the water and to control
taste and odor problems and it was added 0.2 g/m3. Chlorine gas is
used in post-chlorination to yield a free chlorine residual of 0.3 mg/
l in the purified water.
2.2. GAC filters
The 14 GAC filters are ordinary one-layer filters and each of
them has a surface area of 30 m2 and a bed depth of about 115 cm.
All similar in structure, the filters are so-called sand replacement
filters, in which the GAC replaces the sand to mechanically filter
and remove odor and taste from water. The filter contact time with
water is 15 min (1600 m3/h). The filters are flushed with water and
air after about 40 h of use and the GAC is regenerated every couple
of years. Carbons are changed after about three regenerations
because the aluminum accumulates into the filter and cannot be
removed in regeneration.
In this research four of the filters (characterized in Table 1) were
studied. The types of the filters B and C were Filtrasorb TL 820
and filter D Filtrasorb 200. Carbons in filters B and D were
changed before the start of the study. Filter C was regenerated
twice before the study and during the study in May 2001. Filter A
was Aqva Sorb BG-09 and regenerated twice before the study.
2.3. Sampling procedure
Water samples were taken once a week between the middle of
September 2000 and the end of September 2001, a total of 12
months. Samples were taken from the following stages of the
treatment sequence: (1) raw water, (2) water after the flotation,
prior to ClO2 addition, (3) water after four parallel AC filters (AC-
A, AC-B, AC-C and AC-D) before chlorination, and (4) combined
purified water from all 14 GAC filters (see Fig. 1). Basic water
analyses were done at the day of the sampling. The 10 ml samples
were collected and frozen until analysed with HPSEC and UV254
during the year 2001.

Fig. 1. Diagram of the Rusko Water Treatment Plant.
A. Matilainen et al. / Environment International 32 (2006) 324–331326
2.4. Analysis
The basic water quality parameters were measured in the
laboratory of the Rusko Water Treatment Plant. TOC samples were
measured according to the SFS-EN1484 (2001) standard and by using
a Shimadzu TOC-5000Awith a high sensitivity catalyst. Total organic
material was measured by the KMnO4 oxidation method according to
the Finnish Society of Food Science and Technology guidelines.
Hardness, alkalinity, turbidity and colour were measured according to
the SFS 3003 (1987), SFS 3005 (1981), SFS-EN ISO 7027 (2000) and
SFS-EN ISO 7887/part 4 (1995) standards, respectively.
UV254 and HPSEC measurements were done on the frozen
samples during the year 2001 at the laboratory of the Tampere
University of Technology. UV254 absorption was measured with a
Shimadzu UV-1601, UV–VIS spectrophotometer. Before the
measurement, the raw water samples and the samples after flotation
were filtered through a Gelman 0.45 Am membrane. HPSEC
samples were first filtered through a Gelman 0.45 Am membrane
and then size-exclusion fractionated with a Hewlett-Packard HPLC
1100-series system, equipped with a diode array UV detector
(k =254) and a TSKgel G3000SW 7.5 mm(ID)�30 cm column.
Pre-column was not used. Sodium acetate (0.01 M) was used as
Table 1
The type and regeneration conditions of the GAC filters studied in the Rusko W
AC-A AC-B
Name Aqva Sorb BG-09 Filtrasorb TL
Manufactured in China Belgium
Raw material Bitumic coal Bitumic coal
Iodine value 950 mg/g 900 mg/g
Granular size 90%, 0.4–1.4 mm >91%, 0.9–2
Taken in use 13.7.1995 13.6.2000
Regenerated 4.4.1998
25.5.2000
eluent at a flow rate of 1 ml/min. Injection volume was 30 Al.Method was selected and performed based on results from earlier
studies (Vartiainen et al., 1987; Peuravuori and Pihlaja, 1997).
Heights of the peaks in the chromatogram were used in data
analysis (Peuravuori and Pihlaja, 1997; Vartiainen et al., 1987).
The height of the peak in the HPSEC chromatogram refers to the
amount of the NOM in the specific molecular size fraction. The
sum of all the peak heights (SOPH) in the chromatogram
represents the total amount of the NOM capable of UV adsorption
in the sample, with the peak having the lowest retention time
referring to the highest MM and the peak having the highest
retention time to the lowest MM NOM. Determination of the
AMM for the different peak fractions is illustrated in Matilainen et
al. (2001). Determination was done with the ultrafiltration (UF)
fractionation. The values were calculated according to the method
reported by Logan and Jiang (1990). AMM for the different peak
fractions are defined roughly as >5000 g/mol, 4000–5000 g/mol,
3000–4000 g/mol, 1000–3000 g/mol, 500–1000 g/mol and <500
g/mol for the peaks I, II, III, IV, V and VI, respectively. The peaks I
and II are here referred to the HMM organic matter with the AMM
>4000 g/mol, the peaks III and IV to the intermediate molar mass
(IMM) organic matter with the AMM range of 4000–1000 g/mol
ater Treatment Plant
AC-C AC-D
820 Filtrasorb TL 820 Filtrasorb 200
Belgium Belgium
Bitumic coal Bitumic coal
900 mg/g 850 mg/g
.0 mm >91%, 0.9–2.0 mm 0.6–0.7 mm
1.12.1994 29.9.2000
12.4.1997
15.5.1999
11.5.2001

Fig. 2. HPSEC chromatogram of the raw and the treated water samples from the Rusko Water Treatment Plant. The components are eluted in order of
decreasing molecular sizes, the small molecules are the last to elute from the column (high molar mass (HMM) matter represents peaks I and II, intermediate
molar mass (IMM) peaks III and IV and low molar mass (LMM) peaks V–VII).
A. Matilainen et al. / Environment International 32 (2006) 324–331 327
and the peak V to VII to the LMM organic matter with the AMM
<1000 g/mol (see Fig. 2).
Table 2
Average results of water quality parameters measured at the Rusko Water
Treatment Plant laboratory (19.9.2000–27.9.2001)
Raw water Treated water
Average Min Max Average Min Max
KMnO4
(n =49)
mg/l 17 15 19 5.2 3.2 7.8
DOC (n =13) mg/l 5.4 4.6 5.8 2.7 2.1 3.1
TOC (n =248) mg/l 5.5 4.3 7.6 2.6 1.7 3.4
UV-254
(n =15)
cm�1 0.13 0.11 0.15 0.03 0.02 0.04
pH (n =253) 7.1 6.7 7.4 8.4 7.8 9.0
Alkalinity
(n =253)
mmol/l 0.25 0.23 0.30 0.73 0.57 0.85
Conductivity
(n =55)
mS/m 6.5 6.1 7.1 14 13 16
Turbidity
(n =253)
FTU 2.1 0.16 5.5 0.10 0.01 0.23
Colour (n =50) mg Pt/l 16 10 25 <2.5 <2.5 2.5
Hardness
(n =54)
-dH 1.1 0.96 1.8 3.3 3.0 3.5
n =maximum amount of measurements.
3. Results and discussion
3.1. NOM removal in the treatment train
On average, the treatment process removed 69%, 53%, 77%,
95% and 84% of NOM measured as KMnO4, TOC, UV254,
turbidity and colour, respectively (Table 2). In the HPSEC
measurements, five to seven peaks were found in the raw water
samples (Fig. 2). Other researchers have obtained similar patterns
on the Finnish surface water samples (Myllykangas et al., 2002;
Nissinen et al., 2001; Vuorio et al., 1998; Vartiainen et al., 1987).
However, it must be emphasized that the HPSEC column gels
might have charge repulsion effects (Peuravuori and Pihlaja, 1997),
as well as adsorption interactions with the humic compounds
(Myllykangas et al., 2002), which can affect the measurement of
the NOM with the HPSEC. When using UV adsorption as a
detection method, one should also remember that small aliphatic
compounds do not adsorb UV light due to the lack of conjugated
double bonds, and thus are not indicated by the UV254 measure-
ments. Still, the similar TSK columns as ours have been used for
NOM measurements for more than 17 years and the method has
proved to be highly informative in studying changes in the MSD of
NOM (Myllykangas et al., 2002; Nissinen et al., 2001; Vuorio et
al., 1998; Peuravuori and Pihlaja, 1997; Vartiainen et al., 1987).
Calculated as the sum of the peak heights (SOPH) on the
chromatogram, the total removal of the NOM was 75% at the
treatment process when the yearly average results of the raw and
treated water were compared (Fig. 3). The raw water consisted
mostly of the HMM and the IMM NOM (Fig. 2). The treated water
had very small amount of HMM matter left and also the IMM
matter was diminished considerably. The removal of the LMM
compounds was the most inefficient (Fig. 3).
3.2. NOM removal on the coagulation
Coagulation/flocculation followed by flotation removed effi-
ciently the HMM organic matter. The highest MM fraction (>5000
g/mol) was completely removed and the second highest (4000–
5000 g/mol) by over 90%. About 60% of the IMM matter remained

Fig. 3. Different MM fractions of NOM remained (according to the HPSEC results) after each purification process (in % compared to the raw water results)
calculated as an average during the investigation 19.9.2000–27.9.2001 (n =53).
A. Matilainen et al. / Environment International 32 (2006) 324–331328
in water on the coagulation/flocculation and flotation. The removal
of the LMM matter was more complicated. About 80% of the
LMM matter was still present in water after the coagulation process
(Fig. 3). According to the literature, the removal of the LMM
fraction in coagulation is difficult because it consists mostly of
fulvic acids, which are difficult to destabilize by the aluminum
coagulation dosages commonly employed in the water treatment
(Collins et al., 1986).
3.3. NOM removal on the GAC filtration
The HMM substances, which were easily removed in the
coagulation, reappeared in the GAC filtered water and in the
combined purified water from time to time. The overall increase
compared to the situation after the coagulation/flotation was nearly
10%. This may be due to the polymerisation of the organic matter in
the ClO2 oxidation before the GAC filtration. It has been reported
that small doses of ClO2 oxidant could increase themolecular weight
of some NOMmolecules (Swietlik et al., 2002). When compared to
the sample collected after the coagulation/flotation, the enhance-
ment of the removal of the IMM fraction in the GAC filtration was in
general about 20%. The amount of the LMM matter diminished
slightly in the GAC filtration, except of the smallest fraction, which
increased occasionally.
The overall efficiency of the parallel GAC filters to remove the
different MM fractions of NOM is shown in Fig. 4. The removal or
reappearance of the MM fractions in the GAC filtration is
compared to the values measured after the coagulation/flotation
but prior the ClO2 oxidation. The highest MM fraction (peak I,
>5000 g/mol) disappeared after the flotation. During the study, it
reappeared few times in samples taken after the GAC filtration.
This happened in every filter in January and February and again in
the summertime. This phenomenon may be due to the polymer-
isation in the ClO2 oxidation that was mentioned earlier or
breakthrough of the components from the filter bed. The height
of the peak II (4000–5000 g/mol) increased and decreased without
a clear pattern. Thus, the GAC filtration did not cause any further
purification of the HMM (>4000 g/mol) fraction of the NOM.
Compared to the situation after the coagulation/flotation, the
removal of the NOM represented by the peaks III, IV and V
(MM 500–4000 g/mol) was further enhanced in every GAC filter
studied. On average, the removal rates were 27%, 30%, 36% and
36% on the filters A, B, C and D, respectively. Swietlik et al.
(2002) noticed in their study that the GAC filtered water previously
treated with ClO2 contained exclusively the LMM fraction of
NOM with the AMM <500 g/mol compared to the untreated water.
This means that after the ClO2 oxidation the HMM and the IMM
fraction of the NOM adsorbed better on the GAC filter. According
to our study, the reduction of the LMM matter was complicated. As
mentioned before, the small molecules are less visible in the
HPSEC measurements because of their week UV254 response
resulting from the scarcity of the aromatic structures (Nissinen et
al., 2001). Still, in our study, the MM fraction of <500 g/mol
(peaks VI and VII) was observed to increase occasionally in the
filtered water. Especially in the spring and the summer few large
increases in the amount of this MM fraction were noticed. In some
cases, the peak VII emerged only on the GAC filtered water. The
increase in the amount of the NOM in the MM fraction of <500 g/
mol may be due to the breakthrough of the molecules that may
have been the decomposition or metabolic products of the bacteria
living in the filters (Boualam et al., 2003; Vuorio et al., 1998). The
overall poor removal values of the MM fraction of <500 g/mol
may also be due to the oxidation of the NOM with ClO2 just before
the GAC filtration. The oxidation may have caused the large

Fig. 4. The efficiency of the GAC filtration to remove the residual MM fractions of NOM remained after coagulation/flotation in percentages with variation
bars (n =53).
A. Matilainen et al. / Environment International 32 (2006) 324–331 329
molecules to break-up into the smaller ones (Swietlik et al., 2004).
These small molecules do not adsorb well in to the GAC because
of their high polarity (Swietlik et al., 2002).
Fig. 5. Influence of the regeneration to the capacity of filter AC-C to remove differ
on the average of the percentage removal values 2 months prior to the regenerati
One of the filters was regenerated during the study. Filter AC-C
was regenerated for the third time in May 2001. In general, the
regeneration significantly enhanced the removal of the NOM, and
ent MM fractions of NOM after coagulation/flotation. Values are calculated
on to the averages of values 2 months after regeneration.

A. Matilainen et al. / Environment International 32 (2006) 324–331330
especially the IMM matter removal (Fig. 5). The IMM matter
removal efficiency was approximately 45% higher right after the
regeneration. The HMM matter (mainly fraction 4000–5000 g/
mol) removal rate increased to about 40% and the increase in the
removal rates of the part of the LMM matter was about 30%.
However, the removal of this LMM fraction was on average very
irregular. Boere (1992) noticed in his study that the removal of the
HMM matter organics was constant or increasing after the
reactivation and the content of the LMM matter was constant or
decreasing. The carbon in AC-D was changed to a new one in the
beginning of the study, in October 2000, and same improvement
was detected especially in the IMM matter removal, as with
regeneration of the filter AC-C. However, the efficiency seemed to
be reverted to the same level as before regeneration and change of
carbon within few months.
4. Conclusions
The treatment process at the Rusko Water Treatment
Plant removed 53–95% of the NOM from the raw water
according to different measurement techniques. Measured
with HPSEC, the HMM matter was removed almost
completely and the IMM matter reduced considerably but
the LMM matter was hard to remove in the process.
The capacity of the GAC filtration to remove the organic
matter was influenced by the age and the regeneration of the
carbons on the filters. In general, different MM fractions
remained in water after the coagulation/flotation process
was removed in GAC filtration dissimilarly. The amount of
the HMM matter did not reduce any further. The GAC
filtration was the most effective in the IMM organic matter
removal. The LMM organic matter was hard to remove even
in the GAC filtration. On the contrary, the LMM organic
fraction increased occasionally. This might be due to
bacteria living on the filter and release of metabolites from
the filter bed. The ClO2 oxidation prior the GAC filtration
most probably decreased the adsorption of the LMM
fraction of NOM. Regeneration or change of the carbon
enhanced the NOM removal considerably, but within few
months efficiency reverted to the level before the operation.
HPSEC was very useful tool for monitoring the
organic matter quantity and quality during the water
treatment process. Particularly, to the monitoring of the
condition of an individual GAC filter, HPSEC can
provide the information about the removal efficiency
quickly and relatively easily. Hence, the saturation and
decrease of efficiency of the filters to remove NOM are
noticed immediately.
Acknowledgements
The authors wish to thank the Finnish Graduate
School in Environmental Science and Technology
(EnSTe) and Kemira Chemicals Ltd for financial support.
We would also like to thank the Water Works of
Tampere and Rusko Water Treatment Plant laboratory
staff, especially Mrs. Terttu Makinen and Mr. Jukka
Meriluoto for all the information and help during the
research.
References
Aiken G, McKnight D, Wershaw R, MacCarthy R, editors. Humic
substances in soil, sediment and water. John Wiley & Sons; 1985.
Boere JA. Combined use of ozone and granular activated carbon (GAC) in
potable water treatment: effects on GAC quality after reactivation.
Ozone Sci Eng 1992;14:123–37.
Boualam M, Fass S, Saby S, Lahoussine V, Cavard J, Gatel D, et al.
Organic matter quality and survival of coliforms in low-nutritive waters.
J Am Water Works Assoc 2003;95:119–26.
Collins MR, Amy GL, Steelink C. Molecular weight distribution,
carboxylic acidity and humic substances content of aquatic organic
matter: implications for removal during water treatment. Environ Sci
Technol 1986;20:1028–32.
Croue J, Korshin GV, Benjamin M. Characterization of natural organic
matter in drinking water. USA: AWWARF Am Water Works Assoc;
2000 [ISBN 1-58321-015-6].
Hooper SM, Summers RS, Solarik G, Owen DM. Improving GAC
performance by optimised coagulation. J Am Water Works Assoc
1996;88:107–20.
Hyde RA, Hill DG, Zabel TF, Burke T. Replacing sand with GAC in rapid
gravity filters. J Am Water Works Assoc 1987;79:33–8.
Jacangelo JG, DeMarco J, Owen DM, Randtke SJ. Selected processes for
removing NOM: an overview. J Am Water Works Assoc 1995;87:
64–77.
Karanfil T, Kitis M, Kilduff JE, Wigton A. Role of granular activated
carbon surface chemistry on the adsorption of organic compounds: 2.
Natural organic matter. Environ Sci Technol 1999;33:3225–33.
Logan B, Jiang Q. Molecular size distributions of dissolved organic matter.
J Environ Eng 1990;116:1046–62.
Matilainen A, Lindqvist N, Korhonen S, Tuhkanen T. Characterization of
the organic matter transformation in different stages of the water
treatment process. IWA 2nd World Water Congress, October 15–17,
Berlin, Germany; 2001.
Matilainen A, Lindqvist N, Korhonen S, Tuhkanen T. Removal of NOM in
the different stages of the water treatment process. Environ Int 2002;
28:457–65.
McCreary JJ, Snoeyink VL. Characterization and activated carbon
adsorption of several humic substances. Water Res 1980;14:151–60.
Myllykangas T, Nissinen T, Rantakokko P, Martikainen P, Vartiainen T.
Molecular size fractions of treated aquatic humus. Water Res 2002;
36:3045–53.
Newcombe G. Charge vs porosity—some influences on the adsorption of
natural organic matter (NOM) by activated carbon. Water Sci Technol
1999;40:191–8.
Newcombe G, Morrison J, Hepplewhite C. Simultaneous adsorption of
MIB and NOM onto activated carbon: I. Characterization of system and
NOM adsorption. Carbon 2002;40:2135–46.
Nissinen TK, Miettinen IT, Martikainen PJ, Vartiainen T. Molecular size
distribution of natural organic matter in raw and drinking waters.
Chemosphere 2001;45:865–73.
Owen DM, Amy GL, Chowdhury ZK, Paode R, McCoy G, Viscosil K.
NOM characterization and treatability. J Am Water Works Assoc 1995;
87:46–63.
Peuravuori J, Pihlaja K. Molecular size distribution and spectroscopic
properties of aquatic humic substances. Anal Chim Acta 1997;337:
133–49.
Semmens MJ, Staples AB, Hohenstein G, Norgaard GE. Influence of
coagulation on removal of organics by granular activated carbon. J Am
Water Works Assoc 1986;78:80–4.

A. Matilainen et al. / Environment International 32 (2006) 324–331 331
SFS 3003. Determination of the sum of calcium and magnesium in water
Titrimetric method. Helsinki, Finland’ Finnish Standards Association
SFS; 1987.
SFS 3005. Alkalinity and acidity in water Potentiometric titration. Helsinki,
Finland’ Finnish Standards Association SFS; 1981.
SFS-EN 1484. Water analysis Guidelines for the determination of total
organic carbon (TOC) and dissolved organic carbon (DOC). Helsinki,
Finland’ Finnish Standards Association SFS; 2001.
SFS-EN ISO 7027. Water quality Determination of turbidity. Helsinki,
Finland’ Finnish Standards Association SFS; 2000.
SFS-EN ISO 7887. Water quality Examination and determination of colour.
Helsinki, Finland’ Finnish Standards Association SFS; 1995.
Swietlik J, Raczyk-Stanislawiak U, Bilozor S, Ilecki W, Nawrocki J.
Adsorption of natural organic matter oxidized with ClO2 on granular
activated carbon. Water Res 2002;36:2328–36.
Swietlik J, Dabrowska A, Raczyk-Stanislawiak U, Nawrocki J. Reactivity
of natural organic matter fractions with chlorine dioxide and ozone.
Water Res 2004;38:547–58.
Vartiainen T, Liimatainen A, Kauranen P. The use of TSK size exclusion
columns in determination of quality and quantity of humus in raw
waters and drinking waters. Sci Total Environ 1987;62:75–84.
Vuorio E, Vahala R, Rintala J, Laukkanen R. The evaluation of
drinking water treatment performed with HPSEC. Environ Int 1998;
24:617–23.

III
Comparison of the efficiency of aluminium and ferric sulphate in the removal of natural organic matter during drinking water treatment process.
Matilainen, A., Lindqvist, N. and Tuhkanen, T.
Environmental Technology 26:867-857 (2005)
Reprinted with kind permission of Selper Ltd.


IV
The role of ozonation and activated carbon filtration in the natural organic matter removal from drinking water.
Matilainen, A., Iivari, P., Sallanko, J., Heiska, E. and Tuhkanen, T.
Environmental Technology 27:1171-1180 (2006)
Reprinted with kind permission of Selper Ltd.


V
Enhancement of the natural organic matter removal from drinking water by nanofiltration.
Matilainen, A., Liikanen, R., Nyström, M., Lindqvist, N. and Tuhkanen, T.
Environmental Technology 25:283-291 (2004)
Reprinted with kind permission of Selper Ltd.


������������� ����� �����������������������
������������������������ ����� �!�"���#$%&������������'#�� ��(