removal of methylene blue from aqueous ...(random), the kinetic data well described by pseudo-second...
TRANSCRIPT

www.wjpr.net Vol 7, Issue 19, 2018. 230
Abood et al. World Journal of Pharmaceutical Research
REMOVAL OF METHYLENE BLUE FROM AQUEOUS SOLUTIONS
USING IRAQI PORCELLANITE ROCKS
Methaq I. Abood*1 and Andtarik E. Jassim
2
1Marine Sciences Center, University of Basrah, Basrah-Iraq.
2College of Education for Pure Science, University of Basrah, Basrah-Iraq.
ABSTRACT
Industrial wastewater and other polluted water need to be treated to
make it possible to discharge into rivers and reuse them. Adsorption
takes the importance of ways to remove organic and inorganic
pollutants in water. The search for materials that are locally available
and cheap to use as adsorbent surfaces. The Iraqi porcellanite powder
can be used to remove the dye of Methylene Blue in batch method. The
effect of various experimental parameters such as contact time,
temperature, solution pH, weight of adsorbent, initial dye
concentration, ionic strength were investigated. The adsorption studies
included both equilibrium adsorption isotherms and kinetics. The
applicability of Langmuir and Freundlich equations was investigated at different temperature,
and the Freundlich isotherm exhibited the best fit with experimental data. The
thermodynamic parameters indicated that the adsorption was a spontaneous process (ΔG was
negative), the negative value of ΔH indicate endothermic and ΔS was positive value
(random), the kinetic data well described by Pseudo-second order kinetic model with intra
particle diffusion as one of the rate limiting steps.
KEYWORDS: Adsorption, Methylene Blue, Thermodynamic and Kinetic.
INTRODUCTION
Synthetic dyes are one of most important materials that are widely used in many industries
such as textiles, cosmetics, leather, wool, paper, printing, pharmaceutical and food industries,
and may generate large amounts of aqueous colored effluents and causes an important
environmental proplems faced the human in last century.[1]
World Journal of Pharmaceutical Research SJIF Impact Factor 8.074
Volume 7, Issue 19, 230-243. Research Article ISSN 2277– 7105
Article Received on
15 Oct. 2018,
Revised on 05 Nov. 2018,
Accepted on 26 Nov. 2018
DOI: 10.20959/wjpr201819-13793
*Corresponding Author
Methaq I. Abood
Marine Sciences Center,
University of Basrah, Basrah-
Iraq.

www.wjpr.net Vol 7, Issue 19, 2018. 231
Abood et al. World Journal of Pharmaceutical Research
The presence of very small amounts of dye in water (< 1ppm for some dyes) causes aesthetic
worsening and decrease the solubility of dissolved oxygen, water transparency, and sunlight
permeability, affecting aquatic life and the food chain.[2]
As one of the common dyes,
methylene blue (MB) is widely used as the coloring agent and disinfected in rubbers,
pharmaceuticals, pesticides, varnishes, and dyestuffs and so on[3]
, it has been reported that
cationic dyes like MB are more toxic than anionic dyes.[4]
Dyes usually have complex
aromatic molecular structures which make them more stable and difficult to biodegrade, due
to this a conventional biological waste water treatment process is not very efficient in treating
dye waste water.
The removal of color from waste water can be accomplished by filtration, microbiological
decomposition, ion exchange, chemical coagulation, chemical oxidation and adsorption.[5]
The adsorption process provides an attractive and alternative treatment especially if the
adsorbent is, inexpensive and readily available.[6]
Therefore the development of efficient, low cost and eco friendly technologies is needed to
reduce the dye content in waste water. Among treatment technologies adsorption It is the
most efficient method for the removal of synthetic dyes from aqueous effluents.[7,8]
In this
present study, we studied the adsorption of methylene blue dye on the surface of Iraqi
porcellanite. The system variables studied include sorbent dose, contact time, initial
concentration of the dye, pH, FTIR analysis, ionic strength and temperature.
MATERIALS AND METHODS
The cationic dye methylene blue (MB) was used as an adsorbate in this work. Molecular
formula :(C16H18N3CIS) was procured from B.D.H and the molecular weight of 319.85
gmol−1. The chemical structure of MB is shown in Fig. 1.
MB dye solution was prepared by dissolving 0.1 g of dye in 1 L the 100 mg/L then dilution to
required concentration. wavelength at maximum absorbance (λmax) was determined by
scanning the wavelength and found to be 663.5.
Fig. 1: Chemical Structure of Methylene Blue.

www.wjpr.net Vol 7, Issue 19, 2018. 232
Abood et al. World Journal of Pharmaceutical Research
EXPERIMENTAL
Adsorbent materiel
Natural porcellanite samples were obtained from the Ministry of Industry and Minerals (The
general company for Geological survey and mining), the clay in powder forms were washed
with distilled water to remove impurities and dispose of disposable materials, water soluble
salts and other, dried samples for three hours in the oven (at 600°C) and then crushed and
sieved to a particle size of 75 μm and then used for experimental work.
Adsorbent Characterization
In order to elucidate the particle properties (e.g., surface morphology and particle size) of the
resulting porceiianite powders the powder texture was observed by the scanning electron
microscope (SEM).
Chemical functional groups were examined by FT-IR apparatus type Shimadzu using KBr
pellet method of room temperature. The spectra were retrieved in the wave number range
from 400 to 4000 cm-1
.
Adsorption studies
Batch equilibrium experiments had been carried out to find the optimum pH, contact time and
equilibrium isotherms. A series of 100 ml stopper conical flasks were used by adding 0.5 gm
of Porcellanite particle size of (75 μm) to 50 ml of 100 mg/l of dye.
The experiments were done at room temperature, after gentle shaking for desired time at 120
rpm. The mixture was then centrifuged and the concentration of the dye determines using
UV-Vis spectrophotometer (UV-1200 Spectrophotometer). The removal efficiency and the
equilibrium uptake of MB dye were calculated according to the equations:
% Removal = 100 …….1
Qe = m
CCVsol eo )-.(= ……..2
Where Co is concentration of dye before the adsorption (mg/l), Ce is equilibrium
concentration (mg/l), m (g) adsorbent weight and V solution volume in liter, Qe is the
equilibrium adsorption capacity (mg/g).

www.wjpr.net Vol 7, Issue 19, 2018. 233
Abood et al. World Journal of Pharmaceutical Research
Kinetic study
Kinetic of methylene Blue on Porcellanite was carried out with (0.5 g) of the porcellanite
powder transferred into 100 ml screw cupped conical flask containing 50 ml of 100 mg/l of
tested dye, different samples were shaken at (120 rpm) for (10, 20, 30 and 40oC) by using
isothermal water-bath shaker then the mixture solution was taken out at different periods of
time. The mixture was centrifuged then measure the amount of the adsorbed dye
spectrophotometrically at 663.5 nm, and estimated by eq.(2).
RESULTS AND DISCUSSION
Characterization of the adsorbent
The FT-IR spectrum as show in figure (2) and Chemical functional in the porcellanite
characteristic bands.
Fig. (2): FT-IR of porcellanite powder.
The results of the FTIR spectrum of the porcellanite rock powder, Fig(2) showed the
presence of the main absorption bands. We observe a strong band confined between 3460 -
3620 cm-1
resulting from the stretching vibration of the hydroxyl groups. The absorption band
at (1138.00 cm-1
) belongs to Si-O group. The spectrum also showed peak at (467 cm-1
)
represent Absorption of the group (Fe-O). The spectrum shows an absorption band at
(792.7cm-1
) and represents the absorption of the group (Al-O). These chemical groups
represent effective sites where the adsorption process occurs because of its negative charge,
which gives these groups the ability to form chemical bonds or physical bonds because they
contain an electronic pair or an electrostatic charge that you can share to form a physical
link.[9]
www.wjpr.net Vol 7, Issue 19, 2018. 234
Abood et al. World Journal of Pharmaceutical Research
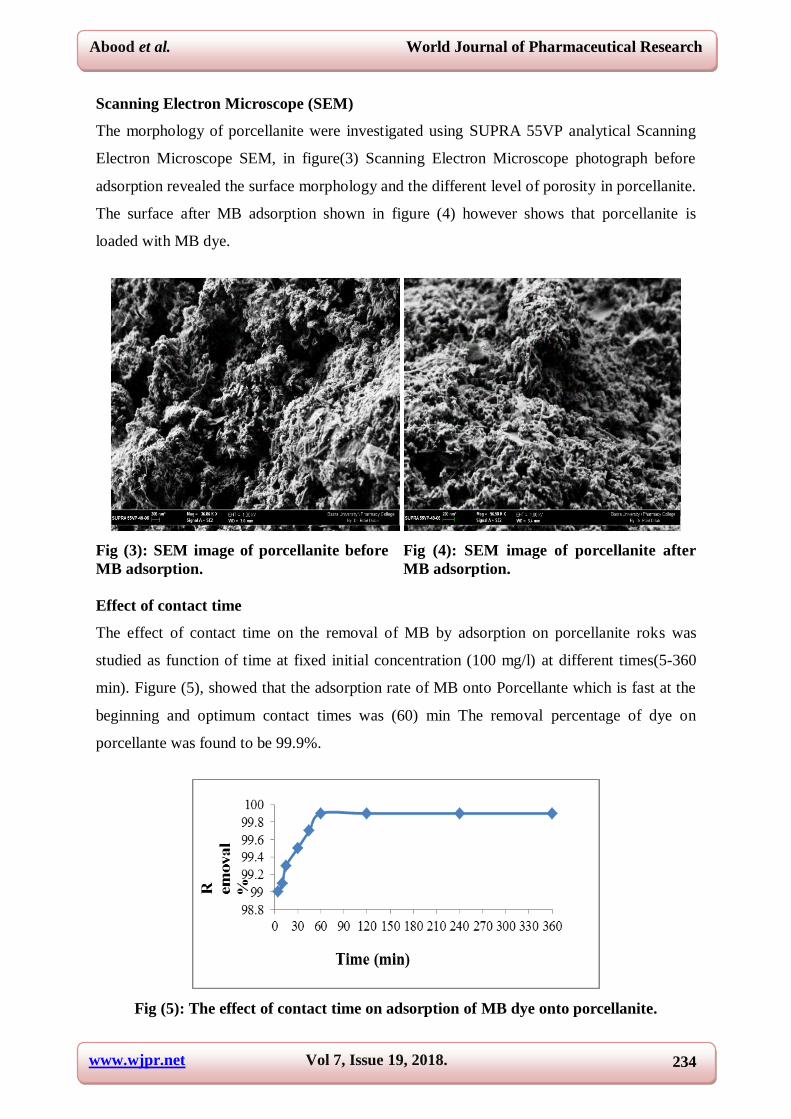
Scanning Electron Microscope (SEM)
The morphology of porcellanite were investigated using SUPRA 55VP analytical Scanning
Electron Microscope SEM, in figure(3) Scanning Electron Microscope photograph before
adsorption revealed the surface morphology and the different level of porosity in porcellanite.
The surface after MB adsorption shown in figure (4) however shows that porcellanite is
loaded with MB dye.
Fig (3): SEM image of porcellanite before
MB adsorption.
Fig (4): SEM image of porcellanite after
MB adsorption.
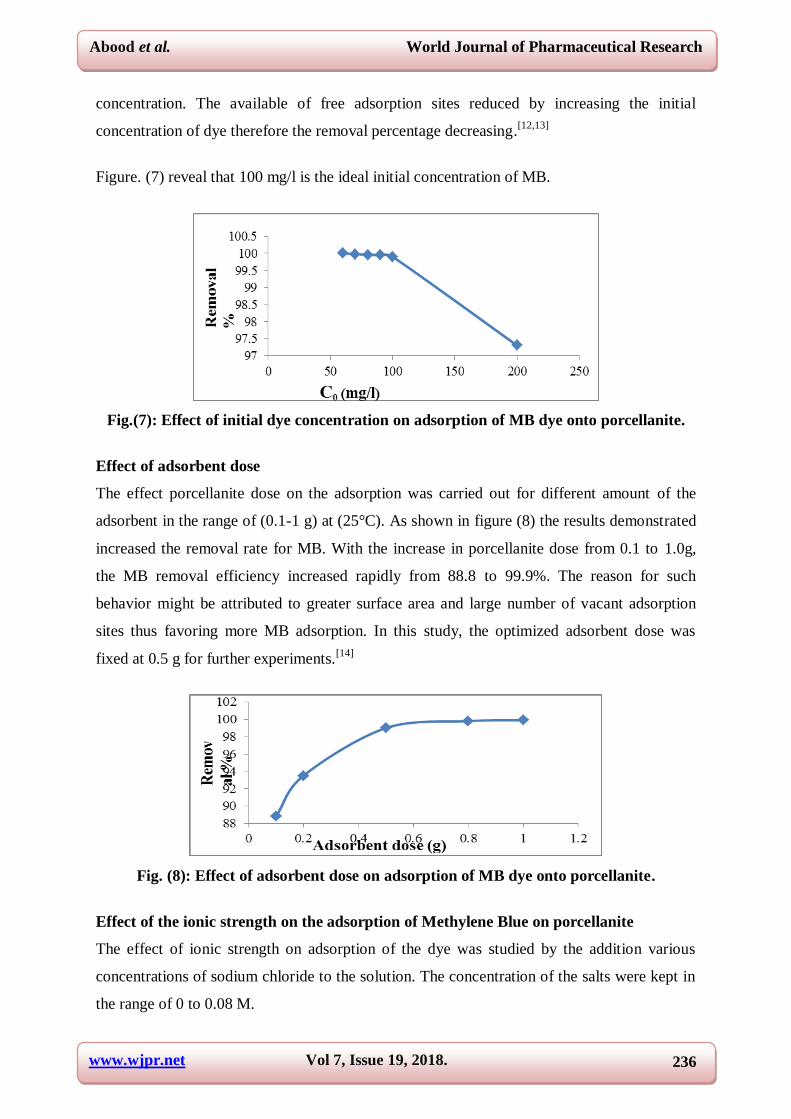
Effect of contact time
The effect of contact time on the removal of MB by adsorption on porcellanite roks was
studied as function of time at fixed initial concentration (100 mg/l) at different times(5-360
min). Figure (5), showed that the adsorption rate of MB onto Porcellante which is fast at the
beginning and optimum contact times was (60) min The removal percentage of dye on
porcellante was found to be 99.9%.
Fig (5): The effect of contact time on adsorption of MB dye onto porcellanite.

www.wjpr.net Vol 7, Issue 19, 2018. 235
Abood et al. World Journal of Pharmaceutical Research
Effect of pH on adsorption of MB dye
The pH is one of the most important factors controlling the adsorption of dye onto adsorbent.
Adsorption f MB onto porcellanite was carried out for the examination of influence of pH on
the dye adsorption, while the initial dye concentration, contact time, temperature, and amount
of porcellanite were fixed. (50mg/l),4hr, (25°C),(0.5g) respectively. at a rangeof (2 -11) The
pH was adjusted by adding a small amount of 0.1M HCl and/or 0.1M NaOH; and it was
found that the removal percentage increased with increase in pH (Figure 6) Figure showed
that at low pH value, the adsorption was decreased. When solution pH increased from 2 to
11, the adsorption increased. The maximum dye uptake was observed in the pH range of (11).
The basic dyes give positively charged ions when dissolved in water. Thus, in acidic medium
positively charged surface of sorbent tends to oppose the adsorption of cationic sorbate
species. When the pH of dye solution is increased the surface tends to acquire negative
charge, thereby resulting in an increased adsorption of dyes due to increasing electrostatic
attraction between positively charged sorbate and negatively charged sorbent.[10]
As the pH of
the aqueous phase is lowered, a solid surface will usually become more positive, or less
negative, because of adsorption onto charged sites of protons from the solution with
consequent increase in the adsorption of anionic surfactants and decrease in the adsorption of
cationics.[11]
Fig (6): Effect of pH on adsorption of MB dye onto porcellanite surface.
Effect of initial dye concentration
The effect of initial concentration of dye solution on the adsorption was carried out for
different concentration of dye solution in the range of (60-200 mg/l) at (25°C). The result
revealed that the percentage adsorption of dye was decreases with increases in initial
www.wjpr.net Vol 7, Issue 19, 2018. 236
Abood et al. World Journal of Pharmaceutical Research
concentration. The available of free adsorption sites reduced by increasing the initial
concentration of dye therefore the removal percentage decreasing.[12,13]
Figure. (7) reveal that 100 mg/l is the ideal initial concentration of MB.
Fig.(7): Effect of initial dye concentration on adsorption of MB dye onto porcellanite.
Effect of adsorbent dose
The effect porcellanite dose on the adsorption was carried out for different amount of the
adsorbent in the range of (0.1-1 g) at (25°C). As shown in figure (8) the results demonstrated
increased the removal rate for MB. With the increase in porcellanite dose from 0.1 to 1.0g,
the MB removal efficiency increased rapidly from 88.8 to 99.9%. The reason for such
behavior might be attributed to greater surface area and large number of vacant adsorption
sites thus favoring more MB adsorption. In this study, the optimized adsorbent dose was
fixed at 0.5 g for further experiments.[14]
Fig. (8): Effect of adsorbent dose on adsorption of MB dye onto porcellanite.
Effect of the ionic strength on the adsorption of Methylene Blue on porcellanite
The effect of ionic strength on adsorption of the dye was studied by the addition various
concentrations of sodium chloride to the solution. The concentration of the salts were kept in
the range of 0 to 0.08 M.

www.wjpr.net Vol 7, Issue 19, 2018. 237
Abood et al. World Journal of Pharmaceutical Research
As shown in Fig. 9, increasing the ionic strength of the solution caused decrease in adsorption
capacity of the dye. This could be attributed to the competition phenomenon between the dye
molecules and the ions for the same sites of the adsorbent. On the other hand, “ionic
atmosphere may be progressively formed around MB molecules with increased NaCl
concentration and result in the reduction of MB adsorption onto porcellante.[15]
Fig. (9): Effect of ionic strength on adsorption of MB dye onto porcellanite.
Adsorption Isotherm
Adsorption isotherm is the relationship between the amount of a substance adsorbed and its
concentration in the equilibrium solution at constant temperature. The adsorption isotherm is
important from both a theoretical and a practical point of view, because the application of
adsorption isotherms facilitates describing the interaction between the adsorbate and the
adsorbent of any system. The parameters obtained from the different models provide
important information on the adsorption mechanisms and the surface properties and affinities
of the adsorbent.[16]
The adsorption of dye from aqueous solution on porcellanite has been
studied at different temperatures (10, 20, 30 40°C) the general shape of dye adsorption
isotherm are show in figure (10) where the quantities adsorbed on porcellanite (Qe) are
plotted as a function of equilibrium concentration (Ce) at (10, 20, 30 and 40°C).
Fig. (10): Adsorption isotherm of dye onto porcellanite at different temperatures.

www.wjpr.net Vol 7, Issue 19, 2018. 238
Abood et al. World Journal of Pharmaceutical Research
The shape of the adsorption isotherm of MB dye on porcellanite consistent with (S 3 type) on
the Giles classification. This type, indicative of vertical or flat orientation of adsorbed, there
is strong inter-molecular attraction within the adsorbed layer, and the adsorbate is
monofunctional. In the initial part of an S-curve, the more solute was already adsorbed, the
easier it is for additional amounts to become fixed.[17]
The experimental adsorption data were
applied to both the theoretical Langmuir isotherm equation and empirical Freundlich
equation. The results of applying Langmuir e (eq.3) and Freundlich (eq.4).
......3Q
C
bQ
1
Q
C
mm
e
e
e
Where Qm is the maximum adsorption capacity (mg/g) and b is related to the adsorption
energy.
Log Qe = log Kf + log Ce…….4
Where Kf is a function of the adsorption capacity and n is the intensity of adsorption.
Table (1) Results of application of Langmuir & Freundlich isotherm on the system
studied.
MB
dye
Temp(oC)
Langmuir Freundlich
Qm
(mg/g)
b
(l/g) R
2 Kf n R
2
10 10.52 0.79 0.972 4.750 2.525 0.973
20 14.70 1.41 0.989 4.830 2.109 0.994
30 14.92 0.56 0.994 5.432 2.074 0.996
40 14.92 0.41 0.989 7.925 2.386 0.991
The Langmuir and Freundlich isotherms are applied on the experimental data of the
adsorption of MB dye on porcellanite by plotting (Ce/qe) versus (Ce) and (logqe) versus
(logCe) respectively Langmuir and Fruendlich isotherms Figure 11 & 12). The Langmuir
assumes the adsorbent surface is uniform with limit number of active site and no more
adsorption take place after formation monolayer.[18,19]
Freundlich assumes heterogeneous
surface and the concentration of adsorbate affect the adsorption capacity.[20]
and (The results
of Table (1) show that the value of (Qm) increased with increasing in the temperature because
the adsorption was endothermic, (Kf) is a function of the adsorption capacity and (n) is a
function of the strength used adsorption material. Value of n low showed adsorption bond is
weak, when the value of n <1 the adsorption coefficient increases with increasing
concentration of the solution led to an increase in hydrophobic surface characteristics after
monolayer. When the value of n>1 Kf decreases with concentration.[21]
The results also show

www.wjpr.net Vol 7, Issue 19, 2018. 239
Abood et al. World Journal of Pharmaceutical Research
that the Freundlich isotherm is better fitted on this system than the Langmuir isotherm as
show by the linear relationship of (log qe) versus (log Ce) figure (12).
Fig. (11): Linear form of Langmuir isotherm of MB dye on porcellanite at different
temperatures.
Fig. (12): Linear form of Freundlich isotherm of MB dye on porcellanite at different
temperatures.
Thermodynamic Study
The adsorption of methylen blue onto porcellanite was investigated as a function of
temperature The effect of temperature was studied for temperatures ranging from 10°C to
40°C using different initial concentration, and the thermodynamic parameters free energy
change (ΔG), enthalpy change ΔH and enthalpy change ΔS, which are important in
determining the feasibility, spontaneity and the nature of adsorbate-adsorbent interactions,
can be obtained by using the following mathematical relations:
K = Csolid / Cliquid……… 6
www.wjpr.net Vol 7, Issue 19, 2018. 240
Abood et al. World Journal of Pharmaceutical Research
G = – RT ln K ……. ……. 7
Where ΔG is the Gibbs energy change (KJ.mol-1), K is the equilibrium constant, Csolid is
the solid phase concentration at equilibrium (mg/l),Cliquid is the liquid phase concentration
at equilibrium (mg/l), T is the temperature in Kelvin and R is the gas constant (0.008314 KJ.
mol-1
. K-1
).
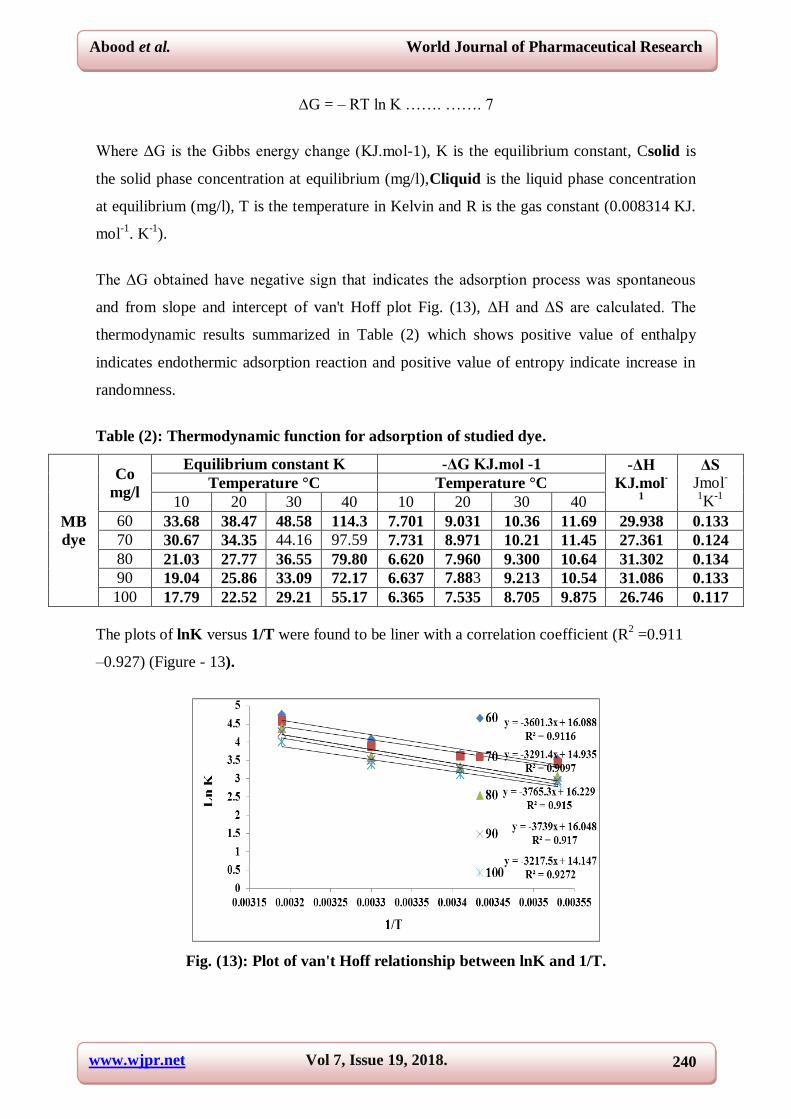
The ΔG obtained have negative sign that indicates the adsorption process was spontaneous
and from slope and intercept of van't Hoff plot Fig. (13), ΔH and ΔS are calculated. The
thermodynamic results summarized in Table (2) which shows positive value of enthalpy
indicates endothermic adsorption reaction and positive value of entropy indicate increase in
randomness.
Table (2): Thermodynamic function for adsorption of studied dye.
MB
dye
Co
mg/l
Equilibrium constant K -ΔG KJ.mol -1 -ΔH
KJ.mol-
1
ΔS Jmol
-
1K
-1
Temperature °C Temperature °C
10 20 30 40 10 20 30 40
60 33.68 38.47 48.58 114.3 7.701 9.031 10.36 11.69 29.938 0.133
70 30.67 34.35 44.16 97.59 7.731 8.971 10.21 11.45 27.361 0.124
80 21.03 27.77 36.55 79.80 6.620 7.960 9.300 10.64 31.302 0.134
90 19.04 25.86 33.09 72.17 6.637 7.883 9.213 10.54 31.086 0.133
100 17.79 22.52 29.21 55.17 6.365 7.535 8.705 9.875 26.746 0.117
The plots of lnK versus 1/T were found to be liner with a correlation coefficient (R2 =0.911
–0.927) (Figure - 13).
Fig. (13): Plot of van't Hoff relationship between lnK and 1/T.
www.wjpr.net Vol 7, Issue 19, 2018. 241
Abood et al. World Journal of Pharmaceutical Research
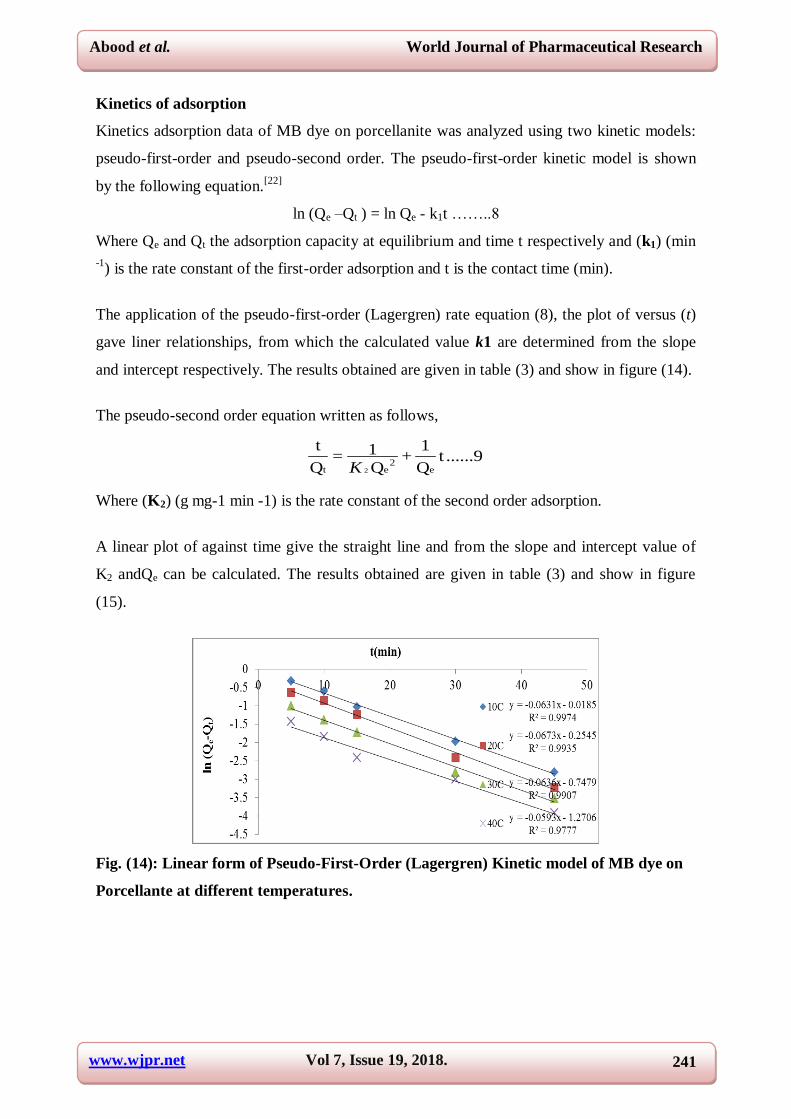
Kinetics of adsorption
Kinetics adsorption data of MB dye on porcellanite was analyzed using two kinetic models:
pseudo-first-order and pseudo-second order. The pseudo-first-order kinetic model is shown
by the following equation.[22]
ln (Qe –Qt ) = ln Qe - k1t ……..8
Where Qe and Qt the adsorption capacity at equilibrium and time t respectively and (k1) (min
-1) is the rate constant of the first-order adsorption and t is the contact time (min).
The application of the pseudo-first-order (Lagergren) rate equation (8), the plot of versus (t)
gave liner relationships, from which the calculated value k1 are determined from the slope
and intercept respectively. The results obtained are given in table (3) and show in figure (14).
The pseudo-second order equation written as follows,
......9tQ
1+
Q
1=Q
t
e2
et 2K
Where (K2) (g mg-1 min -1) is the rate constant of the second order adsorption.
A linear plot of against time give the straight line and from the slope and intercept value of
K2 andQe can be calculated. The results obtained are given in table (3) and show in figure
(15).
Fig. (14): Linear form of Pseudo-First-Order (Lagergren) Kinetic model of MB dye on
Porcellante at different temperatures.

www.wjpr.net Vol 7, Issue 19, 2018. 242
Abood et al. World Journal of Pharmaceutical Research
Fig. (15): Linear form of Pseudo-Second-Order Kinetic model of MB dye on porcellante
at different temperatures.
Table (3): First order and Second order kinetic rate constant, calculated and
experimental Qe values and R2.
MB
DYE
Temp.
°C
Pseudo-First-Order Pseudo-Second-Order
Qe
exp.
mg/g
Qe
Cal.
mg/g
K1 hr-1 R2
Qe
exp.
mg/g
Qe
Cal.
mg/g
K2 hr-1 R2
10 9.97 1.01 0.063 0.997 9.97 10.1 0.155 1
20 9.98 1.28 0.067 0.993 9.98 10.1 0.245 1
30 9.99 2.11 0.063 0.990 9.99 10.1 0.450 1
40 9.99 3.56 0.059 0.977 9.99 9.90 5.101 0.999
CONCLUSION
The results of present investigation show that porcellante has very high adsorption capacity
with regard to the removal of methylene blue from its aqueous solution. The experimental
equilibrium data obtained were applied to the Langmuir, and Freundlich isotherm equations
to test the fitness of these equations. By considering the experimental results and adsorption
models applied in this study, it can be concluded that adsorption of methylene blue obeys
Freundlich isotherm, The results suggested that the percentage removal of methylene blue on
porcellanite increased with increased pH, The maximum percentage removal of (99.98%)
occurred at pH 11. The adsorption capacity of MB decreased with increased ionic strength
but increased with increased temperature., Thermodynamic studies shows the adsorption
process spontaneous and endothermic, Adsorption kinetic was found to followed the pseudo
second order kinetics rate expression.

www.wjpr.net Vol 7, Issue 19, 2018. 243
Abood et al. World Journal of Pharmaceutical Research
REFERENCES
1. M. El Haddad, A. Regti, M. R. Laamari, R. Slimani, R. Mamouni, S. E. Antri, S. Lazar,
Journal of the Taiwan Institute of Chemical Engineers, 2014; 45(2): 533-540.
2. C. Zaharia and D.Suteu, Organic Pollutants Ten Years After the Stockholm Convention–
Environmental and Analyitcal Update, T. Puzyn and A. Mostrag-Szlichtyng (eds.), In Tech,
Rijeka, Croatia, 2012.
3. F. Zhang, Z. Zhao, R. Tan, Y. Guo, L. Cao, L. Chen, J. Li, W. Xu, Y. Yang, W. Song, J.
Colloid and Interface Science, 2012; 386(1): 277-284.
4. J.O. Hao, H. Kim, P.C. Chiang, Crit. Rev. J. Environ. Sci. Technol, 2000; 30: 449.
5. W.Zhou, W. Zimmermann, J, FEMS Microbiol, Lett, 1993; 107: 157-61.
6. G. Mckay, M. S. Ottrburn and A. G. Sweeney, J, Water Res., 1980; 14: 15.
7. E.C. Lima, N.F. Cardoso, S.L.P. Dias, F.A. Pavan, Chem. Eng. J., 2009; 155: 627–636.
8. T. Calvete, E.C. Lima, N.F. Cardoso, J.C.P. Vaghetti, S.L.P., Dias, F.A. Pavan, J. Environ.
Manage, 2010; 91: 1695–1706.
9. R. M. Silverstein, F. X. Webster and D. J. Kiemle, "Spectrometric Identification of Organic
Compounds", 7th ed, Hardcover, 2005; 512.
10. E. L.Abd, M.M. Latif, A.M Ibrahim, "J. Desalin. Water Treat", 2009; 6: 252-268.
11. P. K. Malik,. J.Dyes Pigm", 2003; 56: 239-249.
12. M. Ozacar and I.A. Sengil, Bioresour. Technol, 2005; 96: 791-795.
13. C.A.P Almeida, N.A Dedacher, A.J. Downs and Mello, J.colloid and interface science, 2009;
332: 46-53.
14. A.F. Al-Kami, A.H. Elywe, Z.S. Abdalameer, Iraq National Journal of Chemistry, 2013; 51:
301-315.
15. P. Sathishkumar, M. Arulkumar, and T. Palvannan, Journal of Cleaner Production, 2012;
22(1): 67–75.
16. M.M. Alexro, Vargas, ré L. Cazetta, Marcos H. Kunita, Taís L. Silva, V.C. Almeida, Chem.
Eng. J., 2011; 168: 722.
17. A. Adrien, 5th edition, Chapman and Hall, London, 1973; 222.
18. K.G. Vijay, R. Tamilarasan, and M. Dharmendirakumar, mater. Environ. sci J., 2012; 3(1):
157-170.
19. I. Langmuir, Am. Chem. J., 1918; 40(9): 1361-1403.
20. H. Freundlich, Z. Phys. Chem. J., 1906; 57: 385-470.
21. M.H. Ghazi, C. N Weng, H.A. Rahman, N. A. Zakaria, Journal of Geography and Earth
Science, 2013; 1–08.
22. E.M. Al-Kinani, J. of Al-Nahrain University, 2016; 19(2): 58-68.