removal of hydrogen sulfide from groundwater by granular activated...
TRANSCRIPT

Removal of Hydrogen Sulfide
from Groundwater by Granular
Activated CarbonKeisuke Ikehata, PhD, PE, PEng
Pacific Advanced Civil Engineering (PACE), Inc.
Fountain Valley, CA

Co-authors and Acknowledgements
Co-authors
Andrew T. Komor, Yuan (Abby) Li, Xiaoyan (Leo) Qu – PACE
Jay A. Kleinheinz, Duncan S. Lee – City of Huntington Beach
C. Bryan Trussell, David R. Hokanson – TrussellTechnologies
Acknowledgements
Steve Styles, Chris Cassotta, Derek Smith – City of Huntington Beach
2
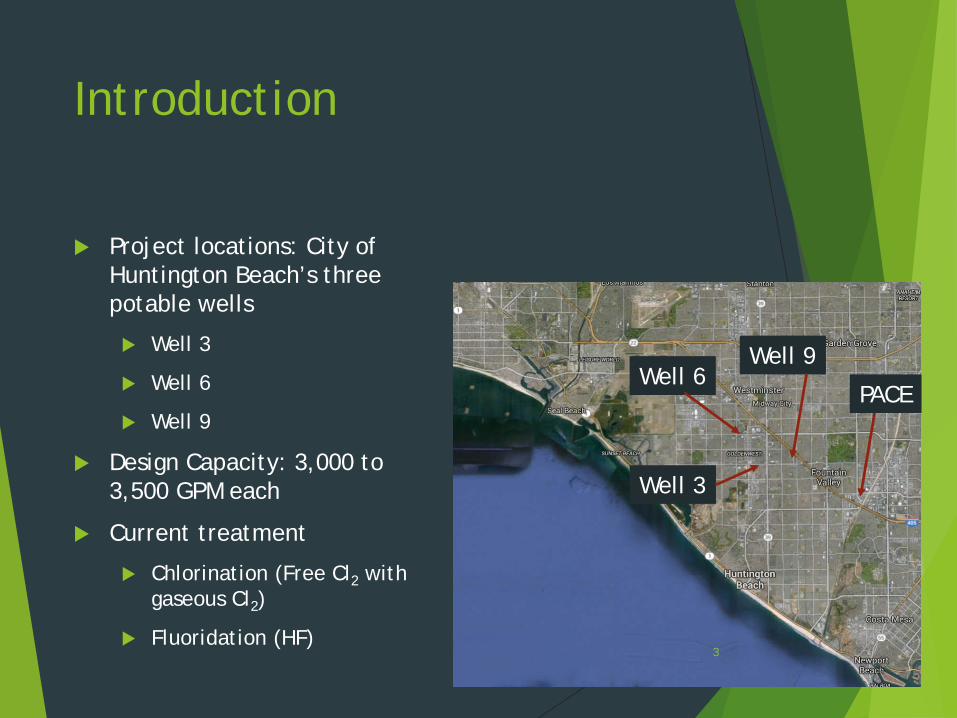
Introduction
Project locations: City of Huntington Beach’s three potable wells
Well 3
Well 6
Well 9
Design Capacity: 3,000 to 3,500 GPM each
Current treatment
Chlorination (Free Cl2 with gaseous Cl2)
Fluoridation (HF)
PACE
Well 9
Well 3
Well 6
3

Project Objective
Utilize the groundwater to maximize the local water resources in the current drought situations
Historically the wells haven’t been run at their full speed (50% to 60%)
Water quality concerns at the design production rates
Color (NOM): <5 CU up to 15 CU
H2S: non-detect up to 0.2 mg/L
Addition of treatment facilities has been considered
Granular activated carbon (GAC)
Chlorine-bisulfite-chlorine
Ozone
GAC-based treatment has already been selected for one of the wells
Being considered at the other wells4

Pilot Study Objectives
GAC-based treatment has been tested by the City of Huntington Beach and a full-scale demo filter has been installed and used at Well 9 since 2010
The demo filter has a design capacity of 250 gpm
Coconut shell-based media
No backwash
A series of pilot studies have been carried out
To evaluate the feasibility of the GAC-based treatment
To identify H2S removal mechanisms
To ensure no odor or other unexpected water quality issues in the distribution system
To determine full-scale design parameters
5

History of On-site Pilot Studies
2006: Initial pilot study (up to 30 gpm) at Well 9
2009: Demo GAC filter vessel (250 gpm, sidestream) at Well 9
2014: Demo GAC filter monitoring (with chlorine) at Well 9 (Up to 350 gpm)
2014: Small pilot GAC at Well 9 (0.25 gpm)
2014: Demo GAC filter monitoring (without chlorine) at Well 9 (Up to 400 gpm)
2014-2015: Small pilot GAC at Wells 6 and 3 (Up to 0.6 gpm, reduced filter bed depth)
2015: Demo GAC filter monitoring (reduced filter bed depth) at Well 9 (ongoing)
2015: Small pilot GAC and non-GAC at Well 9 (Up to 0.6 gpm)
6
NOTE: Full-scale filters are being designed for Well 9
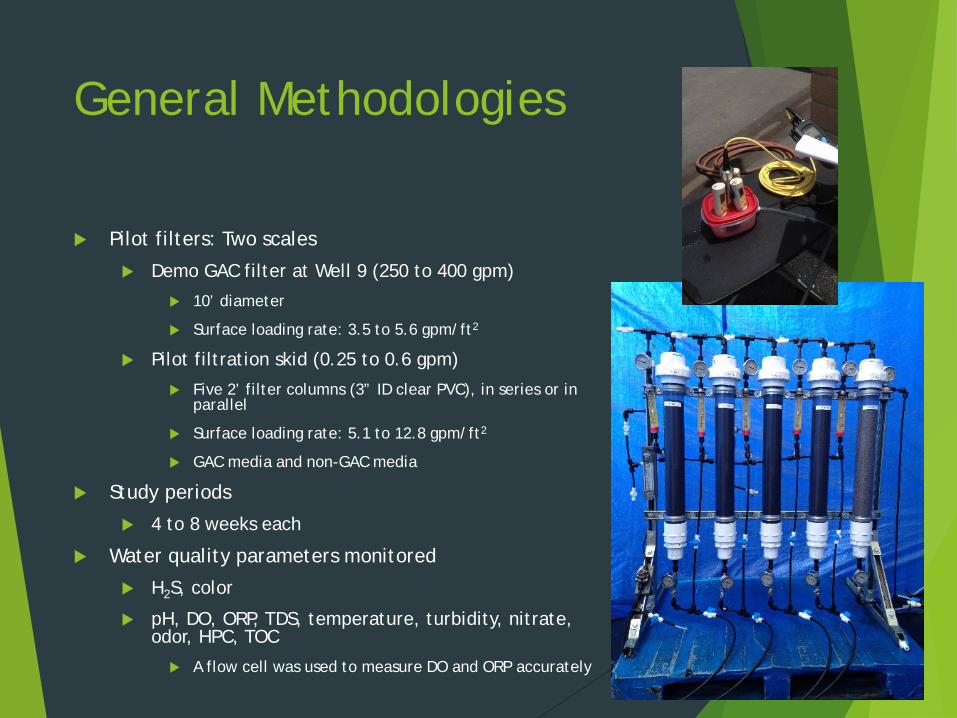
General Methodologies
Pilot filters: Two scales
Demo GAC filter at Well 9 (250 to 400 gpm)
10’ diameter
Surface loading rate: 3.5 to 5.6 gpm/ft2
Pilot filtration skid (0.25 to 0.6 gpm)
Five 2’ filter columns (3” ID clear PVC), in series or in parallel
Surface loading rate: 5.1 to 12.8 gpm/ft2
GAC media and non-GAC media
Study periods
4 to 8 weeks each
Water quality parameters monitored
H2S, color
pH, DO, ORP, TDS, temperature, turbidity, nitrate, odor, HPC, TOC
A flow cell was used to measure DO and ORP accurately7
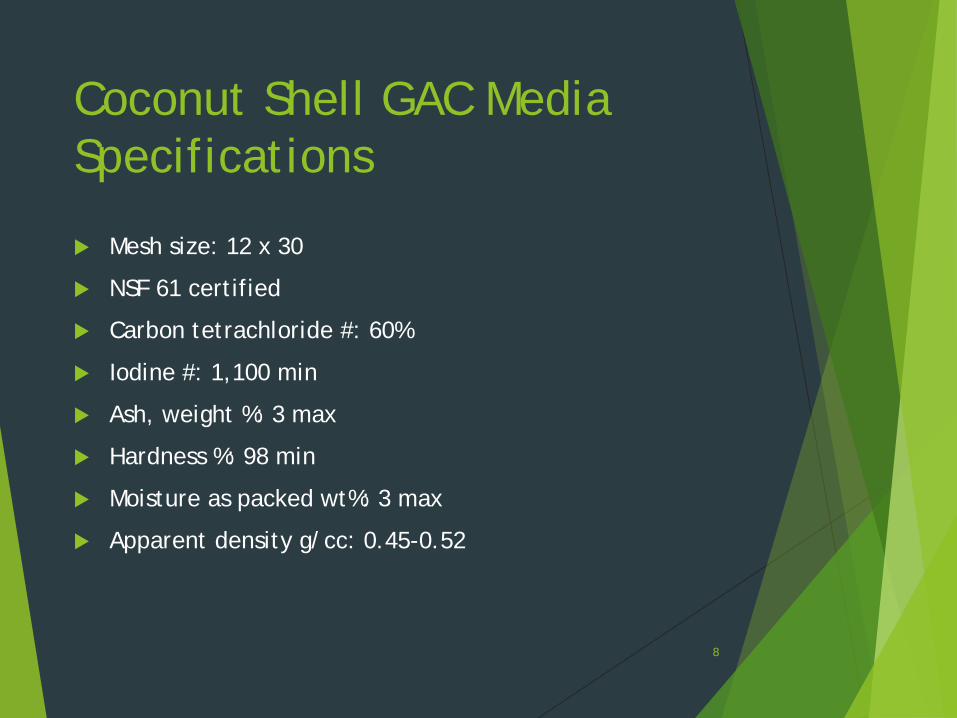
Coconut Shell GAC Media Specifications
Mesh size: 12 x 30
NSF 61 certified
Carbon tetrachloride #: 60%
Iodine #: 1,100 min
Ash, weight %: 3 max
Hardness %: 98 min
Moisture as packed wt%: 3 max
Apparent density g/cc: 0.45-0.52
8
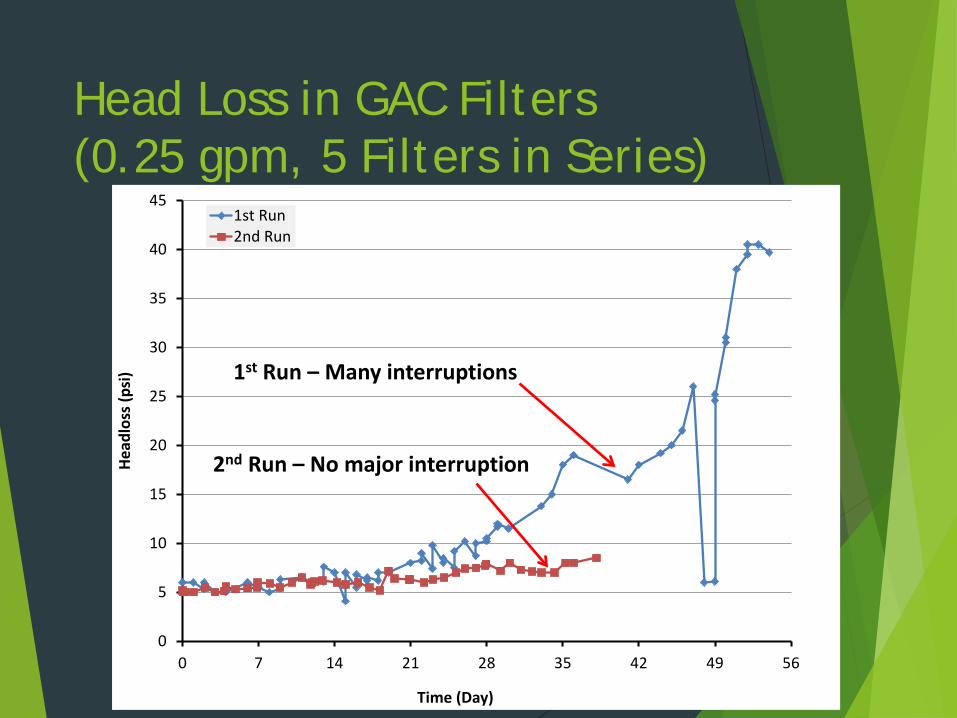
Head Loss in GAC Filters (0.25 gpm, 5 Filters in Series)
90
5
10
15
20
25
30
35
40
45
0 7 14 21 28 35 42 49 56
Head
loss
(psi
)
Time (Day)
1st Run2nd Run
2nd Run – No major interruption
1st Run – Many interruptions
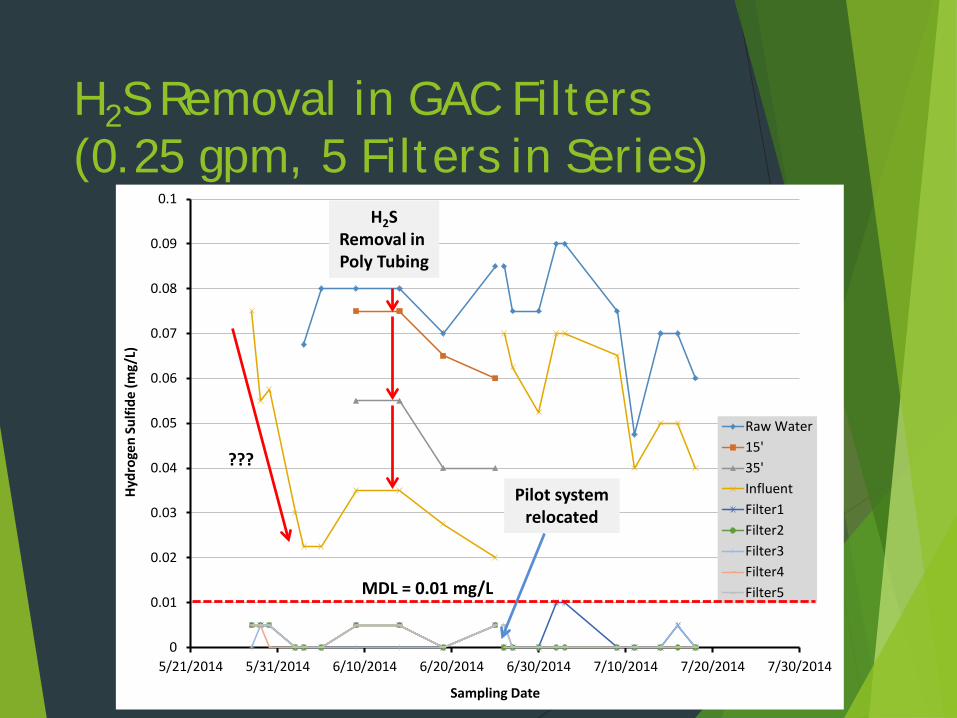
H2S Removal in GAC Filters (0.25 gpm, 5 Filters in Series)
100
0.01
0.02
0.03
0.04
0.05
0.06
0.07
0.08
0.09
0.1
5/21/2014 5/31/2014 6/10/2014 6/20/2014 6/30/2014 7/10/2014 7/20/2014 7/30/2014
Hydr
ogen
Sul
fide
(mg/
L)
Sampling Date
Raw Water15'35'InfluentFilter1Filter2Filter3Filter4Filter5
Pilot systemrelocated
H2SRemoval in Poly Tubing
MDL = 0.01 mg/L
???

Color Removal in GAC Filters (0.25 gpm, 5 Filters in Series)
110
2
4
6
8
10
12
14
16
18
5/21/2014 5/31/2014 6/10/2014 6/20/2014 6/30/2014 7/10/2014 7/20/2014 7/30/2014
Colo
r (Pt
Co C
U)
Sampling Date
Raw Water15'35'InfluentFilter1Filter2Filter3Filter4Filter5Pilot system
relocated
All 5 GAC filters were exhausted with respect to organic matter

H2S, DO, Nitrate-N, and ORP (0.25 gpm, 5 Filters in Series)
12
-200
-180
-160
-140
-120
-100
-80
-60
-40
-20
0
0.00
0.02
0.04
0.06
0.08
0.10
0.12
0.14
0.16
0.18
0.20
Raw WellWater
Influent Filter #1 Filter #2 Filter #3 Filter #4 Filter #5
ORP
(mV)
Diss
olve
d O
xyge
n (m
g/L)
, Hyd
roge
n Su
lfide
(mg/
L),
Nitr
ate-
N (m
g/L)
Sampling Location
DOHydrogen SulfideNitrate-N (TNT 835)ORP
<3 min of EBCT was enough

Head Loss in GAC Filters (0.25 gpm, 5 filters in Series)
13
0
1
2
3
4
5
6
7
8
9
10
Head
loss
(psi
)
Date
Filter 1Filter 2Filter 3Filter 4Filter 5System

Colonization at the Surface of Filter 1 (0.25 gpm, 5 Filters in Series)
14
Day 0
Day 9
Day 1 Day 3 Day 6 Day 7 Day 8
Day 10 Day 13 Day 14 Day 15 Day 16
Day 17 Day 21 Day 22 Day 23 Day 24 Day 30
Day 31 Day 32 Day 34

H2S Removal Mechanisms
Physicochemical
Adsorption/catalytic oxidation
Only at the start up (a few days)
Chlorine/Mn-mediated oxidation
No chlorine
Biological
Thiobacillus spp.
Autotrophic denitrifier
Thiothrix spp.
Gram-negative, microaerobicsulfide oxidizer 15
Gram-negative, rod-shape cells forming filaments
T2 Medium forThiobacillus
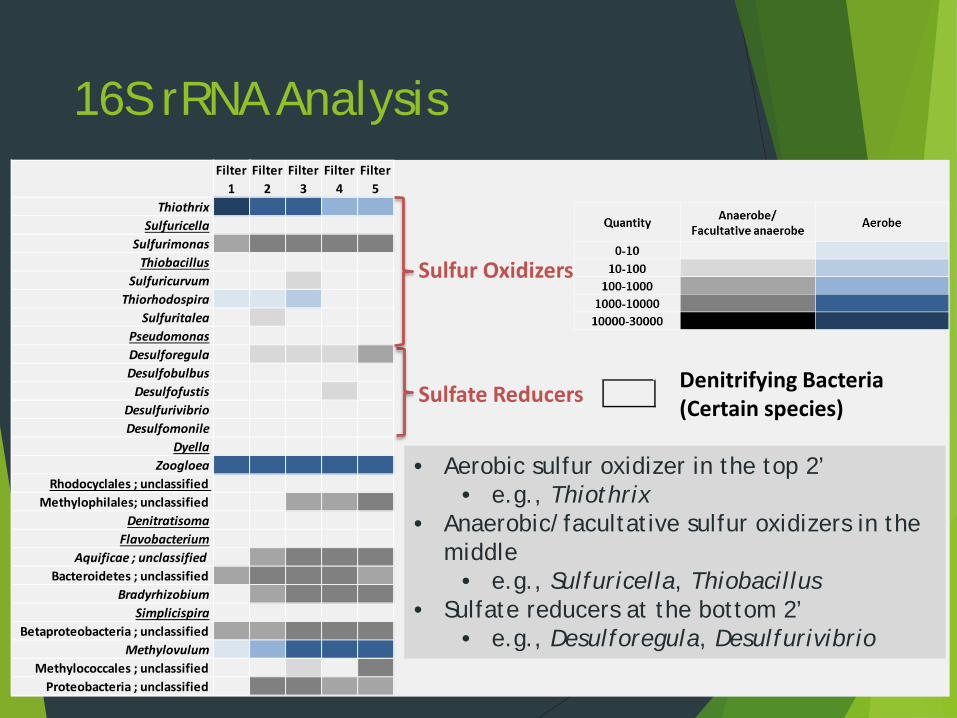
16S rRNA Analysis
16
Sulfur Oxidizers
Sulfate Reducers Denitrifying Bacteria (Certain species)
Filter 1
Filter 2
Filter 3
Filter 4
Filter 5
ThiothrixSulfuricella
SulfurimonasThiobacillus
Sulfuricurvum Thiorhodospira
Sulfuritalea PseudomonasDesulforegulaDesulfobulbus
Desulfofustis Desulfurivibrio Desulfomonile
DyellaZoogloea
Rhodocyclales ; unclassified Methylophilales; unclassified
DenitratisomaFlavobacterium
Aquificae ; unclassified Bacteroidetes ; unclassified
Bradyrhizobium Simplicispira
Betaproteobacteria ; unclassified Methylovulum
Methylococcales ; unclassified Proteobacteria ; unclassified
• Aerobic sulfur oxidizer in the top 2’• e.g., Thiothrix
• Anaerobic/facultative sulfur oxidizers in the middle
• e.g., Sulfuricella, Thiobacillus• Sulfate reducers at the bottom 2’
• e.g., Desulforegula, Desulfurivibrio
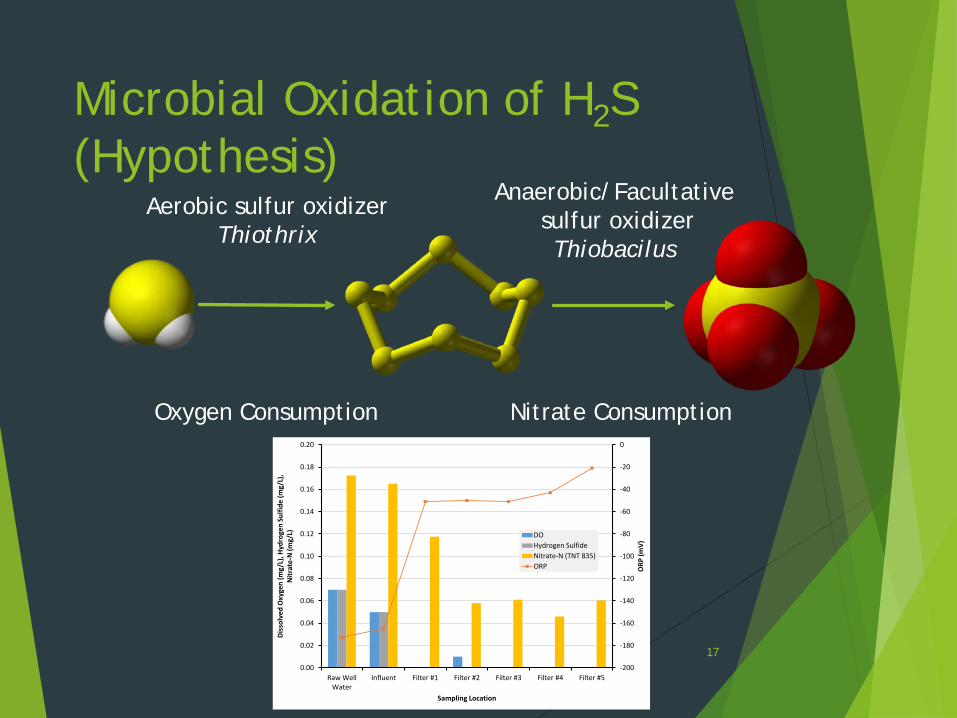
Microbial Oxidation of H2S (Hypothesis)
17
Aerobic sulfur oxidizerThiothrix
Anaerobic/Facultativesulfur oxidizerThiobacilus
Oxygen Consumption Nitrate Consumption
-200
-180
-160
-140
-120
-100
-80
-60
-40
-20
0
0.00
0.02
0.04
0.06
0.08
0.10
0.12
0.14
0.16
0.18
0.20
Raw WellWater
Influent Filter #1 Filter #2 Filter #3 Filter #4 Filter #5
ORP
(mV)
Diss
olve
d O
xyge
n (m
g/L)
, Hyd
roge
n Su
lfide
(mg/
L),
Nitr
ate-
N (m
g/L)
Sampling Location
DOHydrogen SulfideNitrate-N (TNT 835)ORP

Byproducts and Odor
Elemental sulfur
Polysulfides
Products of elemental sulfur and H2S
HSnH
Matchstick odor
Elemental sulfur was detected in the Demo GAC filter effluent
Polysulfide was non-detect
However, a very slight matchstick odor was present in some of the filter effluent samples
Need more sensitive sulfur analysis methods
18
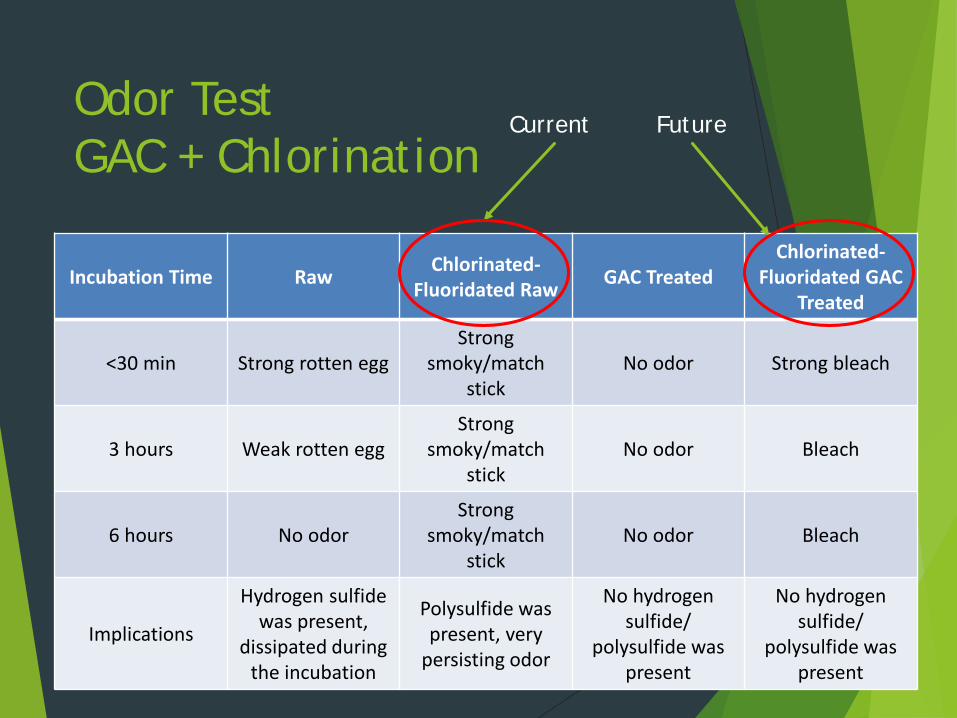
Odor TestGAC + Chlorination
19
Incubation Time Raw Chlorinated-Fluoridated Raw GAC Treated
Chlorinated-Fluoridated GAC
Treated
<30 min Strong rotten eggStrong
smoky/matchstick
No odor Strong bleach
3 hours Weak rotten eggStrong
smoky/matchstick
No odor Bleach
6 hours No odorStrong
smoky/matchstick
No odor Bleach
Implications
Hydrogen sulfide was present,
dissipated during the incubation
Polysulfide was present, very
persisting odor
No hydrogensulfide/
polysulfide was present
No hydrogensulfide/
polysulfide was present
Current Future

High Flow Rate, Short EBCT(12.8 gpm/ft2, 1.2 min, Parallel)
20

Conclusions
GAC-based H2S removal is feasible, repeatable, consistent and almost instantaneous
Coconut-shell based GAC
Worked at all three well sites
No odorous byproducts before/after chlorination
The primary removal mechanism is microbial
DO, ORP and nitrate are important parameters to monitor
Sulfate reduction may occur if the EBCT is too long
Service flow rate can be as high as 13 gpm/ft2
EBCT can be as short as 1 min
Bed depth: Minimum 2’
Huge savings in capital and O&M costs
The filters can be run for at least 3 to 4 weeks
Up to a few years (the demo filter at Well 9)
Backwash will remove excess biomass and elemental sulfur21

THANKSContact Information:
Keisuke Ikehata, PhD, PE, PEng
(714) 481-0662
22