removal of h2s from crude oil via stripping followed by
TRANSCRIPT
ORIGINAL PAPER
Removal of H2S from crude oil via stripping followedby adsorption using ZnO/MCM-41 and optimizationof parameters
N. Hazrati • M. Abdouss • A. Vahid •
A. A. Miran Beigi • A. Mohammadalizadeh
Received: 11 December 2012 / Revised: 15 November 2013 / Accepted: 7 December 2013 / Published online: 10 January 2014
� Islamic Azad University (IAU) 2014
Abstract In the present work, H2S of crude oil was
removed via a two-step method including stripping fol-
lowed by adsorption. First, ZnO/MCM-41 adsorbents
containing 5, 17.5 and 30 wt% of zinc were synthesized
and characterized using XRD and nitrogen physisorption.
Then, these materials were used as adsorbents for the
removal of the H2S stripped from crude oil. At second step,
the H2S of crude oil was extracted to gas phase by hot
stripping. The obtained extract was collected in a storage
tank for the subsequent H2S adsorption process. A three-
factor Box–Behnken design with five center points and one
response was performed for the optimization of adsorption
of H2S. The influence of process parameters and their
interactional effects on the adsorption of H2S were ana-
lyzed using the obtained adsorption experimental data. A
model including three important factors, i.e., temperature,
space velocity and amount of supported zinc and their
interactions, was developed to generate the optimum con-
dition. The point of Zn = 30 wt%, T = 300 �C and space
velocity = 3,000 h-1 had the optimum point with the
highest break point time (tbp = 973 min).
Keywords Box–Behnken design � Crude oil � Hydrogen
sulfide � Mesoporous materials � Optimization � Removal �Zinc oxide
Introduction
Hydrogen sulfide, H2S(g), is a common gaseous pollutant
which is colorless, odorous, highly toxic, corrosive for
pipelines and poisonous for catalysts (Husein et al. 2010;
Nassar et al. 2010; Wieckowska 1995; Rowan et al. 2009;
Dorman et al. 2002). The world demand for sweet crude oil
as well as lowering the emitted pollutants from crude oil
derivatives is growing to meet international regulations. In
the combustion of fuels containing sulfur such as coal and
oil, SOx is mostly formed. SOx is responsible for the for-
mation of acid rain, corrosion of metal structures and is
harmful to human and other living organisms (Hogan 2010;
Holleman and Wiberg 2001). Removal of H2S from a gas
stream could be accomplished by adsorption onto a solid
surface (Srivastav and Srivastava 2009; Samadi-Maybodi
et al. 2011; Wang et al. 2012; Ko et al. 2004), catalytic
oxidation and absorption using a liquid solution (Morais
Batista et al. 2010; Corma et al. 1995). However, the
majority of these techniques show some drawbacks. For
instance, high surface area activated carbons are expensive,
and the catalytic oxidation materials (Morais Batista et al.
2010) and liquid solution could cause secondary pollution
after invalidation. Liquid-phase chemical scrubbing with
amines suffers from inherently high regeneration cost and
inefficiency (Corma et al. 1995). Many materials have been
developed for H2S adsorption from a great amount of
industrial gas effluent streams (Untea et al. 2009; Subrenat
et al. 2008; Bagreev et al. 2004; Polychronopoulou et al.
2005). Adsorption by metal oxide sorbents is recognized to
be an energy-efficient technology for H2S removal. Sor-
bents with high surface area and high porosity are needed to
increase the sorption activity and to increase the break point
time. In order for the high surface area to be accessible, a
network of macropores and mesopores should be existed in
N. Hazrati � M. Abdouss
Department of Chemistry, Amirkabir University of Technology,
Tehran, Iran
N. Hazrati � A. Vahid (&) � A. A. Miran Beigi �A. Mohammadalizadeh
Research Institute of Petroleum Industry, Tehran, Iran
e-mail: [email protected]
123
Int. J. Environ. Sci. Technol. (2014) 11:997–1006
DOI 10.1007/s13762-013-0465-z

the sorbent. Mesoporous silicate materials are good candi-
dates and can be used for this purpose. One of the well-
known members of this group, i.e., MCM-41, has allowed
immense scope for many research groups to work on this
material, with uniform pore size and shape, in different
ways due to its very high surface area and adsorption
capacity (Kresge et al. 1992; Wan and Zhao 2007; Taguchi
and Schuth 2005; Li et al. 2010; Galarneau et al. 1999). One
of the appropriate methods for the preparation of such
sorbent is embedding of proper metal oxides (active part) on
the surface of MCM-41 (Samadi-Maybodi et al. 2011).
Thermodynamic analysis of the oxides of some metals
showed that Zn, Fe, Mo, Mn, Sr, B, Co, Cu and W are the
suitable metals due to their sulfur removal efficiencies and
thermal stabilities (Wang et al. 2009).
After the work of Westmoreland and Harrison, studies
were concentrated on zinc, copper, iron and calcium oxides
(Wang et al. 2009). From the thermodynamic analysis, it
can be shown that zinc oxide is a good adsorbent having
high sulfur removal efficiency because of high equilibrium
constant (Westmoreland and Harrison 1976; Wang et al.
2008). Moreover, ZnO is considered a cost-effective and
stable sorbent compared to other metal oxides (Westmore-
land and Harrison 1976). Experimental design methods help
us to find the influences of each process parameter and their
interactions to achieve the optimum condition (Sun et al.
2007; Kumar et al. 2008; Tripathi et al. 2009; Habibi et al.
2010; Mohammadalizadeh et al. 2011a, b; Keyvanloo et al.
2010; Farahzadi et al. 2012). Herein, the H2S of crude oil
was removed via stripping followed by adsorption on zinc-
containing MCM-41. At first, different incipient wetness
prepared zinc-containing MCM-41 adsorbents were syn-
thesized and characterized using high- and low-angle X-ray
diffraction and nitrogen physisorption. Then, the H2S of
crude oil was removed via hot stripping. The obtained H2S-
in-LPG extract was collected in a storage tank. After that,
the H2S of obtained H2S-in-LPG extract was adsorbed using
zinc-containing MCM-41. Response surface methodology
(RSM) was applied for optimizing the adsorption of H2S. A
three-factor Box–Behnken design with five center points
and one response was performed to generate the optimum
condition. This work was carried out at research institute of
petroleum industry during winter 2012.
Materials and methods
Synthesis
All chemicals were purchased from Merck and used without
further purification. In a typical synthesis, cetyltrimethyl-
ammonium bromide (CTAB) and NaOH were dissolved
in an appropriate amount of water. While stirring,
predetermined quantity of tetraethylorthosilicate (TEOS)
was added to this solution over a period of 15 min. After
70-min stirring, the obtained suspension was transferred
into the Teflon-lined stainless steel and autoclaved at 90 �C
for 96 h. Then, the precipitate was filtered and washed with
deionized water and acetone, respectively. The as-synthe-
sized samples were calcined with heating rate of 1 �C/min
up to 550 �C and held at this temperature for 5 h.
For the preparation of zinc-containing MCM-41, 10
grams of calcined sample was impregnated with 100 mL of
tetrahydrofuran (THF) containing predetermined amounts of
Zn(NO3)2 � 4H2O. The suspension was shacked for 24 h and
dried under vacuum at 80 �C and calcined at 550 �C for 3 h.
Resultant samples denoted as ZnOx/MCM where x indicates
the weight percent of zinc in the corresponding sample.
Characterization
X-ray diffraction (XRD) patterns were recorded using a
Philips 1840 diffractometer with nickel-filtered Cu Karadiation (1.5418� A) operating at 35.4 kV and 28 mA. The
BET surface area, pore volume and pore size distribution of
synthesized samples were measured by nitrogen adsorption
at 77 K using a BELSORP-max apparatus. Prior to analysis,
the samples were out-gassed in vacuum for 4 h at 300 �C
until a stable vacuum of 0.1 Pa was reached. Determination
of H2S was carried out via UOP-163 standard test method
using METTLER TOLEDO G20 apparatus.
H2S adsorption
Soumar crude oil was obtained from south of Iran. At first,
H2S of crude oil was removed using hot stripping and the
obtained extract was collected in a storage tank. The
obtained extract containing light hydrocarbons, such as
LPG, lighter gases and also H2S, was abbreviated to H2S-
in-LPG. The stripping was carried out at 80 �C during
30 min under the 0.5 L/min flow rate of nitrogen as carrier
gas. The concentration of H2S in the stripped crude oil was
lower than 1 ppm. The concentration of H2S in the H2S-in-
LPG was 5,000 ppm. This concentration was taken as the
criterion for the H2S break point during adsorption of H2S.
Adsorption measurements for H2S were performed using a
laboratory-made apparatus. Scheme 1 illustrates the
adsorption apparatus made and used in this work.
Analysis of the reactor effluent stream using UOP163
method gave H2S break point curves.
Box–Behnken experimental design and optimization
by RSM
The optimum condition for maximizing the adsorption of
H2S was determined by means of a three-factor Box–
998 Int. J. Environ. Sci. Technol. (2014) 11:997–1006
123

Behnken design combined with response surface modeling
and quadratic model. The effect of quadratic interactions and
main effects on adsorption of H2S were investigated as well.
It is well known that this experimental method gave H2S
breakthrough curves to model the response as a mathemati-
cal function of factors with unbiased and minimum variance.
Thus, the graphical outlook of the mathematical model
describes the shape of the response surface being investi-
gated (Sun et al. 2007; Kumar et al. 2008; Tripathi et al. 2009;
Habibi et al. 2010; Mohammadalizadeh et al. 2011a, b;
Keyvanloo et al. 2010; Farahzadi et al. 2012). In this work,
the effects of three process variables (factors) of A: zinc
weight percent (%), B: temperature (�C) and C: space
velocity (h-1) on the adsorption of H2S were investigated.
The parameters were normalized before analyzing the
regression. The natural variables were coded as ?1, -1 and
0 for high, low and central point, respectively. So the units
of the parameters were not important. The actual variables
(Xi) were coded by linear transformation as follow:
xi ¼Xi � ðXhighþXlowÞ
2ðXhighþXlowÞ
2
ð1Þ
where xi is the dimensionless coded value of ith factor, Xi is
the uncoded value of the ith independent variable (natural
factor), and Xhigh and Xlow are the uncoded factor value at
high and low level, respectively. The three examined levels
and experimental ranges of ZnO (denoted as A) are as
follows: 5, 17.5 and 30 wt%. The three examined levels
and experimental ranges of temperature (denoted as B) are
as follows: 50, 175 and 300 �C. The three examined levels
and experimental ranges of space velocity (denoted as C)
are as follows: 3,000, 7,500 and 12,000 h-1.
The behavior of the system was explained by the fol-
lowing quadratic polynomial equation as a function of
independent variables involving their quadratic interactions
and squared terms.
y ¼ b0 þX3
i¼1
bixi þX3
i¼1
biix2i þ
X3
i¼1
X3
i\j
bixixj þ e ð2Þ
where y is predicted response of the time at which the
outlet concentration of H2S reaches 5,000 ppm, and x1, x2,
x3 are the coded independent variables, b0 intercept, bi
linear coefficient, bij interaction quadratic coefficient, bii
squared coefficient, i and j are the index numbers for
variables and e is the random error which shows the dif-
ferent sources of variability.
Least squares method was used to solve these set of
equations (Keyvanloo et al. 2010; Farahzadi et al. 2012).
The initial concentration of H2S, 5,000 ppm, was taken as
the criterion for H2S break point.
In statistics, Box–Behnken designs (BBD) are typical
experimental design for response surface methodology.
BBD is a class of rotatable or nearly rotatable second-order
designs based on three-level incomplete factorial designs.
Each design can be thought of as a combination of a two-
level (full or fractional) factorial design with an incomplete
block design. In each block, a certain number of factors are
put through all combinations for the factorial design, while
the other factors are kept at the central values.
The number of experiments (N) required for the devel-
opment of BBD is defined as follows:
N ¼ 2kðk � 1Þ þ Co ð3Þ
where k is number of factors and Co is the number of
central points.
Results and discussion
XRD analysis
All prepared samples were characterized using low- and
high-angle X-ray diffraction to get structural information
Scheme 1 Schematic
representation of laboratory-
made apparatus used for the
removal of H2S from crude oil
Int. J. Environ. Sci. Technol. (2014) 11:997–1006 999
123
about their pore order and phases of the obtained zinc
oxide, respectively.
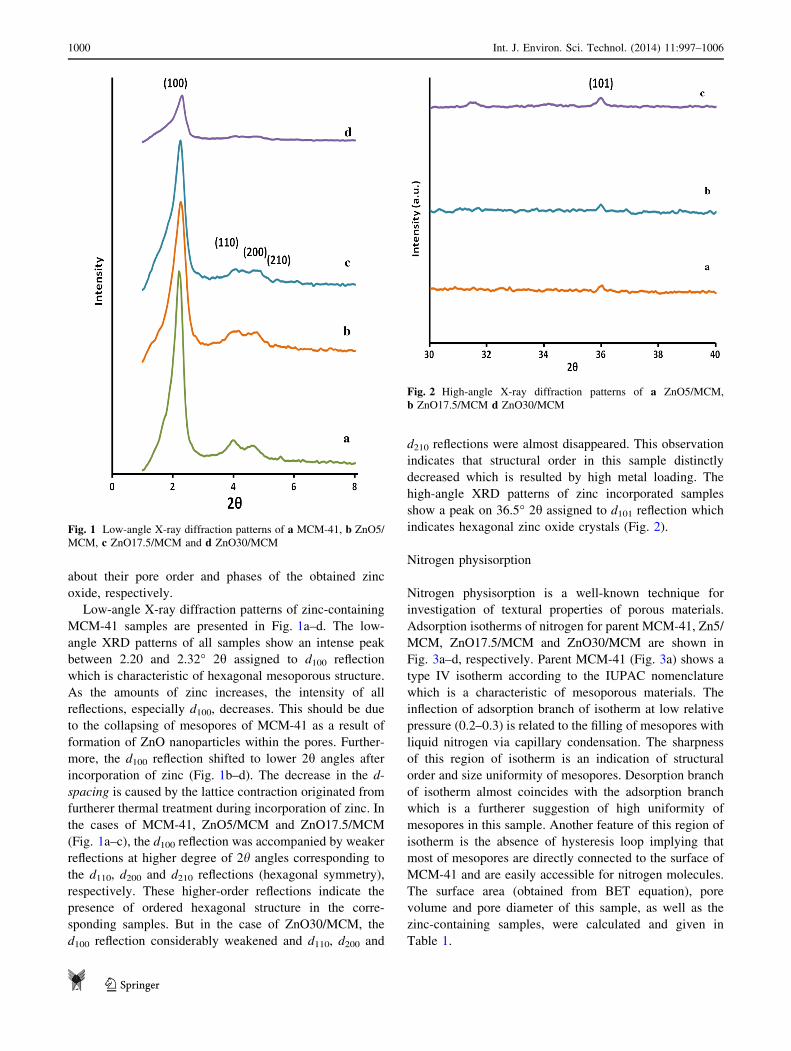
Low-angle X-ray diffraction patterns of zinc-containing
MCM-41 samples are presented in Fig. 1a–d. The low-
angle XRD patterns of all samples show an intense peak
between 2.20 and 2.32� 2h assigned to d100 reflection
which is characteristic of hexagonal mesoporous structure.
As the amounts of zinc increases, the intensity of all
reflections, especially d100, decreases. This should be due
to the collapsing of mesopores of MCM-41 as a result of
formation of ZnO nanoparticles within the pores. Further-
more, the d100 reflection shifted to lower 2h angles after
incorporation of zinc (Fig. 1b–d). The decrease in the d-
spacing is caused by the lattice contraction originated from
furtherer thermal treatment during incorporation of zinc. In
the cases of MCM-41, ZnO5/MCM and ZnO17.5/MCM
(Fig. 1a–c), the d100 reflection was accompanied by weaker
reflections at higher degree of 2h angles corresponding to
the d110, d200 and d210 reflections (hexagonal symmetry),
respectively. These higher-order reflections indicate the
presence of ordered hexagonal structure in the corre-
sponding samples. But in the case of ZnO30/MCM, the
d100 reflection considerably weakened and d110, d200 and
d210 reflections were almost disappeared. This observation
indicates that structural order in this sample distinctly
decreased which is resulted by high metal loading. The
high-angle XRD patterns of zinc incorporated samples
show a peak on 36.5� 2h assigned to d101 reflection which
indicates hexagonal zinc oxide crystals (Fig. 2).
Nitrogen physisorption
Nitrogen physisorption is a well-known technique for
investigation of textural properties of porous materials.
Adsorption isotherms of nitrogen for parent MCM-41, Zn5/
MCM, ZnO17.5/MCM and ZnO30/MCM are shown in
Fig. 3a–d, respectively. Parent MCM-41 (Fig. 3a) shows a
type IV isotherm according to the IUPAC nomenclature
which is a characteristic of mesoporous materials. The
inflection of adsorption branch of isotherm at low relative
pressure (0.2–0.3) is related to the filling of mesopores with
liquid nitrogen via capillary condensation. The sharpness
of this region of isotherm is an indication of structural
order and size uniformity of mesopores. Desorption branch
of isotherm almost coincides with the adsorption branch
which is a furtherer suggestion of high uniformity of
mesopores in this sample. Another feature of this region of
isotherm is the absence of hysteresis loop implying that
most of mesopores are directly connected to the surface of
MCM-41 and are easily accessible for nitrogen molecules.
The surface area (obtained from BET equation), pore
volume and pore diameter of this sample, as well as the
zinc-containing samples, were calculated and given in
Table 1.
Fig. 1 Low-angle X-ray diffraction patterns of a MCM-41, b ZnO5/
MCM, c ZnO17.5/MCM and d ZnO30/MCM
Fig. 2 High-angle X-ray diffraction patterns of a ZnO5/MCM,
b ZnO17.5/MCM d ZnO30/MCM
1000 Int. J. Environ. Sci. Technol. (2014) 11:997–1006
123

The isotherm of ZnO5/MCM is shown in Fig. 3b. It
demonstrates a type IV isotherm indicating that mesopor-
ous structure of corresponding sample remained intact after
incorporation of 5 wt% of zinc into MCM-41. The capillary
condensation region almost coincides with capillary evap-
oration. This means that the uniformity of mesopores did
not decrease after incorporation of zinc oxide into the
mesopores of this sample. However, the height of capillary
condensation/evaporation region slightly decreased and
somewhat shifted to lower relative pressure. This obser-
vation results in small decrease in both mesopore volume
and pore diameter which is caused by lattice contraction.
Moreover, a parallel reason for decreasing of mesopore
volume should be the occupation of mesopores with zinc
oxide nanoparticles. In the case of ZnO17.5/MCM
(Fig. 3c), the shape of isotherm corresponds to type IV and
the capillary condensation/evaporation step is steel sharp.
However, the decreasing of the height of this region of
isotherm is able to be seen and is higher than that of ZnO5/
MCM which is due to the higher amount of zinc oxide
incorporated into MCM-41. Figure 3d shows the isotherm
of ZnO30/MCM. As can be seen, the shape of isotherm
obviously changed and the height of isotherm at capillary
condensation/evaporation region considerably decreased.
This should be due to the very high amount of zinc oxide
incorporated into MCM-41 leading to the extreme collapse
of mesopores. As the amounts of zinc increased, the mean
pore diameter of the samples decreased. This should be due
to the embedding of zinc oxide nanoparticles within the
mesopores of the corresponding sample which leads to the
decreasing of mean pore diameter. Another suggestion is
the lattice contraction of zinc-containing samples caused
by the subsequent thermal treatment during impregnation.
This thermal treatment causes not only conversion of
Zn(NO3)2 to ZnO nanoparticles but also a parallel reaction,
i.e., condensation of silanol groups of MCM-41 to siloxane
bond.
Statistical analysis of H2S adsorption experiments
Based on Eq. 3, with 3 main factors and 5 times replication
in center point to reduce the magnitude of error (k = 3 and
Co = 5), the runs will be limited to 17 as are detailed in
Fig. 3 Nitrogen physisorption isotherm of a calcined MCM-41,
b ZnO5/MCM, c ZnO17.5/MCM and d ZnO30/MCM
Table 1 Textural properties of ZnO/MCM-41 samples containing
different weight percent of zinc (0, 5, 17.5 and 30)
Sample
name
SBET
(m2/g)
Vp
(cm3/g)ad (nm)b a
(nm)cWd
(nm)dbd
(nm)e
MCM-41 739 0.49 4.010 4.61 3.50 1.28
ZnO5 680 0.43 3.908 4.49 3.32 1.33
ZnO17.5 569 0.35 3.908 4.49 3.13 1.51
ZnO30 254 0.14 3.802 4.37 2.24 2.24
a Mesopore volumeb d-spacing from XRD diffractogramsc Unit cell parameterd Pore diameter (nm) calculated by geometrical method (Samadi-
Maybodi et al. 2011)e wall thickness obtained from a - (wd/1.050) equation
Table 2 The design matrix and experimental data of the break point
from the BBD design
Run Independent variables
A B C tbp (min)
1 17.5 175 7,500 180
2 30.0 175 12,000 119.4
3 17.5 50 3,000 355.3
4 30 50 7,500 446.1
5 5 50 7,500 157.6
6 17.5 175 7,500 179
7 17.5 175 7,500 170
8 5 300 7,500 216.4
9 17.5 175 7,500 192
10 30 175 3,000 634.4
11 5 175 12,000 283.1
12 5 175 3,000 241.1
13 17.5 50 12,000 172.1
14 30 300 7,500 459.3
15 17.5 175 7,500 185
16 17.5 300 3,000 850
17 17.5 300 12,000 190.2
Int. J. Environ. Sci. Technol. (2014) 11:997–1006 1001
123
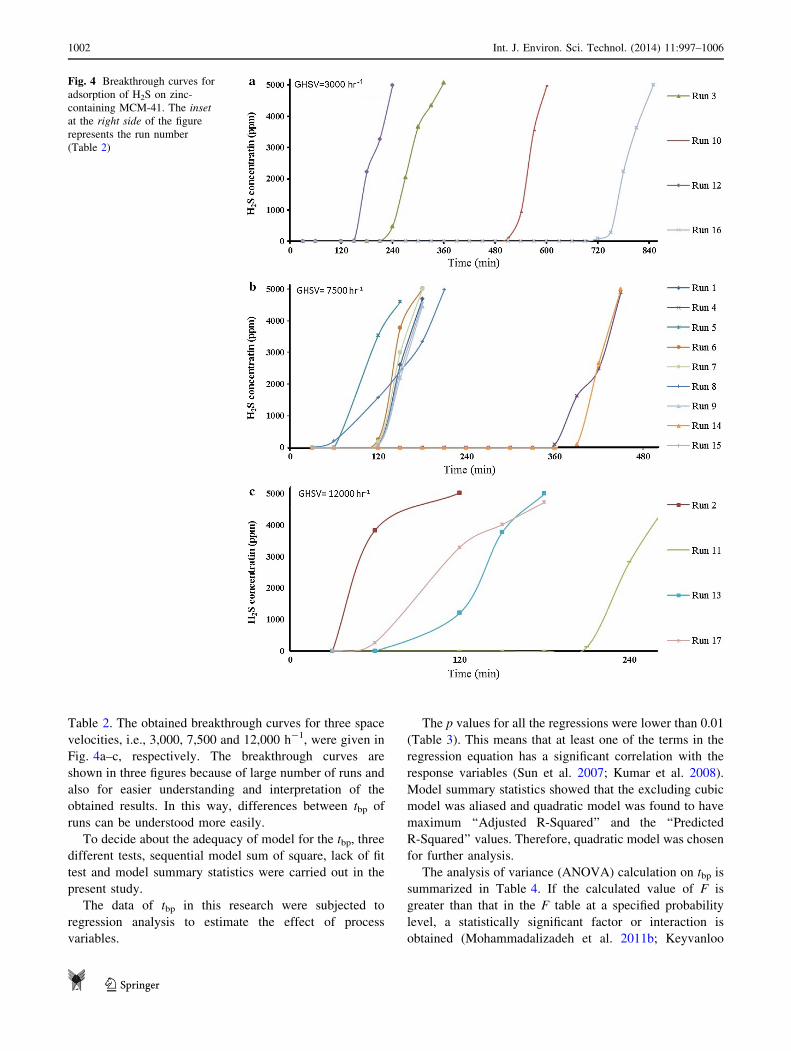
Table 2. The obtained breakthrough curves for three space
velocities, i.e., 3,000, 7,500 and 12,000 h-1, were given in
Fig. 4a–c, respectively. The breakthrough curves are
shown in three figures because of large number of runs and
also for easier understanding and interpretation of the
obtained results. In this way, differences between tbp of
runs can be understood more easily.
To decide about the adequacy of model for the tbp, three
different tests, sequential model sum of square, lack of fit
test and model summary statistics were carried out in the
present study.
The data of tbp in this research were subjected to
regression analysis to estimate the effect of process
variables.
The p values for all the regressions were lower than 0.01
(Table 3). This means that at least one of the terms in the
regression equation has a significant correlation with the
response variables (Sun et al. 2007; Kumar et al. 2008).
Model summary statistics showed that the excluding cubic
model was aliased and quadratic model was found to have
maximum ‘‘Adjusted R-Squared’’ and the ‘‘Predicted
R-Squared’’ values. Therefore, quadratic model was chosen
for further analysis.
The analysis of variance (ANOVA) calculation on tbp is
summarized in Table 4. If the calculated value of F is
greater than that in the F table at a specified probability
level, a statistically significant factor or interaction is
obtained (Mohammadalizadeh et al. 2011b; Keyvanloo
Fig. 4 Breakthrough curves for
adsorption of H2S on zinc-
containing MCM-41. The inset
at the right side of the figure
represents the run number
(Table 2)
1002 Int. J. Environ. Sci. Technol. (2014) 11:997–1006
123

et al. 2010). The F is defined as F = MSF/MSE, where
MSF and MSE are the mean squares of factors (interac-
tions) and mean squares of errors, respectively. After car-
rying out the ANOVA test, the factors A, B, C and
interactions A 9 C, B 9 C, B2 and C2 proved to have
statistically significant effect on tbp, but interactions
A 9 B and A2 exhibited statistically insignificant effect on
tbp. F value is an indication of the level of significance. The
higher F is the more significant effect on the response.
From a combination of estimates for the variables and the
ANOVA results, a quadratic model with statistical signif-
icance can be generated. The regression equation obtained
after variance analysis gives the level of H2S adsorption. It
includes a linear relationship between all the main effects
and response the final quadratic polynomial equations in
terms of natural variables presented as follows:
Table 3 Adequacy of the model
Source Sum of square df Mean square F value Prob [ F Remark
Sequential model sum of square
Mean 1.489 9 106 1 1.489 9 106
Linear 3.316 9 105 3 1.105 9 105 4.87 0.0175 Suggested
2FI 1.349 9 105 3 44,956.33 2.81 0.0943 Suggested
Quadratic 1.072 9 105 3 35,722.22 4.71 0.0419 Suggested
Cubic 52,785.95 3 17,595.33 267.81 \0.0001 Aliased
Residual 262.80 4 65.70
Total 2.116 9 106 17 1.244 9 105
Lack of fit tests
Linear 2.948 9 105 9 32,757.96 498.6 \0.0001 Suggested
2FI 1.600 9 105 6 26,658.78 405.77 \0.0001 Suggested
Quadratic 52,785.98 3 17,595.33 267.81 \0.0001 Suggested
Cubic 0.000 0 Aliased
Pure error 0.029 4 65.70
Source SD R2 Adjusted R2 Predicted R2 PRESS Remark
Model summary statistics
Linear 150.66 0.5291 0.4205 0.1161 5.540 9 105 Suggested
2FI 126.58 0.7444 0.5910 0.1093 5.582 9 105 Suggested
Quadratic 87.05 0.9154 0.8065 -0.3483 8.450 9 105 Suggested
Cubic 8.11 0.9996 0.9983 Aliased
Table 4 Analysis of variance (ANOVA) of the response surface model for the prediction of tbp
Source Sum of square df Mean square F value P value (Prob [ F) Remark
Model 5.737 9 105 9 63,739.63 8.41 0.0052 Significant
A 72,390.13 1 72,390.13 9.55 0.0176 Significant
B 42,748.88 1 42,748.88 5.64 0.0492 Significant
C 2.165 9 105 1 2.165 9 105 28.57 0.0011 Significant
AB 519.84 1 519.84 0.069 0.8009 Not significant
AC 77,562.25 1 77,562.25 10.23 0.0151 Significant
BC 56,786.89 1 56,786.89 7.49 0.0290 Significant
A2 4,620.07 1 4,620.07 0.61 0.4605 Not significant
B2 46,886.42 1 46,886.42 6.19 0.0418 Significant
C2 46,575.92 1 46,575.92 6.15 0.0423 Significant
Error 262.80 4 65.70
Total 6.267 9 105 16
Int. J. Environ. Sci. Technol. (2014) 11:997–1006 1003
123
tbp ¼ þ158:481þ 20:033XA � 0:063XB � 0:0341XC
� 7:296� 10�3XA � XB � 2:476� 10�3XA � Xc
� 2:118� 10�4XB � XC þ 0:212X2A þ 6:754� 10�3X2
B
þ 5:194� 10�6X2C
ð4Þ
However, in this equation, the insignificant terms, i.e., A2
and AB, were omitted, and the equation was refitted to
experimental data. The obtained Eq. (5) is as follows:
tbp ¼ þ138:107þ 26:177XA�0:229XB�0:0354XC
�2:476� 10�3XA � Xc�2:118� 10�4XB � XC
þ 6:865� 10�3X2B þ 5:279� 10�6X2
C ð5Þ
Xi denotes the actual variables for factors, i.e., A, B and
C. XA corresponds to the weight percent of zinc (wt%) in
the adsorbent, XB (�C) to the temperature and XC (h-1) to
the space velocity. The R2 value equals to 0.9072 for
Eq. (5) indicates a good fitting for the experimental data of
the break point time.
Effects of the model components and their interactions
on tbp
According to this figure, break point increases by increas-
ing the weight percent of zinc (A) in the adsorbents and
decreased by increasing the space velocity (C). Increasing
zinc loading at center point operating condition (T: 175 �C
and space velocity: 7,500 h-1) caused noticeable increas-
ing of tbp. This is attributed to rise in the active sites by
increasing zinc oxide loading on MCM-41 which increases
the chemisorption of H2S on the support materials by
increasing temperature, tbp also increases. Increasing the
temperature speeded up the adsorption of H2S by chemical
adsorption of H2S on ZnO (Maghsodi et al. 2013). How-
ever, we performed TGA test on three spent adsorbents
which adsorbed H2S at 50, 140 and 300 �C, respectively).
The first adsorbent showed a reduction peak of about 3 %
at 150 �C, the second adsorbent displayed a reduction
weight about 1.9 % at 150 �C and the third adsorbent
exhibited 5.9 % weight loss at 530 �C. This means that
weight reduction at 150 �C temperature is due to the
release of physically adsorbed H2S on adsorbent. The
weight reduction at higher temperature (5.9 %) is larger
than those of low temperatures (3 and 1.9 %). This larger
weight loss at high temperature indicates that type of
adsorption at high temperature is chemisorption.
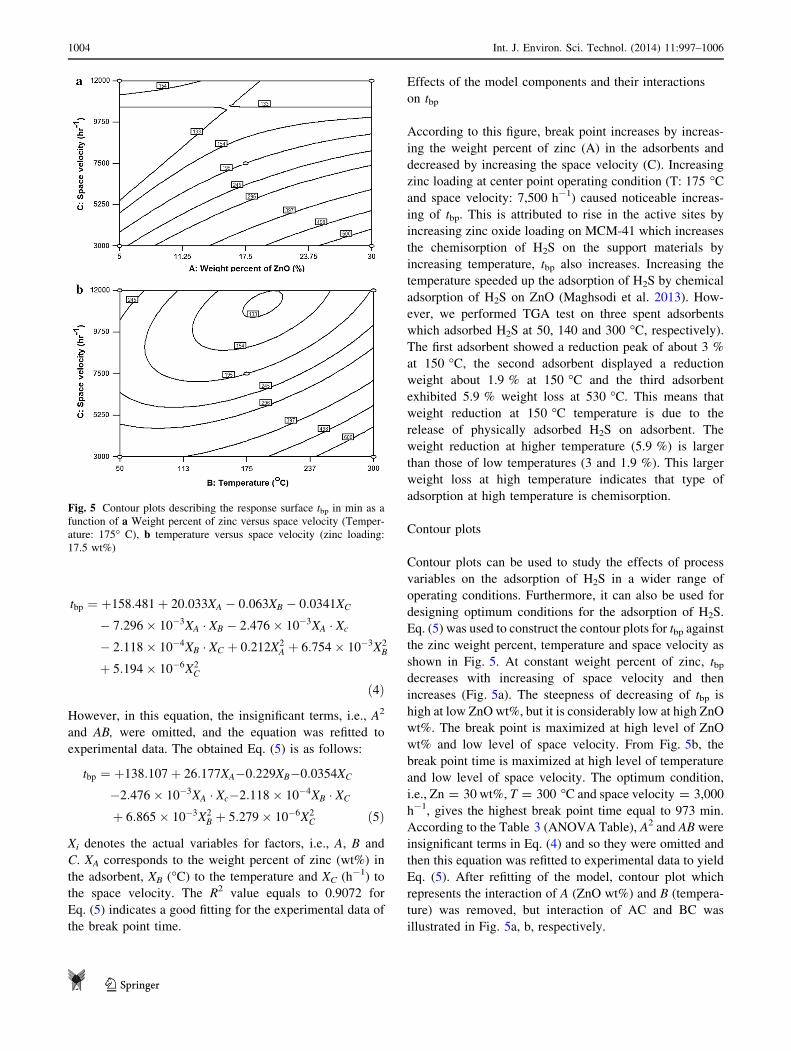
Contour plots
Contour plots can be used to study the effects of process
variables on the adsorption of H2S in a wider range of
operating conditions. Furthermore, it can also be used for
designing optimum conditions for the adsorption of H2S.
Eq. (5) was used to construct the contour plots for tbp against
the zinc weight percent, temperature and space velocity as
shown in Fig. 5. At constant weight percent of zinc, tbp
decreases with increasing of space velocity and then
increases (Fig. 5a). The steepness of decreasing of tbp is
high at low ZnO wt%, but it is considerably low at high ZnO
wt%. The break point is maximized at high level of ZnO
wt% and low level of space velocity. From Fig. 5b, the
break point time is maximized at high level of temperature
and low level of space velocity. The optimum condition,
i.e., Zn = 30 wt%, T = 300 �C and space velocity = 3,000
h-1, gives the highest break point time equal to 973 min.
According to the Table 3 (ANOVA Table), A2 and AB were
insignificant terms in Eq. (4) and so they were omitted and
then this equation was refitted to experimental data to yield
Eq. (5). After refitting of the model, contour plot which
represents the interaction of A (ZnO wt%) and B (tempera-
ture) was removed, but interaction of AC and BC was
illustrated in Fig. 5a, b, respectively.
Fig. 5 Contour plots describing the response surface tbp in min as a
function of a Weight percent of zinc versus space velocity (Temper-
ature: 175� C), b temperature versus space velocity (zinc loading:
17.5 wt%)
1004 Int. J. Environ. Sci. Technol. (2014) 11:997–1006
123

Conclusion
In this work, the H2S content of crude oil was removed using
combination of two methods, i.e., stripping and adsorption.
Investigation in to effects process parameters including
weight percent of zinc, temperature of adsorption and space
velocity on the adsorption of H2S using ZnOx/MCM was
also carried out via RSM methodology and Box–Behnken
experimental design. Characterization tests (XRD and N2
physisorption) showed that up to 30 wt% of ZnO, ordered
hexagonal structure of MCM-41 preserved. After carrying
out the ANOVA test, the factors A, B, C and interactions
A 9 C, B 9 C, B2 and C2 proved to have statistically sig-
nificant effect on tbp, but interactions A 9 B and A2 exhibited
statistically insignificant effect on tbp. Among the main
effects, space velocity has the highest effect on the response,
while temperature has the lowest effect. Among interactions,
A 9 C has the highest effect on the response even higher
than those of two main effects, i.e., temperature and ZnO
wt%. The regression equation obtained after variance ana-
lysis gives the level of H2S adsorption. According to F value,
the obtained model is significant and R2 is larger than 0.90
providing that over 90 % of total variations is explained by
the model. Furthermore, according to F value, the lack of fit is
not significant relative to the pure error which means the
model capture all the assignable cause variation of the
response. The optimal values of key factors (zinc loading,
temperature and space velocity) were obtained by solving the
regression Eq. 4. The point of weight percent of Zn = 30
wt%, T = 300 �C and space velocity = 3,000 h-1 in
experimental design is the optimum point with the highest
break point. The adsorption of H2S from crude oil has a high
impact on oil industry and environment because it reduces
the emission of H2S and saves the loss of valuable LPG and
lighter gases.
Acknowledgments We would like to acknowledge the Iranian
national oil company for the financial support under the grant number
of 14832662. This work has been supported by Iranian national oil
company. This work is original and is not published previously and
also is not under consideration elsewhere. All authors are agreeing
with publication of this manuscript in International Journal of
Environmental Science and Technology.
References
Bagreev A, Menendez JA, Dukhno I, Tarasenko Y, Bandosz TJ
(2004) Bituminous coal-based activated carbons modified with
nitrogen as adsorbents of hydrogen sulfide. Carbon
42(3):469–476
Corma A, Martinez A, Martinezsoria V, Monton JB (1995) Hydro-
cracking of vacuum gasoil on the novel mesoporous MCM-41
aluminosilicate catalyst. J Catal 153(1):25–31
Dorman DC, Moulin FJ, McManus BE, Mahle KC, James RA, Struve
MF (2002) Cytochrome oxidase inhibition induced by acute
hydrogen sulfide inhalation: correlation with tissue sulfide
concentrations in the rat brain, liver, lung, and nasal epithelium.
Toxicol Sci 65(1):18–25
Farahzadi M, Towfighi J, Mohammaalizadeh A (2012) Catalytic
oxidation of isopropyl mercaptan over nano catalyst of tungsten
oxide supported multiwall carbon nanotubes. Fuel Process
Technol 97:15–23
Galarneau A, Desplantier D, Dutartre R, Direnzo F (1999) Micelle
templated silicates as a test bed for methods of mesopore size
evaluation. Microp. Mesop. Mater. 27(2–3):297–308
Habibi R, Rashidi AM, Towfighi-Daryan J, Mohammadalizadeh A
(2010) Study of the Rod-Like and spherical nano-ZnO morphology
on H2S removal from natural gas. Appl Surf Sci 257(2):434–439
Hogan CM (2010) Abiotic factor encyclopedia of earth. In: Monosson
E, Cleveland C (eds).National Council for Science and the
Environment, Washington DC
Holleman AF, Wiberg E (2001) Inorganic chemistry. Academic
Press, San Diego
Husein MM, Patruyo L, Pereira-Almao P, Nassar NN (2010)
Scavenging H2S(g) sorption from oil phases by means of
ultradispersed sorbents. J Colloid Interface Sci 342(2):253–260
Keyvanloo K, Towfighi J, Sadrameli SM, Mohamadalizadeh A (2010)
Investigating the effect of key factors, their interactions and
optimization of naphtha steam cracking by statistical design of
experiments. J Anal Appl Pyrolysis 87(2):224–230
Ko TH, Chu H, Chaung LK, Tseng TK (2004) High temperature
removal of hydrogen sulfide using an N-150 sorbent. J Hazard
Mater 114(1–3):145–152
Kresge CT, Leonowicz ME, Roth WJ, Vartuli JC, Beck JS (1992)
Ordered mesoporous molecular sieves synthesized by a liquid-
crystal template mechanism. Nature 359:710–712
Kumar A, Prasad B, Mishra I (2008) Optimization of process
parameters for acrylonitrile removal by a low-cost adsorbent
using Box–Behnken design. J Hazard Mater 150(1):174–182
Li L, Wu P, Yu Q, Wu G, Guan N (2010) Low temperature H2-SCR
over platinum catalysts supported on Ti-containing MCM-41.
Appl Catal B Environ 94(3–4):254–262
Maghsodi H, Soltanieh M, Bozorgzadeh HR, Mohamadalizadeh A
(2013) Adsorption isotherms and ideal selectivities of hydrogen
sulfide and carbon dioxide over methane for the Si-CHA zeolite:
comparison of carbon dioxide and methane adsorption with the
all-silica DD3R zeolite. Adsorption 19:1045–1053
Mohammadalizadeh A, Towfighi J, Rashidi A, Manteghian M,
Mohajeri A, Arasteh R (2011a) Nanoclays as nano adsorbent
for oxidation of H2S into elemental sulfur. Korean J Chem Eng
28(5):1221–1226
Mohammadalizadeh A, Towfighi J, Rashidi A, Mohajeri A, Golkar M
(2011b) Modification of carbon nanotubes for H2S sorption. Ind
Eng Chem Res 50(13):8050–8057
Morais Batista AH, de Sousa FF, Honorato SB, Ayala AP, Filho JM,
de Sousa FW, Pinheiro AN, de Araujo JCS, Nascimento RF,
Valentini A, Oliveira AC (2010) Ethylbenzene to chemicals:
catalytic conversion of ethylbenzene into styrene over metal-
containing MCM-41. J Mol Catal A: Chem 315(1):86–98
Nassar NN, Husein MM, Pereira-Almao P (2010) Ultradispersed
particles in heavy oil: part II, sorption of H2S (g). Fuel Process
Technol 91(2):169–174
Polychronopoulou K, Fierro JLG, Efstathiou AM (2005) Novel Zn–
Ti-based mixed metal oxides for low-temperature adsorption of
H2S from industrial gas streams. Appl Catal B Environ
57(2):125–137
Rowan FE, Docherty NG, Coffey JC, O’Connell PR (2009) Sulphate-
reducing bacteria and hydrogen sulphide in the aetiology of
ulcerative colitis. Br J Surg 96(2):151–158
Samadi-Maybodi A, Teymouri M, Vahid A, Miranbeigi A (2011)
In situ incorporation of nickel nanoparticles into the mesopores
Int. J. Environ. Sci. Technol. (2014) 11:997–1006 1005
123

of MCM-41 by manipulation of solvent-solute interaction and its
activity toward adsorptive desulfurization of gas oil. J Hazard
Mater 192(3):1667–1674
Srivastav A, Srivastava VC (2009) Adsorptive desulfurization by
activated alumina. J Hazard Mater 170(2–3):1133–1140
Subrenat A, Le Leuch LM, Le Cloirec P (2008) Electro deposition of
copper and iron oxides on to activated carbon fibred cloths:
application to H2S and NH3 removal from air. Environ Technol
29(9):993–1000
Sun J, Modi S, Liu K, Lesieur R, Buglass J (2007) Kinetics of zinc
oxide sulfidation for packed-bed desulfurizer modeling. Energ
Fuels 21(4):1863–1871
Taguchi A, Schuth F (2005) Ordered mesoporous materials in
catalysis. Microp Mesop Mater 77(1):1–45
Tripathi P, Srivastava V, Kumar A (2009) Optimization of an azo dye
batch adsorption parameters using Box–Behnken design. Desal-
in. 149(3):1273–1279
Untea I, Dancila M, Vasile E, Belcu M (2009) Structural, morpho-
logical and textural modifications of ZnO–TiO2 HTGD based
sorbents induced by Al2O3 addition, thermal treatment and
sulfurizing process. Powder Technol 191(1–2):27–33
Wan Y, Zhao DY (2007) On the controllable soft-templating
approach to mesoporous silicates. Chem Rev 107(7):2821–2860
Wang X, Jia J, Zhao L, Sun T (2008) Chemisorption of hydrogen
sulphide on zinc oxide modified aluminum-substituted SBA-15.
Appl Surf Sci 254(17):5445–5451
Wang JA, Zhou XL, Chen LF, Norena LE, Yu GX, Li CL (2009)
Hydroisomerization of n-heptane on the Pt/H3PW12O40/Zr-
MCM-41 catalysts. J Mol Catalysis A Chem 299(1–2):68–76
Wang J, Qiu B, Han L, Feng G, Hu Y, Chang L, Bao W (2012) Effect
of precursor and preparation method on manganese based
activated carbon sorbents for removing H2S from hot coal gas.
J Hazard Mater 213–214:184–192
Westmoreland PR, Harrison DP (1976) Evaluation of candidate solids
for high-temperature desulfurization of low-Btu gases. Environ
Sci Technol 10(7):659–661
Wieckowska J (1995) Catalytic and adsorptive desulphurization of
gases. Catal Today 24(4):405–465
1006 Int. J. Environ. Sci. Technol. (2014) 11:997–1006
123