removal of fluoride from drinking water using egg shellsutpedia.utp.edu.my › 8447 › 1 › fyp...
TRANSCRIPT
Removal of Fluoride from Drinking Water Using Egg Shells
BY
I NYOMAN PRASETYA PERMANA
13506
A project dissertation submitted to the
Chemical Engineering Program
Universiti Teknologi PETRONAS
in partial fulfilment of the requirement for the
BACHELOR OF ENGINEERING (Hons)
(CHEMICAL ENGINEERING)
May 2013
Universiti Teknologi PETRONAS
Bandar Seri Iskandar
31750 Tronoh
Perak Darul Ridzuan
i
CERTIFICATION OF APPROVAL
Removal of Fluoride from Drinking Water using Egg Shells
by
I Nyoman Prasetya Permana
13506
A project dissertation submitted to the
Chemical Engineering Program
Universiti Teknologi PETRONAS
in partial fulfilment of the requirement for the
BACHELOR OF ENGINEERING (Hons)
(CHEMICAL ENGINEERING)
Approved by,
_____________________
(Dr Lemma Dendena Tufa)
UNIVERSITI TEKNOLOGI PETRONAS
TRONOH, PERAK
May 2013
ii
CERTIFICATION OF ORIGINALITY
This is to certify that I am responsible for the work submitted in this project, that the
original work is my own except as specified in the references and
acknowledgements, and that the original work contained herein have not been
undertaken or done by unspecified sources or persons.
__________________________
(I Nyoman Prasetya Permana, ID: 13506)
iii
ABSTRACT
Fluoride is one of the ions that naturally occurring and often found in ground or river
water both in high and low concentration where its origin might come naturally or
anthropogenic. Fluoride in concentration above 1.5 ppm is having a bad side effect
to human health since it causes fluorosis that increases the hardness of bones and
teeth while reducing their elasticity, thus making the bones brittle.
Removal of fluoride or defluridation is often required in order to reduce the
concentration of fluoride in drinking water below its safe level before being
consumed. There are many techniques that can be used in order to reduce the
concentration of fluoride in water such as adsorption, reverse osmosis, precipitation,
and electrodialysis. Adsorption is one of the defluoridation methods that offer low
cost and acceptable efficiency without removing other important ions from the water.
However its cost and efficiency is highly dependent on its type of adsorbent.
Egg shells, a cheap waste product from food industry, are the chosen adsorbent in
this study, where it potential of being an adsorbent of fluoride is being tested by
varying the pH and the adsorbent amount. From the study, it is seen that the
optimum pH of the adsorption lies at pH around pH5 with highest efficiency of
0.1334942 mgfluoride/gegg shell. Its capability of regeneration is also being tested and
NaOH proven to be the effective reagents for its regeneration process. A further
study is suggested on looking at the effect of time od the adsorption amount and also
further study regarding which is more feasible between regenerating the used
eggshell or replace it with a new one.
iv
ACKNOWLEDGEMENT
I would like to express my utmost gratitude to my very kind and supporting
supervisor, Dr Lemma Dendena Tufa for his permission to work on this project and
for his assistance throughout the project period. I am thankful to the colleagues and
lecturers from chemical engineering department for their support and feed-backs
during the progress of this work. In addition to that, I would also like to thank the
technicians in chemical engineering department for their help in performing the
experiments needed for this study. Last but not least, I would like to thank my family
for their continuous support and encouragement in my studies and this project
especially.

v
TABLE OF CONTENTS
CERTIFICATION OF APPROVAL ............................................................................ i
CERTIFICATION OF ORIGINALITY ...................................................................... ii
ABSTRACT ............................................................................................................... iii
ACKNOWLEDGEMENT .......................................................................................... iv
TABLE OF CONTENTS ............................................................................................. v
LIST OF TABLES ..................................................................................................... vii
LIST OF FIGURES ................................................................................................. viii
CHAPTER 1 PROJECT BACKGROUND ................................................................ 1
1.1 Background Study ......................................................................................... 1
1.2 Problem Statement ........................................................................................ 4
1.3 Objective ....................................................................................................... 4
1.4 Scope of Study ............................................................................................... 4
CHAPTER 2 LITERATURE REVIEW ..................................................................... 6
2.1 Defluoridation Technique .............................................................................. 6
2.2 Principal of Adsorption ................................................................................. 9
2.3 Egg Shell ..................................................................................................... 13
CHAPTER 3 METHODOLOGY ............................................................................. 15
3.1 Research Methodology ................................................................................ 15
3.1.1 Chemical and Materials Needed .......................................................... 15
3.1.2 Experimental Procedures / Approach................................................... 16
3.2 Preparation of Adsorbent ............................................................................. 16
3.3 Preliminary Experiment .............................................................................. 17
vi
3.4 Testing the Effect of pH and Amount of Adsorbent at 5mg/L solution ...... 17
3.5 Testing Effectiveness at Higher Concentration of Fluoride ........................ 18
3.6 Testing the Regeneration Capability ........................................................... 19
3.7 Variation of Parameter ................................................................................ 19
3.8 Key Milestones ............................................................................................ 20
3.9 Gantt Chart .................................................................................................. 21
CHAPTER 4 RESULTS AND DISCUSSION ......................................................... 22
4.1 Preliminary Experiment .............................................................................. 22
4.2 Testing the Effect of pH and Amount of Adsorbent at 5mg/L solution ...... 26
4.3 Testing Effectiveness at Higher Concentration of Fluoride ........................ 34
4.4 Testing the Regeneration Capability ........................................................... 36
CHAPTER 5 CONCLUSION & RECOMMENDATION ........................................ 39
5.1 Conclusion ................................................................................................... 39
5.2 Recommendation ......................................................................................... 40
REFFERENCES ........................................................................................................ 41
vii
LIST OF TABLES
Table 2-1 Comparison of Defluoridation Methods ...................................................... 6
Table 3-1 Taguchi L'16 Array .................................................................................... 18
Table 3-2 Key Milestones .......................................................................................... 20
Table 3-3 Gantt chart ................................................................................................. 21
Table 4-1 Result of Preliminary Experiment ............................................................. 22
Table 4-2 Effect of pH and Amount of Adsorbent at 5mg/L solution ....................... 27
Table 4-3 Effectiveness of Eggshell at 5mg/L .......................................................... 28
Table 4-4 ANOVA Table ........................................................................................... 29
Table 4-5 Concentration Change at 10mg/L Fluoride solution ................................. 34
Table 4-6 Effectiveness at 10mg/L fluoride solution ................................................. 35
Table 4-7 Final Fluoride Concentration ..................................................................... 36
viii
LIST OF FIGURES
Figure 1-1 Countries with endemic fluorosis ............................................................... 3
Figure 3-1 Experimental Approach ............................................................................ 16
Figure 4-1 Amount of eggshell vs final fluoride concentration ................................. 23
Figure 4-2 Amount of eggshell vs amount of fluoride removed ................................ 24
Figure 4-3 Amount of adsorbent vs qe ....................................................................... 24
Figure 4-4Amount of adsorbent vs Qe ....................................................................... 25
Figure 4-5 Effect of pH on adsorption efficiency (averaged amount of adsorbent) .. 30
Figure 4-6 Effect of amount of adsorbent on adsorption efficiency at pH 3 ............. 31
Figure 4-7 Effect of amount of adsorbent on adsorption efficiency at pH 5 ............. 31
Figure 4-8 Effect of amount of adsorbent on adsorption efficiency at pH 7 ............. 32
Figure 4-9 Effect of amount of adsorbent on adsorption efficiency at pH 9 ............. 32
Figure 4-10 Effect of amount of adsorbent on different level of pH ......................... 34
Figure 4-11 Amount of Adsorbent vs Efficiency at 10 mg/L solution ...................... 35
Figure 4-12 Treatment Time vs Final Fluoride Concentration .................................. 37
1
CHAPTER 1
PROJECT BACKGROUND
1.1 Background Study
Fluoride is an anion which is the reduced form of fluorine where it acts as an ion or
when in is bonded to another element. Like other halides, it is a monovalent ion with
-1 charge. Compounds that consist of fluoride usually having distinct properties
when compared to other halides compound. Inorganic compound containing fluorine
are often called as fluorides. Solutions of inorganic fluoride in water usually contain
F- and HF
-2. Only few of the inorganic fluorides are soluble in water without
undergoing significant hydrolysis. Because of its smaller radius/charge ratio,
fluorides are more strongly solvated thus it reactivity differs from chloride and other
halides. When relatively unsolated, fluoride is a very strong base. The presence of
fluoride and its compounds can be detected by spectroscopy.
Fluoride is usually found naturally in water and foods, however it exist in low
concentration. Average concentration of fluoride in seawater is 1.3 ppm, 0.01-0.3
ppm for fresh water supplies, 1.2-1.5 ppm for ocean (WHO,2004). However some of
the fresh water contains a dangerous level of fluoride and defluoridation must be
performed in order to remove the excess fluoride from this kind of source.
2
Fluoride has a good effect on human body at low concentration in drinking water
since it promotes calcification and was able to protect tooth from decaying. This
beneficial concentration of fluoride in drinking water range from 0.4 ppm to 1.0 ppm
(Fawell et. Al, 2006). However if the concentration of fluoride in drinking water is
too high, above 1.5 ppm which is stated by World Health Organization (WHO,1996),
people who drank the water will be exposed to health problem named fluorosis.
Fluorosis is divided into dental fluorosis and skeletal fluorosis. Dental fluorosis is a
developmental disturbance of the teeth’s enamel caused by overexposure of fluoride.
Dental fluorosis happened when the hydroxyapatites, general composition of teeth,
in the teeth are replaced by fluorapatites. This causes some white spots on the teeth,
in milder case, or a rough brown marking on the teeth in some severe case. The most
concern regarding dental fluorosis comes on aesthetic parts in permanent dentition
(Yeung,2008).
A more threatening effect of overexposure of fluoride can be seen in the form of
skeletal fluorosis which in its advanced cases causes damage and pain to bones and
joints. The bones are hardened and become less elastic due to high concentration of
fluoride thus resulting in higher frequency of fractures in the bone. On the joints,
fluoride promotes the calcification on the joints. Fluorosis also causes thickening of
bone structure and accumulation of bone tissue which contributes to impaired joint
mobility. On the other hand, high concentration fluorides also affect the thyroid
gland which causes hyperparathyroidism where an uncontrolled secretion of
parathyroid hormones occurs. These hormones regulate the concentration of calcium
in the body thus an increase of these hormones in the body demands an increase in
calcium concentration in the body. If the intake calcium is less than the demand
caused by this increase in amount of the parathyroid hormones, calcium are started to
be taken from the bones thus causes flexibility of the bones reduces. This, combined
with the original effect of skeletal fluorosis makes the bones more brittle than it
should causing it to easily fractures (Whittford, 1994).

3
Causes of high fluoride concentration on water are both caused by natural occurrence
and industrial activities. Waste water producers such as aluminum, steel, glass,
toothpaste, and pesticides industries are often contains fluoride which are able to
enter water bodies. While naturally this happened due to the coming of fluoride from
some rocks and mineral that contains fluoride and passed by water (WHO,1996).
Due to both of this occurrence that increases fluoride level in water, UNICEF stated
that there are at least 25 countries which are affected by fluorosis across the globe.
Countries that are affected by fluorosis mostly come from Asia, northern Africa, and
eastern Africa. Apart from this region there are also some countries that are affected
including Mexico, Argentina, Australia and New Zealand. The Figure 1-1 below,
which is taken from UNICEF website, clearly shows the countries affected with
endemic level of fluorosis (UNICEF).
Figure 1-1 Countries with endemic fluorosis
This information above proves that the need of reducing fluoride from water,
especially drinking water is becoming more important today.

4
1.2 Problem Statement
Due to the nature of some water bodies with high fluoride content whether it is
because of industrial effect or natural occurrence and the effect fluoride have on
human body, it is becoming important to remove this constituent of water to safe
level before consumed by people. Removal techniques are being employed in order
to reduce the concentration of fluoride. However some of the defluoridation method
are expensive are not readily available while giving some setbacks as well as
advantage on its own. Egg shells are some example of materials that can remove
fluoride from water effectively. Putting it aside, these materials are easily found and
needs simple processing before being able to be used for deluoridation process.
However, more investigation regarding the capabilities of this material is still need to
be done.
1.3 Objective
The objective of the study is as follow:
- To investigate the effectiveness of eggshell as fluoride adsorbent, considering the
effect of adsorbent amount and pH.
- Investigate the regeneration capability of eggshell
The study above is done in order to see the feasibility of eggshells as a low cost
alternative for defluoridation of drinking water as well as to investigate the
regeneration capabilities of eggshell.
1.4 Scope of Study
The basic of the study is about how effective an alternative low cost adsorbent such
as eggshells able to remove fluoride from water. First of all the capability of
eggshells to remove fluoride from drinking water is being studied by investigating
5
the amount of fluoride it can remove within certain amount of eggshell that is being
used. Furthermore, the effect of pH and eggshell amount regarding the capability of
the adsorbents and its regeneration capabilities will be investigated to see feasibility
of the eggshell to be used on a larger scale.
6
CHAPTER 2
LITERATURE REVIEW
2.1 Defluoridation Technique
One of the easiest methods in order to reduce concentration of fluoride in drinking
water is to add fresh water with lower concentration of fluoride with water with high
concentration in order to dilute the fluoride concentration. However, such source of
water with low fluoride content might not readily available in some places.
Therefore defluoridation is the only alternative left in order to reduce the
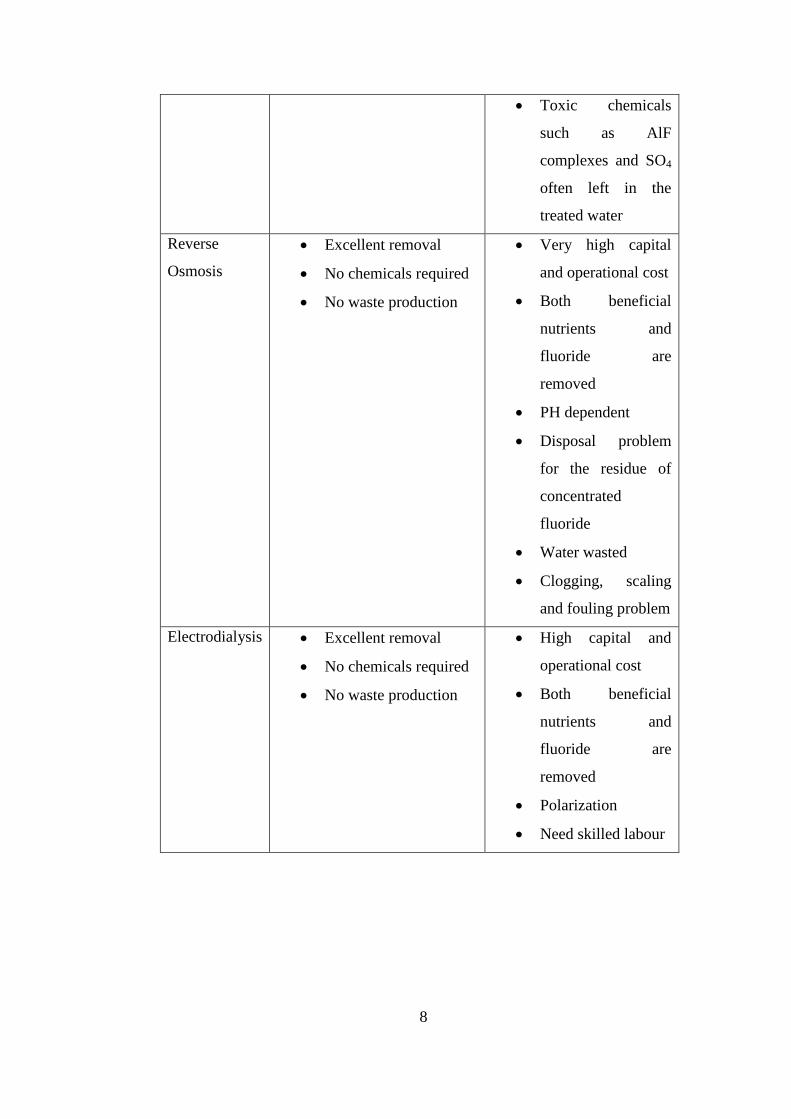
concentration of fluoride in water. There are five methods that are commonly used to
perform defluoridation which are adsorption or ion exchange, electrodialysis, reverse
osmosis, and precipitation/coagulation. The advantage and disadvantage of each
method are listed on the table below (Logathanan et. al, 2012).
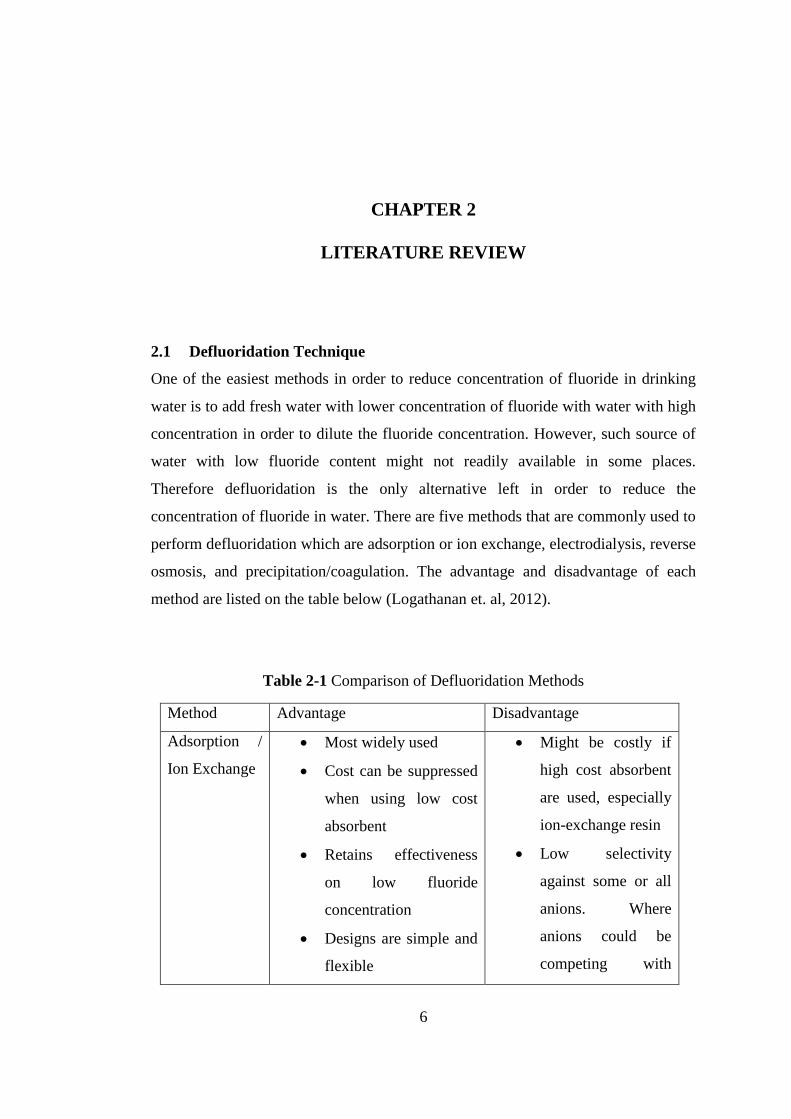
Table 2-1 Comparison of Defluoridation Methods
Method Advantage Disadvantage
Adsorption /
Ion Exchange
Most widely used
Cost can be suppressed
when using low cost
absorbent
Retains effectiveness
on low fluoride
concentration
Designs are simple and
flexible
Might be costly if
high cost absorbent
are used, especially
ion-exchange resin
Low selectivity
against some or all
anions. Where
anions could be
competing with

7
Ease of operation
Minimum to no waste
production
fluoride ion
Frequent
regeneration or
replacement of
adsorbent needed
Effective at pH < 7
Granular adsorbent
needed for good
hydraulic flow
Precipitation /
coagulation
Medium cost
Precise control of
chemicals addition
Widely used
Low effectiveness,
cannot remove
below 5mg/L of
fluoride due to the
high solubility of
the product CaF2
and secondary
treatment needed
Requires large
amount of
chemicals
Frequent testing of
feed and treated
water needed
Additional cost
might come from
the chemical, its
storage and feeding
system
Large volume of
sludge waste
Acid neutralization
needed
8
Toxic chemicals
such as AlF
complexes and SO4
often left in the
treated water
Reverse
Osmosis
Excellent removal
No chemicals required
No waste production
Very high capital
and operational cost
Both beneficial
nutrients and
fluoride are
removed
PH dependent
Disposal problem
for the residue of
concentrated
fluoride
Water wasted
Clogging, scaling
and fouling problem
Electrodialysis Excellent removal
No chemicals required
No waste production
High capital and
operational cost
Both beneficial
nutrients and
fluoride are
removed
Polarization
Need skilled labour

9
2.2 Principal of Adsorption
Adsorption is the adhesion of atoms, molecules or ions into a surface. These atoms
create a film of adsorbate to the surface of the adsorbent (Logathanan et. al, 2012).
Mainly there are five mechanism in which adsorption occurs which are van der
Waals force, ion exchange, hydrogen bonding, ligand exchange, and chemical
modification on the surface of adsorbent. In the case of adsorption of fluoride, van
der Waals and ion exchange mechanism both uses weak physical adsorption an not
specific to fluoride. However hydrogen bonding and ligand exchange could give a
more specific adsorption of fluoride since it is governed by chemical adsorption.
Modification on the surface of adsorbent gives both chemical and physical
adsorption thus giving both specific and non-specific adsorption.
If other anions existed in the water, both van der Waals and ion exchange cannot
remove fluoride easily. Fluoride adsorption however, will be achieved by hydrogen
bonding and ligand exchange in the presence of most types of anions in the water.
Only some anions that specifically on the adsorbent will compete with fluoride on
the adsorption sites (Logathanan et. al, 2012).
Van der Waals force is weak and only applies on short range. This force is
proportionally increasing with the size of the molecules involved. Therefore
adsorbates with high molecular weight will be more likely to stick on the surface of
an adsorbent. Therefore this causes fluoride will be hard to be removed from solution
which contains another adsorbate that have higher molecular weight, for example
organic matters (Gupta et al, 2006). Only manganese oxide-coated alumina at high
pH is able to adsorb fluoride via van der Waals force (Teng et all, 2006).
In ion exchange, occurs a stoichiometric process where ions leaving ion exchanger
surface is replaced by equivalent number of moles of ions in order to maintain the
neutrality of the exchanger where this process is rapid and reversible. Ion exchange
selectivity depends on the valency, concentration and size of the ions that is involved
in the exchange. Higher valency, higher concentration and smaller hydrated
10
equivalent volume are favored. Fluoride removal is hard to achieve via this
mechanism due to the fact that there are many other anions which are having better
selectivity compared to fluoride. This selectivity order can be simplified as the
following: citrate > SO42- > I- > NO3- > CrO42-> Br- > SCN- > Cl- > acetate > F-.
Thus if these anions exist in the solution, it will be very hard to selectively adsorb
fluoride (Weinerl, 2012).
Hydrogen bonding gave a strong dipole-dipole attraction between the strong
electropositive H atom in a molecule of an adsorbent and a strong electronegative
atom in another molecule (Weinerl, 2012). This type of bond gives a strong force
compared to van der Waals and ion exchange but weaker than ligand exchange. Due
to its high charge/atomic radius value, fluorine is one of the most electronegative
atom thus is having high selectivity on adsorption. Coal based adsorbent and ion
exchange resins are examples of adsorbent which create hydrogen bond with fluoride
(Sivasamy, 2011).
Taking a look on ligand exchange mechanism, metallic cation at the surface of an
adsorbent creates a strong covalent metallic bond with fluoride in solution. This
releases other potential determining ions that were bound to the metallic cation
before such as OH-. Therefore F is specifically adsorbed on the adsorbent surface or
sometimes called as forming inner sphere complex. This ligand exchange
mechanism, expecially on metal oxides, often cause an increase in the pH of the
solution because of the release of OH- ions from the adsorbent. This kind of
adsorbent has an advantage in terms of giving high adsorption capacity as well as
high selectivity. Ligand exchange mechanism also enables the adsorbent to remove a
large proportion of anions which have higher selectivity but lower concentration in a
solution where competing anions with lower selectivity but higher concentration also
existed (Tokunaga et al, 1995).
11
Adsorption capacity of an adsorbent can be improved by performing chemical
modification on the surface of the adsorbent. This is useful especially in the case
where the adsorbents are having negative surface charge which might repel the
negatively charged fluoride. In these kind of adsorbents, positive charged multivalent
cations are introduced into the adsorbent in order to attract fluoride ions by columbic
force and produce adsorption sites that can interact with the fluoride ions. These
cations act similar like a bridge to assist the adsorption.
Therefore it can be concluded that among these methods, the best solutions for
adsorption in defluorization of water is by harnessing the ligand exchange and
hydrogen bonding mechanism. And further studies have found out that ligand
exchange mechanism are dominant when inorganic adsorbent were used, where
hydrogen bonding were dominant when organic adsorbent were used (Logathanan et.
al, 2012)
Adsorption rate and capacity are affected by several factors including pH,
temperature, adsorption kinetics, and co-existing anions. Among these factors, pH is
considered as the factor that has greatest effect to adsorption. Adsorption reaches its
lowest value on both very low and very high pH. Despite that each type of adsorbent
has their own optimum pH, but they can be generalized as having good performance
at the pH ranging from 4 to 8. This occurs due to the concentration of positive when
pH is low and negative ions when pH is high. The reduction of adsorption below pH
4 occurs because fluoride started to react with hydrogen to form weakly ionized HF.
At pH higher than 8, the surface of the adsorbent started to become negatively
charged, thus hindering attraction of fluoride. Furthermore high pH condition causes
other competing cations increases in number which further lessen the adsoption
capability (Logathanan et. al, 2012).

12
Some anions like phosphate, chloride, sulphate, bromide and nitrate presents in
natural water and having potential of competing with fluoride for removal by
adsorbents. However this competition only depends on the relative concentration of
these ions and their affinity for the adsorbent (Meenakshi & Viswanathan, 2007).
Mostly they will affect the adsorption when ion exchange resins are used as an
adsorbent. Past studies shows that nonspecifically adsorbing ion, such as nitrate and
chloride, doesn’t have effect on fluoride adsorption that is using adsorbent that
specifically adsorb fluoride. Only specifically adsorbed anions such as phosphate,
arsenate and selenate can compete with fluoride in this kind of adsorbent. However,
if a non-specific adsorbent is being used, both nonspecifically and specifically
adsorbed anions can compete with fluoride (Logathanan et. al, 2012).
Different with earlier factors, temperature shows now consistency in terms of its
effect on adsorption. Adsorption with endothermic nature increases as temperature
increases, however it decreases as temperature increase if an exothermic natured
adsorption occurs (Logathanan et. al, 2012). Some adsorbents, like trivalent
cations/zeolite, show no significant effect on adsorption when temperature is
changed (Onyago et all, 2004). The reason of this inconsistencies are not well
investigated and stated in previous studies since it may depends on temperature
range studies, the nature of the adsorbent, and the conditions used in the studies
(Logathanan et. al, 2012).
Finally adsorption kinetics also has its own effect on adsorption. Studies have shown
that 90% of fluoride was removed in the first 5-120 minute where the rate of removal
was very high at this range and thereafter falls off significantly and finally
approaches zero as the sign of equilibrium. This occurs because at the early minutes,
there are many vacant sites on the adsorbent thus encourage high rate of removal.
This fast rate enables the adsorbent to treat large quantity of water (Lv et. al, 2006)
where slow rate would be a problem in the adsorption process of the filter bed
(Ruixia, Jinlong & Honxiao, 2002). Rate of fluoride adsorption increases as the
13
initial concentration of adsorbent increases (Lv et. al, 2006) and as the initial
concentration of fluoride decreases. Properties of the structure of the adsorbent and
the interaction of fluoride with these sites also determine the rate of reaction
(Logathanan et. al, 2012).
Suitable adsorbent for fluoride doesn’t just have a good capability in adsorbing
fluoride. It also need good cost effectiveness as well as good desorption capabilities,
where the latter could lead into efficient regeneration for multiple times. A good
reagent for desorption or regeneration process doesn’t damage the adsorbent.
Desorption occurs by leaching the fluoride ion from the adsorbent by the action of
salts, acid or bases. Desorbing agents can be chosen based on the activity of the
adsorption at certain pH. Low adsorption on low pH proposes acid as the desorbent
and low adsorption at high pH proposes bases as the desorbent. Therefore the
optimum desorption condition is basically on the lowest condition for adsorption.
(Logathanan et. al, 2012).
2.3 Egg Shell
The outer coatings of hard-shelled eggs are often called as egg shell. Avian
egg shells existed in order to protect the egg against damage and contamination. It
also provides calcium for embryogenesis. According to the data from US food
industry, more than 150000 tons of egg shell waste was produced in a year. Where
mostly used as fertilizer, animal feed ingredients or discarded (Nakano, Ikawa &
Ozimek, 2003). Egg shells, especially bird ones, contains calcium carbonate inside it.
Chicken eggshells are made of 94% calcium carbonate crystals where it is stabilized
by a protein matrix. The remaining constituents are made of magnesium carbonate
by 1%, calcium phosphate for 1% and organic matter, which includes the protein
matrix, by 4%. The egg shells waste from food processing and manufacturing
usually composed of the calcium carbonate and the eggshell membrane or called as
14
ESM. The ESM resides between the egg white and the inner surface of the eggshell
(Parsons, 1982; Nakano, Ikawa & Ozimek, 2003).
Egg shell powder also start being used as a fluoride adsorbent from ground
water due to its high calcium content that can attract the negative fluoride ions.
Experimental data indicated monolayer sorption of homogeneus surface. And
according to Dubinin-Radishkevic isotherm model, the adsorption mechanism of
eggshell powder was chemisorption. This was implied by the kinetics of the
adsorption by eggshell which follows a pseudo-second-order kinetic model.
Thermodynamic model also implies that adsorption of fluoride by egg shells are
exothermic and spontaneous process. Eggshell powder also found to have a good
result when tested to defluoride ground water sample collected from Nasipur and
Nowapara Village in India (Bhaumik et. al, 2012).

15
CHAPTER 3
METHODOLOGY
3.1 Research Methodology
3.1.1 Chemical and Materials Needed
Some chemicals and materials needed for the study are:
o Eggshells
Eggshells will be the main material to be studied. The material however will be
treated 1st before being used to conduct experiment.
o Sodium Fluoride
Sodium fluoride will be the basis for the fluoride solution. The initial solution
concentration will be based on 5mg/L and 10mg/L with the amount of 200mL.
o Phosporic Acid
Phosporic Acid will be the main acid used to backwash the eggshell powder to
investigate its regeneration capabilities
o HCL
Hydrochloric acid will be used to conduct experiment regarding the effect pH on the
adsorption. It will be prepared to alter and prepare the pH of the solution.
o NaOH
16
Hydrochloric acid will be used to conduct experiment regarding the effect pH on the
adsorption. It will be prepared to alter and prepare the pH of the solution. A solution
of 0.01 Mol NaOH will be prepared to regenerate the eggshell as well.
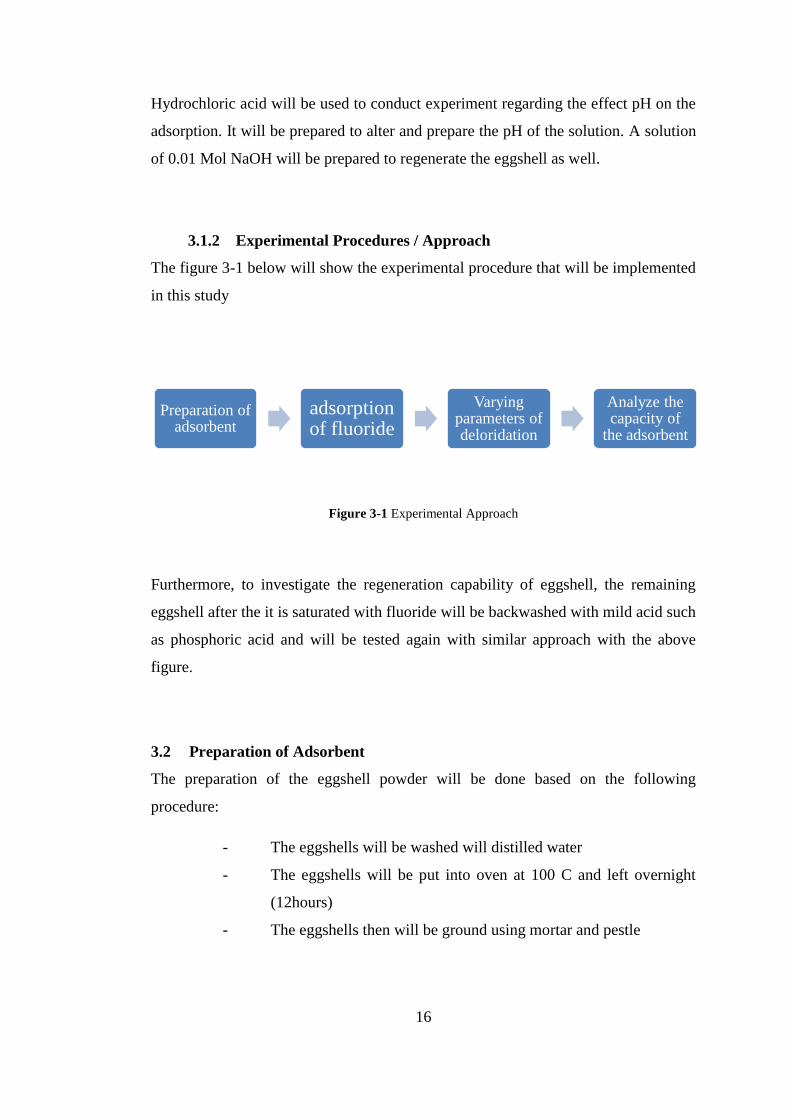
3.1.2 Experimental Procedures / Approach
The figure 3-1 below will show the experimental procedure that will be implemented
in this study
Figure 3-1 Experimental Approach
Furthermore, to investigate the regeneration capability of eggshell, the remaining
eggshell after the it is saturated with fluoride will be backwashed with mild acid such
as phosphoric acid and will be tested again with similar approach with the above
figure.
3.2 Preparation of Adsorbent
The preparation of the eggshell powder will be done based on the following
procedure:
- The eggshells will be washed will distilled water
- The eggshells will be put into oven at 100 C and left overnight
(12hours)
- The eggshells then will be ground using mortar and pestle
Preparation of adsorbent
adsorption of fluoride
Varying parameters of deloridation
Analyze the capacity of
the adsorbent
17
3.3 Preliminary Experiment
The procedure for testing the effect of the amount of adsorbent used will be done
based on the following procedure:
- 200 mL of 2.15 mg/L of fluoride solution will be put into 4 1L
beakers. Their pH are being controlled using HCl and were put
into pH of 3.
- 1.4, 2.8, 4.2 and 5.6 grams of adsorbent were put into the beakers
respectively. Using jar test equipment, the solution is stirred for 2
hours under 120 rpm.
- After 2 hours, 10ml of solutions from each beaker are extracted
and put into different test tubes. Ion chromatography was used to
determine the final value of the fluoride concentration.
- The experiment was then repeated using absorbent values of 0.28,
0.56, 0.84 and 1.12 g .
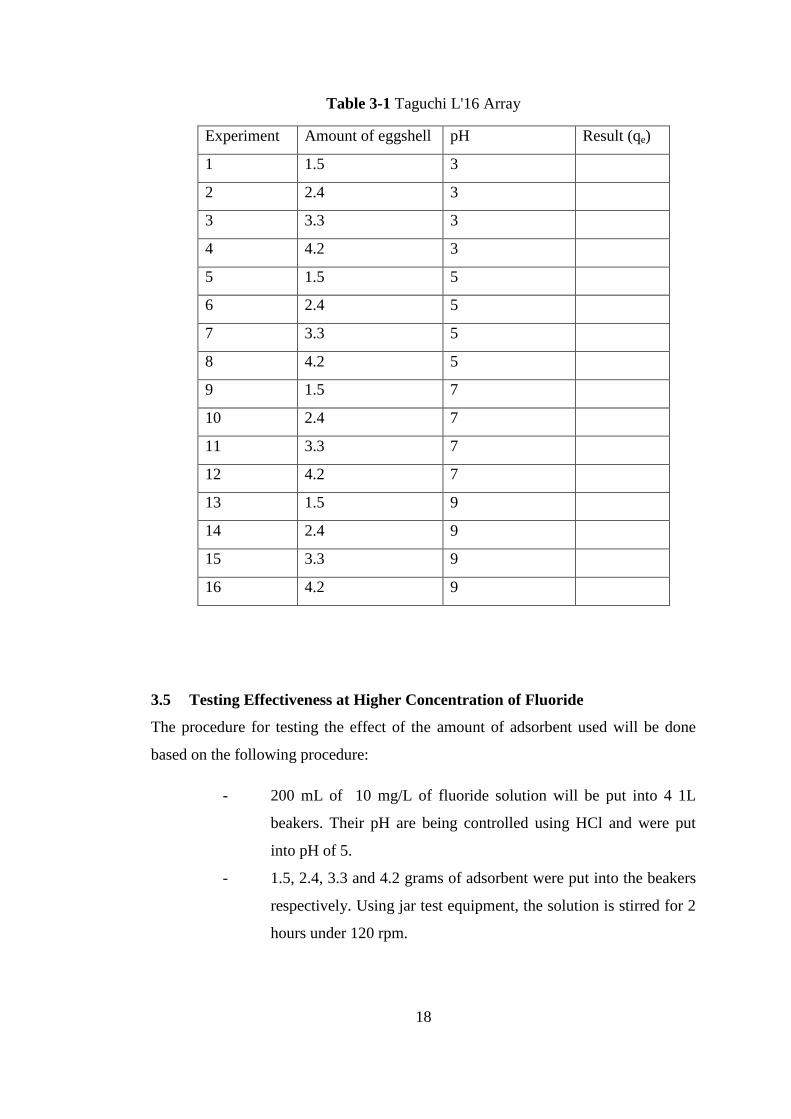
3.4 Testing the Effect of pH and Amount of Adsorbent at 5mg/L solution
The procedure for testing the effect of pH will be done based on the following
procedure:
- 200 mL of 5mg/L of fluoride solution will be put into beakers, the
pH and amount of the adsorbent will put accordingly as described
in table 3-2 below.
- Beakers will be put into jar test equipment to induce stirring.
- The experiment is done when t=120 minutes. A sample from the
end solution will be taken to be measured of its fluoride content
18
Table 3-1 Taguchi L'16 Array
Experiment Amount of eggshell pH Result (qe)
1 1.5 3
2 2.4 3
3 3.3 3
4 4.2 3
5 1.5 5
6 2.4 5
7 3.3 5
8 4.2 5
9 1.5 7
10 2.4 7
11 3.3 7
12 4.2 7
13 1.5 9
14 2.4 9
15 3.3 9
16 4.2 9
3.5 Testing Effectiveness at Higher Concentration of Fluoride
The procedure for testing the effect of the amount of adsorbent used will be done
based on the following procedure:
- 200 mL of 10 mg/L of fluoride solution will be put into 4 1L
beakers. Their pH are being controlled using HCl and were put
into pH of 5.
- 1.5, 2.4, 3.3 and 4.2 grams of adsorbent were put into the beakers
respectively. Using jar test equipment, the solution is stirred for 2
hours under 120 rpm.

19
- After 2 hours, 10ml of solutions from each beaker are extracted
and put into different test tubes. Ion chromatography was used to
determine the final value of the fluoride concentration.
The experiment was then repeated using absorbent values of 0.28, 0.56, 0.84 and
1.12 g .
3.6 Testing the Regeneration Capability
The procedure for testing the regeneration capabilities will be done based on the
following procedure:
- 1.5 g of dried and used adsorbent will be prepared.
- The adsorbent will be left overnight on oven at 110 C
- 200 mL of 5mg/L of 0.01MOL phosphoric acid is prepared as
well as 0.01MOL of acetic acid and 0.01MOL of NaOH. A
200mL of distillled water is prepared as well.
- The used adsorbent will be added to the solution. The beaker then
put into jar test equipment the timer then started.
- The experiment is done when t=120 minutes.
3.7 Variation of Parameter
The effects of the parameters that will be investigated includes the effects of pH and
amount of the adsorbent. Other parameters will be kept constant when one of the
parameters is being tested. A further look on the effect of time and adsorption rate is
proposed to be investigated as well.
20
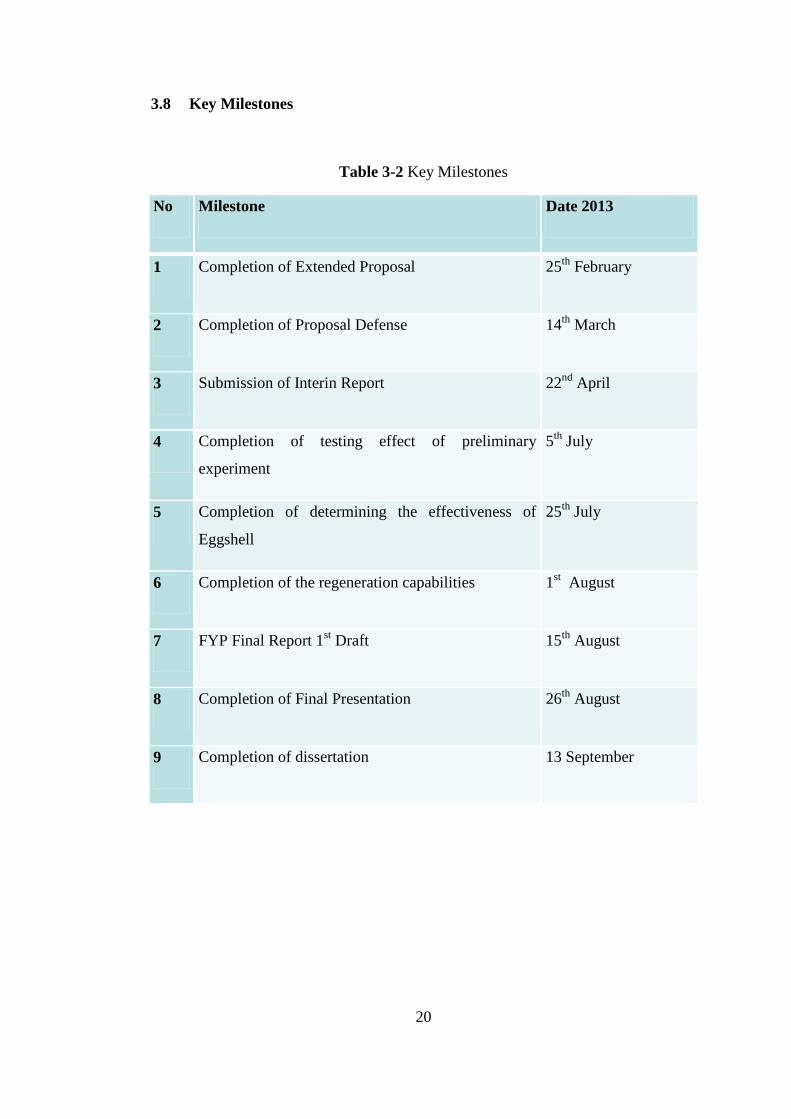
3.8 Key Milestones
Table 3-2 Key Milestones
No Milestone Date 2013
1 Completion of Extended Proposal 25th
February
2 Completion of Proposal Defense 14th
March
3 Submission of Interin Report 22nd
April
4 Completion of testing effect of preliminary
experiment
5th
July
5 Completion of determining the effectiveness of
Eggshell
25th
July
6 Completion of the regeneration capabilities 1st August
7 FYP Final Report 1st Draft 15
th August
8 Completion of Final Presentation 26th
August
9 Completion of dissertation 13 September
21
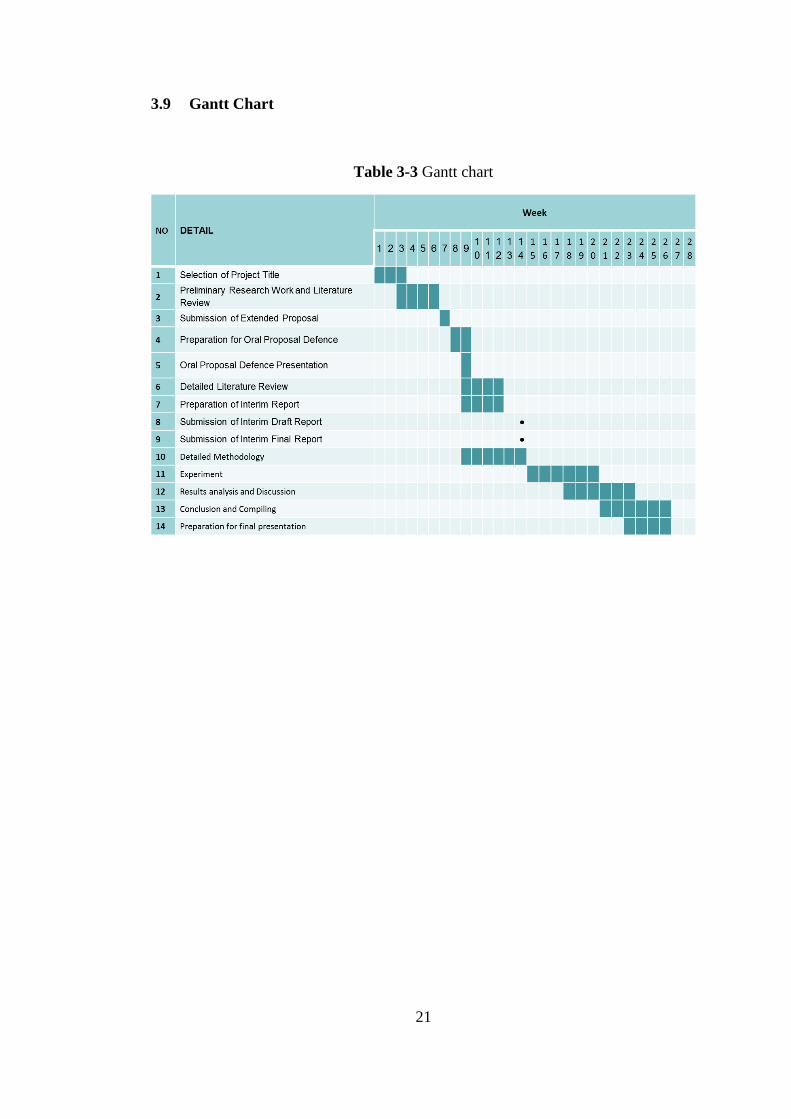
3.9 Gantt Chart
Table 3-3 Gantt chart
22
CHAPTER 4
RESULTS AND DISCUSSION
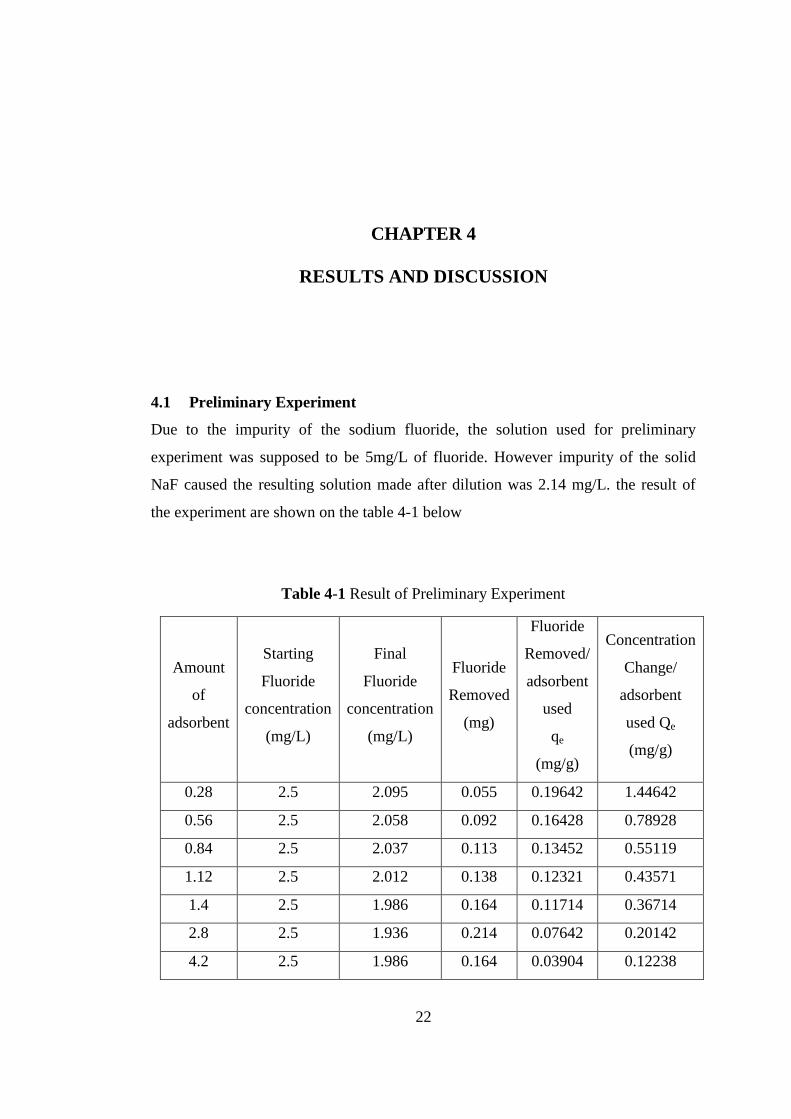
4.1 Preliminary Experiment
Due to the impurity of the sodium fluoride, the solution used for preliminary
experiment was supposed to be 5mg/L of fluoride. However impurity of the solid
NaF caused the resulting solution made after dilution was 2.14 mg/L. the result of
the experiment are shown on the table 4-1 below
Table 4-1 Result of Preliminary Experiment
Amount
of
adsorbent
Starting
Fluoride
concentration
(mg/L)
Final
Fluoride
concentration
(mg/L)
Fluoride
Removed
(mg)
Fluoride
Removed/
adsorbent
used
qe
(mg/g)
Concentration
Change/
adsorbent
used Qe
(mg/g)
0.28 2.5 2.095 0.055 0.19642 1.44642
0.56 2.5 2.058 0.092 0.16428 0.78928
0.84 2.5 2.037 0.113 0.13452 0.55119
1.12 2.5 2.012 0.138 0.12321 0.43571
1.4 2.5 1.986 0.164 0.11714 0.36714
2.8 2.5 1.936 0.214 0.07642 0.20142
4.2 2.5 1.986 0.164 0.03904 0.12238
23
5.6 2.5 1.924 0.226 0.04035 0.10285
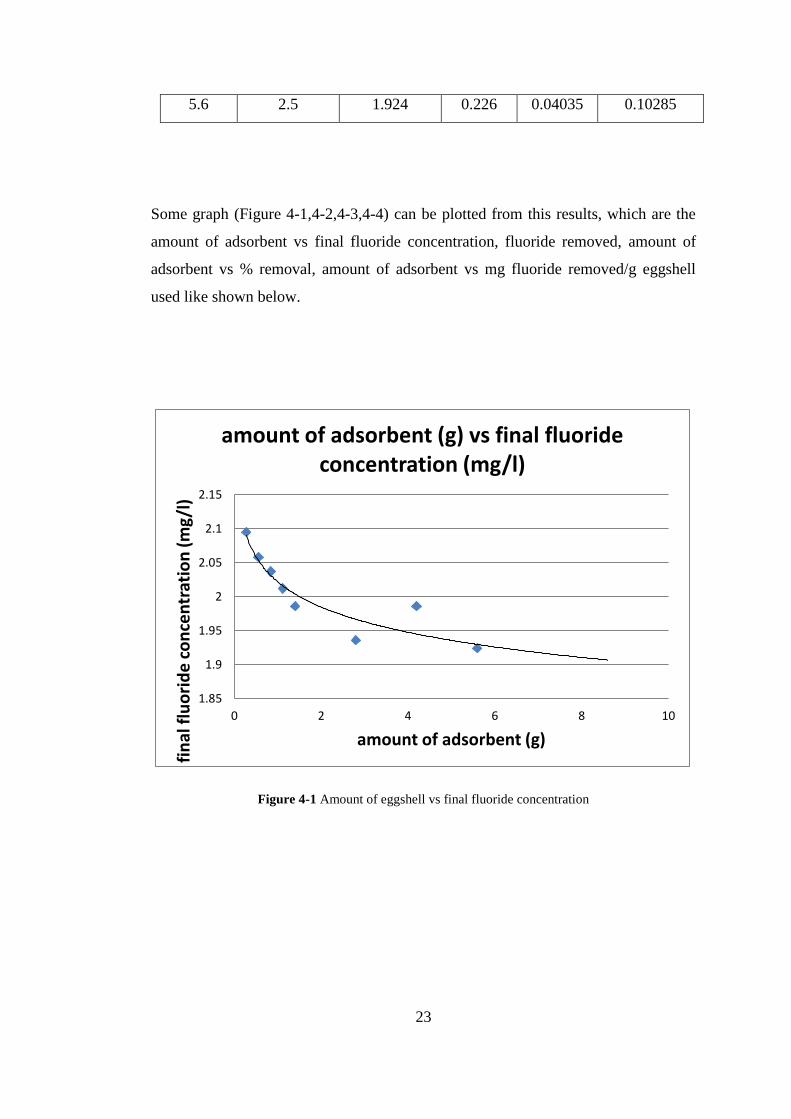
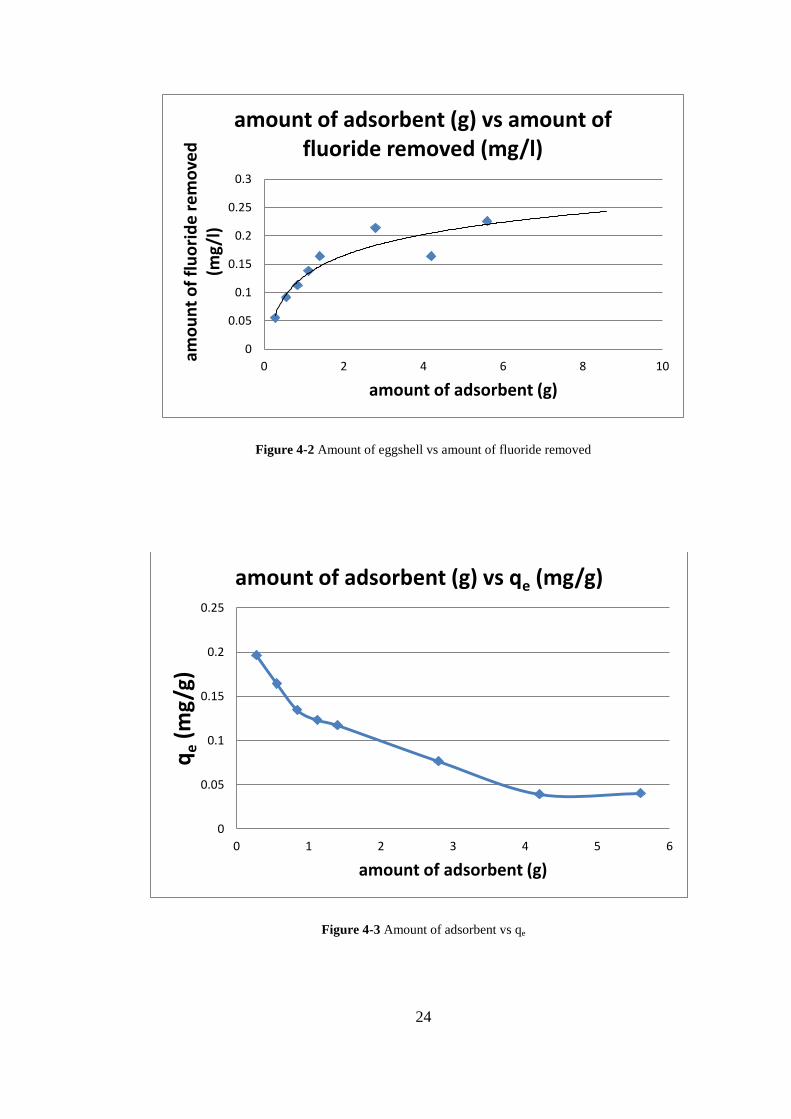
Some graph (Figure 4-1,4-2,4-3,4-4) can be plotted from this results, which are the
amount of adsorbent vs final fluoride concentration, fluoride removed, amount of
adsorbent vs % removal, amount of adsorbent vs mg fluoride removed/g eggshell
used like shown below.
Figure 4-1 Amount of eggshell vs final fluoride concentration
1.85
1.9
1.95
2
2.05
2.1
2.15
0 2 4 6 8 10
fin
al f
luo
rid
e c
on
cen
trat
ion
(m
g/l)
amount of adsorbent (g)
amount of adsorbent (g) vs final fluoride concentration (mg/l)
24
Figure 4-2 Amount of eggshell vs amount of fluoride removed
Figure 4-3 Amount of adsorbent vs qe
0
0.05
0.1
0.15
0.2
0.25
0.3
0 2 4 6 8 10
amo
un
t o
f fl
uo
rid
e r
em
ove
d
(mg/
l)
amount of adsorbent (g)
amount of adsorbent (g) vs amount of fluoride removed (mg/l)
0
0.05
0.1
0.15
0.2
0.25
0 1 2 3 4 5 6
qe (
mg
/g)
amount of adsorbent (g)
amount of adsorbent (g) vs qe (mg/g)

25
Figure 4-4 Amount of adsorbent vs Qe
From the table and result of this preliminary experiment a further information can be
deduced. 1st of all, it can be clearly seen that the adsorption of fluoride at pH of 3
proven to have its own equilibrium. From the preliminary experiment it can be seen
that the adsorption somehow getting slower when it reaching the concentration of 1.9
mg/L. Therefore it can be determined that the adsorption of fluoride at pH 3 by
eggshell have its equilibrium state somewhere at concentration of 1.9mg/L.
Another interesting finding is that the higher value of qe or the amount of fluoride
adsorbed/amount of eggshell reaches its highest value around 0.08 mg/g. however its
optimum value is yet to be determined due to the accidentally small concentration
used in this preliminary experiment. Compared to the findings by Bhaumix et. Al
(2012), this value is relatively small. Where in the article it is shown that the qe
value could reach up to around 0.19 mg/g for solution of 5mg/l while for solution of
20mg/l it can reaches up to 0.75 mg/g.
The results of the preliminary experiment can be proven useful in order to determine
the right dose to be experimented on the main experiment. By using the equilibrium
value and the dose extracted from the article by Bhaumik et al (2012) and from the
preliminary experiment.
0
0.2
0.4
0.6
0.8
1
1.2
1.4
1.6
0 1 2 3 4 5 6
flu
ori
de
re
mo
ved
/ n
um
be
r o
f ad
sorb
en
t (m
g/g)
amount of adsorbent (g)
amount of adsorbent (g) vs Qe (mg/g.L)

26
At pH 3, therefore the amount of fluoride that can be absorbed before reaching
equilibrium is
5mg/l-1.9mg/l*0.2L= 0.62mg
Thus by applying the dose both from preliminary experiment and Bhaumik et al
(2012) the needed amount of adsorbent will be
0.62 mg / 0.04 mg/g = 16 g
0.62 mg/ 0.19 mg/g = 3.3 g
Since the main experiment will follow a taguchi method and will follow the L’16
array, 4 different parameter of the amount of adsorbent will be needed. However,
this is only based on pH of 3. Since the experiments done in the reference article of
this study (Bhaumix et al, 2012) were mainly done using adsorbent with the amount
of 2.4 and since the difference in amount based on the preliminary experiment was
too big compared to dose suggested amount, the amount gained from preliminary
experiment was neglected. Thus the selected amount of adsorbent to be used on the
main experiment will be around 2.4 mg and 3.3 mg with additional two levels are
added by subtracting and adding by the same amount of differences therefore the
chosen amount were 1.5g, 2.4g, 3.3g, and 4.2 g of eggshells. Therefore this further
modifies the taguchi L’16 array into Table 3-1.
4.2 Testing the Effect of pH and Amount of Adsorbent at 5mg/L solution
By using the results gained from the preliminary experiment. A proper taguchi L’16
array was formed in order to test the efficiency of eggshell as a fluoride adsorbent in
the effect of changing pH and adsorbent amount. The result of the experiment is
shown on the table 4-2 below.
27
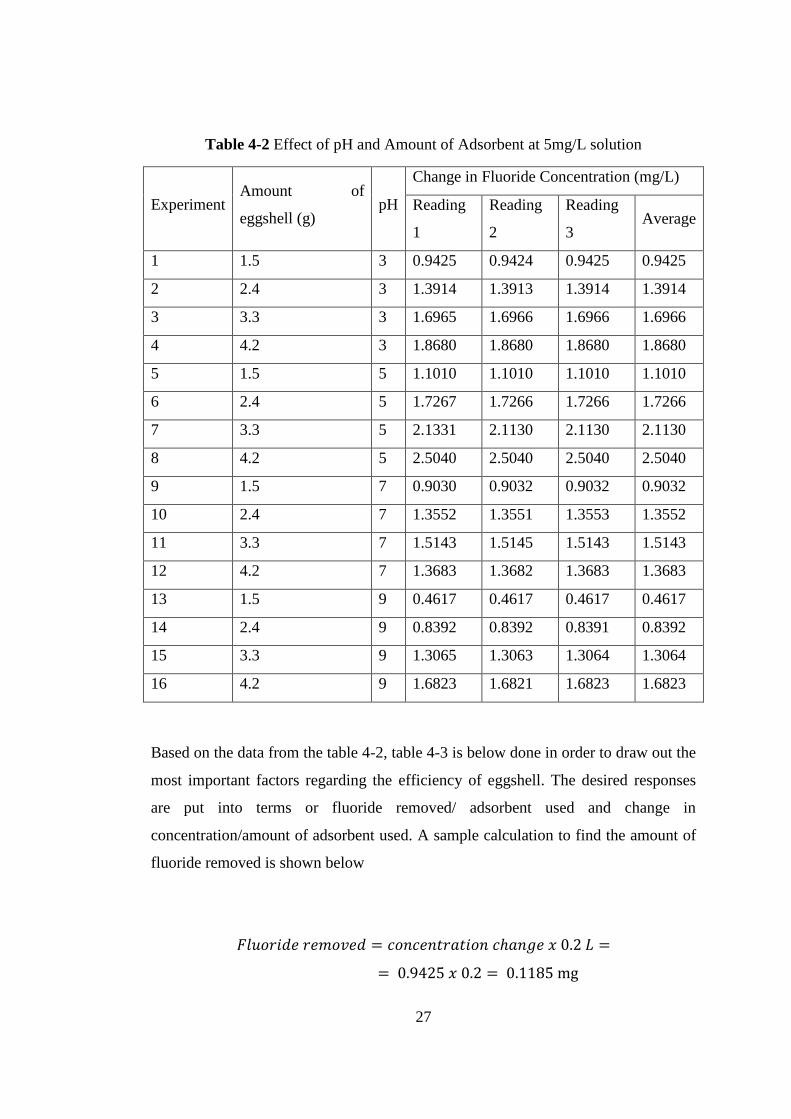
Table 4-2 Effect of pH and Amount of Adsorbent at 5mg/L solution
Experiment Amount of
eggshell (g) pH
Change in Fluoride Concentration (mg/L)
Reading
1
Reading
2
Reading
3 Average
1 1.5 3 0.9425 0.9424 0.9425 0.9425
2 2.4 3 1.3914 1.3913 1.3914 1.3914
3 3.3 3 1.6965 1.6966 1.6966 1.6966
4 4.2 3 1.8680 1.8680 1.8680 1.8680
5 1.5 5 1.1010 1.1010 1.1010 1.1010
6 2.4 5 1.7267 1.7266 1.7266 1.7266
7 3.3 5 2.1331 2.1130 2.1130 2.1130
8 4.2 5 2.5040 2.5040 2.5040 2.5040
9 1.5 7 0.9030 0.9032 0.9032 0.9032
10 2.4 7 1.3552 1.3551 1.3553 1.3552
11 3.3 7 1.5143 1.5145 1.5143 1.5143
12 4.2 7 1.3683 1.3682 1.3683 1.3683
13 1.5 9 0.4617 0.4617 0.4617 0.4617
14 2.4 9 0.8392 0.8392 0.8391 0.8392
15 3.3 9 1.3065 1.3063 1.3064 1.3064
16 4.2 9 1.6823 1.6821 1.6823 1.6823
Based on the data from the table 4-2, table 4-3 is below done in order to draw out the
most important factors regarding the efficiency of eggshell. The desired responses
are put into terms or fluoride removed/ adsorbent used and change in
concentration/amount of adsorbent used. A sample calculation to find the amount of
fluoride removed is shown below

28
By dividing the gained value of concentration change and fluoride removed with
adsorbent amount, the effectiveness in terms of concentration change/g of adsorbent
used and fluoride removed/g of adsorbent used is gained and shown on table 4-3.
Table 4-3 Effectiveness of Eggshell at 5mg/L
Experiment
Amount
of
eggshell
(g)
pH
Fluoride
Removed
(mg)
Fluoride
Removed/adsorbent
used
qe
(mg/g)
Concentration
Change/
adsorbent
used Qe
(mg/g)
1 1.5 3 0.1885 0.1257 0.6283
2 2.4 3 0.2783 0.1159 0.5797
3 3.3 3 0.3393 0.1028 0.5141
4 4.2 3 0.3736 0.0890 0.4448
5 1.5 5 0.2202 0.1468 0.7340
6 2.4 5 0.3453 0.1439 0.7194
7 3.3 5 0.4226 0.1281 0.6403
8 4.2 5 0.5008 0.1192 0.5962
9 1.5 7 0.1806 0.1204 0.6021
10 2.4 7 0.2710 0.1129 0.5647
11 3.3 7 0.3029 0.0918 0.4589
12 4.2 7 0.2737 0.0652 0.3258
13 1.5 9 0.0923 0.0616 0.3078
14 2.4 9 0.1582 0.0659 0.3297
15 3.3 9 0.2613 0.0792 0.3959
16 4.2 9 0.3365 0.0801 0.4006
29
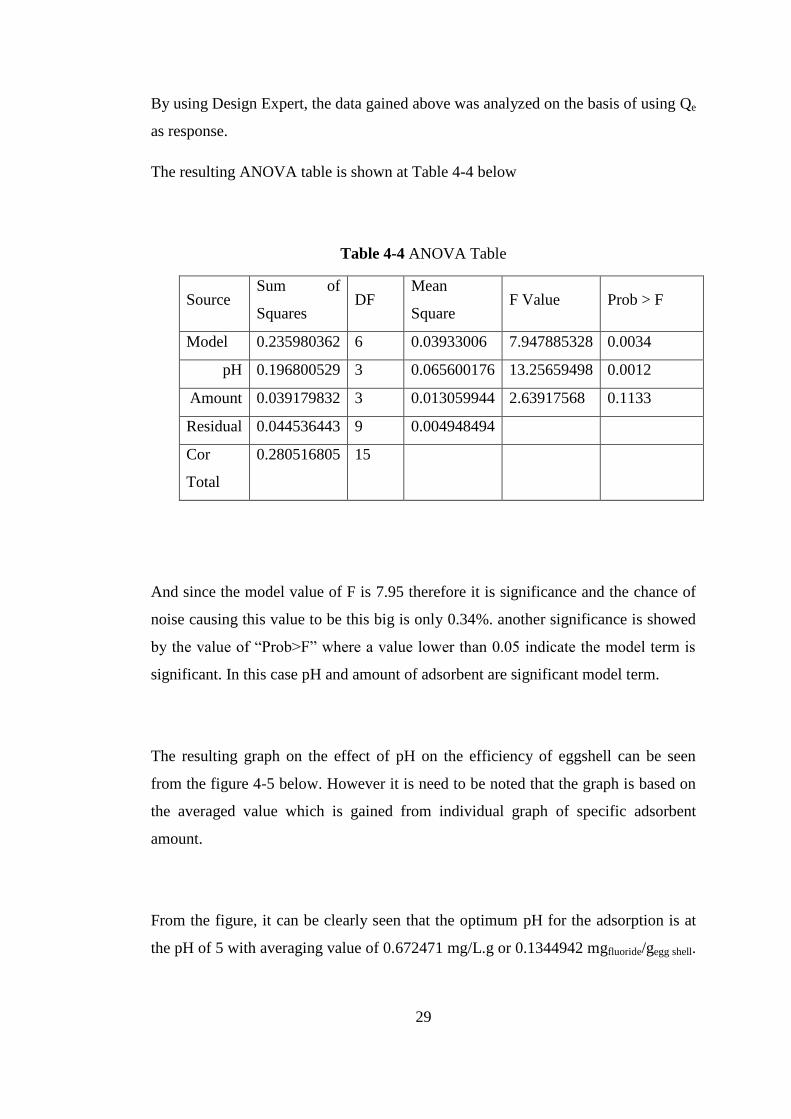
By using Design Expert, the data gained above was analyzed on the basis of using Qe
as response.
The resulting ANOVA table is shown at Table 4-4 below
Table 4-4 ANOVA Table
Source Sum of
Squares DF
Mean
Square F Value Prob > F
Model 0.235980362 6 0.03933006 7.947885328 0.0034
pH 0.196800529 3 0.065600176 13.25659498 0.0012
Amount 0.039179832 3 0.013059944 2.63917568 0.1133
Residual 0.044536443 9 0.004948494
Cor
Total
0.280516805 15
And since the model value of F is 7.95 therefore it is significance and the chance of
noise causing this value to be this big is only 0.34%. another significance is showed
by the value of “Prob>F” where a value lower than 0.05 indicate the model term is
significant. In this case pH and amount of adsorbent are significant model term.
The resulting graph on the effect of pH on the efficiency of eggshell can be seen
from the figure 4-5 below. However it is need to be noted that the graph is based on
the averaged value which is gained from individual graph of specific adsorbent
amount.
From the figure, it can be clearly seen that the optimum pH for the adsorption is at
the pH of 5 with averaging value of 0.672471 mg/L.g or 0.1344942 mgfluoride/gegg shell.
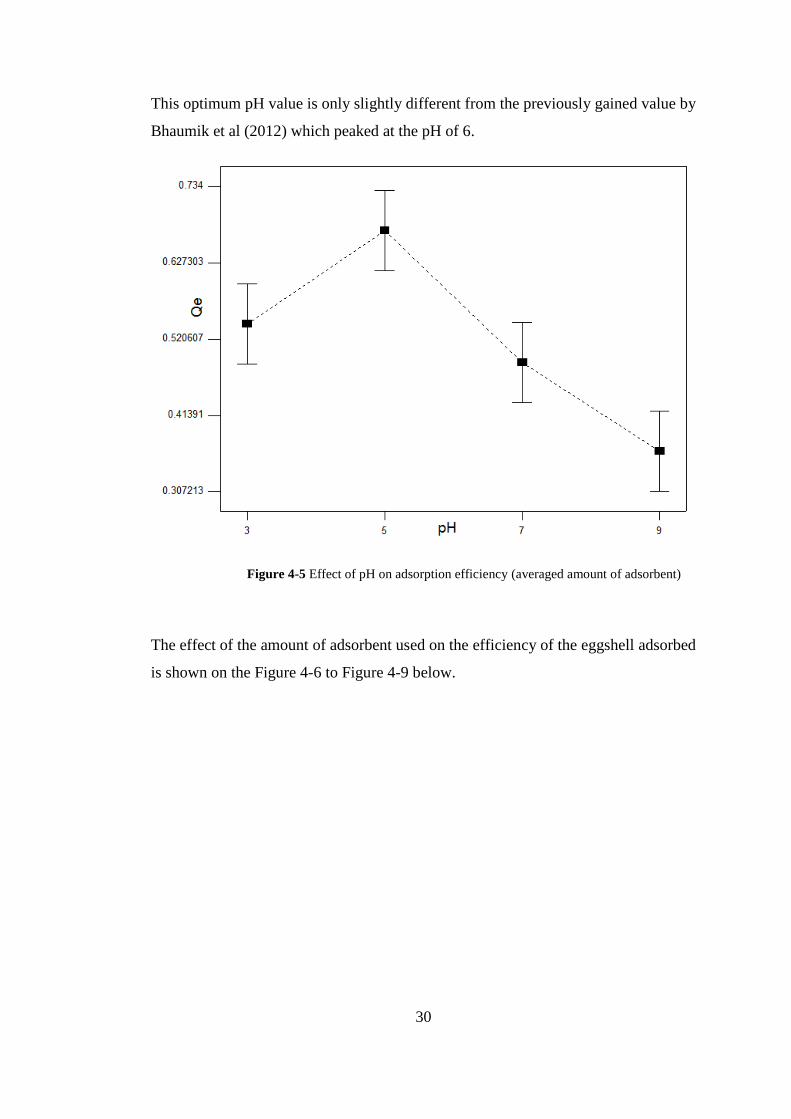
30
This optimum pH value is only slightly different from the previously gained value by
Bhaumik et al (2012) which peaked at the pH of 6.
Figure 4-5 Effect of pH on adsorption efficiency (averaged amount of adsorbent)
The effect of the amount of adsorbent used on the efficiency of the eggshell adsorbed
is shown on the Figure 4-6 to Figure 4-9 below.
31
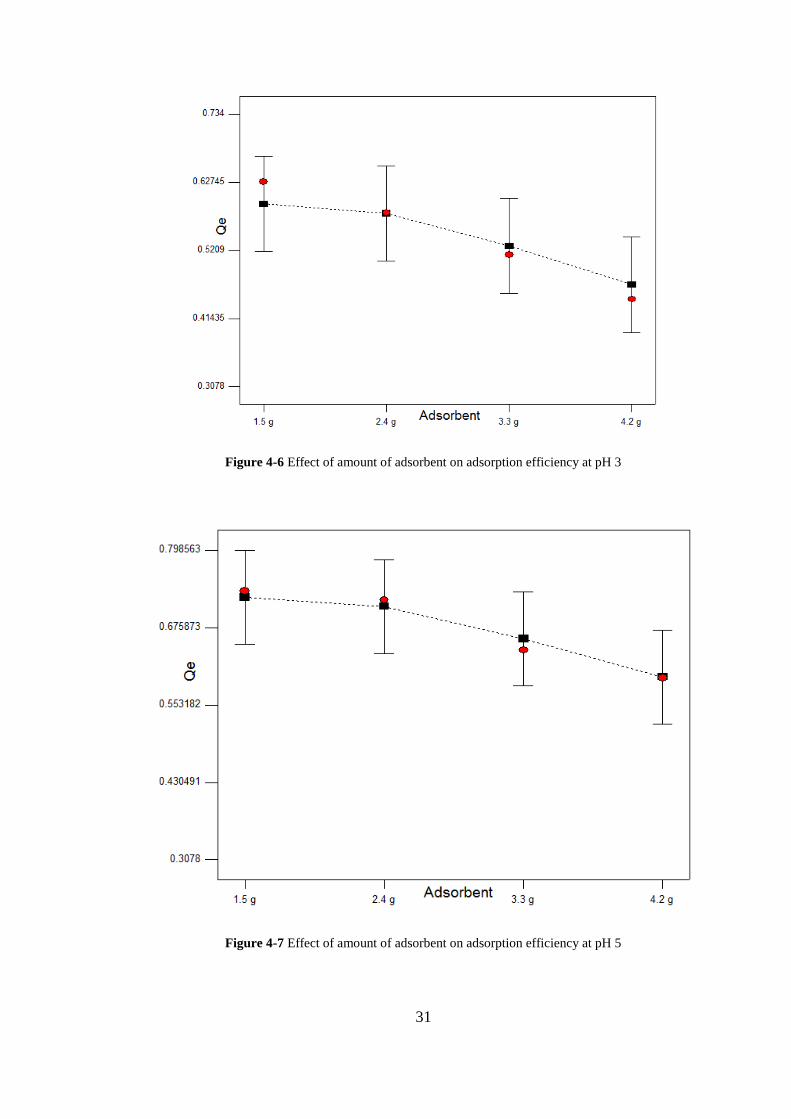
Figure 4-6 Effect of amount of adsorbent on adsorption efficiency at pH 3
Figure 4-7 Effect of amount of adsorbent on adsorption efficiency at pH 5
32
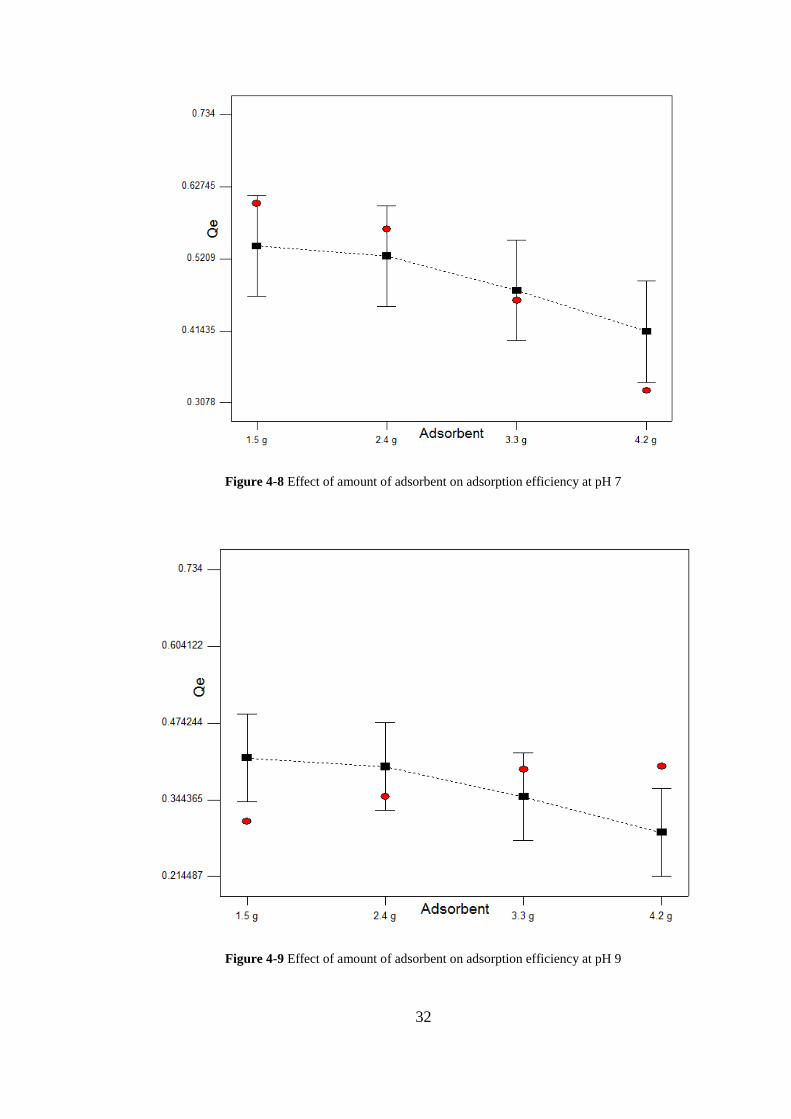
Figure 4-8 Effect of amount of adsorbent on adsorption efficiency at pH 7
Figure 4-9 Effect of amount of adsorbent on adsorption efficiency at pH 9

33
The figure was taken from the resulting calculation of the Design Expert software,
where the red dots are the input values gained from experiment and the dark lines are
the values gained after analyzing by design expert. From the figure it is shown that
the efficiency usually peaked at the value of adsorbent around 1.5 grams when
applied to 200 ml of 5mg/L solution of fluoride under room temperature and 200
rpm. This value agrees on the past study by Bhaumik et al (2012) which shows that
the adsorption value peaked around 1.5 grams where higher amount of the adsorbent
showed to have constant value to of efficiency.
The slight difference in the trend could happened because of the hindrance
experienced by the greater amount of eggshell due to the lower rpm applied, which
was 200 rpm compared to 250 rpm used on the previous study by Bhaumil et al
(2012). Another caused might be the type of the mixer used was unable to perform a
complete stirring. From the data gained, it is also found that the maximum amount of
adsorption efficiency was 0.697242 mg/L.g or 0.1394484 mgfluoride/gegg shell. The
lower rpm, egg shell particle size and the mixer type might also be the source of the
slight differences with the past study by Bhaumix et al (2012). The Figure 10 below
shows the compiled graph on the effect of amount of adsorbent on different pH level.

34
Figure 4-10 Effect of amount of adsorbent on different level of pH
4.3 Testing Effectiveness at Higher Concentration of Fluoride
A similar test was done on a higher level concentration of fluoride in order to see any
changes happening in the adsorption trend or values. The pH chosen to be tested was
at pH 5 with rpm 200, concentration of fluoride at 10 mg/L with 200 ml solution.
The result is shown on the Table 4-5 below and plot on Figure 4-11 below.
Table 4-5 Concentration Change at 10mg/L Fluoride solution
Experiment Amount of eggshell
(g) pH
Change in Fluoride Concentration (mg/L)
Reading1 Reading2 Reading3 Average
1 1.5 3 1.5550 1.5552 1.5554 1.5552
2 2.4 3 2.4274 2.4271 2.4274 2.4274
3 3.3 3 3.2388 3.2385 3.2385 3.2386
4 4.2 3 3.8405 3.8405 3.8404 3.8405
0
0.1
0.2
0.3
0.4
0.5
0.6
0.7
0.8
0 1 2 3 4 5
Qe
(m
g/g.
L)
Amount of Adsorbent
pH 5
pH 3
pH 7
pH 9
35
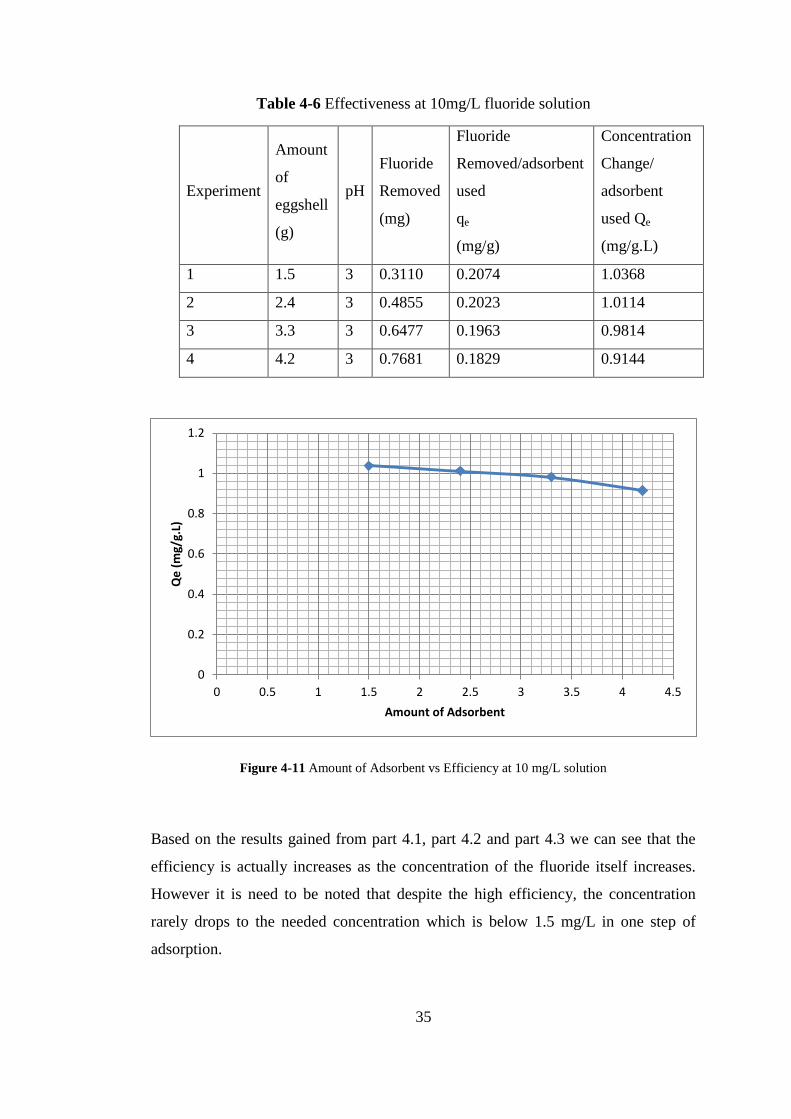
Table 4-6 Effectiveness at 10mg/L fluoride solution
Experiment
Amount
of
eggshell
(g)
pH
Fluoride
Removed
(mg)
Fluoride
Removed/adsorbent
used
qe
(mg/g)
Concentration
Change/
adsorbent
used Qe
(mg/g.L)
1 1.5 3 0.3110 0.2074 1.0368
2 2.4 3 0.4855 0.2023 1.0114
3 3.3 3 0.6477 0.1963 0.9814
4 4.2 3 0.7681 0.1829 0.9144
Figure 4-11 Amount of Adsorbent vs Efficiency at 10 mg/L solution
Based on the results gained from part 4.1, part 4.2 and part 4.3 we can see that the
efficiency is actually increases as the concentration of the fluoride itself increases.
However it is need to be noted that despite the high efficiency, the concentration
rarely drops to the needed concentration which is below 1.5 mg/L in one step of
adsorption.
0
0.2
0.4
0.6
0.8
1
1.2
0 0.5 1 1.5 2 2.5 3 3.5 4 4.5
Qe
(m
g/g.
L)
Amount of Adsorbent

36
4.4 Testing the Regeneration Capability
Based on Logathanan et al (2012) weak acids are often chosen as a method to
regenerates used adsorbent. However in the same article also said that mostly
calcium based adsorbent also regenerated using hydroxide ions. The solution
prepared was distilled water with the addition of 0.01 mol of NaOH, Acetic Acid,
and Phosporic acid which were put on different beaker. A solution of pure distilled
water as a reference. The final concentration of fluoride after several hours of
treatment is tested on the Ion Chromatograph to see the amount of fluoride released
by the used eggshell under different treatments.
Originally, the experiment was conducted using sodium hydroxide, phosphoric acid
and acetic acid. However only solution that was treated with hydroxide and distilled
water that shows the amount of fluoride in the solution after regeneration process.
The solutions treated with acetic acid and phosphoric acid was unable to be detected
by Ion Chromatograph device. One of the reasons is the reaction happening between
fluoride and the acids. For example the reaction of fluoride and the phosphoric acid
which binds the fluoride and calcium to make the compound fluoroapatite, thus
makes it unable to be detected by the Ion Chromatography device. The result gained
from the experiment is shown on the table and figure below:
Table 4-7 Final Fluoride Concentration
Experiment
Eggshell
Amount
(g)
Final Concentration
(mg/l)
0
hours
2
hours
6
hours
24
hours
30
hours
48
hours
Distilled Water 1.5 0.004 0.048 0.184 1.131 1.131 1.097
OH 1.5 0.005 0.047 0.098 0.131 0.209 0.201
37
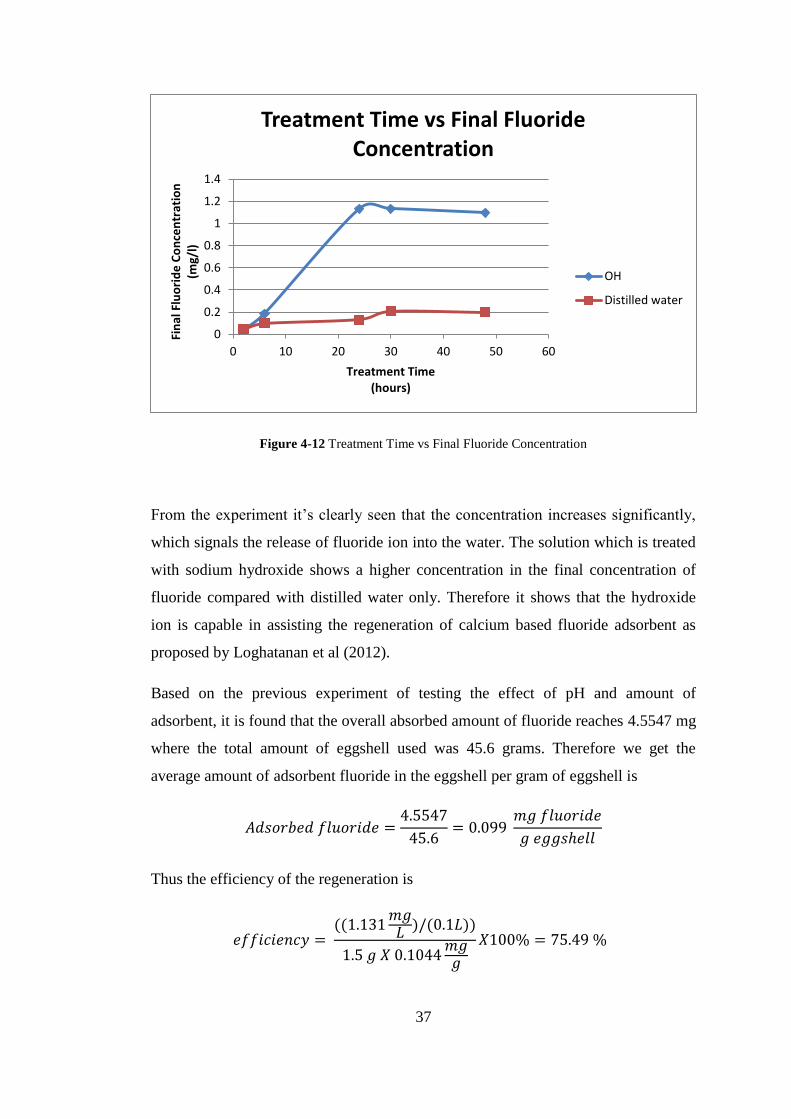
Figure 4-12 Treatment Time vs Final Fluoride Concentration
From the experiment it’s clearly seen that the concentration increases significantly,
which signals the release of fluoride ion into the water. The solution which is treated
with sodium hydroxide shows a higher concentration in the final concentration of
fluoride compared with distilled water only. Therefore it shows that the hydroxide
ion is capable in assisting the regeneration of calcium based fluoride adsorbent as
proposed by Loghatanan et al (2012).
Based on the previous experiment of testing the effect of pH and amount of
adsorbent, it is found that the overall absorbed amount of fluoride reaches 4.5547 mg
where the total amount of eggshell used was 45.6 grams. Therefore we get the
average amount of adsorbent fluoride in the eggshell per gram of eggshell is
Thus the efficiency of the regeneration is
0
0.2
0.4
0.6
0.8
1
1.2
1.4
0 10 20 30 40 50 60
Fin
al F
luo
rid
e C
on
cen
trat
ion
(m
g/l)
Treatment Time (hours)
Treatment Time vs Final Fluoride Concentration
OH
Distilled water
38
The amount of the efficiency is taken at the highest point where it results in a good
efficiency of 72.23%. It is also to be noted that at 48 hours the concentration slightly
dropped, where this might shows the timing where the fluoride is actually begin to
be adsorbed by the eggshell again. Therefore it is advised not to perform the
regeneration more than 30 hours.

39
CHAPTER 5
CONCLUSION & RECOMMENDATION
5.1 Conclusion
Adsorption is one of the widely used and cheap methods of removal of fluoride
where its adsorption efficiency and its cost depend on the type of adsorbent used.
The adsorbent used usually contains positive ions or cations that can attract the
fluoride ions which are negatively charged. Eggshell is one of the candidates as an
adsorbent of fluoride since it is mostly made of calcium, as well as it is a waste
product thus it is cheap in price. Therefore a further study to analyze the
effectiveness of the eggshell as fluoride adsorbent would be beneficial.
This study had proven that eggshell have a good potential as a fluoride adsorbent
since it able to adsorb fluoride quite effectively. The optimum operating pH of the
fluoride itself is maximized around pH 5 to pH 6 which can be easily maintained and
can be easily converted back to drinkable pH after treatment of fluoride removal.
The efficiency also increases as the concentration of the fluoride increases, however
it is to be noted that the adsorption cannot reach to the safe amount in one time
adsorption. Thus a further study in the number of stages needed to reach the safe
level of below 1.5 ppm is further needed to be done. The study also manages to
prove the ability of eggshell to be regenerated. However due to the cheapness of the
eggshell and it can be easily replaced, a further study needed to be done to see which
option is more feasible whether to replace it or to regenerate it.
40
5.2 Recommendation
There are several recommendations and suggestions that can be done in the future
works. Fluoride standard solution should be used instead of using solid sodium
fluoride in order to make it easier to control the solution concentration. A
temperature control device such as hot plate can also be used to maintain
temperature or test the effect of temperature as well as stirring using magnetic stirrer
instead of using jar test. Using mechanical grinder to make fine particles of eggshell
can also be done to further increase adsorption capacity of the eggshell. A further
study can be done in order to see the effect of time or flow on the adsorption thus
making it possible to design the actual adsorption chamber. Finally an economic
study regarding which is more feasible whether to regenerate or replace used
adsorbent can also be done.
41
REFFERENCES
[1] Fawell,J., Bailey, K., Chilton, E., Dahi, E., Fewtrell, L., Magara, Y., Fluoride
in Drinking Water, World Health Organization, IWA Publishing, UK, 2006.
[2] World Health Organisation, Guidelines for Drinking-water Quality, Volume 2.
Health Criteria and Other Supporting Information, second ed., World Health
Organisation, Geneva, 1996.
[3] Unicef Position on Dental Fluorosis. (n.d.). Retrieved from
http://www.nofluoride.com/Unicef_fluor.cfm
[4] Logathanan, P., Vigneswaran, S., Kasandamy, J., & Naidu, R. (2012).
Defluoridation of drinking water using adsorption processes. Journal of
Hazardous Material,
[5] Gupta, V.K., Carrott, J.M., Carrott, M.M.L.R. Suhas, Low-cost adsorbents:
Growing approach to wastewater treatment – a review. Crit. Rev. Environ. Sci.
Technol. 39 (2009) 783–842.
[6] Teng, S., Wang,, Gong, W., Liu, X., Gao, B., Removal of fluoride by hydrous
manganese oxide-coated alumina: performance and mechanism. J. Hazard.
Mater. 168 (2009) 1004–1011.
[7] Weiner, E.R., Applications of Environmental Aquatic Chemistry, CRC Press,
Taylor and Francis Group, Florida, 2008.
[8] Sivasamy, A., Singh, K.P., Mohan, D., Maruthamuthu, M., Studies on
defluoridation of water by coal-based sorbents. J. Chem. Technol. Biotechnol.
76 (2001) 717–722.
42
[9] Tokunaga, S., Haron, S.A., Wasay, S.A., Wong, K.F., Laosangthum, K.
Uchiumi, A., Removal of fluoride ions from aqueous solutions by multivalent
metal compounds. Inter. J. Environ. Studies 48 (1995) 17–28.
[10] Meenakshi, S., Viswanathan, N., Identification of selective ion-exchange resin
for fluoride sorption. J. Colloid Interface Sci. 308 (2007) 438–450.
[11] Onyango, M.S., Kojima, Y., Aoyi, O., Bernardo, E.C., Matsuda, H.,
Adsorption equilibrium modelling and solution chemistry dependence of
fluoride removal from water by trivalent-cation-exchanged zeolite F-9. J.
Coloid Interface Sci. 279 (2004) 341–350.
[12] Lv, L., He, J., Wei, M., Evans, D.G., Duan, X., Factors influencing the
removal of fluo-ride from aqueous solution by calcined Mg-Al-CO3 layered
double hydroxides. J. Hazard. Mater. B133 (2006) 119–128.
[13] Ruixia, L., Jinlong, G., Hongxiao, T., Adsorption of fluoride, phosphate, and
arsenate ions on a new type of ion exchange fiber. J. Colloid Interface Sci. 248
(2002) 268–274.
[14] A.H. Parsons, Structure of the eggshell, Poult. Sci. 61 (1982) 2013–2021.
[15] Nakano, T., Ikawa, N.I., Ozimek, L., Chemical composition of chicken
eggshell and shell membranes, Poult. Sci. 82 (2003) 510–514.
[16] Bhaumik, R., Mondal, K., Das, B., Roy, P., Pal, K. C., Das, C., Banerjee, A.,
& Datta, J. K. (2012). Eggshell powder as an adsorbent for removal of fluoride
from aqueous solution : equilibrium kinetic and thermodynamic studies.
[17] Fluoride in Drinking-water: Background document for development of WHO
Guidelines for Drinking-water Quality. World Health Organization, 2004
[18] Environmental Health Criteria 227: Fluorides. World Health Organization,
2002, p. 38
[19] Whitford, G.,M. (1994). Intake and Metabolism of Fluoride. Advances in
Dental Research
[20] Yeung, C.,A. (2008). A systematic review of the efficacy and safety of
fluoridation. Evid Based Den