removal of disinfection by-product precursors by …
TRANSCRIPT
REMOVAL OF DISINFECTION BY-PRODUCT PRECURSORS BY ACTIVATED
CARBON AND MIEX®
_______________________________________
A Thesis
presented to
the Faculty of the Graduate School
at the University of Missouri-Columbia
_______________________________________________________
In Partial Fulfillment
of the Requirements for the Degree
Master of Science
_____________________________________________________
by
DAVID HANIGAN
Dr. Thomas Clevenger, Thesis Supervisor
JULY 2011
The undersigned, appointed by the dean of the Graduate School, have examined the
thesis entitled
REMOVAL OF DISINFECTION BY-PRODUCT PRECURSORS BY ACTIVATED
CARBON AND MIEX®
presented by David Hanigan,
a candidate for the degree of Master of Science in Environmental Engineering,
and hereby certify that, in their opinion, it is worthy of acceptance.
Professor Thomas Clevenger
Professor Enos Inniss
Professor Allen Thompson
ii
ACKNOWLEDGEMENTS
I would like to express my thanks to Dr. Tom Clevenger for his encouragement and advice
throughout this research. Also, to the Missouri Water Resources Research Center, who provided
funding for the project. To my committee, Dr. Enos Inniss and Dr. Allen Thompson, thank you
for the time you have invested in me while providing guidance. I would also like to
acknowledge my fellow students Lisa Wulff , Laetitia Ramolino, Dan David, and Ted Grimes for
their help with instrumentation, planning, and a set of extra hands. The staff of the Missouri
Water Resources Research Center, specifically Dr. Jing Cheng, provided training on the
instrumentation. I would also like to thank my family for their support and assistance.
iii
TABLE OF CONTENTS
ACKNOWLEDGEMENTS .................................................................................... ii
LIST OF FIGURES .............................................................................................. vii
LIST OF TABLES ................................................................................................. xi
LIST OF ABBREVIATIONS ............................................................................... xii
ABSTRACT ......................................................................................................... xiv
Chapter
1 Introduction ...................................................................................................... 1
1.1 DBPs and Potable Water ........................................................................... 1
1.2 Research Objectives .................................................................................. 3
2 Current State of Knowledge ............................................................................. 4
2.1 Health Effects ............................................................................................ 4
2.1.1 Animal ................................................................................................. 4
2.1.2 Case Studies ........................................................................................ 5
2.2 DBP Formation ......................................................................................... 7
2.2.1 NOM.................................................................................................... 7
2.2.2 Formation Mechanics .......................................................................... 8
2.2.3 Surrogates for TTHM and HAA5 FP .................................................. 9
2.2.4 Temporal Trends in DBP Formation ................................................. 12
2.3 DBP Formation Mitigation...................................................................... 13
iv
2.3.1 Post-disinfection ................................................................................ 14
2.3.2 During Disinfection ........................................................................... 14
2.3.3 Pre-disinfection ................................................................................. 15
3 Iron Impregnated AC for DBP FP Reduction ................................................ 21
3.1 Introduction ............................................................................................. 21
3.2 Materials and Methods ............................................................................ 22
3.2.1 Sampling............................................................................................ 22
3.2.2 Activated Carbon............................................................................... 22
3.2.3 Carbon Treatment .............................................................................. 23
3.2.4 TOC/DOC Analysis .......................................................................... 23
3.2.5 UV254 Analysis ................................................................................ 24
3.2.6 Chlorination ....................................................................................... 24
3.2.7 THM Analysis ................................................................................... 25
3.2.8 HAA Analysis ................................................................................... 25
3.2.9 Calculations ....................................................................................... 25
3.3 Results and Discussion ............................................................................ 26
3.3.1 Characteristics of Filtered Water....................................................... 26
3.3.2 DOC, UV254, and SUVA ................................................................. 26
3.3.3 TTHM FP .......................................................................................... 29
3.3.4 HAA FP ............................................................................................. 31
3.3.5 DBP Surrogate Parameters ................................................................ 32
3.4 Conclusions ............................................................................................. 36

v
4 Removal of DPB FP in a Bench Scale Water Treatment Facility .................. 37
4.1 Introduction ............................................................................................. 37
4.2 Materials and Methods ............................................................................ 38
4.2.1 Sampling............................................................................................ 38
4.2.2 Treatment Materials .......................................................................... 38
4.2.3 Treatment .......................................................................................... 39
4.2.4 DOC Analysis ................................................................................... 39
4.2.5 UV254 Analysis ................................................................................ 39
4.2.6 Chlorination ....................................................................................... 40
4.2.7 THM Analysis ................................................................................... 40
4.2.8 Calculations ....................................................................................... 40
4.3 Results and Discussion ............................................................................ 40
4.3.1 Characteristics of Filtered Water....................................................... 41
4.3.2 DOC, UV254 and SUVA .................................................................. 41
4.3.3 TTHM FP .......................................................................................... 44
4.3.4 DBP Surrogate Parameters Post Treatment ...................................... 46
4.4 Conclusions ............................................................................................. 50
5 NOM Fractionation......................................................................................... 52
5.1 Introduction ............................................................................................. 52
5.2 Materials and Methods ............................................................................ 53
5.2.1 Sampling............................................................................................ 53
5.2.2 Treatment Materials .......................................................................... 53

vi
5.2.3 Treatment .......................................................................................... 53
5.2.4 XAD Fractionation ............................................................................ 54
5.2.5 DOC Analysis ................................................................................... 55
5.2.6 UV254 Analysis ................................................................................ 56
5.2.7 Chlorination ....................................................................................... 56
5.2.8 THM Analysis ................................................................................... 57
5.2.9 HAA Analysis ................................................................................... 57
5.2.10 Calculations ..................................................................................... 57
5.3 Results and Discussion ............................................................................ 58
5.3.1 Dissolved Organic Carbon ................................................................ 58
5.3.2 TTHM and HAA FP .......................................................................... 60
5.3.3 UV254 and SUVA ............................................................................ 66
5.4 Conclusions ............................................................................................. 68
6 Recommendations and Opportunities for Future Research ............................ 69 7 References ...................................................................................................... 71
vii
LIST OF FIGURES
Figure 2-2 1997-2010 Quarterly Boonville, MO DNR formation data (adapted from MO
DNR, 2010; Wulff, 2011) ......................................................................... 13
Figure 3-1 DOC of Boonville, MO River water after 24 hr adsorption by several activated
carbons ...................................................................................................... 27
Figure 3-2 DOC of Boonville, MO River water percent reduction by adsorption on
several activated carbons .......................................................................... 27
Figure 3-3 UV254 of Boonville, MO River water after 24 hr adsorption of NOM by
several activated carbons .......................................................................... 28
Figure 3-4 UV254 of Boonville, MO River water percent reduction by adsorption of
NOM on several activated carbons ........................................................... 28
Figure 3-5 SUVA of Boonville, MO River water after 24 hr adsorption of NOM by
several activated carbons .......................................................................... 29
Figure 3-6 TTHM FP of chlorinated Boonville, MO River water after 24 hr adsorption of
NOM by several activated carbons ........................................................... 30
Figure 3-7 TTHM FP of chlorinated Boonville, MO River water percent reduction by
adsorption of NOM on several activated carbons ..................................... 30
Figure 3-8 Percent TTHM from brominated species resulting from reactions with NOM
in Boonville, MO River water after 24 adsorption on several activated
carbons ...................................................................................................... 31

viii
Figure 3-9 HAA FP of chlorinated Boonville, MO River water after 24 hr adsorption of
NOM by several activated carbons ........................................................... 31
Figure 3-10 HAA FP of chlorinated Boonville, MO River water percent reduction by
adsorption of NOM on several activated carbons ..................................... 32
Figure 3-11 Formation potential vs. DOC of Boonville, MO River water after 24 hr
adsorption of NOM on activated carbons ................................................. 33
Figure 3-12 TTHM FP vs. UV254 of Boonville, MO River water after 24 hr adsorption
on specified materials ............................................................................... 34
Figure 3-13 Formation potential vs. UV254 of Boonville, MO River water excluding Fe-
AC data ..................................................................................................... 34
Figure 3-14 Formation potential vs. SUVA of Boonville, MO River water after 24 hr
adsorption of NOM on activated carbons ................................................. 35
Figure 3-15 Formation potential vs. chlorine demand of Boonville, MO River water after
24 adsorption of NOM on activated carbons ............................................ 36
Figure 4-1 Boonville, MO River DOC, UV254, SUVA, and TTHM FP percent reductions
after greensand, activated carbon, or MIEX® treatment .......................... 41
Figure 4-2 DOC of Boonville, MO River water after greensand, activated carbon, or
MIEX® treatment ..................................................................................... 42
Figure 4-3 UV254 of Boonville, MO River water after greensand, activated carbon, or
MIEX® treatment ..................................................................................... 43
ix
Figure 4-4 SUVA of Boonville, MO River water after greensand, activated carbon, or
MIEX® treatment ..................................................................................... 43
Figure 4-5 TTHM FP of chlorinated Boonville, MO River water after greensand,
activated carbon, or MIEX® treatment .................................................... 44
Figure 4-6 Percent of TTHM FP of Boonville, MO River water from chlorinated and
brominated THM species after greensand, activated carbon, or MIEX®
treatment ................................................................................................... 45
Figure 4-7 Percent reduction of chlorinated and brominated THM species resulting from
reactions with Boonville, MO River NOM after treatment with greensand,
activated carbon, or MIEX® ..................................................................... 46
Figure 4-8 TTHM FP vs. DOC of Boonville, MO River water after greensand, activated
carbon, or MIEX® treatment .................................................................... 47
Figure 4-9 TTHM FP vs. UV254 of Boonville, MO River water after greensand,
activated carbon or MIEX® treatment ..................................................... 48
Figure 4-10 TTHM FP vs. UV254 of Boonville, MO River water for specific materials 48
Figure 4-11 TTHM FP vs. SUVA of Boonville, MO river water after treatment with
greensand, activated carbon or MIEX® ................................................... 49
Figure 4-12 TTHM FP vs. SUVA of Boonville, MO River water for specific materials 49
Figure 4-13 TTHM FP vs. chlorine demand of Boonville, MO River water after
greensand, activated carbon, or MIEX® treatment .................................. 50
x
Figure 5-1 Fractionated DOC of Boonville, MO River water after treatment with
activated carbon or MIEX® ...................................................................... 59
Figure 5-2 Disinfection by-product formation potentials resulting from reactions with
fractionated NOM in chlorinated Boonville, MO River water after
treatment with activated carbon or MIEX® ............................................. 61
Figure 5-3 Disinfection by-product formation potential reductions resulting from reduced
reactions with fractionated NOM in chlorinated Boonville, MO River
water .......................................................................................................... 62
Figure 5-4 Formation potential resulting from NOM fractions vs. DOC in fractions of
Boonville, MO River water....................................................................... 64
Figure 5-5 Brominated DBPs resulting from reactions with NOM fractions in chlorinated
Boonville, MO River water....................................................................... 65
Figure 5-6 UV254 absorbance in fractionated water after activated carbon or MIEX®
treatment ................................................................................................... 66
Figure 5-7 Formation potential derived from reactions with NOM fractions vs. UV254 in
Boonville, MO River water....................................................................... 67
Figure 5-8 SUVA of Boonville, MO River water by NOM fraction after activated carbon
and MIEX® treatment .............................................................................. 68

xi
LIST OF TABLES
Table 1-1 Disinfection by-product common abbreviations (adapted from Shorney, 1998) 3
Table 2-1 Meta-analytic estimates of the association between bladder and colon cancer at
specified levels of cumulative exposure to chlorination by-products (from
Morris et al., 1992) ..................................................................................... 6
Table 3-1 Properties of carbons used as treatment materials in 24 hr adsorption study ... 23
Table 3-2 Filtered Boonville, MO River (May 18, 2010) water characteristics ............... 26
Table 4-1 Properties of commercailly available activated carbons and greensand used as
treatment materials in Boonville, MO River water ................................... 38
Table 4-2 Filtered Boonville, MO River (Aug. 25, 2010) water characteristics .............. 41
Table 5-1 Boonville, MO River water DOC recoveries from XAD4 and DAX8 resins .. 58
xii
LIST OF ABBREVIATIONS
AC – Activated carbon
BCAA – Bromochloroacetic acid
BDCAA – Bromodichloroacetic acid
BDCM – Bromodichloromethane
CDBAA – Chlorodibromoacetic acid
CDBM – Chlorodibromomethane
CNT – Carbon nanotubes
COOH – Carboxyl group
COOR – Ester group
DBAA – Dibromoacetic acid
DBP – Disinfection by-product
DBP FP – Disinfection by-product formation potential
DCAA – Dichloroacetic acid
DI – Deionized
DOC – Dissolved organic carbon
DOM – Dissolved organic matter
EPA – Environmental Protection Agency
GC/MS – Gas chromatograph / mass spectrometer
GFH – Granular ferric hydroxide
HAA – Haloacetic acid
HAA5 FP – Total of 5 haloacetic acid’s formation potentials
HPI – Hydrophilic
HPO – Hydrophobic
HPO-A – Hydrophobic Acid
HPO-N – Hydrophobic Neutral

xiii
MBAA – Monobromoacetic acid
MCAA – Monochloroacetic acid
MTBE – Methyl tertiary-butyl ether
NH2 – Amine group
NO2 – Amide group
NOM – Natural organic matter
OH – Alcohol group
OR – Ether group
R – Alkyl group
SUVA – Specific ultraviolet absorbance
TBAA – Tribromoacetic acid
TBM – Bromoform
TCAA – Trichloroacetic acid
TCM – Chloroform
THM – Trihalomethane
TTHM FP – Total trihalomethane formation potential
TOC – Total organic carbon
TPI- Transphilic
TPH-A – Transphilic acid
TPH-N – Transphilic neutral
X – Halogen group
µg/L – Micrograms per liter
≥ - Greater than or equal to
≤ - Less than or equal to
< - Less than
> - Greater than
xiv
REMOVAL OF DISINFECTION BY-PRODUCT PRECURSORS BY
ACTIVATED CARBON AND MIEX®
DAVID HANIGAN
Dr. Thomas Clevenger Thesis Supervisor
ABSTRACT
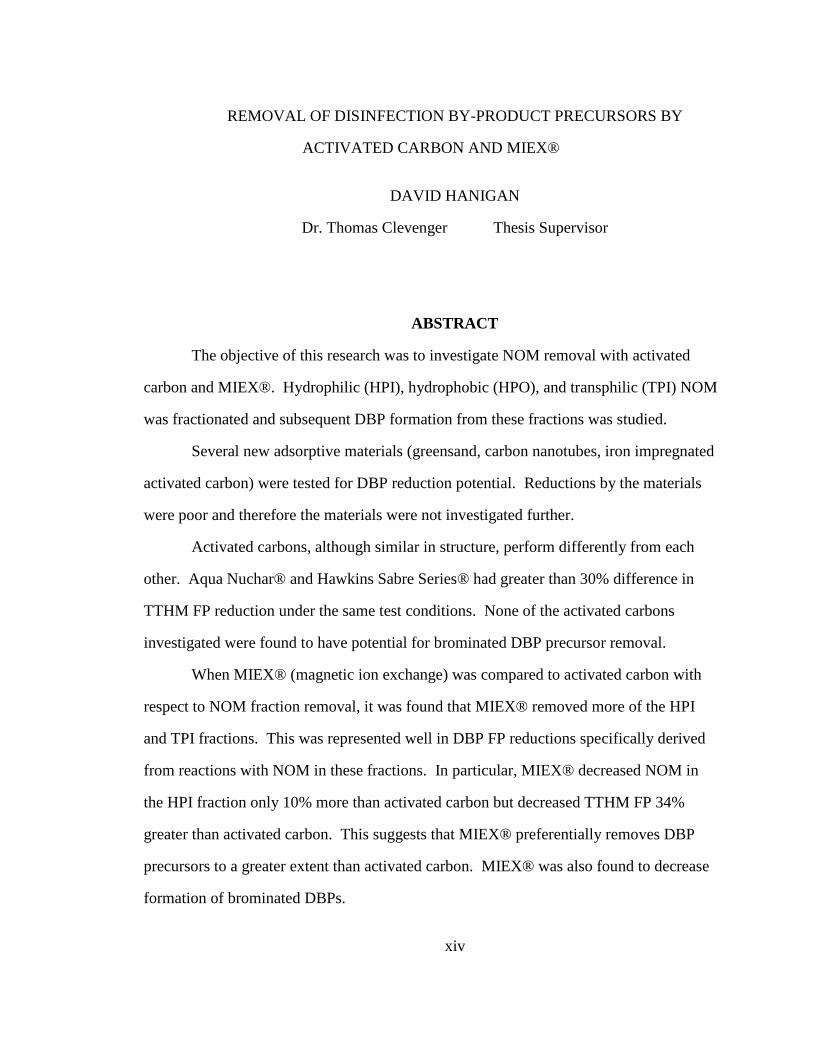
The objective of this research was to investigate NOM removal with activated
carbon and MIEX®. Hydrophilic (HPI), hydrophobic (HPO), and transphilic (TPI) NOM
was fractionated and subsequent DBP formation from these fractions was studied.
Several new adsorptive materials (greensand, carbon nanotubes, iron impregnated
activated carbon) were tested for DBP reduction potential. Reductions by the materials
were poor and therefore the materials were not investigated further.
Activated carbons, although similar in structure, perform differently from each
other. Aqua Nuchar® and Hawkins Sabre Series® had greater than 30% difference in
TTHM FP reduction under the same test conditions. None of the activated carbons
investigated were found to have potential for brominated DBP precursor removal.
When MIEX® (magnetic ion exchange) was compared to activated carbon with
respect to NOM fraction removal, it was found that MIEX® removed more of the HPI
and TPI fractions. This was represented well in DBP FP reductions specifically derived
from reactions with NOM in these fractions. In particular, MIEX® decreased NOM in
the HPI fraction only 10% more than activated carbon but decreased TTHM FP 34%
greater than activated carbon. This suggests that MIEX® preferentially removes DBP
precursors to a greater extent than activated carbon. MIEX® was also found to decrease
formation of brominated DBPs.

xv
SUVA, UV254, DOC, and chlorine demand were all investigated as surrogate
parameters for DBPs. UV254 was found to correlate best with DBP formation with
0.56<R2<0.80. UV254 absorbed by HPO NOM was found to correlate best with TTHM
FP (R2=0.88) with HPI being poorly correlated (R
2=0.20). THMs resulting from reactions
with HPI NOM accounted for between 40% and 55% of THMs from all fractions.
1
1 INTRODUCTION
1.1 DBPS AND POTABLE WATER
As the world population continues to grow, there is an ever increasing demand for
potable water. Due to this demand, a modern treatment and distribution system has been
established in almost all major urban centers. The oxidative properties of chlorine have
made it a primary form of disinfection in many of these facilities. However, because of
chlorine’s chemical properties, it has the potential to create disinfection by-products
(DBPs). Disinfection by-products are generated following a reaction with natural organic
matter (NOM) and chlorine (Bull et al., 1995; Jacangelo et al., 1995). Natural organic
matter has been found in all surface and ground waters in varying amounts, but has been
found in greater concentrations in surface water.
Chlorinated disinfection systems are closely regulated by the United States
Environmental Protection Agency (EPA). Most recently, EPA placed regulations on
disinfection by-products due to their potential carcinogenicity (McGeehin, 1993;
Villanueva et al., 2003). Trihalomethanes (THMs) and haloacetic acids (HAAs) have
been shown to be the two largest contributors to DBPs on a by weight basis (Krasner et
al., 1989; Adams et al., 2005). Their contributions are regulated by the Stage 2
Disinfectants and Disinfection By Products Rule at 80 and 60 µg/L, respectively (U.S.
EPA, 2006).
2
Trihalomethanes form as the substitution of any halogen such as fluorine,
chlorine, bromine, and iodine, for three of the four hydrogen atoms in methane.
Haloacetic acids form when a halogen atom takes the place of hydrogen in acetic acid.
Waters high in bromide have been shown to generate more THMs and HAAs,
specifically the brominated species such as bromoform, as bromide tends to catalyze
these reactions (Richardson et al., 1999; Hua et al., 2006).
Trihalomethane and HAA concentrations are measurements of several combined
compounds. In bench scale studies, DBPs are generally reported as total trihalomethane
formation potential (TTHM FP) and haloacetic acid formation potential (HAA5 FP).
Stage 2 Disinfectants and Disinfection By Products Rule requires that the total of the four
THMs and the total of 5 HAAs (MCAA, DCAA, TCAA, MBAA, DBAA) listed in Table
1-1 to be below the standard values to be in compliance.

3
Table 1-1 Disinfection by-product common abbreviations (adapted from Shorney, 1998)
Compound Abbreviation Structure
Chloroform TCM CHCl3
Bromodichloromethane BDCM CHBrCl2
Chlorodibromomethane CDBM CHBr2Cl
Bromoform TBM CHBr3
Monochloroacetic acid MCAA CH2ClCOOH
Monobromoacetic acid MBAA CH2BrCOOH
Dichloroacetic acid DCAA CHCl2COOH
Trichloroacetic acid TCAA CCl3COOH
Bromochloroacetic acid BCAA CHBrClCOOH
Dibromoacetic acid DBAA CHBr2COOH
Bromodichloroacetic acid BDCAA CHBrCl2COOH
Chlorodibromoacetic acid CDBAA CBr2ClCOOH
Tribromoacetic acid TBAA CBr3COOH
THMs
HAAs
1.2 RESEARCH OBJECTIVES
The objectives of this research were; 1) To investigate THM and HAA formation
reduction with activated carbon and ion exchange, 2) Investigate possible surrogates for
DBP formation of Boonville, MO treatment facility water, 3) Investigate NOM fractions
that were removed using activated carbon and ion exchange treatments, 4) Test
performance of several new adsorptive materials for DBP precursor removal.

4
2 CURRENT STATE OF KNOWLEDGE
2.1 HEALTH EFFECTS
Research has been conducted regarding the toxic effects of DBPs. A large
amount of conclusive direct work has been conducted on animals while case-control
studies have been performed concerning human toxicity with generally less conclusive
findings.
2.1.1 Animal
It has been shown that both THMs and HAAs are carcinogenic in rodents
(Dunnick et al., 1985; National Toxicology Program, 1987; National Toxicology
Program, 1989; Bull et al., 1990). The U.S. National Cancer Institute confirmed early
findings (Eschenbrenner, 1945; Eschenbrenner and Miller, 1946) regarding carcinogenic
properties of TCM. Up to a 92% increase of hepatocellular carcinoma could be found in
male mice dosed 180 mg/kg five times a week for 78 weeks and a 95% increase for
female mice with the same dosing schedule. Rats in the study were less susceptible to
increased cancer risk having only 24% increase in male and 4% in female (National
Cancer Institute, 1976).
More recently, in rats, liver toxic effects, specifically cytoplasmic vacuolization,
chronic inflammation, necrosis and fatty change, have been observed after administration
of CDBM, BDCM, and TBM. Similar effects were found in mice with the exception of
5
female mice, which were only susceptible to fatty change after exposure to THMs.
Chlorodibromomethane, BDCM, and TBM also caused liver neoplasms in mice, kidney
neoplasms in mice and rats, and colon or rectal neoplasms in rats (Dunnick and Melnick,
1993).
2.1.2 Case Studies
Much of the aforementioned research studied individual DBPs rather than
ingestion of common mixtures of DBPs found in modern water supply systems. Also,
doses were much higher than an average person would receive from a properly
functioning water treatment facility. Epidemiological studies have been conducted to
gain knowledge on the toxicity to humans.
Early studies regarding exposure to chlorination by-products were conclusive
individually, but often disagreed conjunctively. A meta-analysis encompassing 10
DBP/cancer related studies was conducted in 1992 (Morris et al.). Meta-analysis was
based on the quality of the researcher’s selection of subjects, confounding variables
adjustment, exposure assessment, and statistical analysis. Bladder and rectal cancer were
deemed to be of the highest quality by the author and are shown in Table 2-1. A positive
correlation between exposure and risk was found.

6
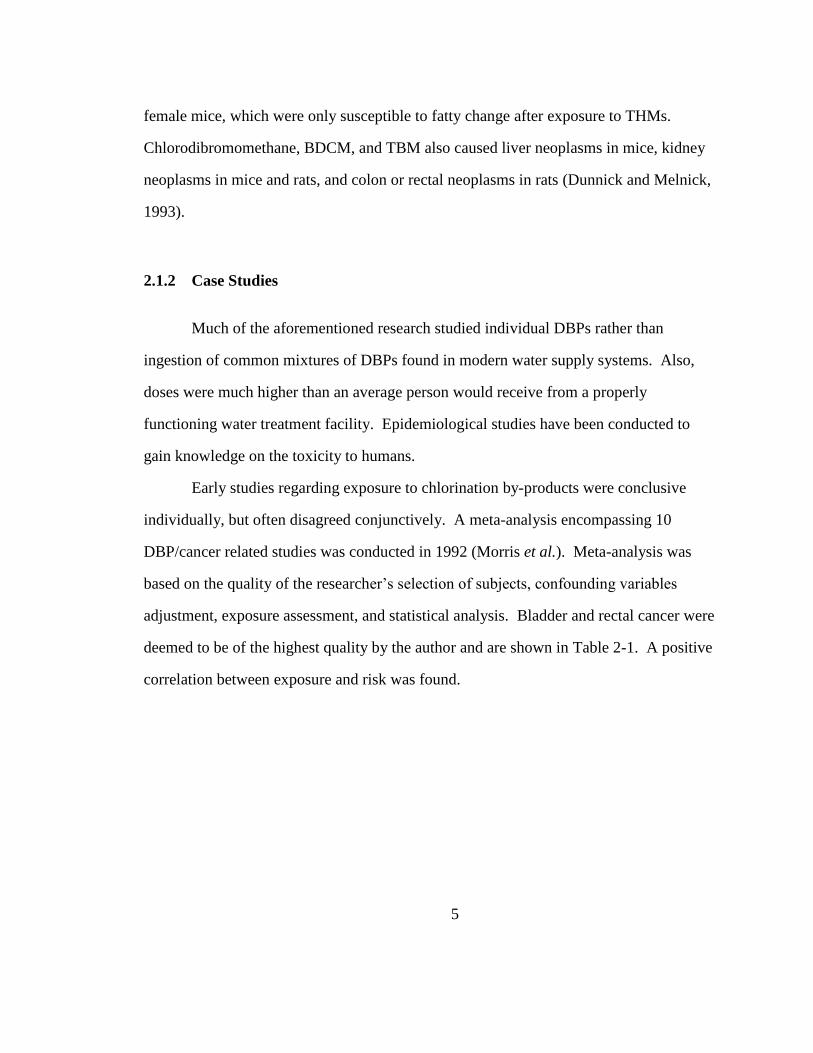
Table 2-1 Meta-analytic estimates of the association between bladder and colon cancer at
specified levels of cumulative exposure to chlorination by-products (from
Morris et al., 1992)
Low 1.03 0.85, 1.24
Moderatea
1.2 1.05, 1.37
Moderateb
1.2 1.04, 1.38
High 1.41 1.24, 1.62
Low 1.13 0.61, 2.09
Moderatea
1.29 1.00, 1.67
Moderateb
1.49 1.10, 2.01
High 2.04 1.18, 3.53
bThis category includes all studies for which exposure was dichotomous, in
addition to studies ranked a middle level of exposure.
aThis Category includes only data from those studies that ranked a middle
level of exposure.
Site
Level of
Exposure
Relative
Risk 95% CI
Bladder
Rectum
Cancer sites such as brain, breast, kidney, liver, and others were also included in
the meta-analysis. All were found to have positive correlations with DBP exposure level.
More recent studies agreed with the above findings regarding bladder and rectal
cancer (Cantor et al., 1998; Hildesheim et al., 1998; Cantor et al., 1999) and added that
men appeared to be more susceptible to THM influence for bladder cancer than women,
finding a negative odds ratio for women no matter the length of exposure (Cantor et al.,
1998). Another study found odds ratios for brain cancer of 1.0, 1.1, 1.6, and 1.3 for
exposure to chlorinated surface water of 0, 1-19, 20-39, and 40 years (Cantor et al.,
1999).
Toxicity has also been shown to be affected by quantity both in respect to
consumption as well as concentration. Spontaneous abortion was shown to increase 3%

7
for women drinking water containing ≥75 µg/L THM. Odds ratios increased from 1.1 to
2.0 when number of glasses consumed of ≥75 µg/L THM increased to greater than 5
daily (Waller et al., 1998).
2.2 DBP FORMATION
Disinfection by-product formation occurs as a reaction between NOM and any
halogen. Due to the makeup of NOM, there are several pathways for the formation of
DBPs.
2.2.1 NOM
Natural organic matter is an extremely complex heterogeneous material made up
of hydrophilic acids, humic substances, proteins, lipids, carboxylic acids,
polysaccharides, amino acids, and hydrocarbons (Wei et al., 2008). Humic substances
have been found to make up 50-70% of NOM in water (Baker and Spencer, 2004).
Disinfection is generally a final process, after coagulation and filtration, for potable
water, and therefore disinfectants react with only little or no particulate organic matter.
Subsequently, the majority of DBP formation potential (DBP FP) research regarding
organic matter in natural water has been conducted with interest in dissolved organic
matter (DOM). Dissolved organic matter is measured with the surrogate parameter,
dissolved organic carbon (DOC). Dissolved organic carbon is defined similarly to DOM
as the fraction of total organic carbon (TOC) that passes a 0.45 µm filter, or the
nonparticulate fraction. It is measured with a TOC analyzer after filtration.

8
XAD resin has been used to fractionate several distinct groups of DOM. These
groups are; hydrophobic (HPO), containing the hydrophobic acid (HPO-A) and
hydrophobic neutral (HPO-N) fractions, transphilic (TPI), also containing acid and
neutral fractions (TPHA and TPHN, respectively), and hydrophilic (HPI). The
hydrophobic fraction generally contains humic substances such as humic and fulvic acids
(Cheng, 2007). Both TPH and HPI are mostly nonhumic containing fractions and are
often referred to together as HPI.
Natural organic matter is considered highly aromatic as indicated by its high
ultraviolet absorbance at a wavelength of 254 nm (UV254) (Reckhow et al., 2004). This
property can be attributed to unsaturated bonds in functional groups contained in humic
substances common in NOM (Nikolaou and Lekkas, 2001). Specific ultraviolet
absorbance (SUVA) is defined as UV254 divided by the DOC concentration. It has been
shown to be a good indicator of the aromaticity of NOM (Reckhow et al., 1990; Croue et
al., 2000; Kitis et al., 2001; Liang and Singer, 2003).
2.2.2 Formation Mechanics
Trihalomethanes and HAAs form as the substitution of a halogen for one or more
hydrogen atoms. However, the kinetics of such substitutions are extremely complex as
the composition of NOM is not entirely known. Several pathways for the formation of
DBPs are possible and therefore, it is difficult to be sure which is occurring.
pH may have an effect on DBP generation and governs the mechanics of
formation of DBPs as well as their fate after formation. It has been shown that not only
may HAA decompose at elevated pH (Krasner et al., 1989), but that there is also more
9
potential for THM formation and less for HAA formation. The opposite is true for
decreased pH (Liang and Singer, 2003; Cheng, 2007; Ye et al., 2009).
Chlorine may also oxidize bromide containing compounds forming hypobromous
acid. Hypobromous acid has been shown to more readily react with NOM in the
formation of brominated DBPs. Hypobromous acid is thought to be a better substitution
agent and poorer oxidant than hypochlorous acid and therefore, generation of brominated
THM and HAA species in waters with greater than 10 µg/L bromide can be much more
significant than chlorinated species (Richardson et al., 1999; Hua et al., 2006).
Carlson et al. (1975) indicated that electron donating aromatic functional groups (
-OH, -OR, -NH2, -R) are more reactive in the formation of halogenated DBPs than
electron accepting aromatics (-NO2, -COOH, -COOR, -X). This is due to the groups’
capacity to direct the halogens to both the ortho and para positions whereas the electron
accepting functional groups orient the halogens in the meta position only. Placing
halogens at either ortho or para positions will increase the electron density in the
aromatic ring while the meta position will decrease it.
2.2.3 Surrogates for TTHM and HAA5 FP
Water treatment facilities cannot quickly analyze effluent for TTHM or HAA5.
Generally facilities are tested by state or federal entities quarterly for Stage 2 compliance.
To ensure compliance, it is necessary for facilities to estimate DBP concentration through
correlation with an easily analyzed surrogate. Candidates are DOC, UV254, chlorine
demand, and SUVA.
10
2.2.3.1 Organic Carbon
Organic carbon can be analyzed inside of 10 min with most available equipment
and requires little or no preparation work. The analysis is already conducted onsite at
most water treatment facilities and is therefore a good candidate as a DBP surrogate.
Several studies have been conducted to study the relationship between TOC/DOC
and TTHM FP with conflicting results. Chapra and Canale (1997) found that data from
four previous studies with similar experimental methods could be approximated into Eq.
2-1.
Eq. 2-1
The data were contradictory to a study conducted by Najm et al. (1994) who found TOC
correlation to be r2
< 0.67 for TTHM FP. HAA5 FP was also poorly correlated.
Dissolved organic carbon has in many cases been found to be a poor surrogate for
TTHM FP (Stepczuk et al., 1998a; Stepczuk et al., 1998b; White et al., 2003) and HAA5
FP (White et al., 2003).
2.2.3.2 UV254
Analyzing UV254 absorbance requires passing light through a quartz cell of water
and measuring a percentage of light energy lost. The lost energy is assumed absorbed
and this process takes less than 1 min with modern equipment. Again the process requires
little or no preparation.
Ultraviolet absorbance arises due to unsaturated bonds in molecules or functional
groups and is related to reactivity. Ultraviolet absorbance at a wavelength of 254 nm has

11
been found to be well correlated with TTHM FP (Singer et al., 1981; Rathbun, 1996)
with some studies reporting correlation coefficients between 0.93 and 0.99 (Edzwald et
al., 1985; Najm et al., 1994; White et al., 2003). Also it has been shown to have
potential as a HAA5 FP surrogate (White et al., 2003) but correlation coefficients are
generally less than for TTHM FP (Najm et al., 1994).
2.2.3.3 SUVA
Specific UV absorbance is defined as UV254/DOC and requires slightly more
analysis time as both UV254 and DOC analyses are required.
The correlation with DBP FP is generally poor as not all aromatic moieties are
reactive with chlorine (Fram et al., 1999; Kitis et al., 2001; Weishaar et al., 2003; White
et al., 2003). This is also indicated as previously noted by the poor relationship between
DOC and DBP FP. However, in some cases SUVA has been shown to be a good
indicator of hydrophobic carbon with hydrophobic content being a good indicator of
HAA FP (Croue et al., 2000; Liang and Singer, 2003; Boyer and Singer, 2005).
2.2.3.4 Chlorine Demand
Chlorine demand is the difference between dosed chlorine and residual chlorine
after a given period of time as shown in Eq. 2-2. Analysis takes less than 10 min and
involves a reagent sensitive to free chlorine and a spectrometer.
Eq. 2-2
Little research has been conducted regarding chlorine demand as a surrogate for
DBP FP. Of the research conducted, studies are sensitive to allowed reaction time as
well as water source. With reaction times on the order of a few days and water from both

12
reservoir and river sources, Reckhow et al. (1990) found good correlations with both
TTHM FP and several halogenated acetic acids. Also, Gang (2003) found that formation
of TTHM FP could be directly related to chlorine consumption by ultra filtered NOM
(R2=.97-.99). The relation was found to be from 30.9 to 41.9 µg-TTHM/mg-Cl2
consumed dependant on molecular weight with the smaller molecules generating greater
quantities of TTHMs. However, Edzwald et al. (1985) found correlation coefficients of
0.85 and 0.53 for river and reservoir sources respectively with reaction time fixed at 2 hr.
2.2.4 Temporal Trends in DBP Formation
Several seasonal trends such as NOM concentration, temperature, and
precipitation, can be expected to affect DBP formation. Also, these variations cause
operational changes in treatment plants such as chlorine dose and activated carbon use
which also directly affect DBP formation.
Disinfection by-product concentrations in treated water are generally higher in the
summer and fall than in the winter and spring with third quarter TTHM FP and HAA5 FP
up to double that of fourth quarter (Williams et al., 1998; Sohn et al., 2001; Adams et al.,
2005; Rodriguez et al., 2007). Of note, Williams et al. (1998) collected data from 35
drinking water treatment facilities with chlorine as the primary disinfectant finding a
200% increase in TTHM FP, 160% increase in DCAA, and 122% increase in TCAA
from winter to summer months.
Although the cause for this increase is not entirely known, Adams et al. (2005)
speculated that it is at least partially due to algal growth patterns and precipitation.
Intuitively, algae blooms occur during summer months, taking advantage of greater hours
of sunlight with algae and other accumulated NOM then being washed into treatment
13
facilities during heavier precipitation in the fall. At least in partial agreement, Chen et al.
(2008) concluded that that 20%-50% of DBP FP was due to algal blooms.
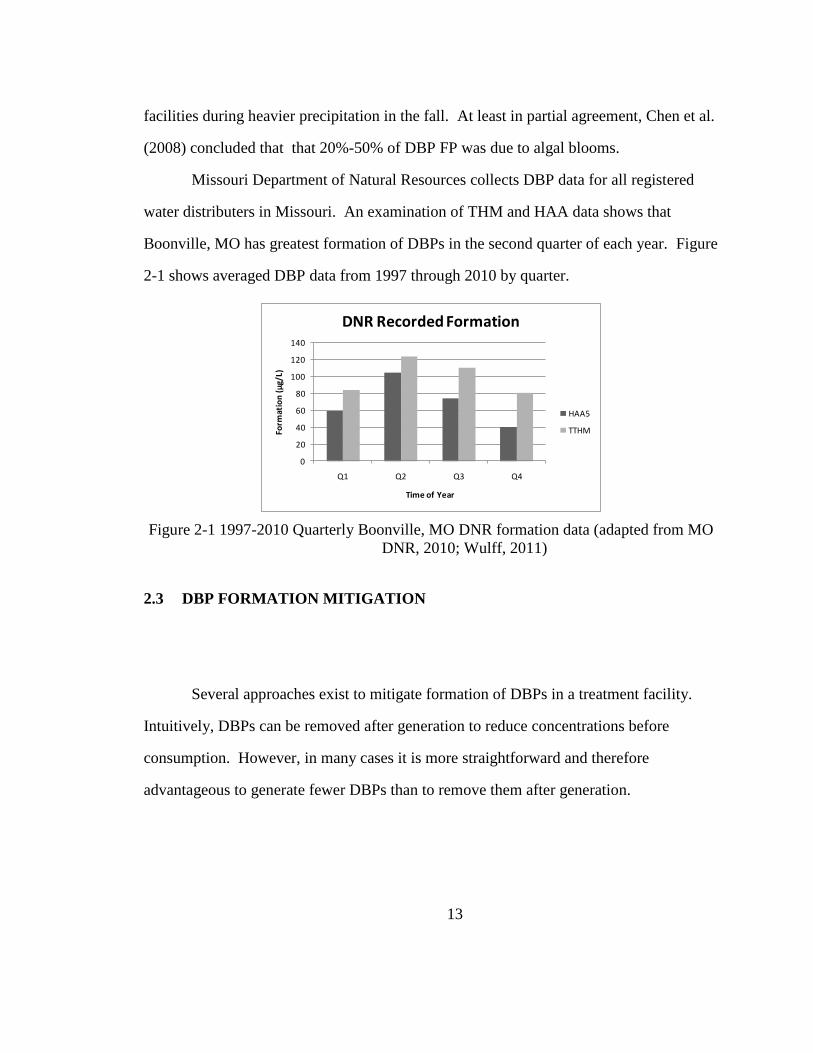
Missouri Department of Natural Resources collects DBP data for all registered
water distributers in Missouri. An examination of THM and HAA data shows that
Boonville, MO has greatest formation of DBPs in the second quarter of each year. Figure
2-1 shows averaged DBP data from 1997 through 2010 by quarter.
0
20
40
60
80
100
120
140
Q1 Q2 Q3 Q4
Form
atio
n (
µg/
L)
Time of Year
DNR Recorded Formation
HAA5
TTHM
Figure 2-1 1997-2010 Quarterly Boonville, MO DNR formation data (adapted from MO
DNR, 2010; Wulff, 2011)
2.3 DBP FORMATION MITIGATION
Several approaches exist to mitigate formation of DBPs in a treatment facility.
Intuitively, DBPs can be removed after generation to reduce concentrations before
consumption. However, in many cases it is more straightforward and therefore
advantageous to generate fewer DBPs than to remove them after generation.
14
2.3.1 Post-disinfection
Constraints with potable water treatment facility design make it difficult and
therefore uncommon to attempt to remove DBPs after generation. Although it has been
shown that activated carbon (AC) will remove THMs and HAAs (Lykins et al., 1988;
Speth and Miltner, 1990), it is impractical to add AC to water that is entering the
distribution system without the addition of new sedimentation basins. It has also been
shown that biologically active carbon can remove DBPs, but it is once again impractical
(Tung, 2004).
2.3.2 During Disinfection
Mitigation during disinfection refers to use of alternative disinfectants such as
ozone, monochloramine, and ultraviolet irradiation. These alternatives generate less
HAAs and THMs and can be as effective as chlorine in inactivating microbes (Liberti et
al., 2003; Muellner et al., 2006; Rose et al., 2007; Antonelli et al., 2008; Burns et al.,
2008; Muñoz et al., 2009). However, USEPA requires a chlorine residual in all
distribution systems and consequently, ozone, and ultraviolet irradiation must be
augmented with chlorine before the water enters the distribution system. In addition,
with the exception of monochloramine, it is monetarily challenging for smaller
municipalities to switch to alternative disinfectants as major facility modifications are
required. Monochloramine requires little modifications and is therefore being used more
frequently to meet required EPA chlorine residuals.

15
2.3.3 Pre-disinfection
Enhanced coagulation and adsorption of NOM before disinfection are common
techniques to reduce DBP formation. Enhanced coagulation involves the testing of
several coagulant doses and chemicals at a particular pH in order to find which
combination is most effective at reducing DBP formation. Activated carbon, other
adsorbents, and ion exchangers can be added to the water before the coagulation process
also in an attempt to remove a large portion of NOM.
Adsorption, most generally, is the adhesion of dissolved molecules to a surface.
Adsorption occurs in most instances due to surface energy. In a material, inner molecules
are surrounded by similar molecules, thus satisfying their bonding requirements.
However, the molecules at the edges or surfaces are not wholly surrounded and therefore
have unsatisfied bonding requirements. This can cause other materials, such as NOM,
with similarly unsatisfied bonding requirements to bond or adsorb.
2.3.3.1 Activated Carbon
Activated carbon is of particular interest as it has been oxidized to generate an
extremely porous structure and therefore high surface area that is beneficial for
adsorption. Wei et al. (2008) found that HPI was the major component of aquatic DOC
(50%) with HPO-A (30%) contributing. Also, that DOC removal of up to 39% could be
obtained with granular AC treatment (3.3 µg C m-2
@ 1 hr and pH 7.8). HPI and HPO-A
fractions were shown to be the main TTHM FP precursors, accounting for 80% of TTHM
FP. While a reduction of 56% TTHM FP was found following AC treatment, a reduction
of 71% and 38% TTHM FP for HPO-A and HPI fractions were found individually. This
implies that AC, while being effective at removing portions of TTHM FP and DOC, is
more effective at removing HPO than HPI fractions.

16
Modified AC has also been of recent interest. A study in 2009 (Klimenko et al.,
2009) concluded that oxidation of AC by hydrogen peroxide decreases the adsorption
efficiency of AC. However, this decrease of absorption efficacy was compensated by the
catalytic effect of hydrogen peroxide oxidation of the fulvic acids. Therefore, AC and
H2O2 synergistically react with more fulvic acids than just AC. Unfortunately, fulvic
acids have been shown to be less chlorine reactive, and therefore less DBP producing
than humic acids (Zhang et al., 2009). It is possible that fulvic-like acids contained in the
HPI fraction would respond similarly with combined hydrogen peroxide and AC
treatment, but little conclusive research has been conducted.
2.3.3.2 Carbon Nanotubes
Carbon nanotubes (CNT) are different from AC in that AC has varying oxidation
states and functional groups formed at the adsorption sites during the oxidation process
while CNT has globally conjugated unsaturated carbons in three dimensional arrays.
This provides for adsorption sites along the surface of a cylindrical structure rather than
in micropores of different sizes as is found in AC.
Carbon Nanotubes have been shown to preferentially adsorb the more chlorine
reactive high molecular weight humic acids over fulvic acids. In AC, smaller molecules
are preferentially adsorbed because they can reach small and large pores, where as in
CNT, large molecules are adsorbed more readily due to their higher adsorption strength
(Hyung and Kim, 2008). Regardless of NOM type (bulk, fulvic, or humic), when
adsorption isotherms were conducted after adsorption to CNT, aromatic carbon content
showed the strongest relationship. Adsorption capacity has been shown to double (from
30 to 60 µg C m-2
@ 144 hr and pH 7) when aromatic group content increased from 30%
to 60% (Hyung and Kim, 2008). This was consistent with findings that aromatic group

17
content is related directly to chlorine reactivity, more specifically, generation of DBPs
(Wu, 1998). Although adsorption capacity is highly dependent on pH and ionic strength
in the water, it is unlikely that control will be had over pH or ionic strength in an
application.
2.3.3.3 High Clay Content Soils
Conventionally, research conducted regarding adsorption has been performed to
determine ability of high clay content soil to retain NOM for agricultural purposes.
Previous studies on sorption of NOM to soils have primarily been conducted at lower pH
(3-5) to model subsurface soils (Gu et al., 1994; Meier et al., 1999). As pH decreases,
adsorption capacity of clay generally increases as the oxides contained in the clay are
usually deprotonated at higher pH (Tipping, 1981).
Regarding kaolinite, a clay with high aluminum oxide content, Meier et al. (1999)
have found sorption of 80 to 100 µg C m-2
@ 24 hr and pH 4 while Kahle et al. (2004)
found 9 to 44 µg C m-2
sorption @ 24 hr and pH 7. This is consistent with expected
decrease in adsorption capacity due to higher pH. However, even at low pH (4), it has
been shown that if both aluminum and iron oxides were removed from clay soils, up to
94% decrease in adsorption was obtained (Kaiser and Zech, 2000). Although these
findings are contradictory, it can be assumed that the oxides contained in the soil play a
part in adsorption at all pH ranges.
Goethite, a mineral found in clay soils is iron oxyhydroxide ( Fe3+
O(OH) ) and
has a great capacity for NOM adsorption (300 µg C m-2
@ 24 hr and pH 4) (Meier et al.,
1999). This is likely due to its capability for ligand exchange between carboxylic and
phenolic groups of the NOM and the hydroxyl groups of the iron oxide (James et al.,
2007; Genz et al., 2008). Sorption onto goethite also decreases the average molecular

18
weight of a solution indicating that higher molecular weight, more humic molecules have
been adsorbed (Meier et al., 1999; James et al., 2007). Removal of the iron and
aluminum containing oxides in a soil has been shown to reduce the adsorption capacity of
HPO material more than HPI (Kaiser and Zech, 2000) and, therefore, it can be inferred
that the oxides sites preferentially adsorb hydrophobic fractions of the NOM present.
Finally, it can be concluded that goethite has similar characteristics to AC in respect to
preferential adsorption of highly aromatic, high molecular weight, hydrophobic
molecules.
2.3.3.4 Iron Oxide
The high capacity for natural oxides such as goethite to adsorb NOM has
generated interest in iron oxide. Genz et al. (2008) studied granular ferric hydroxide
(GFH) for NOM removal. Granular ferric hydroxide is frequently used for arsenic
removal and is applied in numerous European waterworks. It is similar to goethite and is
predominately akaganeite, a poorly crystallized iron oxide. Granular ferric hydroxide
was found to have potential for adsorption of DOC (36 to 107 µg C m-2
@ 72 hr and pH
between 7 and 8). In particular, larger, more polar, more UV-active fulvic acids are
preferentially adsorbed. The study also showed that adsorption was strongly dependent
on pH, pointing again to ligand exchange as a primary mechanism.
A similar study found that pure iron oxide in the form of hematite removes 330
and 180 µg C / m2 @ 18 hr and pH of 4.1 and 6.5, respectively. It was also noted that
phosphate and sulfate have a severe negative impact on adsorption (Gu et al., 1994).
Yujung et al. (1997) studied iron oxide from an application perspective. Olivine
was coated with approximately 5% by weight iron oxide and used as filter media. Five
percent was achieved only after several coatings eliciting a need for a more efficient
19
process. A 57% reduction in DOC was found after being passed through the filter media
with contact time of only 10 min. However, it was discovered that adsorption efficiency
decreases sharply with time and media would need to be regenerated once every few days
assuming influent DOC is 3-5 mg/L. The coated media can be regenerated to near full
adsorption capacity with NaOH, however, repeated backwashing also degrades
adsorption capacity past 10 regenerations.
2.3.3.5 MIEX®
Anion exchange resins have been shown to remove large quantities of NOM from
natural waters (Anderson and Maier, 1979; Bolto et al., 2002; Singer and Bilyk, 2002;
Boyer and Singer, 2005; Humbert et al., 2005). Generally, an anion exchange resin
exchanges a chloride ion from a quarternary ammonium functional group for an organic
anion. Adsorption is typically avoided if possible as it decreases the resins ability to be
regenerated by brine.
MIEX® (magnetic ion exchange) is relatively new, being produced commercially
first in 1999, and has two properties that separate it from previously available anion
exchange resins. First, it is smaller (2-5 times) than traditional resins with a mean
particle diameter of 180 µm (Boyer and Singer, 2005). MIEX® also contains enough
iron oxide to render it magnetic which aids in agglomeration and therefore settling of the
material. This rapid sedimentation is critical as the material is intended to be regenerated
and reused. Similar to other ion exchangers, MIEX® is a macroporous, strong base,
polyacrylic resin with quarternary amine functional groups.
When MIEX® is used without coagulation, UV254 reductions of 50%-85% and
DOC reductions of 40%-75% have been reported (Cook et al., 2001; Hamm and Bourke,
2001; Pelekani et al., 2001). Trihalomethane and HAA formation is also reduced with
20
declination in the ranges of 30%-85% for THM (Hamm and Bourke, 2001; Singer and
Bilyk, 2002) and 50-68% for HAA formation (Boyer and Singer, 2005).
MIEX® has been shown to preferentially remove high SUVA DOM. Thirty to
seventy five percent was reported in HPO matter removal compared to TPI matter with
20%-75% removal. This high SUVA DOM is HPO in nature and generated greater
amounts of HAAs (Boyer and Singer, 2005).
MIEX® has also been shown to remove large amounts of bromide from waters
(Singer and Bilyk, 2002; Boyer and Singer, 2005). However, when alkalinity approaches
100 mg/L, as little as 15% bromide removal was evident. As much as 94% was possible
with alkalinity of 20 mg/L. Little bromide reduction was possible with coagulation alone
(Singer and Bilyk, 2002; Boyer and Singer, 2005).

21
3 IRON IMPREGNATED AC FOR DBP FP REDUCTION
3.1 INTRODUCTION
Natural organic matter is present in all natural ground and surface waters. Natural
organic matter is derived from decomposing plant and animal matter and is considered
non-toxic. However, when combined with free chlorine in a water treatment facility,
potentially carcinogenic DBPs form as the result of a halogen substitution for one or
more hydrogen atoms (Eschenbrenner, 1945; Eschenbrenner and Miller, 1946; Dunnick
et al., 1985; National Toxicology Program, 1987; Bull et al., 1990; Dunnick and
Melnick, 1993; McGeehin, 1993; King and Marrett, 1996; Hildesheim et al., 1998;
Cantor et al., 1999). Recently, USEPA has placed restrictions on THM and HAA levels
in distributed waters (U.S. EPA, 2006). Removal of NOM by adsorption before reaction
with chlorine is currently a cost effective method of reducing DBP levels in treated water.
A great deal of adsorption research has been conducted on soils with high iron
oxide content (Tipping, 1981; Gu et al., 1994; Yujung et al., 1997; James et al., 2007). It
has been shown that goethite, a naturally occurring iron oxide, has a capacity for NOM
removal of 300 µg C m-2
after 24 hrs (Meier et al., 1999). This is likely due to ligand
exchange between the carboxylic and phenolic groups of the NOM and the hydroxyl
groups of the iron oxide (James et al., 2007; Genz et al., 2008). It has also been reported
that removal of oxides from a soil reduces the capacity for adsorption of NOM (Kaiser
and Zech, 2000) but little or no research has been completed regarding the DBP FP of the

22
removed NOM. Therefore, an adsorption study regarding DBP FP reduction with iron
oxides was of interest.
3.2 MATERIALS AND METHODS
3.2.1 Sampling
Raw water was collected in May 18, 2010 from the City of Boonville’s water
treatment facility. A submerged intake in the Missouri River just north of the City of
Boonville pumps water up to the facility. A grab sample was collected from a
pressurized inlet to the facility’s first sedimentation basin. The sample was then
transferred immediately to the Missouri Water Resources’ research lab where it was
stored at 3°C for the duration of the study. The intent was not to study only Boonville’s
treatment process, but to study DBP forming surface water in general and therefore, raw
water was used rather than water sampled directly before AC addition in the treatment
train.
3.2.2 Activated Carbon
Hydrodarco® B (Norit Americas Inc., Marshall, TX) was obtained onsite from
the City of Boonville water treatment plant. During the time of this study, Boonville
used Hydrodarco® as a form of DBP reduction on a seasonal basis. Aqua Nuchar® was
obtained from Meadwestvaco, Richmond, VA. Carbon nanotubes were acquired from
Nanotech Port Co., Shenzhen, China. Iron impregnated activated carbon (Fe-AC) was
obtained as Darco 20-50 (Norit Americas Inc.) and subsequently prepared by Zhimang

23
Gu (University of Missouri) for related research (Gu et al., 2005). A summary of the
material’s properties from the manufacturers is given in Table 3-1. It should be noted
that the properties listed are for Darco 20-50 and therefore may not accurately represent
the material after iron impregnation.
Table 3-1 Properties of carbons used as treatment materials in 24 hr adsorption study
Material Particle Size Surface Area (m^2/g) Iodine Number (mg/g)
Hyrdodarco B 90% <45 µm >500
Aqua Nuchar 90% <45 µm 1200-1600 >900
CNT 1-100 nm
Fe-AC .3-.8 mm 650 625
3.2.3 Carbon Treatment
300 ml bottles containing different doses of AC (20, 40, 60, 80 mg/L) were filled
with 250 ml of raw water. Doses were not chosen to represent Boonville’s facility but to
investigate NOM removal at high doses of AC and to investigate potential removal by
new adsorptive materials. The minimum amount of agitation to keep the AC suspended
was found to be 225 rpm and therefore bottles were shaken at 225 rpm for 24 ± 1 hrs.
Water was then immediately filtered using a 0.45 µm filter and stored at 3°C pending
analysis.
3.2.4 TOC/DOC Analysis
After filtration, non-purgeable organic carbon (DOC) was analyzed using a
Shimadzu Total Organic Carbon Analyzer (Shimadzu Corp., Atlana, GA) with an ASI
24
auto-sampler. Acidification was conducted using 2M hydrochloric acid obtained from
Fisher Scientific, Fair Lawn, NJ as 36M and subsequently diluted.
3.2.5 UV254 Analysis
Filtered water was transferred to a 1 cm3 cuvette via pipette. Absorbance at a
wavelength of 254 nm was measured 10 times using a Varian CARY50Conc UV-visible
light spectrophotometer and averaged.
3.2.6 Chlorination
Chlorination was completed in accordance with Summers et. al (1996). A sodium
hypochlorite dosing solution (about 2,000 mg/L) was made from 13% active chlorine
(sodium hypochlorite) stock solution and buffered at pH 8 with 0.01M KH2PO4.
The dosing solution’s concentration was then measured 3 times and averaged to
ensure accuracy. Approximately 50 ml filtered water was transferred to 125 ml amber
incubation bottles and buffered with borate solution. An appropriate amount of sodium
hypochlorite dosing solution was added and the bottle was capped and inverted twice.
The bottle was filled with borate buffered filtered water and capped ensuring no head
space. The bottles were then stored in the dark for 24 hrs. Chlorine residual was then
measured using a Hach DR/2400 spectrophotometer after which chlorine was quenched
with 4.4 mg NH4Cl dissolved in deionized water (DI).
25
3.2.7 THM Analysis
A gas chromatograph (Varian, Model 3800) / mass spectrometer (GC/MS)
(Varian, Saturn 3800) equipped with a Tekmar 3000 purge and trap concentrator was
used for the determination of THM concentrations. This process was similar to the
Standard Method for the Examination of Water and Wastewater 6200 B and US EPA
Method 524.
3.2.8 HAA Analysis
For the determination of HAA concentrations, a method involving liquid/liquid
extraction and derivatization similar to Standard Method for Examination of Water and
Wastewater 6521 and US EPA Method 552.2 was used. At an acidic pH, methyl tertiary-
butyl ether (MTBE) was used to extract non-dissociated acidic compounds. Sodium
sulfate was added to increase extraction efficiency as a salting agent. A 10% v/v solution
of sulfuric acid and methanol was added to produce methyl ester derivatives that could be
separated chromatographically (Varian, Model 3800).
3.2.9 Calculations
Chlorine demand was calculated using Eq. 2-2. Percent reduction was calculated
with respect to filtered only water and is represented in Eq. 3-1.
26
Eq. 3-1
3.3 RESULTS AND DISCUSSION
3.3.1 Characteristics of Filtered Water
After sample collection and filtration but before chlorination, UV254 and DOC
were measured. After chlorination, THM and HAA were measured and reported as
TTHM FP and HAA5 FP. A summary of the filtered water’s characteristics is shown in
Table 3-2. The water was characterized with high DOC, high UV254, and elevated DBP
FP levels typical of mid spring.
Table 3-2 Filtered Boonville, MO River (May 18, 2010) water characteristics
DOC (mg/L) UV254 (1/m) SUVA TTHM FP (µg/L) HAA5 FP (µg/L) pH
5.32 18.41 3.54 240 83 8
3.3.2 DOC, UV254, and SUVA
Dissolved organic carbon reduction was least when Fe-AC was used as a sorbent
with only 16% reduction at the highest dose of 80 mg/L. Aqua Nuchar® removed the
largest quantity of DOC with up to 50% reduction at a dose of 100 mg/L (Figure 3-1 and

27
Figure 3-2). This indicates that both iodine adsorption and surface area are possible
indicators of DOC sorption.
0
1
2
3
4
5
6
7
20 40 60 80 100
DO
C (m
g/L)
AC Dose (mg/L)
DOC
Aqua Nuchar
Fe-AC
Hydrodarco B
CNT
Filtered
Figure 3-1 DOC of Boonville, MO River water after 24 hr adsorption by several activated
carbons
0102030405060708090
100
20 40 60 80 100
Pe
rce
nt
Re
du
ctio
n
AC Dose (mg/L)
DOC Reduction
Aqua Nuchar
Fe-AC
Hydrodarco B
CNT
Figure 3-2 DOC of Boonville, MO River water percent reduction by adsorption on
several activated carbons
Fe-AC reduced UV254 absorbance the least with decreases in UV254 only at
doses of 60 (7%) and 80 mg/L (12%) and increases at other doses. Aqua Nuchar® again
decreased UV254 absorbance more than the other materials with a maximum decrease of
55% (Figure 3-3 and Figure 3-4). Again, surface area and iodine adsorption number are
possible indicators of a material’s affinity for UV254 reduction.
28
0
5
10
15
20
25
30
20 40 60 80 100
UV
25
4 (1
/m)
AC Dose (mg/L)
UV254
Aqua Nuchar
Fe-AC
Hydrodarco B
CNT
Filtered
Figure 3-3 UV254 of Boonville, MO River water after 24 hr adsorption of NOM by
several activated carbons
-20
0
20
40
60
80
100
20 40 60 80 100
Pe
rce
nt
Re
du
ctio
n
AC Dose (mg/L)
UV254 Reduction
Aqua Nuchar
Fe-AC
Hydrodarco B
CNT
Figure 3-4 UV254 of Boonville, MO River water percent reduction by adsorption of
NOM on several activated carbons
There was little correlation between AC dose and SUVA (Figure 3-5). This is
likely a representation of poor HPI NOM removal as SUVA is a representation of more
aromatic, HPO structures in NOM (Croue et al., 1999; Liang and Singer, 2003).
29
0.0
1.0
2.0
3.0
4.0
5.0
6.0
7.0
20 40 60 80 100
SUV
A (L
/mg-
m)
AC Dose (mg/L)
SUVA
Aqua Nuchar
Fe-AC
Hydrodarco B
CNT
Filtered
Figure 3-5 SUVA of Boonville, MO River water after 24 hr adsorption of NOM by
several activated carbons
3.3.3 TTHM FP
EPA has set a maximum contaminant level of 80 µg/L for TTHM. Filtered water
TTHM FP was 240 µg/L. Reduction of TTHM FP to an acceptable level was achieved in
only one case by Aqua Nuchar® at a dose of 80 mg/L. TTHM FP levels are shown in
Figure 3-6 and percent reduction is shown in Figure 3-7. Although the EPA limit was
only achieved in one case, TTHM FP was decreased by all ACs. Again, Fe-AC
performed worse than other common carbons, attaining only a maximum of 31%
reduction. Aqua Nuchar® again had greatest reductions, indicating that DOC and
UV254 were indicators of TTHM FP.

30
0
50
100
150
200
250
300
20 40 60 80 100
TTH
M F
P (
µg/
L)AC Dose (mg/L)
TTHM FP
Aqua Nuchar
Fe-AC
Hydrodarco B
CNT
Filtered
TTHM MCL = 80 µg/L
Figure 3-6 TTHM FP of chlorinated Boonville, MO River water after 24 hr adsorption of
NOM by several activated carbons
0102030405060708090
100
20 40 60 80 100
Pe
rce
nt
Re
du
ctio
n
AC Dose (mg/L)
TTHM FP Reduction
Aqua Nuchar
Fe-AC
Hydrodarco B
CNT
Figure 3-7 TTHM FP of chlorinated Boonville, MO River water percent reduction by
adsorption of NOM on several activated carbons
As shown in Figure 3-8, percentage TTHM from brominated species (BDCM,
CDBM, Bromoform) increased with increasing doses of AC. This is an indication of
little or no adsorption of bromide with the AC used. Fe-AC and CNT had less
pronounced increases in percentage of TTHM brominated, not because they reduced
TTHM and brominated THM, but because they reduced neither to a great extent.
31
02468
101214161820
20 40 60 80 100
TTH
M %
Bro
min
ate
dAC Dose (mg/L)
TTHM %Br
Aqua Nuchar
Fe-AC
Hydrodarco B
CNT
Filtered
Figure 3-8 Percent TTHM from brominated species resulting from reactions with NOM
in Boonville, MO River water after 24 adsorption on several activated carbons
3.3.4 HAA FP
EPA has set a regulatory limit on HAA5 at 60 µg/L. Filtered water contained
HAA5 FP of 75 µg/L. Concentrations below the EPA maximum contaminant level were
achieved by Aqua Nuchar® , Hydrodarco® , and CNT at AC doses of 60 mg/L and
greater. Fe-AC treated water did not contain less than 62 µg/L HAA FP for any dosage.
Lower doses of Fe-AC had HAA formations exceeding those of the filtered water
average. Formation potential is shown in Figure 3-9 and Figure 3-10.
0
10
20
30
40
50
60
70
80
90
20 40 60 80 100
HA
A5
FP
(µ
g/L)
AC Dose (mg/L)
HAA5 FP
Aqua Nuchar
Fe-AC
Hydrodarco B
CNT
Filtered
HAA5 MCL = 60 µg/L
Figure 3-9 HAA FP of chlorinated Boonville, MO River water after 24 hr adsorption of
NOM by several activated carbons
32
0102030405060708090
100
20 40 60 80 100
Pe
rce
nt
Re
du
ctio
nAC Dose (mg/L)
HAA5 FP Reduction
Aqua Nuchar
Fe-AC
Hydrodarco B
CNT
Figure 3-10 HAA FP of chlorinated Boonville, MO River water percent reduction by
adsorption of NOM on several activated carbons
3.3.5 DBP Surrogate Parameters
3.3.5.1 DOC
Dissolved organic carbon represents the quantity of NOM contained in the water.
However, not all NOM is reactive with chlorine. Figure 3-11 shows that TTHM
formation could be predicted by DOC concentration with an R2=0.74. HAA5 formation
could not be predicted as accurately with DOC, having an R2=0.63. For use as a
surrogate, these correlations are likely not great enough.

33
y = 55.851x - 69.86R² = 0.7414
y = 17.339x - 11.407R² = 0.6261
0
50
100
150
200
250
300
0 1 2 3 4 5 6 7
Form
atio
n P
ote
nti
al (
µg/
L)DOC (mg/L)
Formation Potential vs. DOC
TTHM
HAA5
Figure 3-11 Formation potential vs. DOC of Boonville, MO River water after 24 hr
adsorption of NOM on activated carbons
3.3.5.2 UV254
With the exception of Fe-AC samples, UV254 was a good indicator of TTHM FP.
Results are shown in Figure 3-12. Due to the poor correlation directly resulting from Fe-
AC inconsistencies, it has been removed from the data set used to generate Figure 3-13.
Haloacetic acids were predicted poorly by UV254. UV254 is an indication of more HPO,
aromatic molecules in water and therefore, waters with a highly reactive HPI NOM
content will have poor correlation between UV254 and formation potential.
34
0
50
100
150
200
250
0 5 10 15 20 25TT
HM
FP
(µ
g/L)
UV254 (1/m)
TTHM FP vs. UV254
Aqua Nuchar
Fe-AC
Hydrodarco B
CNT
Filtered
Figure 3-12 TTHM FP vs. UV254 of Boonville, MO River water after 24 hr adsorption
on specified materials
y = 12.449x - 13.637R² = 0.8024
y = 3.4595x + 10.47R² = 0.55510
50
100
150
200
250
0 5 10 15 20 25
Form
atio
n P
ote
nti
al (
µg/
L)
UV254 (1/m)
Formation Potential vs. UV254
TTHM
HAA5
Figure 3-13 Formation potential vs. UV254 of Boonville, MO River water excluding Fe-
AC data
3.3.5.3 SUVA
SUVA was a poor indicator of TTHM and HAA5 FP as shown in Figure 3-14.
Removing Fe-AC from the data set did not make a great difference in the model although
it was again the most poorly correlated. Again, as HPO NOM tends to absorb more
ultraviolet light than HPI, UV254 and therefore SUVA is a representation of HPO
content and will in turn tend to have poor correlations with formation if a large fraction of
formation is derived from reactions with HPI content.

35
y = 26.015x + 65.788R² = 0.1024
y = 12.172x + 16.529R² = 0.1924
0
50
100
150
200
250
300
0 1 2 3 4 5 6 7Fo
rmat
ion
Po
ten
tial
(µ
g/L)
SUVA (L/mg-m)
Formation Potential vs. SUVA
TTHM
HAA5
Figure 3-14 Formation potential vs. SUVA of Boonville, MO River water after 24 hr
adsorption of NOM on activated carbons
3.3.5.4 Chlorine Demand
After chlorination, free chlorine was measured in order to assure 1 ± 0.4 mg/L
free chlorine residual (Summers et al., 1996). The difference between the amount of
chlorine added and the final free chlorine before quenching is identified as chlorine
demand (Eq. 2-2). Figure 3-15 shows that chlorine demand was closely related to TTHM
FP. Chlorine demand was less accurate at predicting HAA5 FP. Although chlorine
demand is closely related to formation, it is not likely that the correlation is great enough
to be used as a surrogate on site.

36
y = 39.493x - 5.2862R² = 0.8016
y = 12.236x + 8.6616R² = 0.6875
0
50
100
150
200
250
300
0 1 2 3 4 5 6 7Fo
rmat
ion
Po
ten
tial
(µ
g/L)
Cl2 Demand (mg/L)
Formation Potential vs. Chlorine Demand
TTHM
HAA5
Figure 3-15 Formation potential vs. chlorine demand of Boonville, MO River water after
24 adsorption of NOM on activated carbons
3.4 CONCLUSIONS
Aqua Nuchar® removed the greatest amount of THM and HAA precursors, and
was therefore used for further studies. Fe-AC removed the least DBP precursors possibly
due to Fe blockage of meso and macro pores on the AC surface. Fe-AC and CNT were
used to assess possible new materials for DBP FP removal. As removal by these
materials was poor compared to common AC, they were not studied further.
Iodine adsorption number and surface area were indicators of DOC sorption and
UV254 reduction. UV254 was the most accurate predictor of TTHM and HAA5 FP
which confirms that aromatic moieties contribute greatly to DBP formation. Chlorine
demand was also an indicator of TTHM and HAA5 FP. Chlorine demand and UV254
did not predict HAA5 FP as well as TTHM FP.

37
4 REMOVAL OF DPB FP IN A BENCH SCALE WATER TREATMENT
FACILITY
4.1 INTRODUCTION
The study was conducted to determine if the previous 24 hr adsorption study was
representative of adsorption that may occur in a treatment facility. Aqua Nuchar® as
well as Hydrodarco® were selected as activated carbons with potential for NOM
removal. In addition, given the hypothesis formed in section 3.4, that iodine adsorption
number is related to NOM adsorption and therefore reduced DBP FP, Hawkins Sabre
Series® AC was introduced to the sample set. With data supporting NOM sorption by
phyllosilicates (Kaiser and Zech, 2000; Kahle et al., 2004), greensand was tested for
potential DBP FP reduction. Activated carbons have a greater specific surface area when
compared with greensand and therefore greensand was used at an elevated dosage.
MIEX® was included in this study as a comparison of NOM removal by adsorption and
removal through ion exchange.
38
4.2 MATERIALS AND METHODS
4.2.1 Sampling
A grab sample was obtained August 25, 2010 from Boonville’s pressurized raw
Missouri River water inlet. The sample was stored at 3°C for a less than two weeks prior
to treatment and analysis.
4.2.2 Treatment Materials
Hydrodarco® B (Norit Americas Inc., Marshall, TX) was obtained onsite from
the City of Boonville, MO water treatment plant. At the time of sampling the City of
Boonville used Hydrodarco® as a form of DBP reduction on a seasonal basis. Aqua
Nuchar® was obtained from Meadwestvaco, Richmond, VA. MIEX® resin was
acquired from Orica Watercare, Watkins, CO. Prior to treatment, resin was loaded with
natural NOM and regenerated with brine solution. Hawkins Sabre Series® (CR325AA-
10) was acquired onsite from the City of Marceline, MO water treatment facility. A
summary of the materials’ properties is given in Table 4-1.
Table 4-1 Properties of commercailly available activated carbons and greensand used as
treatment materials in Boonville, MO River water
Material Particle Size
Surface Area
(m^2/g) Iodine Number (mg/g)
Hyrdodarco B 90% <45 µm >500
Aqua Nuchar 90% <45 µm 1200-1600 >900
Hawkins Sabre Series® 90% <45 µm >1000
Greensand ~0.5 mm

39
4.2.3 Treatment
1 L of raw, unfiltered water was mixed in square 2 L containers with an
appropriate quantity of treatment material using a gang stirrer. For samples being treated
with activated carbon, 20 and 60 mg/L doses were used. MIEX® samples were dosed
with 2 or 6 mL/L. Doses were again not chosen to represent Boonville’s facility, but to
investigate NOM removal at high doses of treatment materials. Contact with treatment
materials was intended to model a treatment facility and therefore a 30 min rapid mix
(100 rpm) followed by a 30 min sedimentation period (15 rpm) were used. Water was
not coagulated. Water was then filtered to 0.45 µm in an attempt to model a theoretical
treatment facility’s process train (sedimentation, coagulation, activated carbon treatment,
sedimentation, filtration, disinfection).
4.2.4 DOC Analysis
After filtration, non-purgeable organic carbon was analyzed using a Shimadzu
Total Organic Carbon Analyzer (Shimadzu Corp., Atlana, GA) with an ASI auto-
sampler. Acidification was conducted using 2M hydrochloric acid obtained from Fisher
Scientific, Fair Lawn, NJ.
4.2.5 UV254 Analysis
Filtered water was transferred to a 1 cm3 cuvette via pipette. Absorbance was
measured at a wavelength or 254 nm 10 times using a Varian CARY50Conc UV-visible
light spectrophotometer and averaged.
40
4.2.6 Chlorination
The filtered samples were chlorinated similarly to section 3.2.6 and in accordance
with Summers et al. (1996) to contain 1 mg/L free chlorine after 24 hrs. Free chlorine
was then quenched with NH4Cl to prevent further DBP generation.
4.2.7 THM Analysis
A gas chromatograph (Varian, Model 3800) / mass spectrometer (GC/MS)
(Varian, Saturn 3800) equipped with a Tekmar 3000 purge and trap concentrator was
used for determination of THM concentrations. This process was similar to the Standard
Method for the Examination of Water and Wastewater 6200 B and US EPA Method 524.
4.2.8 Calculations
Chlorine demand was calculated using Eq. 2-2. Percent reduction was calculated
with respect to filtered only water and is represented in Eq. 3-1.
4.3 RESULTS AND DISCUSSION
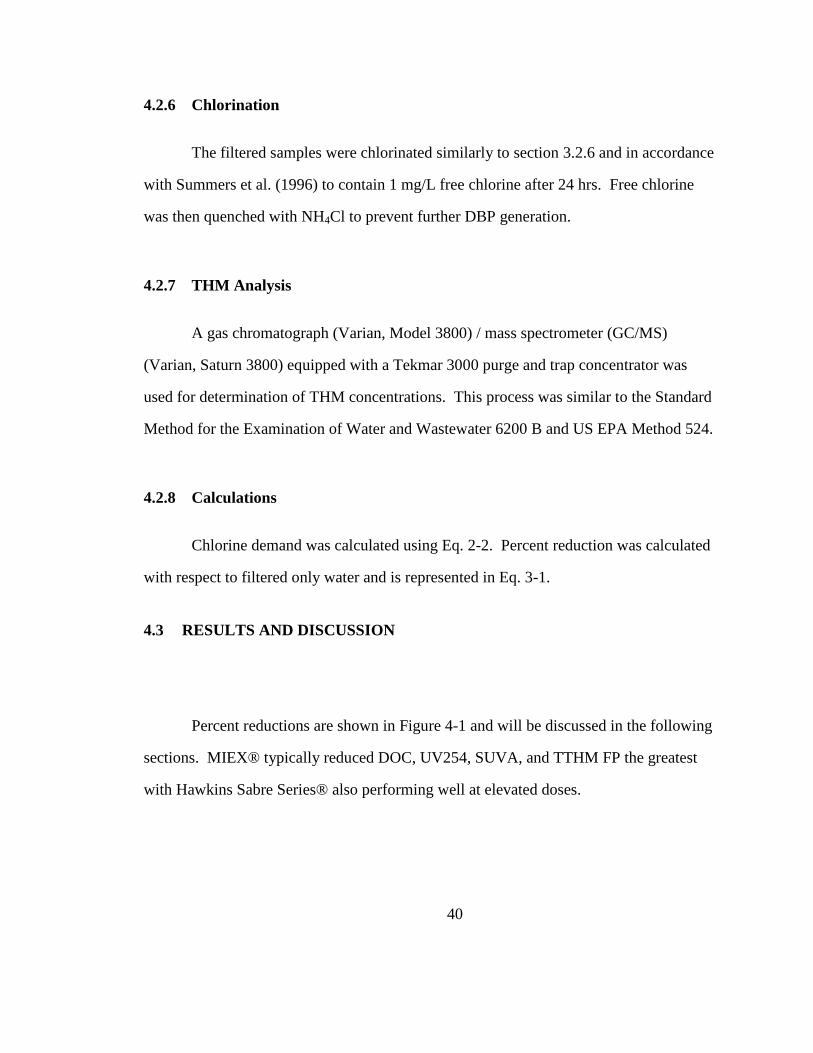
Percent reductions are shown in Figure 4-1 and will be discussed in the following
sections. MIEX® typically reduced DOC, UV254, SUVA, and TTHM FP the greatest
with Hawkins Sabre Series® also performing well at elevated doses.
41
-20
0
20
40
60
80
100
Greensand 20mg/L
Greensand 60mg/L
Greensand 2000mg/L
Hydrodarco B 20mg/L
Hydrodarco B 60mg/L
Aqua Nuchar 20mg/L
Aqua Nuchar 60mg/L
Hawkins 20mg/L
Hawkins 60mg/L
MIEX 2mL/L MIEX 6mL/L
Pe
rce
nt
Re
du
ctio
n
Reductions
DOC
SUVA
UV254
TTHM FP
Figure 4-1 Boonville, MO River DOC, UV254, SUVA, and TTHM FP percent reductions
after greensand, activated carbon, or MIEX® treatment
4.3.1 Characteristics of Filtered Water
Total trihalomethane formation potential of the water after filtration was still
above the EPA regulatory limit of 80 µg/L. The water was again high in DOC, SUVA,
and TTHM FP. This was expected due to the aforementioned temporal trends in DBP
formation (Sec 2.2.4) and the sampling date.
Table 4-2 Filtered Boonville, MO River (Aug. 25, 2010) water characteristics
DOC (mg/L) UV254 (1/m) SUVA (L/mg*m) TTHM FP (µg/L) pH
4.83 15 3 232 8
4.3.2 DOC, UV254 and SUVA
A slight increase (3%-6%) in DOC was found when greensand was used to treat
the water. Again, Aqua Nuchar® performed slightly better than Hydrodarco® for both
doses used. However, Hawkins Sabre Series® outperformed both with a performance

42
increase over Aqua Nuchar® by 5% at a dose of 20 mg/L and 16% at a dose of 60 mg/L.
MIEX® decreased DOC the greatest with reduction up to 57%. Dissolved organic
carbon is shown in Figure 4-2 with percent reductions shown in Figure 4-1.
0
1
2
3
4
5
6
DO
C (m
g/L)
DOC
Figure 4-2 DOC of Boonville, MO River water after greensand, activated carbon, or
MIEX® treatment
Despite an increase in DOC, greensand showed a slight decrease in UV254,
confirming that phyllosilicates do have affinity for adsorption of NOM containing
unsaturated bonds. However, little difference in UV254 reduction between doses of 20
mg/L and 2000 mg/L indicates that greensand may be extremely selective in its sorption.
Hydrodarco®, Aqua Nuchar® and Hawkins were similar in performance with Hawkins
reductions being only slightly greater. UV254 similarities in conjunction with DOC
variations for Hawkins and Aqua Nuchar® AC indicate that some of the adsorbed DOC
may have been nonaromatic carbon.
Hawkins AC performance increase agrees with Section 3.3.2 regarding iodine
adsorption number and surface area as an indicator of UV254 and DOC reduction.
MIEX® reduced SUVA the greatest (74%). Figure 4-3 shows UV254 results with
percent reduction in Figure 4-1. Figure 4-4 shows SUVA results with percent reduction

43
again in Figure 4-1. The reduction in both SUVA and UV254 by activated carbons and
MIEX® indicates the removal of highly aromatic, HPO NOM. However, UV254 and
SUVA give little indication of HPI NOM content.
02468
1012141618
UV
25
4 (1
/m)
UV254
Figure 4-3 UV254 of Boonville, MO River water after greensand, activated carbon, or
MIEX® treatment
00.5
11.5
22.5
33.5
SUV
A (L
/mg-
m)
SUVA
Figure 4-4 SUVA of Boonville, MO River water after greensand, activated carbon, or
MIEX® treatment
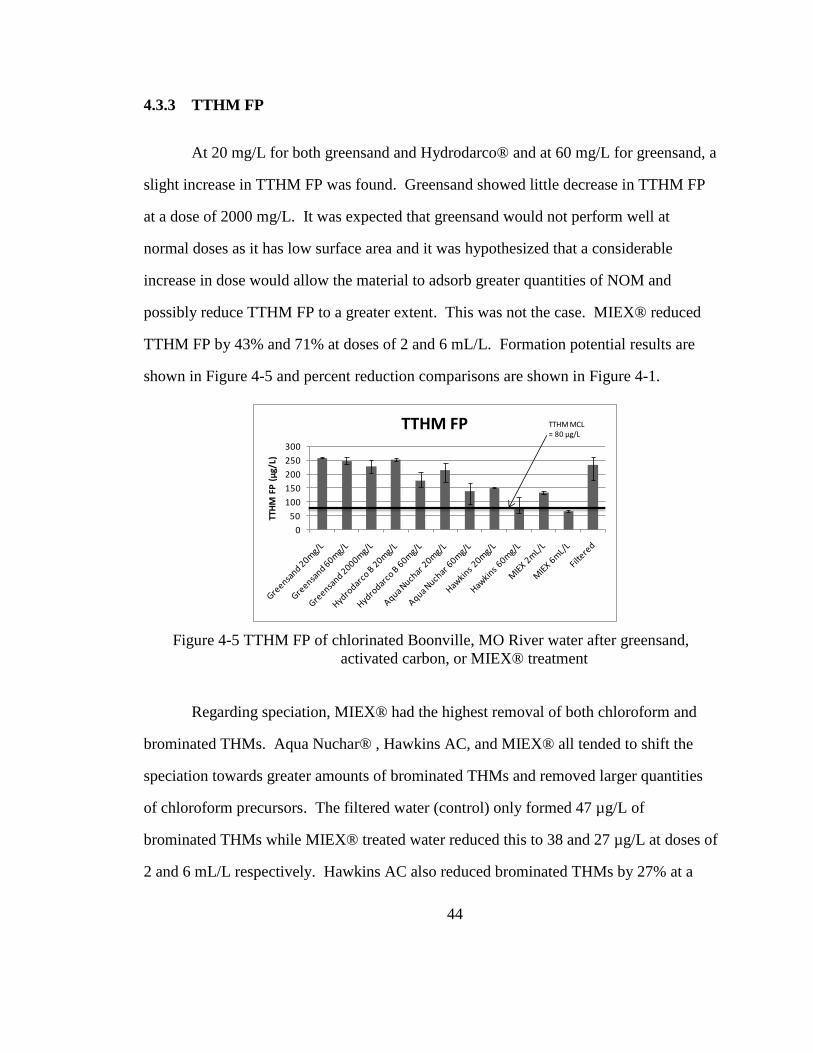
44
4.3.3 TTHM FP
At 20 mg/L for both greensand and Hydrodarco® and at 60 mg/L for greensand, a
slight increase in TTHM FP was found. Greensand showed little decrease in TTHM FP
at a dose of 2000 mg/L. It was expected that greensand would not perform well at
normal doses as it has low surface area and it was hypothesized that a considerable
increase in dose would allow the material to adsorb greater quantities of NOM and
possibly reduce TTHM FP to a greater extent. This was not the case. MIEX® reduced
TTHM FP by 43% and 71% at doses of 2 and 6 mL/L. Formation potential results are
shown in Figure 4-5 and percent reduction comparisons are shown in Figure 4-1.
0
50
100
150
200
250
300
TTH
M F
P (
µg/
L)
TTHM FP TTHM MCL = 80 µg/L
Figure 4-5 TTHM FP of chlorinated Boonville, MO River water after greensand,
activated carbon, or MIEX® treatment
Regarding speciation, MIEX® had the highest removal of both chloroform and
brominated THMs. Aqua Nuchar® , Hawkins AC, and MIEX® all tended to shift the
speciation towards greater amounts of brominated THMs and removed larger quantities
of chloroform precursors. The filtered water (control) only formed 47 µg/L of
brominated THMs while MIEX® treated water reduced this to 38 and 27 µg/L at doses of
2 and 6 mL/L respectively. Hawkins AC also reduced brominated THMs by 27% at a

45
dose of 60 mg/L. The reduction of brominated THMs indicates bromide removal with
MIEX® and agrees with literature (Singer and Bilyk, 2002; Boyer and Singer, 2005).
Speciation is shown in Figure 4-6 and Figure 4-7.
0%
10%
20%
30%
40%
50%
60%
70%
80%
90%
100%
Pe
rce
nt
of
TTH
M
Percentage of TTHM FP from Brominated Species
%Brominated
%Chloroform
Figure 4-6 Percent of TTHM FP of Boonville, MO River water from chlorinated and
brominated THM species after greensand, activated carbon, or MIEX®
treatment

46
-20
0
20
40
60
80
100
Pe
rce
nt
Re
du
ctio
n
Percentage of Chloroform and Brominated Species Reduction
Chloroform
Brominated Species
Figure 4-7 Percent reduction of chlorinated and brominated THM species resulting from
reactions with Boonville, MO River NOM after treatment with greensand,
activated carbon, or MIEX®
4.3.4 DBP Surrogate Parameters Post Treatment
4.3.4.1 DOC
Dissolved organic carbon reductions closely mirrored TTHM FP. Approximately
8% of DOC removal was non-THM producing for Hawkins AC and MIEX®. The
relationship was not as clear for Aqua Nuchar® but it does appear that the majority of
DOC removed was THM forming in nature. The association between Hydrodarco® and
DOC reduction was unclear due to an increase in TTHM FP in the 20 mg/L dose.
Correlation is shown in Figure 4-8. Slope of the linear fit was within 6% of results found
in Section 3.3.5.1.

47
y = 59.632x - 54.665R² = 0.8104
0
50
100
150
200
250
300
0 1 2 3 4 5 6TT
HM
FP
(µ
g/L)
DOC (mg/L)
TTHM FP vs. DOC
Figure 4-8 TTHM FP vs. DOC of Boonville, MO River water after greensand, activated
carbon, or MIEX® treatment
4.3.4.2 UV254
Correlation between UV254 and TTHM FP reduction for all ACs studies was
minimal. UV254 reduction was always higher than TTHM FP reduction but to different
extents. This indicates that although MIEX®, Hydrodarco®, Hawkins Sabre Series®,
and Aqua Nuchar® all reduced TTHM FP, the mechanism was through different NOM
fraction removal. MIEX® removed more aromatic THM forming NOM than the
activated carbons. Correlation is shown in Figure 4-9. Slope of the fit is within 7% of
Section 3.3.5.2 and suggests a consistent formation of TTHM with regard to aromatic
moieties from Boonville water and implies that UV254 may have potential as a TTHM
surrogate.
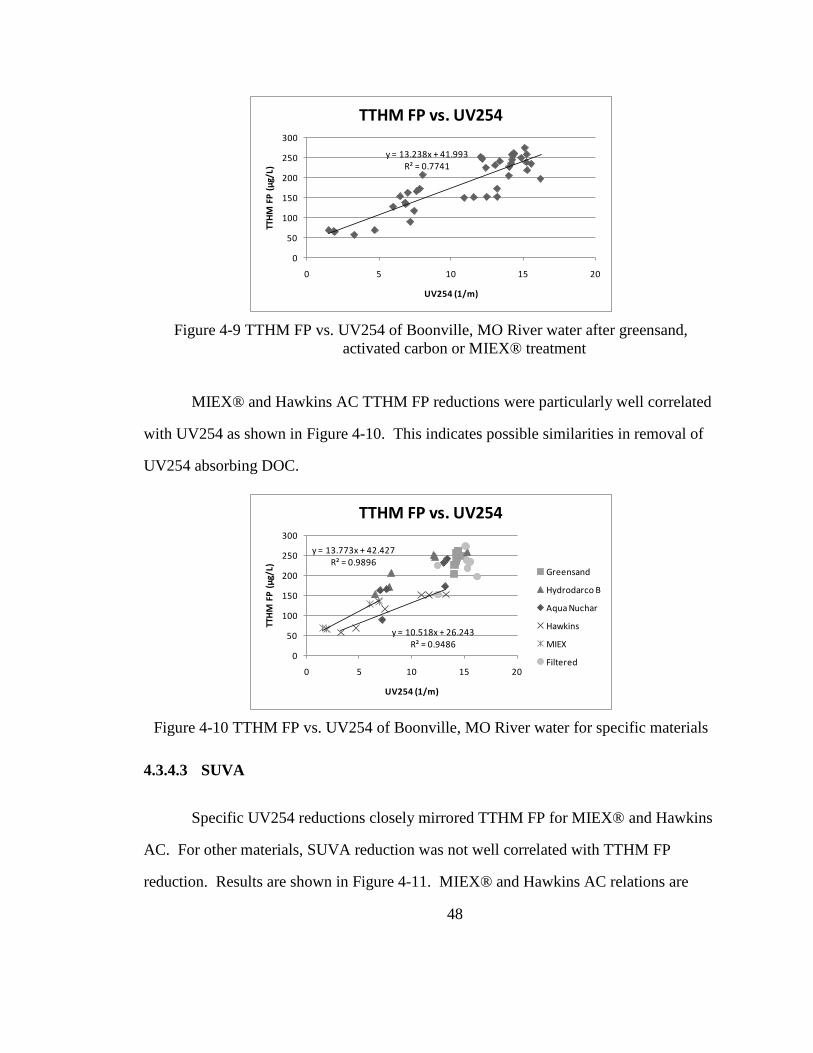
48
y = 13.238x + 41.993R² = 0.7741
0
50
100
150
200
250
300
0 5 10 15 20TT
HM
FP
(µ
g/L)
UV254 (1/m)
TTHM FP vs. UV254
Figure 4-9 TTHM FP vs. UV254 of Boonville, MO River water after greensand,
activated carbon or MIEX® treatment
MIEX® and Hawkins AC TTHM FP reductions were particularly well correlated
with UV254 as shown in Figure 4-10. This indicates possible similarities in removal of
UV254 absorbing DOC.
y = 10.518x + 26.243R² = 0.9486
y = 13.773x + 42.427R² = 0.9896
0
50
100
150
200
250
300
0 5 10 15 20
TTH
M F
P (
µg/
L)
UV254 (1/m)
TTHM FP vs. UV254
Greensand
Hydrodarco B
Aqua Nuchar
Hawkins
MIEX
Filtered
Figure 4-10 TTHM FP vs. UV254 of Boonville, MO River water for specific materials
4.3.4.3 SUVA
Specific UV254 reductions closely mirrored TTHM FP for MIEX® and Hawkins
AC. For other materials, SUVA reduction was not well correlated with TTHM FP
reduction. Results are shown in Figure 4-11. MIEX® and Hawkins AC relations are
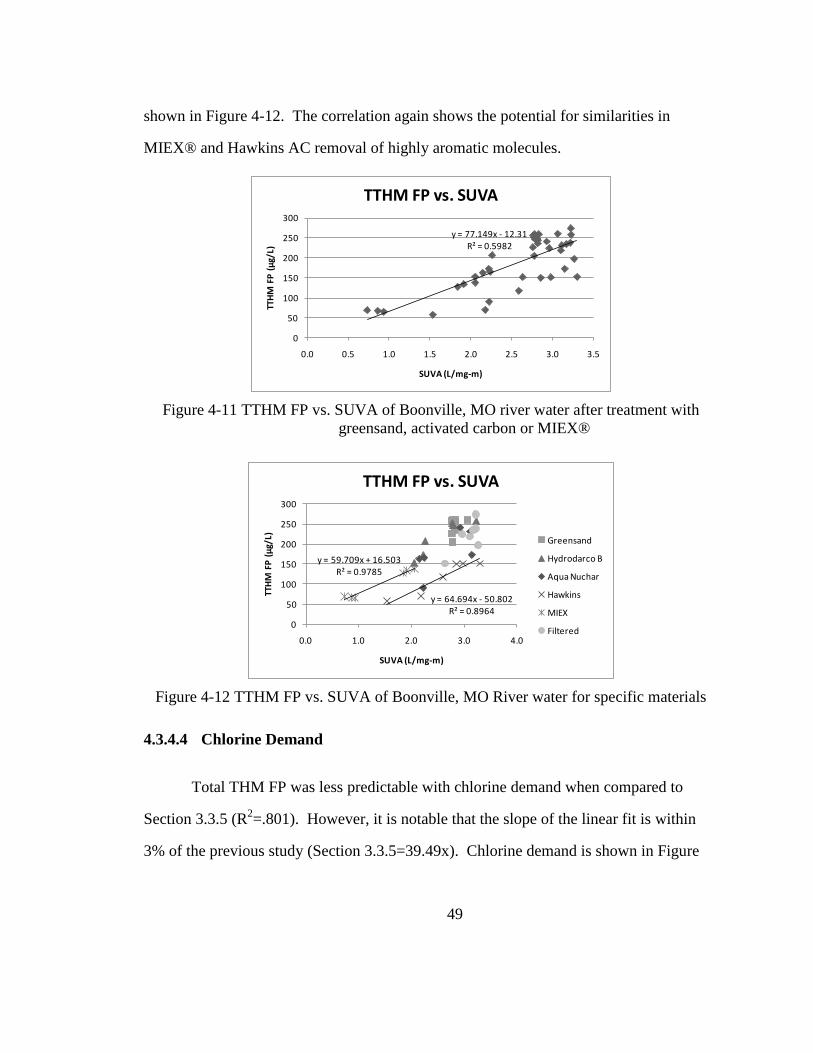
49
shown in Figure 4-12. The correlation again shows the potential for similarities in
MIEX® and Hawkins AC removal of highly aromatic molecules.
y = 77.149x - 12.31R² = 0.5982
0
50
100
150
200
250
300
0.0 0.5 1.0 1.5 2.0 2.5 3.0 3.5
TTH
M F
P (
µg/
L)
SUVA (L/mg-m)
TTHM FP vs. SUVA
Figure 4-11 TTHM FP vs. SUVA of Boonville, MO river water after treatment with
greensand, activated carbon or MIEX®
y = 64.694x - 50.802R² = 0.8964
y = 59.709x + 16.503R² = 0.9785
0
50
100
150
200
250
300
0.0 1.0 2.0 3.0 4.0
TTH
M F
P (
µg/
L)
SUVA (L/mg-m)
TTHM FP vs. SUVA
Greensand
Hydrodarco B
Aqua Nuchar
Hawkins
MIEX
Filtered
Figure 4-12 TTHM FP vs. SUVA of Boonville, MO River water for specific materials
4.3.4.4 Chlorine Demand
Total THM FP was less predictable with chlorine demand when compared to
Section 3.3.5 (R2=.801). However, it is notable that the slope of the linear fit is within
3% of the previous study (Section 3.3.5=39.49x). Chlorine demand is shown in Figure

50
4-13. As correlation is inconsistent temporally, it is an unlikely candidate as a DBP
surrogate.
y = 38.175x - 26.738R² = 0.6705
0
50
100
150
200
250
300
0 1 2 3 4 5 6 7 8
TTH
M F
P (
µg/
L)
Cl2 Demand (mg/L)
TTHM FP vs. Chlorine Demand
Figure 4-13 TTHM FP vs. chlorine demand of Boonville, MO River water after
greensand, activated carbon, or MIEX® treatment
4.4 CONCLUSIONS
Greensand was an unlikely candidate for THM precursor removal. This was
possibly due to reduced surface area and therefore reduced adsorption sites for NOM.
Reduction of SUVA was not a good indicator for TTHM FP reduction for Aqua Nuchar®
and Hydrodarco® but correlated well for Hawkins AC as well as MIEX®. Hawkins AC
reduced SUVA more than it reduced TTHM FP while Aqua Nuchar® reduced TTHM FP
more than it reduced SUVA. Activated carbons, although similar in structure and
makeup, performed considerably different from one another and different from MIEX®,
which reduced SUVA and TTHM FP equally. Reductions in brominated species were
found, but, in general, they were reduced less than chloroform. This was again expected
as bromide is difficult to remove from water.

51
Chlorine demand and UV254 had the greatest correlation with TTHM FP.
Specific surface area and iodine adsorption number were confirmed to be good indicators
of TTHM reduction potential.

52
5 NOM FRACTIONATION
5.1 INTRODUCTION
Natural organic matter is an extremely complex heterogeneous material made up
of hydrophilic acids, humic substances, proteins, lipids, carboxylic acids,
polysaccharides, amino acids, and hydrocarbons (Wei et al., 2008). Given the diverse
nature of NOM and therefore complicated removal processes, there is interest in
fractionation and subsequent analysis of DBP precursors. Generally, more aromatic,
more hydrophobic matter is removed through ion exchange and adsorption (Tipping,
1981; Gu et al., 1994; Humbert et al., 2005; Hyung and Kim, 2008; Wei et al., 2008). In
order to provide more efficient treatment, it is important to know which fraction of NOM
creates DBPs.
Hawkins AC was selected as an activated carbon as it had the greatest potential
for DBP FP reduction based on a Section 4.3.3. MIEX® was selected as an ion exchange
resin due to its previously demonstrated capacity for brominated species reduction and
affinity for NOM sorption.

53
5.2 MATERIALS AND METHODS
5.2.1 Sampling
Raw water was grab sampled from Boonville, MO water treatment facility’s
pressurized inlet on October 22, 2010. Water was transferred immediately to a
refrigerator at the University of Missouri and stored at 3°C. All glassware used was
detergent cleaned, DI rinsed, chlorinated for 24 hrs, DI rinsed again, and air dried at
300°C before use.
5.2.2 Treatment Materials
Hawkins Sabre Series® (CR325AA-10) AC was obtained onsite from the City of
Marceline, MO water treatment facility. MIEX® was obtained from Orica Watercare,
Watkins, CO. MIEX® resin was loaded with NOM and regenerated with brine before
use. Hawkins AC was used as a virgin material.
5.2.3 Treatment
Within 2 weeks of sampling, 1 L of raw, unfiltered water was mixed in square 2 L
containers with an appropriate quantity of treatment material using a gang stirrer. An
attempt was made (based on previous initial results) to match DOC removal from
MIEX® and Hawkins AC so THM/HAA species removal could be directly compared.
The appropriate doses were selected to be 5 mL/L and 60mg/L for settled MIEX® resin
and Hawkins AC, respectively.
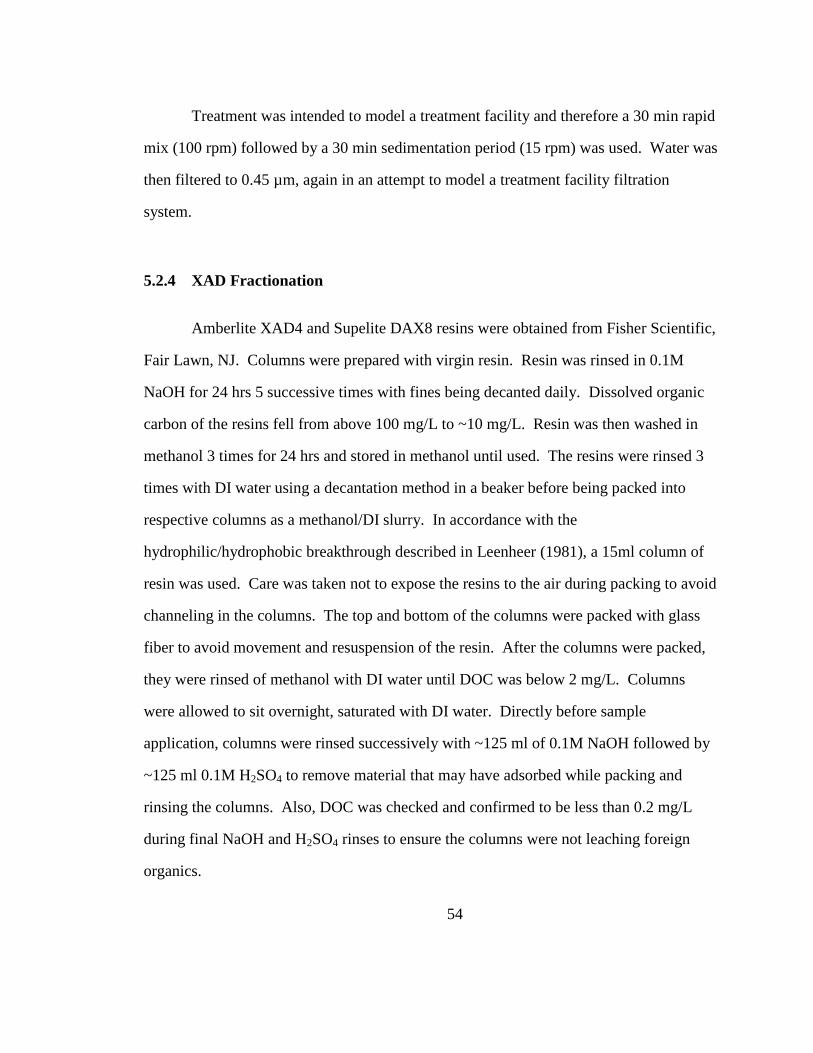
54
Treatment was intended to model a treatment facility and therefore a 30 min rapid
mix (100 rpm) followed by a 30 min sedimentation period (15 rpm) was used. Water was
then filtered to 0.45 µm, again in an attempt to model a treatment facility filtration
system.
5.2.4 XAD Fractionation
Amberlite XAD4 and Supelite DAX8 resins were obtained from Fisher Scientific,
Fair Lawn, NJ. Columns were prepared with virgin resin. Resin was rinsed in 0.1M
NaOH for 24 hrs 5 successive times with fines being decanted daily. Dissolved organic
carbon of the resins fell from above 100 mg/L to ~10 mg/L. Resin was then washed in
methanol 3 times for 24 hrs and stored in methanol until used. The resins were rinsed 3
times with DI water using a decantation method in a beaker before being packed into
respective columns as a methanol/DI slurry. In accordance with the
hydrophilic/hydrophobic breakthrough described in Leenheer (1981), a 15ml column of
resin was used. Care was taken not to expose the resins to the air during packing to avoid
channeling in the columns. The top and bottom of the columns were packed with glass
fiber to avoid movement and resuspension of the resin. After the columns were packed,
they were rinsed of methanol with DI water until DOC was below 2 mg/L. Columns
were allowed to sit overnight, saturated with DI water. Directly before sample
application, columns were rinsed successively with ~125 ml of 0.1M NaOH followed by
~125 ml 0.1M H2SO4 to remove material that may have adsorbed while packing and
rinsing the columns. Also, DOC was checked and confirmed to be less than 0.2 mg/L
during final NaOH and H2SO4 rinses to ensure the columns were not leaching foreign
organics.
55
After acid/base rinsing, the columns were loaded with filtered or treated and
filtered water that had been adjusted to pH 2 with 2M H2SO4. All samples were
fractionated in triplicate. Water was allowed to gravity flow at a rate of 6-15 bed
volumes per hour first through the column packed with DAX8 to adsorb strongly HPO
NOM and then through the column packed with XAD4 to adsorb weakly HPO NOM.
The strongly HPO fraction will be referred to henceforth as simply the HPO fraction
while the weakly HPO will be referred to as transphilic (TPI). The hydrophilic (HPI)
NOM fraction passes the columns. Both HPO and TPI were back flush eluted
individually at 5 bed volumes per hour with approximately 10 bed volumes of 0.1M
NaOH. The eluate from the backflush was collected and diluted with Millipore water,
then adjusted to natural pH with 2M and 0.1M H2SO4. The HPI fraction was first
analyzed for DOC before being adjusted to natural pH.
5.2.5 DOC Analysis
Immediately after fractionation, non-purgeable organic carbon was analyzed
using a Shimadzu Total Organic Carbon Analyzer (Shimadzu Corp., Atlana, GA) with an
ASI auto-sampler. Acidification was required only if the sample was from the HPO or
TPI fractions and was conducted using 2M hydrochloric acid obtained from Fisher
Scientific, Fair Lawn, NJ.
In an effort to exceed the instrument’s lowest level of detection, both HPO and
TPI samples were analyzed at double concentration meaning that they were only diluted
back to half original sample volume. Results were then divided by two. As HPI samples
require no dilution due to the procedure, it was required that these be analyzed at normal
concentrations. In general, concentrations of all analytes are to be compared with the

56
same fraction of other samples and not across fractions. In other words, HPO and TPI
concentrations are to be compared only with another sample’s HPO or TPI concentration,
as the analysis methods are consistent, but not with HPI concentrations.
In previous backwash processes, it was important to use NaOH that had been
exposed to the air as little as possible in all the required steps if the sample was to be
analyzed for DOC due to the hygroscopic properties of NaOH and dissatisfactory purging
of inorganic carbon by the instrument.
5.2.6 UV254 Analysis
Fractionated water was transferred to a 1 cm3 cuvette via pipette. Absorbance
was measured at a wavelength or 254 nm 10 times using a Varian CARY50Conc UV-
visible light spectrophotometer and averaged.
5.2.7 Chlorination
Chlorination was completed in accordance with Summers et. al (1996). A sodium
hypochlorite dosing solution (about 2,000 mg/L) was made from 13% active chlorine
(sodium hypochlorite) stock solution and buffered at pH 8 with 0.01M KH2PO4.
An appropriate amount of sodium hypochlorite dosing solution to generate 1 ±0.4
mg/L free chlorine was added and the bottle was capped and inverted ten times. The
reactions were performed in headspace free amber colored glass bottles during a 24 hr
period in the absence of light. Chlorine was quenched with 4.4 mg NH4Cl in DI water.
57
5.2.8 THM Analysis
A gas chromatograph (Varian, Model 3800) / mass spectrometer (GC/MS)
(Varian, Saturn 3800) equipped with a Tekmar 3000 purge and trap concentrator was
used for determination of THM concentrations. This process was similar to the Standard
Method for the Examination of Water and Wastewater 6200 B and US EPA Method 524.
5.2.9 HAA Analysis
For determination of HAA concentration, a method involving liquid/liquid
extraction and derivatization similar to Standard Method for Examination of Water and
Wastewater 6521 and US EPA Method 552.2 was used. At an acidic pH, methyl tertiary-
butyl ether (MTBE) was used to extract non-dissociated acidic compounds. Sodium
sulfate was added to increase extraction efficiency as a salting agent. A 10% v/v solution
of sulfuric acid with methanol was added to produce methyl ester derivatives that could
be separated chromatographically (Varian, Model 3800).
5.2.10 Calculations
Chlorine demand was calculated using Eq. 2-2. Percent reduction was calculated
with respect to filtered only water and is represented in Eq. 3-1.
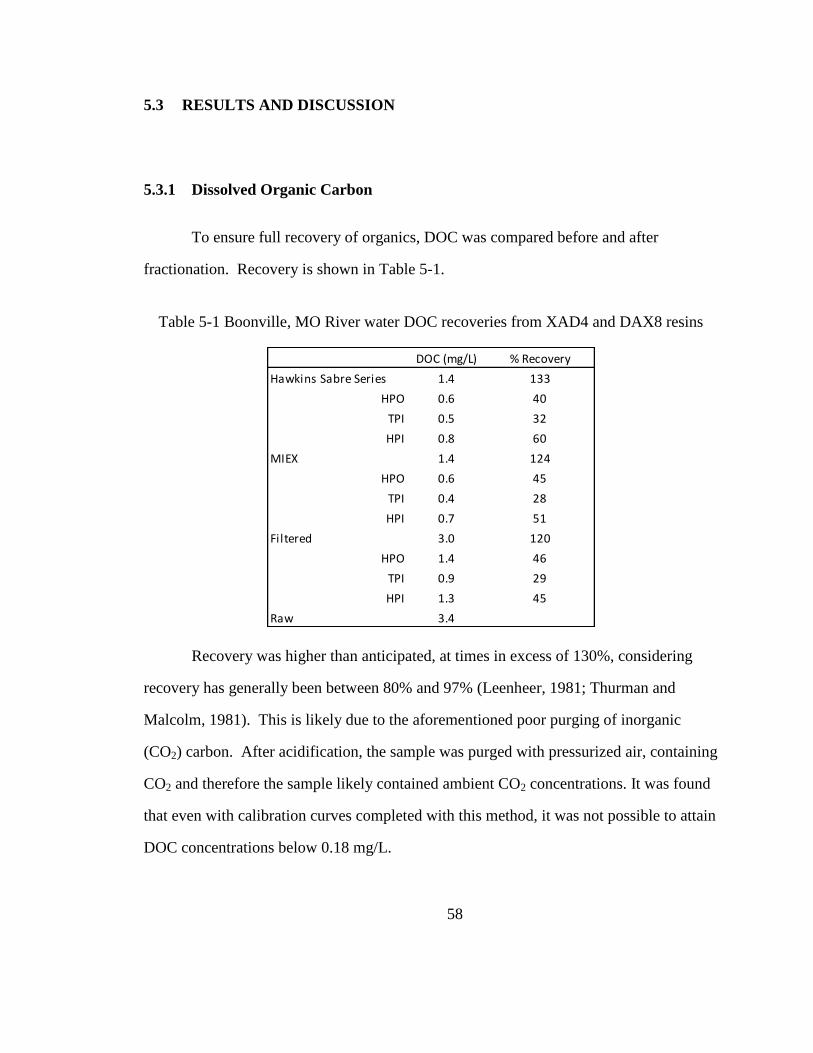
58
5.3 RESULTS AND DISCUSSION
5.3.1 Dissolved Organic Carbon
To ensure full recovery of organics, DOC was compared before and after
fractionation. Recovery is shown in Table 5-1.
Table 5-1 Boonville, MO River water DOC recoveries from XAD4 and DAX8 resins
DOC (mg/L) % Recovery
Hawkins Sabre Series 1.4 133
HPO 0.6 40
TPI 0.5 32
HPI 0.8 60
MIEX 1.4 124
HPO 0.6 45
TPI 0.4 28
HPI 0.7 51
Filtered 3.0 120
HPO 1.4 46
TPI 0.9 29
HPI 1.3 45
Raw 3.4
Recovery was higher than anticipated, at times in excess of 130%, considering
recovery has generally been between 80% and 97% (Leenheer, 1981; Thurman and
Malcolm, 1981). This is likely due to the aforementioned poor purging of inorganic
(CO2) carbon. After acidification, the sample was purged with pressurized air, containing
CO2 and therefore the sample likely contained ambient CO2 concentrations. It was found
that even with calibration curves completed with this method, it was not possible to attain
DOC concentrations below 0.18 mg/L.
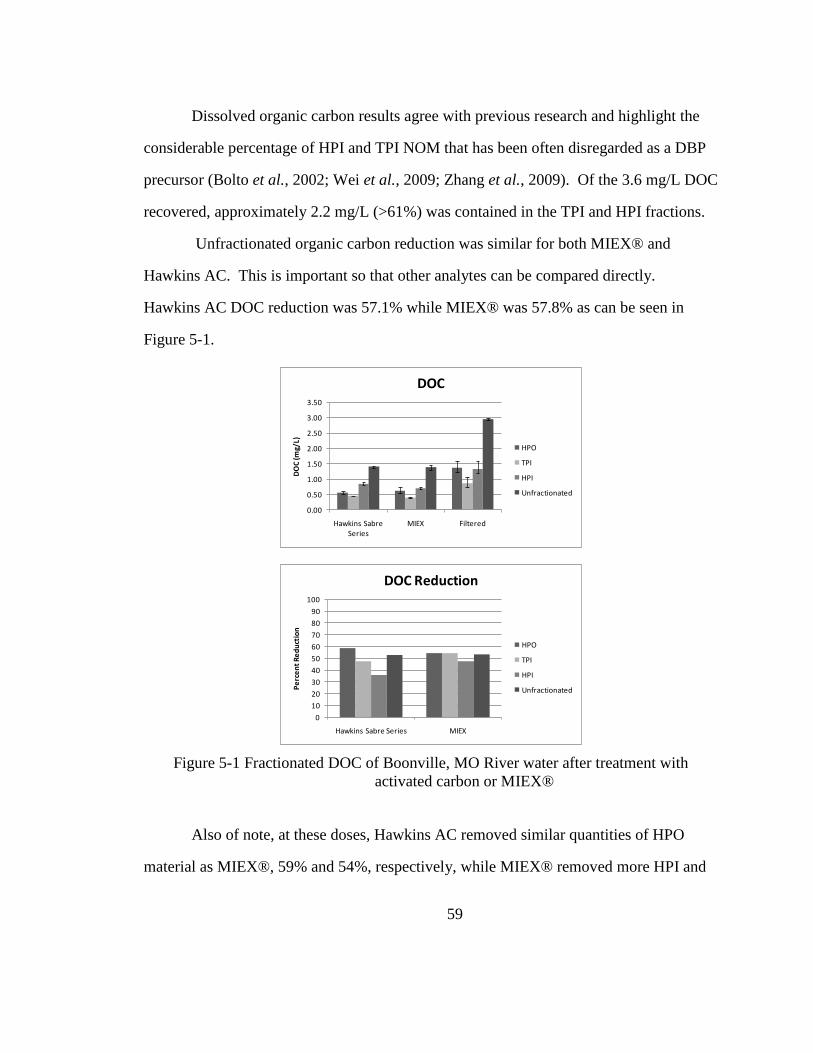
59
Dissolved organic carbon results agree with previous research and highlight the
considerable percentage of HPI and TPI NOM that has been often disregarded as a DBP
precursor (Bolto et al., 2002; Wei et al., 2009; Zhang et al., 2009). Of the 3.6 mg/L DOC
recovered, approximately 2.2 mg/L (>61%) was contained in the TPI and HPI fractions.
Unfractionated organic carbon reduction was similar for both MIEX® and
Hawkins AC. This is important so that other analytes can be compared directly.
Hawkins AC DOC reduction was 57.1% while MIEX® was 57.8% as can be seen in
Figure 5-1.
0.00
0.50
1.00
1.50
2.00
2.50
3.00
3.50
Hawkins Sabre Series
MIEX Filtered
DO
C (m
g/L)
DOC
HPO
TPI
HPI
Unfractionated
0
10
20
30
40
50
60
70
80
90
100
Hawkins Sabre Series MIEX
Pe
rce
nt
Re
du
ctio
n
DOC Reduction
HPO
TPI
HPI
Unfractionated
Figure 5-1 Fractionated DOC of Boonville, MO River water after treatment with
activated carbon or MIEX®
Also of note, at these doses, Hawkins AC removed similar quantities of HPO
material as MIEX®, 59% and 54%, respectively, while MIEX® removed more HPI and

60
TPI material than AC. This is in support of previous literature that concludes that AC,
primarily kinetically governed by adsorption, removes less HPI material, or material that
is inherently attracted to polar water molecules (Wei et al., 2009). MIEX® removed all
fractions similarly.
5.3.2 TTHM and HAA FP
Figure 5-2 shows DBP formations. MIEX® and Hawkins AC have similar
reductions in formation potential in the HPO fraction indicating similar removal of HPO
precursors. The greatest difference between treatment efficacies was a 29% difference in
reduction of TTHM FP in the HPI fraction (Hawkins AC, 21%; MIEX®, 50%) shown in
Figure 5-3. MIEX® has been shown previously to reduce HPI DOC (Boyer and Singer,
2005) but it had not been previously shown that this DOC reduction directly translates to
a reduction in TTHM formed from the HPI fraction.

61
0
10
20
30
40
50
Hawkins Sabre Series
MIEX Filtered
TTH
M F
P (
µg/
L)
TTHM FP
HPO
TPI
HPI
0
10
20
30
40
50
Hawkins Sabre Series
MIEX Filtered
HA
A5
FP
(µ
g/L)
HAA5 FP
HPO
TPI
HPI
Figure 5-2 Disinfection by-product formation potentials resulting from reactions with
fractionated NOM in chlorinated Boonville, MO River water after treatment
with activated carbon or MIEX®
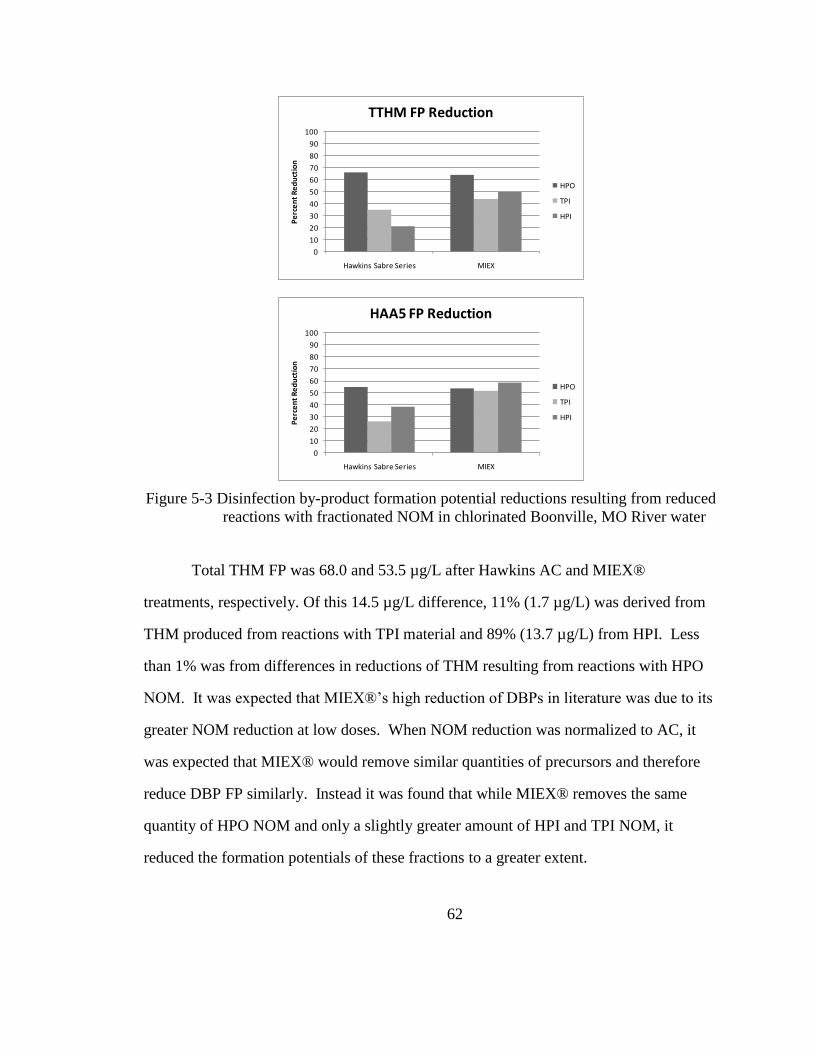
62
0
10
20
30
40
50
60
70
80
90
100
Hawkins Sabre Series MIEX
Pe
rce
nt
Re
du
ctio
n
TTHM FP Reduction
HPO
TPI
HPI
0
10
20
30
40
50
60
70
80
90
100
Hawkins Sabre Series MIEX
Pe
rce
nt
Re
du
ctio
n
HAA5 FP Reduction
HPO
TPI
HPI
Figure 5-3 Disinfection by-product formation potential reductions resulting from reduced
reactions with fractionated NOM in chlorinated Boonville, MO River water
Total THM FP was 68.0 and 53.5 µg/L after Hawkins AC and MIEX®
treatments, respectively. Of this 14.5 µg/L difference, 11% (1.7 µg/L) was derived from
THM produced from reactions with TPI material and 89% (13.7 µg/L) from HPI. Less
than 1% was from differences in reductions of THM resulting from reactions with HPO
NOM. It was expected that MIEX®’s high reduction of DBPs in literature was due to its
greater NOM reduction at low doses. When NOM reduction was normalized to AC, it
was expected that MIEX® would remove similar quantities of precursors and therefore
reduce DBP FP similarly. Instead it was found that while MIEX® removes the same
quantity of HPO NOM and only a slightly greater amount of HPI and TPI NOM, it
reduced the formation potentials of these fractions to a greater extent.
63
Reductions in HAA5 FP from MIEX® were also pronounced. Formation from
the TPI and HPI fractions was reduced 26% and 20% greater, respectively, after MIEX®
treatment than with Hawkins AC. MIEX® showed little preference for hydrophobicity
of HAA5 precursors while Hawkins AC again preferred HPO precursors.
Total HAA5 FP was 49.6 and 37.7 µg/L after Hawkins AC and MIEX ®
treatments respectively. Of this 11.9 µg/L difference, 37.5% (4.5 µg/L) was provided by
the difference in reactions with TPI material and 64% (7.7 µg/L) by HPI. Haloacetic acid
forming reactions with HPO NOM increased with MIEX® although not to a great
enough extent to warrant discussion other than to clarify the aforementioned greater than
100% reductions. With similar reductions in total DOC, it was again expected that
reductions in HAA5 FP would be similar for treatment materials. This was incorrect as
MIEX® targeted HAA5 forming organics while Hawkins AC appeared to partially
adsorb nonreactive NOM.
Much of the unexpected reductions in formation potential with little reduction in
corresponding NOM are explained by poor correlation between HPI/TPI DOC and
formation potential as shown in Figure 5-4. This was particularly evident in THM
forming HPI and TPI material. Data were used from all waters; MIEX® treated,
Hawkins AC treated, and filtered only.

64
FP = 32.239HPO + 0.679R² = 0.8034
FP = 15.919TPI + 4.8759R² = 0.5216
FP = 26.233HPI + 9.7555R² = 0.3946
0
10
20
30
40
50
60
0.00 0.50 1.00 1.50 2.00
Form
atio
n P
ote
nti
al (
µg/
L)
DOC (mg/L)
TTHM FP vs. DOC
HPO
TPI
HPI
FP = 16.391HPO + 3.7048R² = 0.8882
FP = 21.089TPI + 1.6682R² = 0.7849
FP = 30.082HPI - 3.462R² = 0.7461
0
10
20
30
40
50
60
0.00 0.50 1.00 1.50 2.00
Form
atio
n P
ote
nti
al (
µg/
L)
DOC (mg/L)
HAA5 FP vs. DOC
HPO
TPI
HPI
Figure 5-4 Formation potential resulting from NOM fractions vs. DOC in fractions of
Boonville, MO River water
Figure 5-5 shows brominated species from reactions with specific NOM fractions.
As expected, the HPI fraction has the greatest quantity of brominated THM. Due to the
affinity of polar water molecules for ionic species such as bromide, adsorption by
nonionic resins is low and therefore, bromide passes the columns almost entirely.
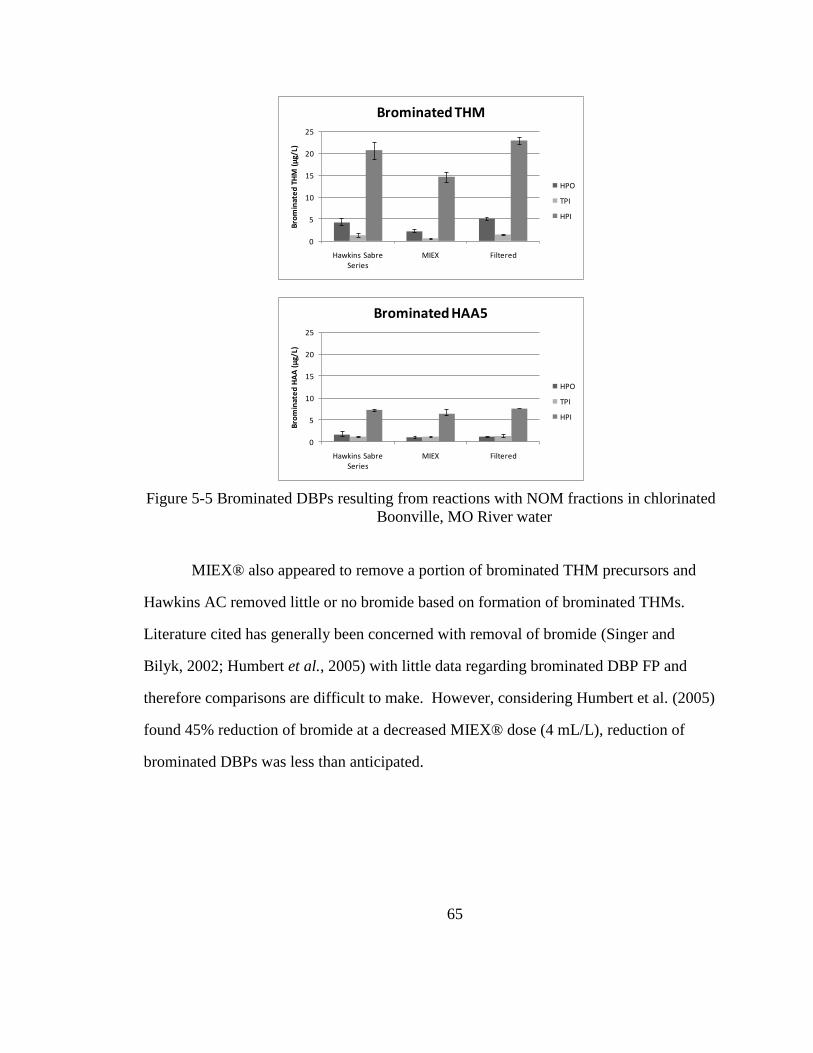
65
0
5
10
15
20
25
Hawkins Sabre Series
MIEX Filtered
Bro
min
ate
d T
HM
(µ
g/L)
Brominated THM
HPO
TPI
HPI
0
5
10
15
20
25
Hawkins Sabre Series
MIEX Filtered
Bro
min
ate
d H
AA
(µ
g/L)
Brominated HAA5
HPO
TPI
HPI
Figure 5-5 Brominated DBPs resulting from reactions with NOM fractions in chlorinated
Boonville, MO River water
MIEX® also appeared to remove a portion of brominated THM precursors and
Hawkins AC removed little or no bromide based on formation of brominated THMs.
Literature cited has generally been concerned with removal of bromide (Singer and
Bilyk, 2002; Humbert et al., 2005) with little data regarding brominated DBP FP and
therefore comparisons are difficult to make. However, considering Humbert et al. (2005)
found 45% reduction of bromide at a decreased MIEX® dose (4 mL/L), reduction of
brominated DBPs was less than anticipated.
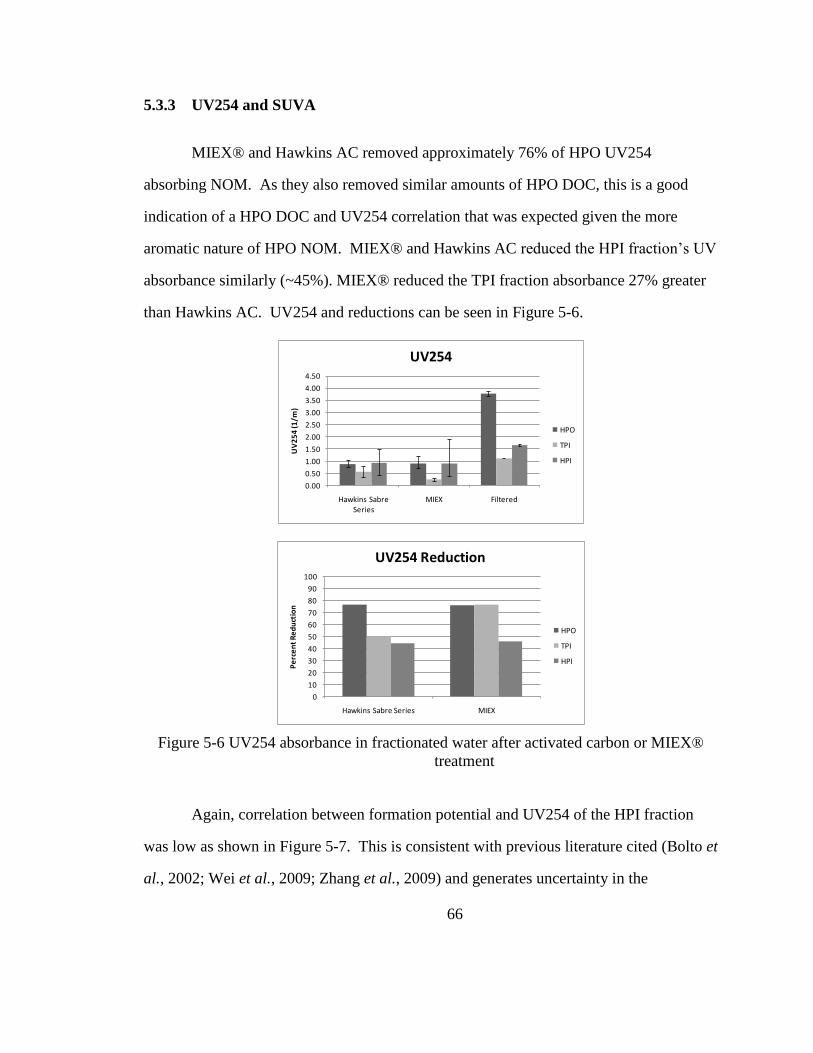
66
5.3.3 UV254 and SUVA
MIEX® and Hawkins AC removed approximately 76% of HPO UV254
absorbing NOM. As they also removed similar amounts of HPO DOC, this is a good
indication of a HPO DOC and UV254 correlation that was expected given the more
aromatic nature of HPO NOM. MIEX® and Hawkins AC reduced the HPI fraction’s UV
absorbance similarly (~45%). MIEX® reduced the TPI fraction absorbance 27% greater
than Hawkins AC. UV254 and reductions can be seen in Figure 5-6.
0.00
0.50
1.00
1.50
2.00
2.50
3.00
3.50
4.00
4.50
Hawkins Sabre Series
MIEX Filtered
UV
25
4 (1
/m)
UV254
HPO
TPI
HPI
0
10
20
30
40
50
60
70
80
90
100
Hawkins Sabre Series MIEX
Pe
rce
nt
Re
du
ctio
n
UV254 Reduction
HPO
TPI
HPI
Figure 5-6 UV254 absorbance in fractionated water after activated carbon or MIEX®
treatment
Again, correlation between formation potential and UV254 of the HPI fraction
was low as shown in Figure 5-7. This is consistent with previous literature cited (Bolto et
al., 2002; Wei et al., 2009; Zhang et al., 2009) and generates uncertainty in the
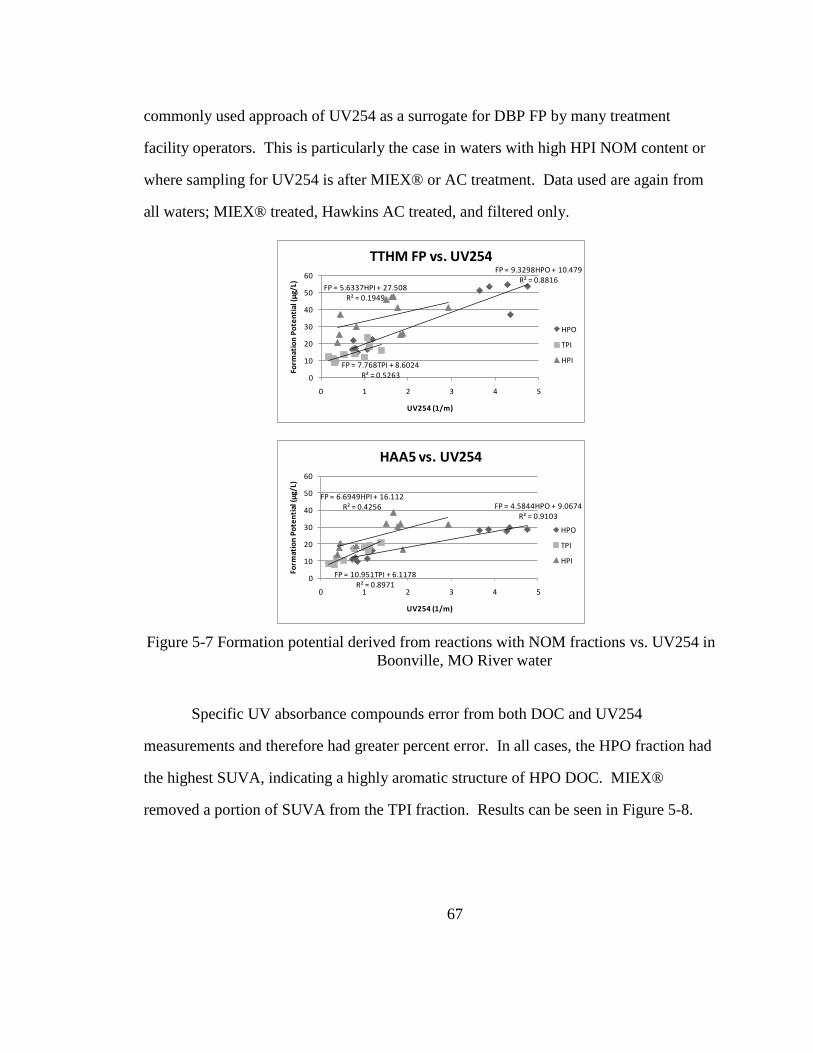
67
commonly used approach of UV254 as a surrogate for DBP FP by many treatment
facility operators. This is particularly the case in waters with high HPI NOM content or
where sampling for UV254 is after MIEX® or AC treatment. Data used are again from
all waters; MIEX® treated, Hawkins AC treated, and filtered only.
FP = 9.3298HPO + 10.479R² = 0.8816
FP = 7.768TPI + 8.6024R² = 0.5263
FP = 5.6337HPI + 27.508R² = 0.1949
0
10
20
30
40
50
60
0 1 2 3 4 5
Form
atio
n P
ote
nti
al (
µg/
L)
UV254 (1/m)
TTHM FP vs. UV254
HPO
TPI
HPI
FP = 4.5844HPO + 9.0674R² = 0.9103
FP = 10.951TPI + 6.1178R² = 0.8971
FP = 6.6949HPI + 16.112R² = 0.4256
0
10
20
30
40
50
60
0 1 2 3 4 5
Form
atio
n P
ote
nti
al (
µg/
L)
UV254 (1/m)
HAA5 vs. UV254
HPO
TPI
HPI
Figure 5-7 Formation potential derived from reactions with NOM fractions vs. UV254 in
Boonville, MO River water
Specific UV absorbance compounds error from both DOC and UV254
measurements and therefore had greater percent error. In all cases, the HPO fraction had
the highest SUVA, indicating a highly aromatic structure of HPO DOC. MIEX®
removed a portion of SUVA from the TPI fraction. Results can be seen in Figure 5-8.

68
0.00
0.50
1.00
1.50
2.00
2.50
3.00
3.50
Hawkins Sabre Series
MIEX Filtered
SUV
A (L
/mg*
m)
SUVA
HPO
TPI
HPI
Figure 5-8 SUVA of Boonville, MO River water by NOM fraction after activated carbon
and MIEX® treatment
5.4 CONCLUSIONS
When bulk DOC reductions were the same, Hawkins AC and MIEX® performed
differently as DBP treatments. MIEX® and Hawkins AC reduced DOC, UV254, SUVA,
TTHM FP and HAA5 FP in the HPO fraction similarly. This was expected as HPO
material is inherently easily adsorbed onto AC. MIEX® reduced the DOC in the HPI
fraction slightly greater than Hawkins AC, but reduced TTHM FP and HAA5 FP to a
greater extent. This demonstrates the preferential affinity of MIEX® not only for HPI
material but specifically for DBP forming HPI material. Much of the resin’s superior
DBP FP reduction over Hawkins AC was due to its greater removal of HPI and TPI
precursors, not bulk NOM.
Brominated DBPs were found for the most part in the HPI fraction. This was
expected due to the difficulty of removing a bromide ion from highly polar water
molecules. MIEX® reduced brominated DBP formations greater than Hawkins AC but
to a lesser extent than anticipated.
69
6 RECOMMENDATIONS AND OPPORTUNITIES FOR FUTURE RESEARCH
All studies were conducted without regard for coagulation processes that are used
in Boonville and around the world. All results and conclusions should be confirmed at
bench scale with the aid of coagulation/flocculation before significant changes in a
treatment process are planned.
A change in the AC used for treatment is generally not considered significant and
therefore it is recommended that Boonville, MO water treatment facility discontinue use
of Hydrodarco® and begin use of Hawkins Sabre Series®. Although carbon doses were
not selected with regard to Boonville, MO, Hawkins AC reduced DBP FP to a greater
extent than the currently used Hydrodarco® at all doses and will therefore likely reduce
DBP FP at Boonville. This is also one of the simplest means of confirming that results
translate to a full scale system with coagulation.
Bromide reduction should be investigated as some brominated species reduction
could be found from both Hawkins AC and MIEX®. These studies should be conducted
at Boonville during a period when brominated DBP species formation is above 90 µg/L
or conducted at a different site altogether. Also, brominated HAA formation should be
investigated more thoroughly.
Although SUVA has been shown to be a good indicator of DBP FP in past
studies, it is not accurate in these studies. This is likely due to the incorporation of AC
and MIEX® treated samples (HPI and TPI DOC reduction without UV254 reduction) in
the correlation studies. Therefore, SUVA should not be used as an indicator of change in

70
DBP FP before and after treatment but only for an initial analysis of formation potential
of raw water if at all.
In addition, SUVA is thought to be a measure of reactivity of DOC. This assumes
that most of the DOC that generates DBPs is aromatic and HPO in nature. The lack of
good correlation can be explained at least partially by the great contribution of TPI and
HPI DOC to DBP FP.
Furthermore, as UV254 and SUVA are often used as predictors of DBP FP, it
should be noted that this is highly dependent on treatment process and seasonality. As
DOC diminishes in the fall and winter, UV254 becomes extremely low as error in SUVA
measurement becomes large. However, this is generally not a concern for Boonville and
several other treatment facilities as they are in compliance by a considerable amount for
these seasons.
Of great importance regarding UV254 is the method of treatment used by the
facility. Accuracy as a predictor of DBP FP is reduced for similar reasons as SUVA in
that UV254 absorption is a measure of aromatic, unsaturated bonds. The compounds
containing these bonds are largely HPO in nature and therefore the correlation between
UV254 and DBP FP is weak when HPI and TPI fractions of DOC are large, specifically
after treatment with an AC.
Finally, iodine adsorption number is somewhat indicative of DOC adsorption and
DBP FP reduction. A study with several ACs should be conducted and the usefulness of
this parameter assessed using several different source waters containing many types of
NOM.
71
7 REFERENCES
Adams, C., T. Timmons, T. Seitz, J. Lane and S. Levotch, 2005. Trihalomethane and
haloacetic acid disinfection by-products in full-scale drinking water systems.
Journal of Environmental Engineering, 131(4): 526-534.
Anderson, C.T. and W.J. Maier, 1979. Trace organics removal by anion exchange resins.
Journal American Water Works Association, 71(5): 278-283.
Antonelli, M., V. Mezzanotte and C. Nurizzo, 2008. Wastewater disinfection by uv
irradiation: Short and long-term efficiency. Environmental Engineering Science,
25(3): 363.
Baker, A. and R.G.M. Spencer, 2004. Characterization of dissolved organic matter from
source to sea using fluorescence and absorbance spectroscopy. Science of The
Total Environment, 333(1-3): 217-232.
Bolto, B., D. Dixon, R. Eldridge, S. King and K. Linge, 2002. Removal of natural organic
matter by ion exchange. Water Research, 36(20): 5057-5065.
Bourke, M. and M. Arias, 2009. Ion exchange for nom removal prior to membranes.
Available from
http://www.miexresin.com/files/publishedPapers/MembranePretreatment_WhiteP
aper.pdf.
Boyer, T.H. and P.C. Singer, 2005. Bench-scale testing of a magnetic ion exchange resin
for removal of disinfection by-product precursors. Water Research, 39(7): 1265-
1276.
Bull, R.J., L. Birnbaum, K.P. Cantor, J.B. Rose, B.E. Butterworth, R.E.X. Pegram and J.
Tuomisto, 1995. Water chlorination: Essential process or cancer hazard?
Toxicological Sciences, 28(2): 155.
Bull, R.J., I.M. Sanchez, M.A. Nelson, J.L. Larson and A.J. Lansing, 1990. Liver tumor
induction in b6c3f1 mice by dichloroacetate and trichloroacetate. Toxicology,
63(3): 341-359.
Burns, N., J. Neemann, R. Hulsey, A.C. Fonseca, I. Singh and R. Pante, 2008. Synergistic
evaluation of ozone and uv at the coquitlam source for enhanced dbp control and
cryptosporidium inactivation. Ozone: Science & Engineering, 30(1): 3-12.
Cantor, K.P., C.F. Lynch, M.E. Hildesheim, M. Dosemeci, J. Lubin, M. Alavanja and G.
Craun, 1998. Drinking water source and chlorination byproducts i. Risk of
bladder cancer. Epidemiology, 9(1): 21-28.
Cantor, K.P., C.R. Lynch, M.E. Hildesheim, M. Dosemeci, J. Lubin, M. Alavanja and G.
Craun, 1999. Drinking water source and chlorination byproducts in iowa, iii. Risk
of brain cancer. Am. J. Epidemiol., 150(6): 552-560.
72
Carlson, R.M., R.E. Carlson, H.L. Kopperman and R. Caple, 1975. Facile incorporation
of chlorine into aromatic systems during aqueous chlorination processes.
Environmental Science & Technology, 9(7): 674-675.
Chapra, S. and R. Canale, 1997. Empirical models for disinfection by-products in lakes
and reservoirs. Journal of Environmental Engineering, 123: 714.
Chen, C., X.-j. Zhang, L.-x. Zhu, J. Liu, W.-j. He and H.-d. Han, 2008. Disinfection by-
products and their precursors in a water treatment plant in north china: Seasonal
changes and fraction analysis. Science of The Total Environment, 397(1-3): 140-
147.
Cheng, J., 2007. Occurrence and modeling of thms and haa formation in drinking water
[electronic resource]. University of Missouri-Columbia.
Cook, D., C. Chow and M. Drikas, 2001. Laboratory study of conventional alum
treatment versus miex treatment for removal of natural organic matter.
Croue, J., D. Violleau and L. Labouyrie, 2000. Disinfection by-product formation
potentials of hydrophobic and hydrophilic natural organic matter fractions: A
comparison between a low-and a high-humic water. ACS Publications: pp: 139-
153.
Croue, J.P., D. Violleau, B. Legube and C. Bodaire, 1999. Removal of hydrophobic and
hydrophilic constituents by anion exchange resin. Water Science and Technology,
40(9): 207-214.
Dunnick, J.K., J.K. Haseman, H.S. Lilja and S. Wyand, 1985. Toxicity and
carcinogenicity of chlorodibromomethane in fischer 344/n rats and b6c3f1 mice.
Toxicol. Sci., 5(6part1): 1128-1136.
Dunnick, J.K. and R.L. Melnick, 1993. Assessment of the carcinogenic potential of
chlorinated water: Experimental studies of chlorine, chloramine, and
trihalomethanes. Journal of the National Cancer Institute, 85(10): 817.
Edzwald, J.K., W.C. Becker and W. K.L, 1985. Surrogate parameters for monitoring
organic matter and thm precursors. Journal American Water Works Association,
7(4).
Eschenbrenner, A.B., 1945. Induction of hepatomas in mice by repeated oral
administration of chloroform, with observations of sex differences. J. Natl. Cancer
Inst., 5: 251-255.
Eschenbrenner, A.B. and E. Miller, 1946. Liver necrosis and the induction of carbon
tetrachloride hepatomas in strain a mice. J. Natl. Cancer Inst., 6: 352-341.
Fram, M., R. Fujii, J. Weishaar, B. Bergamaschi and G. Aiken, 1999. How doc
composition may explain the poor correlation between specific trihalomethane
formation potential and specific uv absorbance. Water Resources Investigations
Report: WRI: 99-4018.
Gang, D., T.E. Clevenger and S.K. Banerji, 2003. Relationship of chlorine decay and
thms formation to nom size. Journal of hazardous materials, 96(1): 1-12.
Genz, A., B. Baumgarten, M. Goernitz and M. Jekel, 2008. Nom removal by adsorption
onto granular ferric hydroxide: Equilibrium, kinetics, filter and regeneration
studies. Water Research, 42(1-2): 238-248.
73
Gu, B., J. Schmitt, Z. Chen, L. Liang and J.F. McCarthy, 1994. Adsorption and
desorption of natural organic matter on iron oxide: Mechanisms and models.
Environmental Science & Technology, 28(1): 38-46.
Gu, Z., J. Fang and B. Deng, 2005. Preparation and evaluation of gac-based iron-
containing adsorbents for arsenic removal. Environmental Science & Technology,
39(10): 3833-3843.
Hamm, E. and M. Bourke, 2001. Application of magnetized anion exchange resin for
removal of doc at coldiron watkins memorial water treatment plant in danville,
ky. pp: 11-15.
Hildesheim, M.E., K.P. Cantor, C.F. Lynch, M. Dosemeci, J. Lubin, M. Alavanja and G.
Craun, 1998. Drinking water source and chlorination byproducts ii. Risk of colon
and rectal cancers. Epidemiology, 9(1): 29-35.
Hua, G., D.A. Reckhow and J. Kim, 2006. Effect of bromide and iodide ions on the
formation and speciation of disinfection byproducts during chlorination.
Environmental Science & Technology, 40(9): 3050-3056.
Humbert, H., H. Gallard, H. Suty and J.-P. Croué, 2005. Performance of selected anion
exchange resins for the treatment of a high doc content surface water. Water
Research, 39(9): 1699-1708.
Hyung, H. and J.-H. Kim, 2008. Natural organic matter (nom) adsorption to multi-walled
carbon nanotubes: Effect of nom characteristics and water quality parameters.
Environmental Science & Technology, 42(12): 4416-4421.
Jacangelo, J.G., J. Demarco, D.M. Owen and S.J. Randtke, 1995. Selected processes for
removing nom : An overview. American Water Works Association, Denver, CO,
ETATS-UNIS.
James, F.H., O. Tsutomu, H. Zhongqi, C.W. Honeycutt and D.B. Dail, 2007. Influence of
decomposition on chemical properties of plant- and manure-derived dissolved
organic matter and sorption to goethite. Journal of Environmental Quality, 36(1):
135.
Kahle, M., M. Kleber and R. Jahn, 2004. Retention of dissolved organic matter by
phyllosilicate and soil clay fractions in relation to mineral properties. Organic
Geochemistry, 35(3): 269-276.
Kaiser, K. and W. Zech, 2000. Dissolved organic matter sorption by mineral constituents
of subsoil clay fractions. Journal of Plant Nutrition and Soil Science, 163(5): 531.
King, W.D. and L.D. Marrett, 1996. Case-control study of bladder cancer and
chlorination by-products in treated water (ontario, canada). Cancer Causes and
Control, 7(6): 596-604.
Kitis, M., T. Karanfil, J. Kilduff and A. Wigton, 2001. The reactivity of natural organic
matter to disinfection by-products formation and its relation to specific ultraviolet
absorbance. Water science and technology: a journal of the International
Association on Water Pollution Research, 43(2): 9.
Klimenko, N., L. Savchina, T. Polyakova and I. Kozyatnik, 2009. Adsorption-catalytic
removal of fulvic acids on activated carbons in the presence of hydrogen
peroxide. Journal of Water Chemistry and Technology, 31(2): 92-97.

74
Krasner, S.W., M.J. McGuire and J.J. Jacongelo, 1989. The occurrence of disinfection
by-products in us drinking water. J.AWWA., 81(8): 41.
Leenheer, J.A., 1981. Comprehensive approach to preparative isolation and fractionation
of dissolved organic carbon from natural waters and wastewaters. Environmental
Science & Technology, 15(5): 578-587.
Liang, L. and P.C. Singer, 2003. Factors influencing the formation and relative
distribution of haloacetic acids and trihalomethanes in drinking water.
Environmental Science & Technology, 37(13): 2920-2928.
Liberti, L., M. Notarnicola and D. Petruzzelli, 2003. Advanced treatment for municipal
wastewater reuse in agriculture. Uv disinfection: Parasite removal and by-product
formation. Desalination, 152(1-3): 315-324.
Lykins, B.W., R.M. Clark and J.Q. Adams, 1988. Granular activated carbon for
controlling thms. Journal American Water Works Association, 80(5): 85-92.
McGeehin, M.A., 1993. Case-control study of bladder cancer and water disinfection
methods in colorado. American Journal of Epidemiology, 138(7): 492.
Meier, M., K. Namjesnik-Dejanovic, P.A. Maurice, Y.-P. Chin and G.R. Aiken, 1999.
Fractionation of aquatic natural organic matter upon sorption to goethite and
kaolinite. Chemical Geology, 157(3-4): 275-284.
MO DNR, 2010. http://www.dnr.mo.gov/DWW/
Morris, R.D., A.M. Audet, I.F. Angelillo, T.C. Chalmers and F. Mosteller, 1992.
Chlorination, chlorination by-products, and cancer: A meta-analysis. Am J Public
Health, 82(7): 955-963.
Muellner, M.G., E.D. Wagner, K. McCalla, S.D. Richardson, Y.-T. Woo and M.J. Plewa,
2006. Haloacetonitriles vs. Regulated haloacetic acids:€‰ are nitrogen-
containing dbps more toxic? Environmental Science & Technology, 41(2): 645-
651.
Muñoz, I., A. Rodríguez, R. Rosal and A.R. Fernández-Alba, 2009. Life cycle assessment
of urban wastewater reuse with ozonation as tertiary treatment: A focus on
toxicity-related impacts. Science of The Total Environment, 407(4): 1245-1256.
Najm, I., N. Patania, J. Jacangelo and S. Krasner, 1994. Evaluating surrogates for
disinfection by-products. Journal of the American Water Works
Association;(United States), 86(6).
National Cancer Institute, 1976. Report on the carcinogenesis bioassay of chloroform. In:
(CAS No. 67-66-3).
National Toxicology Program, 1987. Toxicity and carcinogenicity of
bromodichloromethane in f344/n rats and b6c3f1 mice. In: (Cas No. 75-27-4).
National Toxicology Program, 1989. Ntp toxicology and carcinogenesis studies of
tribromomethane (bromoform) in f344/n rats and b6c3f1 mice (gavage studies).
In: (CAS No. 75-25-2).
Nikolaou, A.D. and T.D. Lekkas, 2001. The role of natural organic matter during
formation of chlorination by-products: A review. Acta hydrochimica et
hydrobiologica, 29(2-3): 63-77.

75
Pelekani, C., M. Drikas and D. Bursill, 2001. Application of direct filtration to miex®
treated river murray water. pp: 1-4.
Rathbun, R., 1996. Regression equations for disinfection by-products for the mississippi,
ohio and missouri rivers. Science of The Total Environment, 191(3): 235-244.
Reckhow, D.A., 1984. Organic halide formation and the use of pre-ozonation and alum
coagulation to control organic halide precursors (chloroform, fulvic acid, tox).
Reckhow, D.A., P.L.S. Rees and D. Bryan, 2004. Watershed sources of disinfection
byproduct precursors. Water Science and Technology, 4: 61-69.
Reckhow, D.A., P.C. Singer and R.L. Malcolm, 1990. Chlorination of humic materials:
Byproduct formation and chemical interpretations. Environmental Science &
Technology, 24(11): 1655-1664.
Richardson, S.D., A.D. Thruston, T.V. Caughran, P.H. Chen, T.W. Collette, T.L. Floyd,
K.M. Schenck, B.W. Lykins, G.-r. Sun and G. Majetich, 1999. Identification of
new drinking water disinfection byproducts formed in the presence of bromide.
Environmental Science & Technology, 33(19): 3378-3383.
Rodriguez, M.J., J.-B. Serodes, P. Levallois and F. Proulx, 2007. Chlorinated disinfection
by-products in drinking water according to source, treatment, season, and
distribution location. Journal of Environmental Engineering & Science, 6(4): 355-
365.
Rose, L.J., E.W. Rice, L. Hodges, A. Peterson and M.J. Arduino, 2007. Monochloramine
inactivation of bacterial select agents. Appl. Environ. Microbiol., 73(10): 3437-
3439.
Shorney, H.L., 1998. Disinfection by-product precursor removal by enhanced softening
and coagulation. University of Kansas.
Singer, P.C., J.J. Barry, G.M. Palen and A.E. Scrivner, 1981. Trihalomethane formation
in north carolina drinking waters. Journal American Water Works Association,
73(8).
Singer, P.C. and K. Bilyk, 2002. Enhanced coagulation using a magnetic ion exchange
resin. Water Research, 36(16): 4009-4022.
Sohn, J., D. Gatel and G. Amy, 2001. Monitoring and modeling of disinfection by-
products (dbps). Environmental Monitoring and Assessment, 70(1-2): 211.
Speth, T.F. and R.J. Miltner, 1990. Adsorption capacity of gac for synthetic organics.
Jaournal American Water Works Association, 82(2): 72-75.
Stepczuk, C., A. Martin, P. Longabucco, J. Bloomfield and S. Effler, 1998a.
Allochthonous contributions of thm precursors to a eutrophic reservoir. Lake and
Reservoir Management, 14(2): 344-355.
Stepczuk, C., E. Owens, S. Effler, M. Auer and J. Bloomfield, 1998b. A modeling
analysis of thm precursors for a eutrophic reservoir. Lake and Reservoir
Management, 14(2): 367-378.
Summers, R.S., S.M. Hooper, H.M. Shukairy, G. Solarik and D. Owen, 1996. Assessing
dbp yield: Uniform formation conditions. Journal American Water Works
Association, 88(6): 80-93.
76
Thurman, E.M. and R.L. Malcolm, 1981. Preparative isolation of aquatic humic
substances. Environmental Science & Technology, 15(4): 463-466.
Tipping, E., 1981. The adsorption of aquatic humic substances by iron oxides.
Geochimica et Cosmochimica Acta, 45(2): 191-199.
Tung, H.-h., 2004. Haloacetic acids removal by biologically active carbon.
U.S. EPA, 2006. National primary drinking water regulations: Stage 2 disinfectants and
disinfection byproducts rule Fed. Regist. 71 pp: 388-492.
Villanueva, C.M., M. Kogevinas and J.O. Grimalt, 2003. Haloacetic acids and
trihalomethanes in finished drinking waters from heterogeneous sources. Water
Research, 37(4): 953-958.
Waller, K., S.H. Swan, G. DeLorenze and B. Hopkins, 1998. Trihalomethanes in drinking
water and spontaneous abortion. Epidemiology, 9(2): 134-140.
Wei, L.-l., Q.-l. Zhao, S. Xue and T. Jia, 2008. Removal and transformation of dissolved
organic matter in secondary effluent during granular activated carbon treatment.
Journal of Zhejiang University - Science A, 9(7): 994-1003.
Wei, L.L., Q.L. Zhao, S. Xue, C.C. Chang, F. Tang, G.L. Liang and T. Jia, 2009.
Reduction of trihalomethane precursors of dissolved organic matter in the
secondary effluent by advanced treatment processes. Journal of Hazardous
Materials, 169(1-3): 1012-1021.
Weishaar, J.L., G.R. Aiken, B.A. Bergamaschi, M.S. Fram, R. Fujii and K. Mopper,
2003. Evaluation of specific ultraviolet absorbance as an indicator of the chemical
composition and reactivity of dissolved organic carbon. Environmental Science &
Technology, 37(20): 4702-4708.
White, D., D. Garland, J. Narr and C. Woolard, 2003. Natural organic matter and dbp
formation potential in alaskan water supplies. Water Research, 37(4): 939-947.
Williams, D.T., F.M. Benoit and G.L. Lebel, 1998. Trends in levels of disinfection by-
products. Environmetrics, 9(5): 555-563.
Wu, W.W.-S., 1998. The effect of structural characteristics of humic substances on
disinfection by-product formation.
Wulff, L.M., 2011. Personal Communication.
Ye, B., W. Wang, L. Yang, J. Wei and X. E, 2009. Factors influencing disinfection by-
products formation in drinking water of six cities in china. Journal of Hazardous
Materials, 171(1-3): 147-152.
Yujung, C., L. Chi-Wang and M.B. Mark, 1997. Iron oxide--coated media for nom
sorption and particulate filtration. American Water Works Association. Journal,
89(5): 100.
Zhang, H., J. Qu, H. Liu and X. Zhao, 2009. Characterization of isolated fractions of
dissolved organic matter from sewage treatment plant and the related disinfection
by-products formation potential. Journal of Hazardous Materials, 164(2-3): 1433-
1438.