remote sensing of environment -...
TRANSCRIPT
Remote Sensing of Environment 115 (2011) 281–297
Contents lists available at ScienceDirect
Remote Sensing of Environment
j ourna l homepage: www.e lsev ie r.com/ locate / rse
Review
The photochemical reflectance index (PRI) and the remote sensing of leaf, canopyand ecosystem radiation use efficienciesA review and meta-analysis
Martín F. Garbulsky a,b, Josep Peñuelas a,⁎, John Gamon c, Yoshio Inoue d, Iolanda Filella a
a Global Ecology Unit, CREAF, CEAB, CSIC, Center for Ecological Research and Forestry Applications, Universitat Autònoma de Barcelona, 08193 Bellaterra, Catalunya, Spainb Faculty of Agronomy, Universidad de Buenos Aires, C1417DSE, Buenos Aires, Argentinac Departments of Earth & Atmospheric Sciences & Biological Sciences, University of Alberta, Edmonton T6G 2E3, Alberta, Canadad National Institute for Agro-Environmental Sciences (NIAES) Tsukuba, Ibaraki 305-8604, Japan
Abbreviations: MODIS, MODerate resolution Imaginactive radiation absorbed by the vegetation; APAR, absovegetation index; PRI, photochemical reflectance index;⁎ Corresponding author. Tel.: +34 935812199; fax +
E-mail address: [email protected] (J. Peñuelas
0034-4257/$ – see front matter © 2010 Elsevier Inc. Aldoi:10.1016/j.rse.2010.08.023
a b s t r a c t
a r t i c l e i n f oArticle history:Received 13 March 2010Received in revised form 24 August 2010Accepted 28 August 2010
Keywords:Radiation use efficiencyGross primary productivityPhotochemical reflectance indexMODIS
Traditional remote sensing techniques allow the assessment of green plant biomass, and therefore plantphotosynthetic capacity. However, detecting how much of this capacity is actually realized is a morechallenging goal. Is it possible to remotely assess actual carbon fluxes? Can this be done at leaf, canopy andecosystem scales and at different temporal scales? Different approaches can be used to answer thesequestions. Among them, the Photochemical Reflectance Index (PRI) derived from narrow-band spectro-radiometers is a spectral index increasingly being used as an indicator of photosynthetic efficiency. Weexamined and synthesized the scientific literature on the relationships between PRI and severalecophysiological variables across a range of plant functional types and ecosystems at the leaf, canopy andecosystem levels and at the daily and seasonal time scales. Our analysis shows that although the strength ofthese relationships varied across vegetation types, levels of organization and temporal scales, in mostreviewed articles PRI was a good predictor of photosynthetic efficiency or related variables with performancesat least as good as the widely used NDVI as indicator of green biomass. There are possible confounding factorsrelated to the intensity of the physiological processes linked to the PRI signals, to the structure of the canopiesand to the illumination and viewing angles that warrant further studies, and it is expected that the utility ofPRI will vary with the ecosystem in question due to contrasting environmental constraints, evolutionarystrategies, and radiation use efficiency (RUE; the ratio between carbon uptake and light absorbed byvegetation) variability. Clearly, more research comparing ecosystem responses is warranted. Additionally, likeany 2-band index that is affected by multiple factors, the interpretation of PRI can be readily confounded bymultiple environmental variables, and further work is needed to understand and constrain these effects.Despite these limitations, this review shows an emerging consistency of the RUE–PRI relationship thatsuggests a surprising degree of functional convergence of biochemical, physiological and structuralcomponents affecting leaf, canopy and ecosystem carbon uptake efficiencies. PRI accounted for 42%, 59%and 62% of the variability of RUE at the leaf, canopy and ecosystem respective levels in unique exponentialrelationships for all the vegetation types studied. It seems thus that by complementing the estimations of thefraction of photosynthetically active radiation intercepted by the vegetation (FPAR), estimated with NDVI-likeindices, PRI enables improved assessment of carbon fluxes in leaves, canopies and many of the ecosystems ofthe world from ground, airborne and satellite sensors.
g Spectroradiometer; RUE, radiation use efficiency; GPP,rbed photosynthetically active radiation by green vegetatFWHM, full width of half maximum.34 935814151.).
l rights reserved.
© 2010 Elsevier Inc. All rights reserved.
Contents
1. Introduction . . . . . . . . . . . . . . . . . . . . . . . . . . . . . . . . . . . . . . . . . . . . . . . . . . . . . . . . . . . . . . 2822. Methods . . . . . . . . . . . . . . . . . . . . . . . . . . . . . . . . . . . . . . . . . . . . . . . . . . . . . . . . . . . . . . . . 283
gross primary productivity; FPAR, fraction of the photosyntheticion; NDVI, normalized difference vegetation index; EVI, enhanced
282 M.F. Garbulsky et al. / Remote Sensing of Environment 115 (2011) 281–297
3. Results . . . . . . . . . . . . . . . . . . . . . . . . . . . . . . . . . . . . . . . . . . . . . . . . . . . . . . . . . . . . . . . . . 2863.1. Leaf level . . . . . . . . . . . . . . . . . . . . . . . . . . . . . . . . . . . . . . . . . . . . . . . . . . . . . . . . . . . . 287
3.1.1. Diurnal changes . . . . . . . . . . . . . . . . . . . . . . . . . . . . . . . . . . . . . . . . . . . . . . . . . . . . . 2873.1.2. Seasonal changes . . . . . . . . . . . . . . . . . . . . . . . . . . . . . . . . . . . . . . . . . . . . . . . . . . . . 2883.1.3. Other factors of change . . . . . . . . . . . . . . . . . . . . . . . . . . . . . . . . . . . . . . . . . . . . . . . . . 2893.1.4. General relationship at the leaf level . . . . . . . . . . . . . . . . . . . . . . . . . . . . . . . . . . . . . . . . . . . 289
3.2. Canopy level. . . . . . . . . . . . . . . . . . . . . . . . . . . . . . . . . . . . . . . . . . . . . . . . . . . . . . . . . . . 2903.2.1. Diurnal changes . . . . . . . . . . . . . . . . . . . . . . . . . . . . . . . . . . . . . . . . . . . . . . . . . . . . . 2903.2.2. Seasonal changes . . . . . . . . . . . . . . . . . . . . . . . . . . . . . . . . . . . . . . . . . . . . . . . . . . . . 2903.2.3. Other factors of change . . . . . . . . . . . . . . . . . . . . . . . . . . . . . . . . . . . . . . . . . . . . . . . . . 2903.2.4. General relationship at the canopy level . . . . . . . . . . . . . . . . . . . . . . . . . . . . . . . . . . . . . . . . . 290
3.3. Ecosystem level . . . . . . . . . . . . . . . . . . . . . . . . . . . . . . . . . . . . . . . . . . . . . . . . . . . . . . . . . 2913.4. RUE–PRI relationships across scales . . . . . . . . . . . . . . . . . . . . . . . . . . . . . . . . . . . . . . . . . . . . . . . . 291
4. Discussion . . . . . . . . . . . . . . . . . . . . . . . . . . . . . . . . . . . . . . . . . . . . . . . . . . . . . . . . . . . . . . . 2914.1. PRI assessment of RUE . . . . . . . . . . . . . . . . . . . . . . . . . . . . . . . . . . . . . . . . . . . . . . . . . . . . . . 2914.2. PRI and RUE standardization . . . . . . . . . . . . . . . . . . . . . . . . . . . . . . . . . . . . . . . . . . . . . . . . . . . 2924.3. Ecosystem-specific PRI performances . . . . . . . . . . . . . . . . . . . . . . . . . . . . . . . . . . . . . . . . . . . . . . . 293
5. Concluding remarks. . . . . . . . . . . . . . . . . . . . . . . . . . . . . . . . . . . . . . . . . . . . . . . . . . . . . . . . . . . 294Acknowledgments . . . . . . . . . . . . . . . . . . . . . . . . . . . . . . . . . . . . . . . . . . . . . . . . . . . . . . . . . . . . . . 294References . . . . . . . . . . . . . . . . . . . . . . . . . . . . . . . . . . . . . . . . . . . . . . . . . . . . . . . . . . . . . . . . . 294
1. Introduction
A key challenge in arriving at a sustainable world is to betterunderstand biosphere–atmosphere carbon fluxes, which are extreme-ly dynamic in time and space (Le Quere et al., 2009). Several questionsremain open. What factors control photosynthetic and respiratoryfluxes by terrestrial landscapes? How are these controls and source/sink patterns distributed in time and space? What is the capacity forterrestrial ecosystems to continue functioning as carbon sinks in theface of ongoing disturbance and climate change? Current tools forexploring these questions include eddy covariance and remotesensing. Eddy covariance is currently the only direct way to assesscarbon flux of whole ecosystems with high temporal resolution.However, eddy covariance towers can effectively measure a single“point” over flat and uniform terrain, usually on the order of a fewhundred squared meters (Baldocchi, 2008). Remote sensing has theability to extend our knowledge of carbon flux in space. Combiningremote sensing with eddy covariance in a modeling frameworkprovides a powerful approach for addressing the carbon dynamics ofterrestrial ecosystems.
The fraction of photosynthetically active radiation absorbed by thecanopy (FPAR) can be estimated from remotely sensed vegetationindices. Vegetation indices, such us the Normalized DifferenceVegetation Index (NDVI) or the Enhanced Vegetation Index (EVI)are normalized differences between the reflectance in the nearinfrared and the red regions of the spectrum, which are very oftendetermined from satellite, or aircraft imagery. The FPAR provide ameasure of potential and not of actual photosynthesis because ofvarying synchrony between green canopy development and photo-synthetic fluxes across vegetation types (Field et al., 1995; Gamonet al., 1995; Myneni et al., 1995). They even can be empiricalestimators of photosynthesis or primary productivity for certainecosystems because they reflect both recent carbon gain and potentialfuture carbon gain in the absence of constraints on photosynthesis(Field, 1991). However, for many ecosystems, considerable uncer-tainty still remains about how much of this capacity is realized inpractice because the radiation use efficiency (RUE) varies significantlybetween plants, environmental conditions, and ecosystems due tovarying environmental constraints (Field et al., 1994; Garbulsky et al.,2010). For example, in many evergreen-dominated ecosystems suchas shrublands, Mediterranean or coniferous forests, seasonal orperiodic stress events may shut down carbon uptake to near zero(Asensio et al., 2007; Ogaya and Peñuelas, 2003) through a process ofphotosynthetic downregulation, even though in the short term the
vegetation continues to absorb light that might otherwise be used forphotosynthesis. Consequently, NDVI can be a poor indicator oftemporal variation in CO2 fluxes, particularly for evergreen speciessubjected to periodic downregulation (Gamon et al., 1995; Runningand Nemani, 1988). However, it is still a good estimator of the spatialvariability of carbon uptake (Garbulsky and Paruelo, 2004).
The widely used radiation use efficiency model (Monteith, 1977)stated that gross (GPP) or net primary productivity (NPP) of avegetation stand can be derived from the absorbed photosyntheticallyactive radiation by green vegetation during the period of study(APARdt), the product of FPAR and photosynthetic active radiation(PAR), and from the efficiency (RUE) with which this absorbedradiation is converted into biomass:
GPP = ∫RUE × APARdt
In various forms, these simple relationships have been the basis formany evaluations of photosynthesis and primary production from thecanopy to the global scales (Field et al., 1995; Running et al., 2004).Many models have assumed a constant efficiency (Myneni et al.,1995) or derived this term from literature values by biome (Ruimyet al., 1994). Another approach is to downregulate the maximumefficiency by biome using climatic variables, like vapour pressuredeficit (VPD) and temperature, as surrogates for photosyntheticstresses (Running et al., 2004). Because VPD and temperature aloneare not always good surrogates of reduced efficiency, meteorologicallybased methods may not always explain efficiency variation. Manystudies show that the efficiency greatly varies in time and space(Gamon et al., 1995; Garbulsky et al., 2010; Runyon et al., 1994) due toperiodic environmental and physiological limitations. Factors con-tributing to this variability, include contrasting functional types(Gamon et al., 1997; Huemmrich et al., 2010), drought and temperatureextremes (Landsberg and Waring, 1997; Sims et al., 2006a) andnutrient levels (Gamon et al., 1997; Ollinger et al., 2008).
In recent years, this RUE term of the model has been found to beaccessible through spectral reflectance, thus opening the possibility ofusing remote sensing techniques to detect temporal and spatialvariations in photosynthetic radiation use efficiency and therefore toimprove the temporal and spatial characterization of carbon uptakeby vegetation. Different approaches have arisen recently to remotelyestimate RUE from a wide variety of wavelengths and sensor types.Among those approaches, the use of land surface temperature derivedfrom thermal wavelengths was successfully tested for a set of 11

283M.F. Garbulsky et al. / Remote Sensing of Environment 115 (2011) 281–297
different sites distributed only in North America to estimate 16 dayGPP, but it would be inadequate for the estimation of GPP in shortertime steps due to the inability to track short-term (e.g. diurnal)physiological variability (Sims et al., 2008). This study included manymesic sites, but did not include many arid or semiarid ecosystemswhere downregulation due to drought and temperature extremeswould likely occur. Consequently, the ability of this approach tocapture the full range of variability across biomes, particularly due toshort-term stress, remains unclear. An alternate approach links thesun induced chlorophyll fluorescence, derived from an oxygenabsorption band located at 760 nm, to the diurnal changes in RUE,but tests of this method have been limited (Damm et al., 2010).Consequently, the full capabilities of these promising approaches arenot yet entirely clear.
The detection of the spatial and temporal variations in RUE couldalso be assessed through the remote sensing of plant pigments. This isa key tool to diagnose a range of plant physiological properties andprocesses (Blackburn, 2007; Peñuelas and Filella, 1998). In particular,different studies were conducted during the 1990s at the leaf andclose canopy levels using close-range remote sensing from the groundor from low platforms to assess this efficiency parameter RUE basedon concurrent xanthophyll pigment changes (Filella et al., 1996;Gamon et al., 1990; Gamon et al., 1992; Gamon et al., 1997; Gamonand Surfus, 1999; Peñuelas et al., 1995; Peñuelas et al., 1997a;Peñuelas et al., 1998; Peñuelas et al., 1994). The foundation of thisremote sensing approach to estimate the RUE is the de-epoxidationstate of the xanthophyll cycle which is linked to heat dissipation(Demmig-Adams and Adams, 1996). This is a decay process of excitedchlorophyll that competes with and is complementary to photosyn-thetic electron transport (Niyogi, 1999). Since the reflectance at531 nm is functionally related to the de-epoxidation state of thexanthophyll cycle (Gamon et al., 1990; Gamon et al., 1992; Peñuelaset al., 1995), a Photochemical Reflectance Index (PRI, typicallycalculated as [R531−R570]/[R531+R570], where R indicates reflectanceand numbers indicate wavelength nanometers at the center of thebands), was developed as a method to remotely assess photosyntheticefficiency using narrow-band reflectance (Gamon et al., 1992;Peñuelas et al., 1995). The mechanistic basis for these wavelengthselections have been fully explored at the leaf scale (Gamon et al.,1993b), but are more poorly supported at canopy and larger scales,where a variety of alternate wavebands have been used, often basedon statistical correlations (Gamon et al., 1992; Inoue et al., 2008) ordetermined by instrument limitations (Garbulsky et al., 2008b). Thelack of a clear consensus in the literature on the “best” PRIwavelengths, has hindered cross-study comparisons. Consequently,it is not entirely clear if the best wavelengths for measuring thisfeature at the leaf scale (531 and 570 nm) are necessarily the bestwavelengths at progressively larger scales, where multiple scatteringand other confounding effects may alter the spectral response of thexanthophyll cycle feature, much in the way that pigment absorptionpeaks can vary depending upon their chemical and scatteringmedium. More work, therefore, may be needed to determine theideal PRI algorithm for airborne or spaceborne platforms, and thesestudies have been hampered by the limited availability and high costsof suitable airborne and spaceborne instruments.
Since PRI measures the relative reflectance on either side of thegreen reflectance “hump” (550 nm), it also compares the reflectancein the blue (chlorophyll and carotenoids absorption) region of thespectrum with the reflectance in the red (chlorophyll absorptiononly) region. Consequently, it can serve as an index of relativechlorophyll:carotenoid levels, often referred to as bulk pigment ratiosor “pool sizes”. Over longer time scales (weeks–months), changes inbulk pigment content and ratios due to leaf development, aging orchronic stress have been reported to play a significant role togetherwith the xanthophyll pigment epoxidation in the PRI signal (Gamonet al., 2001; Peñuelas et al., 1997a; Sims and Gamon, 2002; Stylinski
et al., 2002). Thus, PRI is also often related to chlorophyll/carotenoidratios in leaves across a large number of species, ages and conditions(Filella et al., 2009; Stylinski et al., 2002). Therefore, to the extent thatphotosynthetic activity correlates with changing chlorophyll/carot-enoid ratios in response to stress, ontogeny or senescence, PRI mayprovide an effective measure of relative photosynthetic rates.Together, these responses to de-epoxidation state of the xanthophyllcycle and to chlorophyll/carotenoid ratios ensure that PRI scales withphotosynthetic efficiency across a wide range of conditions, speciesand functional types (Filella et al., 1996; Gamon et al., 1992; Gamonand Qiu, 1999; Peñuelas et al., 1995; Stylinski et al., 2002).
Nowadays, the PRI is increasingly being used as an index ofphotosynthetic performance in general and of RUE in particular innatural and seminatural vegetation (e.g. Asner et al., 2004; Mändet al., 2010; Middleton et al., 2009; Peñuelas and Llusia, 2002) or incrops (e.g. Strachan et al., 2002; Zhou and Wang, 2003). Therelationships between PRI and different ecophysiological relatedvariables have been tested over a wide range of species, plantfunctional types, temporal steps and environmental conditions.However, different problems that preclude its generalization toecosystem scales and its global and operational use as an estimatorof RUE have recently been described (Barton and North, 2001; Graceet al., 2007). In brief, these problems are related to the interference tothe PRI signal produced by other plant pigments not related tophotosynthetic efficiency, to the structural differences of the canopies,to varying “background effects” (e.g. soil color, moisture, or shadows)to the different PRI formulations or signals derived from a variety ofsensors and to illumination and viewing angles variations. This mayhelp explain why different ecosystems or conditions can appear tohave slightly different RUE–PRI responses.
In this study we reviewed the literature reporting the use of thePRI to assess physiological variables related to photosyntheticefficiency such as epoxidation state of xanthophylls (EPS), nonphotochemical quenching (NPQ), actual photochemical fluorescenceyield, RUE derived from gas exchange, and net photosynthesis. Ouraim was to analyse the use of PRI as an indicator of RUE at the leaf,stand and ecosystem scales for different vegetation types and timescales, to identify knowledge gaps and to present perspectives forfuture research. Our final additional aimwas to evaluate and constructa general calibration of the relationship of RUE with PRI at the leaf,canopy and ecosystem levels.
2. Methods
We gathered the published articles that reported relationshipsbetween remote sensed PRI and any kind of plant physiologicalvariables. This primarily included Science Citation Index articlesreporting results at different spatial and temporal scales and from awide range of plant species or vegetation types. This broad spectrumof studies necessarily included different sensor types, from hand heldspectroradiometers to satellite sensors. For each article we registeredthe main features of the study and the coefficient of determination(R2) as an indicator of the strength of each presented relationship. Forthose studies that presented data for PRI and physiological variablesbut did not present the statistical results of the relationship, weextracted the raw data from the plots, and calculated the statisticalresults of the relationships ourselves. We analyzed and drew thecoefficients of determination of all the correlations using boxplots foreach vegetation types (herbaceous, broadleaf, conifers, etc.), timescale (daily or seasonal, i.e. changes within seasons and acrossseasons), and organization level (leaf, canopy— from plant to stand—
or ecosystem). In this review, the term “canopy” refers to either asingle plant or a monospecific stand, whereas the term “ecosystem”
refers to a mixed-species stand. We tested the differences in R2
between vegetation types using a t test when therewere enough casesstudied per vegetation type.

Table 1List of studies found in the literature that linked PRI with ecophysiological variables. Specrad= spectroradiometer. Acronyms for the ecophysiological variables are: RUE= radiationuse efficiency; EPS = epoxidation state of the xantophylls; DEPS = de-epoxidation state of the xanthophylls; Fv/Fm = maximum photochemical efficiency of PSII; ΔF/Fm′ =effective quantum yield or actual photochemical efficiency or photochemical efficiency of Photosystem II (ΦPSII); Amax=maximum photosynthesis rate; Fs = steady state value offluorescence; Jmax = electron transport under saturating light; NPQ = non photochemical quenching; and Chl/Car = ratio chlorophyll content/carotenoids content.
Article orderby publicationdate
Year Reference Scale Variance factor Species/vegetation type Vegetationtype
Sensor Figure # Ecophysiologicalvariables
3 1995 (Peñuelaset al., 1995)
Leaves Hours Hedera canariensis,Phaseolus vulgaris,Rhus ovata/R. integrifolia,Heteromeles arbutifolia,Succulents (Agave americana,Opuntia ficus-indica andCereus hexagonus)
Broadleaf Specrad 1d–4–101e
RUEΔF/Fm′
31 2004 (Evain et al.,2004)
Leaves Hours Vitis vinifera Broadleaf Specrad 1a1e
NPQΔF/Fm′
45 2006 (Weng et al.,2006b)
Leaves Hours Mango Broadleaf Specrad 1a1e
NPQFv′/Fm′
52 2007 (Rascheret al., 2007)
Leaves Hours Pterocarpus indicus,Ceiba pentandra,Pachira aquatica,Inga sapindoides
Broadleaf Specrad 1a1e
NPQΔF/Fm′
64 2008 (Meroniet al., 2008a)
Leaves Hours Populus deltoides(ozone treatments)
Broadleaf Specrad 1d–4–10 RUE
41 2006 (Nakajiet al., 2006)
Leaves Hours Japanese larch (Larixkaempferi Sarg.)
Conifers Camera 2b1d–4–10
ChlCar/ChlRUE
9 1999 (Methy et al.,1999)
Leaves Hours Alfalfa Herbaceous/crop
Specrad 1e ΔF/Fm′
10 1999 (Gamon andSurfus 1999)
Leaves Hours Sunflower Herbaceous/crop
Specrad 1c EPS (ΔPRI)
27 2004 (Guo andTrotter 2004)
Leaves Hours/difspecies
Lycopersicon esculentum,Populus deltoides x P. Nigra,Evergreen perennials(Coprosma robusta,Pseudopanax arboreus)+3evergreen perennials
Mixture Specrad 1a1b1d–3c–4–101e–3b1f
NPQCar/ChlRUEΔF/Fm′
Net CO2 uptake
2 1994 (Peñuelaset al., 1994)
Leaves Hours/seasonal Sunflower Herbaceous/crop
Specrad 1c1d–3f–101f–3f
EPSRUENet CO2 uptake
5 1997 (Peñuelaset al., 1997b)
Leaves Seasonal Quercus ilex/Phillyrea latifolia Broadleaf Specrad 2a2d–102e
NPQRUEΔF/Fm′
29 2004 (Peñuelaset al., 2004)
Leaves Seasonal Phillyrea angustifolia Broadleaf Specrad 2f Net CO2 uptake
63 2008 (Lettset al., 2008)
Leaves Seasonal Populus angustifolia Broadleaf Specrad 2e ΔF/Fm′
74 2009 (Panigadaet al., 2009)
Leaves Seasonal Fagus sylvatica Broadleaf Specrad 2a2e
NPQΔF/Fm′
47 2006 (Weng et al.,2006c)
Leaves Seasonal Pinus (P. taiwanensis,P. armandi and P. morrisonicola),Evergreen trees (Stranvaesianiitakayamensis, Rhododendronmori and Trochodendronaralioides) and perennialgrasses (Yushania niitakayamensis,Miscanthus transmorrisonensisand M. floridulus)
Conifers Specrad 3e Fv′/Fm′
76 2009 (Weng et al.,2009)
Leaves Seasonal Pinus taiwanensis Conifers Specrad 2e Fv′/Fm′
82 2009 (Filella et al.,2009)
Leaves Seasonal Pinus sylvestris - Quercus ilex Conifers Specrad 2b2c
DEPSCar/Chl
83 2009 (Busch et al.,2009)
Leaves Seasonal Pinus banksiana Conifers Specrad 2a2c
NPQEPS
24 2002 (Winkel et al.,2002)
Leaves Seasonal Chenopodium quinoa Herbaceous/crop
Specrad 2d–4–102e
RUEΔF/Fm′
26 2002 (Tambussiet al., 2002)
Leaves Seasonal Wheat Herbaceous/crop
Specrad 2c DEPS
35 2005 (Inamullah andIsoda 2005)
Leaves Seasonal Soya/cotton Herbaceous/crop
Specrad 2a2e
NPQΔF/Fm′
49 2006 (Chen et al.,2006)
Leaves Seasonal Rice Herbaceous/crop
Specrad 2b Car/Chl
78 2009 (Gerosaet al., 2009)
Leaves Seasonal Phaseolus vulgaris Herbaceous/crop
Specrad 2e ΔF/Fm′
42 2006 (Weng et al.,2006a)
Leaves Seasonal Mangifera indica, Podocarpusnagi and Alnus formosana
Mixture Specrad 2e2a
ΔF/Fm′
NPQ54 2007 (Martin et al.,
2007)Leaves Dif populations Metrosideros polymorpha Broadleaf Specrad 3a
3bCar/ChlΔF/Fm′
284 M.F. Garbulsky et al. / Remote Sensing of Environment 115 (2011) 281–297

Table 1 (continued)
Article orderby publicationdate
Year Reference Scale Variance factor Species/vegetation type Vegetationtype
Sensor Figure # Ecophysiologicalvariables
38 2005 (Raddiet al., 2005)
Leaves Dif species Mediterranean forests Broadleaf Specrad NPQ
6 1997 (Gamonet al., 1997)
Leaves Dif species 20 sps (annual, deciduousperennial, and evergreenperennial)/cotton
Mixture Specrad 1e–3b1d–3c–4–10
ΔF/Fm′
RUE
25 2002 (Sims andGamon 2002)
Leaves Dif species 53 different species Mixture Specrad 3a Car/Chl
43 2006 (Guo andTrotter 2006)
Leaves Dif species 13 different speciesambient and elevatedCO2
Mixture Specrad 3b3c–10
ΔF/Fm′
RUE
14 2000 (Stylinskiet al., 2000)
Leaves Leaves Quercus pubescens Broadleaf Specrad3a
JmaxCar/Chl
15 2000 (Moran et al.,2000)
Leaves Ntreatment×light
Picea engelmannii Conifers Specrad Chl (A+B)
44 2006 (Inoue andPeñuelas 2006)
Leaves N×watercondition
Soybean Herbaceous/crop
Specrad 3c–4–10 RUE
70 2008 (Naumannet al., 2008a)
Leaves Saltconcentration
Myrica cerifera Broadleaf Specrad 3b ΔF/Fm′
21 2002 (Richardson andBerlyn 2002)
Leaves Spatial Betula papyrifera Broadleaf Specrad 3c RUE
48 2006 (Asner et al.,2006)
Leaves Spatial Metrosideros polymorpha Broadleaf Specrad Chl–CarCar/Chl
81 2009 (Martin andAsner 2009)
Leaves Spatial Metrosideros polymorpha Broadleaf Specrad 3a Car/Chl
17 2001 (Richardsonet al., 2001)
Leaves Spatial Red spruce and balsam fir Conifers Specrad 3b ΔF/Fm′
37 2005 (Whiteheadet al., 2005)
Leaves Spatial×sps Three different species fromsix mixed forests
Mixture Specrad Amax
12 2000 (Methy 2000) Leaves/canopy
Hours Quercus ilex Broadleaf Specrad 1e2f
ΔF/Fm′
Net CO2 uptake1 1992 (Gamon et al.,
1992)Leaves/canopy
Hours Sunflower Herbaceous/crop
Specrad 1c EPSRUE
20 2002 (Stylinskiet al., 2002)
Leaves/canopy
Seasonal 3 chaparral shrubs(Quercus berberidifolia,Ceanothus greggii,Adenostoma fasciculamtum)
Broadleaf Specrad 3a ΔF/Fm′
Net CO2 uptakeCar/ChlDEPS
33 2005 (Gamon et al.,2005)
Leaves/plant
Hours Anacardium excelsum,Luehea seemanni
Broadleaf Specrad ΔF/Fm′
39 2005 (Dobrowskiet al., 2005)
Canopy Hours Vitis vinifera Broadleaf Specrad Fs
11 2000 (Nichol et al.,2000)
Canopy Seasonal Broadleaf deciduous(Aspen–Fen), Conifers(old jack pine–oldblack spruce)
Broadleaf HelicopterSpecrad
5–7–10 RUE
36 2005 (Serrano andPeñuelas 2005)
Canopy Seasonal Mediterranean forest Broadleaf Specradtransmitance
5–10 Net CO2 uptakeRUE
40 2006 (Nicholet al., 2006)
Canopy Seasonal Mangrove (Rhizophoraand Avicennia)
Broadleaf Specrad ΔF/Fm′
NPQ50 2006 (Sims et al.,
2006a)Canopy Seasonal Chaparral shrubs Broadleaf Tram
Specrad5–10 RUE
69 2008 (Peguero-Pinaet al., 2008)
Canopy Seasonal Quercus coccifera Broadleaf Specrad ΔF/Fm′
FsEPSNPQ
75 2009 (Naumannet al., 2009)
Canopy Seasonal Myrica cerifera andIva frutescens
Broadleaf Airbornespectro
ΔF/Fm′
79 2009 (Chenget al., 2009)
Canopy Seasonal Douglas fir forest Conifers Specrad 5–10 RUE
8 1998 (Carter 1998) Canopy Seasonal Pinus taeda-P. elliotti Conifers Specrad Amax18 2002 (Nichol
et al., 2002)Canopy Seasonal Boreal forest Siberia Conifers Specrad 5–7–10 RUE
34 2005 (Louis et al.,2005)
Canopy Seasonal Scots Pine Conifers Specrad Net CO2 uptake
51 2007 (Nakaji et al.,2007)
Canopy Seasonal Larix kaempferi Conifers Specrad 5–10 RUE
57 2008 (Hall et al.,2008)
Canopy Seasonal Douglas fir Conifers Specrad 5–7–10 RUE
58 2008 (Hilker et al.,2008)
Canopy Seasonal Douglas fir Conifers Specrad 5–7–10 RUE
66 2008 (Nakaji et al.,2008)
Canopy Seasonal Three sites: Larix kaempferi,Chamaecyparis obtuseand Larix gmelinii xL. kaempferi+Sasa senanensisand S. kurilensis
Conifers Specrad 5–7–10 RUE
(continued on next page)
285M.F. Garbulsky et al. / Remote Sensing of Environment 115 (2011) 281–297
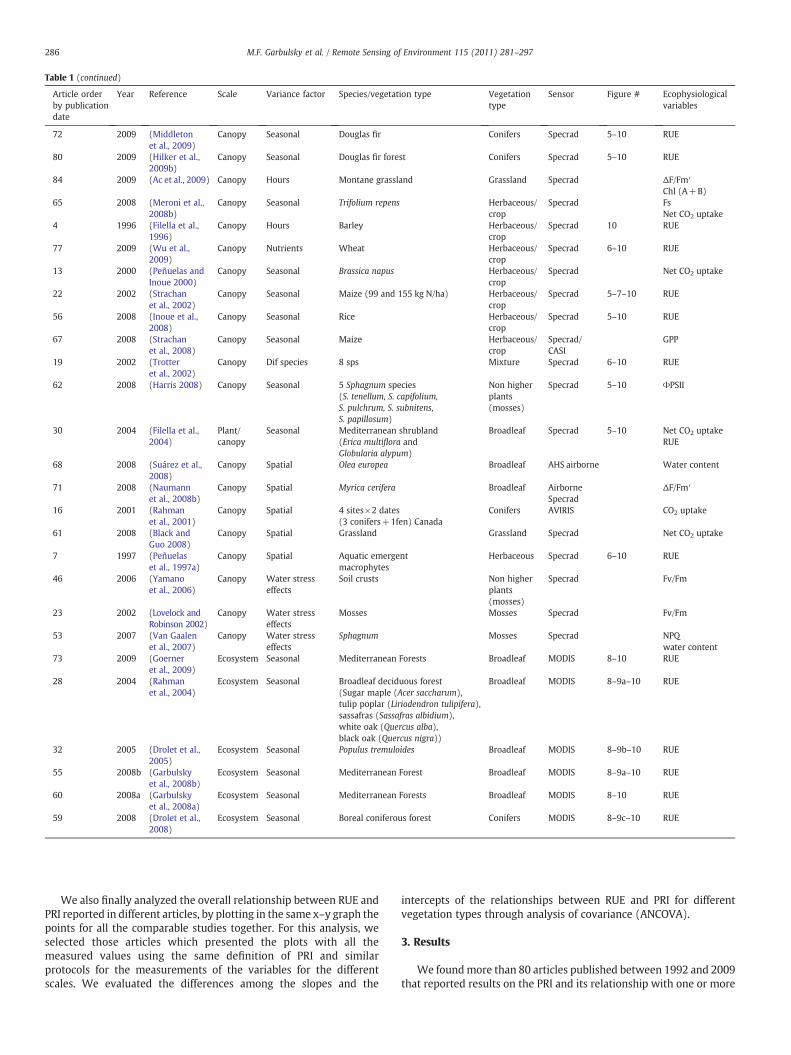
Table 1 (continued)
Article orderby publicationdate
Year Reference Scale Variance factor Species/vegetation type Vegetationtype
Sensor Figure # Ecophysiologicalvariables
72 2009 (Middletonet al., 2009)
Canopy Seasonal Douglas fir Conifers Specrad 5–10 RUE
80 2009 (Hilker et al.,2009b)
Canopy Seasonal Douglas fir forest Conifers Specrad 5–10 RUE
84 2009 (Ac et al., 2009) Canopy Hours Montane grassland Grassland Specrad ΔF/Fm′
Chl (A+B)65 2008 (Meroni et al.,
2008b)Canopy Seasonal Trifolium repens Herbaceous/
cropSpecrad Fs
Net CO2 uptake4 1996 (Filella et al.,
1996)Canopy Hours Barley Herbaceous/
cropSpecrad 10 RUE
77 2009 (Wu et al.,2009)
Canopy Nutrients Wheat Herbaceous/crop
Specrad 6–10 RUE
13 2000 (Peñuelas andInoue 2000)
Canopy Seasonal Brassica napus Herbaceous/crop
Specrad Net CO2 uptake
22 2002 (Strachanet al., 2002)
Canopy Seasonal Maize (99 and 155 kg N/ha) Herbaceous/crop
Specrad 5–7–10 RUE
56 2008 (Inoue et al.,2008)
Canopy Seasonal Rice Herbaceous/crop
Specrad 5–10 RUE
67 2008 (Strachanet al., 2008)
Canopy Seasonal Maize Herbaceous/crop
Specrad/CASI
GPP
19 2002 (Trotteret al., 2002)
Canopy Dif species 8 sps Mixture Specrad 6–10 RUE
62 2008 (Harris 2008) Canopy Seasonal 5 Sphagnum species(S. tenellum, S. capifolium,S. pulchrum, S. subnitens,S. papillosum)
Non higherplants(mosses)
Specrad 5–10 ΦPSII
30 2004 (Filella et al.,2004)
Plant/canopy
Seasonal Mediterranean shrubland(Erica multiflora andGlobularia alypum)
Broadleaf Specrad 5–10 Net CO2 uptakeRUE
68 2008 (Suárez et al.,2008)
Canopy Spatial Olea europea Broadleaf AHS airborne Water content
71 2008 (Naumannet al., 2008b)
Canopy Spatial Myrica cerifera Broadleaf AirborneSpecrad
ΔF/Fm′
16 2001 (Rahmanet al., 2001)
Canopy Spatial 4 sites×2 dates(3 conifers+1fen) Canada
Conifers AVIRIS CO2 uptake
61 2008 (Black andGuo 2008)
Canopy Spatial Grassland Grassland Specrad Net CO2 uptake
7 1997 (Peñuelaset al., 1997a)
Canopy Spatial Aquatic emergentmacrophytes
Herbaceous Specrad 6–10 RUE
46 2006 (Yamanoet al., 2006)
Canopy Water stresseffects
Soil crusts Non higherplants(mosses)
Specrad Fv/Fm
23 2002 (Lovelock andRobinson 2002)
Canopy Water stresseffects
Mosses Mosses Specrad Fv/Fm
53 2007 (Van Gaalenet al., 2007)
Canopy Water stresseffects
Sphagnum Mosses Specrad NPQwater content
73 2009 (Goerneret al., 2009)
Ecosystem Seasonal Mediterranean Forests Broadleaf MODIS 8–10 RUE
28 2004 (Rahmanet al., 2004)
Ecosystem Seasonal Broadleaf deciduous forest(Sugar maple (Acer saccharum),tulip poplar (Liriodendron tulipifera),sassafras (Sassafras albidium),white oak (Quercus alba),black oak (Quercus nigra))
Broadleaf MODIS 8–9a–10 RUE
32 2005 (Drolet et al.,2005)
Ecosystem Seasonal Populus tremuloides Broadleaf MODIS 8–9b–10 RUE
55 2008b (Garbulskyet al., 2008b)
Ecosystem Seasonal Mediterranean Forest Broadleaf MODIS 8–9a–10 RUE
60 2008a (Garbulskyet al., 2008a)
Ecosystem Seasonal Mediterranean Forests Broadleaf MODIS 8–10 RUE
59 2008 (Drolet et al.,2008)
Ecosystem Seasonal Boreal coniferous forest Conifers MODIS 8–9c–10 RUE
286 M.F. Garbulsky et al. / Remote Sensing of Environment 115 (2011) 281–297
We also finally analyzed the overall relationship between RUE andPRI reported in different articles, by plotting in the same x–y graph thepoints for all the comparable studies together. For this analysis, weselected those articles which presented the plots with all themeasured values using the same definition of PRI and similarprotocols for the measurements of the variables for the differentscales. We evaluated the differences among the slopes and the
intercepts of the relationships between RUE and PRI for differentvegetation types through analysis of covariance (ANCOVA).
3. Results
We foundmore than 80 articles published between 1992 and 2009that reported results on the PRI and its relationship with one or more

Table 2Summary of the most common ecophysiological variables linked to PRI, acronyms andmethods used in the literature for their estimation.
Acronym Full name Determination methods
Net CO2 uptake Gas exchange at the leafor stand (eddy covariance)level
RUE Radiation useefficiency
Gas exchange
EPS or DEPS Epoxidation orde-epoxidationstate of thexanthophylls
Chromatography highperformance liquidchromatography (HPLC)
ΔF/Fm′ or ΦPSII Effective quantumyield or actualphotochemicalefficiency orphotochemical efficiencyof Photosystem II
Chlorophyll fluorescence
NPQ Non photochemical quenching Chlorophyll fluorescenceCar/Chl Carotenoids/chlorophyll contents Spectrophotometry HPLC
287M.F. Garbulsky et al. / Remote Sensing of Environment 115 (2011) 281–297
variables related to photosynthesis performance (Table 1). More thana third part of these studies were published during 2008–09,emphasizing the increasing interest of the scientific community onthis subject. These studies were performed at the leaf, the canopy and
Fig. 1. Boxplots for the coefficients of determination for the relationships between the physi(Chl/Car), c) epoxidation state of xantophylls (EPS), d) radiation use efficiency (RUE), e) actuat the short daily time scale. Central lines represent the medians, boxes represent 50% of thoutliers. The numbers of reported relationships found in the literature are shown in bracke
the ecosystem level and some of them presented more than onerelationship, e.g. for different species or different sites. The highestnumber of relationships reported was for relationships with theeffective quantum yield or actual photochemical efficiency (ΔF/Fm′),but the PRI was also linked to several different variables for differentspatial and temporal scales: RUE, net CO2 uptake, NPQ, EPS (or DEPS),the ratio chlorophyll/carotenoids (Table 2). Other less frequentecophysiological variables reported in the literature were chlorophyll(A+B) content, maximum photosynthesis rate (Amax), steady statevalue of fluorescence (Fs), and water content.
3.1. Leaf level
3.1.1. Diurnal changesWe found twelve articles that linked the PRI with ΔF/Fm′, NPQ,
DEPS (or EPS), ratio chlorophyll/carotenoids and RUE at the leaf scaleover short (diurnal) time scales. The largest numbers of relationshipswas found for ΔF/Fm′ (n=17) and RUE (n=16). The mediancoefficients of determination for the relationships between PRI andRUE varied between 0.60 and 0.85 and for ΔF/Fm′varied between 0.62and 0.82 depending on the vegetation type (Fig. 1d, e). Except forchlorophyll/carotenoid levels, which were limited to a single study forherbaceous vegetation (Fig. 1b), therewere no remarkable differenceswithin the variables among vegetation types. Non-significant
ological variables: a) non phothochemical quenching (NPQ), b) chlorophyll/carotenoidal photochemical efficiency (ΔF/Fm′) and f) Net CO2 uptake, and PRI at the leaf scale ande data, the whiskers represent the minimum and maximum values and the circles thets.
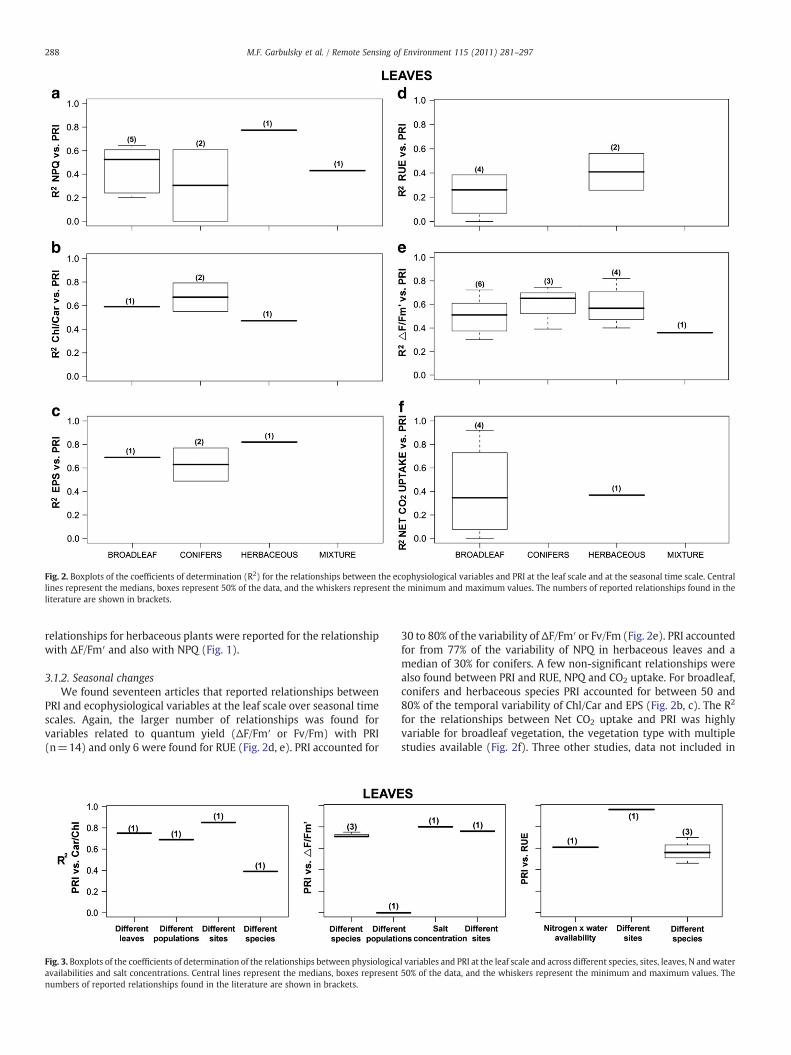
Fig. 2. Boxplots of the coefficients of determination (R2) for the relationships between the ecophysiological variables and PRI at the leaf scale and at the seasonal time scale. Centrallines represent the medians, boxes represent 50% of the data, and the whiskers represent the minimum and maximum values. The numbers of reported relationships found in theliterature are shown in brackets.
288 M.F. Garbulsky et al. / Remote Sensing of Environment 115 (2011) 281–297
relationships for herbaceous plants were reported for the relationshipwith ΔF/Fm′ and also with NPQ (Fig. 1).
3.1.2. Seasonal changesWe found seventeen articles that reported relationships between
PRI and ecophysiological variables at the leaf scale over seasonal timescales. Again, the larger number of relationships was found forvariables related to quantum yield (ΔF/Fm′ or Fv/Fm) with PRI(n=14) and only 6 were found for RUE (Fig. 2d, e). PRI accounted for
Fig. 3. Boxplots of the coefficients of determination of the relationships between physiologicaavailabilities and salt concentrations. Central lines represent the medians, boxes representnumbers of reported relationships found in the literature are shown in brackets.
30 to 80% of the variability of ΔF/Fm′ or Fv/Fm (Fig. 2e). PRI accountedfor from 77% of the variability of NPQ in herbaceous leaves and amedian of 30% for conifers. A few non-significant relationships werealso found between PRI and RUE, NPQ and CO2 uptake. For broadleaf,conifers and herbaceous species PRI accounted for between 50 and80% of the temporal variability of Chl/Car and EPS (Fig. 2b, c). The R2
for the relationships between Net CO2 uptake and PRI was highlyvariable for broadleaf vegetation, the vegetation type with multiplestudies available (Fig. 2f). Three other studies, data not included in
l variables and PRI at the leaf scale and across different species, sites, leaves, N andwater50% of the data, and the whiskers represent the minimum and maximum values. The
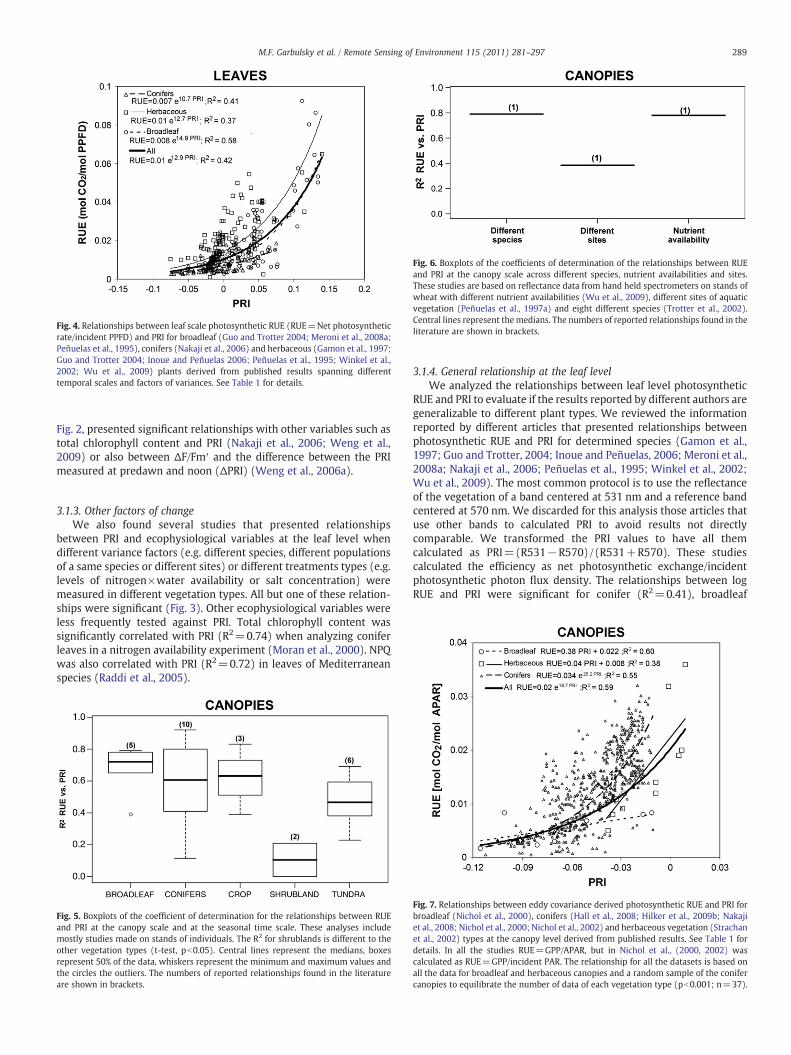
Fig. 6. Boxplots of the coefficients of determination of the relationships between RUEand PRI at the canopy scale across different species, nutrient availabilities and sites.These studies are based on reflectance data from hand held spectrometers on stands ofwheat with different nutrient availabilities (Wu et al., 2009), different sites of aquaticvegetation (Peñuelas et al., 1997a) and eight different species (Trotter et al., 2002).Central lines represent themedians. The numbers of reported relationships found in theliterature are shown in brackets.
Fig. 4. Relationships between leaf scale photosynthetic RUE (RUE=Net photosyntheticrate/incident PPFD) and PRI for broadleaf (Guo and Trotter 2004; Meroni et al., 2008a;Peñuelas et al., 1995), conifers (Nakaji et al., 2006) and herbaceous (Gamon et al., 1997;Guo and Trotter 2004; Inoue and Peñuelas 2006; Peñuelas et al., 1995; Winkel et al.,2002; Wu et al., 2009) plants derived from published results spanning differenttemporal scales and factors of variances. See Table 1 for details.
289M.F. Garbulsky et al. / Remote Sensing of Environment 115 (2011) 281–297
Fig. 2, presented significant relationships with other variables such astotal chlorophyll content and PRI (Nakaji et al., 2006; Weng et al.,2009) or also between ΔF/Fm′ and the difference between the PRImeasured at predawn and noon (ΔPRI) (Weng et al., 2006a).
3.1.3. Other factors of changeWe also found several studies that presented relationships
between PRI and ecophysiological variables at the leaf level whendifferent variance factors (e.g. different species, different populationsof a same species or different sites) or different treatments types (e.g.levels of nitrogen×water availability or salt concentration) weremeasured in different vegetation types. All but one of these relation-ships were significant (Fig. 3). Other ecophysiological variables wereless frequently tested against PRI. Total chlorophyll content wassignificantly correlated with PRI (R2=0.74) when analyzing coniferleaves in a nitrogen availability experiment (Moran et al., 2000). NPQwas also correlated with PRI (R2=0.72) in leaves of Mediterraneanspecies (Raddi et al., 2005).
Fig. 5. Boxplots of the coefficient of determination for the relationships between RUEand PRI at the canopy scale and at the seasonal time scale. These analyses includemostly studies made on stands of individuals. The R2 for shrublands is different to theother vegetation types (t-test, pb0.05). Central lines represent the medians, boxesrepresent 50% of the data, whiskers represent the minimum and maximum values andthe circles the outliers. The numbers of reported relationships found in the literatureare shown in brackets.
3.1.4. General relationship at the leaf levelWe analyzed the relationships between leaf level photosynthetic
RUE and PRI to evaluate if the results reported by different authors aregeneralizable to different plant types. We reviewed the informationreported by different articles that presented relationships betweenphotosynthetic RUE and PRI for determined species (Gamon et al.,1997; Guo and Trotter, 2004; Inoue and Peñuelas, 2006; Meroni et al.,2008a; Nakaji et al., 2006; Peñuelas et al., 1995; Winkel et al., 2002;Wu et al., 2009). The most common protocol is to use the reflectanceof the vegetation of a band centered at 531 nm and a reference bandcentered at 570 nm. We discarded for this analysis those articles thatuse other bands to calculated PRI to avoid results not directlycomparable. We transformed the PRI values to have all themcalculated as PRI=(R531−R570) /(R531+R570). These studiescalculated the efficiency as net photosynthetic exchange/incidentphotosynthetic photon flux density. The relationships between logRUE and PRI were significant for conifer (R2=0.41), broadleaf
Fig. 7. Relationships between eddy covariance derived photosynthetic RUE and PRI forbroadleaf (Nichol et al., 2000), conifers (Hall et al., 2008; Hilker et al., 2009b; Nakajiet al., 2008; Nichol et al., 2000; Nichol et al., 2002) and herbaceous vegetation (Strachanet al., 2002) types at the canopy level derived from published results. See Table 1 fordetails. In all the studies RUE=GPP/APAR, but in Nichol et al., (2000, 2002) wascalculated as RUE=GPP/incident PAR. The relationship for all the datasets is based onall the data for broadleaf and herbaceous canopies and a random sample of the conifercanopies to equilibrate the number of data of each vegetation type (pb0.001; n=37).
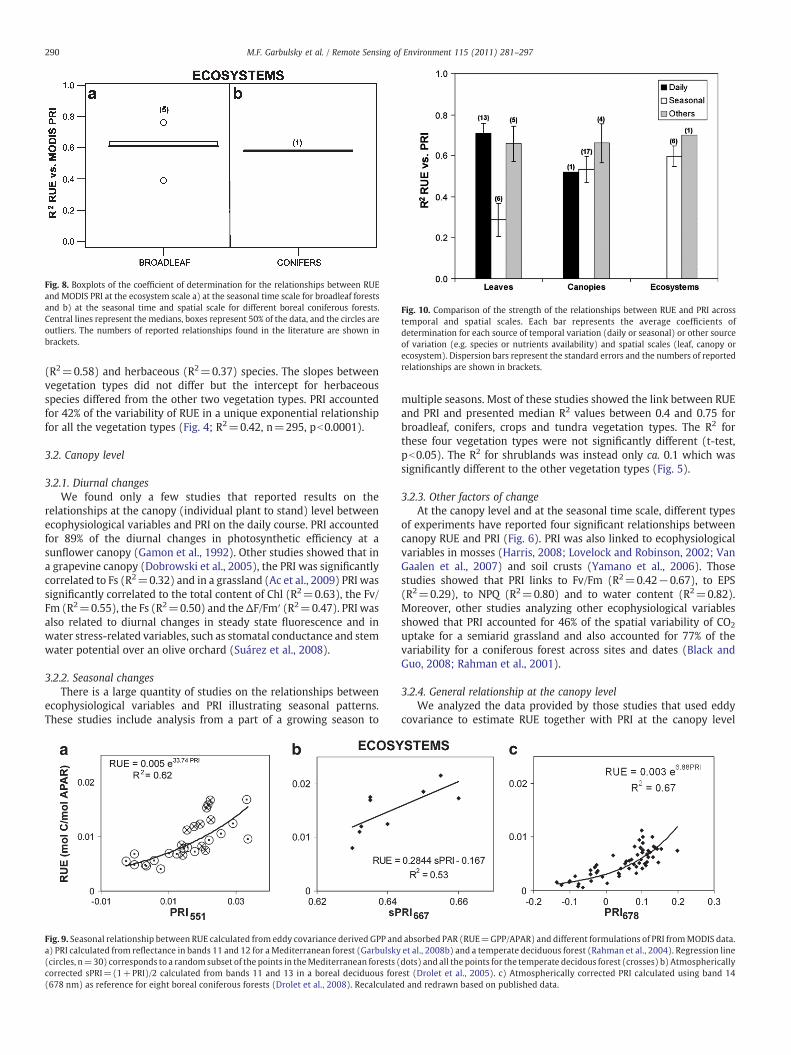
Fig. 8. Boxplots of the coefficient of determination for the relationships between RUEand MODIS PRI at the ecosystem scale a) at the seasonal time scale for broadleaf forestsand b) at the seasonal time and spatial scale for different boreal coniferous forests.Central lines represent the medians, boxes represent 50% of the data, and the circles areoutliers. The numbers of reported relationships found in the literature are shown inbrackets.
Fig. 10. Comparison of the strength of the relationships between RUE and PRI acrosstemporal and spatial scales. Each bar represents the average coefficients ofdetermination for each source of temporal variation (daily or seasonal) or other sourceof variation (e.g. species or nutrients availability) and spatial scales (leaf, canopy orecosystem). Dispersion bars represent the standard errors and the numbers of reportedrelationships are shown in brackets.
290 M.F. Garbulsky et al. / Remote Sensing of Environment 115 (2011) 281–297
(R2=0.58) and herbaceous (R2=0.37) species. The slopes betweenvegetation types did not differ but the intercept for herbaceousspecies differed from the other two vegetation types. PRI accountedfor 42% of the variability of RUE in a unique exponential relationshipfor all the vegetation types (Fig. 4; R2=0.42, n=295, pb0.0001).
3.2. Canopy level
3.2.1. Diurnal changesWe found only a few studies that reported results on the
relationships at the canopy (individual plant to stand) level betweenecophysiological variables and PRI on the daily course. PRI accountedfor 89% of the diurnal changes in photosynthetic efficiency at asunflower canopy (Gamon et al., 1992). Other studies showed that ina grapevine canopy (Dobrowski et al., 2005), the PRI was significantlycorrelated to Fs (R2=0.32) and in a grassland (Ac et al., 2009) PRI wassignificantly correlated to the total content of Chl (R2=0.63), the Fv/Fm (R2=0.55), the Fs (R2=0.50) and theΔF/Fm′ (R2=0.47). PRI wasalso related to diurnal changes in steady state fluorescence and inwater stress-related variables, such as stomatal conductance and stemwater potential over an olive orchard (Suárez et al., 2008).
3.2.2. Seasonal changesThere is a large quantity of studies on the relationships between
ecophysiological variables and PRI illustrating seasonal patterns.These studies include analysis from a part of a growing season to
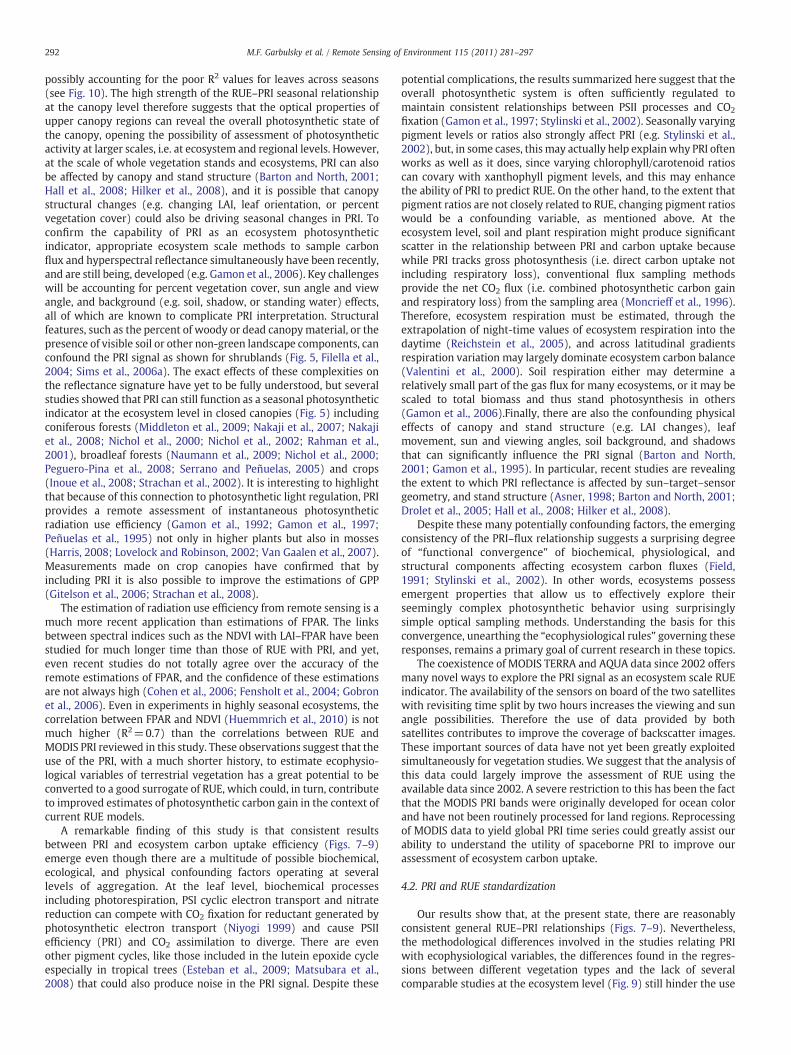
Fig. 9. Seasonal relationship between RUE calculated from eddy covariance derived GPP anda) PRI calculated from reflectance in bands 11 and 12 for aMediterranean forest (Garbulsky(circles, n=30) corresponds to a random subset of the points in theMediterranean forests (corrected sPRI=(1+PRI)/2 calculated from bands 11 and 13 in a boreal deciduous for(678 nm) as reference for eight boreal coniferous forests (Drolet et al., 2008). Recalculate
multiple seasons. Most of these studies showed the link between RUEand PRI and presented median R2 values between 0.4 and 0.75 forbroadleaf, conifers, crops and tundra vegetation types. The R2 forthese four vegetation types were not significantly different (t-test,pb0.05). The R2 for shrublands was instead only ca. 0.1 which wassignificantly different to the other vegetation types (Fig. 5).
3.2.3. Other factors of changeAt the canopy level and at the seasonal time scale, different types
of experiments have reported four significant relationships betweencanopy RUE and PRI (Fig. 6). PRI was also linked to ecophysiologicalvariables in mosses (Harris, 2008; Lovelock and Robinson, 2002; VanGaalen et al., 2007) and soil crusts (Yamano et al., 2006). Thosestudies showed that PRI links to Fv/Fm (R2=0.42−0.67), to EPS(R2=0.29), to NPQ (R2=0.80) and to water content (R2=0.82).Moreover, other studies analyzing other ecophysiological variablesshowed that PRI accounted for 46% of the spatial variability of CO2
uptake for a semiarid grassland and also accounted for 77% of thevariability for a coniferous forest across sites and dates (Black andGuo, 2008; Rahman et al., 2001).
3.2.4. General relationship at the canopy levelWe analyzed the data provided by those studies that used eddy
covariance to estimate RUE together with PRI at the canopy level
absorbed PAR (RUE=GPP/APAR) and different formulations of PRI fromMODIS data.et al., 2008b) and a temperate deciduous forest (Rahman et al., 2004). Regression linedots) and all the points for the temperate decidous forest (crosses) b) Atmosphericallyest (Drolet et al., 2005). c) Atmospherically corrected PRI calculated using band 14d and redrawn based on published data.
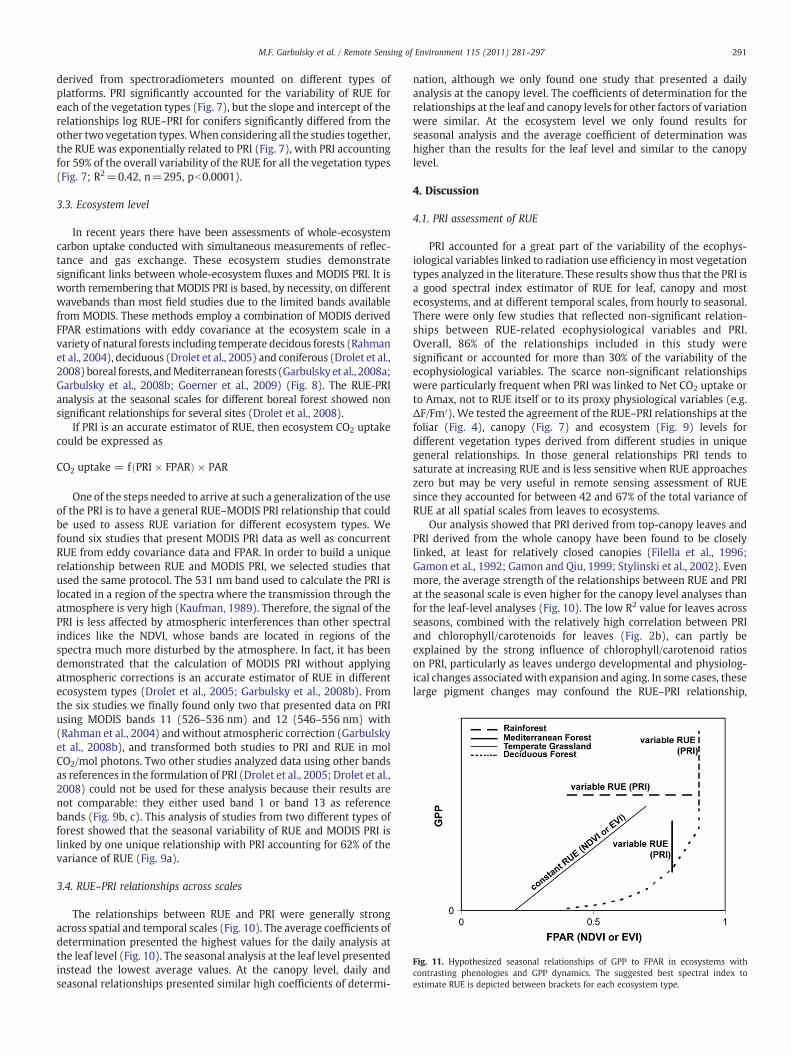
Fig. 11. Hypothesized seasonal relationships of GPP to FPAR in ecosystems withcontrasting phenologies and GPP dynamics. The suggested best spectral index toestimate RUE is depicted between brackets for each ecosystem type.
291M.F. Garbulsky et al. / Remote Sensing of Environment 115 (2011) 281–297
derived from spectroradiometers mounted on different types ofplatforms. PRI significantly accounted for the variability of RUE foreach of the vegetation types (Fig. 7), but the slope and intercept of therelationships log RUE–PRI for conifers significantly differed from theother two vegetation types.When considering all the studies together,the RUE was exponentially related to PRI (Fig. 7), with PRI accountingfor 59% of the overall variability of the RUE for all the vegetation types(Fig. 7; R2=0.42, n=295, pb0.0001).
3.3. Ecosystem level
In recent years there have been assessments of whole-ecosystemcarbon uptake conducted with simultaneous measurements of reflec-tance and gas exchange. These ecosystem studies demonstratesignificant links between whole-ecosystem fluxes and MODIS PRI. It isworth remembering that MODIS PRI is based, by necessity, on differentwavebands than most field studies due to the limited bands availablefrom MODIS. These methods employ a combination of MODIS derivedFPAR estimations with eddy covariance at the ecosystem scale in avariety of natural forests including temperate decidous forests (Rahmanet al., 2004), deciduous (Drolet et al., 2005) and coniferous (Drolet et al.,2008) boreal forests, andMediterranean forests (Garbulsky et al., 2008a;Garbulsky et al., 2008b; Goerner et al., 2009) (Fig. 8). The RUE-PRIanalysis at the seasonal scales for different boreal forest showed nonsignificant relationships for several sites (Drolet et al., 2008).
If PRI is an accurate estimator of RUE, then ecosystem CO2 uptakecould be expressed as
CO2 uptake = f PRI × FPARð Þ × PAR
One of the steps needed to arrive at such a generalization of the useof the PRI is to have a general RUE–MODIS PRI relationship that couldbe used to assess RUE variation for different ecosystem types. Wefound six studies that present MODIS PRI data as well as concurrentRUE from eddy covariance data and FPAR. In order to build a uniquerelationship between RUE and MODIS PRI, we selected studies thatused the same protocol. The 531 nm band used to calculate the PRI islocated in a region of the spectra where the transmission through theatmosphere is very high (Kaufman, 1989). Therefore, the signal of thePRI is less affected by atmospheric interferences than other spectralindices like the NDVI, whose bands are located in regions of thespectra much more disturbed by the atmosphere. In fact, it has beendemonstrated that the calculation of MODIS PRI without applyingatmospheric corrections is an accurate estimator of RUE in differentecosystem types (Drolet et al., 2005; Garbulsky et al., 2008b). Fromthe six studies we finally found only two that presented data on PRIusing MODIS bands 11 (526–536 nm) and 12 (546–556 nm) with(Rahman et al., 2004) andwithout atmospheric correction (Garbulskyet al., 2008b), and transformed both studies to PRI and RUE in molCO2/mol photons. Two other studies analyzed data using other bandsas references in the formulation of PRI (Drolet et al., 2005; Drolet et al.,2008) could not be used for these analysis because their results arenot comparable: they either used band 1 or band 13 as referencebands (Fig. 9b, c). This analysis of studies from two different types offorest showed that the seasonal variability of RUE and MODIS PRI islinked by one unique relationship with PRI accounting for 62% of thevariance of RUE (Fig. 9a).
3.4. RUE–PRI relationships across scales
The relationships between RUE and PRI were generally strongacross spatial and temporal scales (Fig. 10). The average coefficients ofdetermination presented the highest values for the daily analysis atthe leaf level (Fig. 10). The seasonal analysis at the leaf level presentedinstead the lowest average values. At the canopy level, daily andseasonal relationships presented similar high coefficients of determi-
nation, although we only found one study that presented a dailyanalysis at the canopy level. The coefficients of determination for therelationships at the leaf and canopy levels for other factors of variationwere similar. At the ecosystem level we only found results forseasonal analysis and the average coefficient of determination washigher than the results for the leaf level and similar to the canopylevel.
4. Discussion
4.1. PRI assessment of RUE
PRI accounted for a great part of the variability of the ecophys-iological variables linked to radiation use efficiency inmost vegetationtypes analyzed in the literature. These results show thus that the PRI isa good spectral index estimator of RUE for leaf, canopy and mostecosystems, and at different temporal scales, from hourly to seasonal.There were only few studies that reflected non-significant relation-ships between RUE-related ecophysiological variables and PRI.Overall, 86% of the relationships included in this study weresignificant or accounted for more than 30% of the variability of theecophysiological variables. The scarce non-significant relationshipswere particularly frequent when PRI was linked to Net CO2 uptake orto Amax, not to RUE itself or to its proxy physiological variables (e.g.ΔF/Fm′). We tested the agreement of the RUE–PRI relationships at thefoliar (Fig. 4), canopy (Fig. 7) and ecosystem (Fig. 9) levels fordifferent vegetation types derived from different studies in uniquegeneral relationships. In those general relationships PRI tends tosaturate at increasing RUE and is less sensitive when RUE approacheszero but may be very useful in remote sensing assessment of RUEsince they accounted for between 42 and 67% of the total variance ofRUE at all spatial scales from leaves to ecosystems.
Our analysis showed that PRI derived from top-canopy leaves andPRI derived from the whole canopy have been found to be closelylinked, at least for relatively closed canopies (Filella et al., 1996;Gamon et al., 1992; Gamon and Qiu, 1999; Stylinski et al., 2002). Evenmore, the average strength of the relationships between RUE and PRIat the seasonal scale is even higher for the canopy level analyses thanfor the leaf-level analyses (Fig. 10). The low R2 value for leaves acrossseasons, combined with the relatively high correlation between PRIand chlorophyll/carotenoids for leaves (Fig. 2b), can partly beexplained by the strong influence of chlorophyll/carotenoid ratioson PRI, particularly as leaves undergo developmental and physiolog-ical changes associatedwith expansion and aging. In some cases, theselarge pigment changes may confound the RUE–PRI relationship,
292 M.F. Garbulsky et al. / Remote Sensing of Environment 115 (2011) 281–297
possibly accounting for the poor R2 values for leaves across seasons(see Fig. 10). The high strength of the RUE–PRI seasonal relationshipat the canopy level therefore suggests that the optical properties ofupper canopy regions can reveal the overall photosynthetic state ofthe canopy, opening the possibility of assessment of photosyntheticactivity at larger scales, i.e. at ecosystem and regional levels. However,at the scale of whole vegetation stands and ecosystems, PRI can alsobe affected by canopy and stand structure (Barton and North, 2001;Hall et al., 2008; Hilker et al., 2008), and it is possible that canopystructural changes (e.g. changing LAI, leaf orientation, or percentvegetation cover) could also be driving seasonal changes in PRI. Toconfirm the capability of PRI as an ecosystem photosyntheticindicator, appropriate ecosystem scale methods to sample carbonflux and hyperspectral reflectance simultaneously have been recently,and are still being, developed (e.g. Gamon et al., 2006). Key challengeswill be accounting for percent vegetation cover, sun angle and viewangle, and background (e.g. soil, shadow, or standing water) effects,all of which are known to complicate PRI interpretation. Structuralfeatures, such as the percent of woody or dead canopymaterial, or thepresence of visible soil or other non-green landscape components, canconfound the PRI signal as shown for shrublands (Fig. 5, Filella et al.,2004; Sims et al., 2006a). The exact effects of these complexities onthe reflectance signature have yet to be fully understood, but severalstudies showed that PRI can still function as a seasonal photosyntheticindicator at the ecosystem level in closed canopies (Fig. 5) includingconiferous forests (Middleton et al., 2009; Nakaji et al., 2007; Nakajiet al., 2008; Nichol et al., 2000; Nichol et al., 2002; Rahman et al.,2001), broadleaf forests (Naumann et al., 2009; Nichol et al., 2000;Peguero-Pina et al., 2008; Serrano and Peñuelas, 2005) and crops(Inoue et al., 2008; Strachan et al., 2002). It is interesting to highlightthat because of this connection to photosynthetic light regulation, PRIprovides a remote assessment of instantaneous photosyntheticradiation use efficiency (Gamon et al., 1992; Gamon et al., 1997;Peñuelas et al., 1995) not only in higher plants but also in mosses(Harris, 2008; Lovelock and Robinson, 2002; Van Gaalen et al., 2007).Measurements made on crop canopies have confirmed that byincluding PRI it is also possible to improve the estimations of GPP(Gitelson et al., 2006; Strachan et al., 2008).
The estimation of radiation use efficiency from remote sensing is amuch more recent application than estimations of FPAR. The linksbetween spectral indices such as the NDVI with LAI–FPAR have beenstudied for much longer time than those of RUE with PRI, and yet,even recent studies do not totally agree over the accuracy of theremote estimations of FPAR, and the confidence of these estimationsare not always high (Cohen et al., 2006; Fensholt et al., 2004; Gobronet al., 2006). Even in experiments in highly seasonal ecosystems, thecorrelation between FPAR and NDVI (Huemmrich et al., 2010) is notmuch higher (R2=0.7) than the correlations between RUE andMODIS PRI reviewed in this study. These observations suggest that theuse of the PRI, with a much shorter history, to estimate ecophysio-logical variables of terrestrial vegetation has a great potential to beconverted to a good surrogate of RUE, which could, in turn, contributeto improved estimates of photosynthetic carbon gain in the context ofcurrent RUE models.
A remarkable finding of this study is that consistent resultsbetween PRI and ecosystem carbon uptake efficiency (Figs. 7–9)emerge even though there are a multitude of possible biochemical,ecological, and physical confounding factors operating at severallevels of aggregation. At the leaf level, biochemical processesincluding photorespiration, PSI cyclic electron transport and nitratereduction can compete with CO2 fixation for reductant generated byphotosynthetic electron transport (Niyogi 1999) and cause PSIIefficiency (PRI) and CO2 assimilation to diverge. There are evenother pigment cycles, like those included in the lutein epoxide cycleespecially in tropical trees (Esteban et al., 2009; Matsubara et al.,2008) that could also produce noise in the PRI signal. Despite these
potential complications, the results summarized here suggest that theoverall photosynthetic system is often sufficiently regulated tomaintain consistent relationships between PSII processes and CO2
fixation (Gamon et al., 1997; Stylinski et al., 2002). Seasonally varyingpigment levels or ratios also strongly affect PRI (e.g. Stylinski et al.,2002), but, in some cases, thismay actually help explain why PRI oftenworks as well as it does, since varying chlorophyll/carotenoid ratioscan covary with xanthophyll pigment levels, and this may enhancethe ability of PRI to predict RUE. On the other hand, to the extent thatpigment ratios are not closely related to RUE, changing pigment ratioswould be a confounding variable, as mentioned above. At theecosystem level, soil and plant respiration might produce significantscatter in the relationship between PRI and carbon uptake becausewhile PRI tracks gross photosynthesis (i.e. direct carbon uptake notincluding respiratory loss), conventional flux sampling methodsprovide the net CO2 flux (i.e. combined photosynthetic carbon gainand respiratory loss) from the sampling area (Moncrieff et al., 1996).Therefore, ecosystem respiration must be estimated, through theextrapolation of night-time values of ecosystem respiration into thedaytime (Reichstein et al., 2005), and across latitudinal gradientsrespiration variation may largely dominate ecosystem carbon balance(Valentini et al., 2000). Soil respiration either may determine arelatively small part of the gas flux for many ecosystems, or it may bescaled to total biomass and thus stand photosynthesis in others(Gamon et al., 2006).Finally, there are also the confounding physicaleffects of canopy and stand structure (e.g. LAI changes), leafmovement, sun and viewing angles, soil background, and shadowsthat can significantly influence the PRI signal (Barton and North,2001; Gamon et al., 1995). In particular, recent studies are revealingthe extent to which PRI reflectance is affected by sun–target–sensorgeometry, and stand structure (Asner, 1998; Barton and North, 2001;Drolet et al., 2005; Hall et al., 2008; Hilker et al., 2008).
Despite these many potentially confounding factors, the emergingconsistency of the PRI–flux relationship suggests a surprising degreeof “functional convergence” of biochemical, physiological, andstructural components affecting ecosystem carbon fluxes (Field,1991; Stylinski et al., 2002). In other words, ecosystems possessemergent properties that allow us to effectively explore theirseemingly complex photosynthetic behavior using surprisinglysimple optical sampling methods. Understanding the basis for thisconvergence, unearthing the “ecophysiological rules” governing theseresponses, remains a primary goal of current research in these topics.
The coexistence of MODIS TERRA and AQUA data since 2002 offersmany novel ways to explore the PRI signal as an ecosystem scale RUEindicator. The availability of the sensors on board of the two satelliteswith revisiting time split by two hours increases the viewing and sunangle possibilities. Therefore the use of data provided by bothsatellites contributes to improve the coverage of backscatter images.These important sources of data have not yet been greatly exploitedsimultaneously for vegetation studies. We suggest that the analysis ofthis data could largely improve the assessment of RUE using theavailable data since 2002. A severe restriction to this has been the factthat the MODIS PRI bands were originally developed for ocean colorand have not been routinely processed for land regions. Reprocessingof MODIS data to yield global PRI time series could greatly assist ourability to understand the utility of spaceborne PRI to improve ourassessment of ecosystem carbon uptake.
4.2. PRI and RUE standardization
Our results show that, at the present state, there are reasonablyconsistent general RUE–PRI relationships (Figs. 7–9). Nevertheless,the methodological differences involved in the studies relating PRIwith ecophysiological variables, the differences found in the regres-sions between different vegetation types and the lack of severalcomparable studies at the ecosystem level (Fig. 9) still hinder the use
293M.F. Garbulsky et al. / Remote Sensing of Environment 115 (2011) 281–297
of a general RUE–PRI relationship without a proper calibration in eachcase. A primary difference among different studies is in theformulation of the PRI. We found that several formulations arebeing used to calculate PRI, including different target wavelengths(530 nm, 531 nm or 539 nm), different reference bands, and acontrasting order of the subtraction with the reference band. Theuse of different wavelengths could have significant impact on PRI'spredictive ability (Inoue et al., 2008). There are probably also scaleissues associated with the band selection. PRI using the 570 nm bandwas useful at a single leaf scale, for which it was originally defined(Gamon et al., 1993b; Peñuelas et al., 1995), butmay be less useful at acanopy scale where PRI using the 550 nm band may have a higherpredictive ability (Inoue et al., 2008). The use of the sPRI (1+PRI)/2added even further difficulties in comparing between studies. In thecase of PRI derived from MODIS satellite data, bands 10 (488 nm), 12(551 nm), 13 (667 nm) and 14 (678 nm) have been used as referencebands, rendering the different studies incomparable.
On the other hand, the calculation of RUE involved a large set ofdifferences among protocols, e.g. different approaches for carbonuptake estimations, use of total irradiance vs. PAR, or total vs.absorbed PAR, and use of different units (MJ or mol), among others.The eddy covariance technique, which is nowadays the mostwidespread way to measure carbon fluxes at the ecosystem scale, isnot free from problems to reach reliable estimates of GPP (e.g.Serrano-Ortiz et al., 2010). For example, at this moment we cannotrule out interferences of abiotic or heterotrophic CO2 fluxes at theecosystem scale that can surely mask the true RUE–PRI relationship.
A greater availability of ground spectral measurements andtechnical improvements would help to make the PRI a more accurateestimator of RUE and therefore a more powerful tool. On one side, aground PRI measurement network coupled to the eddy covariancetowers (FLUXNET or others) could provide data for a definiteassessment of the utility of the PRI to estimate RUE. This networkshould be built on the design of a homogeneous sensor for all the siteswith the spectral information to calculate a ground-based PRI andother vegetation indices, with a field of view similar to the footprint ofthe tower. An effort in that direction has been advocated by theSpecNet community for several years (Gamon et al., 2006), and iscurrently being conducted at many flux tower sites. In addition, toovercome the problems related to the eddy covariance techniquestated before (e.g. abiotic fluxes, separation of photosynthetic andrespiratory fluxes) it would be highly desirable to make concurrentmeasurements of leaf-level photosynthetic rate and of soil respiration.To determine the photosynthetic contribution to the RUE–PRIrelationship, and to clarify the influence of various pigment pools onthe PRI, optical measurements coupled with pigment measurementsof top-canopy leaves should also be made whenever possible. Finally,long-term studies should also evaluate how structural changes (e.g.due to canopy growth or changing leaf display) might be contributingto the measured PRI signals. Consistent pigment and structuralmeasurements are rarely made in long-term studies, yet they remainessential to fully understand the mechanistic basis of the often highRUE–PRI correlation.
On the satellite side, the continued improvement of the spectralresolution provided by the sensors on board satellite platforms willhelp to obtain better estimations of PRI. The increase of the spectral(b10 nm) and the spatial (b1 km) resolution of the MODIS currentproducts by fusion techniques with images with higher resolutions(Feng et al., 2006; Pohl and Van Genderen, 1998) or the increase of thebackscatter view through techniques like the multiple viewing angleof the Chris–Proba satellite (Verrelst et al., 2008) are among the mostimmediate improvements. The nominal bandwidth of MODIS bandsseems broader than the original bands used for the formulation of PRIat the leaf level. However, the FWHM (full width of half maximum) ofthe MODIS bands are probably not much different from the FWHM ofmany field sensors that have been used in defining PRI at leaf to stand
scales. For example the Spectron (Spectron Engineering, Denver, CO,USA) and UniSpec (PP Systems, Amesbury MA, USA) sensors bothhave FWHM values of about 10 nm, even though their nominalbandwidth is 2–3 nm (Castro-Esau et al., 2006; Gamon et al., 1993a).So even though the nominal bandwidth is wider, the actualbandwidth is more similar across sensors than it might seem. A fullexploration of this topic would require wider availability of airborneand spaceborne hyperspectral sensors (imaging spectrometers),which have been largely unavailable to the broader ecologicalresearch community, with the exception of “demonstration”missions(e.g AVIRIS or Hyperion). In the case of the spatial resolution, sincemost of the eddy covariance towers presently working do notrepresent an area larger than 1 km2, and since the footprint variesconstantlywithwindspeed and direction, it is a challenge to produce asatellite-based PRI with a sufficient spatial resolution to match theeddy covariance sampling region. This goal can be achieved by newsensors but also by fusion or simultaneous use of different sourcesprovided by the actual sensors in orbit in order to obtain moreinformation than can be derived from each of the single sensor dataalone. In all cases, we advocate a standardization of both RUE (andproxy physiological variables) and PRI measurements and units thatallow the comparison of results and the study of possible generalrelationships. Similarly, careful attention to sun–target–sensor geom-etry and characterization of stand structure will be needed to fullyunderstand RUE–PRI relationships across ecosystems from contrast-ing biomes.
4.3. Ecosystem-specific PRI performances
Even if we standardize RUE and PRImeasurements and calculation,there are still great differences between terrestrial ecosystems in thedegree to which any one environmental factor controls photosyn-thetic rates and therefore on the capability of each vegetation index toestimate structural or functional variables. Therefore, using theavailable evidence, we find a wide variation in the degree to whichFPAR and RUE individually track the dynamics of temporal and spatialpatterns of carbon fluxes. Thus the ability to predict fluxes from theseindices for different biomes should be quite variable and will dependupon dominant factors affecting photosynthetic carbon flux (Fig. 11).For some terrestrial ecosystems, FPAR, estimated from vegetationindexes such as NDVI or EVI, or APAR are good surrogates of GPP (e.g.temperate grasslands). For others, there is indeed a positivecorrelation between FPAR or APAR and GPP, but a high part of thevariance of GPP is yet to be explained (Sims et al., 2006b). For thoseecosystems, primarily evergreen-dominated ones, PRI provides auseful index of seasonal carbon fluxes because of its connection withRUE, whereas FPAR would presumably be less useful in this contextsince FPAR or NDVI of evergreen plants changes little over seasonaltime scales (Gamon et al., 1995; Garbulsky et al., 2008b) (Fig. 11). Onthe contrary, PRI may not be effective in detecting ecosystem flux inecosystems where FPAR closely follows the seasonal dynamic of CO2
exchange. This seems to be the case in deciduous ecosystems wherephotosynthetic fluxes closely track seasonal greening and senescenceof the landscape (Sims et al., 2006b) or in the Artic tundra, where netCO2 uptake is often light limited, or in annual croplands andgrasslands where seasonal patterns of temperature or moistureconstrain production and carbon flux. In those ecosystems, FPARscales well with photosynthetic rates and NDVI or EVI are closely tiedto seasonal carbon dynamics and thus provide a dominant indicator ofecosystem CO2 uptake assessment (Sims et al., 2006b). In some otherecosystems, such as shrublands, PRI presented problems for ecosys-tem gas exchange assessment (Fig. 5), in part due to sun angle effectson discontinuous canopies. In desert areas, or in general in areas withhigh percentage of bare soil, such as some shrublands, shadows andnon photosynthetic or dead material can contribute strongly to thereflectance spectrum, rendering PRI less adequate for the estimation
294 M.F. Garbulsky et al. / Remote Sensing of Environment 115 (2011) 281–297
of RUE (Filella et al., 2004; Sims et al., 2006a). Thus, in sparselyvegetated regions, adjustment for percent cover may be needed toyield a useful PRI signal. In tropical areas, the atmospheric interference(e.g. cloudiness and aerosols) are often too high to obtain a good PRIsignal and moreover, some field studies on tropical species haveindicated that PRI does not scale well with ecophysiological variables,possibly due to the lutein epoxide cycle related reflectance (Martinet al., 2007; Rascher et al., 2007). Other tropical field studies havereported clear correlations between PRI and ecophysiological variables,but these relationships vary between species having different strategiesfor coping with light stress (Gamon et al., 2005).
The available data, although still scarce for most regions of theworld, are beginning to show that the usefulness of PRI relative to theFPAR estimations depends on the particular combination of environ-mental conditions, radiation use efficiencies, and structural charac-teristics of the different ecosystems in question. Therefore, aneffective application of remote sensing to carbon flux requires anecological understanding of the environmental controls on carbonflux for these different ecosystems, including the contribution of bioticand abiotic factors to the overall PRI signal. Fortunately, a number ofmethods exist to help address these topics, including radiativetransfer models (Jacquemoud et al., 2009), spectral mixture analysis(Numata et al., 2007), and BRDF (bidirectional reflectance distributionfunction) methods (Hilker et al., 2009a), and greater integration ofthese techniques with ecophysiological methods are needed to fullyunderstand the best way to apply the PRI signal.
5. Concluding remarks
The available evidence shows that the PRI is a reliable estimator ofecophysiological variables closely related to the photosyntheticefficiency at the leaf and canopy levels over a wide range of species,plant functional types and temporal scales. However, there are alsosome exceptions and differences in the protocols of the studies thatgenerate doubts about the generalization to satellite observablescales. The use of uniform protocols is needed to generate comparabledata and at the end a possible general calibration of the relation PRI–RUE. Further studies are also needed to disentangle the several driversof the PRI signal, and to resolve the potentially confounding factors sothat we can improve the assessment of CO2 fluxes in many differentbiomes using hyperspectral or narrow-band remote sensing. Whileflux towers still represent the current standard for ecosystem carbonflux, we must learn to properly calibrate these fluxes against the newremote sensing products if we are to develop reliable remotesampling methods for ecosystem carbon flux. This remains asignificant challenge because flux towers sample in time, whereasremotely sensed imagery samples in space (Rahman et al., 2001). Toconduct this calibration, we should blend these sampling domains byapplying remote sensing aircraft and satellite measurements at thesame temporal and spatial scales as flux tower footprint measure-ments, which is rarely done. Increased acquisition of coordinated fluxand optical data from different biomes is thus needed. Additionally,standardized ground-based optical sampling programs at flux towers(Gamon et al., 2006) should be expanded. Once we have properlycalibrated the surrogates for FPAR and PRI for different ecosystems,we will be able to apply remote sensing to extrapolate in time andspace from tower sites. Although there are currently few spaceborneremote sensing instruments of high spectral resolution (note thatHyperion and Chris/Proba are exceptions, but these are demonstra-tion instruments with limited accessibility), this type of data can nowbe collected from a range of novel helicopter and aircraft instruments(Malenovsky et al., 2009) and from the planned new satellite data.Meanwhile, the 530 nm waveband provided by the satellite-borneMODIS sensor, is starting to be used as a possible RUE indicator at theecosystem scale across different vegetation types with significant
success (Drolet et al., 2005; Drolet et al., 2008; Garbulsky et al., 2008a;Garbulsky et al., 2008b; Goerner et al., 2009; Rahman et al., 2004).
A goal of current studies should be to develop a robust, empiricallytested model for ecosystem fluxes driven by a richer degree ofremotely sensed information than in the past. This may provide analternative to complex models that require extensive parameteriza-tion and a huge quantity of ground climate data (Running et al., 2004).In this simpler approach, a remote measure of FPAR would becomplemented with PRI (a dynamic efficiency factor) to assess thecarbon fluxes of the different ecosystems from remote sensingairborne sensors. Since the flux images obtained in this way provideinstantaneous maps of gross CO2 fluxes (Fuentes et al., 2006; Rahmanet al., 2001), they have to be extended to daily values. These daily fluxestimates could then be integrated throughout the year to derivespatially distributed NPP values for different biomes. This could beachieved with a weekly or biweekly measurement of NDVI and PRIfrom an aerial or satellite-based sensor, combined with estimateddaily variations in PRI from calibration sites on the ground. Theexisting global network of eddy covariance towers (Baldocchi, 2008)provides an ideal ground data source for such calibration (Garbulskyet al., 2010).
The advances presented here have established the possibility ofcombining hyperspectral remote sensing and flux tower data toestimate spatially distributed carbon uptake over large areas, thus, upscaling point tower measurements to the regional scale (Drolet et al.,2008; Hilker et al., 2008). However, any application of the PRI at thisregional scale requires very careful attention to a number ofpotentially confounding factors, many of which are discussed above.An important parallel effort will be to better partition net ecosystemcarbon fluxes into their respiratory and photosynthetic components.Particularly if we further understand the ecological rules controllingecosystem respiration and photosynthesis across multiple ecosys-tems, we should be able to use these new tools to build a betterunderstanding of global carbon fluxes.
Acknowledgments
This work was funded by grants from the Catalan Government(SGR2009-458) and the Spanish Ministry of Education and Science(CGL2006-04025/BOS, CGL2010-17172/BOS and Consolider–IngenioMONTES CSD 2008-00040). M.F.G. gratefully acknowledges the supportby the University of Buenos Aires and the Commissioner forUniversities and Research of the Ministry of Innovation, Universitiesand Enterprise of the Catalan Government and of the European SocialFund.
References
Ac, A., Malenovsky, Z., Hanus, J., Tomaskova, I., Urban, O., & Marek, M. V. (2009). Near-distance imaging spectroscopy investigating chlorophyll fluorescence and photo-synthetic activity of grassland in the daily course. Functional Plant Biology, 36,1006−1015.
Asensio, D., Peñuelas, J., Ogaya, R., & Llusià, J. (2007). Seasonal soil and leaf CO2
exchanges rates in a Mediterranean holm oak forest and their responses to droughtconditions. Atmospheric Environment, 41, 2447−2455.
Asner, G. P. (1998). Biophysical and biochemical sources of variability in canopyreflectance. Remote Sensing of Environment, 64, 234−253.
Asner, G. P., Martin, R. E., Carlson, K. M., Rascher, U., & Vitousek, P. M. (2006).Vegetation–climate interactions among native and invasive species in Hawaiianrainforest. Ecosystems, 9, 1106−1117.
Asner, G. P., Nepstad, D., Cardinot, G., & Ray, D. (2004). Drought stress and carbonuptake in an Amazon forest measured with spaceborne imaging spectroscopy.Proceedings of the National Academy of Sciences of the United States of America, 101,6039−6044.
Baldocchi, D. (2008). Breathing of the terrestrial biosphere: lessons learned from aglobal network of carbon dioxide flux measurement systems. Australian Journal ofBotany, 56, 1−26.
Barton, C. V. M., & North, P. R. J. (2001). Remote sensing of canopy light use efficiencyusing the photochemical reflectance index — Model and sensitivity analysis.Remote Sensing of Environment, 78, 264−273.
295M.F. Garbulsky et al. / Remote Sensing of Environment 115 (2011) 281–297
Black, S. C., & Guo, X. (2008). Estimation of grassland CO2 exchange rates usinghyperspectral remote sensing techniques. International Journal of Remote Sensing,29, 145−155.
Blackburn, G. A. (2007). Hyperspectral remote sensing of plant pigments. Journal ofExperimental Botany, 58, 855−867.
Busch, F., Hüner, N. P. A., & Ensminger, I. (2009). Biochemical constrains limit thepotential of the photochemical reflectance index as a predictor of effectivequantum efficiency of photosynthesis during the winter spring transition in Jackpine seedlings. Functional Plant Biology, 36, 1016−1026.
Carter, G. A. (1998). Reflectance wavebands and indices for remote estimation ofphotosynthesis and stomatal conductance in pine canopies. Remote Sensing ofEnvironment, 63, 61−72.
Castro-Esau, K. L., Sanchez-Azofeifa, G. A., & Rivard, B. (2006). Comparison of spectralindices obtained using multiple spectroradiometers. Remote Sensing of Environ-ment, 103, 276−288.
Chen, W., Zhou, Q., & Huang, J. (2006). Estimating pigment contents in leaves andpanicles of rice after milky ripening by hyperspectral vegetation indices. ChineseJournal of Rice Science, 20, 434−439.
Cheng, Y. B., Middleton, E. M., Hilker, T., Coops, N. C., Black, T. A., & Krishnan, P. (2009).Dynamics of spectral bio-indicators and their correlations with light use efficiencyusing directional observations at a Douglas-fir forest. Measurement Science andTechnology, 20.
Cohen, W. B., Maiersperger, T. K., Turner, D. P., Ritts, W. D., Pflugmacher, D., Kennedy,R. E., et al. (2006). MODIS land cover and LAI collection 4 product quality acrossnine sites in the western hemisphere. IEEE Transactions on Geoscience and RemoteSensing, 44, 1843−1857.
Damm, A., Elbers, J., Erler, A., Gioli, B., Hamdi, K., Hutjes, R., et al. (2010). Remote sensingof sun-induced fluorescence to improve modeling of diurnal courses of grossprimary production (GPP). Global Change Biology, 16, 171−186.
Demmig-Adams, B. B., & Adams, W. W. (1996). The role of xanthophyll cyclecarotenoids in the protection of photosynthesis. Trends in Plant Science, 1, 21−26.
Dobrowski, S. Z., Pushnik, J. C., Zarco-Tejada, P. J., & Ustin, S. L. (2005). Simple reflectanceindices track heat and water stress-induced changes in steady-state chlorophyllfluorescence at the canopy scale. Remote Sensing of Environment, 97, 403−414.
Drolet, G. G., Huemmrich, K. F., Hall, F. G., Middleton, E. M., Black, T. A., Barr, A. G., et al.(2005). A MODIS-derived photochemical reflectance index to detect inter-annualvariations in the photosynthetic light-use efficiency of a boreal deciduous forest.Remote Sensing of Environment, 98, 212−224.
Drolet, G. G., Middleton, E. M., Huemmrich, K. F., Hall, F. G., Amiro, B. D., Barr, A. G., et al.(2008). Regional mapping of gross light-use efficiency using MODIS spectralindices. Remote Sensing of Environment, 112, 3064−3078.
Esteban, R., Olano, J. M., Castresana, J., Fernández-Marín, B., Hernández, A., Becerril, J. M.,et al. (2009). Distribution and evolutionary trends of photoprotective isoprenoids(xanthophylls and tocopherols)within the plant kingdom. Physiologia Plantarum, 135,379−389.
Evain, S., Flexas, J., & Moya, I. (2004). A new instrument for passive remote sensing: 2.Measurement of leaf and canopy reflectance changes at 531 nm and theirrelationship with photosynthesis and chlorophyll fluorescence. Remote Sensing ofEnvironment, 91, 175−185.
Feng, G., Masek, J., Schwaller, M., & Hall, F. (2006). On the blending of the Landsat andMODIS surface reflectance: Predicting daily Landsat surface reflectance. Geoscienceand Remote Sensing, IEEE Transactions on, 44, 2207−2218.
Fensholt, R., Sandholt, I., & Rasmussen, M. S. (2004). Evaluation of MODIS LAI, fAPARand the relation between fAPAR and NDVI in a semi-arid environment using in situmeasurements. Remote Sensing of Environment, 91, 490−507.
Field, C. B. (1991). Ecological scaling of carbon gain to stress and resource availability. InH. A. Mooney, W. E. Winner, & E. J. Pell (Eds.), Response of plants to multiple stresses(pp. 35−65). : Academic Press.
Field, C. B., Gamon, J. A., & Peñuelas, J. (1994). Remote sensing of photosynthesis. In E. -D.Schulze, & M. M. Caldwell (Eds.), Ecophysiology of photosynthesis. Ecological Studies,100. (pp. 511−527) Berlin, Heidelberg, New York: Springer.
Field, C. B., Randerson, J. T., & Malmstrom, C. M. (1995). Global net primary production:Combining ecology and remote sensing. Remote Sensing of Environment, 51, 74−88.
Filella, I., Amaro, T., Araus, J. L., & Peñuelas, J. (1996). Relationship betweenphotosynthetic radiation-use efficiency of Barley canopies and the photochemicalreflectance index (PRI). Physiologia Plantarum, 96, 211−216.
Filella, I., Peñuelas, J., Llorens, L., & Estiarte, M. (2004). Reflectance assessment ofseasonal and annual changes in biomass and CO2 uptake of a Mediterraneanshrubland submitted to experimental warming and drought. Remote Sensing ofEnvironment, 90, 308−318.
Filella, I., Porcar-Castell, A., Munné-Bosch, S., Bäck, J., Garbulsky, M. F., & Peñuelas, J.(2009). PRI assessment of long-term changes in carotenoids/chlorophyll ratio andshort-term changes in de-epoxidation state of the xanthophyll cycle. InternationalJournal of Remote Sensing, 30, 4443−4455.
Fuentes, D. A., Gamon, J. A., Cheng, Y. F., Claudio, H. C., Qiu, H. L., Mao, Z. Y., et al. (2006).Mapping carbon and water vapor fluxes in a chaparral ecosystem using vegetationindices derived from AVIRIS. Remote Sensing of Environment, 103, 312−323.
Gamon, J. A., Field, C. B., Bilger, W., Björkman, O., Fredeen, A., & Peñuelas, J. (1990).Remote sensing of the xanthophyll cycle and chlorophyll fluorescence in sunflowerleaves and canopies. Oecologia, 85, 1−7.
Gamon, J. A., Field, C. B., Fredeen, A. L., & Thayer, S. (2001). Assessing photosyntheticdownregulation in sunflower stands with an optically-based model. PhotosynthesisResearch, 67, 113−125.
Gamon, J. A., Field, C. B., Goulden, M., Griffin, K., Hartley, A., Joel, G., et al. (1995).Relationships between NDVI, canopy structure, and photosynthetic activity in threeCalifornian vegetation types. Ecological Applications, 5, 28−41.
Gamon, J. A., Field, C. B., Roberts, D. A., Ustin, S. L., & Valentini, R. (1993). Functionalpatterns in an annual grassland during an AVIRIS overflight. Remote Sensing ofEnvironment, 44, 239−253.
Gamon, J. A., Filella, I., & Peñuelas, J. (1993). The dynamic 531-nanometer Δ reflectancesignal: A survey of twenty angiosperm species. In H. Yamamoto, & C. Smith (Eds.),Photosynthetic responses to the environment (pp. 172−177). Rockville: AmericanSociety of Plant Physiologists.
Gamon, J. A., Kitajima, K., Mulkey, S. S., Serrano, L., &Wright, S. J. (2005). Diverse opticaland photosynthetic properties in a neotropical dry forest during the dry season:Implications for remote estimation of photosynthesis. Biotropica, 37, 547−560.
Gamon, J. A., Peñuelas, J., & Field, C. B. (1992). A narrow-waveband spectral index thattracks diurnal changes in photosynthetic efficiency. Remote Sensing of Environment,41, 35−44.
Gamon, J. A., & Qiu, H. -L. (1999). Ecological applications of remote sensing at multiplescales. In F. I. Pugnaire, & F. Valladares (Eds.), Handbook of functional plant ecology(pp. 805−846). New York: Marcel Dekker, Inc.
Gamon, J. A., Rahman, A. F., Dungan, J. L., S, M., & Huemmrich, K. F. (2006). SpectralNetwork (SpecNet): what is it and why do we need it? Remote Sensing ofEnvironment, 103, 227−235.
Gamon, J. A., Serrano, L., & Surfus, J. S. (1997). The photochemical reflectance index: anoptical indicator of photosynthetic radiation use efficiency across species,functional types, and nutrient levels. Oecologia, 112, 492−501.
Gamon, J. A., & Surfus, J. S. (1999). Assessing leaf pigment content and activity with areflectometer. The New Phytologist, 143, 105−117.
Garbulsky, M. F., & Paruelo, J. M. (2004). Remote sensing of protected areas to derivebaseline vegetation functioning characteristics. Journal of Vegetation Science, 15,711−720.
Garbulsky, M. F., Peñuelas, J., Ourcival, J. M., & Filella, I. (2008a). Estimación de laeficiencia del uso de la radiación en bosques mediterráneos a partir de datosMODIS. Uso del Indice de Reflectancia Fotoquímica (PRI). Ecosistemas, 17, 89−97.
Garbulsky, M. F., Peñuelas, J., Papale, D., & Filella, I. (2008b). Remote estimation ofcarbon dioxide uptake of a Mediterranean forest. Global Change Biology, 14,2860−2867.
Garbulsky, M. F., Peñuelas, J., Papale, D., Ardö, J., Goulden, M. L., Kiely, G., et al. (2010).Patterns and controls of the variability of radiation use efficiency and primaryproductivity across terrestrial ecosystems. Global Ecology and Biogeography, 19,253−267.
Gerosa, G., Marzuoli, R., Rossini, M., Panigada, C., Meroni, M., Colombo, R., et al. (2009).A flux-based assessment of the effects of ozone on foliar injury, photosynthesis, andyield of bean (Phaseolus vulgaris L. cv. Borlotto Nano Lingua di Fuoco) in open-topchambers. Environmental Pollution, 157, 1727−1736.
Gitelson, A. A., Vina, A., Verma, S. B., Rundquist, D. C., Arkebauer, T. J., Keydan, G., et al.(2006). Relationship between gross primary production and chlorophyll content incrops: Implications for the synoptic monitoring of vegetation productivity. Journalof Geophysical Research, [Atmospheres], 111.
Gobron, N., Pinty, B., Aussedat, O., Chen, J. M., Cohen, W. B., Fensholt, R., et al. (2006).Evaluation of fraction of absorbed photosynthetically active radiation products fordifferent canopy radiation transfer regimes: Methodology and results using JointResearch Center products derived from SeaWiFS against ground-based estimations.Journal of Geophysical Research, [Atmospheres], 111.
Goerner, A., Reichstein, M., & Rambal, S. (2009). Tracking seasonal drought effects onecosystem light use efficiency with satellite-based PRI in a Mediterranean forest.Remote Sensing of Environment, 113, 1101−1111.
Grace, J., Nichol, C., Disney, M., Lewis, P., Quaife, T., & Bowyer, P. (2007). Can wemeasure terrestrial photosynthesis from space directly, using spectral reflectanceand fluorescence? Global Change Biology, 13, 1484−1497.
Guo, J. M., & Trotter, C. M. (2004). Estimating photosynthetic light-use efficiency usingthe photochemical reflectance index: Variations among species. Functional PlantBiology, 31, 255−265.
Guo, J. M., & Trotter, C. M. (2006). Estimating photosynthetic light-use efficiency usingthe photochemical reflectance index: The effects of short-term exposure toelevated CO2 and low temperature. International Journal of Remote Sensing, 27,4677−4684.
Hall, F.G.,Hilker, T., Coops,N.C., Lyapustin,A., Huemmrich,K. F.,Middleton, E., et al. (2008).Multi-angle remote sensing of forest light use efficiency by observing PRI variationwith canopy shadow fraction. Remote Sensing of Environment, 112, 3201−3211.
Harris, A. (2008). Spectral reflectance and photosynthetic properties of Sphagnummosses exposed to progressive drought. Ecohydrology, 1, 35−42.
Hilker, T., Coops, N. C., Coggins, S. B., Wulder, M. A., Brown, M., Black, T. A., et al. (2009a).Detection of foliage conditions and disturbance from multi-angular high spectralresolution remote sensing. Remote Sensing of Environment, 113, 421−434.
Hilker, T., Coops, N. C., Hall, F. G., Black, T. A., Wulder, M. A., Nesic, Z., et al. (2008).Separating physiologically and directionally induced changes in PRI using BRDFmodels. Remote Sensing of Environment, 112, 2777−2788.
Hilker, T., Lyapustin, A., Hall, F. G., Wang, Y., Coops, N. C., Drolet, G., et al. (2009b). Anassessment of photosynthetic light use efficiency from space: Modeling theatmospheric and directional impacts on PRI reflectance. Remote Sensing ofEnvironment, 113, 2463−2475.
Huemmrich, K. F., Gamon, J. A., Tweedie, C. E., Oberbauer, S. F., Kinoshita, G., Houston, S.,et al. (2010). Remote sensing of tundra gross ecosystem productivity and light useefficiency under varying temperature and moisture conditions. Remote Sensing ofEnvironment, 114, 481−489.
Inamullah, & Isoda, A. (2005). Adaptive responses of soybean and cotton to water stressII. Changes in CO2 assimilation rate, chlorophyll fluorescence and photochemicalreflectance index in relation to leaf temperature. Plant Production Science, 8,131−138.
296 M.F. Garbulsky et al. / Remote Sensing of Environment 115 (2011) 281–297
Inoue, Y., & Peñuelas, J. (2006). Relationship between light use efficiency andphotochemical reflectance index in soybean leaves as affected by soil watercontent. International Journal of Remote Sensing, 27, 5109−5114.
Inoue, Y., Peñuelas, J., Miyata, A., & Mano, M. (2008). Normalized difference spectralindices for estimating photosynthetic efficiency and capacity at a canopy scalederived from hyperspectral and CO2 flux measurements in rice. Remote Sensing ofEnvironment, 112, 156−172.
Jacquemoud, S., Verhoef, W., Baret, F., Bacour, C., Zarco-Tejada, P. J., Asner, G. P., et al.(2009). PROSPECT plus SAIL models: A review of use for vegetation characteriza-tion. Remote Sensing of Environment, 113, S56−S66.
Kaufman, Y. J. (1989). The atmospheric effect on remote sensing and its correction. In G.Asrar (Ed.), Theory and applications of optical remote sensing (pp. 336−428). NewYork: John Wiley & Sons, Inc.
Landsberg, J. J., & Waring, R. H. (1997). A generalised model of forest productivity usingsimplified concepts of radiation-use efficiency, carbon balance and partitioning.Forest Ecology and Management, 95, 209−228.
Le Quere, C., Raupach, M. R., Canadell, J. G., Marland, G., Bopp, L., Ciais, P., et al. (2009).Trends in the sources and sinks of carbon dioxide. Nature Geoscience, doi:10.1038/ngeo689.
Letts, M. G., Phelan, C. A., Johnson, D. R. E., & Rood, S. B. (2008). Seasonal photosyntheticgas exchange and leaf reflectance characteristics of male and female cottonwoodsin a riparian woodland. Tree Physiology, 28, 1037−1048.
Louis, J., Ounis, A., Ducruet, J. M., Evain, S., Laurila, T., Thum, T., et al. (2005). Remotesensing of sunlight-induced chlorophyll fluorescence and reflectance of Scots pinein the boreal forest during spring recovery. Remote Sensing of Environment, 96,37−48.
Lovelock, C. E., & Robinson, S. A. (2002). Surface reflectance properties of Antarctic mossand their relationship to plant species, pigment composition and photosyntheticfunction. Plant, Cell & Environment, 25, 1239−1250.
Malenovsky, Z., Mishra, K. B., Zemek, F., Rascher, U., & Nedbal, L. (2009). Scientific andtechnical challenges in remote sensing of plant canopy reflectance and fluores-cence. Journal of Experimental Botany, 60, 2987−3004.
Mänd, P., Hallik, L., Peñuelas, J., Nilson, T., Duce, P., Emmet, B. A., et al. (2010). Responsesof the reflectance indices PRI and NDVI to experimental warming and drought inEuropean shrublands along a north–south climatic gradient. Remote Sensing ofEnvironment, 114, 626−636.
Martin, R., Asner, G., & Sack, L. (2007). Genetic variation in leaf pigment, optical andphotosynthetic function among diverse phenotypes of Metrosideros polymorphagrown in a common garden. Oecologia, 151, 387−400.
Martin, R. E., & Asner, G. P. (2009). Leaf chemical and optical properties of Metrosiderospolymorpha across environmental gradients in Hawaii. Biotropica, 41, 292−301.
Matsubara, S., Krause, G. H., Seltmann, M., Virgo, A., Kursar, T. A., Jahns, P., et al. (2008).Lutein epoxide cycle, light harvesting and photoprotection in species of the tropicaltree genus Inga. Plant, Cell & Environment, 31, 548−561.
Meroni, M., Picchi, V., Rossini, M., Cogliati, S., Panigada, C., Nali, C., et al. (2008a). Leaflevel early assessment of ozone injuries by passive fluorescence and photochemicalreflectance index. International Journal of Remote Sensing, 29, 5409−5422.
Meroni, M., Rossini, M., Picchi, V., Panigada, C., Cogliati, S., Nali, C., et al. (2008b).Assessing steady-state fluorescence and PRI from hyperspectral proximal sensingas early indicators of plant stress: The case of ozone exposure. Sensors, 8,1740−1754.
Methy, M. (2000). Analysis of photosynthetic activity at the leaf and canopy levels fromreflectance measurements: A case study. Photosynthetica, 38, 505−512.
Methy, M., Joffre, R., & Rambal, S. (1999). Remote sensing of canopy photosyntheticperformances: Two complementary ways for assessing the photochemicalreflectance index. Photosynthetica, 37, 239−247.
Middleton, E. M., Cheng, Y. B., Hilker, T., Black, T. A., Krishnan, P., Coops, N. C., et al.(2009). Linking foliage spectral responses to canopy-level ecosystem photosyn-thetic light-use efficiency at a Douglas-fir forest in Canada. Canadian Journal ofRemote Sensing, 35, 166−188.
Moncrieff, J. B., Malhi, Y., & Leuning, R. (1996). The propagation of errors in long-termmeasurements of land–atmosphere fluxes of carbon and water. Global ChangeBiology, 2, 231−240.
Monteith, J. L. (1977). Climate and the efficiency of crop production in Britain.Philosophical Transactions of the Royal Society B: Biological Sciences, 281, 277−294.
Moran, J. A., Mitchell, A. K., Goodmanson, G., & Stockburger, K. A. (2000). Differentiationamong effects of nitrogen fertilization treatments on conifer seedlings by foliarreflectance: A comparison of methods. Tree Physiology, 20, 1113−1120.
Myneni, R. B., Los, S. O., & Asrar, G. (1995). Potential gross primary productivity of terrestrialvegetation from 1982–1990. Geophysical Research Letters, 22, 2617−2620.
Nakaji, T., Ide, R., Oguma, H., Saigusa, N., & Fujinuma, Y. (2007). Utility of spectralvegetation index for estimation of gross CO2 flux under varied sky conditions.Remote Sensing of Environment, 109, 274−284.
Nakaji, T., Ide, R., Takagi, K., Kosugi, Y., Ohkubo, S., Nasahara, K. N., et al. (2008). Utility ofspectral vegetation indices for estimation of light conversion efficiency inconiferous forests in Japan. Agricultural and Forest Meteorology, 148, 776−787.
Nakaji, T., Oguma, H., & Fujinuma, Y. (2006). Seasonal changes in the relationshipbetween photochemical reflectance index and photosynthetic light use efficiencyof Japanese larch needles. International Journal of Remote Sensing, 27, 493−509.
Naumann, J. C., Anderson, J. E., & Young, D. R. (2008a). Linking physiological responses,chlorophyll fluorescence and hyperspectral imagery to detect salinity stress usingthe physiological reflectance index in the coastal shrub, Myrica cerifera. RemoteSensing of Environment, 112, 3865−3875.
Naumann, J. C., Young, D. R., & Anderson, J. E. (2008b). Leaf chlorophyll fluorescence,reflectance, and physiological response to freshwater and saltwater flooding in theevergreen shrub, Myrica cerifera. Environmental and Experimental Botany, 63, 402−409.
Naumann, J. C., Young, D. R., & Anderson, J. E. (2009). Spatial variations in salinity stressacross a coastal landscape using vegetation indices derived from hyperspectralimagery. Plant Ecology, 202, 285−297.
Nichol, C. J., Huemmrich, K. F., Black, T. A., Jarvis, P. G., Walthall, C. L., Grace, J., et al.(2000). Remote sensing of photosynthetic-light-use efficiency of boreal forest.Agricultural and Forest Meteorology, 101, 131−142.
Nichol, C. J., Lloyd, J., Shibistova, O., Arneth, A., Roser, C., Knohl, A., et al. (2002). Remotesensing of photosynthetic-light-use efficiency of a Siberian boreal forest. TellusSeries B-Chemical and Physical Meteorology, 54, 677−687.
Nichol, C. J., Rascher, U., Matsubara, S., & Osmond, B. (2006). Assessing photosyntheticefficiency in an experimental mangrove canopy using remote sensing andchlorophyll fluorescence. Trees-Structure and Function, 20, 9−15.
Niyogi, K. K. (1999). Photoprotection revisited: Genetic and molecular approaches.Annual Review Plant Physiology and Plant Molecular Biology, 50, 333−359.
Numata, I., Roberts, D. A., Chadwick, O. A., Schimel, J., Sampaio, F. R., Leonidas, F. C., et al.(2007). Characterization of pasture biophysical properties and the impact ofgrazing intensity using remotely sensed data. Remote Sensing of Environment, 109,314−327.
Ogaya, R., & Peñuelas, J. (2003). Comparative seasonal gas exchange and chlorophyllfluorescence of thwo dominant woody species in a Holm Oak Forest. Flora, 198,132−141.
Ollinger, S. V., Richardson, A. D., Martin, M. E., Hollinger, D. Y., Frolking, S. E., Reich, P. B.,et al. (2008). Canopy nitrogen, carbon assimilation, and albedo in temperate andboreal forests: Functional relations and potential climate feedbacks. Proceedings ofthe National Academy of Sciences, 105, 19336−19341.
Panigada, C., Rossini, M., Meroni, M., Marzuoli, R., Gerosa, G., & Colombo, R. (2009).Indicators of ozone effects on Fagus sylvatica L. by means of spectroradiometricmeasurements. Rivista Italiana Di Telerilevamento, 41, 3−20.
Peguero-Pina, J. J., Morales, F., Flexas, J., Gil-Pelegrin, E., & Moya, I. (2008).Photochemistry, remotely sensed physiological reflectance index and de-epoxida-tion state of the xanthophyll cycle in Quercus coccifera under intense drought.Oecologia, 156, 1−11.
Peñuelas, J., & Filella, I. (1998). Visible and near-infrared reflectance techniques fordiagnosing plant physiological status. Trends in Plant Science, 3, 151−156.
Peñuelas, J., Filella, I., & Gamon, J. A. (1995). Assessment of photosynthetic radiation-use efficiency with spectral reflectance. The New Phytologist, 131, 291−296.
Peñuelas, J., Filella, I., Gamon, J. A., & Field, C. (1997a). Assessing photosyntheticradiation-use efficiency of emergent aquatic vegetation from spectral reflectance.Aquatic Botany, 58, 307−315.
Peñuelas, J., Filella, I., Llusia, J., Siscart, D., & Piñol, J. (1998). Comparative field study ofspring and summer leaf gas exchange and photobiology of the Mediterranean treesQuercus ilex and Phillyrea latifolia. Journal of Experimental Botany, 49, 229−238.
Peñuelas, J., Gamon, J. A., Fredeen, A. L., Merino, J., & Field, C. B. (1994). Reflectanceindexes associated with physiological-changes in nitrogen-limited and water-limited sunflower leaves. Remote Sensing of Environment, 48, 135−146.
Peñuelas, J., & Inoue, Y. (2000). Reflectance assessment of canopy CO2 uptake.International Journal of Remote Sensing, 21, 3353−3356.
Peñuelas, J., & Llusia, J. (2002). Linking photorespiration, monoterpenes and thermo-tolerance in Quercus. The New Phytologist, 155, 227−237.
Peñuelas, J., Llusia, J., Pinol, J., & Filella, I. (1997b). Photochemical reflectance index andleaf photosynthetic radiation-use-efficiency assessment in Mediterranean trees.International Journal of Remote Sensing, 18, 2863−2868.
Peñuelas, J., Munne-Bosch, S., Llusia, J., & Filella, I. (2004). Leaf reflectance and photo-and antioxidant protection in field-grown summer-stressed Phillyrea angustifolia.Optical signals of oxidative stress? The New Phytologist, 162, 115−124.
Pohl, C., & Van Genderen, J. L. (1998). Multisensor image fusion in remote sensing:concepts, methods and applications. International Journal of Remote Sensing, 19,823−854.
Raddi, S., Cortes, S., Pippi, I., & Magnani, F. (2005). Estimation of vegetationphotochemical processes: An application of the photochemical reflectance indexat the San Rossore test site. Proc. of the 3rd ESA CHRIS/ProbaWorkshop. Frascati, Italy.
Rahman, A. F., Cordova, V. D., Gamon, J. A., Schmid, H. P., & Sims, D. A. (2004). Potentialof MODIS ocean bands for estimating CO2 flux from terrestrial vegetation: A novelapproach. Geophysical Research Letters, doi:10.1029/ 2004GL019778, 31.
Rahman, A. F., Gamon, J. A., Fuentes, D. A., Roberts, D. A., & Prentiss, D. (2001). Modelingspatially distributed ecosystem flux of boreal forest using hyperspectral indicesfrom AVIRIS imagery. Atmospheres, 106, 33579−33591.
Rascher, U., Nichol, C. J., Small, C., & Hendricks, L. (2007). Monitoring spatio-temporaldynamics of photosynthesis with a portable hyperspectral imaging system.Photogrammetric Engineering and Remote Sensing, 73, 45−56.
Reichstein, M., Falge, E., Baldocchi, D., Papale, D., Aubinet, M., Berbigier, P., et al. (2005).On the separation of net ecosystem exchange into assimilation and ecosystemrespiration: review and improved algorithm. Global Change Biology, 11,1424−1439.
Richardson, A. D., & Berlyn, G. P. (2002). Changes in foliar spectral reflectance andchlorophyll fluorescence of four temperate species following branch cutting. TreePhysiology, 22, 499−506.
Richardson, A. D., Berlyn, G. P., & Gregoire, T. G. (2001). Spectral reflectance of Picea rubens(Pinaceae) and Abies balsamea (Pinaceae) needles along an elevational gradient, Mt.Moosilauke, New Hampshire, USA. American Journal of Botany, 88, 667−676.
Ruimy, A., Saugier, B., & Dedieu, G. (1994). Methodology for the estimation of terrestrialnet primary production from remotely sensed data. Journal of Geophysical Research,99, 5263−5283.
Running, S. W., & Nemani, R. R. (1988). Relating seasonal patterns of the AVHRRvegetation index to simulated photosynthesis and transpiration of forests indifferent climates. Remote Sensing of Environment, 24, 347−367.
297M.F. Garbulsky et al. / Remote Sensing of Environment 115 (2011) 281–297
Running, S. W., Nemani, R. R., Heinsch, F. A., Zhao, M., Reeves, M., & Hashimoto, H.(2004). A continuous satellite-derived measure of global terrestrial primaryproduction. Bioscience, 54, 547−560.
Runyon, J., Waring, R. H., Goward, S. N., & Welles, J. M. (1994). Environmental limits onnet primary production and light-use efficiency across the Oregon Transect.Ecological Applications, 4, 226−237.
Serrano-Ortiz, P., Roland, M., Sanchez-Moral, S., Janssens, I. A., Domingo, F., Goddéris, Y.,et al. (2010). Hidden, abiotic CO2 flows and gaseous reservoirs in the terrestrialcarbon cycle: Review and perspectives. Agricultural and Forest Meteorology, 150,321−329.
Serrano, L., & Peñuelas, J. (2005). Assessing forest structure and function from spectraltransmittance measurements: A case study in a Mediterranean holm oak forest.Tree Physiology, 25, 67−74.
Sims, D. A., & Gamon, J. A. (2002). Relationships between leaf pigment content andspectral reflectance across a wide range of species, leaf structures and develop-mental stages. Remote Sensing of Environment, 81, 337−354.
Sims, D. A., Luo, H., Hastings, S., Oechel, W. C., Rahman, A. F., & Gamon, J. A. (2006).Parallel adjustments in vegetation greenness and ecosystem CO2 exchange inresponse to drought in a Southern California chaparral ecosystem. Remote Sensingof Environment, 103, 289−303.
Sims, D. A., Rahman, A. F., Cordova, V. D., El-Masri, B. Z., Baldocchi, D. D., Bolstad, P. V.,et al. (2008). A new model of gross primary productivity for North Americanecosystems based solely on the enhanced vegetation index and land surfacetemperature from MODIS. Remote Sensing of Environment, 112, 1633−1646.
Sims, D. A., Rahman, A. F., Cordova, V. D., El-Masri, B. Z., Baldocchi, D. D., Flanagan, L. B.,et al. (2006). On the use of MODIS EVI to assess gross primary productivity of NorthAmerican ecosystems. Journal of Geophysical Research, Biogeosciences, G04015, doi:10.1029/ 2006JG000162, 111.
Strachan, I. B., Pattey, E., & Boisvert, J. B. (2002). Impact of nitrogen and environmentalconditions on corn as detected by hyperspectral reflectance. Remote Sensing ofEnvironment, 80, 213−224.
Strachan, I. B., Pattey, E., Salustro, C., & Miller, J. R. (2008). Use of hyperspectral remotesensing to estimate the gross photosynthesis of agricultural fields. Canadian Journalof Remote Sensing, 34, 333−341.
Stylinski, C. D., Gamon, J. A., & Oechel, W. C. (2002). Seasonal patterns of reflectanceindices, carotenoid pigments and photosynthesis of evergreen chaparral species.Oecologia, 131, 366−374.
Stylinski, C. D., Oechel, W. C., Gamon, J. A., Tissue, D. T., Miglietta, F., & Raschi, A. (2000).Effects of lifelong CO2 enrichment on carboxylation and light utilization of Quercuspubescens Willd. examined with gas exchange, biochemistry and optical techni-ques. Plant, Cell & Environment, 23, 1353−1362.
Suárez, L., Zarco-Tejada, P. J., Sepulcre-Cantó, G., Pérez-Priego, O., Miller, J. R., Jiménez-Muñoz, J. C., et al. (2008). Assessing canopy PRI for water stress detection withdiurnal airborne imagery. Remote Sensing of Environment, 112, 560−575.
Tambussi, E. A., Casadesus, J., Munne-Bosch, S. M., & Araus, J. L. (2002). Photoprotectionin water-stressed plants of durum wheat (Triticum turgidum var. durum): Changes
in chlorophyll fluorescence, spectral signature and photosynthetic pigments.Functional Plant Biology, 29, 35−44.
Trotter, G. M., Whitehead, D., & Pinkney, E. J. (2002). The photochemical reflectanceindex as a measure of photosynthetic light use efficiency for plants with varyingfoliar nitrogen contents. International Journal of Remote Sensing, 23, 1207−1212.
Valentini, R., Matteucci, G., Dolman, A. J., Schulze, E. D., Rebmann, C., Moors, E. J., et al.(2000). Respiration as the main determinant of carbon balance in European forests.Nature, 404, 861−865.
Van Gaalen, K. E., Flanagan, L. B., & Peddle, D. R. (2007). Photosynthesis, chlorophyllfluorescence and spectral reflectance in Sphagnum moss at varying water contents.Oecologia, 153, 19−28.
Verrelst, J., Schaepman, M. E., Koetz, B., & Kneubuhler, M. (2008). Angular sensitivityanalysis of vegetation indices derived from CHRIS/PROBA data. Remote Sensing ofEnvironment, 112, 2341−2353.
Weng, J. H., Chen, Y. N., & Liao, T. S. (2006a). Relationships between chlorophyllfluorescence parameters and photochemical reflectance index of tree speciesadapted to different temperature regimes. Functional Plant Biology, 33, 241−246.
Weng, J. H., Jhaung, L. H., Jiang, J. Y., Lai, G. M., & Liao, T. S. (2006b). Down-regulation ofphotosystem 2 efficiency and spectral reflectance in mango leaves under very lowirradiance and varied chilling treatments. Photosynthetica, 44, 248−254.
Weng, J. H., Lai, K. M., Liao, T. S., Hwang, M. Y., & Chen, Y. N. (2009). Relationships ofphotosynthetic capacity to PSII efficiency and to photochemical reflectance index ofPinus taiwanensis through different seasons at high and low elevations of sub-tropical Taiwan. Trees-Structure and Function, 23, 347−356.
Weng, J. H., Liao, T. S., Hwang, M. Y., Chung, C. C., Lin, C. P., & Chu, C. H. (2006c). Seasonalvariation in photosystem II efficiency and photochemical reflectance index ofevergreen trees and perennial grasses growing at low and high elevations insubtropical Taiwan. Tree Physiology, 26, 1097−1104.
Whitehead, D., Boelman, N. T., Turnbull, M. H., Griffin, K. L., Tissue, D. T., Barbour, M. M.,et al. (2005). Photosynthesis and reflectance indices for rainforest species inecosystems undergoing progression and retrogression along a soil fertilitychronosequence in New Zealand. Oecologia, 144, 233−244.
Winkel, T., Methy, M., & Thenot, F. (2002). Radiation use efficiency, chlorophyllfluorescence, and reflectance indices associated with ontogenic changes in water-limited Chenopodium quinoa leaves. Photosynthetica, 40, 227−232.
Wu, C. Y., Niu, Z., Tang, Q., & Huang, W. J. (2009). Effects of N, K fertilization on therelationship between photosynthetic light use efficiency and photochemicalreflectance index (PRI). Spectroscopy and Spectral Analysis, 29, 455−458.
Yamano, H., Chen, J., Zhang, Y., & Tamura, M. (2006). Relating photosynthesis ofbiological soil crusts with reflectance: Preliminary assessment based on a hydrationexperiment. International Journal of Remote Sensing, 27, 5393−5399.
Zhou, Q. F., & Wang, J. H. (2003). Leaf and spike reflectance spectra of rice withcontrasting nitrogen supplemental levels. International Journal of Remote Sensing,24, 1587−1593.