remote sensing introduction to light and color. what is remote sensing? introduction to satellite...
TRANSCRIPT

Remote Sensing
• Introduction to light and color.
• What is remote sensing?
• Introduction to satellite imagery.
• 5 resolutions of satellite imagery.
• Satellite image display.
Electromagnetic Waves
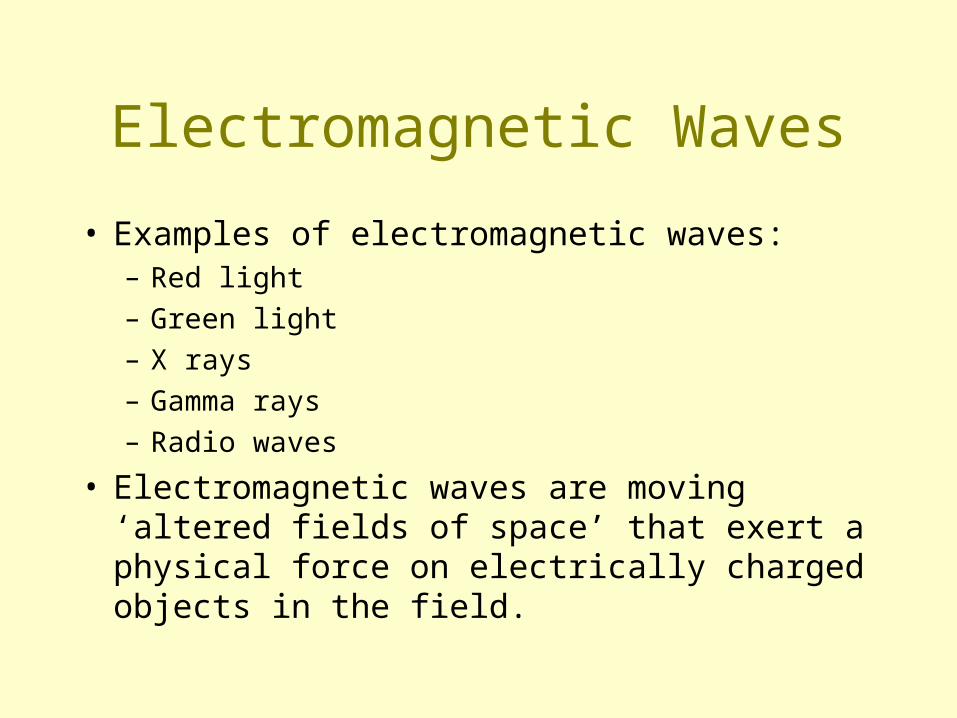
• Examples of electromagnetic waves:– Red light
– Green light
– X rays
– Gamma rays
– Radio waves
• Electromagnetic waves are moving ‘altered fields of space’ that exert a physical force on electrically charged objects in the field.
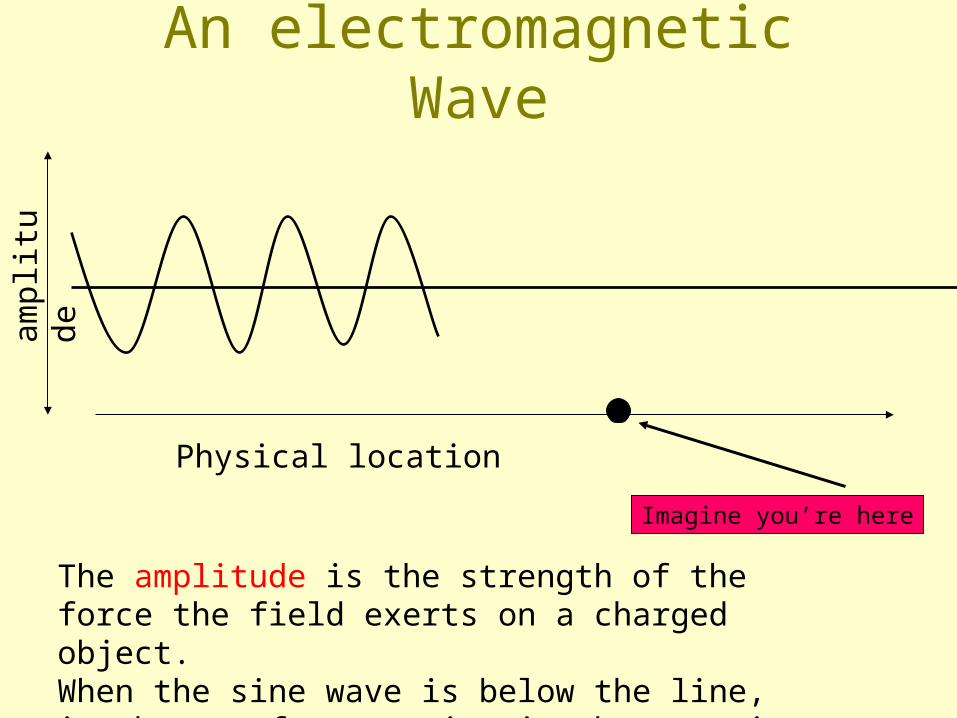
An electromagnetic Waveam
plit
ude
The amplitude is the strength of the force the field exerts on a charged object. When the sine wave is below the line, it shows a force acting in the negative direction.
Physical location
Imagine you’re here
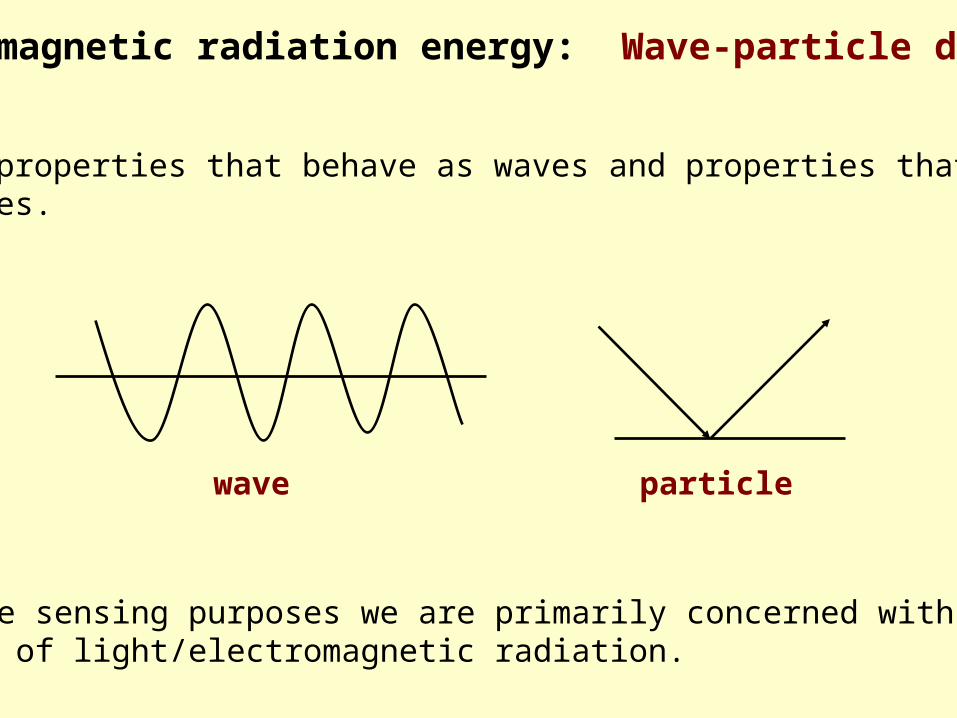
Electromagnetic radiation energy: Wave-particle duality
particlewave
Light has properties that behave as waves and properties that behaveas particles.
For remote sensing purposes we are primarily concerned with the wave behaviors of light/electromagnetic radiation.
Electromagnetic Waves
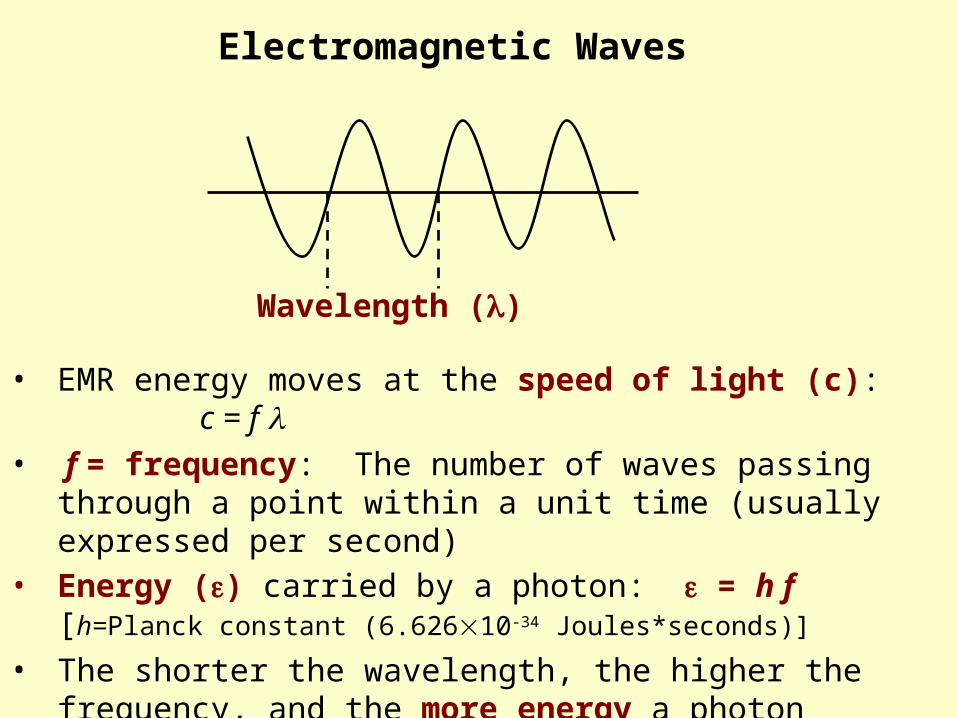
Wavelength ()
• EMR energy moves at the speed of light (c): c = f
• f = frequency: The number of waves passing through a point within a unit time (usually expressed per second)
• Energy () carried by a photon: = h f [h=Planck constant (6.62610-34 Joules*seconds)]
• The shorter the wavelength, the higher the frequency, and the more energy a photon carries. Therefore, short wave ultraviolet solar radiation is very destructive (sunburns)
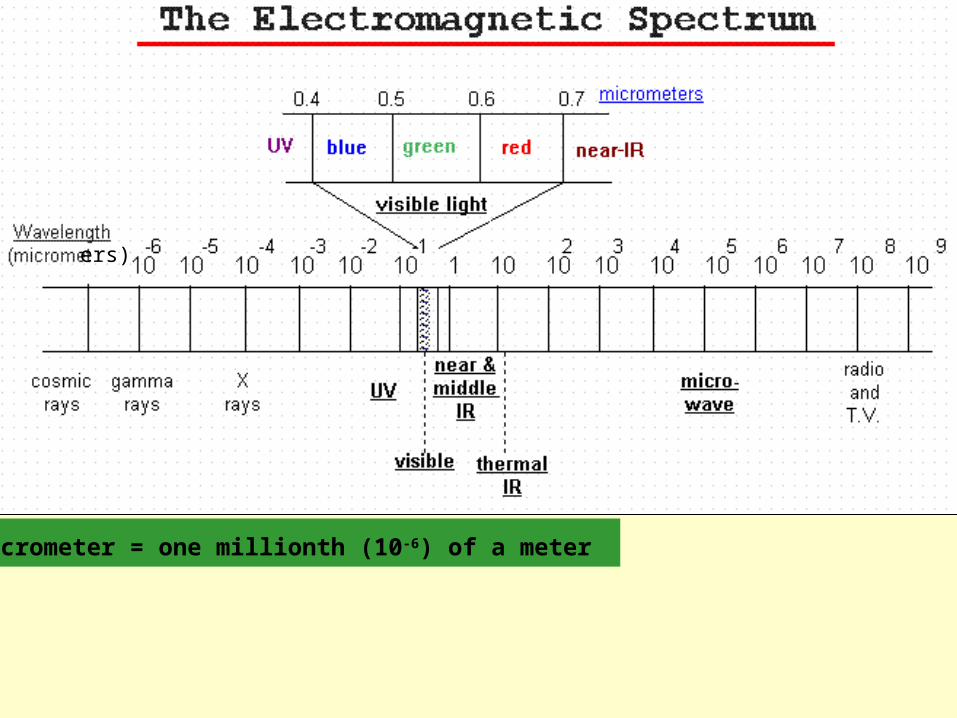
One micrometer = one millionth (10-6) of a meter
ers)
What makes objects a certain color?
• The color of an object is determined by how much light it reflects of each wavelength in the visible light portion of the EM spectrum.
• Some objects emit light as well, greatly affecting their color.
• Objects reflect some wavelengths.
• Objects absorb some wavelengths.
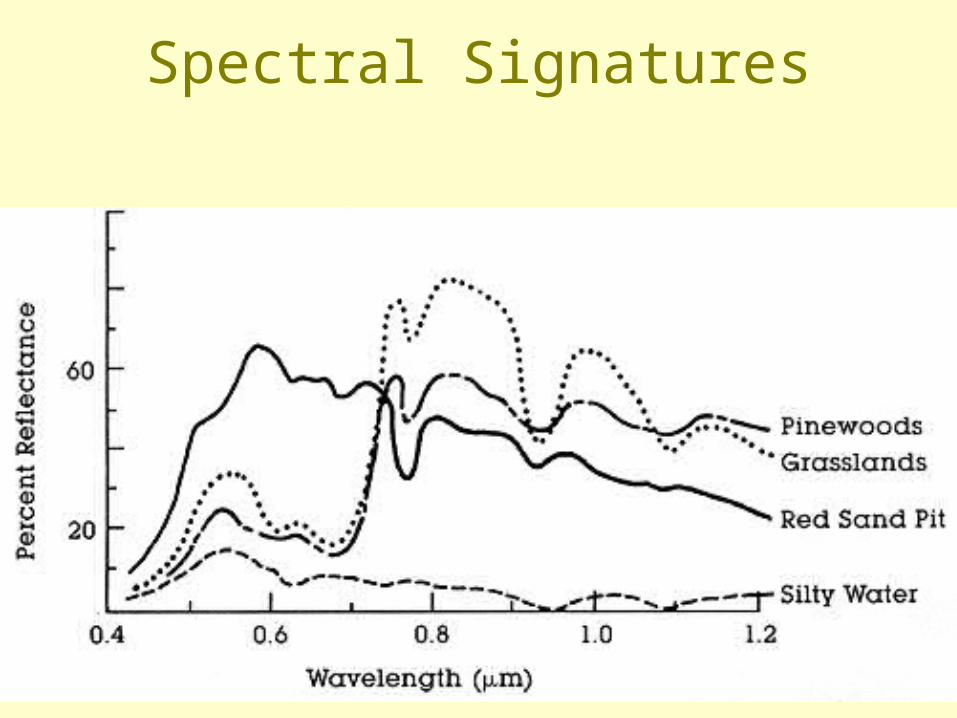
Spectral Signatures
Remote Sensing
• Remote sensors are devices that sense energy from a remote location (i.e., a device not in physical contact with what it is sensing)
• Remote sensing is the science of acquiring, processing and interpreting information/data collected by remote sensors.
Remote Sensing
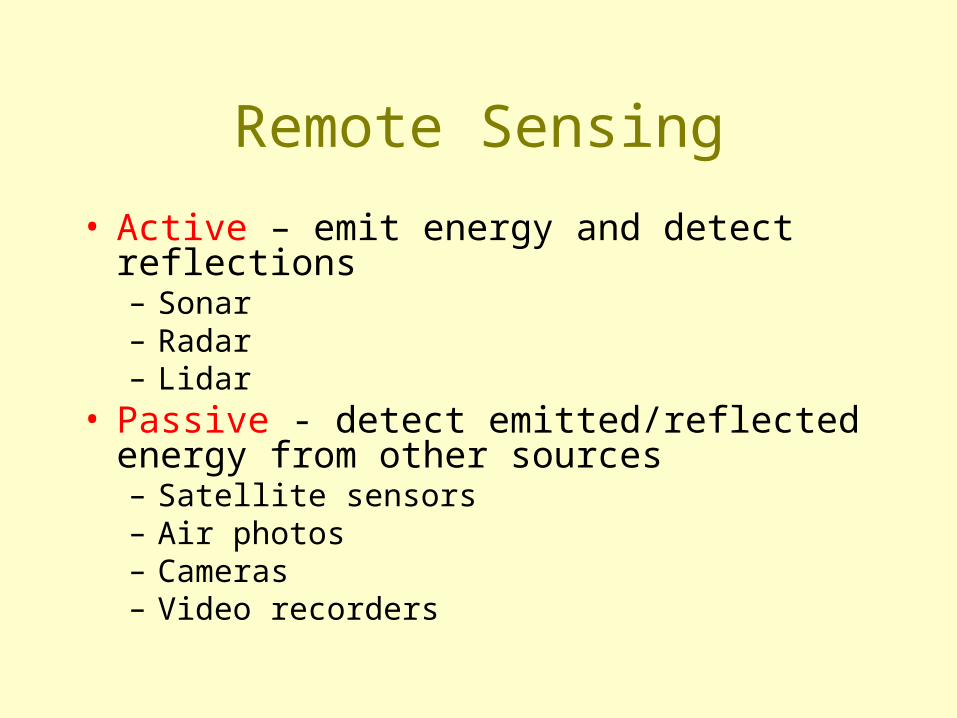
• Active – emit energy and detect reflections– Sonar– Radar– Lidar
• Passive - detect emitted/reflected energy from other sources– Satellite sensors– Air photos– Cameras– Video recorders
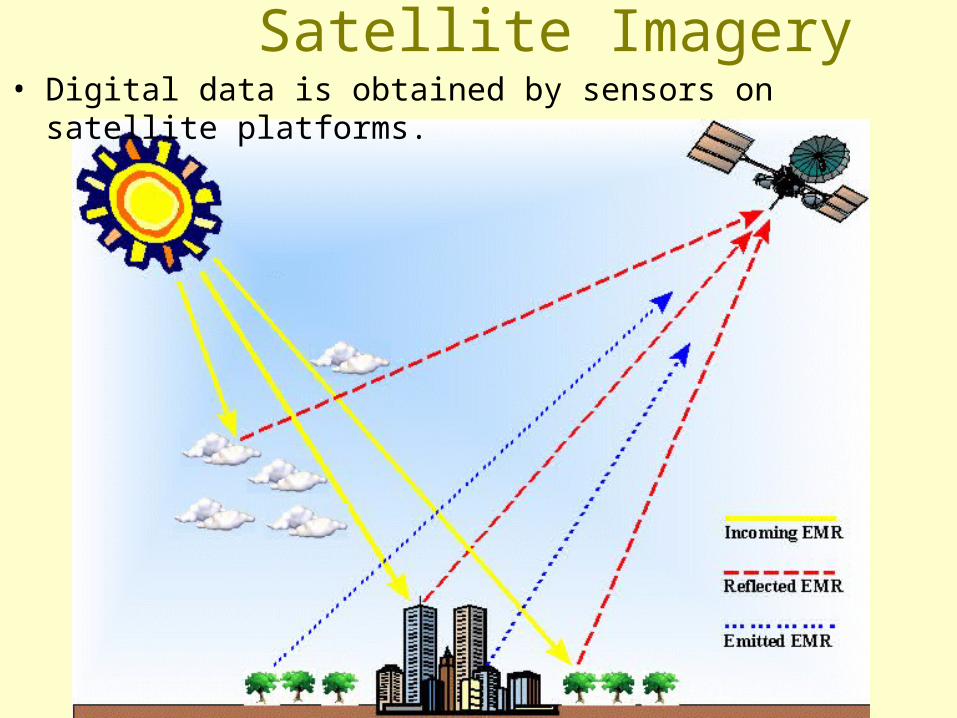
Satellite Imagery• Digital data is obtained by sensors on satellite platforms.
Satellite Imagery
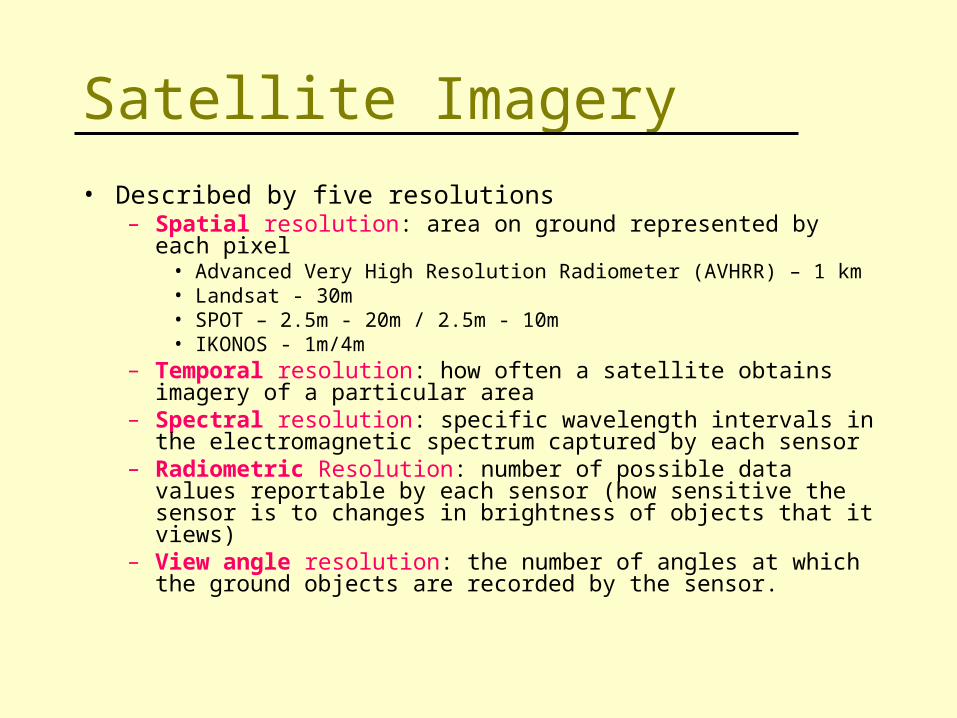
• Described by five resolutions– Spatial resolution: area on ground represented by each pixel
• Advanced Very High Resolution Radiometer (AVHRR) – 1 km• Landsat - 30m• SPOT – 2.5m - 20m / 2.5m - 10m• IKONOS - 1m/4m
– Temporal resolution: how often a satellite obtains imagery of a particular area
– Spectral resolution: specific wavelength intervals in the electromagnetic spectrum captured by each sensor
– Radiometric Resolution: number of possible data values reportable by each sensor (how sensitive the sensor is to changes in brightness of objects that it views)
– View angle resolution: the number of angles at which the ground objects are recorded by the sensor.
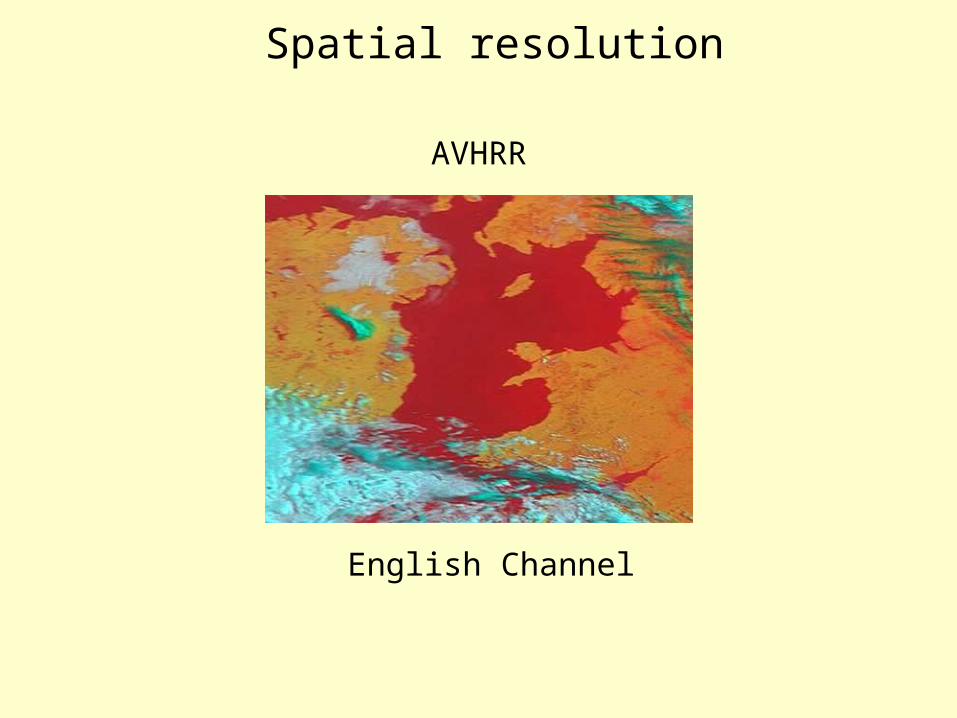
AVHRR
Spatial resolution
English Channel
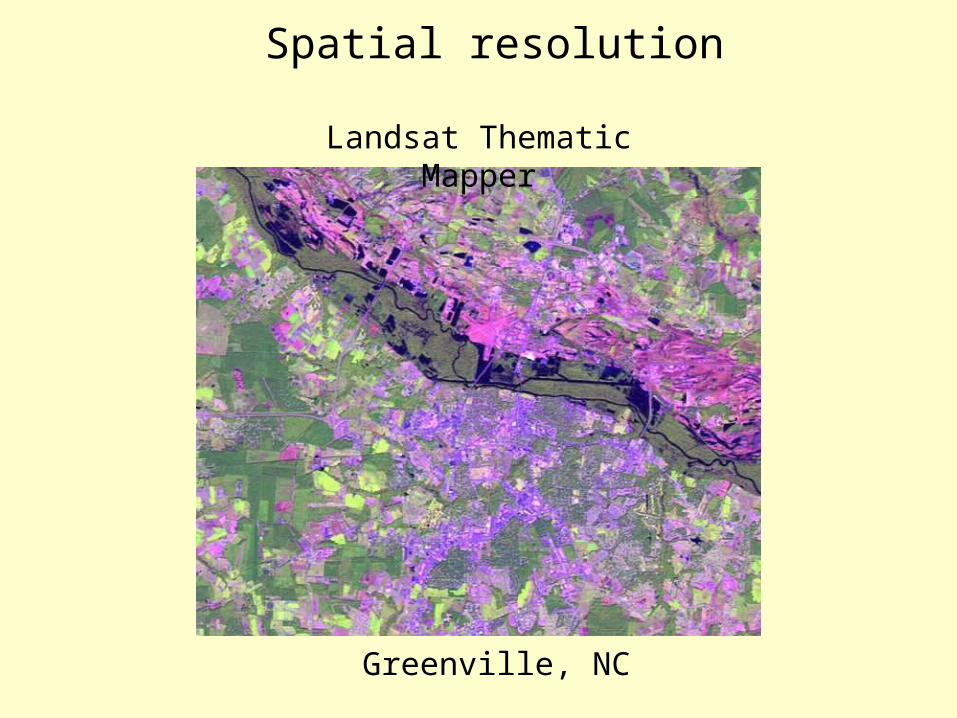
Landsat Thematic Mapper
Spatial resolution
Greenville, NC
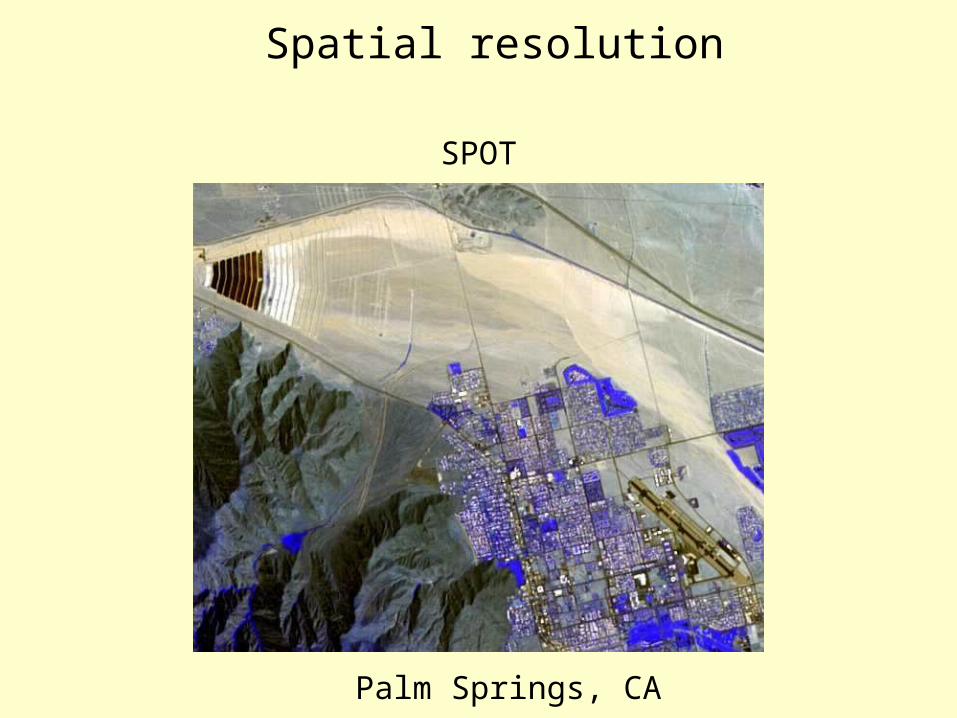
SPOT
Spatial resolution
Palm Springs, CA
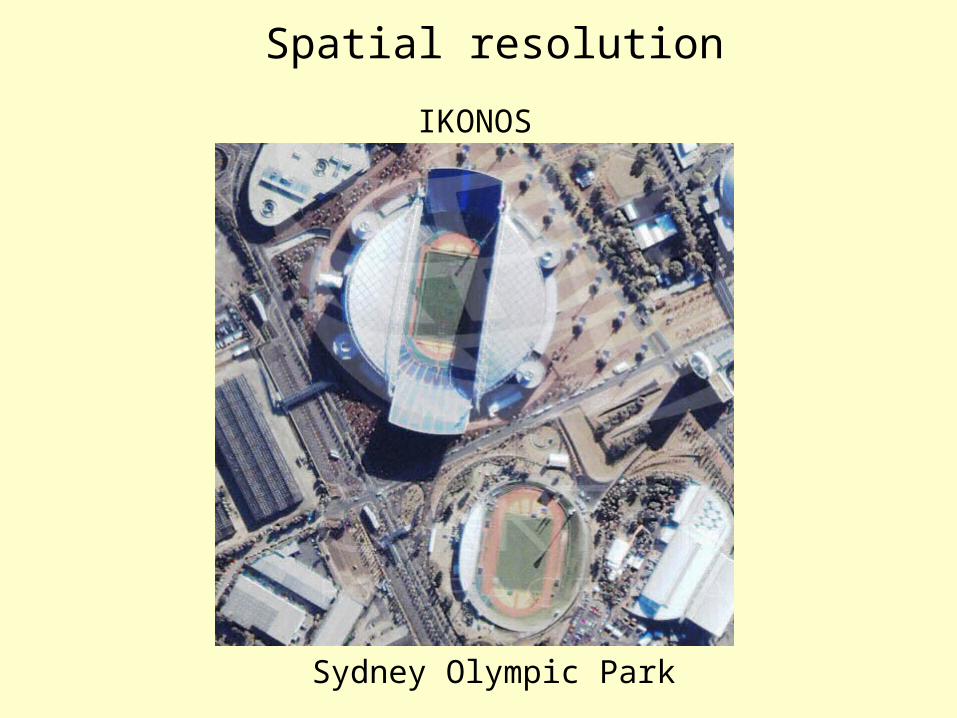
IKONOS
Spatial resolution
Sydney Olympic Park
Temporal Resolution
• Number of days between overhead passes at the same location– Landsat - 16 days
– AVHRR - daily
– IKONOS - 1 to 3 days
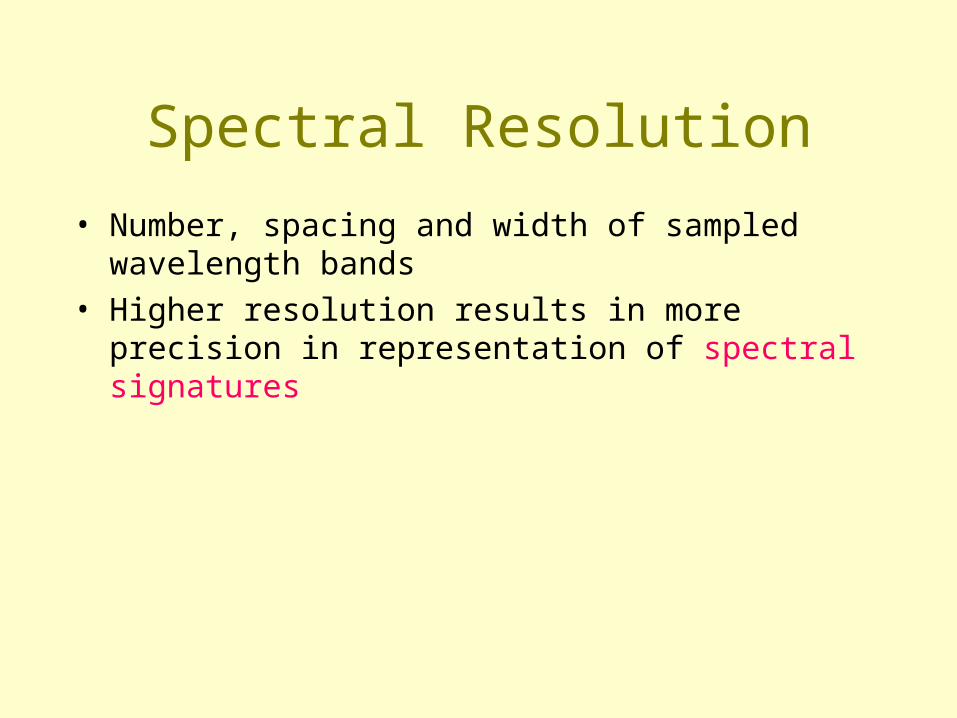
Spectral Resolution
• Number, spacing and width of sampled wavelength bands
• Higher resolution results in more precision in representation of spectral signatures
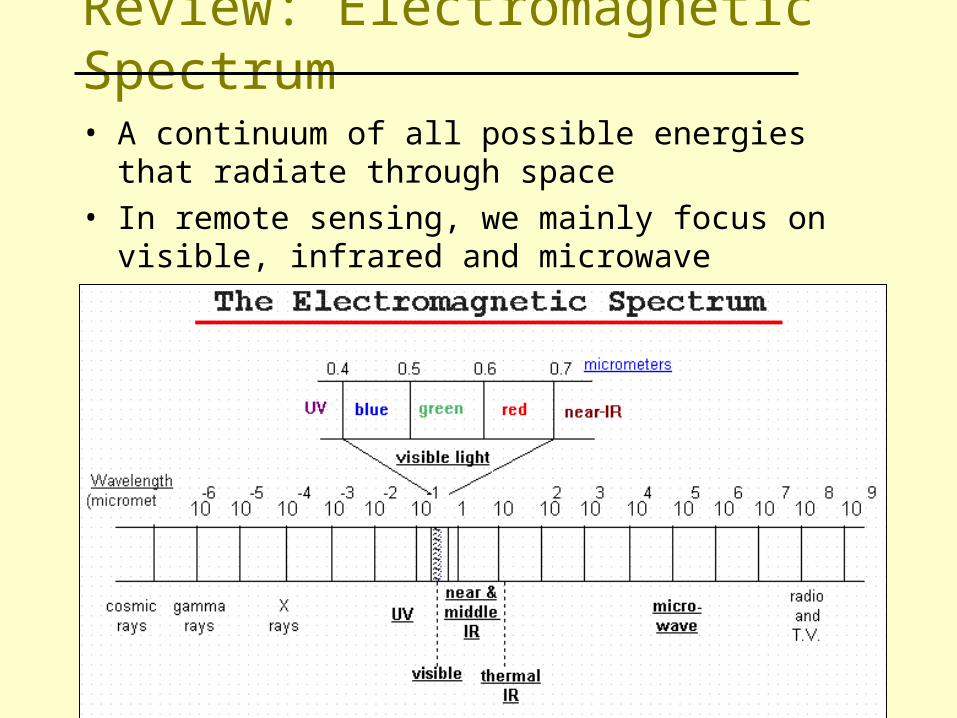
Review: Electromagnetic Spectrum
• A continuum of all possible energies that radiate through space
• In remote sensing, we mainly focus on visible, infrared and microwave
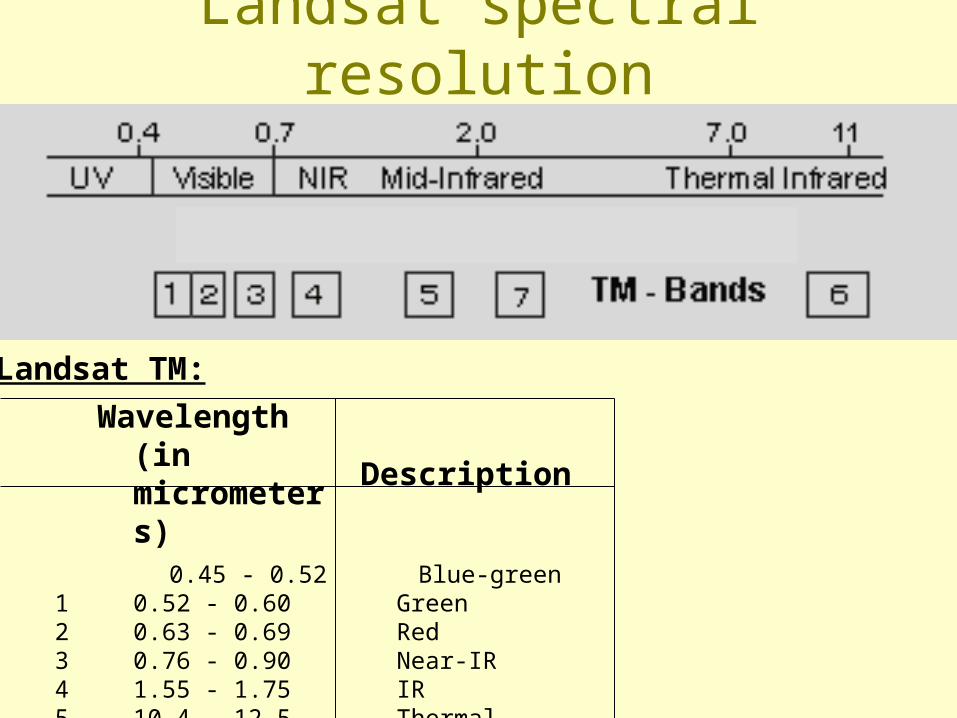
Landsat spectral resolution
Wavelength (in micrometers)
Description
1234567
0.45 - 0.520.52 - 0.600.63 - 0.690.76 - 0.901.55 - 1.7510.4 - 12.52.08 - 2.35
Blue-greenGreenRedNear-IRIRThermal Mid-IR
Landsat TM:
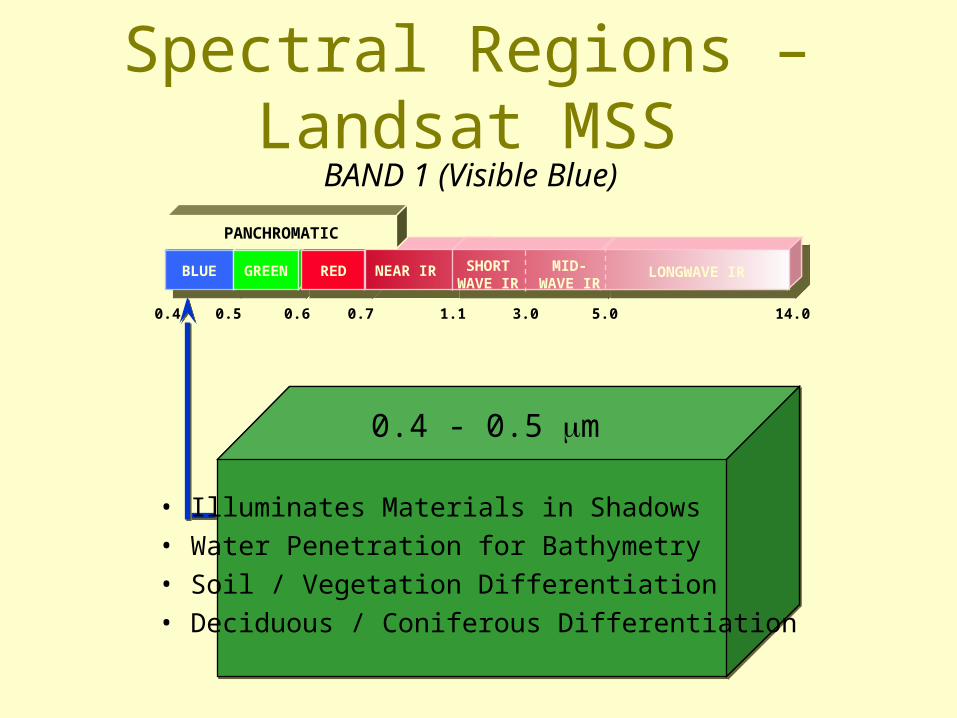
Spectral Regions – Landsat MSS
0.4 - 0.5 m
• Illuminates Materials in Shadows• Water Penetration for Bathymetry• Soil / Vegetation Differentiation• Deciduous / Coniferous Differentiation
BLUEBLUE GREENGREEN REDRED NEAR IR SHORTWAVE IR
MID-WAVE IR
LONGWAVE IR
14.05.03.01.10.70.60.50.4
PANCHROMATIC
BAND 1 (Visible Blue)
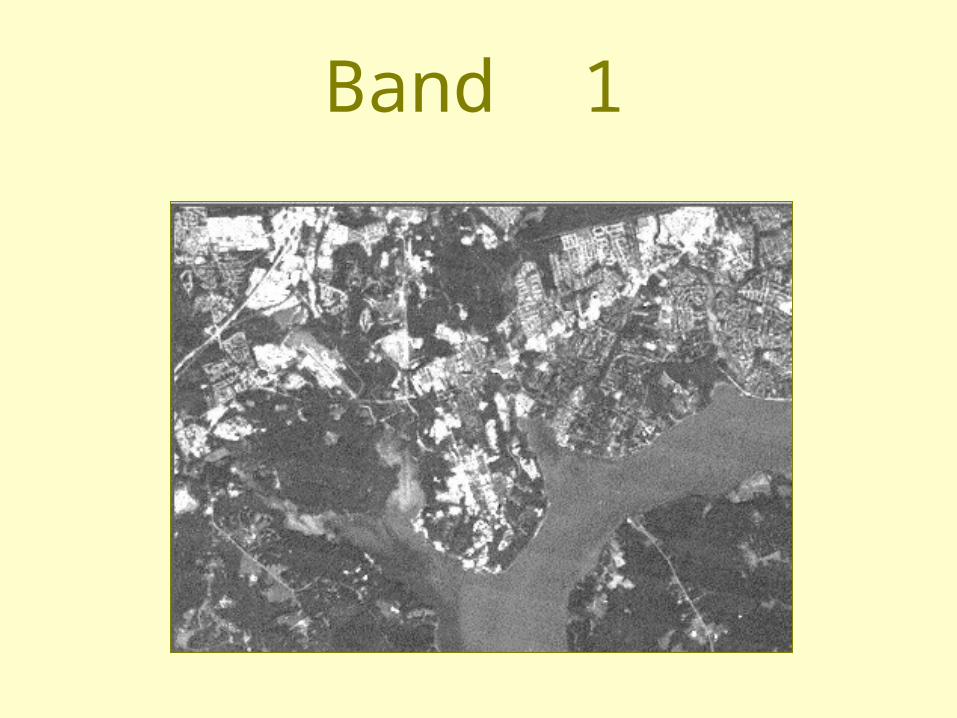
Band 1
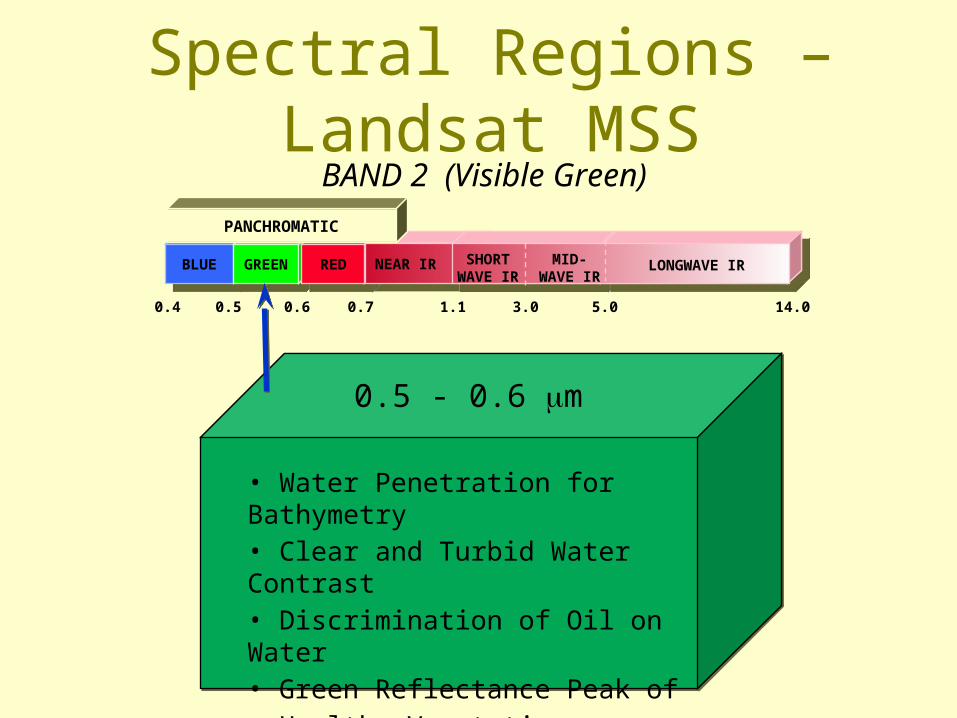
0.5 - 0.6 m
• Water Penetration for Bathymetry• Clear and Turbid Water Contrast• Discrimination of Oil on Water• Green Reflectance Peak of Healthy Vegetation
BLUEBLUE GREENGREEN REDRED NEAR IR SHORTWAVE IR
MID-WAVE IR
LONGWAVE IR
14.05.03.01.10.70.60.50.4
PANCHROMATIC
BAND 2 (Visible Green)
Spectral Regions – Landsat MSS
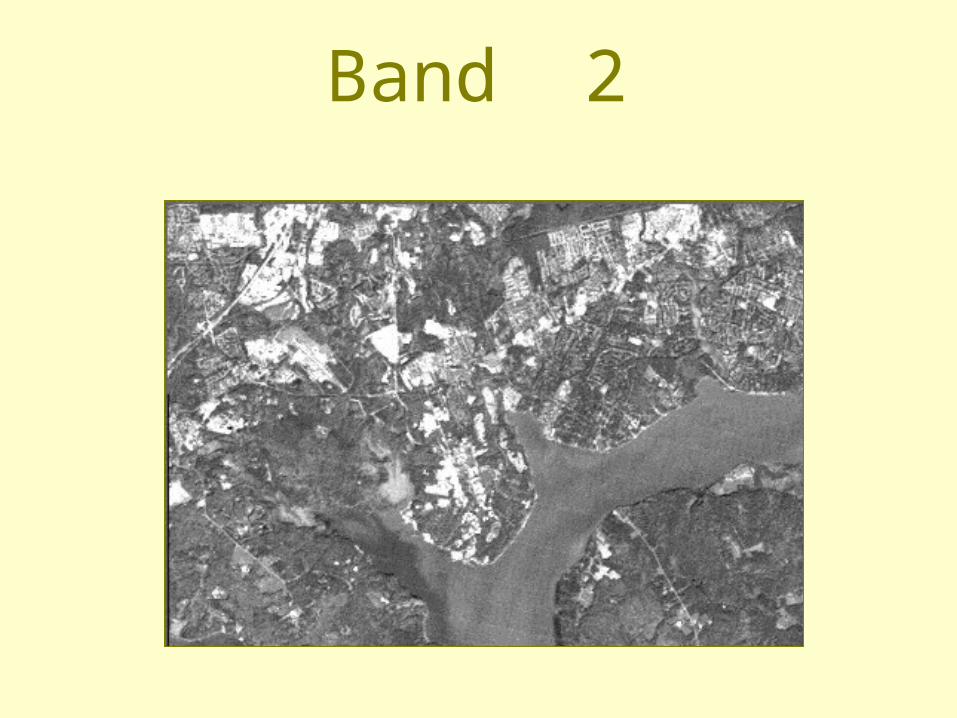
Band 2
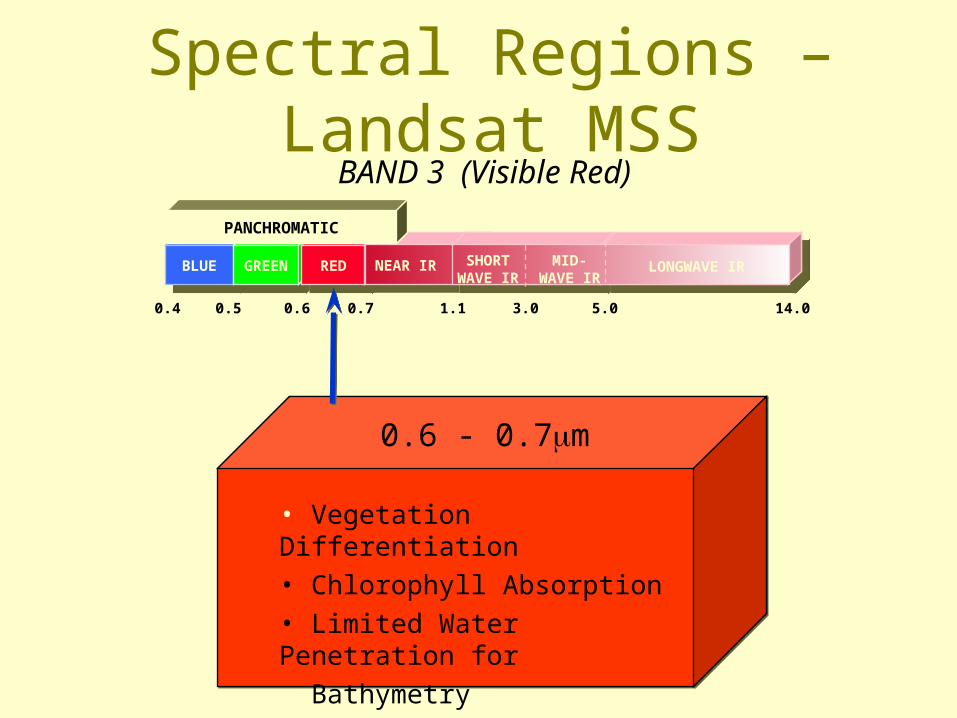
0.6 - 0.7m
• Vegetation Differentiation• Chlorophyll Absorption• Limited Water Penetration for
Bathymetry
BLUEBLUE GREENGREEN REDRED NEAR IR SHORTWAVE IR
MID-WAVE IR
LONGWAVE IR
14.05.03.01.10.70.60.50.4
PANCHROMATIC
BAND 3 (Visible Red)
Spectral Regions – Landsat MSS
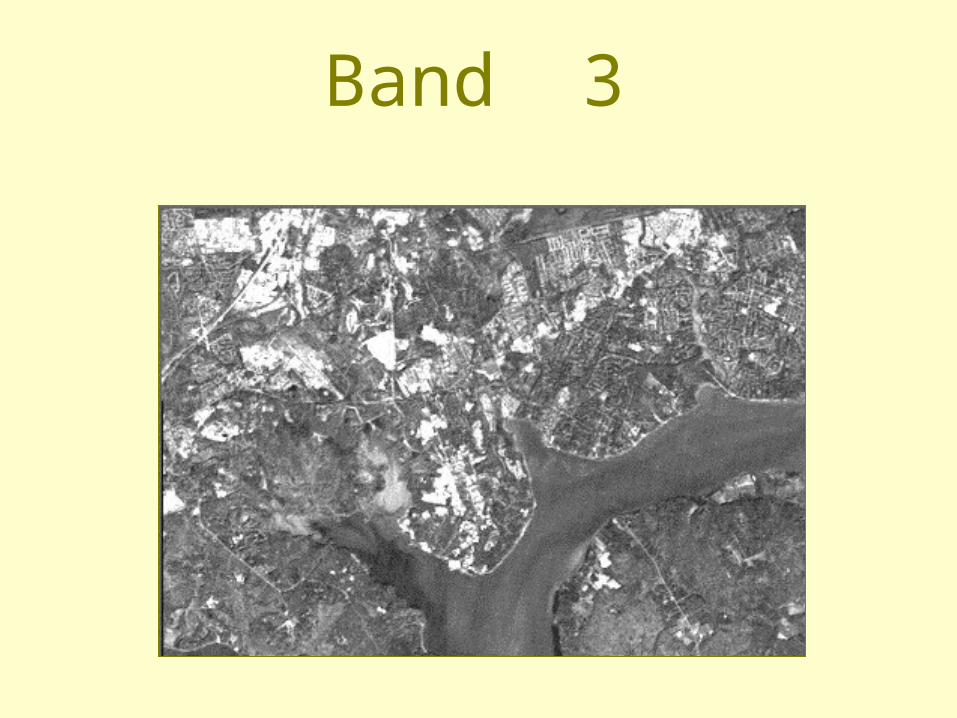
Band 3
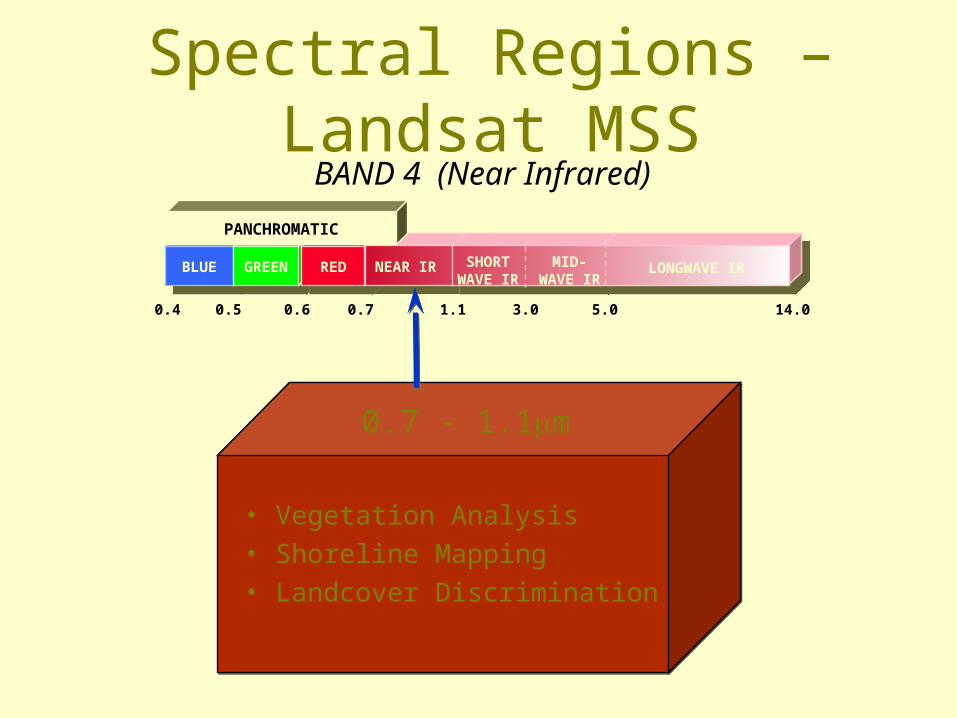
• Vegetation Analysis• Shoreline Mapping• Landcover Discrimination
0.7 - 1.1m
BLUEBLUE GREENGREEN REDRED NEAR IR SHORTWAVE IR
MID-WAVE IR
LONGWAVE IR
14.05.03.01.10.70.60.50.4
PANCHROMATIC
BAND 4 (Near Infrared)
Spectral Regions – Landsat MSS

Band 4

1.1 - 3.0m
• Fire Mapping• Discrimination of Oil on Water• Moisture Content of Soil and Vegetation• Snow / Cloud Differentiation• Vegetation Analysis
BLUEBLUE GREENGREEN REDRED NEAR IR SHORTWAVE IR
MID-WAVE IR
LONGWAVE IR
14.05.03.01.10.70.60.50.4
PANCHROMATIC
BAND 5 (Short-wave Infrared)
Spectral Regions – Landsat MSS
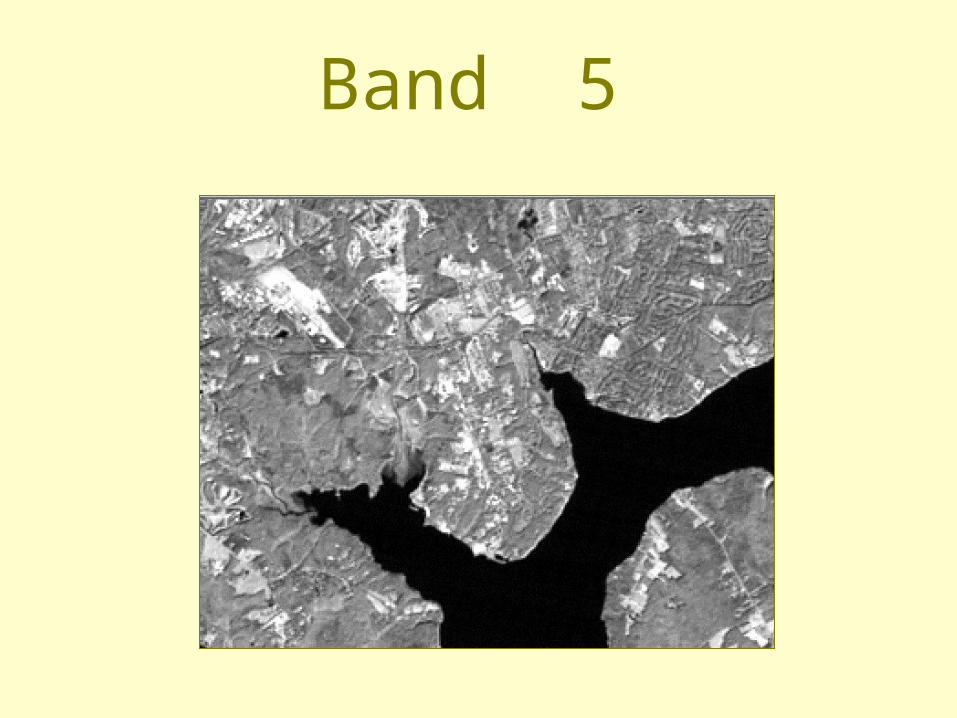
Band 5
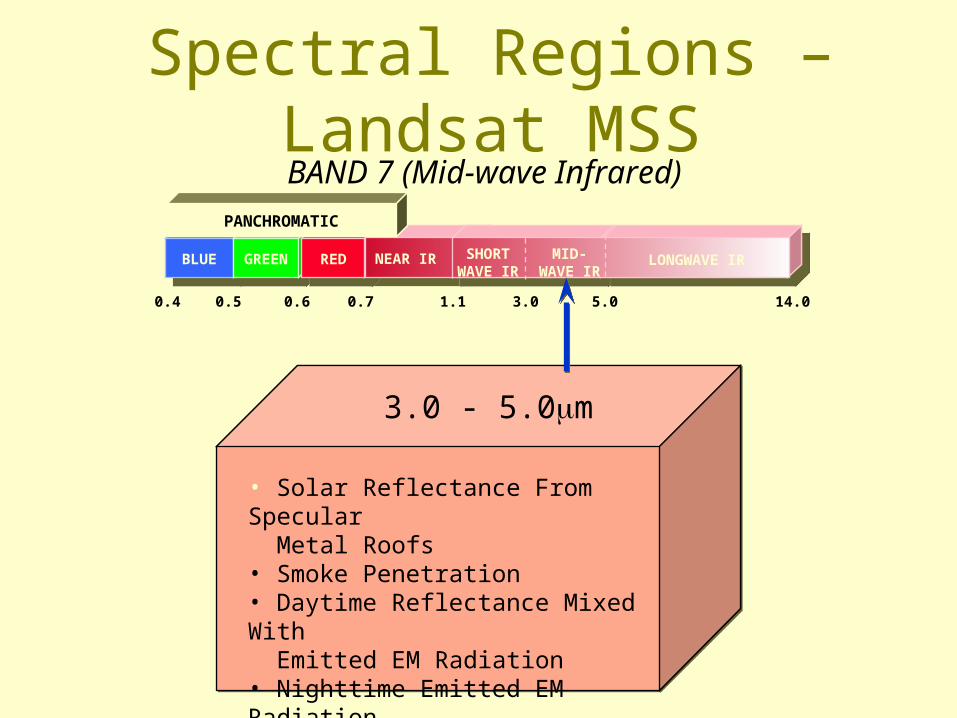
3.0 - 5.0m
• Solar Reflectance From Specular Metal Roofs• Smoke Penetration• Daytime Reflectance Mixed With Emitted EM Radiation• Nighttime Emitted EM Radiation
BLUEBLUE GREENGREEN REDRED NEAR IR SHORTWAVE IR
MID-WAVE IR
LONGWAVE IR
14.05.03.01.10.70.60.50.4
PANCHROMATIC
BAND 7 (Mid-wave Infrared)
Spectral Regions – Landsat MSS
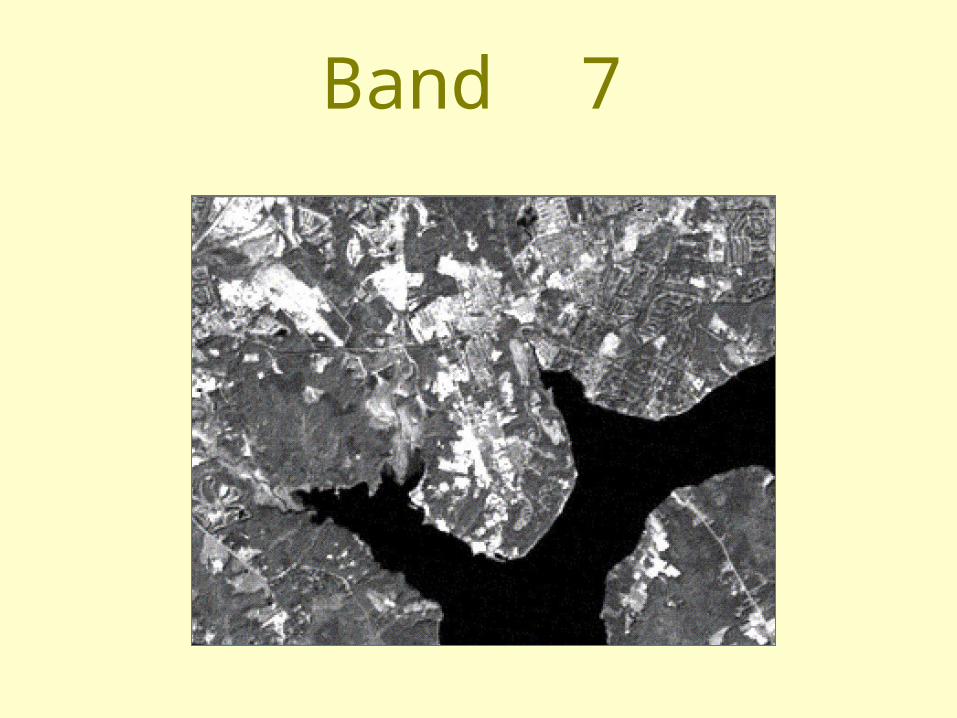
Band 7

5.0 - 14.0m
• Thermal Analysis• Vegetation Density• Urban Heat Islands
BLUEBLUE GREENGREEN REDRED NEAR IR SHORTWAVE IR
MID-WAVE IR
LONGWAVE IR
14.05.03.01.10.70.60.50.4
PANCHROMATIC
BAND 6 (Long-wave Infrared)
Spectral Regions – Landsat MSS

Band 6
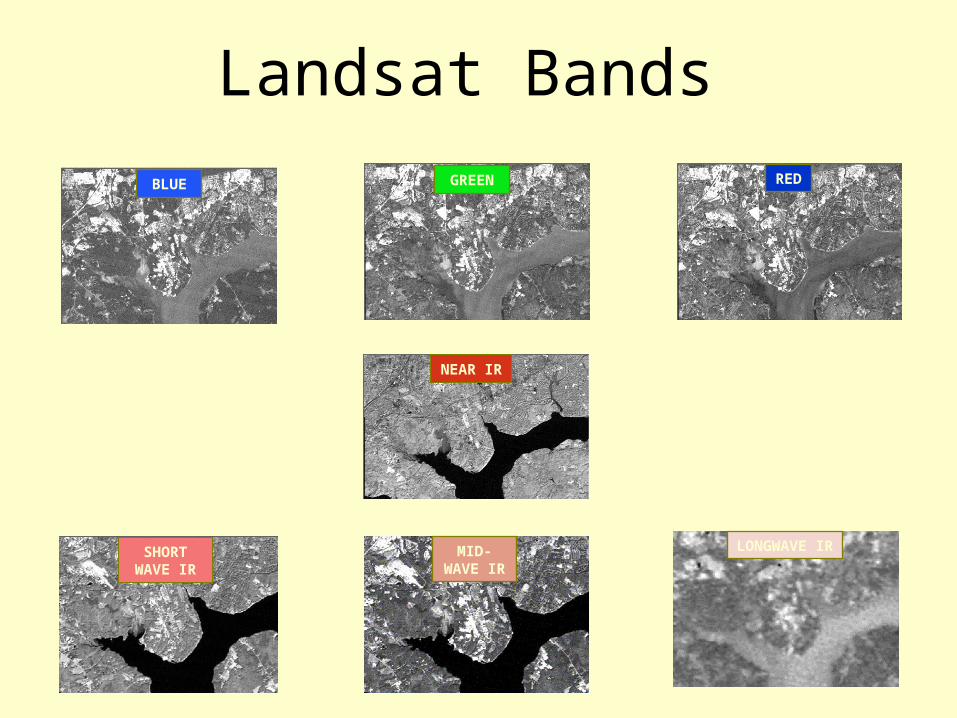
Landsat Bands
Band 1 Band 2 Band 3
Band 4
Band 5 Band 7 Band 6
BLUE GREEN RED
NEAR IR
SHORTWAVE IR
MID-WAVE IR
LONGWAVE IR
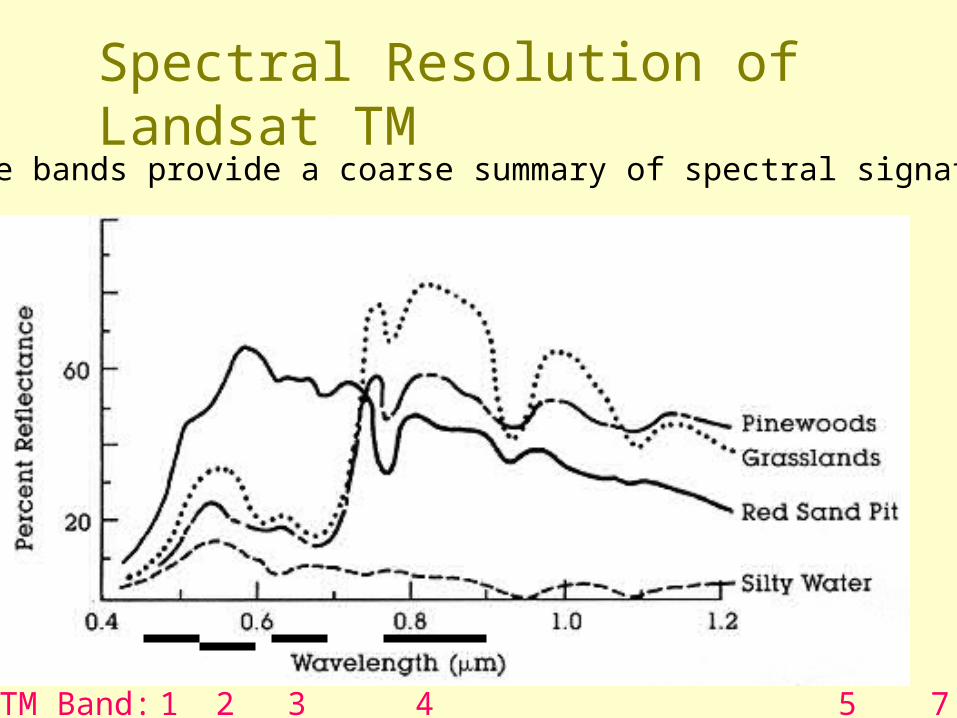
Spectral Resolution of Landsat TM
TM Band: 1 2 3 4 5 7
These bands provide a coarse summary of spectral signatures.
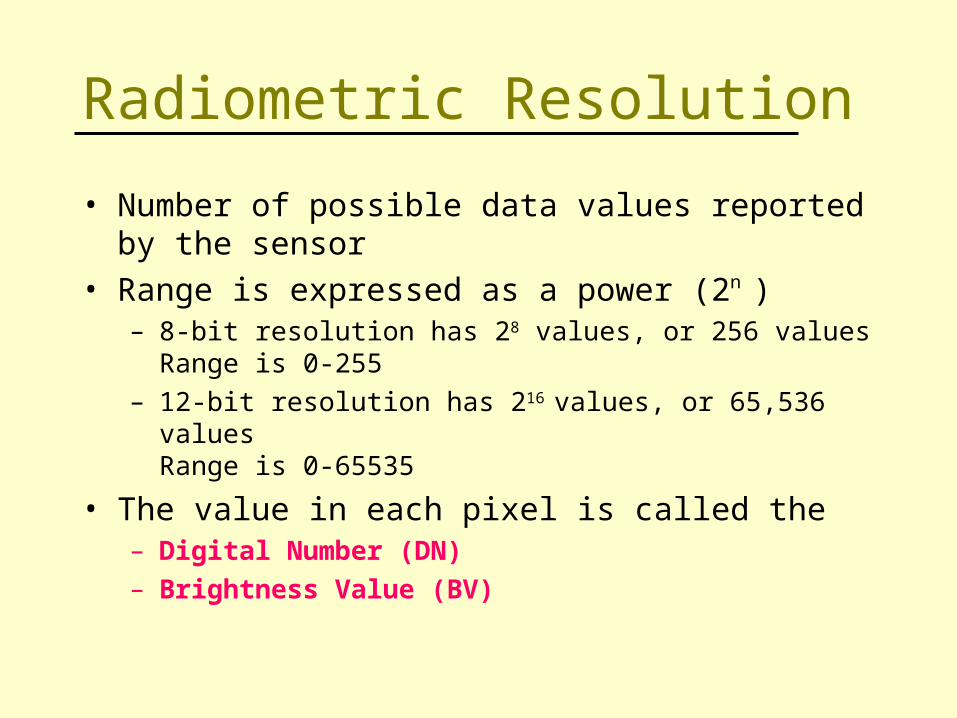
Radiometric Resolution
• Number of possible data values reported by the sensor
• Range is expressed as a power (2n )– 8-bit resolution has 28 values, or 256 values
Range is 0-255
– 12-bit resolution has 216 values, or 65,536 valuesRange is 0-65535
• The value in each pixel is called the– Digital Number (DN)
– Brightness Value (BV)
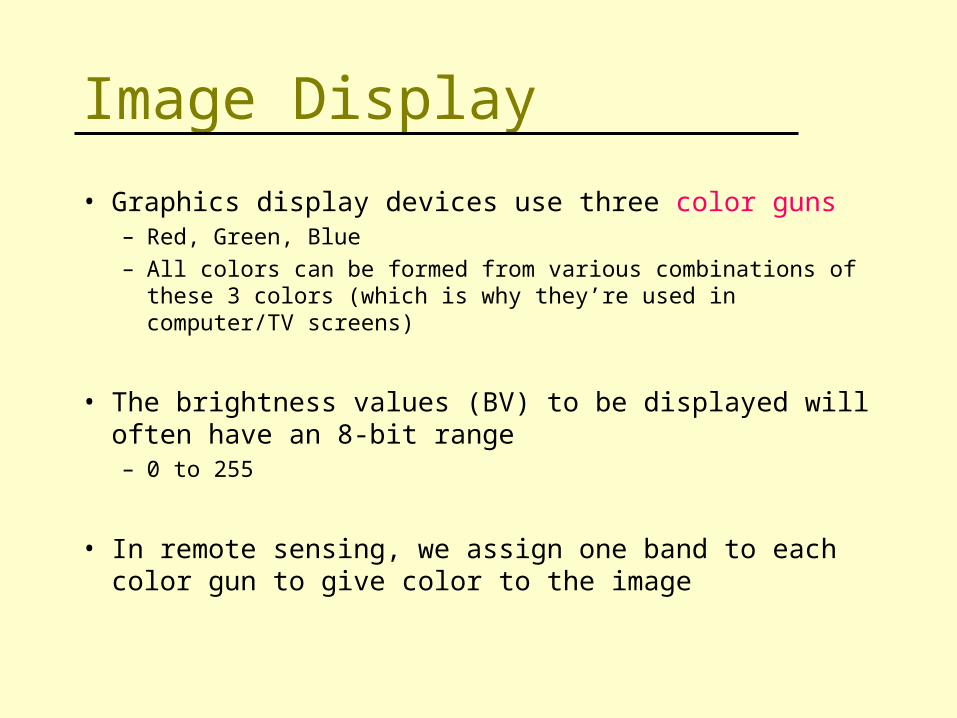
Image Display
• Graphics display devices use three color guns– Red, Green, Blue
– All colors can be formed from various combinations of these 3 colors (which is why they’re used in computer/TV screens)
• The brightness values (BV) to be displayed will often have an 8-bit range– 0 to 255
• In remote sensing, we assign one band to each color gun to give color to the image
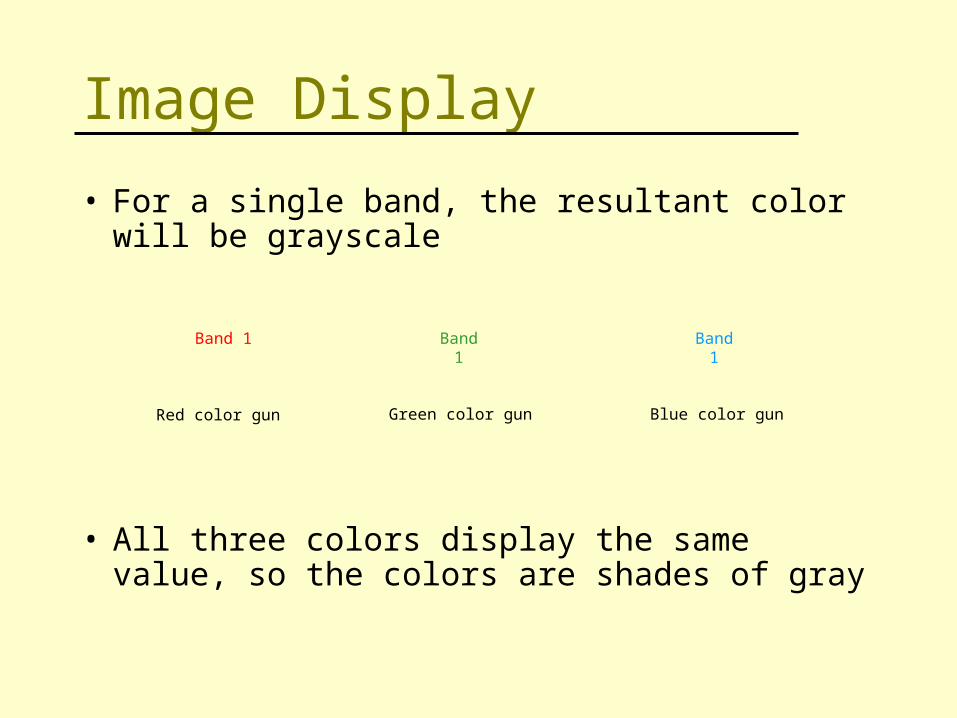
Image Display
• For a single band, the resultant color will be grayscale
• All three colors display the same value, so the colors are shades of gray
Band 1 Band 1 Band 1
Red color gun Green color gun Blue color gun
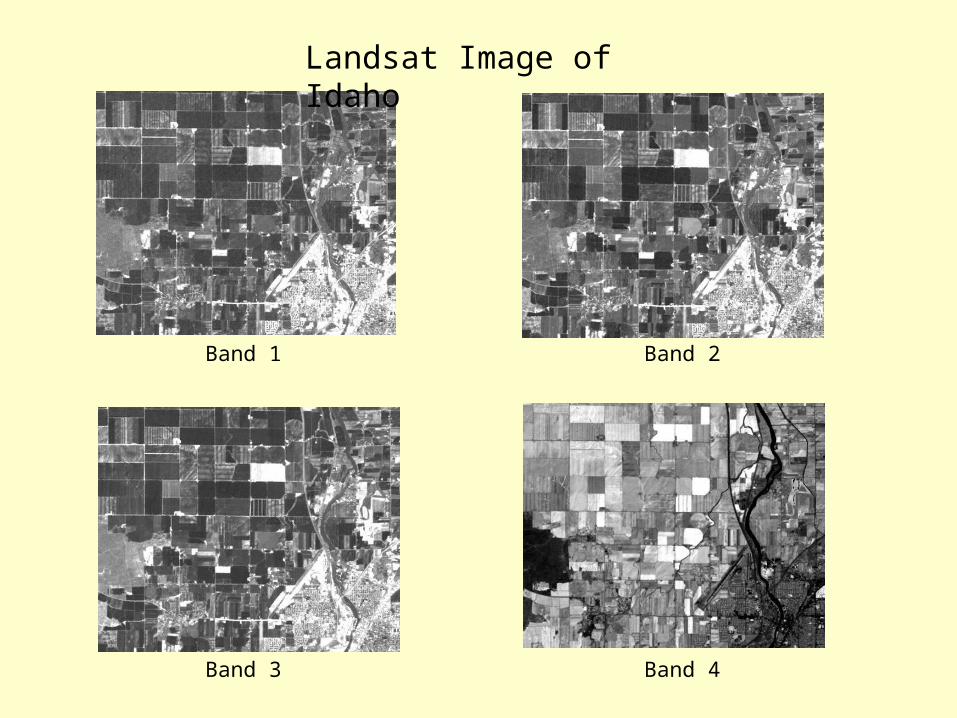
Landsat Image of Idaho
Band 1
Band 3
Band 2
Band 4
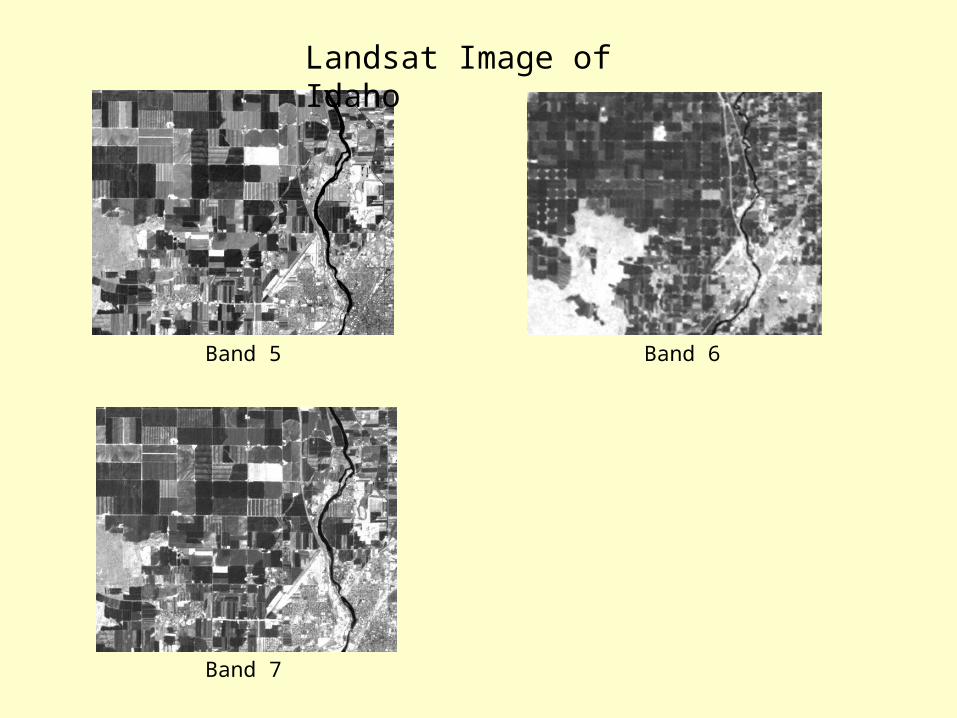
Landsat Image of Idaho
Band 5
Band 7
Band 6

Image Display
• For a multi-band image, the resultant color will depend on which bands are assigned to which color guns
Red (3) Green (2) Blue (1)
Near Infrared (4) Red (3) Green (2)
True Color Composite
(321)
False Color Composite
(432)
Red color gun Green color gun Blue color gun
Red color gun Green color gun Blue color gun
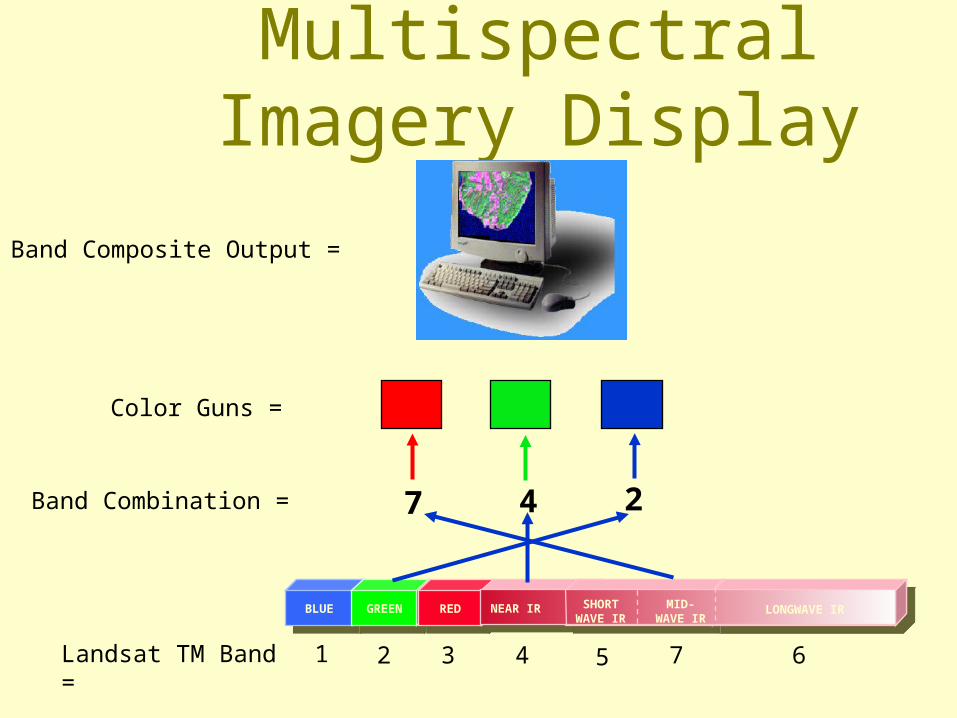
Multispectral Imagery Display
BLUEBLUE
GREENGREEN
REDRED NEAR IR SHORT
WAVE IRMID-
WAVE IRLONGWAVE IR
1Landsat TM Band = 2 3 4 5 7 6
Band Combination = 7 4 2
Color Guns =
Band Composite Output =
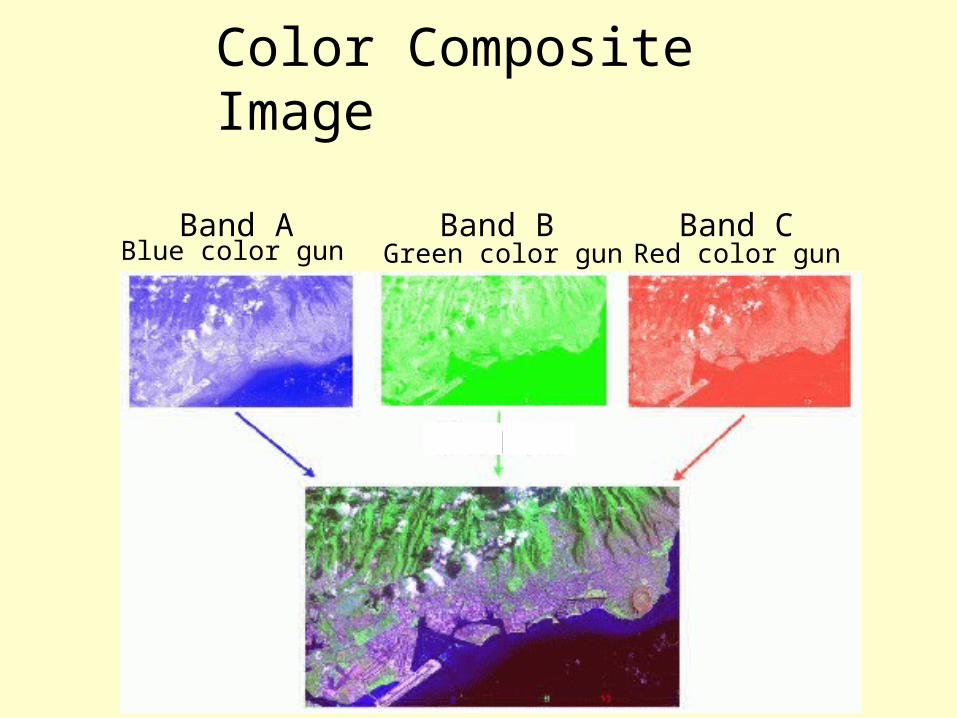
Color composite imageColor Composite Image
Band A Band B Band CBlue color gun Green color gun Red color gun
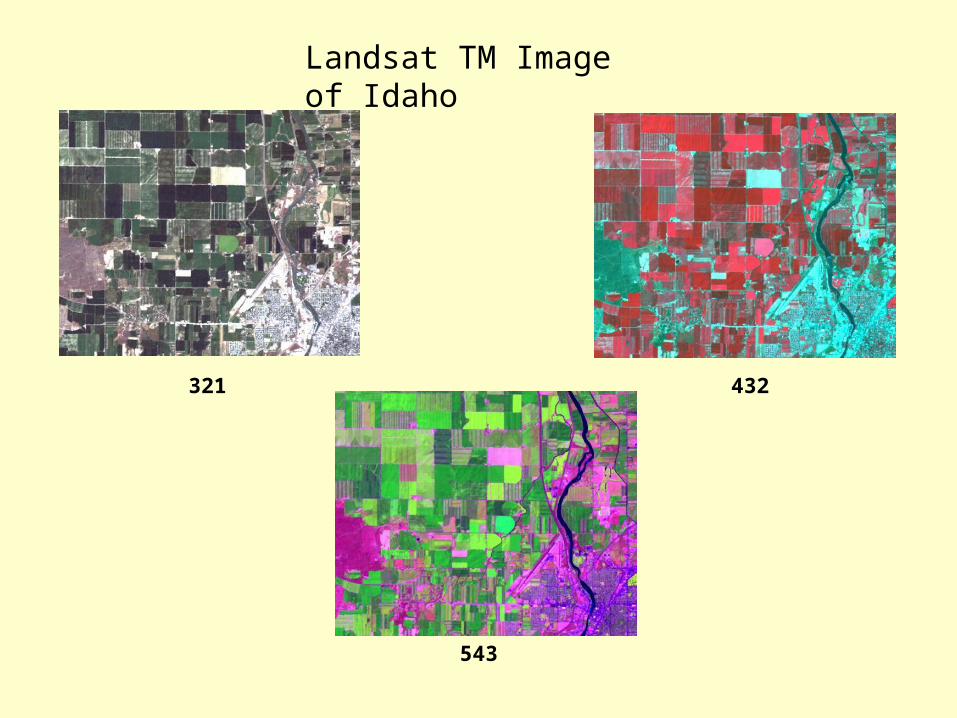
Landsat TM Image of Idaho
321 432
543