remote sensing data products: uses and availabilityuses ... · pdf fileremote sensing data...
TRANSCRIPT

National Aeronautics and Space Administration
Remote Sensing Data Products:Uses and AvailabilityUses and Availability
Glenn S. FeldhakeGlenn S. FeldhakeSenior Spectrum Engineer
National Aeronautics and Space Administration (NASA)
NASA Glenn Research Center21000 Brookpark Rd MS 54-2
: +1-216-433-5668: +1-216-977-744421000 Brookpark Rd, MS 54 2
Cleveland, OH 44135 USA: 1 216 977 7444 : [email protected]
www.nasa.gov 1

National Aeronautics and Space Administration
Topics
• Earth exploration-satellite service• MissionsMissions• Sensing Allocations• Data Products and Uses• Data and Training Resources
www.nasa.gov 2

National Aeronautics and Space Administration
Earth exploration-satellite service (EESS)1.51 Earth exploration-satellite service: A radiocommunication
service between earth stations and one or more space stations, which may include links between space stations in which:which may include links between space stations, in which:– information relating to the characteristics of the Earth and its
natural phenomena, including data relating to the state of the environment, is obtained from active sensors or passive sensors on Earth satellites;
– similar information is collected from airborne or Earth-based platforms;
h i f ti b di t ib t d t th t ti ithi– such information may be distributed to earth stations within the system
concerned;platform interrogation may be included– platform interrogation may be included.
This service may also include feeder links necessary for its operation.
• Station Class: EW
www.nasa.gov
• Station Class: EW
3

National Aeronautics and Space Administration
Types of Orbits• Geosynchronous – spacecraft (S/C) follow figure 8's
in the sky.• Geostationary – S/C stay in one place in the sky.• Polar
S/C t l tl N th d S th– S/C travel mostly North and South. – The Earth rotates under them, and– S/C eventually “see” the entire earth's surface.
• Sun-synchronous – Sun-Earth-S/C orbit plane angle is constant (same shadows, more-or-less). E t i l• Equatorial– S/C travel mostly Eastward.– The Earth wobbles underneath, but
www.nasa.gov
– S/C don't “see” the poles or high latitudes.

National Aeronautics and Space Administration
NASA EESS MissionsS SS ss o s
• ACRIMSAT (1999)• AIM (2007)
• GRACE (filed by D) (2002)• ICESAT (2003)( 00 )
• AQUARIUS on SAC-D (2011)
• AURA (2004)
C S ( 003)• LANDSAT (1982+)• MMS (2015)• OCO-2 (2013)( )
• CALIPSO (filed by F) (2006)• EO-1 (2000)• EOS-AM (a.k.a. Terra)
OCO 2 (2013)• QUIKSCAT (1999)• SDO (2010)• SMAP (2015)( )
(1999)• EOS-PM (a.k.a. Aqua)
(2002)
SMAP (2015)• SORCE (2003)• STEREO (2006)• TIMED (1997)• FAST (1996)
• FIREFLY (2012)• GPM (2013)
• TIMED (1997)• TRMM (1997)• WIND (1994)
www.nasa.gov 5

National Aeronautics and Space Administration
Administrations with Notified EESS SatellitesSatellites
• ALGERIAARGENTINA
• INDONESIA• ISRAEL
• SAUDI ARABIASINGAPORE• ARGENTINA
• AUSTRALIA• BELARUS
• ISRAEL• ITALY• JAPAN
• SINGAPORE• SOUTH AFRICA• SPAIN• BELARUS
• CANADA• CHILE
• KOREA• LIBYA
LUXEMBOURG
• SPAIN• THAILAND• TURKEY
• CHINA• EGYPT
• LUXEMBOURG• MALAYSIA• MEXICO
• UAE• UK
• FRANCE (including ESA)GERMANY
CO• MOROCCO• OMAN
• UKRAINE• USA
www.nasa.gov
• GERMANY• INDIA
• RUSSIA
6
• VIETNAM

National Aeronautics and Space Administration
Types of Sensing - Active
1.182 active sensor: A measuring instrument in the earth exploration-satellite service or in the space p presearch service by means of which information is obtained by transmission and reception of radio waves (RR)waves. (RR)
• Active sensing (echoes)– Visible/Infrared : LIDAR– Microwave : 400 MHz to 94 GHz – Synthetic Aperture Radar (SAR) : uses Doppler shift along
track and a one-dimensional antenna cross-track; ;mathematically reconstructs (synthesizes) the “whole” antenna
• Station Class: E3
www.nasa.gov
Station Class: E3

National Aeronautics and Space Administration
Types of Sensing - Passive
1.183 passive sensor: A measuring instrument in the earth exploration-satellite service or in the space p presearch service by means of which information is obtained by reception of radio waves of natural origin.Passi e sensing (j st listen)• Passive sensing (just listen)– Visible/Infrared : Imagers, cameras, spectrometers– Microwave : 1 000 MHz to 2 500 000 MHz
• Station Class: E4
www.nasa.gov 8

National Aeronautics and Space Administration
Allocations for Emissions1
Frequency Band Radio Service Frequency Band Radio Service401‐403 MHz EESS (E‐s) 432‐438 MHz eess (active)460 470 MHz [eess (s E)] 1215 1300 MHz EESS (active)460‐470 MHz [eess (s‐E)] 1215‐1300 MHz EESS (active)1525‐1535 MHz eess 3100‐3300 MHz eess (active)1690‐1710 MHz [eess (s‐E)] 5250‐5570 MHz EESS (active)2025‐2110 MHz EESS (E‐s) (s‐s) 8550‐8650 MHz EESS (active)2200‐2290 MHz EESS (s‐E) (s‐s) 9300‐9800 MHz EESS (active)8025‐8400 MHz EESS (s‐E) 9800‐9900 MHz eess (active)13.75‐14 GHz eess 13.25‐13.75 GHz EESS (active)25 5 27 GH EESS ( E) 17 2 17 3 GH EESS ( i )25.5‐27 GHz EESS (s‐E) 17.2‐17.3 GHz EESS (active)28.5‐30 GHz eess (E‐s) 24.05‐24.25 GHz eess (active)29.95‐30 GHz eess (E‐s)(s‐s) 35.5‐36 GHz EESS (active)37.5‐40 GHz eess (s‐E) 78‐79 GHz [EESS (active)]37.5 40 GHz eess (s E) 78 79 GHz [EESS (active)]40‐40.5 GHz EESS (E‐s) / eess (s‐E) 94‐94.1 GHz EESS (active)65‐66 GHz EESS 130‐134 GHz EESS (active)
1 CAPITAL LETTERS: Primary Allocation
www.nasa.gov 9
1 CAPITAL LETTERS: Primary Allocationlower case letters: Secondary Allocation[Square Brackets]: Allocation by footnote

National Aeronautics and Space Administration
Allocations for Passive Sensing2
Frequency Band Radio Service Frequency Band Radio Service1370‐1400 MHz [eess (passive)] 31.3‐31.8 GHz EESS (passive)1400‐1427 MHz EESS (passive) 36‐37 GHz EESS (passive)1400‐1427 MHz EESS (passive) 36‐37 GHz EESS (passive)2640‐2655 MHz [eess (passive)] 50.2‐50.4 GHz EESS (passive)2665‐2690 MHz eess (passive) 52.6‐59.3 GHz EESS (passive)2690‐2700 MHz EESS (passive) 86‐92 GHz EESS (passive)4200‐4400 MHz [eess (passive)] 100‐102 GHz EESS (passive)4950‐4990 MHz [eess (passive)] 109.5‐122.25 GHz EESS (passive)6425‐7250 MHz [eess (passive)] 148.5‐151.5 GHz EESS (passive)10.6‐10.7 GHz EESS (passive) 155.5‐158.5 GHz EESS (passive)10.6 10.7 GHz EESS (passive) 155.5 158.5 GHz EESS (passive)14.8‐15.35 GHz [eess (passive)] 164‐167 GHz EESS (passive)15.35‐15.4 GHz EESS (passive) 174.8‐191.8 GHz EESS (passive)18.6‐18.8 GHz (Rgn 1 & 3) EESS (passive) 200‐209 GHz EESS (passive)18.6‐18.8 GHz (Rgn 2) EESS (passive) 226‐231.5 GHz EESS (passive)
21.2‐21.4 GHz EESS (passive) 235‐238 GHz EESS (passive) / [EESS (active)]22.21‐22.5 GHz EESS (passive) 250‐252 GHz EESS (passive)
23 6‐24 GHz EESS (passive) 275‐1000 GHz [eess (passive)]
www.nasa.gov
23.6 24 GHz EESS (passive) 275 1000 GHz [eess (passive)]
10
2 [Italics/square brackets] : Not allocated but in use.

National Aeronautics and Space Administration
Optical Spectrum (above 3000 GHz)
• WRC-12 AI 1.6 (Res 955) “…to consider possible procedures for free-space optical-links, taking into p p p , gaccount the results of ITU-R studies…”
• ITU-R Rec RS.1804, “Technical and operational characteristics of Earth e ploration satellite ser icecharacteristics of Earth exploration-satellite service (EESS) systems operating above 3 000 GHz”
• Regulationg– CS 78 & CV 1005 Note 2: ITU-R Study Groups may conduct
studies without limit of frequency range– Res 118 (Rev Marrakesh 2002): A WRC agenda “canRes 118 (Rev. Marrakesh, 2002): A WRC agenda can
include” issues related to optical spectrum– WRC-12 AI 1.6 (Res 955):
www.nasa.gov 11

National Aeronautics and Space Administration
Examples of Data Products and Usesa p es o ata oducts a d Uses
Disaster Management Long Term Management
• Extreme Weather• Floods
C t l H d / T i
• Climate Change• Pollution Monitoring
• Coastal Hazards / Tsunamis• Volcanoes• Earthquakes
• Plant Health• Land Usage
P l ti D itEarthquakes• Landslides/Subsidence• Droughts
• Population Density• Deforestation• Desertification• Dust Storms
• Wildfires
• Desertification
www.nasa.gov 12
National Aeronautics and Space Administration
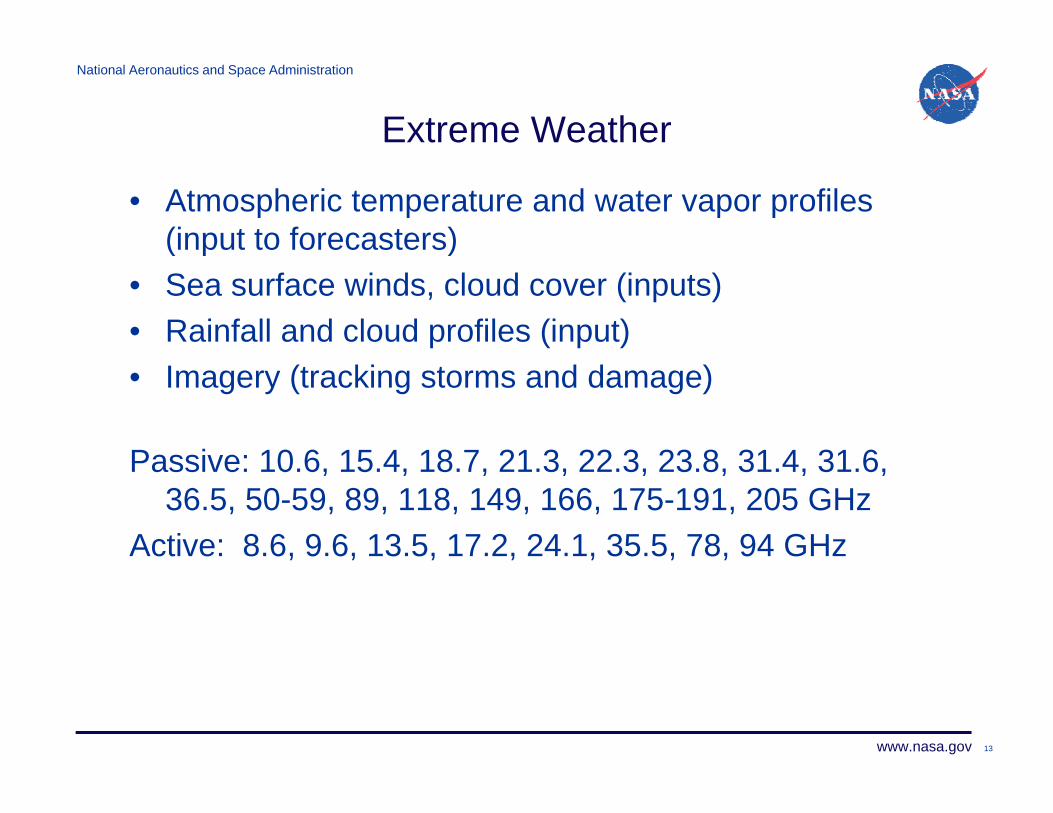
Extreme Weather
• Atmospheric temperature and water vapor profiles (input to forecasters)( p )
• Sea surface winds, cloud cover (inputs)• Rainfall and cloud profiles (input) • Imagery (tracking storms and damage)
Passive: 10 6 15 4 18 7 21 3 22 3 23 8 31 4 31 6Passive: 10.6, 15.4, 18.7, 21.3, 22.3, 23.8, 31.4, 31.6, 36.5, 50-59, 89, 118, 149, 166, 175-191, 205 GHz
Active: 8.6, 9.6, 13.5, 17.2, 24.1, 35.5, 78, 94 GHz, , , , , , ,
www.nasa.gov 13

National Aeronautics and Space Administration
Extreme Weather
GOES imagery showed GOES imagery showed of hurricane Katrina of hurricane Katrina which struck in late which struck in late
August 2005.August 2005.
www.nasa.gov 14

National Aeronautics and Space Administration
Extreme Weather
TRMM displayed the 3TRMM displayed the 3--D characterD characterof the hurricane's rainfall.of the hurricane's rainfall. QuikSCATQuikSCAT produced wind speed produced wind speed
and direction at the ocean surfaceand direction at the ocean surface
www.nasa.gov 15
and direction at the ocean surface.and direction at the ocean surface.Hurricane Katrina was CategoryHurricane Katrina was Category--5 on August 28, 20055 on August 28, 2005

National Aeronautics and Space Administration
Floods
• SAR-generated Digital Elevation Models, or DEMs (risk areas) ( )
• Weather forecasts (warnings) • Areal precipitation, water equivalent from snowfall,
stream flow, soil moisture (risk)• Imagery (assess impact, track recovery)
Passive: 1.4, 2.7, 10.6, 15.4, 18.7, 21.3, 22.3, 23.8, 31.4, 31.6, 36.5, 50-59, 89, 118, 149, 166, 175-191, , , , , , , , , ,205 GHz
Active: 0.43, 1.25, 5.3, 8.6, 9.6, 13.4, 24.1, 35.5 GHz
www.nasa.gov 16

National Aeronautics and Space Administration
Floods
Flooding of the Xi River, Flooding of the Xi River, affecting the city ofaffecting the city of WuzhouWuzhou
LandsatLandsat--7 draped over SRTM DEM7 draped over SRTM DEM
affecting the city of affecting the city of WuzhouWuzhouin Guangxi Province.in Guangxi Province.Reference data are from Reference data are from LandsatLandsat; flood data are from; flood data are from
www.nasa.gov 17
LandsatLandsat; flood data are from ; flood data are from ASAR on ASAR on EnvisatEnvisat..

National Aeronautics and Space Administration
Droughts
• Sea Surface height, temperature (forecast el Nino) • Snowcover surface temperature rain measurementsSnowcover, surface temperature, rain measurements
(forecast available water)• Soil moisture, rainfall, vegetation health (observe
onset, progress)
Passive: 1 4 2 65 4 9 6 7 7 2 10 6 18 7 21 3 22 3Passive: 1.4, 2.65, 4.9, 6.7, 7.2, 10.6, 18.7, 21.3, 22.3, 23.8, 31.5, 36.5, 50-59, 89, 118,149, 166, 175-191, 205 GHz
Active: 0.43, 1.25, 5.3, 8.6, 9.6, 13.5, 17.2, 24.1, 35.5 GHz
www.nasa.gov 18

National Aeronautics and Space Administration
Droughts
El Nino La NinaEl Nino La NinaEastern Pacific: warm, higher (red)Eastern Pacific: warm, higher (red) cooler, lower (blue)cooler, lower (blue)
JASON-1JASON-1
www.nasa.gov 19
, g ( ), g ( ) , ( ), ( )Trade winds: weaker strongerTrade winds: weaker strongerDrought: Australia, Indonesia along American coastsDrought: Australia, Indonesia along American coasts

National Aeronautics and Space Administration
Drought
Soil moisture distribution in Australia during October 2005 and 2006. Soil moisture distribution in Australia during October 2005 and 2006. ggA drought occurred in south east Australia (Granary area) in 2006.A drought occurred in south east Australia (Granary area) in 2006.
Data acquired by AMSRData acquired by AMSR--E on Aqua: E on Aqua: Red = low soil moisture (dry); Blue = high soil moisture (wet)Red = low soil moisture (dry); Blue = high soil moisture (wet)
www.nasa.gov 20
Red = low soil moisture (dry); Blue = high soil moisture (wet). Red = low soil moisture (dry); Blue = high soil moisture (wet).

National Aeronautics and Space Administration
Drought
Data collected by the SPOT Vegetation satellite Data collected by the SPOT Vegetation satellite b t M 11 d 20 2008b t M 11 d 20 2008
www.nasa.gov 21
between May 11 and 20, 2008.between May 11 and 20, 2008.Brown = bad condition; green = good condition.Brown = bad condition; green = good condition.

National Aeronautics and Space Administration
Pollution
• SAR imagery (detect possible oceanic oil spill, then track it) )
• Ocean color to detect red tides.• Atmospheric pollutants via IR
Passive: (none) Active: 1 25 5 3 GHzActive: 1.25, 5.3 GHz
www.nasa.gov 22

National Aeronautics and Space Administration
Pollution
•• Oil Slicks in the Oil Slicks in the Arabian SeaArabian Sea duedueArabian Sea Arabian Sea due due to seepage to seepage from from Oil PlatformsOil Platforms
•• (Multi(Multi--Frequency Frequency SIRSIR--C Image)C Image)
www.nasa.gov 23

National Aeronautics and Space Administration
Pollution
••On 11 August 2006, On 11 August 2006, an oil tanker sankan oil tanker sankan oil tanker sank an oil tanker sank in the Philippines.in the Philippines.
••ENVISAT SAR ENVISAT SAR located the extent of located the extent of the oil slick on 24 the oil slick on 24 August 2006.August 2006.
www.nasa.gov 24
National Aeronautics and Space Administration
Pollution
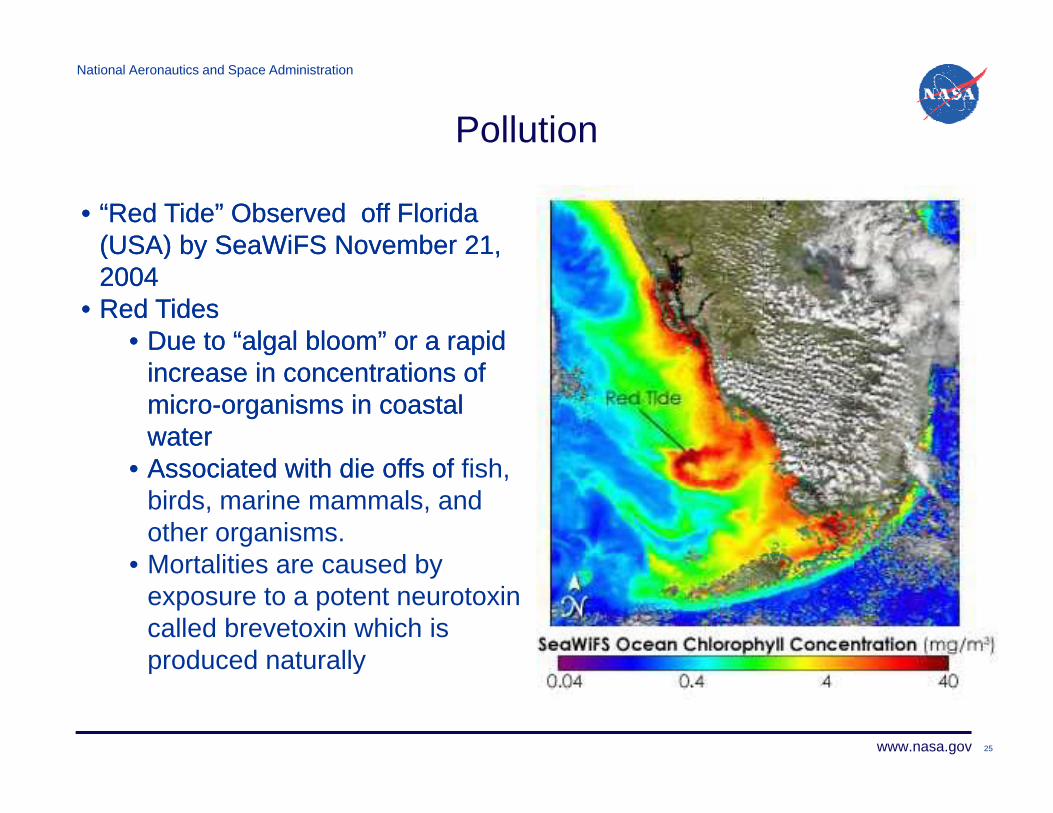
•• “Red Tide” Observed off Florida “Red Tide” Observed off Florida (USA) by(USA) by SeaWiFSSeaWiFS November 21,November 21,(USA) by (USA) by SeaWiFSSeaWiFS November 21, November 21, 2004 2004
•• Red TidesRed Tides•• Due to “algal bloom” or a rapid Due to “algal bloom” or a rapid
increase in concentrations of increase in concentrations of micromicro--organisms in coastal organisms in coastal waterwater
•• Associated with die offs of Associated with die offs of fish, birds, marine mammals, and other organisms. Mortalities are caused by• Mortalities are caused by exposure to a potent neurotoxin called brevetoxin which is produced naturally
www.nasa.gov 25
produced naturally

National Aeronautics and Space Administration
Pollution
www.nasa.gov 26
Nitrogen Dioxide Measured Worldwide in 2008Nitrogen Dioxide Measured Worldwide in 2008
National Aeronautics and Space Administration
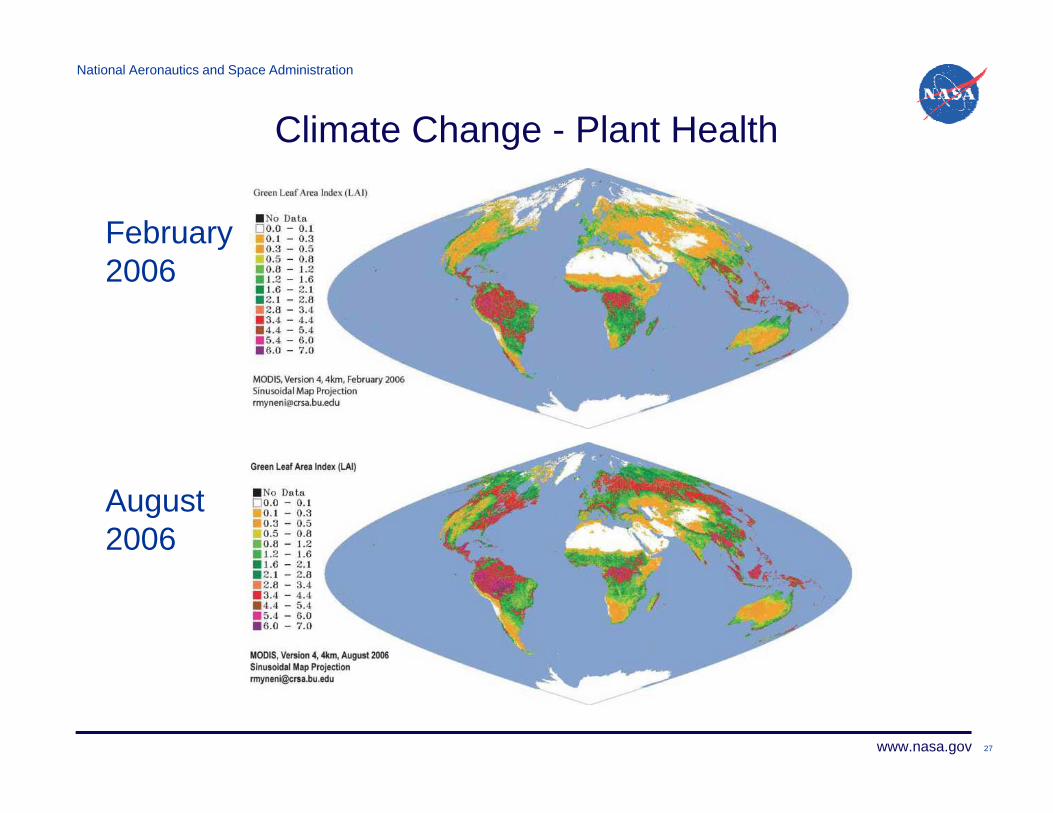
Climate Change - Plant Health
February2006
August2006
www.nasa.gov 27

National Aeronautics and Space Administration
Climate Change - Population Monitoring
Night lights visible from space indicate populated areas
www.nasa.gov 28
Night lights visible from space indicate populated areas

National Aeronautics and Space Administration
Organizations Providing Data & Training
• SERVIR: Spanish for “To Serve”: Regional Visualization and Monitoring System integrating earth g y g gobservations (e.g. satellite imagery) and forecast models together with in situ data and knowledge.UNOSAT The United Nations Instit te for Training• UNOSAT: The United Nations Institute for Training and Research (UNITAR) Operational Satellite Applications Programme (UNOSAT)
• UN-SPIDER: United Nations Platform for Space-based Information for Disaster Management and Emergency Response (UN SPIDER)Emergency Response (UN-SPIDER)
www.nasa.gov 29

National Aeronautics and Space Administration
SERVIR
• Joint NASA, NOAA, USGS, USAID program with regional officesg– Clayton, Panamá (2005)– Nairobi, Kenya (2008)
Kathmandu Nepal (2010)– Kathmandu, Nepal (2010)
• Uses– Monitoring: Air quality, extreme weather, biodiversity, land
cover– Used over 35 times in response to natural disasters and
environmental threats• Wildfires, Floods, Landslides, Alga Blooms
– Emphasis on analyzing impacts of climate change
• www servir net
www.nasa.gov
www.servir.net
30

National Aeronautics and Space Administration
UNOSAT & UN-SPIDER• UNOSAT:
– Specializes in analyzing data from a vast array of sources and pro iding c stom data prod cts and reportsproviding custom data products and reports
– Provides hands-on training with geographic information systems (GIS) equipment
– Has specific modules in training and education curricula up to post-university Master level
• UN-SPIDER:– "Ensure that all countries and international and regional
organizations have access to and develop the capacity to use all types of space-based information to support the full disaster yp p ppmanagement cycle“
– Links space-based remote sensing and disaster management communities
www.nasa.gov
– Conducts workshops
31

National Aeronautics and Space Administration
Other ITU-R and ITU-D resources• Report ITU-R RS.2178 “The essential role and global
importance of radio spectrum use for Earth observations and for related applications”pp
• Recommendation ITU-R RS.1859 “Use of remote sensing systems for data collection to be used in the event of natural disasters and similar emergencies”
• Recommendation ITU R RS 1883 “Use of remote sensing• Recommendation ITU-R RS.1883 Use of remote sensing systems in the study of climate change and the effects thereof”
• ITU/WMO Handbook on “Use of Radio Spectrum for Meteorology: Weather, Water and Climate Monitoring and P di ti ” (Editi 2008)Prediction” (Edition 2008)
• ITU-R Handbook on “Earth Exploration-Satellite Service” (Edition 2011)
• ITU-D Report “Question 22/2 - Utilization of ICT for disasterITU D Report Question 22/2 Utilization of ICT for disaster management, resources, and active and passive space-based sensing systems as they apply to disaster and emergency relief situations” - Final Report
www.nasa.gov 32

National Aeronautics and Space Administration
Other resources
• United States Telecommunications Training Institute (USTTI) : Disaster Management and Communications course, October/November 2011 in Washington, DC, USA
• ITU-R responsible for keeping spectrum used by p p g p yremote sensing satellites free from interference
• ITU-D Study Group 2: Has invited the UNOSAT, UN-SPIDER and SERVIR to establish liaisonSPIDER, and SERVIR to establish liaison relationships with the ITU-D
• Space Frequency Coordination Group (SFCG) Disaster Management DatabaseDisaster Management Database– https://www.sfcgonline.org/Remote%20Sensing/default.aspx
www.nasa.gov
* Many Thanks to Dr. Chuck Wende
33

National Aeronautics and Space Administration
www.nasa.gov 34