remote sensing and gis application in agro ... sensing and gis application in agro-ecological zoning...
TRANSCRIPT

REMOTE SENSING AND GIS APPLICATION INAGRO-ECOLOGICAL ZONING
N.R. PatelAgriculture and Soils DivisionIndian Institute of Remote Sensing, Dehra Dun
Abstract : Sustainable agricultural development requires a systematic effort towardsthe planning of land use activities in the most appropriate way, apart from severalother institutional and policy programme initiatives. Agro-ecological zoning (AEZ)is one of the most important approaches for agricultural developmental planningbecause survival and failure of particular land use or farming system in a given regionheavily relies on careful assessment of agro-climatic resources. This approach is usedto categorize agro-climatically uniform geographical areas for agriculturaldevelopmental planning and other interventions. Modern tools such as satelliteremote sensing and Geographical Information System (GIS) have been providingnewer dimensions to effectively monitor and manage land resources in an integratedmanner for agro-ecological characterization. The application of AEZ is limited bylack of geospatial data, particularly in mountainous areas. This paper tries todemonstrate incorporation of new tools to extend applicability of AEZ in
mountainous areas like Kumaon Himalayas, India.
INTRODUCTION
Sustainable agricultural development requires a systematic effort towards theplanning of land use activities in the most appropriate way, apart from
several other institutional and policy programmme initiatives. Agro-ecologicalzoning (AEZ) is one of the most important bases for agricultural developmentalplanning because survival and failure of particular land use or farming systemin a given region heavily relies on careful assessment of agro-climatic resources.A practical zoning approach thus arises because climate represented by thermaland moisture regimes forms small geographic areas, resulting in a variablemosaic of specialized areas, capable of supporting varied land use systems (Troll,1965). The approach is used to categorize agroclimatically uniform
Satellite Remote Sensing and GIS Applications in Agricultural Meteorologypp. 213-233

214 Remote Sensing and GIS Application in Agro-Ecological Zoning
geographical areas for agricultural developmental planning and otherinterventions. A framework of agro-ecological zoning describing concepts,methods and procedures was conceptualized for the first time by FAO (1976).Agro-ecological zoning refers to the division of an area of land into landresource mapping units, having unique combination of landform, soil andclimatic characteristics and or land cover having a specific range of potentialsand constraints for land use (FAO, 1996). The particular parameters used inthe definition focus attention on the climatic and edaphic requirements ofcrop and on the management systems under which the crops are grown. Eachzone has a similar combination of constraints and potentials for land use andserves as a focus for the targeting of recommendations designed to improvethe existing land use situation, either through increasing production or bylimiting land degradation. The addition of further layers of information onsuch factors as land tenure, land availability, nutritional requirement of humanand livestock populations, infrastructure and costs and prices, has enabled thedevelopment of more advanced applications in natural resource analysis andland use planning. AEZ can be regarded as a set of core applications, leadingto an assessment of land suitability and potential productivity. An output ofAEZ studies includes maps showing agro-ecological zones and land suitability,quantitative estimates on potential crop yields and production. Suchinformation provides the basis for advanced applications such as landdegradation assessment, livestock productivity modeling, population supportcapacity assessment and land use optimization modeling.
IMPORTANCE OF AEZ IN SUSTAINABLE AGRICULTURALDEVELOPMENT PLANNING
The ability of the world’s natural resources to provide for the needs of itsgrowing population is a fundamental issue for the international community.World’s population is increasing rapidly and at the same time, essential naturalresources, such as land and water, are declining both in quantity and qualitydue to such factors as competition with industrial and urban demands. Thebasic problem is that limits to the productive capacity of land resources areset by climate, soil and land forms condition. In this context AEZ can beregarded as a set of applications, leading to an assessment of land suitabilityand potential productivity in terms of climate, soil and land forms condition.
Agro-Ecological Zoning (AEZ) is one of the most important bases ofsustainable agricultural development planning of a region. It is applicable inmicro or local level planning mainly for rainfed agriculture. It assesses basicallythe yield potentialities of various crop conditions; evolves future plan of action

N.R. Patel 215
involving crop diversification; determines suitability of different crops foroptimizing land use, disseminates research results and agro-technology. As aresult sustainable agricultural development planning is increasingly being basedon agro-ecological zones. In this process agro climate zoning has become verypopular (Verma and Partap, 1989). The initial focus of the FAO agro-ecologicalzoning system was to assess the suitability of different types of land use forselected land uses. It is an important starting point for selected land useplanning with an overview of the whole region. It diagnoses the presentsituation with regard to farming and land use by categorizing, describing andanalyzing, farming systems components.
DEFINITIONS
Agro-Ecological Zoning (AEZ) refers to the division of an area of land intosmaller units, which have similar characteristics related to land suitabilitypotential production and environmental impact.
Agro-Ecological Zone is a land resource mapping unit, having a uniquecombination of land form, soil and climatic characteristics and/or land coverhaving a specific range of potentials and constraints for land use (FAO, 1996).
Agro-Ecological Cell (AEC) is defined by a unique combination of land form,soil and climatic characteristics
TRADITIONAL APPROACH
Several attempts have been made to classify the land area into climaticregions. Many of the earlier efforts to delineate agro-climates used manualoverlay of isolines representing either potential evapotranspiration ortemperature or their combinations and superimposed on soil resource maps.Carter (1954) divided India into six climatic regions, ranging from arid toper humid, based on the criteria of Thornthwaite system of climateclassification. Sehgal et al. (1987) prepared a computerized bio-climatic mapof NW India, based on the criteria of dry month. Krishnan (1988) delineated40 soil climatic zones based on major soil types and moisture index. Murthyand Pandey (1978) brought out a 8 agro-ecological region map of India onthe basis of physiography, climate, soils and agricultural regions. The approachdepicts a good beginning of agro-ecological zoning in the country, but it suffersfrom several limitations due to over generalizations such as grouping togetherthe areas having different physiography, temperature and soil in zone.

216 Remote Sensing and GIS Application in Agro-Ecological Zoning
Subramanian (1983) based on the data of 160 meteorological stations inthe country and using the concept of moisture adequacy index, delineated29 agro-ecological zones with the possible 36 combinations of IMA anddominated soil groups as per FAO/UNESCO Soil Map (1974).The planningcommission, as a result of mid-term appraisal of the planning targets of VIIPlan (1985-1990), divided the country into 15 broad agro-climatic zonesbased on physiography and climate (Sehgal et al., 1992).
NEW TOOLS FOR AEZ
Modern tools such as satellite remote sensing and GIS have been providingnewer dimensions to effectively monitor and manage natural resources. It hasbeen well conceived that remote sensing and GIS have great role to play inagro-ecological zoning for sustainable development due to multi-stage characterof the comprehensive approach to agro-ecological zoning (Pratap et al., 1992).Several approaches of AEZ in past involved manual integration of agro-climaticand other natural resource data (Mavi, 1984; Venkateswaralu et al., 1996).As a result, large amount of agro-ecological data could not be handled easilyand aggregation was required at an early stage in the analysis. This led to lossof information on spatial variability. On the other hand, GIS technology isvery useful for automated logical integration of bio-climate, terrain and soilresource inventory information (Patel et al., 2000). The system is capable ofcontaining all data required to solve resource management problems.Topographic maps, land resource map and contour map having physiographic,geographic and bio-climatic information forms primary input for GIS for agro-ecological zoning activities. The system also facilitates the enlargement of aparticular geographic pocket to render more details on retrieval. After collectingthe basic data on zonal resource information, the data can be manipulated tocreate relevant profiles of applied use that can be retrieved on demand. A zonaldatabase can also be integrated with non-geographic information such associoeconomic data, which is relevant for making decision on developmentpriority interventions about the sustainable management of zonal resources.Remote sensing provides digital or hard copy data base information on naturalresources. This information can be stored and retrieved as and when requiredand also data can be classified and aggregated for any number of planningexercises. This AEZ concept involves the representation of land in layers ofspatial information and combination of layers of spatial information usinggeographic information system (GIS).

N.R. Patel 217
STRUCTURE OF AEZ
The structure of AEZ includes the comprehensive framework for theappraisal and planning of land resources (Figure 1). The nature of analysis,which involves the combination of layers of spatial information to define zones,lends itself to application of a GIS. The major requirements of computerizedGIS for an activity like agro-ecological zoning and zonal resource informationof mountain areas are topographic maps, land resource maps and contour maps.These maps, containing physiographic, geographic, and bio-climaticinformation form primary inputs. Various outputs are generated in bothtabular and map forms. Till date, good progress has been made in developingGIS based tools for land resources planning, management and monitoring atdifferent scales.
ELEMENTS OF AEZ
The essential elements of the core applications of AEZ include :
Land resource inventory, comprising
Analysis of length of growing period or moisture availability index
Defining thermal zones
Compilation of climatic resource inventory
Compilation of soil and landform resource inventory
Compilation of present land use inventory
Combination of above to make land resource inventory based on agro-ecological zones or agro-ecological cells.
Inventory of land utilization types and crop requirements
Land suitability evaluation, including
• Potential productivity computations
• Matching of constraints and requirements

218 Remote Sensing and GIS Application in Agro-Ecological Zoning
A CASE STUDY ON AGRO-ECOLOGICAL ZONING IN MOUNTAINECOSYSTEM
Sustainable development of mountain regions is a challenging task becausethe areas have highly diverse and fragile ecosystems. One of the most strikingcharacteristics of mountains is their spatial variability. This makes the planningof the use of natural resources in the mountains more complex than any otherarea. In view of this, the present study was conducted in part of KumaonHimalayas (latitudes 28o45’ to 30o00’N, longitude 78o45’ to 80o15’) todemonstrate the use of remote sensing and GIS as a tools for agro-ecologicalzoning with mountain perspective (Patel et al., 2002). The methodology usedin this study is outlined in the flow diagram in Figure 2. This methodologyis further described as following sub heads.
Climate
Long term (approximately 10 years) monthly maximum and minimumtemperatures were collected from six meteorological stations falling in the
Figure 1: Structure of land resource
Data base for definition of Agro-Ecological Zoning
Land Resource Overlay
Thermal Zones
Rainfall
Moisture Zones
Agro-ecological cellsInformation in computerised GIS form for each cell. Thermal regimes (3 zones) soil moisture (8zones) Rainfall (5 zones) Soil Texture (3 classess) Slope (4 classes) Physiography (3 types) Elevation (5 zones) Soil unit (47 types) Landuse (10 classes)
Physiography
Elevation Zones
Biomass
Slope
Soil Texture
Land use/Land cover

N.R. Patel 219
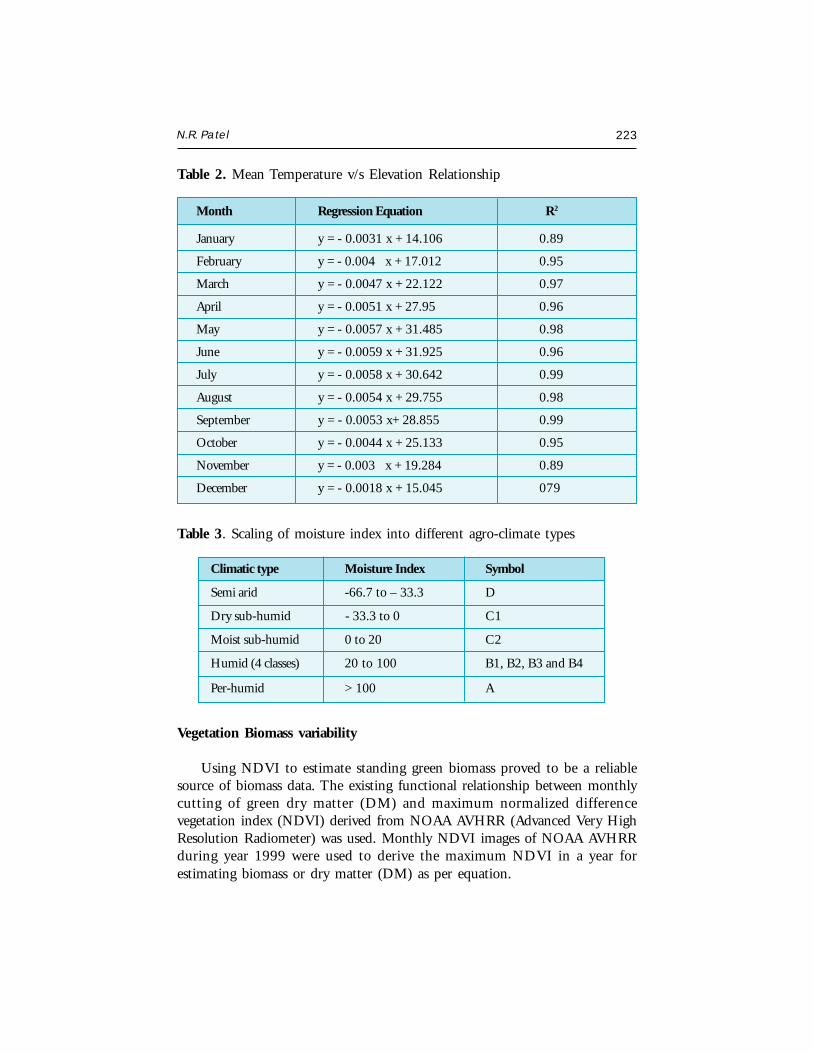
western Himalayas. However, monthly rainfall data for eight years werecollected from eleven rain gauge stations within the study area. The detailsabout location of meteorological and rain gauge stations are shown in Table1. Digital elevation data with one-kilometer grid size was taken from GlobalDigital Elevation Model (USGS GDEM) and geometrically registered in UTMprojection. Validation and accuracy check for digital elevation data derivedfrom Global DEM was done with spot height observation from Survey of Indiatoposheets on 1:250000 scale. A close agreement was observed between spotheight observations and Global DEM based elevation data (R2 = 0.98). Longterm monthly and annual averages of mean temperatures of six meteorologicalstations were regressed against corresponding elevation using MICROSTAstatistical software (Table 2). A good agreement was also observed betweenannual mean temperature and elevation (annual mean temperature = 24.443- 0.0045 × elevation, R2 = 0.97). Similarly long term average annual rainfallrecorded at different rain gauge stations were regressed against elevation fordeveloping rainfall – elevation relationship (annual rainfall = 515.1 + 0.3843× elevation, R2 = 0.75) representing the region under study. The empiricalrelations thus developed were used to utilize inherent spatial quality of digitalelevation model in GIS environment for depicting spatial variation in normal
Figure 2 : Flow diagram of the method for agro-ecological zoning
Soil Maps:PhysiographyTextureSlopeDepth
Bioclimate &Moistureregines
BiomassComposite land
use
Landuse/landcover
(Kharif/Rabi)
TemporalIRS WIFS
Data
NOAAAVHRR
NDVImaxTmax, Tmin
RainfallPET maps
Suggested SuitableLanduse
Global 1.0 kmDEM
ClimateInterpolar
Tmax, TminRainfall
(Weather station)
Agro-Ecological Zoens

220 Remote Sensing and GIS Application in Agro-Ecological Zoning
monthly and annual mean temperatures as well as annual rainfall conditionover Kumaon region. These monthly spatial distribution of mean temperatureswere used for computation of spatial potential evapotranspiration (PET) basedon Thornthwaite (1948) as:
PET = 1.6 [ (10 Tijk/Ijk)ajk ]
where,
Dec
Ijk = ∑ (Tijk/5)1.514
i =Jan
T = Mean air temperature (°C)
i = Month of a year (i = Jan, Feb, ……Dec)
j = Pixel value of i th row
k = Pixel value of j th column
ajk =67.5*10-8(Ijk)3-7.71*10-5*(Ijk)
2+0.01792( Ijk)+0.4923
These monthly potential evapotranspiration were summed over twelvemonths in a year to obtain spatial distribution of annual PET for use incomputation of moisture index (MI). The moisture index with positive andnegative values indicates moist or dry climate and seasonal variation of effectivemoisture. The revised moisture index of Thornwaite and Mather (1955)method based on annual rainfall and potential evapotranspiration wascalculated as,
MI =[( P – PET)/PET] * 100
where,
MI = Moisture Index
P = Rainfall (mm)
PET = Potential Evapotranspiration (mm)
This information on moisture index is vital to congenial biotic environmentand has been used to classify the climatic types. To arrive at homogeneouszones, the limit of moisture index of the various climatic types was scaled asshown in Table 3.

N.R. Patel 221
Tab
le 1
. D
ata
for
field
s an
d lo
cati
on o
f m
eteo
rolo
gica
l an
d ra
in g
auge
sta
tion
s
No.
Met
/rai
n ga
uge
Dat
a fie
lds
Peri
od- L
atitu
deEl
evat
ion
Sour
cest
atio
nM
onth
ly(y
ears
)- L
ongi
tude
(met
er)
1.M
ukte
swar
Rai
nfal
l, Te
mpe
ratu
re10
29 o 2
7’ 2
8.7”
N22
75In
stitu
te T
empe
rate
79 o 3
9’ 2
7.2”
EH
ortic
ultu
re S
tatio
n
2.H
awal
bagh
Rai
nfal
l, Te
mpe
ratu
re10
29o 3
6’ 0
0.0”
N12
50M
et. S
tatio
n79
o 40’
00.
0” E
3.A
lmor
aR
ainf
all,
Tem
pera
ture
1029
o 3
5’ 2
2.4”
N15
28V
ivek
anan
d IC
AR
79 o 3
8’ 4
2.2”
EIn
stitu
te
4.Pa
ntna
gar
Rai
nfal
l, Te
mpe
ratu
re10
29 o 0
2’ 2
7.2”
N23
2A
gric
ultu
re U
nive
rsity
,79
o 2
4’ 3
0.5”
EPa
ntna
gar
5.N
aini
tal
Rai
nfal
l, Te
mpe
ratu
re10
29 o 2
1’ 3
0.7”
N19
45A
stro
nom
y St
ate
79 o 2
7’ 2
6.3”
EO
bser
vato
ry, N
aini
tal
6.D
ehra
Dun
Rai
nfal
l,Tem
pera
ture
1030
o 19’
00.
0” N
682
Met
. Sta
tion
78o 0
2’ 0
0.0”
E
7.M
usso
orie
Rai
nfal
l, Te
mpe
ratu
re10
30o 2
7’ 0
0.0”
N20
24M
et. S
tatio
n, C
SWC
RII
78o 0
5’ 0
0.0”
ED
ehra
Dun
8.C
hauk
hutia
Rai
nfal
l8
29 o 5
2’ 3
2.1”
N97
6Fo
rest
Con
serv
atio
n79
o 2
2’ 1
5.6’
ED
epar
tmen
t, R
anik
het
9.K
edar
Rai
nfal
l8
29 o 4
7’ 0
7.8’
N95
8Fo
rest
Con
serv
atio
n79
o 1
5’ 2
6.8”
ED
epar
tmen
t, R
anik
het

222 Remote Sensing and GIS Application in Agro-Ecological Zoning
10.
Nau
laR
ainf
all
829
o 4
4’ 1
3.5”
N88
6Fo
rest
Con
serv
atio
n79
o 1
5 11
.8”
ED
epar
tmen
t, R
anik
het
11.
Tam
adha
unR
ainf
all
829
o 5
0’ 4
9.0”
N91
2Fo
rest
Con
serv
atio
n79
o 1
2’ 0
5.4”
ED
epar
tmen
t, R
anik
het
12.
Saun
iR
ainf
all
829
o 37’
47.
9” N
1599
Fore
st C
onse
rvat
ion
79o 2
2’ 0
5.8”
ED
epar
tmen
t, R
anik
het
13.
Deo
likhe
tR
ainf
all
829
o 3
8’ 5
1.1”
N17
15Fo
rest
Con
serv
atio
n79
o 2
7’ 0
0.6”
ED
epar
tmen
t, R
anik
het
14.
Bin
taR
ainf
all
829
o 4
7’ 1
0.0”
N18
87Fo
rest
Con
serv
atio
n79
o 2
8’ 1
4.5”
ED
epar
tmen
t, R
anik
het
No.
Met
/rai
n ga
uge
Dat
a fie
lds
Peri
od- L
atitu
deEl
evat
ion
Sour
cest
atio
nM
onth
ly(y
ears
)- L
ongi
tude
(met
er)
N.R. Patel 223
Table 3. Scaling of moisture index into different agro-climate types
Climatic type Moisture Index Symbol
Semi arid -66.7 to – 33.3 D
Dry sub-humid - 33.3 to 0 C1
Moist sub-humid 0 to 20 C2
Humid (4 classes) 20 to 100 B1, B2, B3 and B4
Per-humid > 100 A
Vegetation Biomass variability
Using NDVI to estimate standing green biomass proved to be a reliablesource of biomass data. The existing functional relationship between monthlycutting of green dry matter (DM) and maximum normalized differencevegetation index (NDVI) derived from NOAA AVHRR (Advanced Very HighResolution Radiometer) was used. Monthly NDVI images of NOAA AVHRRduring year 1999 were used to derive the maximum NDVI in a year forestimating biomass or dry matter (DM) as per equation.
Table 2. Mean Temperature v/s Elevation Relationship
Month Regression Equation R2
January y = - 0.0031 x + 14.106 0.89
February y = - 0.004 x + 17.012 0.95
March y = - 0.0047 x + 22.122 0.97
April y = - 0.0051 x + 27.95 0.96
May y = - 0.0057 x + 31.485 0.98
June y = - 0.0059 x + 31.925 0.96
July y = - 0.0058 x + 30.642 0.99
August y = - 0.0054 x + 29.755 0.98
September y = - 0.0053 x+ 28.855 0.99
October y = - 0.0044 x + 25.133 0.95
November y = - 0.003 x + 19.284 0.89
December y = - 0.0018 x + 15.045 079

224 Remote Sensing and GIS Application in Agro-Ecological Zoning
DM = (1.615*NDVImax)1.318 ; R2 = 0.90
DM = Dry matter
NDVImax = Maximum NDVI in a year.
Land use/land cover
Land use/land cover was derived from coarse resolution IRS WiFS satellitedata. Ground truth was collected through integrated use of previous year IRSLISS III hard copy (1:250,000 scale) satellite data, Survey of India (SOI)toposheets and handheld Global Positioning System (GPS). Combination ofsatellite data acquired during kharif (September and October, 2001) and rabi(January and March, 2002) seasons were digitally classified to land use/landcover information classes for kharif and rabi, respectively using MXL classifier.Agricultural land use classes in rabi season were refined with respect to landuse information in kharif season and crop calendar of major crops cultivatedin the region. Finally, classified land use /land cover information of kharif andrabi seasons were logically integrated on a pixel by pixel basis in raster GISfor deriving cropping system or composite land use/land cover (Fig. 3).
Figure 3: Suggested land use based on AEZs and present land use
Barren/ScrubDeciduous ForestDense ForestFallow - FallowFallow - SugarcaneFallow - WheatForest PlantationLakeModerately Dense Forest
Open ForestPaddy - FallowPaddy -SugarcanePaddy - WheatRiverSettlementSugarcaneSugarcane - FallowSugarcane - Wheat
AfforestationAgro HorticultureDouble crop agricultureForestForest PlantationLakeRiver SettlementSocial Forestry
Suggested Land UseComposite Land Use
N

N.R. Patel 225
Soils
Forty-six soil mapping unit along with their characteristics such as depth,texture, slope, erosion status, and drainage condition for the study area wereobtained from soil map (1:250000 scale) prepared by National Bureau of SoilSurvey and Land Use Planning, India. These spatial and non spatial data onsoils were converted into digital soil resource databases for AEZ. In generalterms, coarse loamy and skeletal soils are in side slope and top of LesserHimalayas and piedmont plain while fine textured soils mainly found inalluvial plain and fluvial valleys. The soils are mostly moderately deep to deep,however, approximately 25 % of the area having shallow soils were mainlyfound in Lesser Himalayas and piedmont plain (Fig. 4).
Figure 4: Characteristics of agro-edaphic and agro-climatic zones
All the land resource databases and characteristics (Fig. 1) described aboveas layer or combination of layers of spatial information were integrated oroverlaid to derive different unique agro-ecological cells. These agro-ecologicalcells were further aggregated to arrive at agro-ecological zones and sub zonesbased on their potential to support agriculture and vegetation patterns.
Delineation of agro-climatic zones
Agro-climatic zones are of paramount importance for defining ordelineation of agro-ecological zoning for sustainable use of land resources. Theessential elements in demarcating or defining of an agro-climatic zone arebioclimates based on thermal regimes, moisture regime and biomass variability

226 Remote Sensing and GIS Application in Agro-Ecological Zoning
(Fig. 5). Thermal regimes indicate to the amount of heat available for plantgrowth and development during the growing period. Moisture regimesrepresent water availability for crop production and hence they are the vitalto classify the agro-climatic zones. Nine different agro-climatic zones weredelineated by GIS aided integration of thermal regimes, moisture regimes andbiomass map layers (Fig. 5).
Figure 5: Input layers for agro-ecological zoning
Delineation of Agro-ecological zones and sub-zones
Thirty agro-ecological sub zones (AEZIa to AEZXIIc) were delineated inthe study area (Table 4) by GIS aided integration of nine agro-climatic andeight agro-edaphic zones (Fig. 6). Results revealed that the majority of areafalls in XIa whereas minimum area is occupied by Via (Patel et al., 2002).The other larger sub-zones are Ib and VIIIa, respectively. AEZIc and AEZIIcare the most potential zones for intensive cropping with possibility of twoand three crops such as paddy – wheat or sugarcane – wheat (Table-4). Furthersub-ecological zones are reclassified by GIS aided integration in which sub-zones are clubbed into main agro-ecological zones. Therefore, twelve agro-ecological zones (AEZI to AEZXII) are identified in the study area. The spatial

N.R. Patel 227
Tab
le 4
. Sp
atia
l ex
tent
of
Agr
o-E
colo
gica
l Su
b Z
ones
Sl.N
o.A
EZA
E S
ub Z
one
Des
crip
tion
Are
a (h
a)(%
)
1.I
aE
quat
oria
l, se
mia
rid
very
gen
tly sl
opin
g al
luvi
al p
lain
with
loam
y to
fine
7448
7.48
6.50
loam
y so
ils a
nd lo
w b
iom
ass
2.I
bE
quat
oria
l, se
mia
rid
very
gen
tly sl
opin
g al
luvi
al p
lain
with
loam
y to
fine
1079
97.1
9.42
loam
y so
ils a
nd m
ediu
m b
iom
ass
3.I
cE
quat
oria
l, se
mia
rid
very
gen
tly sl
opin
g al
luvi
al p
lain
with
loam
y to
fine
1011
1.92
0.88
loam
y so
ils a
nd h
igh
biom
ass
4.II
aE
quat
oria
l, se
mia
rid
very
gen
tly sl
opin
g in
allu
vial
pla
in w
ith c
oars
e lo
amy
8001
5.28
6.98
soils
and
low
bio
mas
s
5.II
bE
quat
oria
l, se
mia
rid
very
gen
tly sl
opin
g in
allu
vial
pla
in w
ith c
oars
e lo
amy
6413
5.22
5.59
soils
and
med
ium
bio
mas
s
6.II
cE
quat
oria
l, se
mia
rid
very
gen
tly sl
opin
g in
allu
vial
pla
in w
ith c
oars
e lo
amy
2371
.58
0.21
soils
and
hig
h bi
omas
s
7.II
Ia
Equ
ator
ial,
sem
iari
d ge
ntly
slop
ing
valle
y fil
ls w
ith c
oars
e lo
amy
soils
and
4633
5.98
4.04
low
bio
mas
s
8.II
Ib
Equ
ator
ial,
sem
iari
d ge
ntly
slop
ing
valle
y fil
ls w
ith c
oars
e lo
amy
soils
and
2475
8.47
2.16
med
ium
bio
mas
s
9.II
Ic
Equ
ator
ial,
sem
iari
d ge
ntly
slop
ing
valle
y fil
ls w
ith c
oars
e lo
amy
soils
and
77.7
60.
01hi
gh b
iom
ass
10.
IVa
Sub
equa
tori
al, S
ub h
umid
to h
umid
gen
tly sl
opin
g va
lley
fills
with
coa
rse
3453
1.08
3.02
loam
y so
ils a
nd lo
w b
iom
ass

228 Remote Sensing and GIS Application in Agro-Ecological Zoning
11.
IVb
Sub
equa
tori
al, S
ub h
umid
to h
umid
gen
tly sl
opin
g va
lley
fills
with
coa
rse
1163
1.71
1.01
loam
y so
ils a
nd m
ediu
m b
iom
ass
12.
Va
Equ
ator
ial,
sem
iari
d ge
ntly
slop
ing
pied
mon
t pla
in w
ith c
oars
e lo
amy
soil
4215
1.25
3.68
and
low
bio
mas
s
13.
Vb
Equ
ator
ial,
sem
iari
d ge
ntly
slop
ing
pied
mon
t pla
in w
ith c
oars
e lo
amy
soil
3426
6.01
2.99
and
med
ium
bio
mas
s
14.
Vc
Equ
ator
ial,
sem
iari
d ge
ntly
slop
ing
pied
mon
t pla
in w
ith c
oars
e lo
amy
soil
968.
430.
08an
d hi
gh b
iom
ass
15.
VI
aSu
b eq
uato
rial
, Sub
hum
id to
hum
id g
ently
slop
ing
pied
mon
t pla
in w
ith7.
070.
00co
arse
loam
y so
ils a
nd lo
w b
iom
ass
16.
VI
bSu
b eq
uato
rial
, Sub
hum
id to
hum
id g
ently
slop
ing
pied
mon
t pla
in w
ith11
80.4
81.
10co
arse
loam
y so
ils
17.
VII
aW
arm
tem
pera
te, p
er h
umid
mod
erat
ely
stee
p to
stee
p slo
ping
pie
dmon
t54
44.5
90.
57pl
ain
with
coa
rse
loam
y so
ils a
nd lo
w b
iom
ass
18.
VII
bW
arm
tem
pera
te, p
er h
umid
mod
erat
ely
stee
p to
stee
p slo
ping
pie
dmon
t69
76.9
0.61
plai
n w
ith c
oars
e lo
amy
soils
19.
VII
Ia
Sub
equa
tori
al, S
ub h
umid
to h
umid
mod
erat
e st
eep
to st
eep
slopi
ng H
ills
1231
03.1
10.7
5w
ith lo
am to
fine
loam
soils
and
low
bio
mas
s
20.
VII
Ib
Sub
equa
tori
al, S
ub h
umid
to h
umid
mod
erat
e st
eep
to st
eep
slopi
ng H
ills
6566
2.08
5.72
with
loam
to fi
ne lo
am so
ils
Sl.N
o.A
EZA
E S
ub Z
one
Des
crip
tion
Are
a (h
a)(%
)

N.R. Patel 229
21.
IXa
Equ
ator
ial,
sem
iari
d m
oder
ate
stee
p to
stee
p slo
ping
in H
ills w
ith lo
am to
3535
4.6
3.08
fine
loam
y so
ils a
nd lo
w b
iom
ass
22.
IXb
Equ
ator
ial,
sem
iari
d m
oder
ate
stee
p to
stee
p slo
ping
in H
ills w
ith lo
am to
1556
1.97
2.67
fine
loam
y so
ils a
nd m
ediu
m b
iom
ass
23.
IXc
Equ
ator
ial,
sem
iari
d m
oder
ate
stee
p to
stee
p slo
ping
in H
ills w
ith lo
am to
498.
35.0
5fin
e lo
amy
soils
and
hig
h bi
omas
s
24.
Xa
War
m te
mpe
rate
, per
hum
id m
oder
atel
y st
eep
to st
eep
slopi
ng H
ills w
ith22
86.7
60.
20co
arse
loam
y sk
elet
al so
ils a
nd lo
w b
iom
ass
25.
Xb
War
m te
mpe
rate
, per
hum
id m
oder
atel
y st
eep
to st
eep
slopi
ng H
ills w
ith39
90.3
30.
34co
arse
loam
y sk
elet
al so
ils a
nd m
ediu
m b
iom
ass
26.
XI
aSu
b eq
uato
rial
, Sub
hum
id to
hum
id m
oder
ate
stee
p to
stee
p slo
ping
Hill
s18
2201
.915
.88
with
loam
y sk
elet
al so
ils a
nd lo
w b
iom
ass
27.
XI
bSu
b eq
uato
rial
, Sub
hum
id to
hum
id m
oder
ate
stee
p to
stee
p slo
ping
Hill
s10
6272
9.27
with
loam
y sk
elet
al so
ils a
nd m
ediu
m b
iom
ass
28.
XII
aE
quat
oria
l, se
mia
rid
mod
erat
e st
eep
to st
eep
slopi
ng H
ills w
ith l
oam
y29
40.6
20.
26sk
elet
al so
ils a
nd lo
w b
iom
ass
29.
XII
bE
quat
oria
l, se
mia
rid
mod
erat
e st
eep
to st
eep
slopi
ng H
ills w
ith l
oam
y43
830.
093.
82sk
elet
al so
ils a
nd m
ediu
m b
iom
ass
30.
XII
cE
quat
oria
l, se
mia
rid
mod
erat
e st
eep
to st
eep
slopi
ng H
ills w
ith l
oam
y35
3.44
0.03
skel
etal
soils
and
hig
h bi
omas
s
Sl.N
o.A
EZA
E S
ub Z
one
Des
crip
tion
Are
a (h
a)(%
)

230 Remote Sensing and GIS Application in Agro-Ecological Zoning
Tab
le 5
. Sp
atia
l ex
tent
of
Agr
o-E
colo
gica
l Z
ones
Sl.N
o.A
EZD
escr
iptio
nA
rea
(ha)
(%)
1.I
Equ
ator
ial,
sem
iari
d ve
ry g
ently
slop
ing
in a
lluvi
al p
lain
with
loam
y to
fine
loam
y so
ils19
2596
.516
.8
2.II
Equ
ator
ial s
emia
rid
very
gen
tly sl
opin
g in
allu
vial
pla
in w
ith c
oars
e lo
amy
soi
ls14
6522
.112
.78
3.II
IE
quat
oria
l, se
mia
rid
gent
ly sl
opin
g in
val
ley
fills
with
coa
rse
loam
y so
ils71
172.
216.
21
4.IV
Sub
equa
tori
al, S
ub h
umid
to h
umid
gen
tly sl
opin
g va
lley
fills
with
coa
rse
loam
y so
ils48
42.1
34.
03
5.V
Equ
ator
ial,
sem
iari
d ge
ntly
slop
ing
pied
mon
t pla
in w
ith c
oars
e lo
amy
soil
7738
5.69
6.75
6.V
ISu
b eq
uato
rial
, Sub
hum
id to
hum
id g
ently
slop
ing
pied
mon
t pla
in w
ith c
oars
e lo
amy
soils
1187
.55
1.10
7.V
IIW
arm
tem
pera
te, p
er h
umid
mod
erat
ely
stee
p to
stee
p slo
ping
pie
dmon
t pla
in w
ith c
oars
elo
amy
soils
1242
1.49
1.18
8.V
III
Sub
equa
tori
al, S
ub h
umid
to h
umid
mod
erat
e st
eep
to st
eep
slopi
ng H
ills w
ith lo
amy
tofin
e lo
amy
soils
1887
65.2
16.4
7
9.IX
Equ
ator
ial,
sem
iari
d m
oder
ate
stee
p to
stee
p slo
ping
in H
ills w
ith lo
am to
fine
loam
y so
ils51
414.
926.
80
10.
XW
arm
tem
pera
te, p
er-h
umid
mod
erat
ely
stee
p to
stee
p slo
ping
Hill
s with
coa
rse
loam
ysk
elet
al so
ils62
77.0
90.
54
11.
XI
Sub
equa
tori
al, S
ub h
umid
to h
umid
mod
erat
e st
eep
to st
eep
slopi
ng H
ills w
ith lo
amy
skel
etal
soils
2884
74.2
25.1
5
12.
XII
Equ
ator
ial,
sem
iari
d m
oder
ate
stee
p to
stee
p slo
ping
Hill
s with
loa
my
skel
etal
soils
4712
4.15
4.11

N.R. Patel 231
distribution of these zones is presented in Figure 6. The area covered rangesfrom 0.54 % in AEZ X to 25.15 % in AEZ XI. The whole hilly portion fallsin AEZ VIII whereas lower alluvial plain in AEZ I and AEZ II (Table-5). Asuitable land use (Fig. 3) plan for sustainable use of land resource for theKumaon region was suggested based on characteristics of AEZs and existingland use pattern.
Figure 6. Agro-ecological zones
CONCLUSIONS
A Remote Sensing and Geographical Information System based approachto delineate Agro-Ecologically homogeneous geographical areas was developedusing soil resources, temperature, rainfall, moisture, and biomass as inputlayers. Based on delineated Agro-ecological Zones, suitable land use weresuggested in Kumaon region of Almora, Nainital, Champawat and UdhamSingh Nagar districts.
Following conclusions were drawn from the study,
1. Strong negative relations between temperatures and elevation (i.e. lapserate) would provide basis for estimating spatial variations in temperature,particularly in the mountain ecosystems.

232 Remote Sensing and GIS Application in Agro-Ecological Zoning
2. Spatial distribution of PET and Moisture index would help in definingmicro-Environment more accurately in the mountains environment.
3. Integration of bio-climate, moisture regimes and regional vegetationbiomass in GIS environment could provide a more dynamic way ofcharacterizing homogeneous agro-climatic zones for identifying biophysicaland climate characteristics to agricultural productivity.
REFERENCES
Carter, D.B. 1954. Climates of Africa and according to Thornthwaite (1948) Classification.John Hopkins University Publication (in) Climatology, 7(14).
FAO, 1976. A framework for land evaluation. Food and Agricultural Organisation, SoilsBulletin 32, Rome, Italy.
FAO, 1996. Guidelines: Agro-ecological zoning. Food and Agricultural Organisation, SoilsBulletin, Rome, Italy.
Krishnan, A. 1988. Delineation of soil climatic zones of India and its practical applicationsin Agriculture. Fertilizer News, 33 (4).
Mavi, H.S. 1984. Introduction to Agrometeorology, IInd edition. Raju Primlani for Oxford& IBH Publishers Co. Pvt. Ltd.
Murthy, R.S. and Pandey, S. 1978. Delineation of agro-ecological regions of India. Paperpresented in Commission V, 11th Congress of ISSS, Edmonton, Canada, June 19-27.
Pariyar, M.P. and Singh, G. 1994. GIS based model for agro-ecological zoning: a case studyof Chitwan district, Nepal. Proc. 15th Asian Conference Rem. Sens., Bangalore, India.Vol. 1 : A4-1 to A4-6.
Pratap, T., Pradhan, P., Lotta, P.K., Mya, S., Karim and Nakarmi, G. 1992. GeographicInformation Systems and Technology application in Agro-ecological zonation ofmountain agriculture. Eds. N.S. Jodha, M. Banskota and Tej Pratap, Oxford & IBHPublishing Co. Pvt. Ltd., New Delhi.
Patel, N.R., Mandal, U.K. and Pande, L.M. 2000. Agro-ecological zoning system. A RemoteSensing and GIS Perspective. Journal of Agrometeorology, 2 (1) : 1-13.
Patel, N.R., Endang, P., Suresh Kumar and Pande, L.M. 2002. Agro-ecological zoning usingremote sensing and GIS – A case study in part of Kumaon region. In: Sustainableagriculture development, Proce. of 2nd International Conference on SustainableAgriculture, Water Resources Development and Earth Care Policies, 18-20 December,2002, New Delhi (In Press).

N.R. Patel 233
Sehgal, J.L., Vernemmen, C. and Tavernier, R. 1987. Agro-climatic Environments andMoisture Regimes in NW India - Their Applications in Soils and Crop Growth. ResearchBull. NBSS Publ. 17, Nagpur, India, NBSS & LUP.
Sehgal, J.L., Mandal, D.K., Mandal, C. and Vadivelu, S. 1992. Agro-ecological Region ofIndia. NBSS & LUP (ICAR) Publication 24, Nagpur.
Subramanian, A.R. 1983. Agro-ecological Zones of India. Arch. Met. Geoph. Biocl. Ser. B32;329-333.
Thornthwaite, C.E. and Mathew, J.R. 1955. The Water Balance. Publications in Climatology,Vol.8, No.1. Drexel Institute of Technology, Laboratory of Climatology, Centerton, N.J.pp. 104.
Thornthwaite, C.W. 1948. An Approach towards a rational classification of climate.Geographical Review, 38: 55-94.
Troll, C. 1965. Seasonal Climates of the earth. World maps of Climatology. Eds. E. Rodenwaltand H. Jusatz. Berlin : Springer – Verlag, pp. 28.
Venkateshwarlu, J., Ramakrishna, Y.S. and Rao, A.S. 1996. Agro-climatic zones of India.Annals of Arid Zone, 35 (1); 1-8.
Verma and Pratap, 1989. Agro climatic zones. Profiles and Issues. Agro-climatic RegionalPlanning UNIT (ARPU) Working paper, Ahmedabad: Sardar Patel Inst. of Econ. andSoc. Res. 1989.