remote sensing and geologic mapping of …mramsey/papers/graettinger_etal-2013.pdf7182 a.h....
TRANSCRIPT
International Journal of Remote Sensing, 2013Vol. 34, No. 20, 7178–7198, http://dx.doi.org/10.1080/01431161.2013.817716
Remote sensing and geologic mapping of glaciovolcanic deposits in theregion surrounding Askja (Dyngjufjöll) volcano, Iceland
A.H. Graettingera*, M.K. Ellisa, I.P. Skillingb, K. Reatha, M.S. Ramseya,R.J. Leea, C.G. Hughesc, and D.W. McGarvied
aDepartment of Geology and Planetary Science, University of Pittsburgh, Pittsburgh, PA, USA;bEnergy and Environment Research Institute, University of South Wales, Pontypridd, UK; cEarthSurface Science, JPL, Pasadena, CA, USA; dDepartment of Environment, Earth and Ecosystems,
The Open University, Edinburgh, UK
(Received 23 February 2013; accepted 28 May 2013)
The surface geology of the Northern Volcanic Zone in Iceland is dominated by volcanicridges, central volcanoes, shield volcanoes, and tuyas. The largest features are typi-cally ice-confined (glaciovolcanic) in origin, and are overlain by voluminous Holocene(subaerial) lavas and glacial outwash deposits. The literature has focused heavily onprominent or very young features, neglecting small and older volcanic features. Thepurpose of this study is to demonstrate the application of remote-sensing mappingtechniques to the glaciovolcanic environment in order to identify dominant lithologiesand determine locations for textural, stratigraphic, and age studies. The deposits tar-geted in this study occur on and around Askja volcano, in central Iceland, includingPleistocene glaciovolcanic tuffs and subaerial pumice from the 1875 rhyolitic erup-tion of Askja. Data from the Advanced Spaceborne Thermal Emission and ReflectionRadiometer (ASTER) were used in conjunction with previously published geologic andremote-sensing data sets and recent field work on glaciovolcanic deposits of Askja forvalidation. Remotely acquired data sets include aerial photographs and one ASTERscene obtained in August 2010. Visible and near-infrared (VNIR) and thermal infrared(TIR) classifications and linear deconvolution of the TIR emissivity data were per-formed using end-members derived from regions of interest and laboratory spectra.End-members were selected from samples of representative lithologic units within thefield area, including glaciovolcanic deposits (pillow lavas, tuffs, etc.), historical deposits(1875 pumice, 1920s basaltic lavas), and Holocene basaltic lavas from Askja. Theresults demonstrate the potential for remote sensing-based ground cover mapping ofareas of glaciovolcanic deposits relevant to palaeo-ice reconstructions in areas such asIceland, Antarctica, and British Columbia. Remote sensing-based mapping will benefitglaciovolcanic studies, by determining the lithologic variability of these relatively inac-cessible massifs and serving as an important springboard for the identification of futurefield sites in remote areas.
1. Introduction
The Icelandic landscape is dominated by basaltic Pleistocene glaciovolcanic and Holocenelandforms. Rhyolitic deposits comprise approximately 1% of the total volume of volcanic
*Corresponding author. Present address: Center for Geohazard Studies, University at Buffalo, NY,USA. Email: [email protected]
© 2013 Taylor & Francis
Dow
nloa
ded
by [
Mic
hael
Ram
sey]
at 1
6:35
18
July
201
3

International Journal of Remote Sensing 7179
deposits exposed in Iceland (Jakobsson, Jónasson, and Sigurdsson 2008). Simplified geo-logic maps exist for the entire country, with detailed studies of individual locations ofinterest. One area that has received considerable attention in the last century is Askja(Dyngjufjöll), a glaciovolcanic central volcano in the Northern Volcanic Zone (NVZ)(Figure 1). Central volcanoes, such as Askja, are basaltic shield volcanoes with inter-mittent rhyolitic activity, and typically display collapsed calderas. Central volcanoes areassociated with long-term polygenetic growth occurring along the active and ancient rifts inIceland. These massifs are typically dominated by glaciovolcanic deposits produced in andaround ice-confined lakes. The resulting massifs are steep-sided constructs of pillow lavas,glassy ash, and lapilli tuff deposits. Locally emergent subaerial lavas cap glaciovolcanicdeposits; these lavas were produced after the massif grew above water level, or throughdrainage of the surrounding lake. The relative proportions of these lithofacies at glaciovol-canic centres can vary dramatically from dominantly fragmental (i.e. Helgafell (Schopka,Gudmundsson, and Tuffen 2006)) to totally lava-dominated deposits (i.e. Undirhlíðar,Iceland, and Pillow Ridge, Canada (Edwards et al. 2009)) and varying combinations ofthe two (i.e. Herðubreið, Iceland (Werner, Schmincke, and Sigvaldason 1996)). The Askjacomplex is composed of a wide variety of fragmental and coherent glaciovolcanic andsubaerial deposits bisected by at least three calderas, and is the site of recent effusiveand explosive eruptions (1875, 1920–1929, and 1961) (Annertz, Nilsson, and Sigvaldason1985). This area is of interest to volcanologists and palaeoclimate researchers due to its
Figure 1. Location map of Iceland with the volcanic zones highlighted in grey (modified fromSigvaldason 2002).Note: Askja is located just north of Vatnajökull ice cap. The Northern Volcanic Zone stretches northfrom the Vatnajökull icecap to the coast. Inset shows the Austurfjöll glaciovolcanic massif in relationto Öskjuvatn, the caldera lake of Askja.
Dow
nloa
ded
by [
Mic
hael
Ram
sey]
at 1
6:35
18
July
201
3
7180 A.H. Graettinger et al.
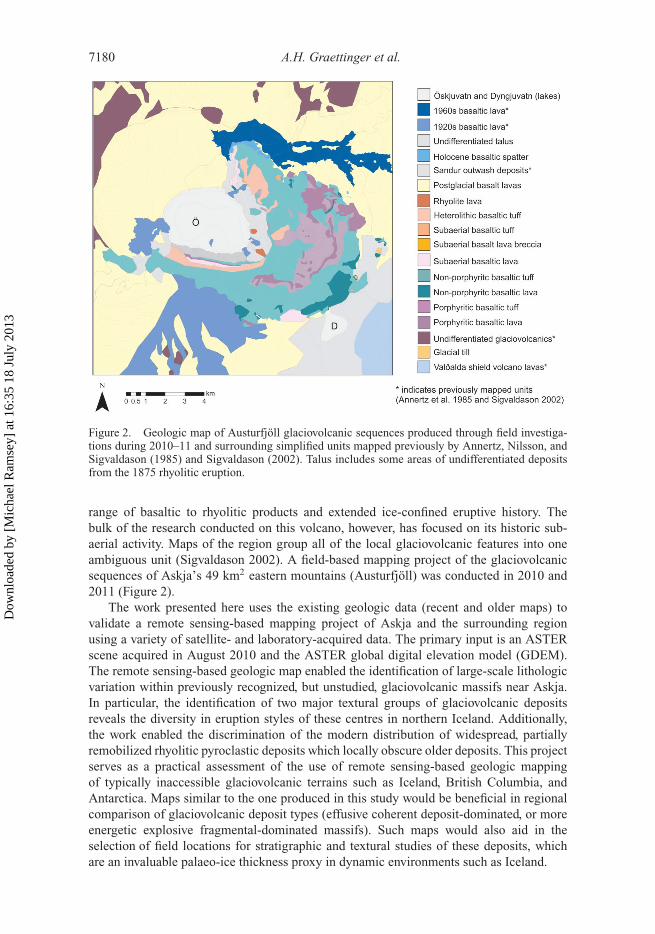
Figure 2. Geologic map of Austurfjöll glaciovolcanic sequences produced through field investiga-tions during 2010–11 and surrounding simplified units mapped previously by Annertz, Nilsson, andSigvaldason (1985) and Sigvaldason (2002). Talus includes some areas of undifferentiated depositsfrom the 1875 rhyolitic eruption.
range of basaltic to rhyolitic products and extended ice-confined eruptive history. Thebulk of the research conducted on this volcano, however, has focused on its historic sub-aerial activity. Maps of the region group all of the local glaciovolcanic features into oneambiguous unit (Sigvaldason 2002). A field-based mapping project of the glaciovolcanicsequences of Askja’s 49 km2 eastern mountains (Austurfjöll) was conducted in 2010 and2011 (Figure 2).
The work presented here uses the existing geologic data (recent and older maps) tovalidate a remote sensing-based mapping project of Askja and the surrounding regionusing a variety of satellite- and laboratory-acquired data. The primary input is an ASTERscene acquired in August 2010 and the ASTER global digital elevation model (GDEM).The remote sensing-based geologic map enabled the identification of large-scale lithologicvariation within previously recognized, but unstudied, glaciovolcanic massifs near Askja.In particular, the identification of two major textural groups of glaciovolcanic depositsreveals the diversity in eruption styles of these centres in northern Iceland. Additionally,the work enabled the discrimination of the modern distribution of widespread, partiallyremobilized rhyolitic pyroclastic deposits which locally obscure older deposits. This projectserves as a practical assessment of the use of remote sensing-based geologic mappingof typically inaccessible glaciovolcanic terrains such as Iceland, British Columbia, andAntarctica. Maps similar to the one produced in this study would be beneficial in regionalcomparison of glaciovolcanic deposit types (effusive coherent deposit-dominated, or moreenergetic explosive fragmental-dominated massifs). Such maps would also aid in theselection of field locations for stratigraphic and textural studies of these deposits, whichare an invaluable palaeo-ice thickness proxy in dynamic environments such as Iceland.
Dow
nloa
ded
by [
Mic
hael
Ram
sey]
at 1
6:35
18
July
201
3
International Journal of Remote Sensing 7181
1.2. Details of study area
Askja is a large basalt-dominated central volcano around 40 km north of the modernVatnajökull icecap (Figure 1). The major topographic feature of the volcano is a glacio-volcanic massif composed of Austurfjöll and Thorvaldstindur fissure ridges. The evolutionof this massif consists of multiple eruptions of fissure-fed micro- and macro-porphyriticlavas, breccias, and tuffs (Figure 2). These deposits were mapped in part by Sigvaldason(1968, 2002) and in great detail by Graettinger (2012).
Maps of historical volcanic deposits from Askja and regional geologic features havebeen published in the last century (Thoroddsen 1925; Bemmelen and Rutten 1955;Thorarinsson and Sigvaldason 1962; Þorarinsson 1963; Sigvaldason 1968; Annertz,Nilsson, and Sigvaldason 1985; Sigvaldason 2002; Carey, Houghton, and Thordarson2009; Hjartardóttir, Einarsson, and Sigurdsson 2009; Carey, Houghton, and Thordarson2010). Additional information on the nature of the historic volcanic activity has been col-lected since 1875 following a 0.321 km3 rhyolitic caldera-forming eruption from Askja(Sigvaldason 1964; Sigurdsson and Sparks 1978; Höskuldsson 1987; Sigvaldason 2002;Carey, Houghton, and Thordarson 2009; Carey, Houghton, and Thordarson 2010; Kuritaniet al. 2011). Previously published maps used in this study include a lineament and simpli-fied geology map (2400 km2) (Hjartardóttir, Einarsson, and Sigurdsson 2009), and a mapof the Holocene lavas surrounding Askja (1400 km2) with some simplified units of glacio-volcanic and interglacial origin (Annertz, Nilsson, and Sigvaldason 1985). The stratigraphyof nearby glaciovolcanic edifice Herðubreið has also been described (Werner, Schmincke,and Sigvaldason 1996; Werner and Schmincke 1999). These data, in conjunction with newfield evidence from Askja (Graettinger 2012), provide excellent opportunities to validateremotely collected data through comparison with samples and field observations (Figure 3).Other predominant features in this region include the glacial river, Jökulsá á Fjöllum, thatflows roughly south–north along the eastern edge of the ASTER scene; Dyngjuvatn, a shal-low periglacial lake between Askja and Valðalða (interglacial shield volcano); Öskjuvatn,a lake filling the youngest caldera of Askja; and extensive sandur (glacial outwash) plainsderived from Vatnajökull.
Remote-sensing data include: aerial photographs collected by LoftMyndir Icelandcomprising a greyscale mosaic in 2003 (850 km2) and one orthorectified colourimage in 2008 (50 km2), and a DEM created by LoftMyndir Iceland from steropairsof orthophotos (280 km2). A daytime ASTER scene acquired on 8 August 2010(AST_L1A.003:2080525361) allowed the mapped area to be extended to approximately4000 km2. ASTER level 2 data used for this study include the atmospherically cor-rected surface radiance product (15 m/pixel for the visible and near-infrared (VNIR) and90 m/pixel for TIR), the VNIR surface reflectance product (15 m/pixel), and the TIR sur-face emissivity product (90 m/pixel) (Figure 3). Unfortunately, shortwave infrared datafrom the ASTER instrument are not available for scenes collected after 2008 and this wasthe only clear daytime scene of the Askja volcano in the ASTER archive. The VNIR andTIR data were integrated with 25 m resolution ASTERGDEM, which encompasses all ofthe previously listed data sets.
2. Methodology
The creation of a 4000 km2 ground cover map of Askja and its surroundings involvedthe use of VNIR and TIR laboratory hyperspectral data of rock samples, VNIR, andTIR multispectral data extracted from the ASTER data, topographic data (ASTERGDEM,AusturfjöllDEM), detailed (Figure 2) and simplified (Figure 3) geologic maps, as well as
Dow
nloa
ded
by [
Mic
hael
Ram
sey]
at 1
6:35
18
July
201
3

7182 A.H. Graettinger et al.
Figure 3. Regional geologic map compiled from previously published sources. Outlines indicatefootprints of datasets used to compile the regional map and remote-sensing data sets utilized in thisstudy. Abbreviations reference features that are discussed in detail in the text: DY, Dyngjufjöll Ytri;HB, Herðubreið; AF, Austurfjöll; VA, Valðalða; KT, Kollóttadyngja.
several different image-processing approaches using Environment for Visualizing Images(ENVI) software. It was through comparison and correlation of these varying spatial andspectral resolution data sets that the best-fit map (BFM) was produced. The steps used toproduce the BFM are summarized in Figure 4.
2.1. Data collection
Remote-sensing data sets were augmented by the collection of lithologic and stratigraphicmeasurements from the field area. Field investigations resulted in the production of alithofacies map of Austurfjöll massif and sample collection of representative surface units.
2.1.1. Field work
The surface volcanic geology of the area of interest was studied in detail through two fieldexpeditions in 2010 and 2011 and analysis of aerial photographs. Representative samples ofthe dominant lithologies were identified on and around Austurfjöll in order to create a spec-tral end-member library. End-members were selected and sampled based on several criteriaincluding: (1) their compositional relevance to the evolution of Askja massif (both basaltsand rhyolite); (2) their abundance in the surrounding landscape (occurring over continuous
Dow
nloa
ded
by [
Mic
hael
Ram
sey]
at 1
6:35
18
July
201
3

International Journal of Remote Sensing 7183
Linear deconvolution
Unsupervised
classification
Process ProductData set
KEY
Aerial
photographs
ASTER
Literature
ASTER GDEM
Lithofacies map
Sample collection
TIR VNIR
Field work
Supervised
classification Groundcoverunits
BFM
Figure 4. Flow chart showing the multiple techniques used to produce the BFM. The map isthe product of a combination of products from multiple data sets and methods of processingremote-sensing data. Four inputs: ASTER data, aerial photographs, field work, and literature arerequired for the construction of this BFM. Ground cover units are initially defined by comparing theresults of supervised and unsupervised processing of ASTER spectral data in conjunction with theASTERGDEM. The boundaries of the ground cover units were further refined using existing datasets from the literature, field work-based lithofacies maps, and aerial photographs.
areas exceeding that of the spatial resolution of the ASTER instrument – 15 m plus); and(3) previous documentation in regional literature. Representative units included: glaciovol-canic subaqueously emplaced basaltic lavas (micro- and macro-porphyritic), subaqueousbasaltic lapilli and ash tuff, Askja subaerial basaltic lava, Valðalða basaltic subaerial lava,Askja historic basalt (1920s), Askja historic pumice components (1875 pumice, obsidian,and lithics), Askja hydrothermally altered rhyolite, diamicton, and basaltic glass (intrusivechill margin) (Figure 5). Preexisting regional maps indicate the presence of subaerial andglaciovolcanic deposits likely similar to the end-members within the region surroundingAskja (Figure 3). Samples and field observations were used for petrologic characterizationof the lithologies mentioned above. The lithofacies map produced by this field work wasused for comparison with remote-sensing results.
2.1.2. VNIR spectra
Directional VNIR reflectance spectra of the end-member lithology samples were collectedat the Image Visualization and Infrared Spectroscopy (IVIS) laboratory of the Universityof Pittsburgh using an Analytical Spectral Devices (ASD) FieldSpec HH spectrometer(0.35–1.1 µm spectral range). Spectra were collected using a full-spectrum lamp forillumination and calibrated against a Spectralon® plate. Whole rock samples with intactnatural surfaces were used. No atmospheric control was made due to the short path length(∼0.5 m) and limited atmospheric contamination in this wavelength region. These spectrawere used to create a hyperspectral end-member VNIR (H-VNIR) library of the selected
Dow
nloa
ded
by [
Mic
hael
Ram
sey]
at 1
6:35
18
July
201
3

7184 A.H. Graettinger et al.
Figure 5. Field images of examples of lithologies selected for spectral end-members from AskjaVolcano Iceland. (a) Glaciovolcanic pillow lava; (b) subaerial basaltic lava; (c) glaciovolcanic lapillituff; (d) 1875 rhyolitic pumice cover; (e) glaciovolcanic ash tuff; (f ) subaqueous porphyritic lava.
lithologies. The spectra were also resampled by convolving them with the ASTER spectralresponse function to produce an ASTER spectral resolution end-member (A-VNIR) library(Figure 6). The visual and near infrared wavelengths were targeted to help highlight vari-ations in the deposits based on colour, as significant variations were observed in the fieldand aerial photos correlating with the bimodal composition of eruptive products (rhyoliticpumice, basaltic lava).
2.1.3. TIR spectra
Hemispherical TIR emissivity spectra of the natural rock surfaces were also collected in theIVIS laboratory using a Nicolet Nexus 670 FTIR spectrometer with a KBr beam splitter and
Dow
nloa
ded
by [
Mic
hael
Ram
sey]
at 1
6:35
18
July
201
3
International Journal of Remote Sensing 7185
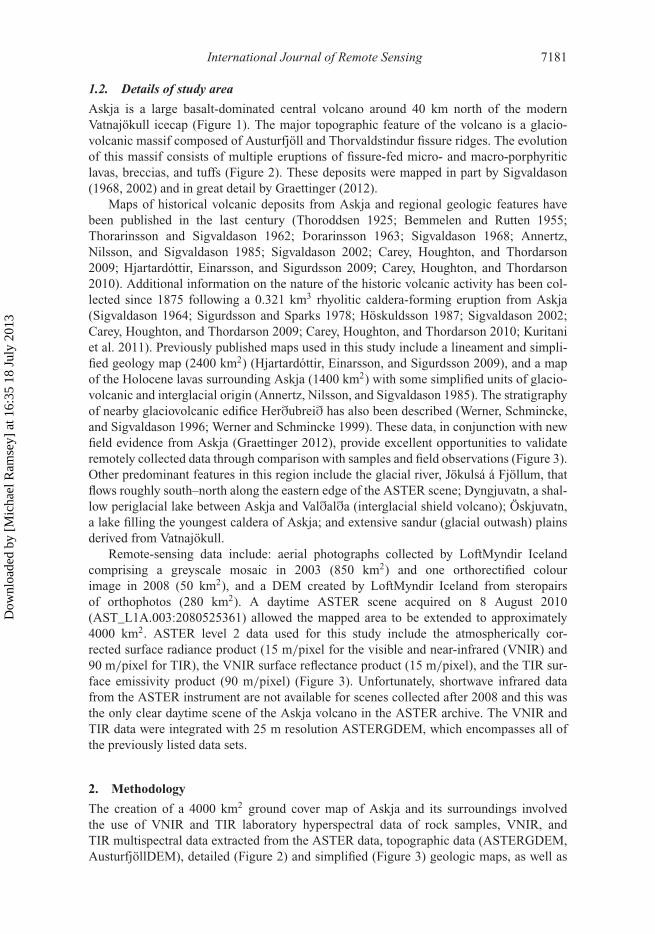
Figure 6. Selected VNIR hyperspectral and ASTER resolution reflectance spectra of representativeend-member samples. The limited spectral diversity of the compositional units (lapilli tuff, subaeriallava, ash tuff, pumice, subaqueous lava, and rhyolite) is primarily from overall brightness levels ofthe samples. However, all units can be distinguished in the limited spectral resolution of ASTER.
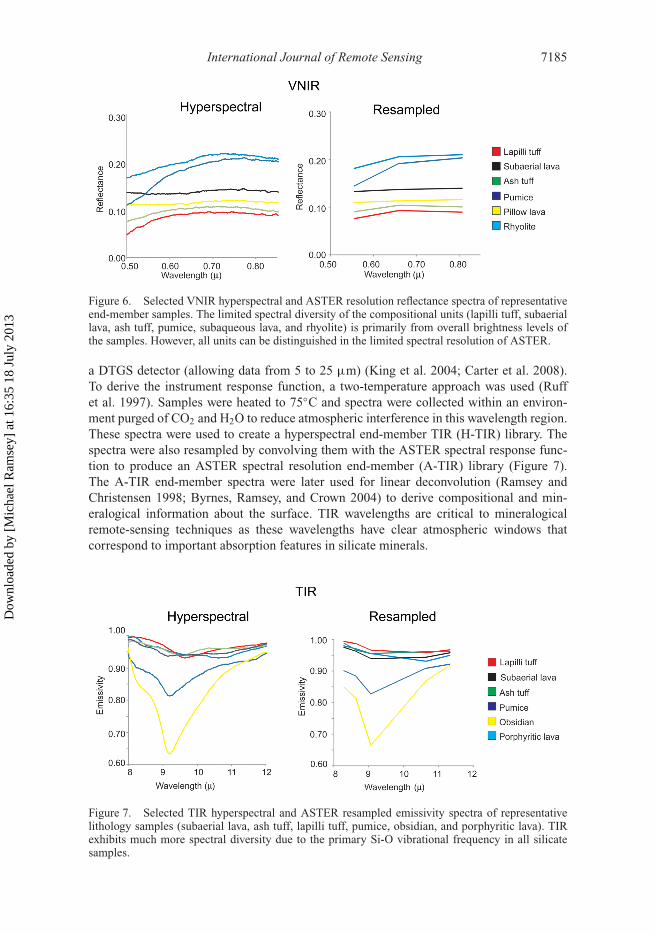
a DTGS detector (allowing data from 5 to 25 µm) (King et al. 2004; Carter et al. 2008).To derive the instrument response function, a two-temperature approach was used (Ruffet al. 1997). Samples were heated to 75◦C and spectra were collected within an environ-ment purged of CO2 and H2O to reduce atmospheric interference in this wavelength region.These spectra were used to create a hyperspectral end-member TIR (H-TIR) library. Thespectra were also resampled by convolving them with the ASTER spectral response func-tion to produce an ASTER spectral resolution end-member (A-TIR) library (Figure 7).The A-TIR end-member spectra were later used for linear deconvolution (Ramsey andChristensen 1998; Byrnes, Ramsey, and Crown 2004) to derive compositional and min-eralogical information about the surface. TIR wavelengths are critical to mineralogicalremote-sensing techniques as these wavelengths have clear atmospheric windows thatcorrespond to important absorption features in silicate minerals.
Figure 7. Selected TIR hyperspectral and ASTER resampled emissivity spectra of representativelithology samples (subaerial lava, ash tuff, lapilli tuff, pumice, obsidian, and porphyritic lava). TIRexhibits much more spectral diversity due to the primary Si-O vibrational frequency in all silicatesamples.
Dow
nloa
ded
by [
Mic
hael
Ram
sey]
at 1
6:35
18
July
201
3
7186 A.H. Graettinger et al.
2.2. Data processing
2.2.1. ASTER classification
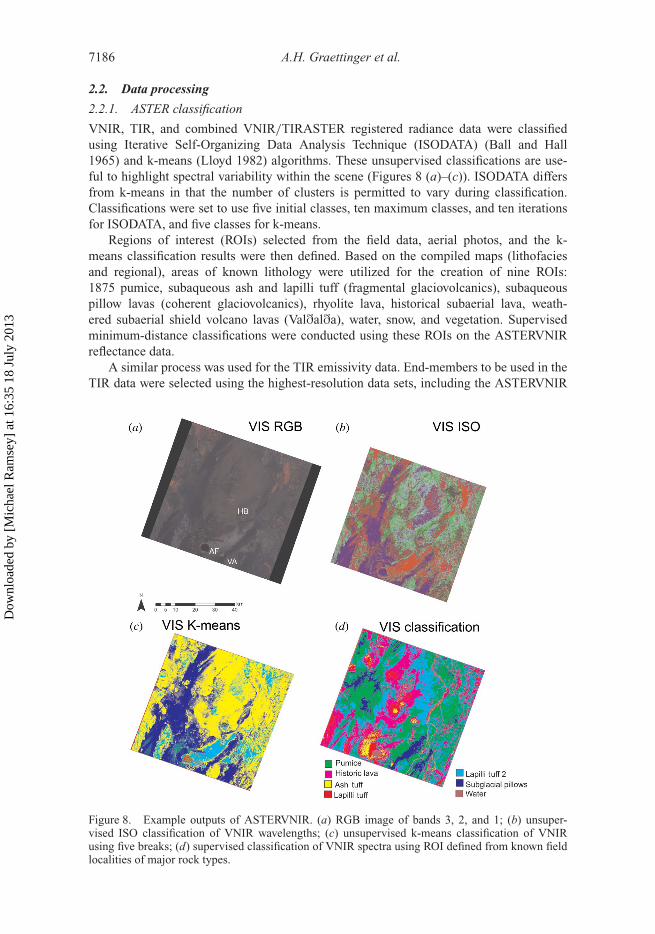
VNIR, TIR, and combined VNIR/TIRASTER registered radiance data were classifiedusing Iterative Self-Organizing Data Analysis Technique (ISODATA) (Ball and Hall1965) and k-means (Lloyd 1982) algorithms. These unsupervised classifications are use-ful to highlight spectral variability within the scene (Figures 8 (a)–(c)). ISODATA differsfrom k-means in that the number of clusters is permitted to vary during classification.Classifications were set to use five initial classes, ten maximum classes, and ten iterationsfor ISODATA, and five classes for k-means.
Regions of interest (ROIs) selected from the field data, aerial photos, and the k-means classification results were then defined. Based on the compiled maps (lithofaciesand regional), areas of known lithology were utilized for the creation of nine ROIs:1875 pumice, subaqueous ash and lapilli tuff (fragmental glaciovolcanics), subaqueouspillow lavas (coherent glaciovolcanics), rhyolite lava, historical subaerial lava, weath-ered subaerial shield volcano lavas (Valðalða), water, snow, and vegetation. Supervisedminimum-distance classifications were conducted using these ROIs on the ASTERVNIRreflectance data.
A similar process was used for the TIR emissivity data. End-members to be used in theTIR data were selected using the highest-resolution data sets, including the ASTERVNIR
Figure 8. Example outputs of ASTERVNIR. (a) RGB image of bands 3, 2, and 1; (b) unsuper-vised ISO classification of VNIR wavelengths; (c) unsupervised k-means classification of VNIRusing five breaks; (d) supervised classification of VNIR spectra using ROI defined from known fieldlocalities of major rock types.
Dow
nloa
ded
by [
Mic
hael
Ram
sey]
at 1
6:35
18
July
201
3

International Journal of Remote Sensing 7187
data, field data, and aerial photographs. Classes whose members exhibited spatial distri-butions smaller than a single TIR pixel (vegetation and snow) were excluded, due to lackof a pure end-member spectra within the ASTER data. The image-based end-memberswere used to create another spectral library (R-TIR), and then for further refinement of theminimum-distance classification.
2.2.2. VNIR reflectance spectra classification
The A-VNIR spectral library was used for supervised minimum-distance classification ofthe reflectance data. The 12-sample spectral library was further refined by creating ROI-based spectra from a targeted region of the known 1875 pumice that was highlighted by theinitial classification to produce the A-VNIR + spectral library. The classification was rerunto produce the best-fit VNIR classification of the pumice ground cover unit (Figure 8(d)).
2.2.3. Linear deconvolution of emissivity spectra (TIR)
Spectral deconvolution, or linear unmixing, is based on the principal that the TIR energyemitted or reflected from a surface containing multiple components (minerals, lithologies)is a linear combination of the energy emitted from each individual component in propor-tion to the end-member’s surface abundance (Ramsey and Christensen 1998). Because thismixing is linear, it can be modelled using an end-member library and a least squares linearfit of the data in order to extract the surface composition percentages of each end-memberfor every pixel (Adams, Smith, and Gillespie 1989; Byrnes, Ramsey, and Crown 2004;Ramsey and Dehn 2004). Linear deconvolution was conducted using the two broadbandTIR spectral libraries (R-TIR and A-TIR).
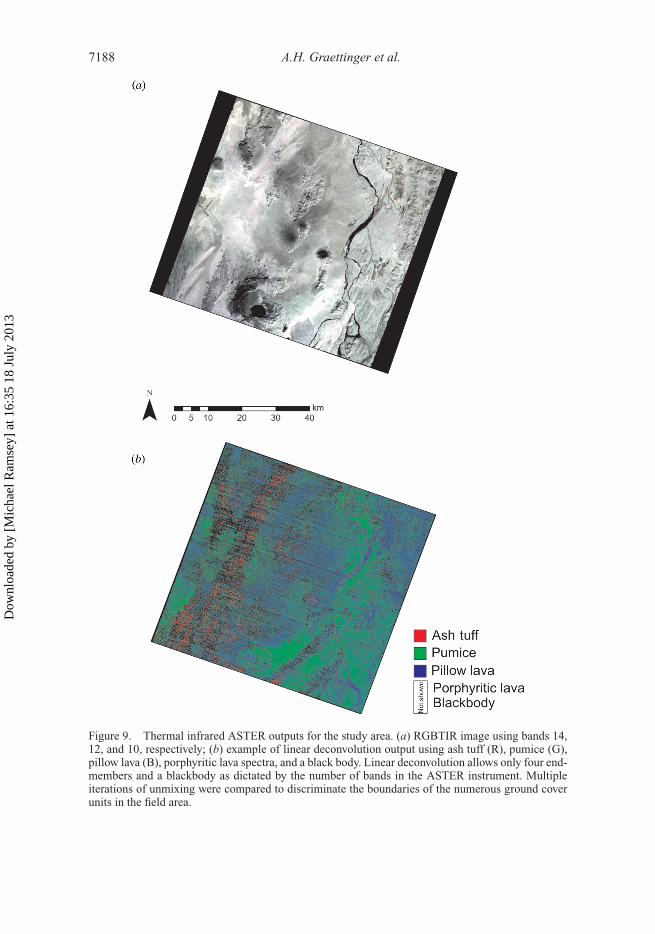
Spectral deconvolution of ASTERTIR data using the image end-members was per-formed using combinations of end-member spectra from the R-TIR spectral library. TheTIRROIs were defined initially with VNIR data and the spectra extracted from the ASTERemissivity data resampled to the same pixel size (15 m) as the VNIR data to ensureaccurate ROI perimeters. The deconvolution process was then run on the atmosphericallycorrected surface emissivity data. The process was repeated using the laboratory-basedA-TIR spectral library (Figure 9).
The deconvolution process involved using four spectral end-members plus a blackbodyspectrum for all iterations. Multiple iterations were performed for each spectral librarywith end-members selected to target deposits of interest: 1875 pumice, historical lava,Holocene lava, fragmental glaciovolcanic deposits (ash tuff and lapilli tuff), and coher-ent glaciovolcanic deposits (subaqueous lava flows). Results were evaluated by examiningthe end-member images as well as the root-mean-squared (RMS) error images that mapthe success of fit of those end-members. This comparison allowed each spectral subsetto be assessed, and to isolate false identifications of ground cover units in outlying areas,particularly the glaciovolcanic and pumice ground cover units.
2.3. Compilation of the best-fit map
Dominant ground cover units were identified from the ROI, VNIR, and TIR classifica-tions as well as the linear deconvolution results. The ground cover units were then dividedinto sub-units based on the success and agreement of classifications and deconvolutionresults. Individual landforms were assessed independently, with the results from eachmethodology compared for consistency and extent of the units. The ground cover units
Dow
nloa
ded
by [
Mic
hael
Ram
sey]
at 1
6:35
18
July
201
3
7188 A.H. Graettinger et al.
Figure 9. Thermal infrared ASTER outputs for the study area. (a) RGBTIR image using bands 14,12, and 10, respectively; (b) example of linear deconvolution output using ash tuff (R), pumice (G),pillow lava (B), porphyritic lava spectra, and a black body. Linear deconvolution allows only four end-members and a blackbody as dictated by the number of bands in the ASTER instrument. Multipleiterations of unmixing were compared to discriminate the boundaries of the numerous ground coverunits in the field area.
Dow
nloa
ded
by [
Mic
hael
Ram
sey]
at 1
6:35
18
July
201
3

International Journal of Remote Sensing 7189
were also compared with the GDEM to better define the boundaries of the lithologic unitsand morphological features. The end-member map was refined and further validated bycomparing it with the regional (Figure 3) and Askjalithologic (Figure 2) maps. Individualground cover units were compared with existing literature discussing the regional fea-tures and deposit distributions. The boundaries for the ground cover units were digitized inArcGIS based on overlays from the multiple remote-sensing techniques using areas of thehighest agreement between methods. For example, the 1875 pumice extent was constrainedby the work of Carey, Houghton, and Thordarson (2010), which documented 233 km2 ofpumice coverage, and thus significant outliers (i.e. to the west of the volcanic complexwhere no pumice was recorded) could be excluded. The final map derived from the remote-sensing data is described as the best-fit map (BFM) of ground cover units (Figure 10).The 1875 pumice unit was subtracted from the ground surface to produce a ‘pumice-free’best-fit map to highlight glaciovolcanic lithologic variations.
The construction of a BFM from multiple techniques was intended to reduce the errorassociated with any of the individual remote sensing-based mapping techniques described
Figure 10. (a) Best-fit map (BFM) of ground cover units in the region north of Askja Volcano; (b)BFM with 1875 pumice removed.
Dow
nloa
ded
by [
Mic
hael
Ram
sey]
at 1
6:35
18
July
201
3

7190 A.H. Graettinger et al.
here. By utilizing the lower spatial resolution but more lithologically diverse TIR data,and the high-spatial resolution but limited-spectral resolution VNIR data, the drawbacks ofthe individual techniques can be reduced. The results are further supported by the inclu-sion of the 25 m-resolution ASTERGDEM, which provides critical morphological data forinterpreting unit boundaries and the distribution of topographically influenced fragmentaldeposits (e.g. sandur and pumice).
3. Results
3.1. Best-fit map
The BFM based on the ASTER data contains six primary ground cover units: subaeriallava (39%), sandur deposits (25%), glaciovolcanic deposits (21%), 1875 pumice (5%),water bodies (5%), and vegetation (4%). Two primary ground cover units, subaerial lavaand glaciovolcanic deposits, were further divided into textural, or geomorphologically dis-tinguished, sub-units. Subaerial lava was divided into four subgroups based on the levelof detail identified through the mapping process: a’a lava, shield volcano, undifferenti-ated Holocene lava, and emergent glaciovolcanic. The a’a subgroup was defined by a highblackbody anomaly on lava flows from 1960 and 2.9 ka just north of Öskjuvatn (Annertz,Nilsson, and Sigvaldason 1985), a result of the high surface roughness of the flows (Ramseyand Fink 1997). This does not preclude the presence of other a’a flows; rather, it indicatesthe distinctive nature of these particular deposits. Shield volcano lavas, Holocenelava, andemergent lava were distinguished from one another by their geomorphic expression andrelative elevation to the regional base elevation. Shield volcano lavas were distinguishedby their distinctive low-angle relief and near circular morphologies and subaerial charac-terization by TIR deconvolution. These features cannot be assigned any age relationshipsusing the remote techniques alone due to the similarity of the flows and aeolian cover. TheHolocene lavas that infill the large Askja caldera were grouped with the shield volcano lavaground cover sub-unit due to their association with a single geomorphologic feature anddistinctive quality relative to the Holocene lavas of the surrounding area. This assignmentis intended to reflect morphology, not imply a genetic origin of the lavas. Emergent lavasare a unique product of glaciovolcanic complexes where subaqueous lavas and tuffs arecapped by subaerial lavas. These lavas were identified as subaerial lavas that occur perchedatop high topographic features, particularly subaqueous-dominated features, in this caseHerðubreið glaciovolcanic volcano (Figure 10). The general base topography identified byTIR techniques as subaerial lava was mapped as undifferentiated Holocene lava, which issupported by regional mapping by Annertz, Nilsson, and Sigvaldason (1985) (Figure 3).
The glaciovolcanic deposits unit was divided into fragmental and coherent-dominatedsubgroups to reflect ash and lapilli tuffs from effusive pillow and sheet lavas. A thirdsubgroup, porphyritic units, was attempted. Porphyritic deposits cover >1% of the fieldmap, but the TIR spectral mapping identified only 3% of the mapped porphyritic unitsfrom the lithofacies map. As such, the training areas were determined to be inadequatefor the identification for this level of detail relative to the two major glaciovolcanic sub-groups. Fragmental glaciovolcanic deposits were distinguished from coherent units bytheir frequent misclassification as other clastic deposits (sandur and pumice) and cor-relation with laboratory VNIR and TIR spectra of the known fragmental deposits fromAskja (dominantly ash tuff) (Table 1). Coherent glaciovolcanic deposits include subaqueouslavas of pillowed, lobate, and sheet morphologies and include common clast-rich brecciasassociated with the lavas. Based on the deposits mapped at Austurfjöll, the deposits areassumed to be dominated by pillowed lava flows.
Dow
nloa
ded
by [
Mic
hael
Ram
sey]
at 1
6:35
18
July
201
3
International Journal of Remote Sensing 7191
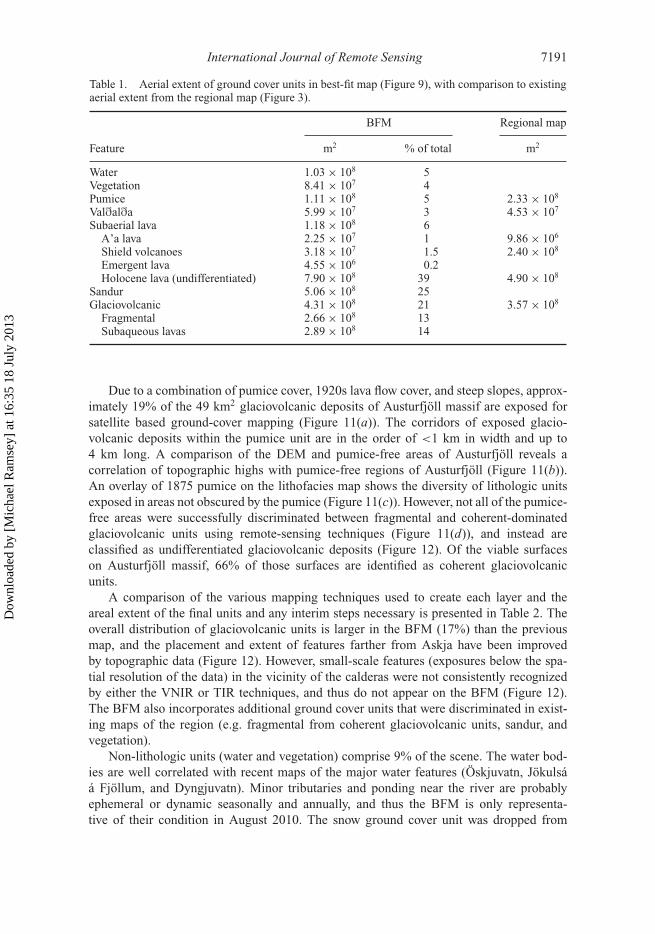
Table 1. Aerial extent of ground cover units in best-fit map (Figure 9), with comparison to existingaerial extent from the regional map (Figure 3).
BFM Regional map
Feature m2 % of total m2
Water 1.03 × 10⁸ 5Vegetation 8.41 × 10⁷ 4Pumice 1.11 × 10⁸ 5 2.33 × 10⁸
Valðalða 5.99 × 10⁷ 3 4.53 × 10⁷
Subaerial lava 1.18 × 10⁸ 6A’a lava 2.25 × 10⁷ 1 9.86 × 10⁶
Shield volcanoes 3.18 × 10⁷ 1.5 2.40 × 10⁸
Emergent lava 4.55 × 10⁶ 0.2Holocene lava (undifferentiated) 7.90 × 10⁸ 39 4.90 × 10⁸
Sandur 5.06 × 10⁸ 25Glaciovolcanic 4.31 × 10⁸ 21 3.57 × 10⁸
Fragmental 2.66 × 10⁸ 13Subaqueous lavas 2.89 × 10⁸ 14
Due to a combination of pumice cover, 1920s lava flow cover, and steep slopes, approx-imately 19% of the 49 km2 glaciovolcanic deposits of Austurfjöll massif are exposed forsatellite based ground-cover mapping (Figure 11(a)). The corridors of exposed glacio-volcanic deposits within the pumice unit are in the order of <1 km in width and up to4 km long. A comparison of the DEM and pumice-free areas of Austurfjöll reveals acorrelation of topographic highs with pumice-free regions of Austurfjöll (Figure 11(b)).An overlay of 1875 pumice on the lithofacies map shows the diversity of lithologic unitsexposed in areas not obscured by the pumice (Figure 11(c)). However, not all of the pumice-free areas were successfully discriminated between fragmental and coherent-dominatedglaciovolcanic units using remote-sensing techniques (Figure 11(d)), and instead areclassified as undifferentiated glaciovolcanic deposits (Figure 12). Of the viable surfaceson Austurfjöll massif, 66% of those surfaces are identified as coherent glaciovolcanicunits.
A comparison of the various mapping techniques used to create each layer and theareal extent of the final units and any interim steps necessary is presented in Table 2. Theoverall distribution of glaciovolcanic units is larger in the BFM (17%) than the previousmap, and the placement and extent of features farther from Askja have been improvedby topographic data (Figure 12). However, small-scale features (exposures below the spa-tial resolution of the data) in the vicinity of the calderas were not consistently recognizedby either the VNIR or TIR techniques, and thus do not appear on the BFM (Figure 12).The BFM also incorporates additional ground cover units that were discriminated in exist-ing maps of the region (e.g. fragmental from coherent glaciovolcanic units, sandur, andvegetation).
Non-lithologic units (water and vegetation) comprise 9% of the scene. The water bod-ies are well correlated with recent maps of the major water features (Öskjuvatn, Jökulsáá Fjöllum, and Dyngjuvatn). Minor tributaries and ponding near the river are probablyephemeral or dynamic seasonally and annually, and thus the BFM is only representa-tive of their condition in August 2010. The snow ground cover unit was dropped from
Dow
nloa
ded
by [
Mic
hael
Ram
sey]
at 1
6:35
18
July
201
3

7192 A.H. Graettinger et al.
Figure 11. Distribution of the 1875 pumice proximal to the Austurfjöll massif overlain on agreyscale hillshade (derived from 10 m LoftmyndirDEM). (a) Complete 1875 distribution of thepumice overlapping the glaciovolcanic deposits. (b) Outline of the 1875 pumice over colouredhillshade to show the relationship between eroded pumice and the topography of the Austurfjöllmassif. The pumice is mostly preserved in topographic lows. (c) 1875 pumice cropped to extent overAusturfjöll to show the exposure of lithology-mapped field units under the pumice. (d) Outline ofcropped pumice distribution of TIR-based discrimination of glaciovolcanic units.
the final map due to its low spatial extent. Snow has a high degree of temporal vari-ability and, for this particular scene, did not have sufficient training areas to create anaccurate ROI.
4. Discussion
The BFM serves as a useful lithologic and ground cover map for the region surround-ing Askja volcano because it (1) increased the aerial extent of the map of the portion of theNorthern Volcanic Zone around Askja; (2) includes the new discrimination of two lithologicsubgroups of glaciovolcanic massifs; (3) contains revised data on the distribution of theremobilized 1875 pumice deposit; and (4) introduces new ground cover units: sandur andvegetation. The production of the map served as a successful test for remote sensing-basedmapping of glaciovolcanic terrains in Iceland, which has had a very limited applicationin the past. The features identified in the map are well constrained by topography andprevious work, but they require more detailed work such as at Askja to establish proper geo-logic map units. The divisions established here serve the purpose of identifying a greaterdiversity in the landscape than previously noted and highlighting areas of unique composi-tion, morphology, and texture relevant to volcanic and palaeoclimate reconstructions of theregion.
Dow
nloa
ded
by [
Mic
hael
Ram
sey]
at 1
6:35
18
July
201
3
International Journal of Remote Sensing 7193
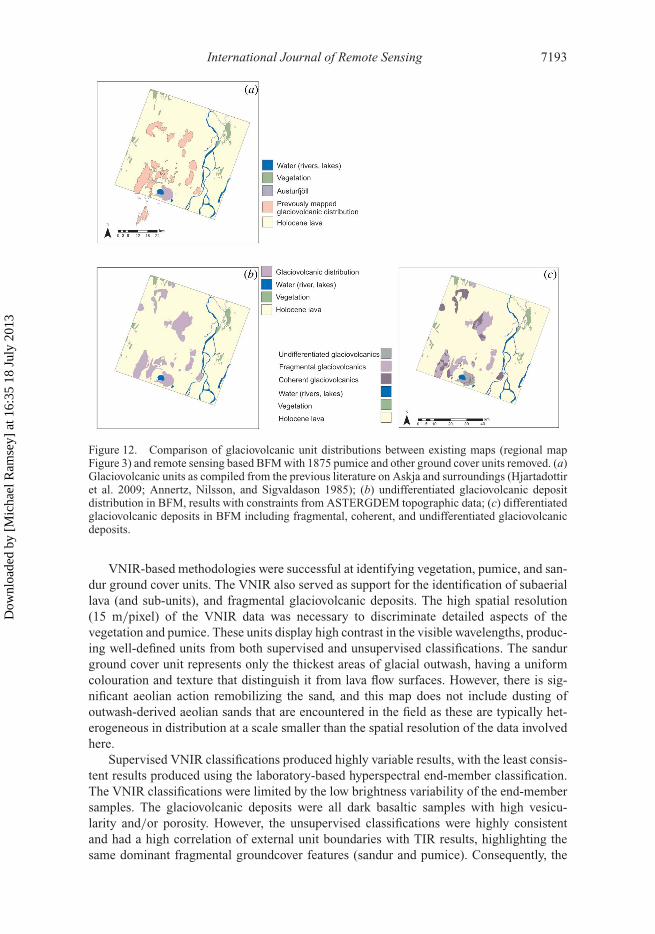
Figure 12. Comparison of glaciovolcanic unit distributions between existing maps (regional mapFigure 3) and remote sensing based BFM with 1875 pumice and other ground cover units removed. (a)Glaciovolcanic units as compiled from the previous literature on Askja and surroundings (Hjartadottiret al. 2009; Annertz, Nilsson, and Sigvaldason 1985); (b) undifferentiated glaciovolcanic depositdistribution in BFM, results with constraints from ASTERGDEM topographic data; (c) differentiatedglaciovolcanic deposits in BFM including fragmental, coherent, and undifferentiated glaciovolcanicdeposits.
VNIR-based methodologies were successful at identifying vegetation, pumice, and san-dur ground cover units. The VNIR also served as support for the identification of subaeriallava (and sub-units), and fragmental glaciovolcanic deposits. The high spatial resolution(15 m/pixel) of the VNIR data was necessary to discriminate detailed aspects of thevegetation and pumice. These units display high contrast in the visible wavelengths, produc-ing well-defined units from both supervised and unsupervised classifications. The sandurground cover unit represents only the thickest areas of glacial outwash, having a uniformcolouration and texture that distinguish it from lava flow surfaces. However, there is sig-nificant aeolian action remobilizing the sand, and this map does not include dusting ofoutwash-derived aeolian sands that are encountered in the field as these are typically het-erogeneous in distribution at a scale smaller than the spatial resolution of the data involvedhere.
Supervised VNIR classifications produced highly variable results, with the least consis-tent results produced using the laboratory-based hyperspectral end-member classification.The VNIR classifications were limited by the low brightness variability of the end-membersamples. The glaciovolcanic deposits were all dark basaltic samples with high vesicu-larity and/or porosity. However, the unsupervised classifications were highly consistentand had a high correlation of external unit boundaries with TIR results, highlighting thesame dominant fragmental groundcover features (sandur and pumice). Consequently, the
Dow
nloa
ded
by [
Mic
hael
Ram
sey]
at 1
6:35
18
July
201
3

7194 A.H. Graettinger et al.
Table 2. Techniques used to identify individual ground cover units.
VIS TIR
FeatureFalse
colour ISOROI
Class.AVNIRClass.
ROIClass.
ROIUnmix
ATIRUnmix
Black-body Topography
Water X X X X X X XVegetation X XPumice X X X X X X XValðalða XSubaerial lava X X X X XA’a lava XShield volcanoes XEmergent lava XSandur X X X X X X XGlacio-volcanic X XFragmental-
dominatedX X
Subaqueouslavas
X X
Holocene lava(undifferenti-ated)
X X X X X X
unsupervised VNIR classifications were given the highest preference in map creation,followed by ROI-based end-member classifications and A-VNIR classification.
The remaining ground cover units were mapped based on variations in micron-scaleroughness and composition identified in the TIR classifications and linear deconvolu-tions, with support from VNIR and topographic data. The glaciovolcanic deposits weremost successfully identified using A-TIR and ROI spectral deconvolution (in that order).Thermal wavelength characteristics are primarily produced by the abundance of micron-scale roughness elements such as vesicles and macro-phenocrysts (Ramsey and Fink 1999;Byrnes, Ramsey, and Crown 2004). The textural qualities of the glaciovolcanic fragmen-tal deposits and pillow lavas are distinct from the surrounding subaerial lava flows, butdisplay large internal variability. The bulk of the fragmental deposits was identified usingthe linear deconvolution approach. Some deposits were more easily distinguished fromcoherent glaciovolcanic deposits with support from the VNIR, particularly DyngjufjöllYtri, where fragmental glaciovolcanics were identified by TIR spectral deconvolution as1875 pumice (Sigvaldason 1992). This misclassification is the direct result of the textu-ral similarity between the fragmental deposits of Dyngjufjöll Ytri and the 1875 pumice.Consequently, the two deposits are better distinguished by the unsupervised VNIR clas-sification, which identifies the compositionally influenced colour variation between thebasaltic glaciovolcanics and the rhyolitic pumice.
The glaciovolcanic deposits of Askja have the most complicated spectral signature ofthe edifices in the region. The massif has the greatest variability of all landforms in themap area. This variability is a result of the combination of extensive incision of the massifby erosion and caldera formation with resulting steep walls, and the abundance of morerecent pumiceous deposits on the older (Pleistocene) deposits. Steep slopes on table moun-tains, like Herðubreið, and caldera walls, are not ideal targets for remote sensing as theirsteep slopes prevent the collection of spectra from glaciovolcanic units. In the case of
Dow
nloa
ded
by [
Mic
hael
Ram
sey]
at 1
6:35
18
July
201
3

International Journal of Remote Sensing 7195
Herðubreið, only the emergent subaerial lava cap is recognized. Austurfjoll also has sig-nificant textural variability, as shown in the lithofacies map (Figure 2), including micro-and macro-porphyritic lavas and tuffs. It was anticipated that the macro-porphyritic lavaswould have a distinct TIR spectral signature (Byrnes, Ramsey, and Crown 2004) (Figure 7).However, A-TIR linear deconvolution did not produce confident results. Additionally, theidentification of units under the pumice by TIR remote-sensing techniques is less accu-rate due to the interference of 1875 pumice of thickness 0.05 to 2 m (Carey, Houghton,and Thordarson 2010). Nevertheless, interesting trends were produced on Austurfjöll; theareas identified successfully beneath the fringes of pumice deposits as coherent have highcorrelation, although limited direct overlap, with porphyritic units of the lithofacies map(Figure 11). The interference of the pumice may have led to the misidentification of por-phyritic tephra and lava as coherent micro-porphyritic glaciovolcanic deposits. Therefore,distinction between coherent glaciovolcanic lavas that are micro- and macro-porphyriticrequires further investigation, whether remotely or in the field.
Subaerial lavas as a group were spectrally unique, with consistent results between clas-sification and deconvolution techniques. The establishment of the subgroups was enabledby incorporating the topographic data. This was of particular importance for distinguishingbetween shield volcanoes and background Holocene lava. These two subgroups do not havesignificant compositional, textural, or visible colour variations as revealed in the TIR andVNIR spectra. This lack of spectral variation is unexpected, as the shield volcano Valðalðais interglacial in age and has significant glacial scour, but remains indistinguishable com-positionally from the background Holocene lava in the TIR. The similarity of the scouredValðalða and Holocene lava is likely due to the dominance of pahoehoe flows in both sub-groups and thin aeolian cover (derived from the sandur) over both features, muting surfacetextures. This highlights the continued need for familiarity with regions with as much com-plexity as that around Askja, and the benefit of incorporating spectral, topographic, andground-based investigations. The DEM was utilized to identify the discrete morphologiesof Valðalða and Kollóttadyngja shield volcanoes, which enabled the separation of thesefeatures from the Holocene lava subgroup. The remaining shields indicated in the regionalmap (Figure 3) have much less topographic relief, and were not identified through thismapping process; they are instead included in the Holocene lava subgroup.
Unconsolidated fragmental ground cover units (such as pumice and sandur) shouldalso be easily resolved using thermophysical techniques such as apparent thermal iner-tia (Scheidt, Ramsey, and Lancaster 2010); however, the high latitude, generally cloudyweather, and long snowy season in the Icelandic Highlands has, to date, precluded theacquisition of an ASTER day–night pair of images over Askja necessary for this tech-nique. It would be worthwhile to consider the testing of apparent thermal inertia to detectunconsolidated fragmental ground cover units using other instruments with higher temporalresolution or ASTER data of regions with a higher abundance of useful scenes. The additionof higher spectral and spatial resolution data sets would also improve the discrimination ofsmaller or more compositionally mixed features.
5. Conclusions
The success of the best-fit map to reveal the diversity in textural and compositional unitsusing only one ASTER data scene reveals the potential for regional mapping of glacio-volcanic terrains remotely. The variability observed within the glaciovolcanic massifssurrounding Askja volcano warrants further field investigation in order to better under-stand the volcanic and depositional processes, as well as the regional volcanic evolution
Dow
nloa
ded
by [
Mic
hael
Ram
sey]
at 1
6:35
18
July
201
3
7196 A.H. Graettinger et al.
and glacial history of the NVZ in Iceland. Existing maps of this and other volcanic zones inIceland do not highlight the diversity of lithofacies at glaciovolcanic centres, which beliesthe nature of the evolution of these volcanic systems. Remotely produced ground covermaps can serve as an important starting point for regional mapping and the identificationof future study sites for volcanic and palaeoclimate research in Iceland and other difficultterrains such as British Columbia and Antarctica (Figure 12). The glaciovolcanic depositsof these regions are becoming increasingly important due to the lack of preservation ofother terrestrial palaeoclimate indicators, particularly of pre-last glacial maximum ice posi-tions (Bourgeois, Daeuteuil, and Van Vliet-Lanoë 2000; Edwards et al. 2009; Edwards,Russel, and Simpson 2011). This technique successfully identified two major textural unitsof glaciovolcanic deposit types. These subunits represent very different eruption styles andthermodynamic histories, and consequently the impact of each eruption on the overlyingice sheet. Furthermore, this technique helps locate coherent lava facies, which are requiredfor the most successful dating techniques for volcanic rocks, and necessary for producingrigorous palaeoclimate proxies such as ice thickness records. Remote investigations suchas this may provide good candidates for further research and chronologies of the region andhelp focus future field work.
This project successfully validated remote-sensing data through the use of existing andrecently collected data, but it also revealed the potential for supplementing field-based map-ping, particularly of remobilized deposits and ground cover units. The new outline of theremobilized 1875 pumice distribution over the Austurfjöll massif adds a highly visible,but previously poorly constrained, unit to the lithologic map (Figure 11(c)). With over onedecade of global ASTER data, this study provides another successful application of inte-grated ASTERVNIR and TIR data for complex compositional reconnaissance mapping ofvolcanic terrains around the world. While Iceland’s latitude provided a greater opportu-nity for satellite overpasses, snow and ice cover prevent the collection of useful scenes.Other locations may have a richer archive for this approach due to more favourable climate.Additionally, as the TIR was only one component of this work, other satellites, such as theLandsat series, including the recently launched LDCM, may provide further opportunitiesfor the refinement of this work and its applications to high-latitude glaciovolcanic centresdespite their relative lack of TIR bands.
AcknowledgementsField work logistics were made possible by the Vatnajökull National Park Iceland, the Universityof Iceland, and a NSF grant to IPS. ASTER global DEM is a product of METI and NASA. Themanuscript was improved by two anonymous reviewers.
ReferencesAdams, J. B., M. O. Smith, and A. R. Gillespie. 1989. “Simple Models for Complex Natural Surfaces:
A Strategey for the Hyperspectral Era of Remote Sensing.” IGARSS Canadian Symposion ofRemote Sensing 12: 16–21.
Annertz, K., M. Nilsson, and G. E. Sigvaldason. 1985. The Postglacial History of Dyngjufjöll. NordicVolcanological Institute Report 8503, 1– 22. Reykjavik: Nordic Volcanological Institute.
Ball, G., and D. Hall. 1965. “Isodata, a Novel Method of Data Analysis and Pattern Classifcation.”Standford Research Institute Technical Report 79, 61 pp.
Bemmelen, R. W. V., and M. G. Rutten. 1955. Tablemountains of Northern Iceland: (and RelatedGeological Notes). Leiden: E.J. Brill.
Bourgeois, O., O. Daeuteuil, and B. Van Vliet-Lanoë. 2000. “Geothermal Control on Flow Patternsin the Last Glacial Maximum Ice Sheet of Iceland.” Earth Surface Processes and Landforms 25:59–76.
Dow
nloa
ded
by [
Mic
hael
Ram
sey]
at 1
6:35
18
July
201
3

International Journal of Remote Sensing 7197
Byrnes, J. M., M. S. Ramsey, and D. A. Crown. 2004. “Surface Unit Characterization of the MaunaUluFlow Field, Kilauea Volcano, Hawai’i, Using Integrated Field and Remote Sensing Analyses.”Journal of Volcanology and Geothermal Research 135: 169–193.
Carey, R. J., B. F. Houghton, and T. Thordarson. 2009. “Abrupt Shifts Between Wet and Dry Phases ofthe 1875 Eruption of Askja Volcano: Microscopic Evidence for Macroscopic Dynamics.” Journalof Volcanology and Geothermal Research 184: 256–270.
Carey, R. J., B. F. Houghton, and T. Thordarson. 2010. “Tephra Dispersal and Eruption Dynamics ofWet and Dry Phases of the 1875 Eruption of Askja Volcano, Iceland.” Bulletin of Volcanology72: 259–278.
Carter, A. J., O. Girina, M. S. Ramsey, and Y. V. Demyanchuk. 2008. “ASTER and Field Observationsof the 24 December 2006 Eruption of Bezymianny Volcano, Russia.” Remote Sensing of theEnvironment 112: 2569–2577.
Edwards, B. R., J. K. Russel, and K. Simpson. 2011. “Volcanology and Petrology of Mathews Tuya,Northern British Columbia, Canada: Glaciovolcanic Constraints on Interpretations of the 0.730Ma Cordilleran Paleoclimate.” Bulletin of Volcanology 73: 479–496.
Edwards, B. R, I. P. Skilling, B. Cameron, C. Haynes, A. Lloyd, and J. H. D. Hungerford. 2009.“Evolution of an Englacial Volcanic Ridge: Pillow Ridge Tindar, Mount Edziza VolcanicComplex, NCVP, British Columbia, Canada.” Journal of Volcanology and Geothermal Research185: 251–275.
Graettinger, A. H. 2012. “Building Ice-Age Askja, Iceland: Products, Processes, and Paleoclimate.”In Geology and Planetary Science, 462 pp. Pittsburgh: University of Pittsburgh.
Hjartardóttir, A. R., P. Einarsson, and H. Sigurdsson. 2009. “The Fissure Swarm of the AskjaVolcanic System Along the Divergent Plate Boundary of N Icealand.” Bulletin of Volcanology71: 961–971.
Höskuldsson, Á. 1987. Some Chemcial Properties of the Askja Volcanic Center, 117–138. Reykjavik:Nordic Volcanological Institute, University of Iceland.
Jakobsson, S. P., K. Jónasson, and I. A. Sigurdsson. 2008. “The Three Igneous Rock Series ofIceland.” Jökull 58: 117–138.
King, P. L., M. S. Ramsey, P. F. McMillian, and G. A. Swayze. 2004. “Laboratory FourierTransform Infrared Spectroscopy Methods for Geologic Samples.” In Infrared Spectroscopy inGeochemsitry, Exploration Geochemistry, and Remote Sensing, edited by P. L. King, 57–911.London, ON: Mineralogical Association of Canada.
Kuritani, T., T. Yokoyama, H. Kitagawa, K. Kobayashi, and E. Nakamura. 2011. “GeochemicalEvolution of Historical Lavas From Askja Volcano, Iceland: Implications for Mechanisms andTimescales of Mamgmatic Differentiation.” Geochemica Et Cosmochimica Acta 75: 570–587.
Lloyd, S. P. 1982. “Least Squares Quantization in PCM.” IEEE Transactions on Information Theory28: 129–137.
Ramsey, M. S., and P. R. Christensen. 1998. “Mineral Abundance Determination: QuantitativeDeconvolution of Thermal Emission Spectra.” Journal of Geophysical Research 103: 577–596.
Ramsey, M. S., and J. Dehn. 2004. “Spaceborne Observations of the 2000 Bezymianny, KamchatkaEruption: The Integration of High-Resolution ASTER Data Into Near Real-Time MonitoringUsing AVHRR.” Journal of Volcanology and Geothermal Research 135: 127–146.
Ramsey, M. S., and J. Fink. 1997. “Mapping Vesicularity of Hawaiian Lava Flows Via ThermalInfrared Remote Sensing.” American Geophysical Union EOS Transactions 78 (46): F777.
Ramsey, M. S., and J. Fink. 1999. “Estimating Silicic Lava Vesicularity with Thermal RemoteSensing: A New Technique for Volcanic Mapping and Monitoring.” Bulletin of Volcanology 61:32–39.
Ruff, S., P. R. Christensen, P. W. Barbera, and D. L. Anderson. 1997. “Quantitiative Thermal EmissionSpectroscopy of Minerals: A Laboratory Technique for Measurement and Calibration.” Journalof Geophysical Research 102: 14899–14913.
Scheidt, S., M. S. Ramsey, and N. Lancaster. 2010. “Determining Soil Moisture and SedimentAvailability at White Sands DUne Field, NM From Apparent Thermal Intertia (ATI) Data.”Journal of Geophysical Research 115: F0204109.
Schopka, H. H., M. T. Gudmundsson, and H. Tuffen. 2006. “The Formation of Helgafell, SouthwestIceland, a Monogenetic Subglacial Hyaloclastite Ridge: Sedimentology, Hydrology and Volcano-Ice Interaction.” Journal of Volcanology and Geothermal Research 152: 359–377.
Sigurdsson, H., and R. Sparks. 1978. “Rifting Episode in North Iceland in 1874–1875 and theEruptions of Askja and Sveinagja.” Bulletin of Volcanology 41: 149–167.
Dow
nloa
ded
by [
Mic
hael
Ram
sey]
at 1
6:35
18
July
201
3
7198 A.H. Graettinger et al.
Sigvaldason, G. E. 1964. “Some Geochemical and Hydrothermal Aspects of the 1961 AskjaEruption.” Contributions to Mineralogy and Petrology 10: 263–274.
Sigvaldason, G. E. 1968. “Structure and Products of Subaquatic Volcanoes in Iceland.” Contributionsto Mineralogy and Petrology 18: 1–16.
Sigvaldason, G. E. 1992. “Recent Hydrothermal Explosion Craters in an Old Hyaloclastite Flow,Central Iceland.” Journal of Volcanology and Geothermal Research 54: 53–63.
Sigvaldason, G. E. 2002. “Volcanic and Tectonic Processes Coinciding with Glaciation and CrustalRebound: An Early Holocene Rhyolitic Eruption in the Dyngjufjöll Volcanic Centre and theFormation of the Askja Caldera, North Iceland.” Bulletin of Volcanology 64: 192–205.
Thorarinsson, S., and G. Sigvaldason. 1962. “The Eruption in Askja, 1961 a Preliminary Report.”American Journal of Science 260: 641–651.
Thoroddsen, T. 1925. Die Geschichte Der IslandischenVulkane. Copenhagen: Royal Academy ofSciences and Letters.
Werner, R., and H.-U. Schmincke. 1999. “Englacial Vs Lacustrine Origin of Volcanic TableMountains: Evidence From Iceland.” Bulletin of Volcanology 60: 335–354.
Werner, R., H.-U. Schmincke, and G. E. Sigvaldason. 1996. “A New Model for the Evolution of TableMountains: Volcanological and Petrological Evidence From Herdubreid and HerdubreidartöglVolcanoes (Iceland).” GeolRundsch 85: 390–397.Þorarinsson, S. 1963. Elduríöskju. Reykjavik: Almenna Bókafélagið.
Dow
nloa
ded
by [
Mic
hael
Ram
sey]
at 1
6:35
18
July
201
3