remote log analytics using dds, elk, and rxjs
TRANSCRIPT
Your systems. Working as one.
Log Analytics Using DDS and RxJS
Sumant Tambe
Jan. 2015

ProDigy4ITAutonomous Probing and Diagnostics for IT
• Flexible Data Acquisition, Smart Analysis, and Adaptive Data Transmission
• Intuitive Dashboards for Status and Remote Diagnostics
• Autonomous, Customizable, Programmable, and Highly Extensible
• Agent-based, distributed, server-less, stream-oriented, and dynamic
• COTS, standards-based open architecture, Secure
8/25/2015 2
DataAcquisition
StreamingAnalysis
Prioritized Intelligent
Comms
ExpertLocalTools
StreamProbes
SnapshotAgents
ITSystems
ProDigy4IT
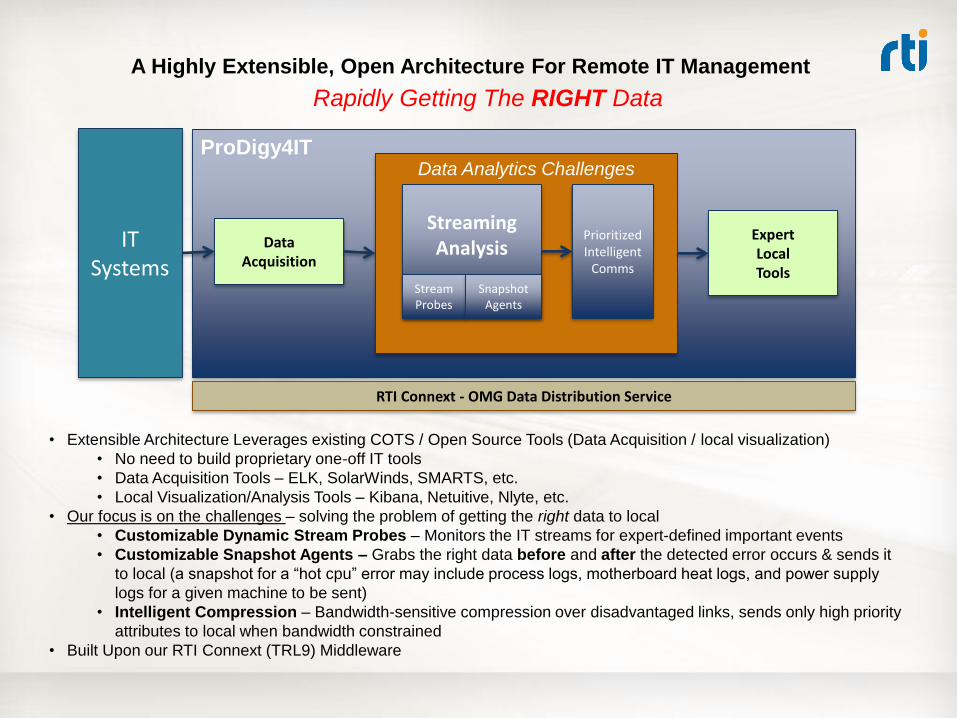
• Extensible Architecture Leverages existing COTS / Open Source Tools (Data Acquisition / local visualization)
• No need to build proprietary one-off IT tools
• Data Acquisition Tools – ELK, SolarWinds, SMARTS, etc.
• Local Visualization/Analysis Tools – Kibana, Netuitive, Nlyte, etc.
• Our focus is on the challenges – solving the problem of getting the right data to local
• Customizable Dynamic Stream Probes – Monitors the IT streams for expert-defined important events
• Customizable Snapshot Agents – Grabs the right data before and after the detected error occurs & sends it
to local (a snapshot for a “hot cpu” error may include process logs, motherboard heat logs, and power supply
logs for a given machine to be sent)
• Intelligent Compression – Bandwidth-sensitive compression over disadvantaged links, sends only high priority
attributes to local when bandwidth constrained
• Built Upon our RTI Connext (TRL9) Middleware
Rapidly Getting The RIGHT Data
RTI Connext - OMG Data Distribution Service
A Highly Extensible, Open Architecture For Remote IT Management
Data Analytics Challenges
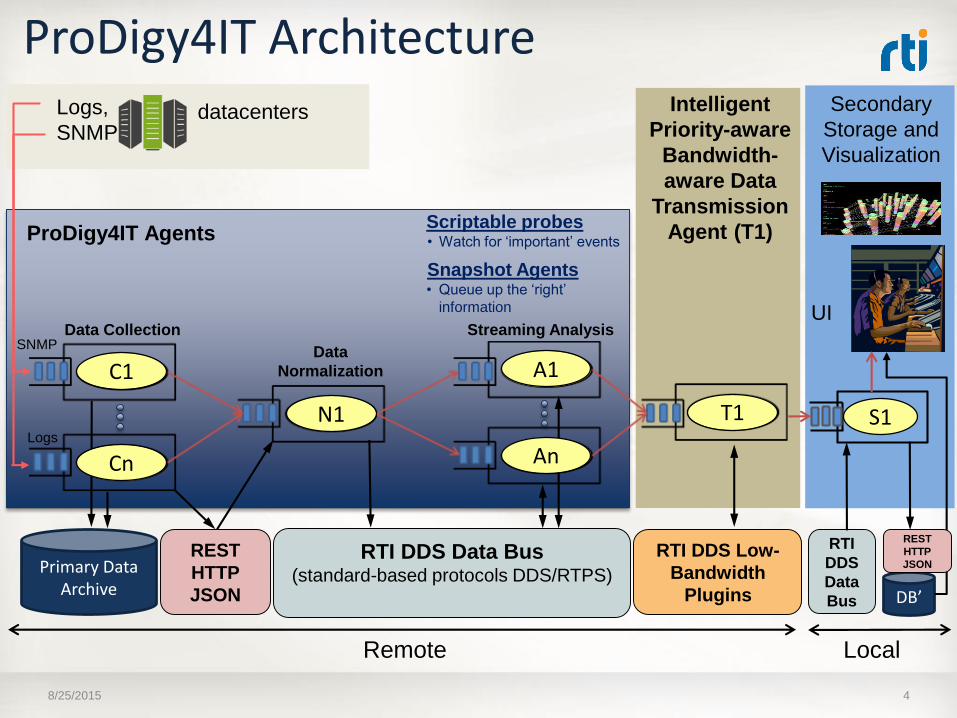
ProDigy4IT Architecture
8/25/2015 4
RTI DDS Data Bus(standard-based protocols DDS/RTPS)
Secondary
Storage and
Visualization
Remote
RTI DDS Low-
Bandwidth
Plugins
Local
Intelligent
Priority-aware
Bandwidth-
aware Data
Transmission
Agent (T1)
RTI
DDS
Data
Bus
Primary Data Archive
T1
DB’
S1
UI
REST
HTTP
JSON
REST
HTTP
JSON
ProDigy4IT Agents
Logs,
SNMP
N1
A1
Cn An
datacenters
C1
Scriptable probes• Watch for ‘important’ events
Snapshot Agents• Queue up the ‘right’
information
Data Collection
Data
Normalization
SNMP
Logs
Streaming Analysis
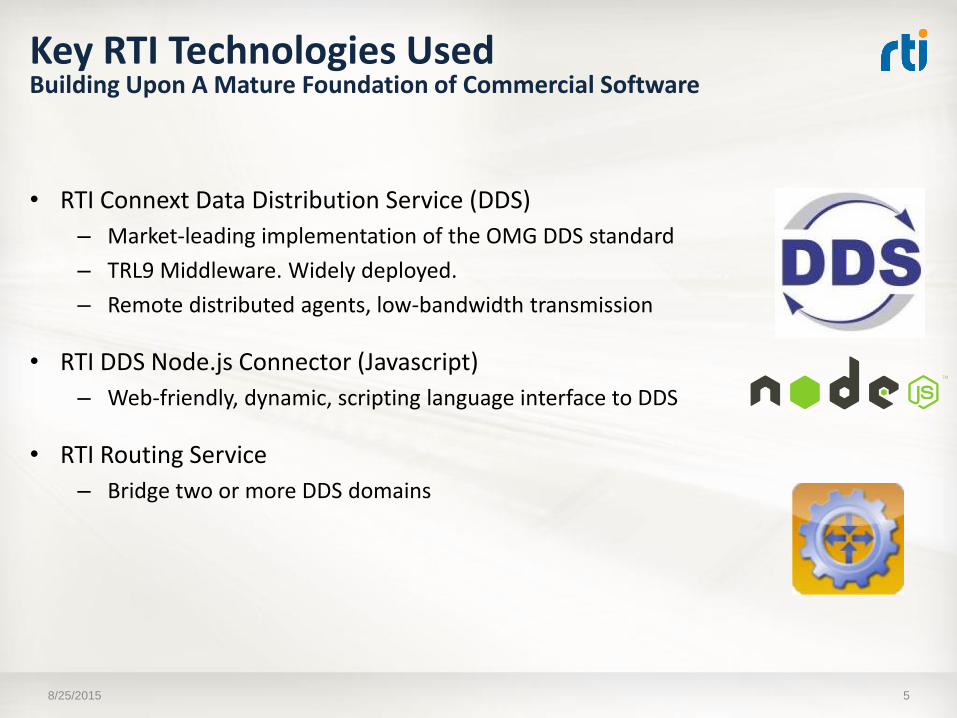
Key RTI Technologies UsedBuilding Upon A Mature Foundation of Commercial Software
• RTI Connext Data Distribution Service (DDS)
– Market-leading implementation of the OMG DDS standard
– TRL9 Middleware. Widely deployed.
– Remote distributed agents, low-bandwidth transmission
• RTI DDS Node.js Connector (Javascript)
– Web-friendly, dynamic, scripting language interface to DDS
• RTI Routing Service
– Bridge two or more DDS domains
8/25/2015 5
Key Open-Source Technologies Used
• Elasticsearch– Document-oriented, scalable, NoSQL database
– Persist data remote and local
• Logstash– Data collection (log, snmp, etc.)
– Configured for Win/Linux logs and snmp
• Kibana– Browser-hosted visualization for time-stamped data
– Configured for dashboards
• Reactive Extensions (Rx)– A library for composing asynchronous data streams
– Used to implement the dynamic stream probing (analysis) agent
8/25/2015 6© RTI

Key InnovationsDetecting Problems & Getting the Right Information to the Experts
• Dynamic Stream Probing (DSP) Agents
– A light-weight, distributed, embedded stream processing engine
– Executes probes
– Dynamic, extensible
– Combines DDS and Rx; Written in Javascript (Node.js)
• Key Concepts
– Data Stream Potentially infinite data samples from a data source
• E.g., a temperature sensor, application event log from a Windows host
– Probe A named declarative “stream processor” that analyzes one or more data streams
• Written using JSON syntax; Probes have data and alert dependencies
– Alert A notification produced by a probe indicating that data samples in a stream satisfy a complex precondition
• E.g., average temperature over last 30 seconds >= 65oC
– Snapshot A collection of samples in a data stream that fall within a window of time before and after the alert
• Informally, a thin slice through time and space (when agents are distributed)
8/25/2015 7© RTI

8/25/2015 8
IT Systems
+/- 1 min window +/- 1 min window
Alert Stream
Source Data
Streams
32
1Dynamic
Stream
Probes
time
Snapshot Stream
+/- 1 min window +/- 1 min window
Experts
snapshots
© RTI
Acquiring The Right Information To Help Resolve Problems
Probe Agents decide what & how much to send
Key Innovations DevelopedDetecting Problems & Getting the Right Information to the Experts
• The Probe Language for Authoring Probes – A Domain-specific language for stream processing and coordination
– Embodies “Save Query; Run Data” paradigm; flow-based programming
– Declarative English-like syntax; Little/No programming experience necessary
– Compose operators using pipes similar to the Unix command line
– Scripted
• No compilation
– Dynamic
• A probe may handle 100s of data streams dynamically
• Probes can be added at run-time to existing running agent processes
• Probes may depend on existing running probes
– Extensible through a library of operators
• Arithmetic, window, conditionals, I/O, filtering, grouping, throttling, staleness detection ,etc.
• Operators may coordinate one or more streams
– Efficient• Compiles just-in-time to native code (V8 Javascript engine)
8/25/2015 9© RTI

Key Innovations DevelopedDetecting Problems & Getting the Right Information to the Experts
• Operator Library for Simplifying Probe Authoring – Extends the probe language
– 30+ operators developed during Phase I
8/25/2015 10© RTI
• Conditionals• >, <, >=, <=, ==, !=
• Time-based Windows• insert avg(celsius) over 30 sec as avg_celsius
• Counter-based Windows• insert avg(celsius) over last 3000 as avg_celsius
• Data manipulation• insert … as• avg(), min(), max(), eval(), JSONPath()• delete <member>
• I/O• source <DDS topic> • source <pre-existing probe> • mergesources <1> <2> …• output dds <topic>• output console
• Filtering• has <member>• hastype <something>• match <a partial object>• contains <field> <data>
• Data Partitioning (very important)• groupby <key-field>• Allows downstream processing on each partition
independently.• Also natively supported by DDS
• Data Stream Capture• snapshot timerange(past-time, future-time)• Captures alert dependencies between probes
• Alert Throttling• interval 120 sec• Avoid repeated firing of an alert in quick
succession
• Staleness Detection• liveliness 30 sec
Operators coordinating multiple streams in Red
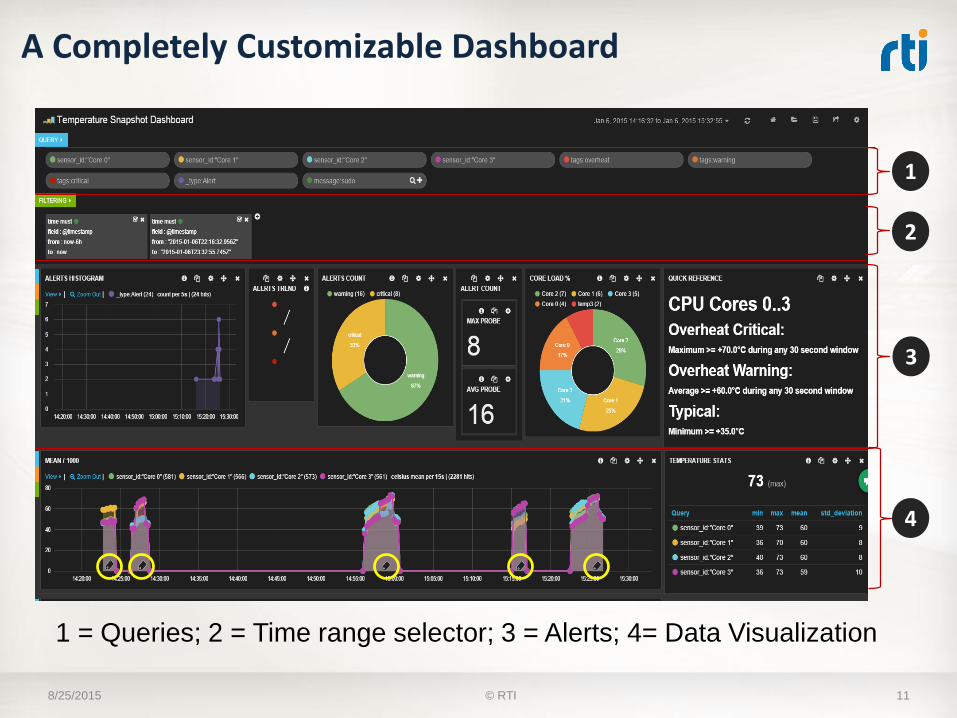
A Completely Customizable Dashboard
8/25/2015 11
1 = Queries; 2 = Time range selector; 3 = Alerts; 4= Data Visualization
1
2
3
4
© RTI
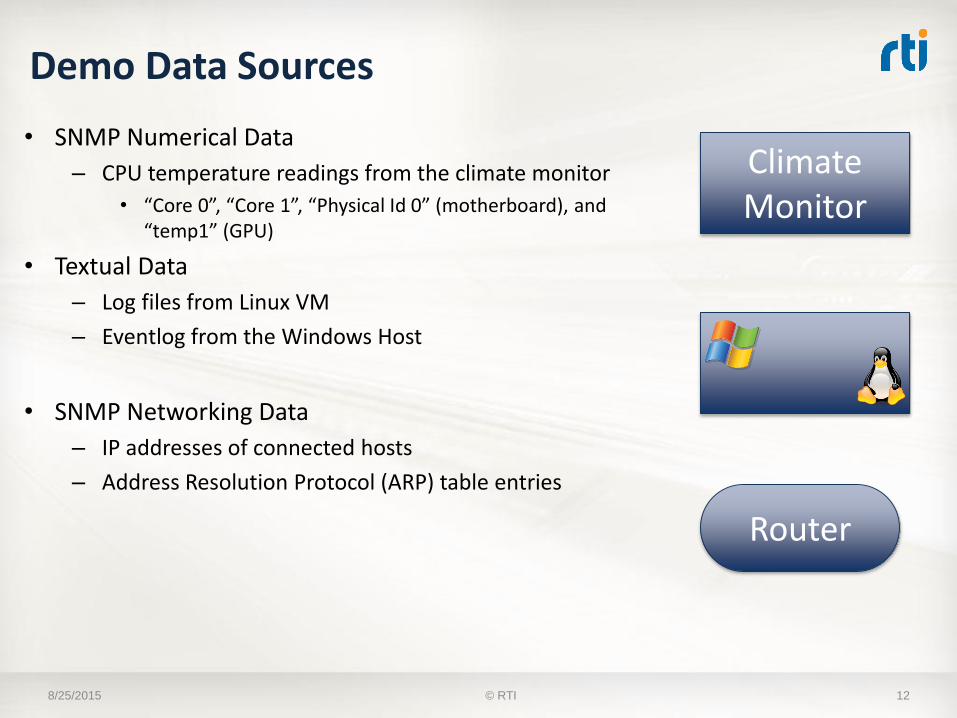
Demo Data Sources
• SNMP Numerical Data
– CPU temperature readings from the climate monitor
• “Core 0”, “Core 1”, “Physical Id 0” (motherboard), and “temp1” (GPU)
• Textual Data
– Log files from Linux VM
– Eventlog from the Windows Host
• SNMP Networking Data
– IP addresses of connected hosts
– Address Resolution Protocol (ARP) table entries
8/25/2015 12
Router
Climate Monitor
© RTI
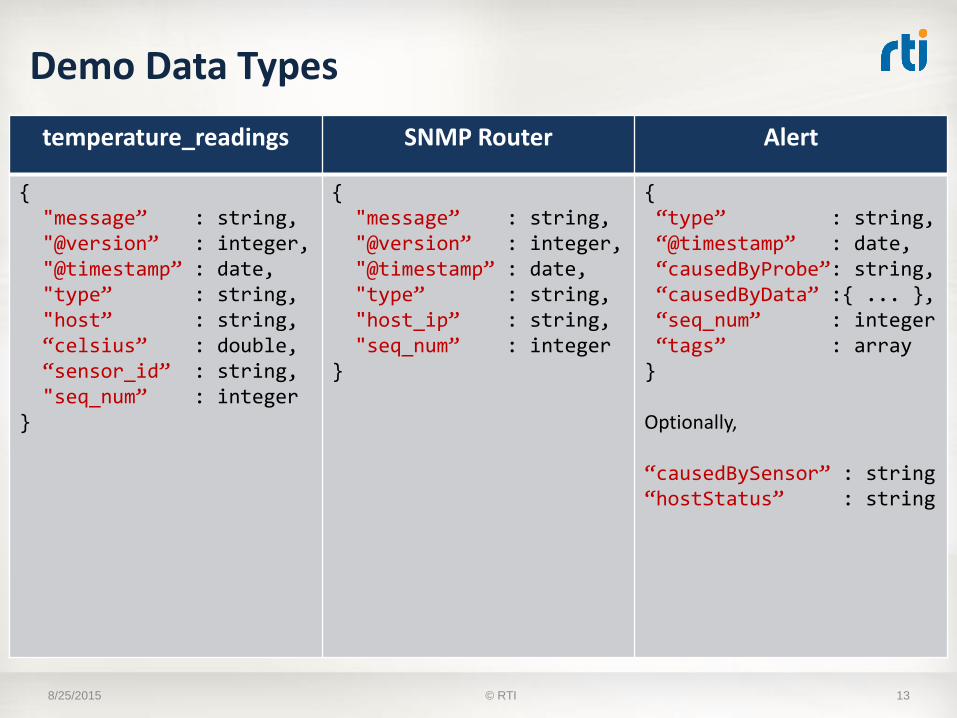
Demo Data Types
8/25/2015 13
temperature_readings SNMP Router Alert
{"message” : string,"@version” : integer,"@timestamp” : date,"type” : string,"host” : string,“celsius” : double,“sensor_id” : string,"seq_num” : integer
}
{"message” : string,"@version” : integer,"@timestamp” : date,"type” : string,"host_ip” : string,"seq_num” : integer
}
{“type” : string,“@timestamp” : date,“causedByProbe”: string,“causedByData” :{ ... },“seq_num” : integer“tags” : array}
Optionally,
“causedBySensor” : string“hostStatus” : string
© RTI
Demo 1: Temperature Diagnostics
• Scenario – Climate monitor reports rising temperatures
• How – Stress CPU to 100% utilization
• Trigger – CPU avg. temperature >= 65oC over 30 seconds
8/25/2015 14© RTI

{
"name" : "TemperatureDataSource",
"filter" : "source AggregateFlow |
hastype temperature_readings |
has sensor_id |
has celsius_x_1000 |
match { \"host\" : \“remote\" } |
insert eval(celsius_x_1000 / 1000) as celsius“,
“trigger” : false
},
{
"name" : "TempAvgProbe",
"filter" : "source TemperatureDataSource |
groupby sensor_id |
insert avg(celsius) over 30 sec as extra.degree_avg |
snapshot timerange(-55 sec,+55 sec) |
greater_than_equal extra.degree_avg 65 |
interval 120 sec",
"trigger" : true,
"tags" : [ "cpu_overheat", "cpu_heat_warning" ]
}
8/25/2015 15© RTI
Developing Custom ProbesExample – Temperature Probe(s)
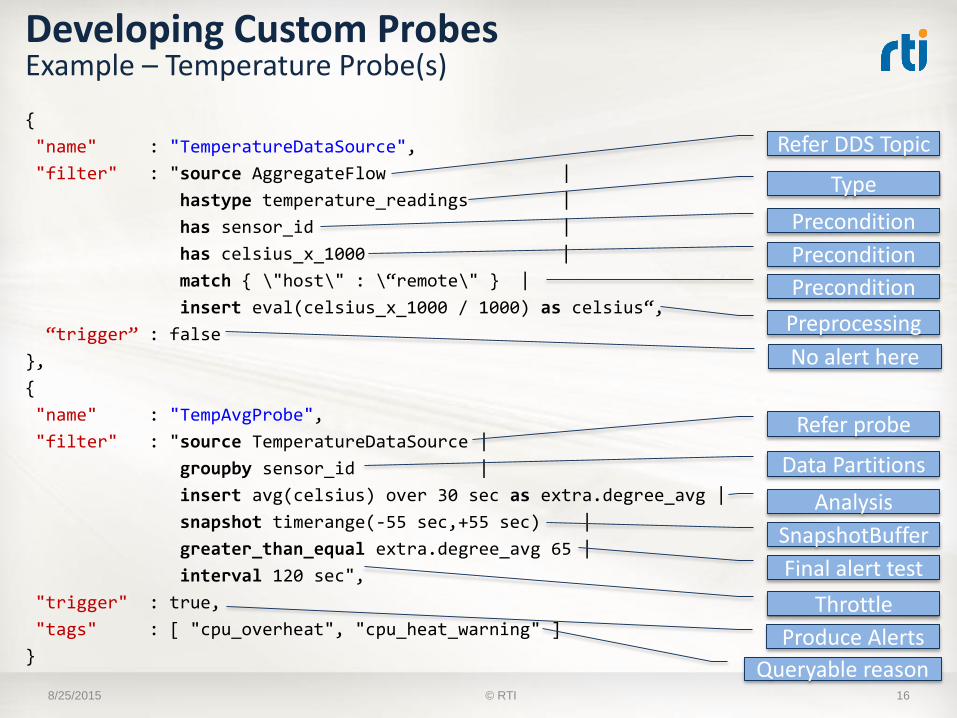
{
"name" : "TemperatureDataSource",
"filter" : "source AggregateFlow |
hastype temperature_readings |
has sensor_id |
has celsius_x_1000 |
match { \"host\" : \“remote\" } |
insert eval(celsius_x_1000 / 1000) as celsius“,
“trigger” : false
},
{
"name" : "TempAvgProbe",
"filter" : "source TemperatureDataSource |
groupby sensor_id |
insert avg(celsius) over 30 sec as extra.degree_avg |
snapshot timerange(-55 sec,+55 sec) |
greater_than_equal extra.degree_avg 65 |
interval 120 sec",
"trigger" : true,
"tags" : [ "cpu_overheat", "cpu_heat_warning" ]
}
8/25/2015 16
Refer DDS Topic
Type
Precondition
Precondition
Preprocessing
Precondition
Refer probe
Data Partitions
Analysis
SnapshotBuffer
Final alert test
Throttle
Queryable reason
No alert here
Produce Alerts
© RTI
Developing Custom ProbesExample – Temperature Probe(s)
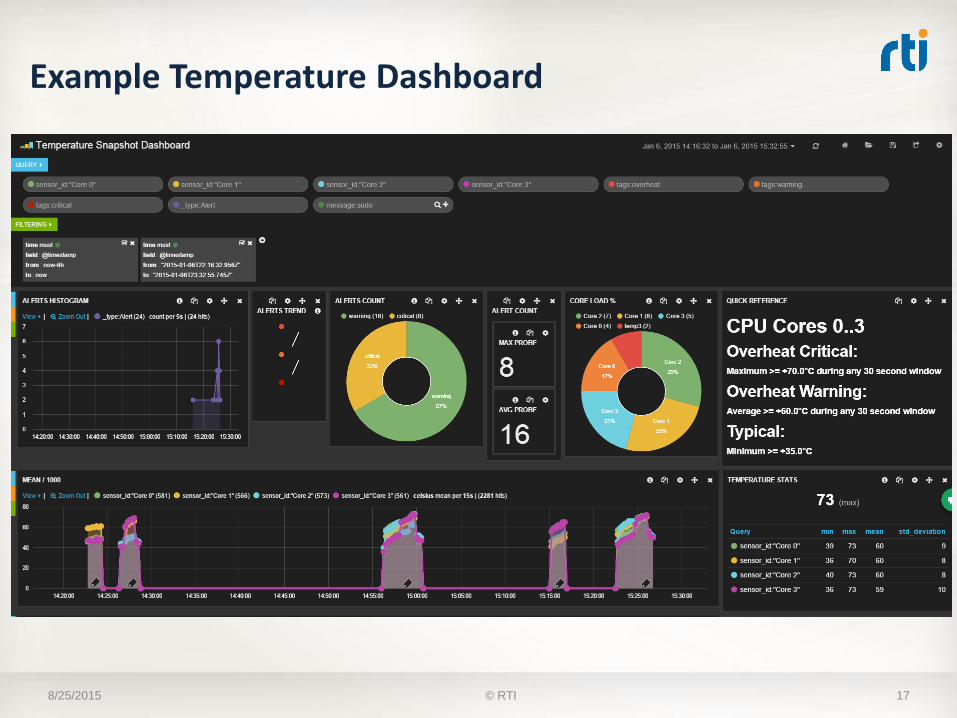
Example Temperature Dashboard
8/25/2015 17© RTI
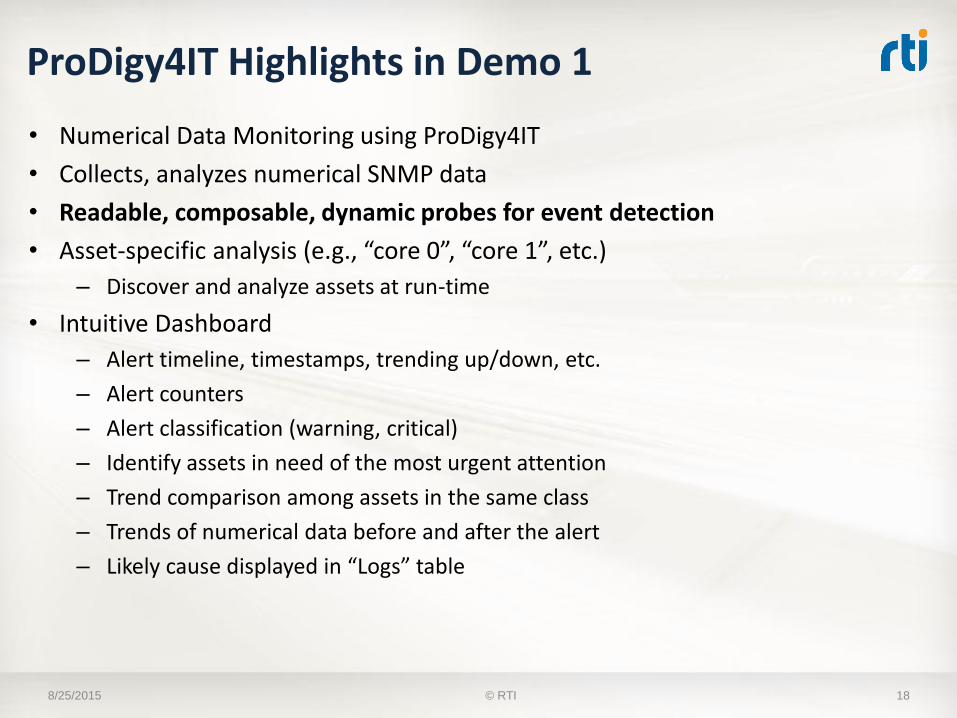
ProDigy4IT Highlights in Demo 1
• Numerical Data Monitoring using ProDigy4IT
• Collects, analyzes numerical SNMP data
• Readable, composable, dynamic probes for event detection
• Asset-specific analysis (e.g., “core 0”, “core 1”, etc.)
– Discover and analyze assets at run-time
• Intuitive Dashboard
– Alert timeline, timestamps, trending up/down, etc.
– Alert counters
– Alert classification (warning, critical)
– Identify assets in need of the most urgent attention
– Trend comparison among assets in the same class
– Trends of numerical data before and after the alert
– Likely cause displayed in “Logs” table
8/25/2015 18© RTI
Demo 2: Logs Diagnostics
• Scenario – Analyze textual log data for alerts
• How – Remote login to Windows/Linux host
• Trigger– On Linux log contains “ … session opened …”
– On Windows log contains “ … new logon … ”
8/25/2015 19© RTI
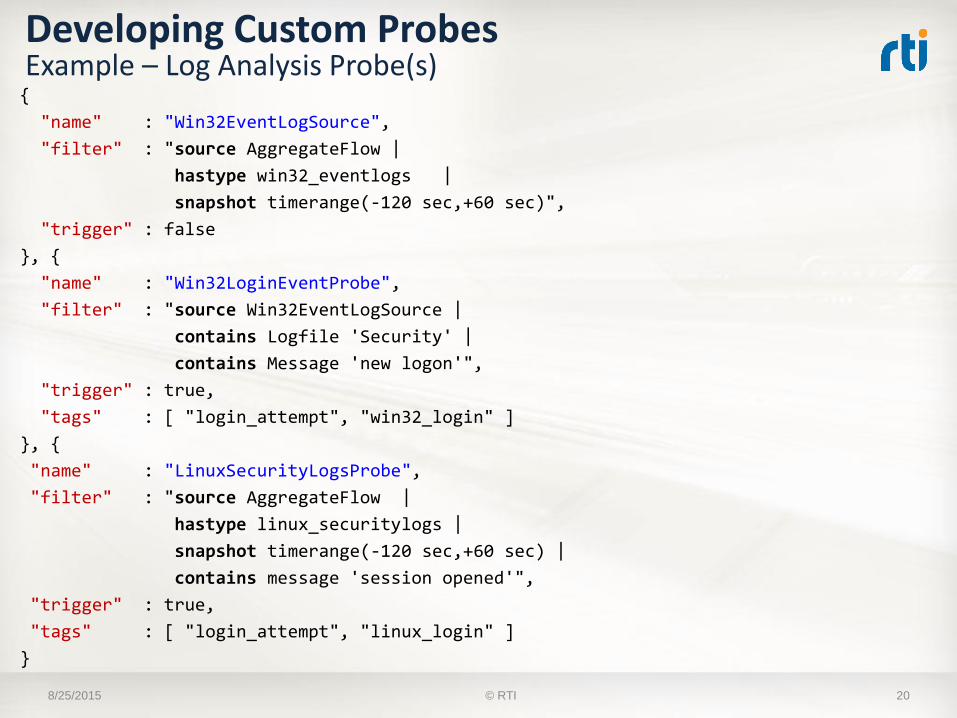
Developing Custom ProbesExample – Log Analysis Probe(s){
"name" : "Win32EventLogSource",
"filter" : "source AggregateFlow |
hastype win32_eventlogs |
snapshot timerange(-120 sec,+60 sec)",
"trigger" : false
}, {
"name" : "Win32LoginEventProbe",
"filter" : "source Win32EventLogSource |
contains Logfile 'Security' |
contains Message 'new logon'",
"trigger" : true,
"tags" : [ "login_attempt", "win32_login" ]
}, {
"name" : "LinuxSecurityLogsProbe",
"filter" : "source AggregateFlow |
hastype linux_securitylogs |
snapshot timerange(-120 sec,+60 sec) |
contains message 'session opened'",
"trigger" : true,
"tags" : [ "login_attempt", "linux_login" ]
}
8/25/2015 20© RTI
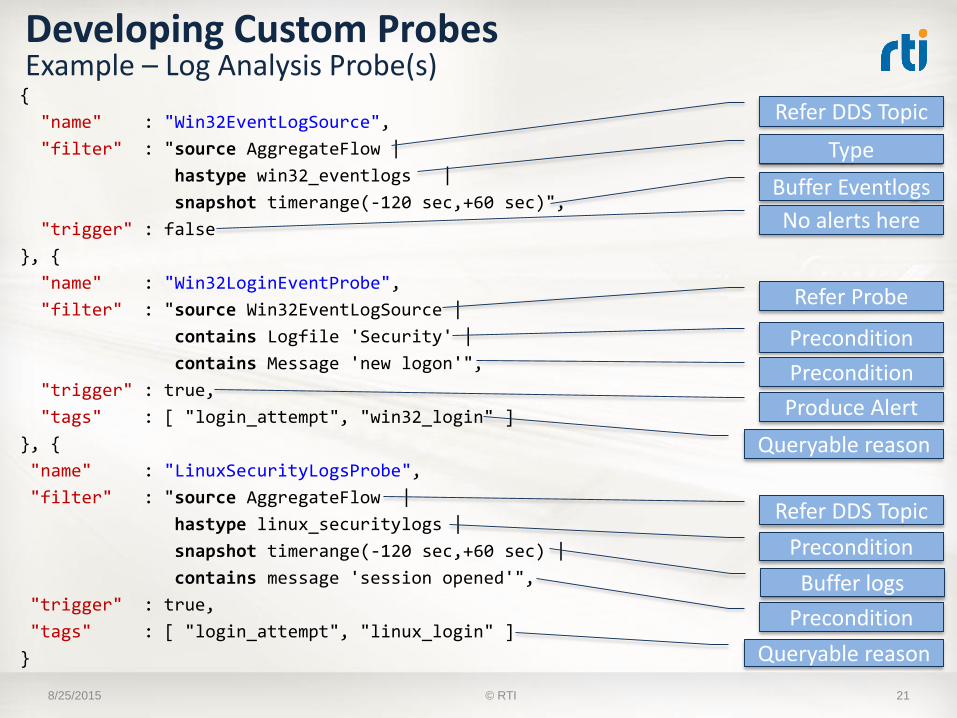
Developing Custom ProbesExample – Log Analysis Probe(s){
"name" : "Win32EventLogSource",
"filter" : "source AggregateFlow |
hastype win32_eventlogs |
snapshot timerange(-120 sec,+60 sec)",
"trigger" : false
}, {
"name" : "Win32LoginEventProbe",
"filter" : "source Win32EventLogSource |
contains Logfile 'Security' |
contains Message 'new logon'",
"trigger" : true,
"tags" : [ "login_attempt", "win32_login" ]
}, {
"name" : "LinuxSecurityLogsProbe",
"filter" : "source AggregateFlow |
hastype linux_securitylogs |
snapshot timerange(-120 sec,+60 sec) |
contains message 'session opened'",
"trigger" : true,
"tags" : [ "login_attempt", "linux_login" ]
}
8/25/2015 21
Refer DDS Topic
Type
Buffer Eventlogs
No alerts here
Refer Probe
Precondition
Produce Alert
Queryable reason
Refer DDS Topic
Precondition
Queryable reason
Precondition
Precondition
Buffer logs
© RTI
ProDigy4IT Highlights in Demo 2
• Textual Data collection and processing using ProDigy4IT
• Collects, analyzes textual log data
• Readable, composable, dynamic probes for log diagnostics
• Log stream specific analysis (e.g., “event logs”, “security logs”, etc.)
• Capture Implicit/Explicit Alert Dependencies– An alert causes snapshot of all other streams to aid diagnosis (e.g., login
alert causes snapshot of temperature readings)
8/25/2015 22© RTI
Demo 3: Availability Diagnostics
• Scenario – Analyze SNMP data from Router
• How – Auto-detect – Poll Router SNMP end-point for Cisco-specific object-ids
• Trigger– Auto-detect connected hosts
– Detect loss of connectivity
8/25/2015 23© RTI
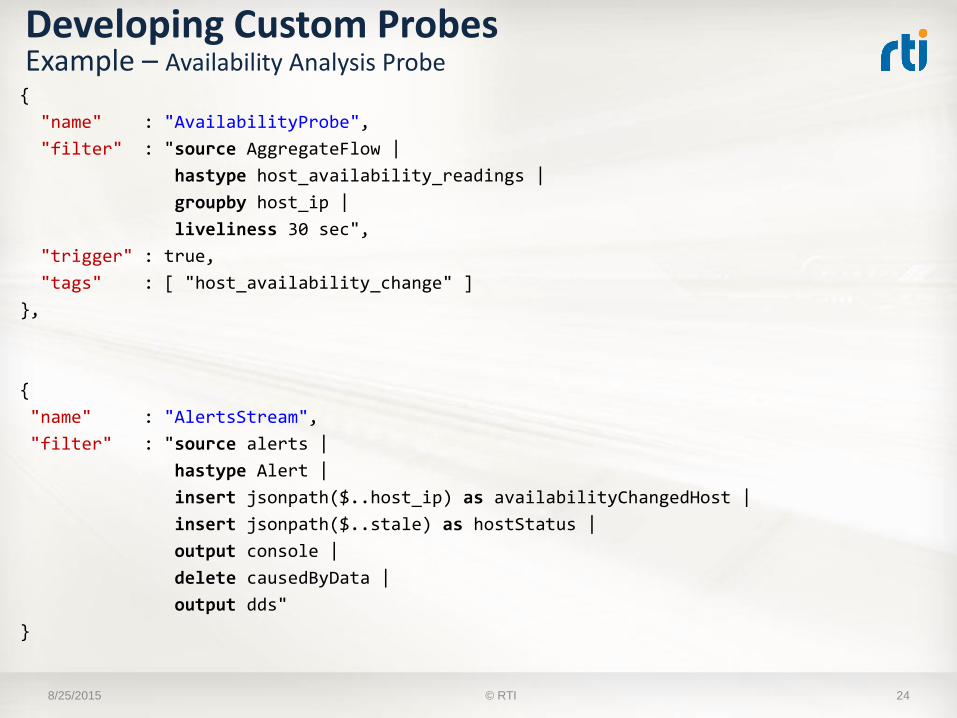
Developing Custom ProbesExample – Availability Analysis Probe{
"name" : "AvailabilityProbe",
"filter" : "source AggregateFlow |
hastype host_availability_readings |
groupby host_ip |
liveliness 30 sec",
"trigger" : true,
"tags" : [ "host_availability_change" ]
},
{
"name" : "AlertsStream",
"filter" : "source alerts |
hastype Alert |
insert jsonpath($..host_ip) as availabilityChangedHost |
insert jsonpath($..stale) as hostStatus |
output console |
delete causedByData |
output dds"
}
8/25/2015 24© RTI
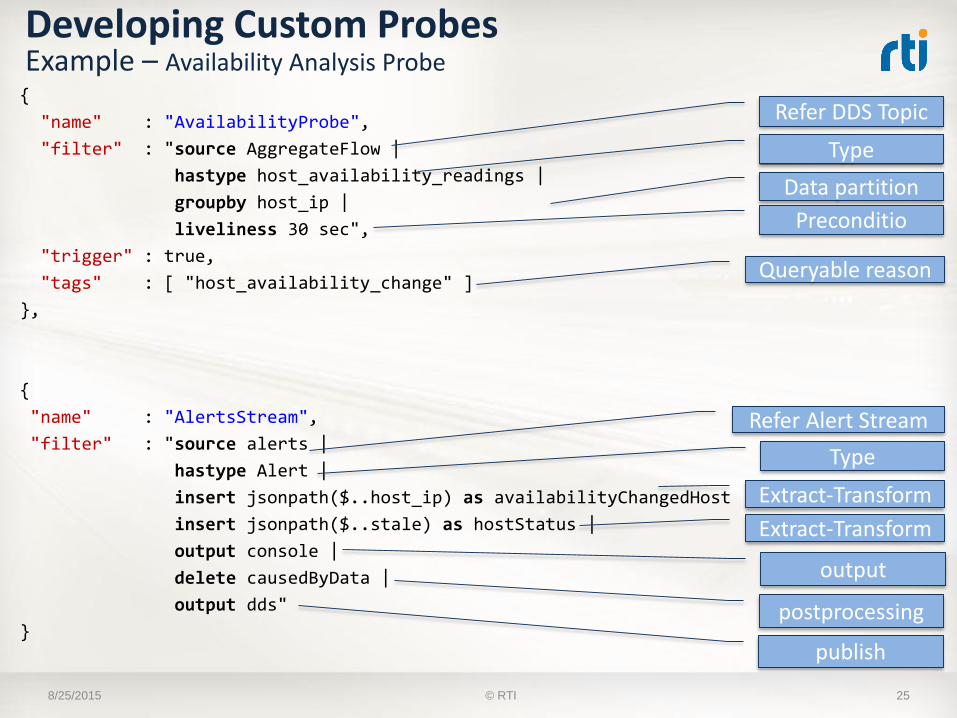
Developing Custom ProbesExample – Availability Analysis Probe{
"name" : "AvailabilityProbe",
"filter" : "source AggregateFlow |
hastype host_availability_readings |
groupby host_ip |
liveliness 30 sec",
"trigger" : true,
"tags" : [ "host_availability_change" ]
},
{
"name" : "AlertsStream",
"filter" : "source alerts |
hastype Alert |
insert jsonpath($..host_ip) as availabilityChangedHost |
insert jsonpath($..stale) as hostStatus |
output console |
delete causedByData |
output dds"
}
8/25/2015 25
Refer DDS Topic
Type
Data partition
Preconditio
Queryable reason
Refer Alert Stream
Type
Extract-Transform
Extract-Transform
output
postprocessing
publish
© RTI
ProDigy4IT Highlights in Demo 3
• SNMP Data collection and processing using ProDigy4IT– Collects, analyzes SNMP from networking equipment
• Readable, composable, dynamic probes for SNMP diagnostics
• Declarative liveliness monitoring– Per host
– Edge triggered – No need to send periodic pings to local
• Alerts post-processing– Alerts are just data streams
– Apply transformations to the alerts before transmitting
8/25/2015 26© RTI
References
• StreamCoCo: A DSL for Processing Data-Centric Streams for Industrial IoT Edge Applications [link]
8/25/2015 © RTI 27

Thank You
8/25/2015 28© RTI – PROPRIETARY – SBIR DATA RIGHTS - UNCLASSIFIED