remittances to latin america and the caribbean...
TRANSCRIPT

remittances& financialinclusion
FORUM ONREMITTANCES LATIN AMERICA AND THE CARIBBEAN
REMITTANCES TO LATIN AMERICA AND THE CARIBBEAN IN 2016:
NEW RECORD

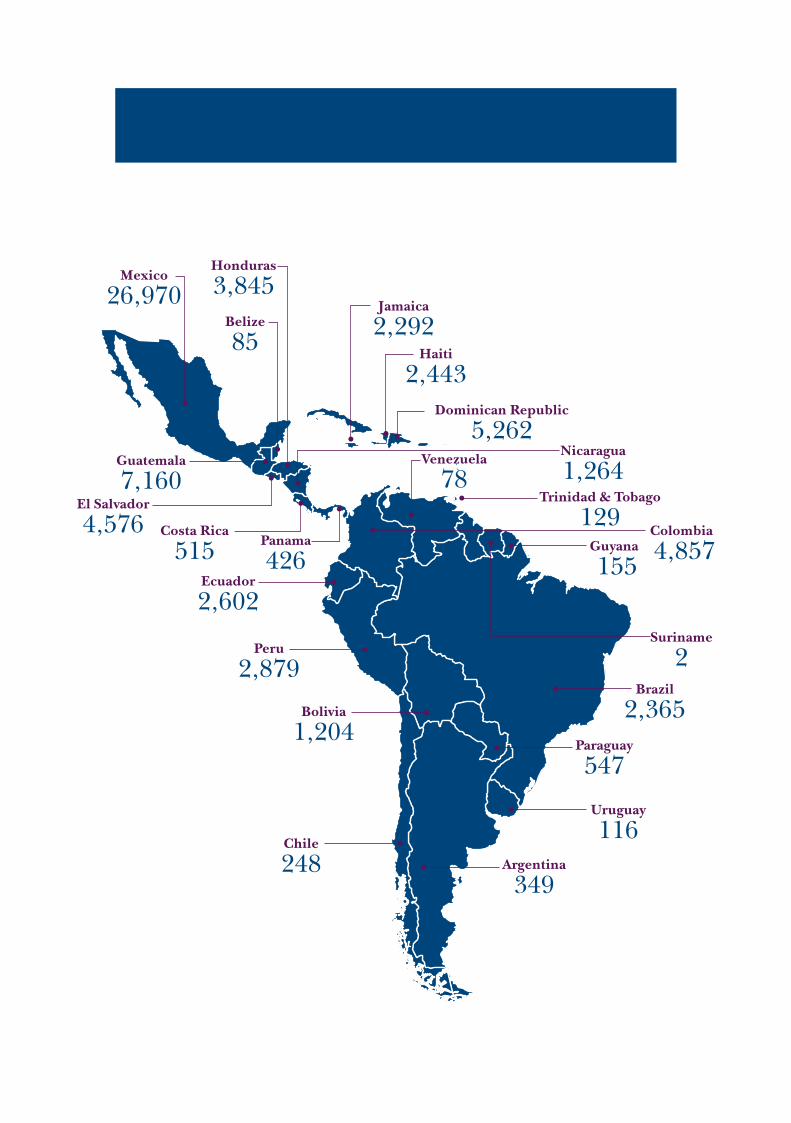
Argentina
349
Uruguay
116
Paraguay
547
Brazil
2,365
Guyana
155
Trinidad & Tobago
129
Venezuela
78
Belize
85
Mexico
26,970Honduras
3,845
Nicaragua
1,264
Dominican Republic
5,262
Panama
426Costa Rica
515
El Salvador
4,576
Haiti
2,443
Jamaica
2,292
Colombia
4,857
Suriname
2
Chile
248
Bolivia
1,204
Peru
2,879
Ecuador
2,602
Guatemala
7,160
Total Amount of Remittances Received in 2016By country in millions of


REMITTANCES TO LATIN AMERICA AND THE CARIBBEAN IN 2016
A New Record
René Maldonado, coordinator of the Remittances and Financial Inclusion Program of the Center for Latin American Monetary Studies (cemla); in collaboration with Jesús Cervantes, manager of Economic Statistics and coordinator of the Forum for Remittances in Latin America and the Caribbean at cemla and Salvador Bonilla, sub-manager of Economic Statistics at cemla.
The document has also benefited from comments and suggestions by Fermín Vivanco and Lukas Keller of the Multilateral Investment Fund (mif), member of the Inter-American Development Bank (idb) Group; and technical support from Cindy Sánchez of cemla.
The opinions expressed in this document are the exclusive responsability of the author and do not necessarily reflect the points of view of cemla or the mif (idb Group).
First edition in english, 2017
All rights reserved in compliance with the law© 2017 Centro de Estudios Monetarios Latinoamericanos (cemla)Durango 54, Colonia Roma Norte, Delegación Cuauhtémoc, 06700 Ciudad de MéxicoMéxico.
Cover: © Roman Motizov | dreamstime.com
isbn: 978-607-7734-92-5 (impreso)isbn: 978-607-7734-94-9 (electrónico)
Published in Mexico
REMITTANCES TO LATIN AMERICA AND THE CARIBBEAN IN 2016A New Record
CONTENT
1 Remittances in 2016 5
2 The Determinants of Remittance Fows 12
3Remittance Income for the Group of Latin American and Caribbean Countries Will Set A New Record in 2017 27


5Remittances to Latin America and the Caribbean in 2016
REMITTANCES TO LATIN AMERICA AND THE CARIBBEAN IN 2016A New Record
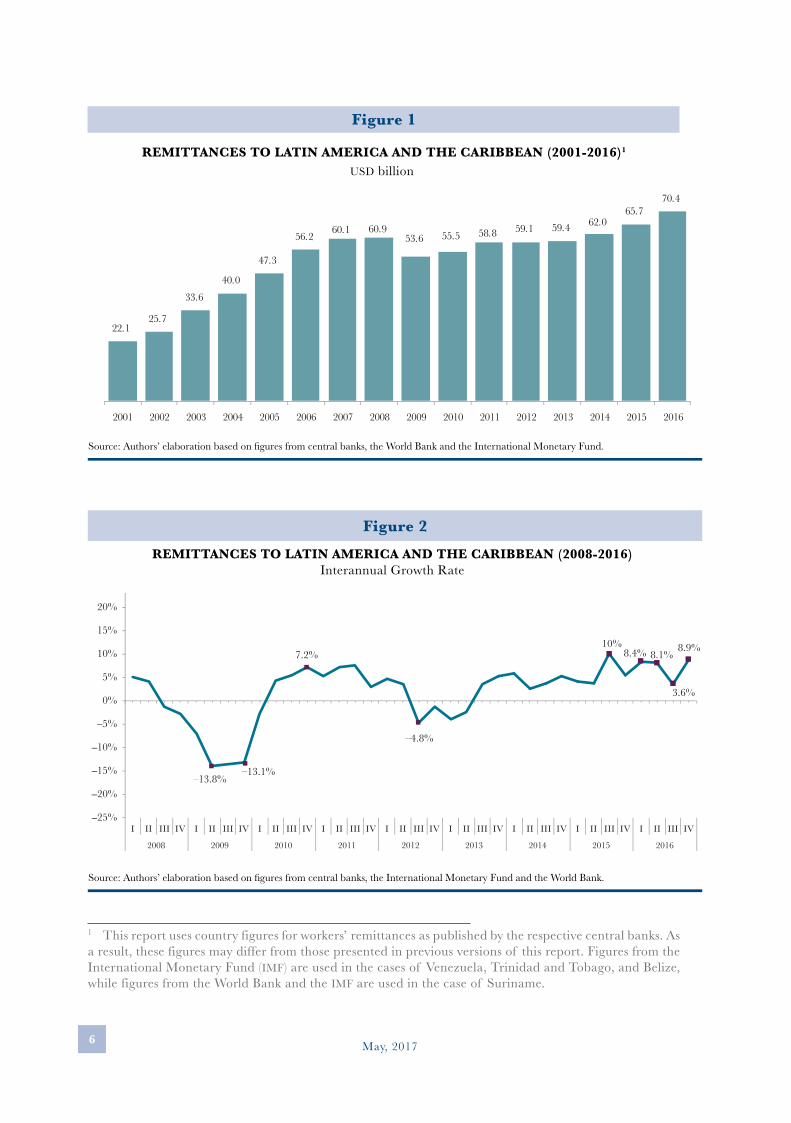
1. REMITTANCES IN 2016In 2016, remittance flows to Latin America and Caribbean reached new record levels that had a very positive impact on millions of reci-pient households. The most important aspects characterizing the be-havior of such inflows were: i) remittances amounted to usd 70,369 million, after having accumulated increases for 7 consecutive years; ii) the annual growth of these inflows was 7.2%, which represents the highest growth rate recorded in the past 10 years, iii) the increase in remittances was generalized throughout all the different subregions; and iv) stemmed from, among other factors, higher employment, ave-rage wages and, consequently, the total wage bill for migrant workers from the region in the main destination countries.
After the fall remittances experienced in 2009, these flows recove-red their growth, albeit at a much slower rate than had been observed prior to the financial crisis. This recovery accelerated significantly during 2015, reaching an annual growth rate of 5.9%, which, howe-ver, was far exceeded in 2016 when levels similar to those seen in years before the international financial crisis were achieved.
Thus, as can be seen in Figure 2, for almost all of 2016 the growth rates of remittances received by Latin America and the Caribbean were 8% higher than those observed in the same periods of the pre-vious year. The third quarter of the year displayed an annual growth rate of 3.6% due to the substantial expansion (10.2%) recorded du-ring the same period one year ago.
On average, a total of usd 17,592 million was received in lac each quarter during 2016. The fourth quarter saw the largest inflow amounting to usd 18,385 million and the smallest inflow was recei-ved in the first quarter (usd 17,737 million).
May, 20176
Gráfica 1REMESAS A AMÉRICA LATINA Y EL CARIBE (2001-2016)1
Miles de millones de dólares estadounidenses
22.125.7
33.640.0
47.3
56.2 60.1 60.953.6 55.5 58.8 59.1 59.4 62.0
65.770.4
2001 2002 2003 2004 2005 2006 2007 2008 2009 2010 2011 2012 2013 2014 2015 2016
Source: Authors’ elaboration based on figures from central banks, the World Bank and the International Monetary Fund.
Figure 2REMITTANCES TO LATIN AMERICA AND THE CARIBBEAN (2008-2016)
Interannual Growth Rate
Source: Authors’ elaboration based on figures from central banks, the International Monetary Fund and the World Bank.
–13.8%–13.1%
–4.8%
7.2%10%
8.1%8.9%8.4%
3.6%
15%
10%
5%
0%
5%
10%
15%
20%
20%
25%
I II III IV I II III IV I II III IV I II III IV I II III IV I II III IV I II III IV I II III IV I II III IV
2008 2009 2010 2011 2012 2013 2014 2015 2016
Figure 1
REMITTANCES TO LATIN AMERICA AND THE CARIBBEAN (2001-2016)1
usd billion
1 This report uses country figures for workers’ remittances as published by the respective central banks. As a result, these figures may differ from those presented in previous versions of this report. Figures from the International Monetary Fund (imf) are used in the cases of Venezuela, Trinidad and Tobago, and Belize, while figures from the World Bank and the imf are used in the case of Suriname.
7Remittances to Latin America and the Caribbean in 2016
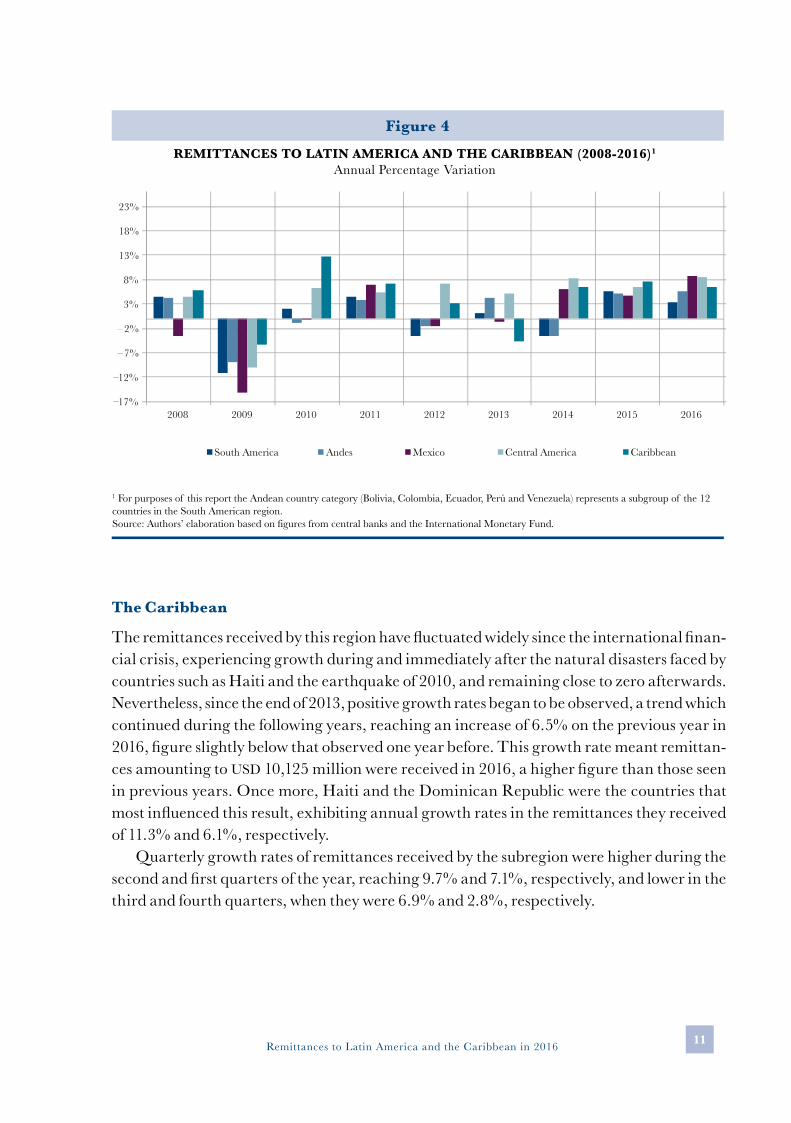
Differences in the destination of migration flows and in the economic conditions in migrants’ host countries mean that every country of origin exhibits specific patterns that do not necessarily follow a common trend. It is therefore necessary to group these coun-tries into subregions in order to better identify and analyze the dynamics of such flows. For the purposes of this analysis, the lac region will be subdivided into Mexico, Central America, the Caribbean and South America.
With this division in mind, it can be seen that for the second consecutive year after the financial crisis all the subregions exhibited positive growth rates, above those of the previous year in the case of Andean countries, Mexico and Central America, and below them in the subregions of South America and the Caribbean.
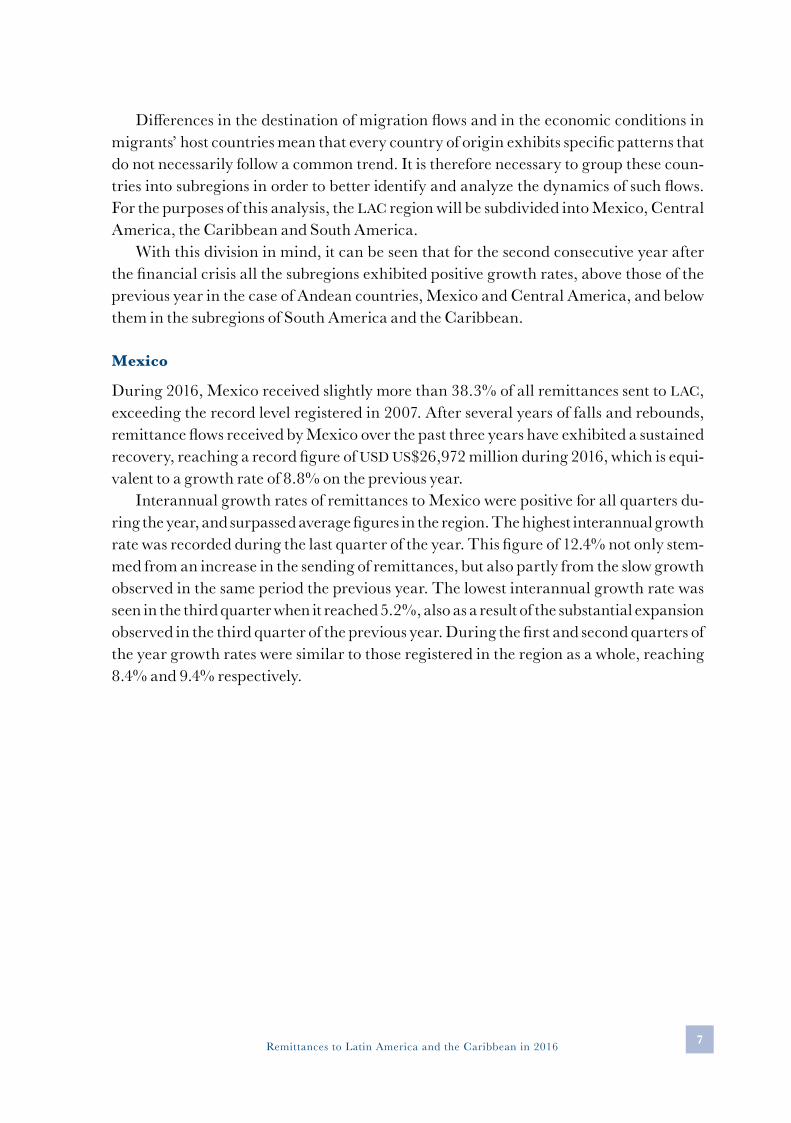
Mexico
During 2016, Mexico received slightly more than 38.3% of all remittances sent to lac, exceeding the record level registered in 2007. After several years of falls and rebounds, remittance flows received by Mexico over the past three years have exhibited a sustained recovery, reaching a record figure of usd us$26,972 million during 2016, which is equi-valent to a growth rate of 8.8% on the previous year.
Interannual growth rates of remittances to Mexico were positive for all quarters du-ring the year, and surpassed average figures in the region. The highest interannual growth rate was recorded during the last quarter of the year. This figure of 12.4% not only stem-med from an increase in the sending of remittances, but also partly from the slow growth observed in the same period the previous year. The lowest interannual growth rate was seen in the third quarter when it reached 5.2%, also as a result of the substantial expansion observed in the third quarter of the previous year. During the first and second quarters of the year growth rates were similar to those registered in the region as a whole, reaching 8.4% and 9.4% respectively.

May, 20178
Figure 3REMITTANCES TO LATIN AMERICA AND THE CARIBBEAN (2008-2016)
USD million
Source: Authors’ elaboration based on figures from central banks and the International Monetary Fund.
0
5,000
10,000
15,000
20,000
25,000
30,000
Mexico Central America Caribbean South America
2008 2009 2010 2011 2012 2013 2014 2015 2016
Central America
Remittances received by Central American countries continued exhibiting growth rates si-milar to those observed immediately after the 2008 financial crisis. In 2016, a new record was set for remittances received by this subregion, reaching a total annual inflow of usd 17,871 million, corresponding to an annual growth rate of 8.5%, higher than that observed during the last 6 years. This rate was the result of higher annual growth in remittances received by Guatemala (13.9%), El Salvador (7.2%) and Nicaragua (5.9%), offset, just as in the previous year, by negative growth in remittances received by Panama (-9.9%) and, to a lesser extent, Costa Rica (-0.5%).
In quarterly terms, the Central American region also displayed positive growth rates throughout the year as a whole, the first quarter being when the highest rate of 11.7% was re-corded, followed by the third and second quarters when they reached 9.24% and 8.0%, res-pectively. A growth rate of 6.2% was recorded in the third quarter, which was, nevertheless, higher than the average observed in the lac region.

9Remittances to Latin America and the Caribbean in 2016
Mexico is the fourth largest remittan-ce recipient in the world, after India, China and the Philippines, and the first in Latin America. In 2016, such inflows to Mexico amounted to usd 26,972 mi-llion, which represented 38.3% of re-mittances received by Latin America and the Caribbean. Said income has had a very positive impact on millions of Mexican recipient households as they contribute to improving stan-dards of living and reducing poverty by helping to fund their expenditure on consumer goods, education, health, housing, and in some cases investment in family businesses as well.
In 2016, remittance flows to Mexico reached record levels, given that af-ter nine years they surpassed the pre-vious record of usd 26,059 million set in 2007. These inflows also regis-tered their third consecutive annual increase in 2016 measured as a pro-portion of gdp, accounting for 2.59 percentage points of gdp, after having been equal to 1.77 percentage points in 2013. It is worth pointing out that this income is relatively small compa-red to the size of the Mexican economy and in comparison to that observed in other countries of the region, parti-cularly those of Central America and
Box 1
THE DETERMINANTS OF REMITTANCES IN 2016: THE CASE OF MEXICO
USA: VARIATION FROM 2013 TO 2016 IN SELECTED VARIABLESOF MEXICAN IMMIGRANT WORKERS
636,340
654,146
–17,806
370,751
265,589
Total
Full time
Partial time
Men
Women
Variation of employement Number of workers
(9.5%)
(11.9%)
(8.3%)
(–1.6%)
(11.6%)
49,968
48,145
1,823
37,903
12,065
Variation of wage bill USD millions
(26.5%)
(23.4%)
(27.7%)
(11.9%)
(27.8%)
4,374
4,461
1,954
5,489
2,375
Variation of averageremuneration
Dollars
(15.5%)
(10.2%)
(17.9%)
(13.8%)
(14.4%)
13,755 22,999 13,214
2014 2015 2016
Total (annual variation)
854 1,532 1,988
2014 2015 2016
Total (annual variation)
276,855 402,944 –43,459
2014 2015 2016
Total (annual variation)
May, 201710
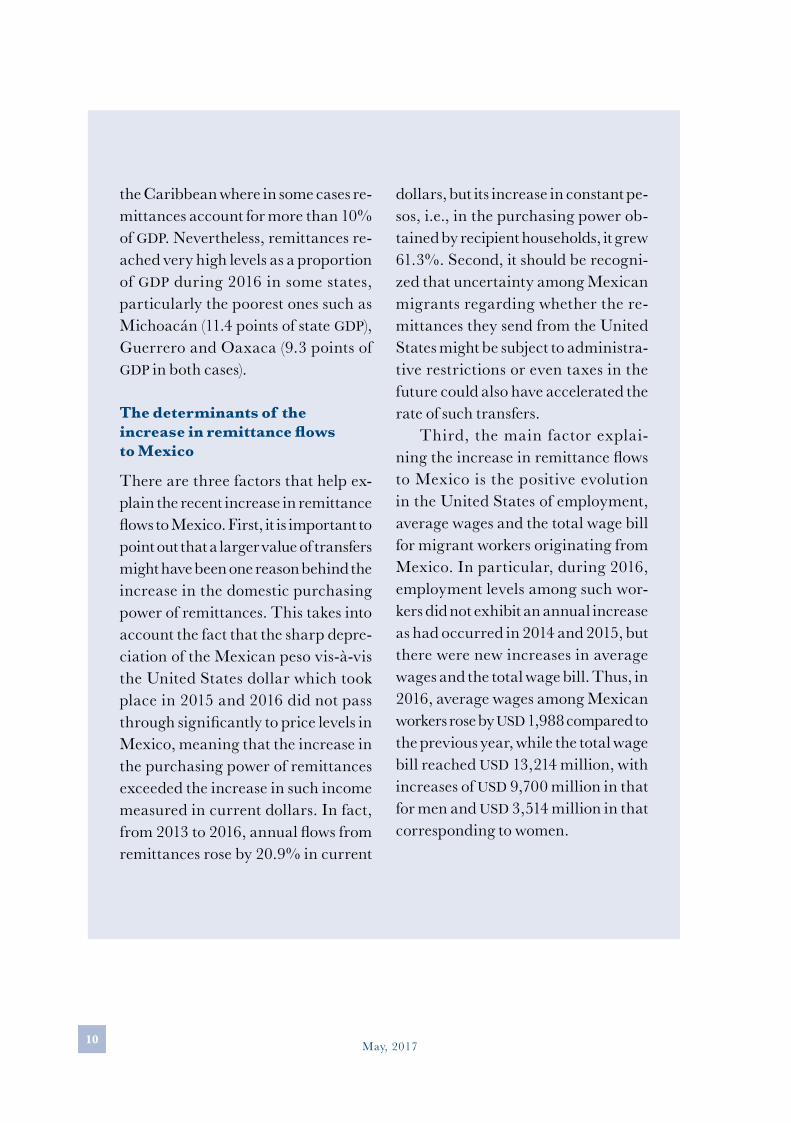
the Caribbean where in some cases re-mittances account for more than 10% of gdp. Nevertheless, remittances re-ached very high levels as a proportion of gdp during 2016 in some states, particularly the poorest ones such as Michoacán (11.4 points of state gdp), Guerrero and Oaxaca (9.3 points of gdp in both cases).
The determinants of the increase in remittance flows to Mexico
There are three factors that help ex-plain the recent increase in remittance flows to Mexico. First, it is important to point out that a larger value of transfers might have been one reason behind the increase in the domestic purchasing power of remittances. This takes into account the fact that the sharp depre-ciation of the Mexican peso vis-à-vis the United States dollar which took place in 2015 and 2016 did not pass through significantly to price levels in Mexico, meaning that the increase in the purchasing power of remittances exceeded the increase in such income measured in current dollars. In fact, from 2013 to 2016, annual flows from remittances rose by 20.9% in current
dollars, but its increase in constant pe-sos, i.e., in the purchasing power ob-tained by recipient households, it grew 61.3%. Second, it should be recogni-zed that uncertainty among Mexican migrants regarding whether the re-mittances they send from the United States might be subject to administra-tive restrictions or even taxes in the future could also have accelerated the rate of such transfers.
Third, the main factor explai-ning the increase in remittance flows to Mexico is the positive evolution in the United States of employment, average wages and the total wage bill for migrant workers originating from Mexico. In particular, during 2016, employment levels among such wor-kers did not exhibit an annual increase as had occurred in 2014 and 2015, but there were new increases in average wages and the total wage bill. Thus, in 2016, average wages among Mexican workers rose by usd 1,988 compared to the previous year, while the total wage bill reached usd 13,214 million, with increases of usd 9,700 million in that for men and usd 3,514 million in that corresponding to women.
11Remittances to Latin America and the Caribbean in 2016
Figure 4REMITTANCES TO LATIN AMERICA AND THE CARIBBEAN (2008-2016)1
Annual Percentage Variation
1 For purposes of this report the Andean country category (Bolivia, Colombia, Ecuador, Perú and Venezuela) represents a subgroup of the 12countries in the South American region.Source: Authors’ elaboration based on figures from central banks and the International Monetary Fund.
17%
–
–
–
–
12%
7%
2%
3%
8%
13%
18%
23%
2008 2009 2010 2011 2012 2013 2014 2015 2016
South America Andes Mexico Central America Caribbean
The Caribbean
The remittances received by this region have fluctuated widely since the international finan-cial crisis, experiencing growth during and immediately after the natural disasters faced by countries such as Haiti and the earthquake of 2010, and remaining close to zero afterwards. Nevertheless, since the end of 2013, positive growth rates began to be observed, a trend which continued during the following years, reaching an increase of 6.5% on the previous year in 2016, figure slightly below that observed one year before. This growth rate meant remittan-ces amounting to usd 10,125 million were received in 2016, a higher figure than those seen in previous years. Once more, Haiti and the Dominican Republic were the countries that most influenced this result, exhibiting annual growth rates in the remittances they received of 11.3% and 6.1%, respectively.
Quarterly growth rates of remittances received by the subregion were higher during the second and first quarters of the year, reaching 9.7% and 7.1%, respectively, and lower in the third and fourth quarters, when they were 6.9% and 2.8%, respectively.
May, 201712
South America
In contrast to Mexico and Central American countries, where remittances mainly origina-te from the United States, in the South American region Spain is also a significant source of such flows. Moreover, the varying levels of development and different economic condi-tions observed in each country of this region results in wage differences that foster intra-regional migration and the corresponding remittance flows from countries like Argentina and Brazil to Bolivia or from Paraguay and Colombia to Venezuela. However, the impor-tance of these intraregional flows within the regional total continues to be relatively small compared to remittances originating from the United States and Spain.
In this context, during 2016, remittances received by South America grew at a slower rate than those observed in other regions, recording growth of 3.5% on flows in the previous year, with total income from remittances amounting to usd 15,402 million, but still not exceed-ing the record levels registered in 2008. The countries that contributed most to this positive growth were Argentina (23.3%), Paraguay (18.6%) and Ecuador (9.4%), while negative growth rates were displayed in Surinam (-77.6%), Venezuela (-6.3%), Chile (-6.5%) and Brazil (-3.8%).
The highest growth rates in the South American region were displayed during the first and second quarters when they reached 6.3% and 4.0%, respectively. However, the third quarter saw growth that was close to zero (0.7%), recovering afterwards during the fourth quarter with a growth rate of 1.1%.
In 2016, 75% of the remittances sent to South America were received by the Andean countries (Bolivia, Colombia, Ecuador, Perú and Venezuela), a figure slightly higher than that observed in 2015. In the last year, the Andean subregion registered a positive growth rate of 5.6%, higher than that for South America as a whole, and meaning the total re-mittances received by this subgroup of countries amounted to usd 11,620 million. Such growth is mostly due to increases in remittances received by Ecuador (9.4%) and Perú (5.7%), somewhat offset by the fall in remittances received by Venezuela (-6.3%).
2. THE DETERMINANTS OF REMITTANCE FOWSTo better understand the changes that have taken place in the amounts of remittances re-ceived by the region we must analyze migration, employment and wage trends in the main destinations of migrants from Latin America and the Caribbean (United States, Spain and, to a lesser extent, other countries in the region). These trends determine the chances of migrants to obtain employment, generate income and send remittances. Furthermore, understanding the economic situation and needs of their families as remittance recipients also helps to explain the behavior of these flows. Under this framework, the referred varia-bles and their relationship with remittances received by the region in 2016 will be analy-zed below.
For some countries one alternative to moving to the United States or Europe is mi-grating to other countries within the same region, particularly neighboring countries.

13Remittances to Latin America and the Caribbean in 2016
This migration and the flows deriving from it are known as intraregional migration or remittances.
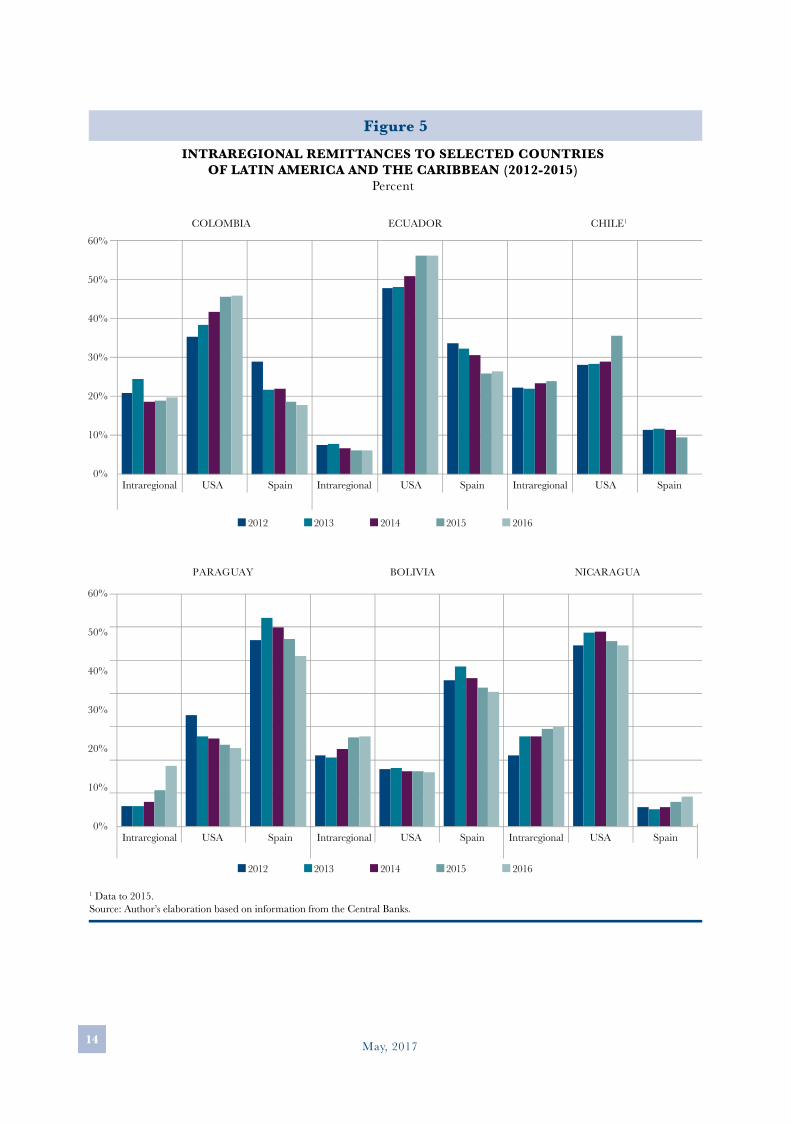
Although only some countries in Latin America and the Caribbean publish information on remittance inflows by country of origin, countries where the intraregional remittances received are relatively more important do so. Thus, according to the information avai-lable, remittances sent from Spain in 2016 to countries such as Paraguay and Bolivia ac-counted for 51% and 41%, respectively, of all such inflows, exceeding those received from the United Sates. In the cases of Ecuador and Colombia, although the proportion of re-mittances from Spain is very significant, representing 26% and 28%, respectively, of those received during 2016, most remittances still come from the United States (56% and 46%, respectively). In other countries, such as Nicaragua, remittances from Spain are smaller, representing just 9% of all such inflows in the last year.
Intraregional remittances continued to be very significant for some countries of the region during 2016, exceeding 20% of the remittances they received (Nicaragua 30%, Bolivia 27%, Colombia 20% and Paraguay 18%). For other countries like Ecuador, intra-regional remittances accounted for just 6% of total inflows.
As remittances from Spain decreased in Colombia, Ecuador and Chile during the re-ferred period (2012-2016), they were replaced by remittances from the United States, whi-le intraregional remittances remained relatively stable.
Also, in Paraguay, Bolivia and Nicaragua, decreasing remittances from Spain and the United States were offset by a growth in remittances from neighboring countries i.e. the proportion of intraregional flows received by these countries increased.
United States
In 2016, an estimated 21.4 million1 migrants from the lac region were living in the United States, which is 287 thousand (1.4%) more than in the previous year. This may partly ex-plain the increase in remittances received by the region overall in the past year.
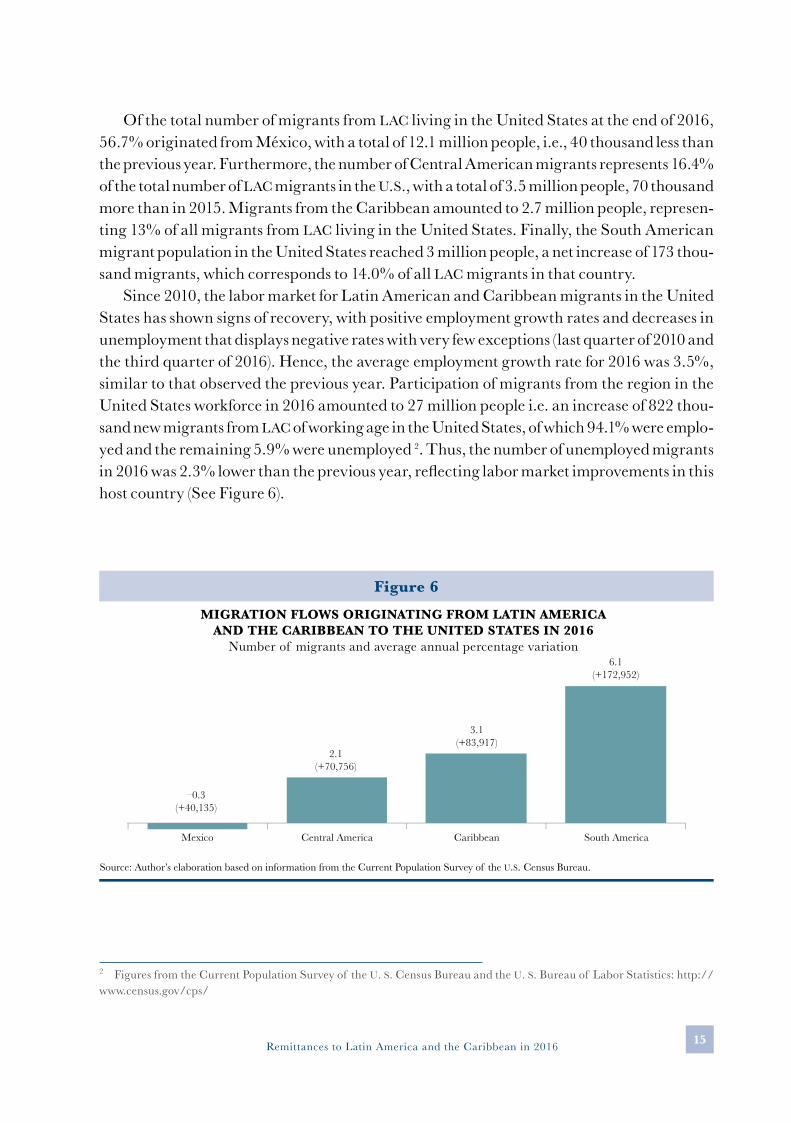
As shown in Figure 6, the abovementioned increase is the result of higher levels of mi-gration from South America (6.1%), the Caribbean (3.1%) and, to a lesser extent, Central America, compared to the previous year. Meanwhile, the number of Mexican migrants decreased by 0.3% as compared to the previous year.
It is also important to highlight that, just as in recent years, the number of migrants in the United States originating from South American countries recorded high growth rates (6.1%). According to country of origin, the growth of migrants from Paraguay, Uruguay, Haiti and Venezuela among those living in the United States stands out. In the same way, it is impor-tant to point out decreases in the number of migrants in the United States originating from Mexico, Nicaragua, Jamaica and Ecuador.
1 Figures from the Current Population Survey of the u. s. Census Bureau and the u. s. Bureau of Labor Statistics.
May, 201714
Figure 5INTRAREGIONAL REMITTANCES TO SELECTED COUNTRIES
OF LATIN AMERICA AND THE CARIBBEAN (2012-2015)Percent
1 Data to 2015.Source: Author’s elaboration based on information from the Central Banks.
50%
40%
30%
20%
10%
60%
0%
50%
40%
30%
20%
10%
60%
0%
Intraregional USA Spain Intraregional USA Spain Intraregional USA Spain
Intraregional USA Spain Intraregional USA Spain Intraregional USA Spain
COLOMBIA ECUADOR CHILE1
2012 2013 2014 2015 2016
2012 2013 2014 2015 2016
PARAGUAY BOLIVIA NICARAGUA
15Remittances to Latin America and the Caribbean in 2016
Of the total number of migrants from lac living in the United States at the end of 2016, 56.7% originated from México, with a total of 12.1 million people, i.e., 40 thousand less than the previous year. Furthermore, the number of Central American migrants represents 16.4% of the total number of lac migrants in the u.s., with a total of 3.5 million people, 70 thousand more than in 2015. Migrants from the Caribbean amounted to 2.7 million people, represen-ting 13% of all migrants from lac living in the United States. Finally, the South American migrant population in the United States reached 3 million people, a net increase of 173 thou-sand migrants, which corresponds to 14.0% of all lac migrants in that country.
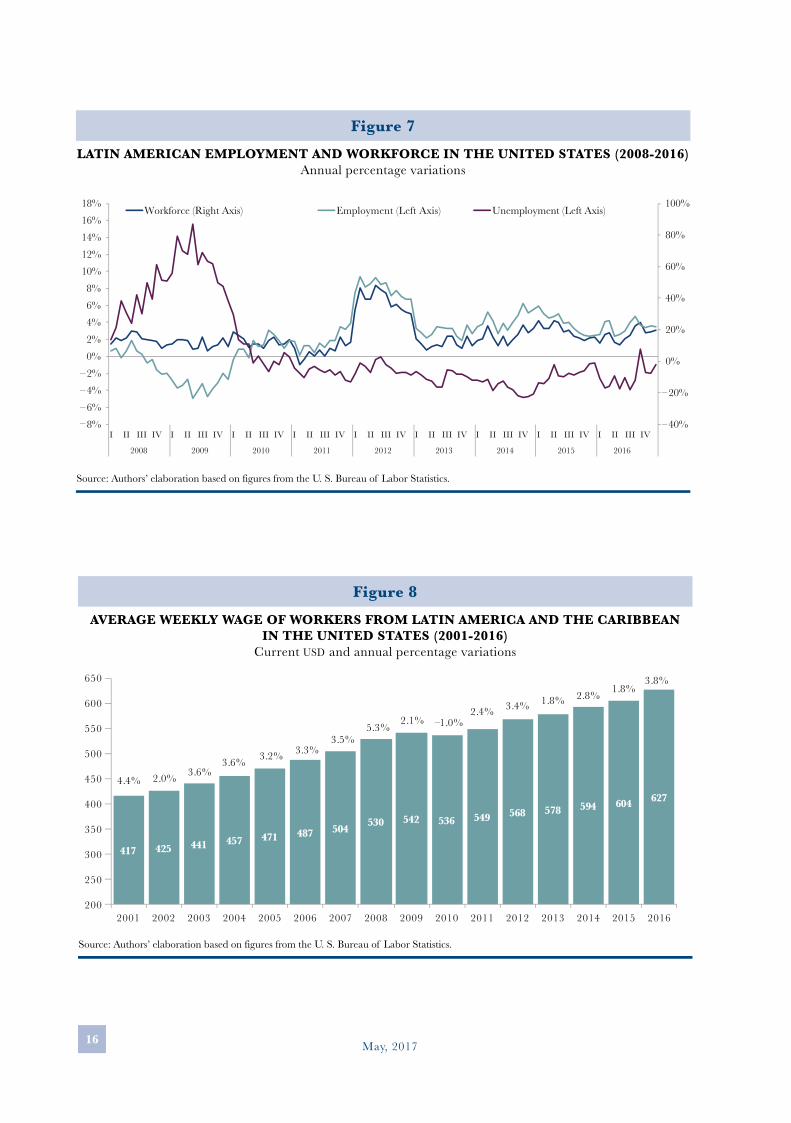
Since 2010, the labor market for Latin American and Caribbean migrants in the United States has shown signs of recovery, with positive employment growth rates and decreases in unemployment that displays negative rates with very few exceptions (last quarter of 2010 and the third quarter of 2016). Hence, the average employment growth rate for 2016 was 3.5%, similar to that observed the previous year. Participation of migrants from the region in the United States workforce in 2016 amounted to 27 million people i.e. an increase of 822 thou-sand new migrants from lac of working age in the United States, of which 94.1% were emplo-yed and the remaining 5.9% were unemployed 2. Thus, the number of unemployed migrants in 2016 was 2.3% lower than the previous year, reflecting labor market improvements in this host country (See Figure 6).
2 Figures from the Current Population Survey of the u. s. Census Bureau and the u. s. Bureau of Labor Statistics: http://www.census.gov/cps/
Figure 6MIGRATION FLOWS ORIGINATING FROM LATIN AMERICA
AND THE CARIBBEAN TO THE UNITED STATES IN 2016Number of migrants and average annual percentage variation
Source: Author’s elaboration based on information from the Current Population Survey of the U.S. Census Bureau.
Mexico
3.1(+83,917)
6.1(+172,952)
2.1(+70,756)
–0.3(+40,135)
Central America Caribbean South America
May, 201716
Figure 7LATIN AMERICAN EMPLOYMENT AND WORKFORCE IN THE UNITED STATES (2008-2016)
Annual percentage variations
Source: Authors’ elaboration based on figures from the U. S. Bureau of Labor Statistics.
–40%
–20%
0%
20%
40%
60%
80%
100%
8%
6%
4%
––––
2%
0%
2%
4%
6%
8%
10%
12%
14%
16%
18%
I II III IV I II III IV I II III IV I II III IV I II III IV I II III IV I II III IV I II III IV I II III IV
2008 2009 2010 2011 2012 2013 2014 2015 2016
Workforce (Right Axis) Employment (Left Axis) Unemployment (Left Axis)
Figure 8AVERAGE WEEKLY WAGE OF WORKERS FROM LATIN AMERICA AND THE CARIBBEAN
IN THE UNITED STATES (2001-2016)Current USD and annual percentage variations
Source: Authors’ elaboration based on figures from the U. S. Bureau of Labor Statistics.
417 425 441 457 471 487 504 530 542 536 549 568 578 594 604 6274.4% 2.0% 3.6%
3.6% 3.2% 3.3% 3.5%
5.3% 2.1% –1.0%
2.4% 3.4% 1.8% 2.8% 1.8%
200
250
300
350
400
450
500
550
600
650
2001 2002 2003 2004 2005 2006 2007 2008 2009 2010 2011 2012 2013 2014 2015 2016
3.8%
17Remittances to Latin America and the Caribbean in 2016
As figure 8 shows in regard to wages, the average weekly wage of lac migrants in the United States in 2016 reached usd us$627, the highest figure observed in the past fifteen years, with a 3.8% annual growth rate compared to the previous year, the highest rate regis-tered since the 2008-2009 financial crisis.
The growth of migration flows from Latin America and the Caribbean to the United States, as well as improvements in the labor market for migrants in that country, help to explain the increase in remittances observed, especially in countries such as Ecuador, Guatemala, Mexico and Haiti, whose remittances mostly originate from the United States.
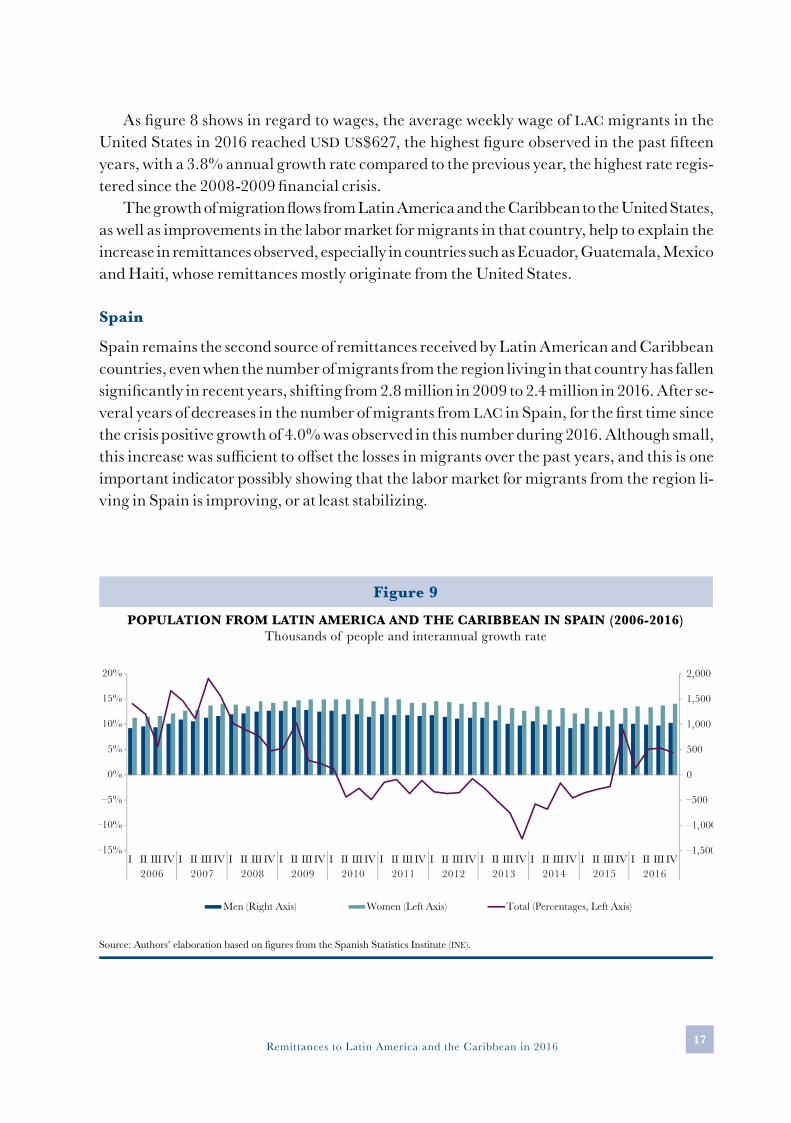
Spain
Spain remains the second source of remittances received by Latin American and Caribbean countries, even when the number of migrants from the region living in that country has fallen significantly in recent years, shifting from 2.8 million in 2009 to 2.4 million in 2016. After se-veral years of decreases in the number of migrants from lac in Spain, for the first time since the crisis positive growth of 4.0% was observed in this number during 2016. Although small, this increase was sufficient to offset the losses in migrants over the past years, and this is one important indicator possibly showing that the labor market for migrants from the region li-ving in Spain is improving, or at least stabilizing.
Figure 9POPULATION FROM LATIN AMERICA AND THE CARIBBEAN IN SPAIN (2006-2016)
Thousands of people and interannual growth rate
Source: Authors’ elaboration based on figures from the Spanish Statistics Institute (INE).
0
500
1,000
1,500
2,000
–1,000
–500
–1,500
15%
10%
5%
0%
–5%
–10%
20%
–15%
I II III IV I II III IV I II III IV I II III IV I II III IV I II III IV I II III IV I II III IV I II III IV I II III IV I II III IV2006 2007 2008 2009 2010 2011 2012 2013 2014 2015 2016
Men (Right Axis) Women (Left Axis) Total (Percentages, Left Axis)

May, 201718
In recent years, cemla has made efforts in collaboration with Latin America and Car ibbean centra l banks and the Multilateral Investment Fund (mif) of the Inter-American Development Bank (ibd) to identify different aspects of the profile of inter-national migrants in the region, the remittances they send, the prices they pay for such transfers and to obtain indicators on the financial inclusion of remittance senders and receivers. By January 2017 surveys had been conducted among migrants from five countries at international airports du-ring three Christmas vacation periods: México (December, 2014), Dominican Republic (December, 2014), Honduras ( January, 2015), El Salvador ( January, 2016) and Guatemala ( January, 2017).
The interviews were made when the migrants arrived in their coun-tries of origin to spend the Christmas holidays with their families or when returning to the countries they live in. Practically the same survey was applied in all five surveys.
These surveys and the resulting studies represent cemla’s efforts as part of the activities performed by the
Remittances Forum of Latin America and the Caribbean under the fra-mework of the Program of Remittances and Financial Inclusion implemented by cemla and mif.
Some selected results of the refe-rred surveys are presented in this box.
Box 2
RESULTS OF SURVEYS ON MIGRATION AND REMITTANCES UP TO 2017 (Selected countries)
76.3
89.4 90.9
78.3 76.7
Mexico DominicanRepublic
ElSalvador
Honduras Guatemala
73.788.3 87.2
68.3 81.3
Non-senders
Senders
NETWORKS OF FAMILY MEMBERSAND FRIENDS IN MIGRATION
Percentage of answers stating that when emigratingthe migrant arrived to live with family members
or friends already living in the destination country
Figure 1

19Remittances to Latin America and the Caribbean in 2016
Presence of family members or friends at destination
One factor that helps identify where to emigrate and settle in a destination country is having family members or friends there in order to receive their support during the initial adaptation period. Figure 1 shows how most of the migrants surveyed went to live in the destination location with family mem-bers or friends that had settled there before them.
Beneficiaries of remittances
The results of the five surveys confirm that remittances are transferred bet-ween individuals with family ties.
Respondents also frequently stated that they send remittances to more than one family member. Figure 2 shows the percentage of surveys in which the
remittance recipient is mentioned, be it alone or together with other recipients.
It stands out that the migrant’s mother registered the largest percen-tage as beneficiary of remittances, be it individually or together with other family members.
Use of the income from remittances
According to the answers of migrants surveyed, which are shown in Figure 3, a high percentage of the number of transfers are used for more than one purpose. The most common are ge-neral living expenses, education and health. Most remittance transfers are sent within a period of one month, which is determined by the fact that these resources are mainly spent on li-ving expenses, health and education.
RECIPIENTS OF REMITTANCES SENT BY MIGRANTSFROM LATIN AMERICA AND THE CARIBBEAN1
58.243.412.740.3
32.726.1
22.47.56.06.4
48.626.1
20.815.914.6
6.64.3
3.12.51.0
MotherFatherSpouseParents
SibilingsChildren
GrandparentsSpouse&children
Aunts&UnclesCousins
49.124.023.7
19.517.116.64.4
4.43.22.3
50.519.917.0
14.727.6
20.73.95.9
3.32.2
1Adds up to more than 100% because some senders mentioned sending remittances to more than one recipient.
54.931.8
21.931.8
26.424.9
4.912.7
3.83.1
El SalvadorMexico Dominican Republic Honduras Guatemala
Figure 2

May, 201720
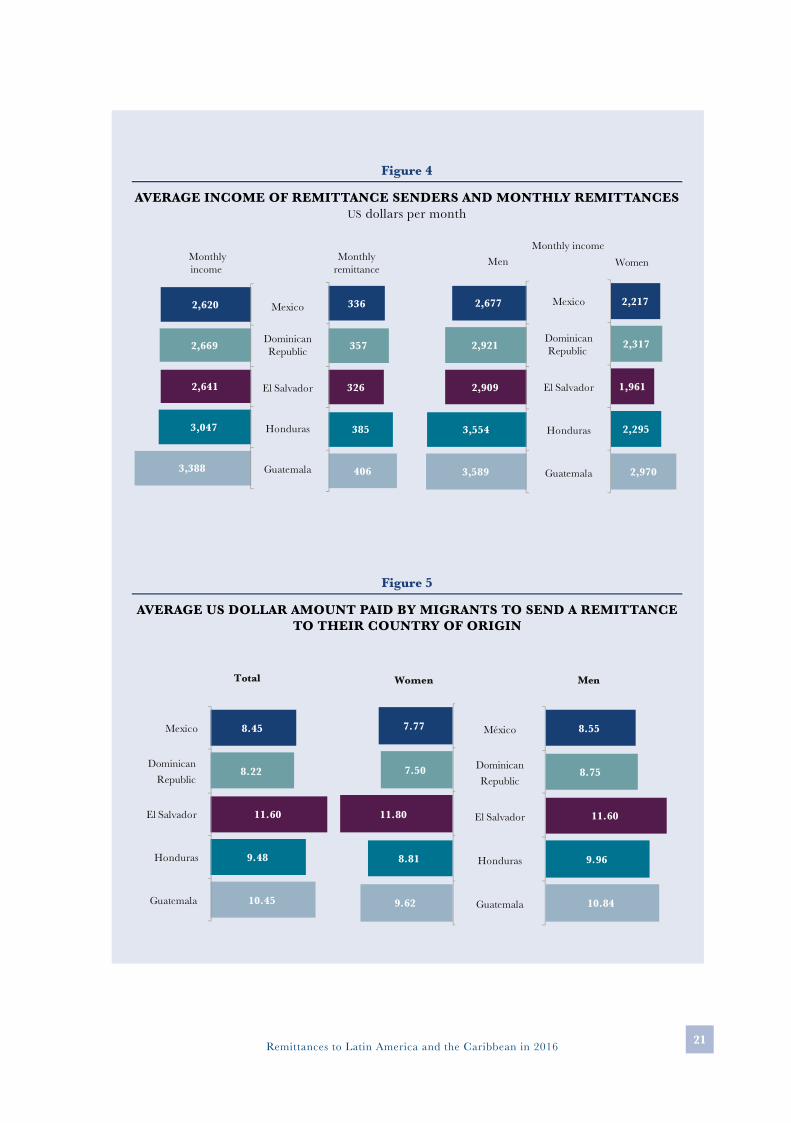
Income of migrants interviewed
The results shown in Figure 4 demons-trate that there is a significant differen-ce between the average income of men and women who were interviewed. This is despite the fact that average le-vels of education among women tended to be higher than in men.
Cost of sending remittances
The survey asked how many dollars senders pay for sending remittances to family members in their countries of origin. The costs actually paid might be slightly lower as it was noticed that there was a tendency among respon-dents to round off their answers, for
instance, into 5, 10, 15 and 20 do-llars, and such rounding was probably upwards. One interesting result is that in 4 out of 5 migratory groups women pay less than men (Figure 5)1.
Percentage of migrants’ income sent as remittances
Figure 6 shows the percentage of in-come obtained by immigrants in the countries where they live that is sent as remittances to family members in their countries of origin. Said percentage varied between 12.3% and 12.8% in
1 It is worth pointing out that the cost captured does not take into account the exchange rate margin where it is applicable.
USE OF REMITTANCES SENT BY MIGRANTS FROM LATIN AMERICAAND THE CARIBBEAN1
Percentage frequency in respondents’ answers
Figure 3
1Answers that show the opinion of remittance senders surveyed about the destination of the resources. Answers add up to morethan 100% because some senders mentioned remittances having more than one destination.
83.3
30.8
13.1
6.4
1.1
0.9
0.1
9.1
Living expenses
Health
Education
Own propertiesProperties owned
by family membersOwn business
Donations to their community
Other uses
90.356.2
24.3
3.0
1.1
0.6
0.6
4.2
95.2
77.4
30.2
13.1
19.5
5.0
0.5
15.6
91.4
72.0
37.0
5.7
3.2
2.5
0.2
2.9
86.7
62.9
38.8
9.5
9.0
3.2
3.8
5.7
El SalvadorMexico Dominican Republic Honduras Guatemala
21Remittances to Latin America and the Caribbean in 2016
AVERAGE INCOME OF REMITTANCE SENDERS AND MONTHLY REMITTANCES US dollars per month
Figure 4
2,620
2,669
2,641
3,047
3,388
336
357
326
385
406
Mexico
DominicanRepublic
DominicanRepublic
El Salvador
Honduras
Guatemala
Monthlyincome
Monthlyremittance
Men Women
2,677
2,921
2,909
3,554
3,589
2,217
2,317
1,961
2,295
2,970
Mexico
El Salvador
Honduras
Guatemala
Monthly income
AVERAGE US DOLLAR AMOUNT PAID BY MIGRANTS TO SEND A REMITTANCE TO THEIR COUNTRY OF ORIGIN
Figure 5
8.45
8.22
11.60
9.48
10.45
Mexico
Dominican Republic
El Salvador
Honduras
Guatemala
Total
8.55
8.75
11.60
9.96
10.84
México
DominicanRepublic
El Salvador
Honduras
Guatemala
Men
7.77
7.50
11.80
8.81
9.62
Women

May, 201722
the case of Salvadorian and Mexican migrants interviewed, and between 14.1% and 14.3% in Guatemalans and Hondurans.
It is important to recognize that those coefficients or percentages refer to respondents who send remittances, but in all the groups surveyed there was a significant percentage of migrants that did not send remittances to their countries of origin. It is also very likely that most of those interviewed were documented migrants in the countries where they were living, possibly su-ggesting that they had been there for a considerable length of time. The lat-ter is important because the results of
the surveys also show that the percen-tage of migrants sending remittances tends to decrease the longer they have been living abroad, as well as a tend to reduce the percentage of their income they send to their family members as remittances.
Figure 6 also presents the cost paid for sending remittances as a percen-tage of the average amount sent. Said cost, which does not include the ex-change rate margin in countries whe-re it is applicable, varied between 2.2% and 2.3% in Guatemala and the Dominican Republic to 3.6% in the case of remittances sent to El Salvador.
MONTHLY REMITTANCE TO AVERAGE MONTHLY INCOME RATION AND COST OF SENDING A REMITTANCE TO AVERAGE REMITTANCE RATIO
Figure 6
Monthly Remittanceto Average Monthly Income Ratio
Cost of Sending a Remittanceto Average Remittance Ratio
Mexico
Dominican
Republic
El Salvador
Honduras
Guatemala
12.8%
13.4%
12.3%
14.3%
12.0%
2.5%
2.3%
3.6%
2.5%
2.6%
23Remittances to Latin America and the Caribbean in 2016
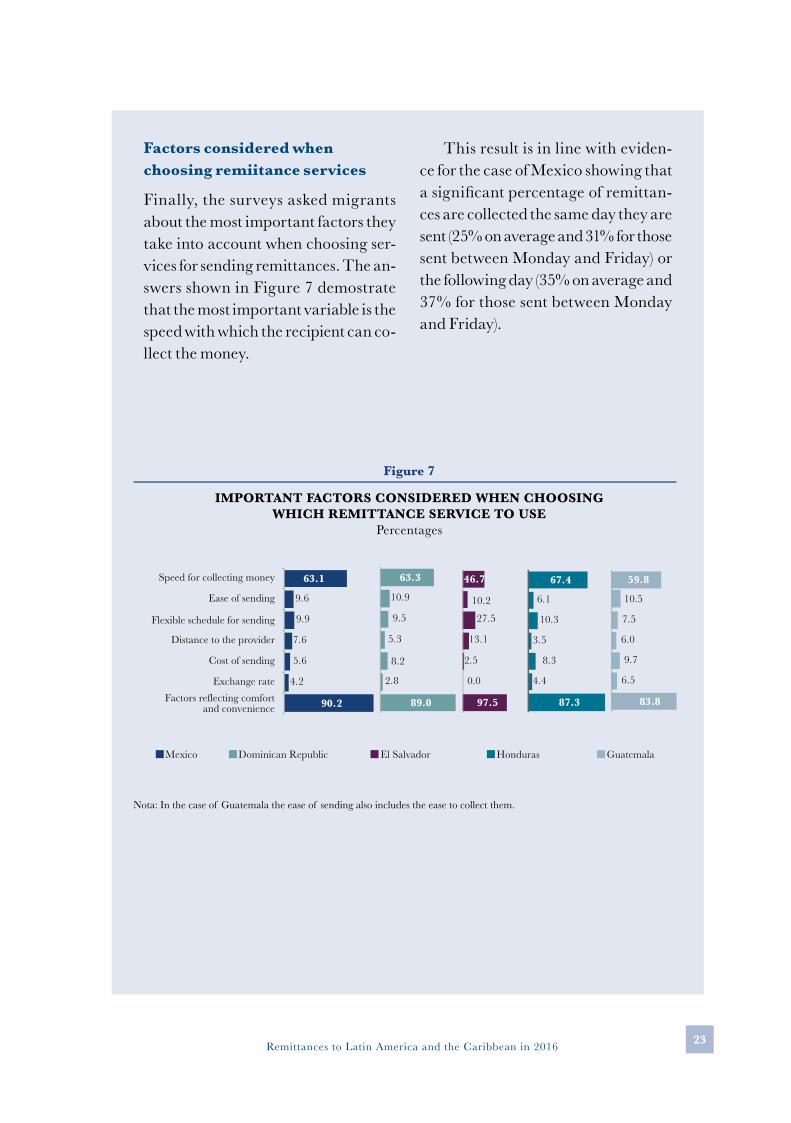
Factors considered when choosing remiitance services
Finally, the surveys asked migrants about the most important factors they take into account when choosing ser-vices for sending remittances. The an-swers shown in Figure 7 demostrate that the most important variable is the speed with which the recipient can co-llect the money.
This result is in line with eviden-ce for the case of Mexico showing that a significant percentage of remittan-ces are collected the same day they are sent (25% on average and 31% for those sent between Monday and Friday) or the following day (35% on average and 37% for those sent between Monday and Friday).
IMPORTANT FACTORS CONSIDERED WHEN CHOOSINGWHICH REMITTANCE SERVICE TO USE
Percentages
Figure 7
Nota: In the case of Guatemala the ease of sending also includes the ease to collect them.
63.1
9.6
9.9
7.6
5.6
4.2
90.2
Speed for collecting money
Ease of sending
Flexible schedule for sending
Distance to the provider
Cost of sending
Exchange rateFactors reflecting comfort
and convenience
63.3
10.9
9.5
5.3
8.2
2.8
89.0
46.7
10.2
27.5
13.1
2.5
0.0
97.5
67.4
6.1
10.3
3.5
8.3
4.4
87.3
59.8
10.5
7.5
6.0
9.7
6.5
83.8
Mexico Dominican Republic El Salvador Honduras Guatemala

May, 201724
Migration of people from Latin America and the Caribbean to Spain and, in turn, the amount of remittances they send, are linked to economic conditions in the host country. The labor market in Spain for migrant workers from Latin America and the Caribbean countries has recently, since the end of 2015, been showing signs of recovery. This can be seen in growth rates during 2016 that reached 2.4% as compared to the previous year, with which the number of migrant workers amounted to just over one million, a figure still be-low that seen in 2009 when it was around two million.
Of the total number of migrants from the region in Spain, 58.6% are employed and the remainder unemployed. It can be inferred from this information that employment in 2016 recorded a growth rate of 5.7% on the previous year, while unemployment decrea-sed by 1.6%.
Although no data is available on the wages of Latin American and Caribbean migrants in Spain, it is known that they mostly work in the construction (men) and service (women) industries. Hence, wages in these industries in Spain can provide an approximation of the changes in income of lac workers in that country. In this regard, wages in the cons-truction industry in 2016 fell by 4.4% compared to the previous year, while wages in the services industry fell 1.9% (Figure 10).
The still modest recovery of migration and employment levels among lac migrants in Spain, together with falling wages in the industries where they work, mostly explain the smaller growth in remittances received by South American countries, which to a great extent come from this part of the world.
At the Origin – Latin America and the Caribbean
The state of the economy, particularly exchange rates and inflation, in countries recei-ving remittances affects the purchasing power of the families benefitting from such flows. Furthermore, given that most of these transfers are used for everyday expenses, it also affects the amounts that migrants decide to send.
With regards to exchange rates, remittances are sent in foreign currency (US dollars, Euros or others) and need to be exchanged into local currency3 before they can be spent by the recipients. Thus, changes in local prices affect the purchasing power of the fami-lies receiving these transfers.
In this regard, figures for exchange rates in the region indicate that the aggregate va-lue4 of currencies in Latin America and the Caribbean has depreciated by 10.8%. This, in combination with the growth observed in remittances, allowed beneficiaries to receive remittance amounts in local currency up to 18.2% higher than those received in the pre-vious year. The largest depreciations were registered in Mexico (19.4%) and countries of the
3 Except in those countries where the dollar is a commonly-used currency.4 Regional and subregional figures for the deprecation or appreciation of local currencies were calculated by weighting variations in the value of remittances in local currency in each country, in regard to participa-tion in regional and subregional remittance flows.

25Remittances to Latin America and the Caribbean in 2016
Figure 10EMPLOYMENT AND WORKFORCE IN SPAIN (2009-2016)
Annual percentage variations
Source: Authors’ elaboration based on figures from the Spanish Statistics Institute (INE).
– 30%
– 20%
– 10%
0%
10%
20%
30%
40%
50%
60%
I II III IV I II III IV I II III IV I II III IV I II III IV I II III IV I II III IV I II III IV2009 2010 2011 2012 2013 2014 2015 2016
Population of Working Age in Spain of LAC Origin Employed Population in Spain of LAC OriginUnemployed Population in Spain of LAC Origin
Figure 11MONTHLY WAGES IN SPAIN BY SECTOR (2006-2016)
Euros per month
1 2016 is only for the first three quarters.Source: Authors’ elaboration based on figures from the Spanish Statistics Institute (INE).
1,30
0
1,35
3
1,42
4
1,50
3
1,58
3
1,62
2
1,67
2
1,75
5
1,87
2
1,98
5
2,00
1
2,07
4
2,12
5
2,12
5
2,13
6
2,11
2
2,01
8
1,53
2
1,59
1
1,64
7
1,71
6
1,78
3
1,83
9
1,96
8
2,06
2
2,22
5
2,34
2
2,37
6
2,42
3
2,40
8
2,41
7
2,42
9
2,47
0
2,42
4
0
500
1,000
1,500
2,000
2,500
3,000
3,500
4,000
4,500
5,000
2000 2001 2002 2003 2004 2005 2006 2007 2008 2009 2010 2011 2012 2013 2014 2015 20161
Construction Services
May, 201726
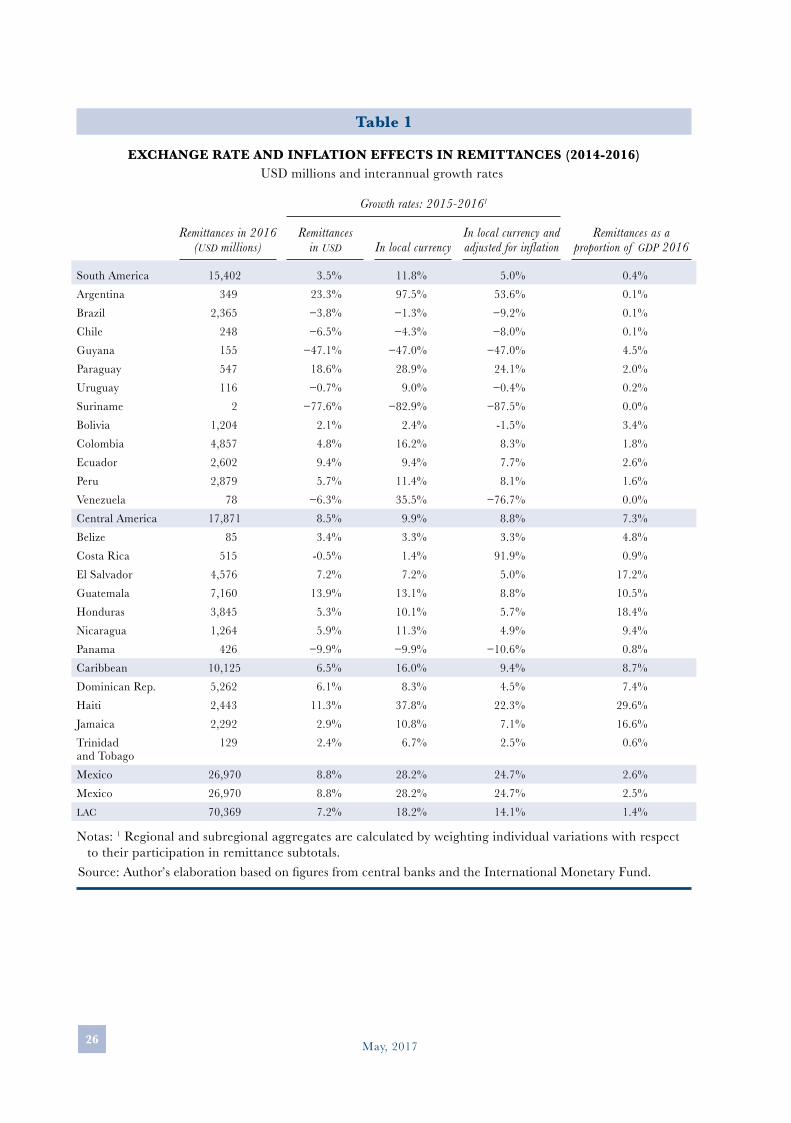
Table 1
EXCHANGE RATE AND INFLATION EFFECTS IN REMITTANCES (2014-2016)usd millions and interannual growth rates
Remittances in 2016 (usd millions)
Growth rates: 2015-20161
Remittances as a proportion of gdp 2016
Remittances in usd In local currency
In local currency and adjusted for inflation
South America 15,402 3.5% 11.8% 5.0% 0.4%Argentina 349 23.3% 97.5% 53.6% 0.1%Brazil 2,365 −3.8% −1.3% −9.2% 0.1%Chile 248 −6.5% −4.3% −8.0% 0.1%Guyana 155 −47.1% −47.0% −47.0% 4.5%Paraguay 547 18.6% 28.9% 24.1% 2.0%Uruguay 116 −0.7% 9.0% −0.4% 0.2%Suriname 2 −77.6% −82.9% −87.5% 0.0%Bolivia 1,204 2.1% 2.4% -1.5% 3.4%Colombia 4,857 4.8% 16.2% 8.3% 1.8%Ecuador 2,602 9.4% 9.4% 7.7% 2.6%Peru 2,879 5.7% 11.4% 8.1% 1.6%Venezuela 78 −6.3% 35.5% −76.7% 0.0%Central America 17,871 8.5% 9.9% 8.8% 7.3%Belize 85 3.4% 3.3% 3.3% 4.8%Costa Rica 515 -0.5% 1.4% 91.9% 0.9%El Salvador 4,576 7.2% 7.2% 5.0% 17.2%Guatemala 7,160 13.9% 13.1% 8.8% 10.5%Honduras 3,845 5.3% 10.1% 5.7% 18.4%Nicaragua 1,264 5.9% 11.3% 4.9% 9.4%Panama 426 −9.9% −9.9% −10.6% 0.8%Caribbean 10,125 6.5% 16.0% 9.4% 8.7%Dominican Rep. 5,262 6.1% 8.3% 4.5% 7.4%Haiti 2,443 11.3% 37.8% 22.3% 29.6%Jamaica 2,292 2.9% 10.8% 7.1% 16.6%Trinidad and Tobago
129 2.4% 6.7% 2.5% 0.6%
Mexico 26,970 8.8% 28.2% 24.7% 2.6%Mexico 26,970 8.8% 28.2% 24.7% 2.5%lac 70,369 7.2% 18.2% 14.1% 1.4%
Notas: 1 Regional and subregional aggregates are calculated by weighting individual variations with respect to their participation in remittance subtotals.
Source: Author’s elaboration based on figures from central banks and the International Monetary Fund.
27Remittances to Latin America and the Caribbean in 2016
Caribbean (9.1%) and South America (7.5%), especially in Argentina (69.9%), Venezuela (41.8%) and Haiti (25.8%). Earnings in remittances due to the depreciation of the exchan-ge rate were more significant in said regions.
Furthermore, inflation in the remittance recipient economies decreases the purcha-sing power of beneficiary families i.e. they can purchase less with the money they receive. In this regard, aggregate inflation5 across the region was 4.1% in 2016. If the impact of in-flation is combined with currency depreciation, the purchasing power of remittance reci-pients is 14.1% higher than the previous year. At the subregional level, Mexico registered the largest growth in the purchasing power of families receiving remittances (24.7%), whi-le in Central America and the Caribbean the growth of remittances combined with the depreciation of their currencies and inflation led to a net increase of 8.8% in purchasing power and slightly less in South America where the growth of purchasing power was 5.0%.
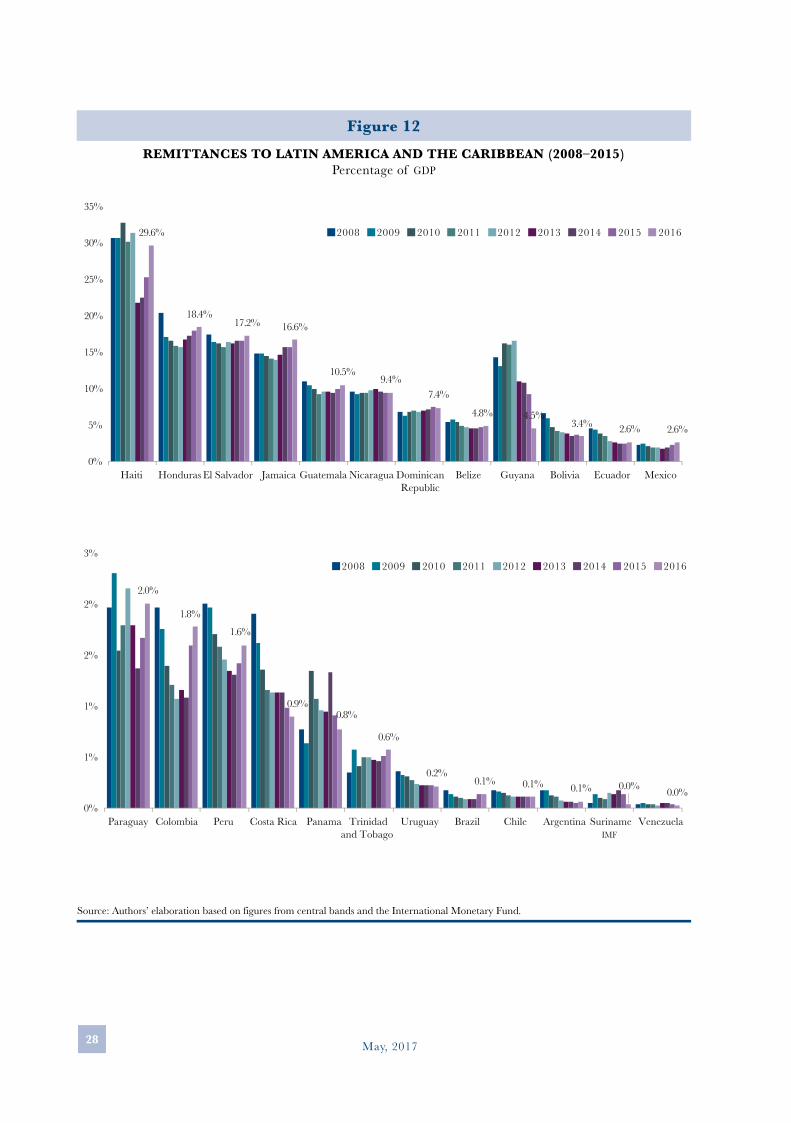
Remittances are a very significant source of foreign currency for many countries in the region, which is reflected by their importance as a percentage of gross domestic product (gdp), and the role they play in improving standards of living among the millions of fa-milies that benefit from them. In El Salvador and Honduras one in five families, and one in six families, respectively, depend on receiving remittances6. Hence, in countries such as Haiti, Honduras, El Salvador, Jamaica and Guatemala, income from remittances was between 10% and 29% of gdp in 2016.
According to recent observations, the significance of remittances in relation to gdp con-tinues to grow at a slow rate in most of the countries of Latin America and the Caribbean. This increase is coherent with the growth observed in such flows, with few exceptions such as Guyana, Bolivia, Costa Rica, Panamá, Uruguay and Venezuela, where the weight of remittances in the gdp seems to have decreased slightly.
3. REMITTANCE INCOME FOR THE GROUP OF LATIN AMERICAN AND CARIBBEAN COUNTRIES WILL SET A NEW RECORD IN 2017
As mentioned in Section 1 of this paper, remittances received by lac countries during 2016 set a new record of usd 70.4 billion, resulting from an annual increase of 7.2%. It should be mentioned that said rate was highly influenced by the significant increases re-corded in the last few months of 2016 in the remittances received by Central American and Caribbean countries and Mexico, which mainly originate from the United States.
5 Regional and subregional inflation figures were calculated by weighting variations in the consumer price indexes of each country in regard to participation in regional and subregional remittance flows. Los datos regionales y subregionales de inflación se calcularon ponderando las variaciones del índice de precios al consumidor de cada país, con relación a cada una de las participaciones en los flujos de remesas regionales y subregionales.6 Remittance Recipients in Honduras: A Socioeconomic Profile. Lukas Keller and Rebeca Rouse, mif, 2015.
May, 201728
Figure 12REMITTANCES TO LATIN AMERICA AND THE CARIBBEAN (2008–2015)
Percentage of GDP
Source: Authors’ elaboration based on figures from central bands and the International Monetary Fund.
29.6%
18.4% 17.2% 16.6%
10.5% 9.4%
7.4%
4.8% 4.5% 3.4% 2.6% 2.6%
0%
5%
10%
15%
20%
25%
30%
35%
Haiti Honduras El Salvador Jamaica Guatemala Nicaragua DominicanRepublic
Belize Guyana Bolivia Ecuador Mexico
2008 2009 2010 2011 2012 2013 2014 2015 2016
2.0%
1.8%
1.6%
0.9% 0.8%
0.6%
0.2% 0.1% 0.1% 0.1% 0.0% 0.0%
0%
1%
1%
2%
2%
3%
Paraguay Colombia Peru Costa Rica Panama Trinidadand Tobago
Uruguay Brazil Chile Argentina SurinameIMF
Venezuela
2008 2009 2010 2011 2012 2013 2014 2015 2016

29Remittances to Latin America and the Caribbean in 2016
The uncertainty that prevailed during said period regarding the harder line the new U.S. administration was likely to follow on immigration policies coupled with the an-nouncement that remittances might be sub-ject to a tax, suggest the referred behavior of remittances could partly be responding to the fact that some migrants sent their re-mittances in advance, or might even have sent part of their savings to their countries of origin. Thus, the increase observed in remittances during 2016 would not only be the result of the favorable evolution of its natural determinants in the United States (employment and wages among the immi-grant population, and the exchange rate), but also of prevailing uncertainty during that period.
For 2017, the growth rate of remittan-ces received by lac countries is expected to slow as a result of the following factors: i) although there is still no information on the evo-lution of migration flows to the United States so far this year, indicators exist which show these have been decreasing since 2015; ii) Changes to immigration policies announced by the new US administration have still not been established, meaning it is not possible to estimate their likely impact on remittance flows originating from that country;7 and, iii) Forecasts from the International Monetary Fund (imf) show a decrease in the growth rate of the Spanish economy and a modest economic recovery in the United States in 2017 as compared to 2016.8 However, it should mentioned that the imf states that the forecast for the United States is subject to several potential risks that could lead to lower growth rates. In addition, the imf forecast for economic activity in the South American region during 2017 is for an expansion of just 0.6% (Table 2), which could affect intraregional migration flows between countries of this subregion and, thereby, intraregional remittance flows.9
7 A hardening of immigration policies in the United States could have the initial effect of increasing remittances from that country as such policies will lead to the repatriation of a significant number of migrants and an advance in the remittances they send. However, it could later have the opposite effect by reducing the size of the migrant population in that country.8 As mentioned in Section 2, the United States is the main destination for migrants from lac, followed by Spain, and is therefore the principal origin of remittances received by the region.9 Section 2 refers to the importance of intraregional remittances in some lac countries.
Table 2
REAL GROSS DOMESTIC PRODUCTAnnual percentage variations
2016 20171
United States 1.6 2.3Spain 3.2 2.6Canada 1.4 1.9Mexico 2.3 1.7South America −2.7 0.6
Argentina −2.3 2.2Brazil −3.6 0.2Colombia 2.0 2.3Venezuela −18.0 −7.4
1 EstimateSource: World Economic Outlook April 2017-
International Monetary Fund.

May, 201730
Figure 13INCOME FROM REMITTANCES IN LATIN AMERICA AND THE CARIBBEAN
USD Thousands of millions
1EstimateSource: Authors’ elaboration based on figures from central banks, the World Bank and the International Monetary Fund.
22.125.7
38.6 40.0
47.3
56.260.1 60.9
53.6 55.5 58.8 59.3 59.462.0
65.770.4
73.6 - 74.3
2001 2002 2003 2004 2005 2006 2007 2008 2009 2010 2011 2012 2013 2014 2015 2016 20171
Based on the above, it is estimated that in 2017 income from remittances in the lac re-gion will set a new record, amounting to between usd 73.6 and 74.3 billion as a result of an annual increase of between 4.5% and 5.5% (Figure 13). Said rate would represent slower growth compared to that observed in 2016 (7.2%) as a result of the factors mentioned above.
Taking into account the groups of lac countries in the subregions referred to previously in this paper, it is estimated that the growth rate of remittances received by said regions will slow compared to that observed in 2016. In particular, in the areas of Central America, the Caribbean and South America inflows from remittances will register annual increases of between 6% to 7%, 4.5% to 5.5%, and 2.5% to 3.5%, respectively. Meanwhile, in the case of Mexico, the growth rate of remittances is estimated to be between 5% and 6% (Table 3).

31Remittances to Latin America and the Caribbean in 2016
Table 3
INCOME FROM REMITTANCES IN LATIN AMERICA AND THE CARIBBEAN
lac Mexico Central America Caribbean South America
usd million
2005 47,340 21,688 8,965 5,542 11,145
2006 56,183 25,567 10,800 6,217 13,599
2007 60,134 26,059 11,990 6,941 15,144
2008 60,856 25,145 12,528 7,349 15,834
2009 53,613 21,306 11,273 6,960 14,074
2010 55,483 21,304 11,984 7,846 14,349
2011 58,841 22,803 12,643 8,414 14,981
2012 59,112 22,438 13,549 8,686 14,439
2013 59,450 22,303 14,260 8,289 14,598
2014 62,019 23,647 15,454 8,834 14,084
2015 65,650 24,785 16,471 9,508 14,886
2016 70,370 26,972 17,871 10,125 15,402
2017* 73.6 - 74.3 28.3 - 28.6 18.9 - 19.1 10.6 - 10.7 15.8 - 15.9
Annual Percentage Variations
2006 18.7 17.9 20.5 12.2 22.0
2007 7.0 1.9 11.0 11.6 11.4
2008 1.2 -3.5 4.5 5.9 4.6
2009 -11.9 -15.3 -10.0 -5.3 -11.1
2010 3.5 0.0 6.3 12.7 2.0
2011 6.1 7.0 5.5 7.2 4.4
2012 0.5 -1.6 7.2 3.2 -3.6
2013 0.6 -0.6 5.2 -4.6 1.1
2014 4.3 6.0 8.4 6.6 -3.5
2015 5.9 4.8 6.6 7.6 5.7
2016 7.2 8.8 8.5 6.5 3.5
2017* 4.5 - 5.5 5.0 - 6.0 6.0 - 7.0 4.5 - 5.5 2.5 - 3.5
1 Estimate in usd billion and percentages.Source: Authors’ elaboration based on figures from central banks, the World Bank and the International
Monetary Fund.

Program of Remittances & Financial Inclusionwww.cemla.org/remesas-if