remittances and poverty in albania - lunds … · remittances and poverty in albania by ... wb:...
TRANSCRIPT

REMITTANCES AND POVERTY IN ALBANIA
by
Erudita Hoti
NATIONALEKONOMISKA INSTITUTIONEN VID LUNDS UNIVERSITET
Department of Economics at the University of Lund
2009:6
Minor Field Study Series
No. 192 Mailing address: ISSN 0283-1589 Nationalekonomiska Institutionen Box 7082 S-220 07 LUND Sweden

REMITTANCES AND POVERTY IN ALBANIA
Erudita Hoti
Bachelor thesis in Economics, April 2009
Supervisor: Yves Bourdet

2
Abstract
With increasing labor and capital mobility in the world, remittance flows have risen
significantly to become the second source after FDI of external funding for developing
countries. Remittances are now viewed by many development practitioners as an important
development tool for recipient countries. This paper studies the impact of remittances on
poverty in Albania – one of the top 20 remittance-receiving countries in the world. It is found
that remittances have a significant impact on the reduction of absolute poverty in the country
by directly raising household income and consumption. However, since emigration is costly,
remittances do not reach the poorest individuals, which can have a negative impact on
inequality. Moreover, there seems to be a high degree of dependency on remittances in
Albania, both on the micro and macro level. Therefore, the sustainability of this source of
income is of special concern.
Key words: Remittances, poverty, inequality, migration, trade balance, consumption

3
Acknowledgements
I wish to give my very special thank you to SIDA for providing me the opportunity to do this
field study in Albania. I thank my supervisor Yves Bourdet for his continuous advice and
support and most importantly for helping me turn an idea into action. My sincerest gratitude
goes to the staff of CESS Albania, Mr. Ilir Gedeshi, Egest Gjokuta and Nadire Xhaxho for
welcoming and hosting me in their institute during my stay in Albania, as well as guiding and
helping me to collect relevant data and giving me access to the internal sources of the
institute.

4
Table of contentsAbstract……………………………………………………………………………………………2
Acknowledgements……………………………………………………………………………….3
Table of contents…………………………………………………………………………………4
List of abbreviations……………………………………………………………………………..5
Tables and figures……………………………………………………………………………….6
TABLE OF CONTENTS.............................................................................................................................. 4
1. INTRODUCTION.................................................................................................................................... 7
1.1 Background...................................................................................................................................... 71.2 Purpose............................................................................................................................................ 81.3 Data……… ...................................................................................................................................... 81.4 Disposition.......................................................................................................................................8
2. REMITTANCES AND POVERTY - THEORETICAL CONSIDERATIONS AND PREVIOUS STUDIES .....................................................................................................................................................10
2.1 Motives and Determinants of Remittances .................................................................................... 102.2 Use of remittances ......................................................................................................................... 122.3 The impact of remittances on poverty and inequality .................................................................... 142.4 The impact of remittances on the overall economy ....................................................................... 17
3. MIGRATION IN ALBANIA ................................................................................................................. 20
3.1 An overview from 1990 onwards ...................................................................................................203.2 Structure and profile of migrants .................................................................................................. 213.3 Motives and characteristics of Albanian Migration ...................................................................... 23
4. REMITTANCES IN ALBANIA, DEVELOPMENT AND PATTERNS ...........................................25
4.1 Trends ............................................................................................................................................ 254.2 Motives and characteristics of remittances ...................................................................................274.3 Transfer channels .......................................................................................................................... 28
5. POVERTY IN ALBANIA–INCIDENCE, SPATIAL DISTRIBUTION AND CHARACTERISTICS...................................................................................................................................................................... 30
5.1 Poverty and poverty measures....................................................................................................... 305.2 Poverty trends in Albania .............................................................................................................. 32
6. REMITTANCES AND POVERTY IN ALBANIA .............................................................................. 37
6.1 Distribution of remittances ............................................................................................................ 376.2 Use of remittances ......................................................................................................................... 396.3 Impact of remittances on poverty .................................................................................................. 416.4 Impact of remittances on inequality .............................................................................................. 456.5 Indirect effects of remittances........................................................................................................ 466.6 Current issues regarding the impact of remittances on the Albanian economy ............................ 49
7. SUMMARY AND CONCLUSIONS...................................................................................................... 50
REFERENCES............................................................................................................................................ 52

5
List of abbreviations:
BOA: Bank of Albania
CESS: Center of Economic and Social Studies
ETF: European Training Foundation
FDI: Foreign Direct Investment
GDP: Gross Domestic Product
IMF: International Monetary Fund
INSTAT: Institute of Statistics
IOM: International Organization of Migration
LDC: Less Developed Countries
LSMS: Living Standard Measurement Survey
MTO: Money Transfer Operators
ODA: Official Development Assistance
WB: World Bank
List of Tables
Table 1: The remittance system: determinants and intermediate effects
Table 2: Studies on the impact of remittances on poverty and inequality
Table 3: Main Countries of Destination for Albanian Emigrants
Table 4: Remittances of Albanian emigrants, million USD, Total, formal and informal
channels, 1994-2004
Table 5: Absolute poverty by urban-rural 2005
Table 6: Absolute poverty by regions 2005
Table 7: Percentage of households receiving Ndihma Ekonomike by Poverty status
and region, Poor includes Extreme poor
Table 8: Income inequality 2005, National, Rural and Urban
Table 9: Poverty indicators and migrant households
Table 10: Perceptions on the remittance impact on the households’ financial
Situation
Table 11: Contribution of Capital Sources for the Establishment of Firms in Albania
6
List of Figures:
Figure 1: Volume of Remittances in relation to FDI, Foreign Aid and Trade Deficit
Figure 2: Remittances in GDP formation, 1993-2005
Figure 3: Absolute poverty by urban-rural 2005
Figure 4: Absolute poverty by regions 2005
Figure 5: Poverty reduction by Stratum, 2002-2005
Figure 6: % of households receiving remittances by region, 2005
Figure 7: Average amount remitted to household (at 2005 prices, leks), 2005
Figure 8: Use of remittances, 2005
Figure 9: Households perceptions about their financial situation
Figure 10: Households perceptions about their financial situation compared to others
Figure 11: Number of Migrants and Remitters, and % of Remitters by Quintile (per
capita expenditure net of remittances)
Figure 12: Mean amount remitted by quintile
Figure 13: Remittances in relation to trade balance, 1996-2005

7
1. Introduction
1.1 Background
As globalization has eased labor and capital mobility remittance flows have increased
immensely, to become the second source after FDI1 of external funding for developing
countries. Remittances are defined as the portion of international migrant workers’ earnings
sent back from the country of employment to the country of origin.2
The growing importance of remittances as a source of foreign exchange is reflected in the fact
that remittance growth has outpaced private capital flows and ODA over the last decade3,
going up from 31.2 billion USD in 1990 to 166.9 billion USD in 2005. This phenomenon has
turned great attention to the causes and effects of international migration and remittances,
both in the migrant source and destination country. Earlier literature on remittances has
emphasized their negative impacts and cautioned against the possible damaging effects of
labor migration and remittance sending, arguing that remittances, being compensatory, are
mainly spent on consumer goods instead of productive investment and thus create a culture of
dependency which undermines the prospects for development. Recently, development
practitioners have viewed remittances as having an important role to play in the development
efforts of recipient countries. This opens up a debate abut possible mechanisms that could be
developed or improved to maximize the positive development impacts from remittances. Such
policy implications are especially interesting for developing country governments.
With an annual inflow of remittances amounting to 14% of its GDP4, Albania is ranked
among the top 20 remittance recipient countries in the world.5 From 1994 to 2002 the
Albanian economy experienced the fastest rise in real GDP in Eastern Europe.6 During the
same period, the country experienced a massive outflow of labor, with some 25% of the
population living and working abroad by the end of 2005.7 At the same time, remittances
received showed an upward trend. Studies by the World Bank, IMF and INSTAT show a
positive relationship between remittances received from migrant workers and poverty
1 Ratha (2003), page 202 Russell (1986), page 6773 World Bank (2006), page 884 World Bank (2007)5 World Bank (2006), page 906 Korovilas (2005) , page 1767 Gedeshi (2006), page 113

8
reduction in the country. However, the sustainability of this source of finance is put into
question.
1.2 Purpose
The purpose of this field study and the thesis itself is to evaluate the impact of remittances on
poverty in Albania.
The questions I will seek to answer are:
- What is the magnitude of remittances in Albania?
- How are remittances distributed across the country?
- What are remittances spent on?
- Which transfer channels are most commonly used?
- How do remittances affect: 1. Absolute poverty; 2. Relative poverty and 3. inequality
in Albania?
1.3 Data
This study is based on secondary sources, mainly from the nationally representative
household survey – LSMS 2005- carried out by INSTAT in collaboration with the WB, as
well as household surveys/studies undertaken by CESS, which is also the most experienced
institute in the field in Albania. Other sources of information are the Bank of Albania, from
where I have collected macro-economic indicators as well as figures on the magnitude of
remittances. The description of migration patterns and characteristics are mainly based on
data from IOM but also from previous studies on remittances’ impact on the Albanian
economy/society. I have found no available data on poverty patterns previous to 2002. The
most comprehensive data on poverty reduction comes from the World Bank poverty
assessment 2002-2005, which is used as a basis when explaining poverty trends.
1.4 Disposition
This paper is disposed in the following way: The first chapter gives an introduction to the
phenomenon of remittances and why this is relevant to Albania. In chapter two follows a brief
review of the theoretical approaches to the causes and consequences of remittances. Some of
9
the best known empirical studies on the effect of remittances on poverty and inequality are
summarized in this chapter. Background information on migration trends and migrant profile
in Albania is presented in chapter three. Chapter four looks at the characteristics of
remittances in Albania and their magnitude since 1990 onwards. In chapter five poverty
measures that will be used in the analysis are discussed, followed by a description on poverty
patterns and poverty reduction in the country. An integrated analysis on poverty and
remittances is carried out in chapter six. The impact of remittances on absolute and relative
(perceived) poverty is discussed, and lastly some of the indirect effects of remittances on the
macroeconomic level are outlined. The paper ends with a conclusion in chapter seven.

10
2. Remittances and poverty - Theoretical considerations and previous studies
The theoretical and empirical literature on remittances focuses mainly on three aspects:
1. The causes of remittances (motives and determinants)
2. The use of remittances
3. The impact of remittances on the economy
Data on remittances is mainly micro-data based on household surveys, and results of their
effects are quite variable depending on setting, country or migrant group studied. This hinders
general inference. Moreover, measuring remittances is a difficult task since most of the
money remitted goes through informal channels and is not recorded in official accounts.
2.1 Motives and Determinants of Remittances
The basis for the current discussion and extensions on motives that migrants have to remit
was set by Stark and Lucas in 1985. Drawing conclusions from studies made on a household
level in Botswana, they suggested the main motives to be “pure altruism”, “pure self-interest”
and “tempered altruism or enlightened self-interest”. The most common and most accepted
motive for remitting money back home is what is known as altruism- the migrants concern
about the well being of the family members left behind in the home country. The migrant
cares about the financial situation of the family, receives positive utility from consumption
and welfare of the family and consequently sends remittances. The altruistic model advances
a number of hypotheses. First, the amount of remittances should increase with the migrant’s
income. Second, the amount of remittances should decrease with an increase in the family
income. And third, remittances should decrease over time as the attachment to the family
gradually weakens.8 In contrast to altruism, pure self interest is shown to be another motive to
remit. The migrant’s behavior is in this case driven by the desire to inherit family assets or to
insure that those left behind are taking care of his/her assets back home. It can also be that
after a certain period of time, the migrant intends to return home, and thus remits money to
accumulate assets as an investment for the future. These two motives to remit are not
mutually exclusive. Often, the case lies somewhere between these two extremes. Therefore
8 OECD (2005), page 16

11
Lucas and Stark (1985) developed a new model to explain the motivation to remit, called
“tempered altruism” or “enlightened self interest”. In this model the migrant and the family at
home mutually benefit from migration, through some kind of implicit contractual agreement.
For a household as a whole, there may be a Pareto-superior strategy to allocate certain
members as migrants, and remittances should be the mechanism for redistributing the gains.9
Stark (1991), as well as Agarwal and Horowitz (2002) and Guibert (2002), suggest that the
family can function as an insurance company that provides members with protection against
income shocks by diversifying the sources of income. On the other hand, Poirine (1997) and
Ilahi and Jafarey (1999) model the family as a bank that finances migration for some
members. The borrowers remit funds in order to repay the loans, which are put toward more
loans to further the interests of other individual family members.10
So far only microeconomic determinants of remittances have been considered, but in order to
have an encompassing view of the remittances situation, macroeconomic determinants need
also to be mentioned. To clarify the intermediate relationships between the determinants and
effects of remittances, Russell (1986) set out a framework of factors that affect: the total pool
of remittance income, the decision whether or not to remit, the amount to remit, the way to
remit and the uses of remittance incomes. The macroeconomic factors in this framework are:
number of workers, wage rates, economic activity in host country, economic activity in
sending country, exchange rate, relative interest rate between labor-sending and receiving
countries, political risk factors in sending country and facility of transferring funds. Below
follows Russell’s model of a remittance system where these determinants are listed and the
expected direction of the relationship between them and the five “intermediate effects” of
remittance are specified. As can be seen, microeconomic factors are also included in this
framework.
9 Ibid, page 1710Quoted by Chami, Fullenkamp, Jahjah (2003), page 6

12
Table 1 The remittance system: determinants and intermediate effects
POTENTIAL DETERMINANTS OF REMITTANCES
Expected direction of relationship
Available pool of remittances
Decision to remit or not
How to remit
Amount to remit
Uses
Number of workers
Wage rates Economic activity in Host country
Economic activity in sending country
Exchange rate
Relative Interest rate between labour-sending and receiving countries
Political risk factors in sending country
Facility of transferring funds
Ratio of females in population in host country
Years since out migration Household income level Employment of other household members
Marital status
Level of education
Occupational level of migrants
+
+/-
+
+
+/-
+/-
-
+
-
+/-
-
-
+
-
-
X
X
X
X
?
X
X
X
X
X
X
X
X
X
X
X
X
X
X
?
X
X
X
X
X
X
X
X
X
XT>
?
X
X
Source: Russell (1986) “Remittances from international migration: A review in perspective”, World Developmenf. Vol. 14. page 679
2.2 Use of remittances
The empirical evidence on the use of remittances is quite diverse and even contradicting,
mainly because the studies on this issue only consider one country at a time. The way in
which remittances are used is what determines their effect on the economy. So if remittances
go to productive investment, education and health they have positive growth effects through
increased output and productivity. If they on the other hand are only spent on consumption
their effects depend on wether the consumed goods are locally produced or imported. If they
are locally produced, a multiplier effect is generated and remittances thus have an indirect

13
contribution to growth by encouraging investment in related industries. But, if they are spent
on imported consumer goods, besides the positive multiplier effect on the economy they also
tend to have a negative effect on the balance of payments. We stated earlier that the primary
motive for remitting money is altruism. This directly implies that remittances are
compensatory income for remittance receivers (they increase when receiver’s income
decreases). It is thus logical to assume that most remittances are mainly spent on consumption
of daily necessities (consumer goods). This is supported by numerous studies: From a
household survey in 22 Mexican communities Massey and Parrado (1994) found that two
thirds of remittances go to consumption- mainly on food and maintenance followed by
housing.11 Similar spending patterns are found by Glytsos (1993)12 for Greece and Gilani
(1981)13 for Pakistani households.
Some literature on remittance use also shows that a significant part of remittances go to
investments and savings. For example: in a case study in the Fuijan province of China (the
home town of half a million international migrants), Zhu finds that migrants are core agents in
the development of the region, mainly through investments in physical and human capital. It
is well documented in numerous studies that the dramatic development of China in the last
decades has mainly been concentrated along its coastal areas. Although this may be attributed
to many factors, including its favorable location, it is noteworthy that Chinese overseas and
Chinese in Hong Kong, Macao and Taiwan have been the major sources of foreign investment
in China.14
In a study based on the Pakistan rural household survey (PRHS) 2001-2002 Mausuri finds
that remittances are indeed invested in physical capital such as farm machinery and
agricultural land, tractors and tube wells, as well as human capital such as schooling and early
childhood growth.15 Egypt is another example where remittances have been used in
investment and productive activities. Return migrants are responsible for 15% of the capital
invested in small enterprises and 15% of the associated employment generation.16 As far as
savings are concerned, development theory maintains that the propensity to save out of
transitory income is higher than the propensity to save out of permanent income (see for
example Gersovitz, 1988). Ample empirical evidence shows that saving out of remittances,
11 Massey, Parrado (1994)12 Glytsos (1993)13 Gilali (1981)14 Zhu (2006), page 16915 Mansuri (2007)16 Wahaba (2005), page 188

14
which are considered as temporary income, is indeed much higher than savings from regular
earnings in the home country.17
The pessimistic view on migrants’ role in development (Hugo 1998:146, Massey et al 1998)
argues that because the majority of remittances are used for consumption, they are not
considered as being used in productive investment. However, not only directly invested
remittances should be considered as investments. Expenditure on education and health are in
fact investments in human capital and are very likely to increase productive capacity in the
long run. Moreover, if remittances are saved in financial intermediaries they are loaned to
investors, thus indirectly contributing to productive investment. An important characteristic of
remittances is that they are fungible by nature – they free up other resources. So even if
remittances are not directly used for investment by the households receiving this money, they
can free the households’ other resources to finance investment.
Having said that altruism and self interest are the main determinants of remittances and that
remittances are used primarily for the provision of basic needs but also invested in productive
activities, there is no doubt that remittances improve the standards of living for the receiving
households. The critical question is wether they have a positive growth/development effect on
the receiving economy as a whole.
2.3 The impact of remittances on poverty and inequality
There exist two extreme views on the relation between remittances and poverty, an optimistic
and a pessimistic view. Proponents of the optimistic view argue that migration reduces
poverty in the labor exporting areas by shifting the population from a low income rural sector
into a relatively high-income urban economy. Remittances improve the standards of living for
the receiving households and if the migrants are from poor households remittances contribute
to poverty alleviation. The pessimistic scenario accepts that households involved in migration
benefit but these beneficiaries may not include the poor. This because the poor households
face constraints to migration- such as high costs and risk. The migrants are thus more likely to
come from middle and high income groups and only contribute to the widening of income
gaps. Further, if remittances are spent on imported goods migration can affect local
17 Glytsos (2002), page 14

15
production and decrease the income of the poor, consequently increasing poverty and
inequality.
Below follows a summary table of 10 studies which, through different methods analyze the
impact of remittances on poverty and inequality.
Table 2: Studies on the impact of remittances on poverty and inequality
Author/s, Year, Country/area
Method Results
Richard H., Adams Jr., John Page2003,74 low & middle income countries
Cross country regression. Uses 3 poverty measures: Poverty headcount, poverty gap, squared poverty gap. Gini coefficient is used to measure inequality.
Estimates for the poverty headcount measure indicate that a 10% increase in the share of remittances in country GDP will lead to a 1.6% decline in the share of people living below the poverty line. The remaining two measures suggest that remittances have a larger effect on poverty: 10% increase in share of remittances will lead to a 2% decline in the depth and severity of poverty. Moreover, the impact of migration and remittances on poverty seems to vary according to regions of the developing world.
IMF, 2005
Cross country study (101 countries over the period 1970-2003)
The results suggest a strong link between poverty, wether measured using the poverty gap or the poverty headcount, and remittances. Though the impact may seem economically small: on average, 2.5 % increase in remittances/GDP ratio is associated with 0.5 % decrease of people living in poverty.
Lipton1980,India,
Regression analysis of data from 40 villages.
Migration increases rural inequality, both within and among villages, because pull migration allows the better off migrants to advance in better jobs, while push migration weakens the poor. Positive remittances go disproportionally to the better off townward migrants; international remitters who send back big sums are seldom from the poorest village groups. Remittances are thus unlikely to do much to reduce rural poverty.
Richard H., Adams Jr1991/1993Arab republic of Egypt
The study uses predicted income equations to estimate the changes that occur between two situations: when remittances are included in andexcluded from household income.
International remittances have a small but positive effect on poverty. The results indicate that the number of households living in poverty declines by 9.8%, when predicted per capita household income includes remittances. Remittances account for 14.7% of total income for poor households.However, when remittances are included in predicted per capita household income, inequality increases. The main reason for this is that most of the migrants came from upper-income households.
Gustafsson B.,Markonenn N.1993,Lesotho
The analysis is based on the Lesotho Household Budget Survey 1987.
Simulations for size and structure of poverty are done assuming that remittances are removed. In this case, an additional 11% to 14% of the households would be classified as poor. But the simulated increase of poverty is much higher when aspects of severity of poverty are taken into account than when

16
only the number of poor households is measured.Acosta, Calderon, Fajnzylber, Lopez,11 Latin American Countires
Household surveys and cross country regression analyses are used. Gini coefficient, 2 head count poverty indicators corresponding to extreme & moderate poverty.
With each percentage point increase in the share of remittances to GDP, the fraction of the population living in poverty is reduced by 0.4%. 9 out of 11 countries exhibit higher Gini coefficients for non-remittances incomes, suggesting that if remittances were exogenously eliminated inequality would increase.
Lopez, Cordova2004,Mexico
The study uses a cross-section of Mexicanmunicipalities and analyzes wether as the fraction of remittance-receiving households in a municipality rises, development indicators improve.
Remittances do not seem to dent the incidence of extreme poverty in a statistically significant way. This might reflect the high cost of migration which only households above some given level might be able to pay for. However, increases in the fraction of households receiving international remittances are generally correlated with better schooling and health outcomes.
Taylor, Mora, Adams, Lopez-Feldman2005,Mexico
The paper utilizes new data from the 2003 Mexico National Rural Household Survey, together with inequality and poverty decomposition techniques.
International migration slightly increases rural inequality, whereas internal migrants are income equalizers. However, both international and internal migration have equalizing effects on incomes in high-migration areas18. International migrant remittances reduce rural poverty by a greater amount than internal migrant remittances do.
Richard H., Adams Jr.2006,Ghana
Uses Ghana Living Standards Survey 1998/99. Uses econometric estimations to predict the income of households with and without remittances.
Remittances have a greater poverty-reducing effect when measured by more sensitive poverty measures: Poverty gap and squared poverty. The latter measure shows that including international remittances in household expenditure reduces severity of poverty by 34.8%.Remittances have a small impact on inequality. With the receipt of international remittances the Gini coefficient increases by 3.5%.
Richard H., Adams Jr.2004,Guatemala
The study is based on data from national household survey (7276 households). Predicted income functions are used to estimate the income status of households when remittances are included and excluded.
Remittances reduce level, depth and severity of poverty. The greatest impact is on severity – the squared poverty gap decreases by 19.8% when international remittances are included in the household income. This is because households from the lowest decile group receive a great proportion of their total income from remittances. Households in the bottom group receiving international remittances receive 60% of their total income from this source. Remittances have on the other hand little impact on income inequality. Most of the poverty reducing effects of remittances come from increases in mean per capita income rather than from any progressive change in income inequality caused by these income flows.
18 These findings reinforce the argument advanced in Stark, Taylor and Yitzhaki (1986) that expansion of migration has an initially unequalizing effect on the rural income distribution, but the diffusion of access to migration eventually makes the effect of remittances on rural incomes more equitable.
17
As can be seen, the evidence on the impacts of remittances on poverty and inequality vary
depending on country, pattern of migration and poverty measure. Generally, the correlation
between remittances and poverty reduction is positive but there seems to be an indication that
remittances have a larger effect on reducing the severity of poverty, than level of poverty. The
impacts on inequality are contradicting between studies, mainly due to the pattern of
migration. When remittances are associated with higher inequality it is mainly either because
overall migrants come from higher income groups or that those who do come from higher
income groups remit relatively greater amounts compared to the migrants from poor
households.
2.4 The impact of remittances on the overall economy
The literature shows no consensus as to whether the net effect of remittances on the receiving
country is positive or negative. Again, evidence varies among countries depending on what
mechanisms/policies exist to utilize their use, because remittances are private transfers and
market forces alone cannot channel them to productive uses. Remittances are inflows of
foreign exchange into the receiving country. Given the persistent problems in the balance of
trade in LDCs, the limited effect of foreign aid, and the difficulties of borrowing, migrant
remittances can substitute for the lack of foreign exchange. Remittances can further be used to
purchase capital goods, contributing to growth and the restructuring of the economy towards
international competitiveness. In this respect, migration in the form of remittances can be
considered as an exchange of abundant unskilled labor for scarce foreign exchange, which
renders possible the financing of those capital goods.19
The potential risk is that LDC governments see remittances as a stable source of income and
rely on them to finance deficits instead of adopting long-term economic policies to create a
competitive domestic market.20 In this line of reasoning, the instability of remittances as a
national source of income is of special concern. Birks and Sinclair (1980:1) view remittances
as unpredictable because manpower demands can presumably have wide swings. They argue
that just as remittances can rise rapidly due to a feverish build up of manpower demand, so
too there can be a steep drop in remittances due to rapid repatriation. Their decline would thus
19 Glytsos (2002), page 620 Chami,.,Fullenkamp, Jahjah (2003)

18
be due to: 1) a decline in wage rates as overheated economies cool off; 2) a decline in real
wage rates due to inflation that leaves less to send home; and 3) the propensity of workers to
settle and be joined by family and thus have less incentive to remit. Therefore, dependency on
the unpredictable remittances destroys the process of development.
Kritz and Keely (1981) question the effect of remittances on development, comparing this
dependency to drug addiction. However, proponents of international migration argue that
labor export is no more productive of dependency than export of commodities or trade in
general.21
Another macroeconomic impact stemming from remittances inflow is the appreciation of the
national currency as the total amount of money in the economy increases without affecting the
inflation rate. However, this real appreciation of the exchange rate makes the country’s
exports relatively more expensive and worsens the competitiveness of the sectors exposed to
international competition. As a result, increasing imports and decreasing exports will cause a
deficit in the external current account. This phenomenon is known as the Dutch Disease (see
Bourdet & Falck, 2006). Other negative effects include the potential impact of remittances on
inflation and wage rate. Remittances are expected to increase demand for goods and services.
If this demand is not met by responsive supply, inflation rises, sometimes to such a level as to
annihilate the positive effects of remittances on development. The increased demand may also
lead to a rise in wages and in turn shift the production to non-traded goods and, again, harm
the competitiveness of the exporting sector. The wage increase can also come from reduced
labor supply caused by increased leisure of recipients.22
As stated earlier, remittances also contribute to increased savings and investment. However,
some studies show a negative relationship between remittances and growth. Chami, R.,
Fullenkamp, C., Jahjah, S. (2003) show empirically that remittances tend to be compensatory
in nature and have a negative effect on economic growth. They also show that moral hazard
problems created by remittances can be severe enough to reduce economic activity.23
In conclusion: there are two opposing views on the impact of remittances. The negative view
which is built on four arguments: dependency, instability, developmental distortion and a
21 Keely,Tran, (1989) page 50322 Glytsos (2002) page 1823 Chami, Fullenkamp, and Jahjah (2003), page 21.Moral hazard occurs when the receiver takes advantage of the remitter by substituting the remittance money for labour. This decreases labour supply in the receiving country.

19
resulting economic decline that overshadows the temporary advantage for a fortunate minority
of beneficiaries.24 And the positive view which turns each of these arguments on its head.
Remittances are responsive to market forces, provide resources for a transition to otherwise
unsustainable development, improve income distribution, and help a significant part of
society improve its quality of life25
24 Keely, Tran, (1989), page 325 Ibid, page 5

20
3. Migration in Albania
3.1 An overview from 1990 onwards
After the fall of communism, Albanians gained the right to move freely within and outside the
country as the Parliament approved the law on fundamental human rights in 1991. Hence, the
first Albanian mass emigration began (the so called “embassy migration”) as thousands of
Albanians sought refuge in western embassies in Tirana, in hope of leaving poverty behind
and starting a better life in the prosperous neighboring countries. Below follows a brief
summary of migration trends since 1990 in chronological order:
1991: During the first years of democracy in Albania, 25,000 migrants fled to southern Italy.
Of these 20.000 were repatriated back. At the same time, mass emigration to Greece was
taking place, but this is less well-documented. About 100,000 Albanians were forcibly
repatriated back to Albania during the Greek “sweep-up” operations in December 1991.26
Altogether, between 1991 and 1992, an estimated 300,000 Albanians left the country. 27
1993-1996: Migration continues due to high unemployment as factories and plants are shut
down. However, migration is more stable during this period as this is a period of economic
growth in Albania. The figures show an estimate of 400,000 emigrants for the mid 90s, with
Greece as the main destination country28.
1997: This is a year of political and economic unrest in the country and even civil war in
some parts, resulting mainly from the break-down of the financial system caused by some
investment schemes29. During this year another mass emigration took place, mainly to Italy
and Greece but also onward migration to other EU countries such as France, Germany and
Belgium was evident.
1999: Another migration outflow followed with the political crisis in Kosova in 1999. During
this year about half a million Kosovar refugees sought shelter in Albania as they were fleeing
from the ethnic cleansing of the Serbian regime. As they later on sought asylum in European
countries, many Albanian citizens mixed themselves in with them.
26 Barjaba, King (2005), page1027 Carletto et al. (2006), page 77028 Vullnetari (2007), page 3329 The link between these schemes and remittances will be briefly explained in chapter six.

21
2000-2007: This period marks the end of large scale mass migration in Albania, although
Carletto et al. (2006: 782) argue that migration levels remained rather high during 2001-
2002.30
By the end of 2008, over 1 million people or more than 25% of Albanian citizens, and over
35% of the Albanian workforce were estimated to be living abroad.31 It should be noted that
there is no consensus over the exact number of migrants in total or for each destination
country. Exact calculations become difficult given the high mobility of migrants and that
much of migration is illegal or periodical. Data that exist come from two types of sources:
Albanian and destination country sources.
3.2 Structure and profile of migrants
The latest Migration Profile done by IOM in Albania estimates the following figures:
Number of emigrants: 860,485 (2005, World Bank)
As percentage of total population: 27.5% (2005, World Bank)
Gender ratio: 75% male/25% female (INSTAT)
Table 3: Main Countries of Destination for Albanian Emigrants
Country Number Year SourceGreece 434,810 2003 European Commission Annual Report on
Statistics on Migration, Asylum and Return
Italy 348,813 2006 ISTAT Italian Statistics OfficeUSA 113,661 2000 US CensusUK 50,000 2005 Ministry of Labor, Social affairs and
Employment and Equal Opportunities, Albania
Canada 14,935 2001 Canadian ConsensusGermany 11,630 2002 Federal Statistics Office
Source: IOM Migration Profile 2007
The largest flows of emigrants originate in the countryside, where the economic situation is
considerably worse than in urban areas.32 According to WB estimates’, by 2002 temporary
international migration from rural households accounted for about two thirds of total
30 Vullnetari (2007), page 3531 Gedeshi I (2008), page 20532 De Zwager, Gedeshi, Germenji, Nikas (2005) page 12
22
migration.33 Since this study focuses on poverty reduction, it is worth mentioning that it
appears that the poorest of the poor cannot migrate, not only because of the lack of financial
capital, but also because of limited social capital which would crucially allow them to borrow
from businesses locally, so that the family survives until the migrant returns.34 Furthermore,
they lack human capital, because, as will be shown below, the chances to migrate are
positively correlated to the educational level.
Migrant occupation: The main sectors of male Albanian emigrant employment in Greece are
construction (49%) and Agriculture (21%). In Italy the primary sectors are construction
(43%), manufacturing (19%) and services (16%) for men. In both neighboring countries
women are primarily occupied by domestic work. In the United Kingdom, construction and
services are the two main sectors of occupation for men (33% and 32% respectively), while
for women the services sector seems the most “preferred” (66%).35
Education Level of migrants and brain drain: Considering that the first 9 years of education
are compulsory in Albania, most migrants have at least completed primary school. Studies
indicate that the likelihood of migration increases with the level of education (Germenji and
Swinnen 2004, Konica 1999). A comprehensive study done in rural Albania shows that none
of the migrants is illiterate and, on average, they have almost 2 years more of schooling than
non-migrants. (10 versus 8.3 years of schooling).36
The emigration rate of tertiary educated is quite high and estimated at 20% by the World
Bank.37 Every year, highly qualified professionals emigrate due to unsatisfactory
working/living conditions in Albania. Evidence from the CESS Data Banks 1 and 2 estimates
that the pool of Albanian academics holding a PhD, and working in universities, laboratories,
research institutions and research departments in industrialized countries comprises some 200
persons. This pool of academics is concentrated in a number of countries: USA (26%), France
(25%), England (9%), Austria (6%) and Germany (5%), and the remaining 29% in Canada,
Italy, Switzerland, Holland and Greece. For a small country like Albania, this is not an
insignificant number. This process of brain drain has been going on since early 1990 – a
recent CESS survey shows that more than half of the lecturers and researchers of the
33 World Bank (2005)34 Vullnetari (2007), page 4635 De Zwager, Gedeshi, Germenji, Nikas (2005)36 Germenji, Swinnen (2005)37 World Bank (2005)

23
universities and research institutions of Albania emigrated during the period 1991-2005, 47%
of them aged 25-34 at the time of emigration.38 As a result, the Albanian higher educational
system has weakened substantially for the last years. Such a loss of human capital and
potential is fatal to a country like Albania which is in its early stage of state rebuilding and
democracy and is struggling to build its path to the integration in the European Union and
world markets. Moreover, it is estimated that over 25,000 young Albanians are currently
studying abroad and many hundreds are attending Masters or PhD programs at universities in
industrialized countries. Many of these have no willingness to return to Albania in current
conditions.39
3.3 Motives and characteristics of Albanian Migration
Three types of international migration can currently be identified in Albania. First, short-term
international migration (for periods of days, weeks, or months), almost exclusively to Greece,
particularly from bordering regions; second, long-term international migration, to Greece,
Italy as well as to other countries of the European Union; and third, legal long-term
international migration to the US and Canada.40
In their National Strategy of Migration, the Albanian government identifies the 3 main
motives behind the decision to emigrate:
1. Economic Factors- such as lack of employment opportunities and poor living
conditions.
2. Public security: Civil unrest is the other main cause of emigration – Many Albanian
professionals with a good financial situation have immigrated to safer and more
prosperous countries to ensure a safer life for themselves and their families.
3. Weak institutions: Corruption and organized crime are two widely accepted features of
state institutions. This paralyses their normal functioning and results in the skepticism
of the citizens for improvement of the social, political and economic situation in the
country.
Besides these push factors, there are also pull factors that attract Albanians to leave their
country. These are: higher wages in the west and labor market demand for cheap labor force
in fields such as agriculture, construction, tourism etc.; better living conditions; better
38 Gedeshi (2006), page 11639 Ibid, page 12640 Carletto, Davis, Stampini, Zezza,(2004)

24
opportunities for the future of immigrants’ children; personal development; the glamorous
image of life in the West as portrayed by foreign television, particularly in the Italian case.41
In 2000 Barjaba first suggested an “Albanian model” of emigration. In this model, Albanian
emigration is characterized by the following features: It is intense (a rate of emigration much
higher than any other Eastern bloc country); it is largely economically driven – a form of
survival migration; it has a high degree of irregularity, with many undocumented migrants; it
displays lots of to-and-fro movement, especially with Greece; and it is dynamic and rapidly
evolving, especially as regards new destinations and routes of migration.42
41 Mai (2002)42 Vullnetari (2007), page 40

25
4. Remittances in Albania, development and patterns
4.1 Trends
Remittances in Albania have been continuously growing since 1992, from 10 to 22% of the
country’s GDP. They exceeded by several times the amount of FDI in the country, exports as
well as the amount of aid received from international institutions.43 During the 1992-2001
period the accumulated FDI was 774.7 million USD, while the accumulated remittance flow
was 3 924.2 million USD or about 5 times more.44
Figure 1: Volume of Remittances in relation to FDI, Foreign Aid and Trade Deficit
However, it has been difficult to report exact figures and realistic assessment of the remittance
flows to Albania, the reason being that large proportions of remittances are transferred
through informal channels and are consequently not recorded in official data. Moreover, much
of remittances are made in-kind such as long term durables, electronic equipment, clothing,
cars etc. and are also left out of official records. Remittances in kind are estimated by De
Zwager, Gedeshi, Germenji, Nikas (2005) to amount to 13.5% of total remittances, which is
not an insignificant figure.
43 Bank of Albania (2008)44 INSTAT (2002)

26
Thus, the volume of remittances reported varies between different institutes, depending on the
techniques they use in their estimations. The table below shows remittances in percentage of
GDP for the period 1993-2005, as estimated by the Bank of Albania.
Figure 2: Remittances in % of GDP, 1993-2005
Remittances in % of GDP
22,3
19,4
15,5
18,6
11,6
14,8
10
14,315,2
13,9
11,4
13,7 14
0
5
10
15
20
25
1993 1994 1995 1996 1997 1998 1999 2000 2001 2002 2003 2004 2005
Year
Pe
rce
nt
Source: Based on data from BoA 2006
The 2007 total remittances are estimated to be 947 million Euros (slightly growing at 1.3%
/year) or 12% of GDP. This growth rate is arguably the lowest in the last 10 years.45
In per capita terms, remittances rose from around USD 100 in early 1990s to more than USD
200 in 2002 and to almost USD 400 in 2007.46 Remittances are expected to decrease as
emigrants complete family reunification or create own families and integrate in the host
countries. Bonds with the family left behind in Albania weaken as new needs and expenses
are born together with the new life abroad. Many scholars think that a cycle exists in
Albanian migration.47 De Zwager et al (2005) estimated the Albanian “emigration cycle” to
be about 17 years. After this time, emigrants either wish to return to Albania, or permanently
settle in the host country.
However, until 2007 there was no noticeable decrease in remittances in Albania. Ilir Gedeshi,
expert in Albanian migration issues, proposes 3 reasons for this: 1. Migration in Albania has
been on the rise during the whole period since 1991. 2. There has been a trend in migration
away from lower income countries (Greece, Italy) towards higher income countries (USA,
45 Bank of Albania (2007), page 5946 Gedeshi (2008) 47 See for example Hatziprokopiou, H. and Labriandis, L. (2005)
27
Canada). 3. “Dirty money” (earned from illegal activities) is also recorded as remittances in
official accounts. On the other hand, the latest findings of CESS show maturation of the
overall migration cycle, evidenced by the high level of legalization and unification of families
in places of migration (90%). Consequently, remittances are expected to decrease, at the same
time as migrant savings abroad increase.
4.2 Motives and characteristics of remittances
It is widely accepted that the determinants of remittances in Albania are an area that lacks
adequate systematic research. One reason might be the relatively short period of emigration
flows and the poor quality of data. But another reason is that it is difficult to test the motives
to remit empirically. One such attempt was made by Hagen-Zanker & Siegel (2007) who used
3 different econometric models to test for the motivations to remit in Albania and Moldova,
but reached no significant results. They concluded that while there is some agreement on
some remitting motives, e.g. altruism towards spouses, many of these results remain
ambiguous due to a number of methodological problems. In real life behavior, altruism and
self-interest are not as strictly defined as in theory. However, family bonds are one of the
strongest elements which define Albanian culture and society. Over the years, the family has
come to play the role of an institution which, besides bearing the normal function of a family,
even aims at providing that kind of support which state structures fail to provide. Therefore, it
can be stated with quite enough certainty that altruism is one of the main motives to remit.
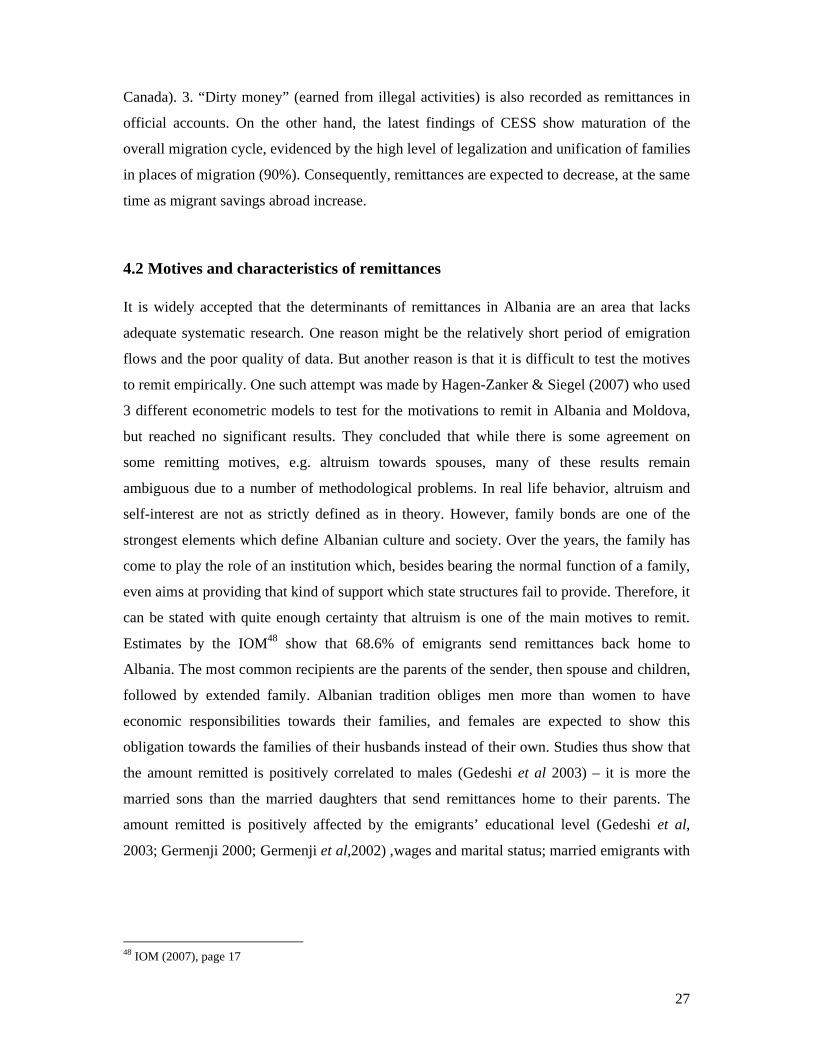
Estimates by the IOM48 show that 68.6% of emigrants send remittances back home to
Albania. The most common recipients are the parents of the sender, then spouse and children,
followed by extended family. Albanian tradition obliges men more than women to have
economic responsibilities towards their families, and females are expected to show this
obligation towards the families of their husbands instead of their own. Studies thus show that
the amount remitted is positively correlated to males (Gedeshi et al 2003) – it is more the
married sons than the married daughters that send remittances home to their parents. The
amount remitted is positively affected by the emigrants’ educational level (Gedeshi et al,
2003; Germenji 2000; Germenji et al,2002) ,wages and marital status; married emigrants with
48 IOM (2007), page 17
28
families remaining in Albania tend to send significantly more in comparison to their
counterparts (Gedeshi et al, 2003; Germenji 2004; Konica 1999)49.
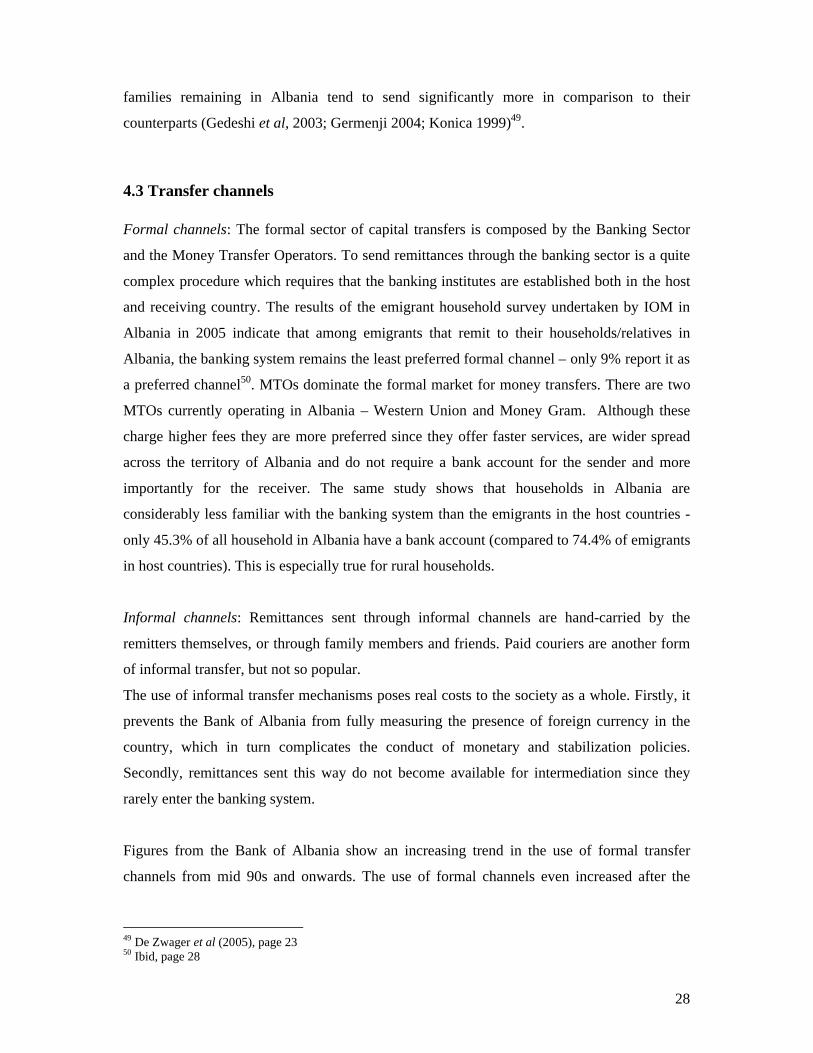
4.3 Transfer channels
Formal channels: The formal sector of capital transfers is composed by the Banking Sector
and the Money Transfer Operators. To send remittances through the banking sector is a quite
complex procedure which requires that the banking institutes are established both in the host
and receiving country. The results of the emigrant household survey undertaken by IOM in
Albania in 2005 indicate that among emigrants that remit to their households/relatives in
Albania, the banking system remains the least preferred formal channel – only 9% report it as
a preferred channel50. MTOs dominate the formal market for money transfers. There are two
MTOs currently operating in Albania – Western Union and Money Gram. Although these
charge higher fees they are more preferred since they offer faster services, are wider spread
across the territory of Albania and do not require a bank account for the sender and more
importantly for the receiver. The same study shows that households in Albania are
considerably less familiar with the banking system than the emigrants in the host countries -
only 45.3% of all household in Albania have a bank account (compared to 74.4% of emigrants
in host countries). This is especially true for rural households.
Informal channels: Remittances sent through informal channels are hand-carried by the
remitters themselves, or through family members and friends. Paid couriers are another form
of informal transfer, but not so popular.
The use of informal transfer mechanisms poses real costs to the society as a whole. Firstly, it
prevents the Bank of Albania from fully measuring the presence of foreign currency in the
country, which in turn complicates the conduct of monetary and stabilization policies.
Secondly, remittances sent this way do not become available for intermediation since they
rarely enter the banking system.
Figures from the Bank of Albania show an increasing trend in the use of formal transfer
channels from mid 90s and onwards. The use of formal channels even increased after the
49 De Zwager et al (2005), page 2350 Ibid, page 28

29
pyramid schemes in 1997 (when in fact one would expect a substantial decrease due to loss of
confidence in the banking sector).
Table 4 shows a continuous increase of formal transfer channels used, both in absolute and
relative terms. As can be seen, the use of formal channels during this period has, in absolute
terms, increased more than 150 times!
Table 4: Remittances of Albanian emigrants, million USD (percent), total, formal and
informal channels, 1994-2004
Year Formal Channels Informal Channels Total1994 10.0 (7.5%) 1000 (92.5%) 100.01995 210.2 (15.5%) 93.0 (84.5%) 101.81996 212.0 (12.0%) 125.7 (88.0%) 132.21997 295.4 (31.3%) 52.4 (68.7%) 70.61998 401.8 (25.1%) 96.9 (74.9%) 119.71999 314.8 (24.2%) 79.8 (75.8%) 97.42000 575.3 (30.7%) 105.3 (69.3%) 140.52001 861.8 (39.7%) 106.1 (60.3%) 162.72002 997.5 (44.7%) 99.9 (55.3%) 167.12003 1,096.5 (39.9%) 133.8 (60.1%) 205.92004 1,660.7 (45.7%) 159.6 (54.3%) 272.0
Source: Bank of Albania, 2005
If the set of data in the table (absolute terms) is compared to estimations of the WB (2005)
and BOA 2008 (fig. 1), it is clear that these figures are considerably lower (in total). WB
estimates a total of 400 million USD of remittances received in Albania during 2005– a figure
considered by them as an underestimation of total remittance flows as it ignores foreign
earnings and savings brought back in person by migrants. BoA (2008) gives an estimate of
about 1000 million USD for the same year. This demonstrates the problems with collecting
unified data about remittance flows- even within an institute, the figures differ from year to
year (as is the case with BoA).

30
5. Poverty in Albania–Incidence, spatial distribution and characteristics
5.1 Poverty and poverty measures
Although it is widely agreed that poverty is a state of being with many more dimensions than
strictly the income dimension (which classical literature emphasizes the most), it is difficult to
measure the non-income aspects of poverty. Therefore, the most widely used measurement of
poverty is income-poverty. Income poverty is defined as the lack of sufficient income to meet
minimum consumption needs. This minimum level of income is usually called the "poverty
line". Every country has a National Poverty Line, which is derived by the Purchasing Power
Parity (PPP). There are two main ways of setting poverty lines in a relative or absolute way:
Absolute poverty lines are anchored in some absolute standard of what households should be
able to count on in order to meet their basic needs.51 The absolute poverty line in Albania is
set at 4891 Albanian Lek/month (about 47USD). The most common measurement of income
poverty is the Headcount index (also called poverty rate). This index gives the incidence of
poverty, i.e the percentage of the population whose per capita incomes/expenditures are below
the poverty line, and is derived by dividing the number of people below the poverty line by
the total population. However, this index is only a descriptive one and does not capture
aspects of poverty which are important for policy-making, such as depth and severity of
poverty. For example, the headcount ratio does not change when a part of the population
becomes poorer, or a very poor group becomes less poor. Therefore, other measures of
poverty need to be used to measure how far below the poverty line the poor are situated, and
how severe poverty is. The measures I will use to describe poverty in Albania are the
Headcount ratio, depth of poverty and severity of poverty.
Depth of poverty is measured by the poverty gap index which is a combined measurement of
the incidence of poverty and depth of poverty. It shows how far from the poverty line the poor
are situated and is defined by:
51http://web.worldbank.org/WBSITE/EXTERNAL/TOPICS/EXTPOVERTY/EXTPA/0,,contentMDK:20242879~menuPK:435055~pagePK:148956~piPK:216618~theSitePK:430367~isCURL:Y~isCURL:Y,00.html

31
Severity of poverty is in addition sensitive to inequality among poor. The poverty severity
index gives more weight to very poor than to less poor and is defined as:
Relative poverty lines are defined in relation to the overall distribution of income or
consumption in a country; for example the poverty line could be set at 50% of the country’s
mean income or consumption. While absolute poverty is measured by comparing a person’s
total income against the total cost of purchasing a basket of goods and services representing
the basic needs of daily life, relative poverty compares a person’s total income and spending
patterns with those of the general population.
Inequality is a key concept when analyzing poverty. Income inequality is the existence of
disproportionate distribution of total national income among households whereby the share
going to rich persons in a country is far greater than that going to poorer persons. The most
common measure of inequality is the Gini-Coefficient. The Gini coefficient is measured
graphically by the Lorenz Curve, dividing the area between the perfect equality line and the
Lorenz curve by the total area lying to the right of the equality line in a Lorenz diagram. The
Gini coefficient ranges income inequality from 0 to 1. The higher the value of the coefficient,
the higher is the inequality of income distribution.52
52 Definitions taken from Todaro, Smith (2006), page 814 and 816

32
5.2 Poverty trends in Albania
5.2.1 Rural-Urban poverty
As expected, the majority of the poor live in rural areas. All three poverty measures are
significantly higher in rural areas than in urban – the incidence of poverty is almost 3 times
higher in rural areas compared to Tirana, and twice as high compared to other urban areas.
The lowest poverty is found in Tirana where the poverty gap is only 1.6% compared to 2.6%
in other cities and 5.3% in rural areas. Also the severity of poverty is twice as high in rural
areas as in cities, and almost 4 times higher than in Tirana.
Table 5, Figure 3
Absolute poverty by Urban Rural,2005Area Poverty measure
Tirana Headcount 8.1Depth 1.6Severity 0.5
Other Urban Headcount 12.4Depth 2.6Severity 0.9
Rural Headcount 24.2Depth 5.3Severity 1.8
Total Headcount 18.5Depth 4Severity 1.3
Source: LSMS 2005
5.2.2 Regional poverty
The poorest of the four defined regions is the Mountain region.53 There are considerable
differences in all poverty measures between this region compared to the Coast, and especially
Tirana. These differences were substantially higher in 2002, but as a result of regional
53 It is important to note that these broadly defined regions are not the same as administrative regions –commonly referred to as prefectures. Rather, these are areas that have been grouped together because they share similar geographic contiguity and endowments. There are four such areas defined for survey purposes, while there are 12 prefectures (WB 2005)
33
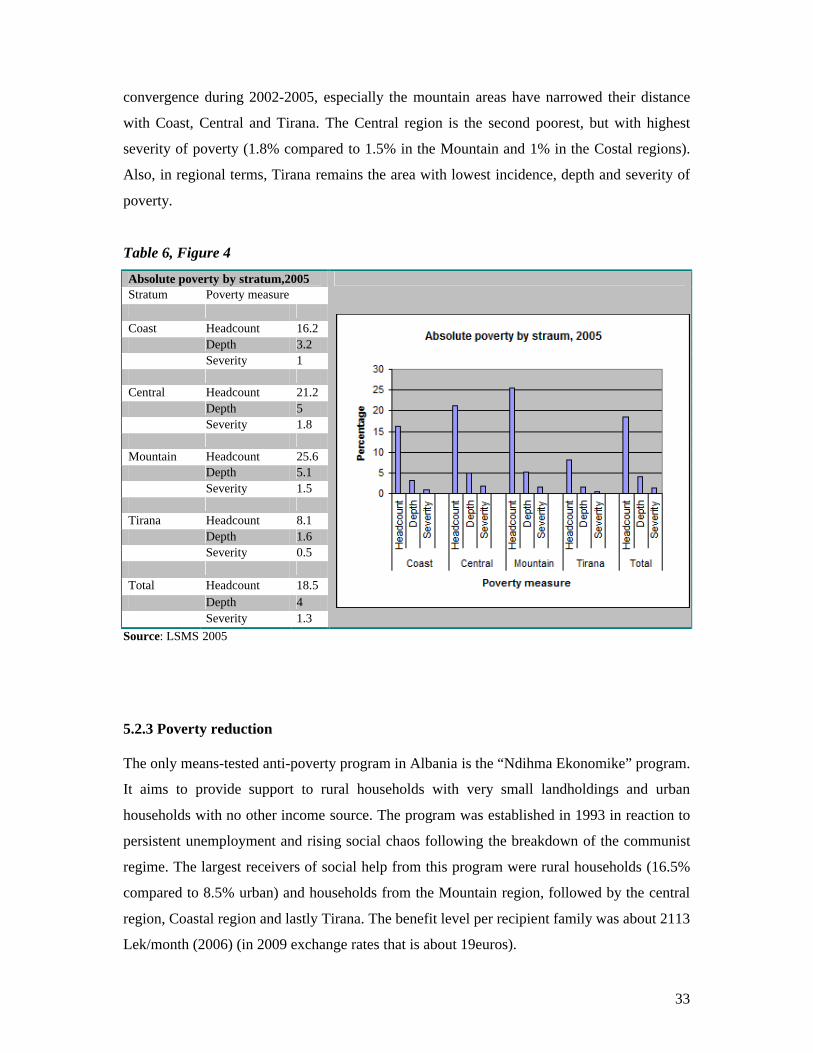
convergence during 2002-2005, especially the mountain areas have narrowed their distance
with Coast, Central and Tirana. The Central region is the second poorest, but with highest
severity of poverty (1.8% compared to 1.5% in the Mountain and 1% in the Costal regions).
Also, in regional terms, Tirana remains the area with lowest incidence, depth and severity of
poverty.
Table 6, Figure 4
Absolute poverty by stratum,2005Stratum Poverty measure
Coast Headcount 16.2Depth 3.2Severity 1
Central Headcount 21.2Depth 5Severity 1.8
Mountain Headcount 25.6Depth 5.1Severity 1.5
Tirana Headcount 8.1Depth 1.6Severity 0.5
Total Headcount 18.5Depth 4Severity 1.3
Source: LSMS 2005
5.2.3 Poverty reduction
The only means-tested anti-poverty program in Albania is the “Ndihma Ekonomike” program.
It aims to provide support to rural households with very small landholdings and urban
households with no other income source. The program was established in 1993 in reaction to
persistent unemployment and rising social chaos following the breakdown of the communist
regime. The largest receivers of social help from this program were rural households (16.5%
compared to 8.5% urban) and households from the Mountain region, followed by the central
region, Coastal region and lastly Tirana. The benefit level per recipient family was about 2113
Lek/month (2006) (in 2009 exchange rates that is about 19euros).

34
Table 7: Percentage of households concerned by Ndihma Ekonomike by Poverty status
and region, poor includes extreme poor
Ext. Poor Poor Non-Poor
All
Coastal 12.3% 9.7% 2.8% 3.6%Central 60.2% 41.6% 13.0% 17.9%Mountain 60.7% 45.0% 29.9% 32.9%Tirana 42.5% 19.7% 2.0% 3.0%
Urban 52.4% 32.9% 6.3% 8.5%Rural 50.0% 32.4% 12.7% 16.5%
Albania 50.7% 32.5% 9.5% 12.7%
Source: LSMS 2005
Poverty reduction between 2002 and 2005 was impressively large – 41% of the poor
population in urban areas and 24% in rural areas were helped out of poverty. Generally,
absolute poverty declined from 25.4% to 18.5% between 2003- 2005 and extreme poverty54
from 5% to 3.5%. Also, the poverty gap and the severity of poverty declined during this
period. According to WB, INSTAT, BOA, this success is mostly attributed to the high
economic growth which Albania has been experiencing since 1992. Evidence shows that most
of the reduction in poverty is due to high growth in mean incomes in a fairly stable inequality
context – meaning that growth has been pro-poor in Albania. The other way from which
changes in poverty can occur is through redistribution to the lower tail of the distribution,
even when there is no change in average mean incomes.
5.2.4 Poverty reduction by region
If we look at poverty reduction by region we see that there are quite big differences between
the developments in the Mountain area and Tirana on the one hand and the coastal and central
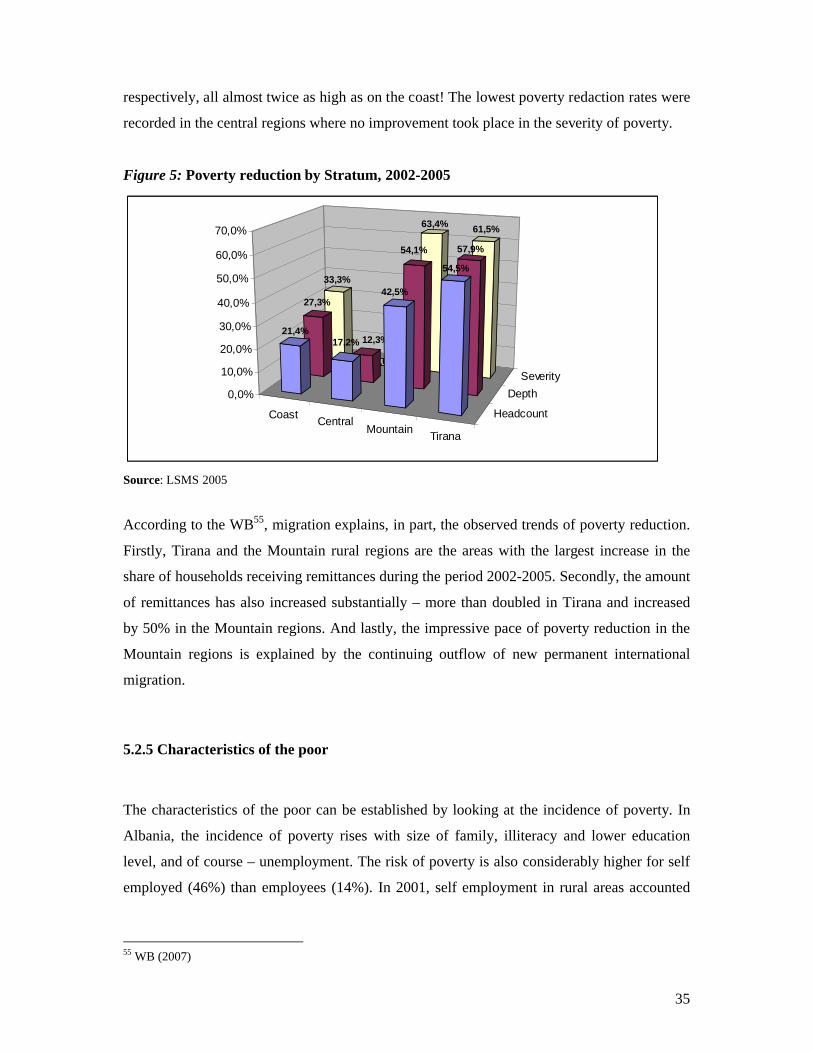
regions on the other hand. During 2002-2005 Tirana experienced the highest rates in poverty
reduction among the regions, with a 54.5% reduction in the poverty headcount, 57.9% in
depth and 61.5% in severity of poverty. The high rates of poverty reduction in the Mountain
regions, which are predominantly rural and poor, are rather surprising. Severity of poverty
decreased by an impressive 63.4% and depth and headcount poverty by 54.1% and 42,5%
54 Extremely poor are those who have difficulty in meeting basic nutritional needs
35
respectively, all almost twice as high as on the coast! The lowest poverty redaction rates were
recorded in the central regions where no improvement took place in the severity of poverty.
Figure 5: Poverty reduction by Stratum, 2002-2005
CoastCentral
MountainTirana
Headcount
Depth
Severity
33,3%
0,0%
63,4% 61,5%
27,3%
12,3%
54,1% 57,9%
21,4%17,2%
42,5%
54,5%
0,0%
10,0%
20,0%
30,0%
40,0%
50,0%
60,0%
70,0%
Source: LSMS 2005
According to the WB55, migration explains, in part, the observed trends of poverty reduction.
Firstly, Tirana and the Mountain rural regions are the areas with the largest increase in the
share of households receiving remittances during the period 2002-2005. Secondly, the amount
of remittances has also increased substantially – more than doubled in Tirana and increased
by 50% in the Mountain regions. And lastly, the impressive pace of poverty reduction in the
Mountain regions is explained by the continuing outflow of new permanent international
migration.
5.2.5 Characteristics of the poor
The characteristics of the poor can be established by looking at the incidence of poverty. In
Albania, the incidence of poverty rises with size of family, illiteracy and lower education
level, and of course – unemployment. The risk of poverty is also considerably higher for self
employed (46%) than employees (14%). In 2001, self employment in rural areas accounted
55 WB (2007)

36
for 89.8% of total employment, compared to only 39% in urban areas.56 A surprising
observation is that households headed by females have a lower incidence of poverty.
According to the WB, part of the explanation may be that these female-headed households
live in households with migrants who boost household incomes through remittances.
Moreover, the incidence of poverty is rising for younger heads of households. 90% of the
poor live in rural Albania, which is characterized by lack of infrastructure, high population
density and unemployment.
5.2.6 Income inequality
Inequality in Albania is considered low and by the standard of the most commonly used
measure, Gini, it remains low57. Inequality is slightly higher in urban regions compared to
rural (0.297 and 0.273 respectively). The highest inequality is noted in Tirana followed by the
Coastal areas, Central areas and lastly the Mountain regions.
Table 8: Income inequality in 2005 measured by the GINI coefficient
GiniNational 0.296Urban 0.297Rural 0.273Coast 0.294Central 0.286Mountain 0.241Tirana 0.298
Source: LSMS 2005
From 2002 there has been a modest increase in inequality in all areas (generally from 0.282 to
0.296) except for the mountain regions which have actually experienced a decline in
inequality (from 27.1 to 24.1)
56 SIDA (2006), page 39. Self employed includes employers and unpaid family members57 WB (2007), page 9

37
6. Remittances and Poverty in Albania
6.1 Distribution of remittances
According to LSMS 2002, remittances from emigrants represent 13% of the average
household income, while for recipient households they represent 47% of the household
income.58 87% of total remittances are sent by split-off migrants59 (who are estimated to be
around 451,000) and the average amount remitted is UDS 1,179. The remaining 13% is sent
by other distant relatives or friends.60 Before moving on to see how remittances are distributed
across regions, it should be noted that 44.5% of split-off migrants originate from the coast,
39% from central regions, 10.5% from Tirana and only 7% from mountain regions. Figure 6
shows that the pattern of remittance-receiving households (as a percent of total households) is
in line with this ranking. The highest level of remittance-receiving households is in the coastal
regions, followed by the central regions, Tirana and lastly mountain areas. However,
proportionally speaking, the largest receivers are from the mountain areas (74% of split-offs
from the mountain areas send remittances), while the lowest are from the coastal areas (60%).
The proportions of emigrant households receiving remittances in the central areas and Tirana
are 70% and 65% respectively.
As can be seen, the evidence on the impacts of remittances on poverty and inequality vary
depending on country, pattern of migration and poverty measure. Generally, the correlation
between remittances and poverty reduction is positive but there seems to be an indication that
remittances have a larger effect on reducing the severity of poverty than level of poverty. The
impacts on inequality are contradicting between studies, mainly due to the pattern of
migration. When remittances are associated with higher inequality it is mainly either because
overall migrants come from higher income groups or that those who do come from higher
income groups remit relatively greater amounts compared to the migrants from poor
households.
58 IMF (2005)59 Defined as members of a nuclear family who have been away from the household since 1990 and now live abroad.60 WB (2007)

38
Figure 6: Percentage of households receiving remittances by region, 2005
0
5
10
15
20
25
30
35
40
45
Tirana CoastUrban
Coast Rural CentralUrban
CentralRural
MountainUrban
MountainRural
Region
Per
cen
t
Source: LSMS 2005
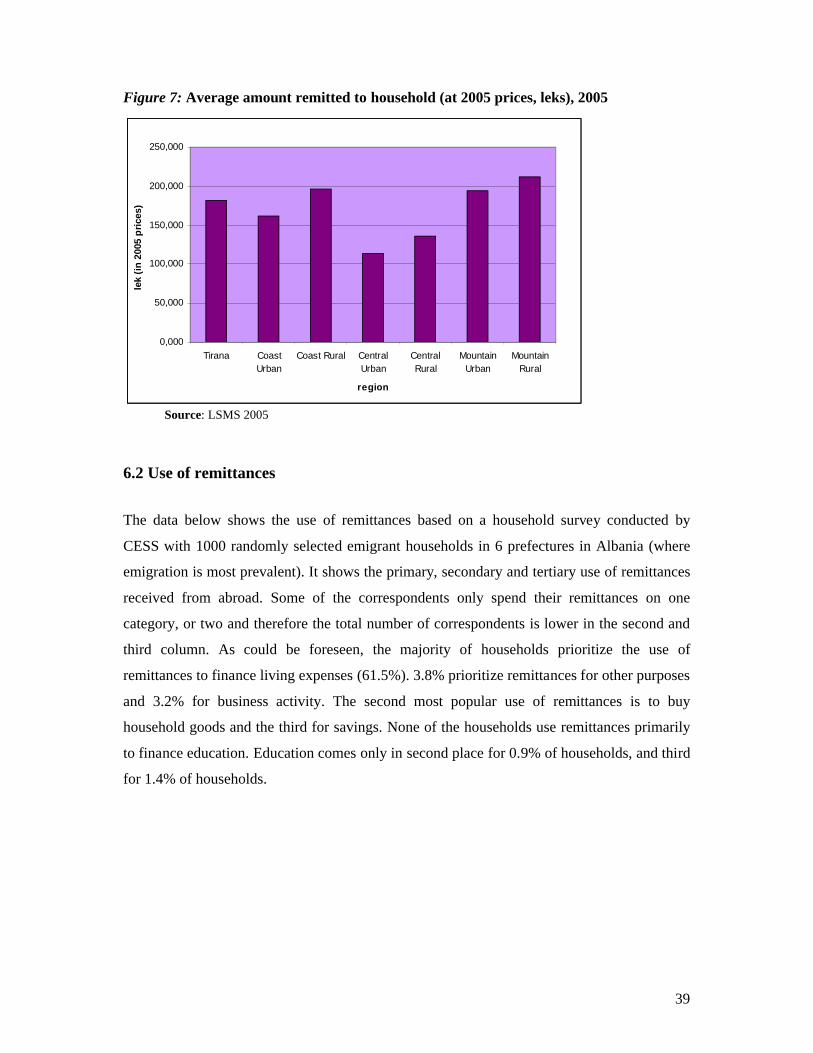
Regarding the amount of remittances, it is interesting to note that although a small portion of
emigration comes from the mountain regions, split-offs from these areas tend on average to
remit the highest amounts – almost twice as much as the central areas. This means that
proportionally more and larger amounts are flowing into the poorer mountain region
compared to the richer areas of the country.61 In general, split offs from rural areas send more
than their counterparts from urban areas in the same region (see fig. below). This can have
positive effects on poverty alleviation since the majority of the poor (90%) are situated in the
rural areas of the country.
61 WB (2007), page 45
39
Figure 7: Average amount remitted to household (at 2005 prices, leks), 2005
0,000
50,000
100,000
150,000
200,000
250,000
Tirana CoastUrban
Coast Rural CentralUrban
CentralRural
MountainUrban
MountainRural
region
lek
(in
200
5 p
rice
s)
Source: LSMS 2005
6.2 Use of remittances
The data below shows the use of remittances based on a household survey conducted by
CESS with 1000 randomly selected emigrant households in 6 prefectures in Albania (where
emigration is most prevalent). It shows the primary, secondary and tertiary use of remittances
received from abroad. Some of the correspondents only spend their remittances on one
category, or two and therefore the total number of correspondents is lower in the second and
third column. As could be foreseen, the majority of households prioritize the use of
remittances to finance living expenses (61.5%). 3.8% prioritize remittances for other purposes
and 3.2% for business activity. The second most popular use of remittances is to buy
household goods and the third for savings. None of the households use remittances primarily
to finance education. Education comes only in second place for 0.9% of households, and third
for 1.4% of households.

40
Figure 8: Use of remittances, 2005
0,0%
10,0%
20,0%
30,0%
40,0%
50,0%
60,0%
70,0%
First use
Second use
Third use
First use 3,8% 61,5% 1,6% 0,0% 1,5% 3,2% 1,7% 0,0%
Second use 5,6% 0,1% 5,7% 0,4% 14,0% 4,4% 6,7% 0,9%
Third use 1,7% 0,0% 0,2% 0,0% 0,8% 1,1% 0,0% 1,4%
OtherLiving
ExpensesTo buy
propertyTo rent
property
To buy furniture/ho
usehold
For Business activity
Savings Education
Source: Internal data from CESS
Similar results were found by De Zwager and Gedeshi (2005). They found that the primarily
remittances go to finance family daily needs, then comes building upgrading and furnishing
the home, followed by investment in real estate. The propensity for beneficiaries of
remittances to save a part of this income was quite high, and estimated to be about 20-30 %.
However, the same is not true for investments in the dynamic sector of the economy. What
little productive investment is achieved by the use of remittances is concentrated in the
primary and tertiary sectors of the economy.
A fair share of the consumption growth (22.1% in urban and 10.6% in rural) that Albania has
been experiencing in the last years is explained by remittances. The large pool of migrants
and the remittances they send have contributed to consumption growth by reducing family
size, financing consumption directly and providing working capital for business start-ups.62
In order to find out weather migrant remittances has an effect on the consumption patterns of
recipient households Castaldo & Reilly (2002) use data from the 202 LSMS to estimate
budget share equations for four broadly defined categories of commodities: food, non-food,
durables and utilities63. The estimated effects for the international remittance recipients are
62 WB (2007), page 1863 Description of expenditure categories: Food: Purchased products, non-purchased products (own produced and received as gift), food eaten outside home, items purchased before reference period; Non-food: Clothing and personal care, house cleaning, home improvements, transport, entertainment and hobbies, other products and

41
found to be statistically significant for all categories except non-food. The effect on food is
shown to be negative (i.e remittance receivers’ average budget share on food compared to
non-receivers’ is 4.5% lower, ceteris paribus). The effects on durables and utilities, on the
other hand, are shown to be positive. Receivers of international remittances spend on average
25% more of their budget share on durables, and 16% more on utilities. Remittances thus
allow households to improve their standards of living, by financing home appliances, use of
electricity, gas, fuels for heating, access to water etc.
6.3 Impact of remittances on poverty
It has been widely acknowledged that since the start of mass emigration from Albania, in
early 1990s, remittances have served as a survival strategy for poor families in the country,
and emigration is perceived to be the most viable means to escape poverty. However, as for
Albania, there is no empirical study that examines the impact of remittances on poverty
reduction. But, several surveys in different parts of the country give evidence on the benefits
of migration and remittances in poverty alleviation.
6.3.1 Remittances, consumption and absolute poverty
Below follows a comparison between households with migrants abroad and those without
regarding consumption and poverty, based on LSMS 2005 data. As is obvious, there are large
differences in consumption levels as well as incidence and depth of poverty between
households with permanent migrant/s abroad and those without. The incidence of poverty is
almost half as low and the depth of poverty more than half as low for households with
permanent migrants compared to households without such. Also per capita consumption is
higher for migrant households – 9.856 lek compared to 8.813 lek for non-migrant households.
These differences are all statistically significant at 99% level of significance. The outcomes
between households with and without temporary migrants on the other hand show no marked
differences.
services; Durables: Domestic appliances, TV, computer, video and DVD-player, Vehicles (bicycle, motorcycle, car, truck tractor); Utilities: Electricity, gas and water, Telephone (landline, mobile, public phone), Fuels for home use (firewood, coal, kerosene, diesel)
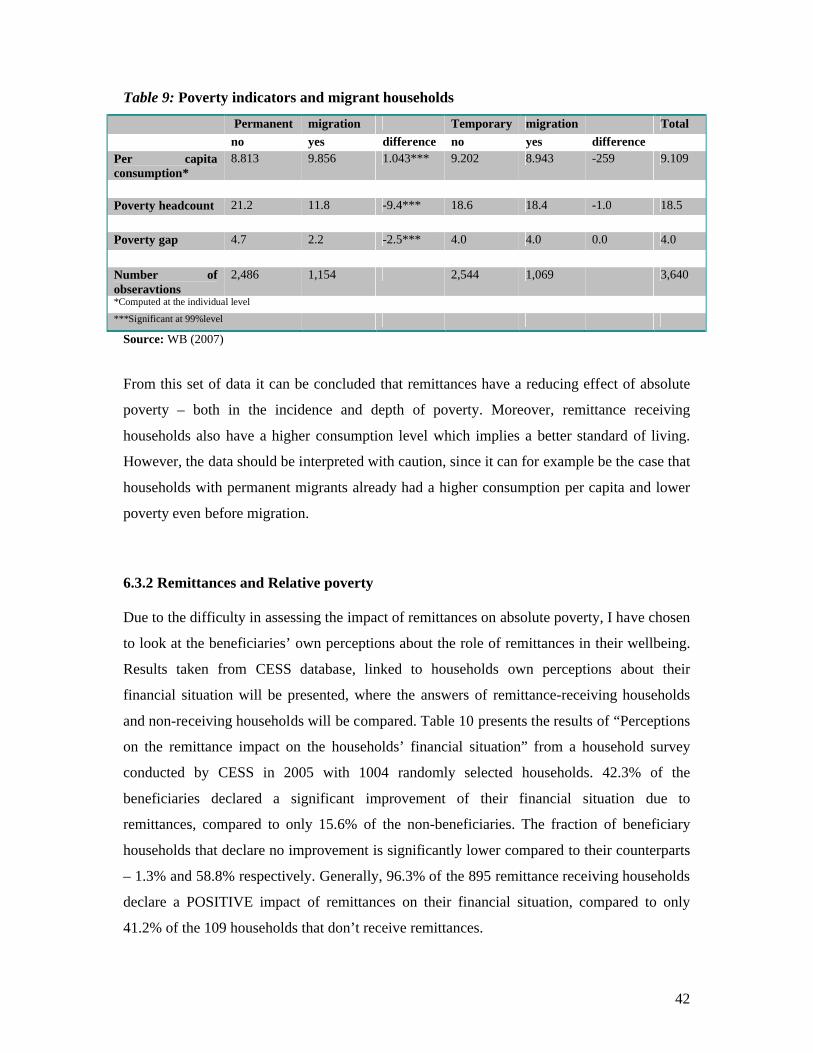
42
Table 9: Poverty indicators and migrant households
Permanent migration Temporary migration Total
no yes difference no yes differencePer capita consumption*
8.813 9.856 1.043*** 9.202 8.943 -259 9.109
Poverty headcount 21.2 11.8 -9.4*** 18.6 18.4 -1.0 18.5
Poverty gap 4.7 2.2 -2.5*** 4.0 4.0 0.0 4.0
Number of obseravtions
2,486 1,154 2,544 1,069 3,640
*Computed at the individual level
***Significant at 99%level
Source: WB (2007)
From this set of data it can be concluded that remittances have a reducing effect of absolute
poverty – both in the incidence and depth of poverty. Moreover, remittance receiving
households also have a higher consumption level which implies a better standard of living.
However, the data should be interpreted with caution, since it can for example be the case that
households with permanent migrants already had a higher consumption per capita and lower
poverty even before migration.
6.3.2 Remittances and Relative poverty
Due to the difficulty in assessing the impact of remittances on absolute poverty, I have chosen
to look at the beneficiaries’ own perceptions about the role of remittances in their wellbeing.
Results taken from CESS database, linked to households own perceptions about their
financial situation will be presented, where the answers of remittance-receiving households
and non-receiving households will be compared. Table 10 presents the results of “Perceptions
on the remittance impact on the households’ financial situation” from a household survey
conducted by CESS in 2005 with 1004 randomly selected households. 42.3% of the
beneficiaries declared a significant improvement of their financial situation due to
remittances, compared to only 15.6% of the non-beneficiaries. The fraction of beneficiary
households that declare no improvement is significantly lower compared to their counterparts
– 1.3% and 58.8% respectively. Generally, 96.3% of the 895 remittance receiving households
declare a POSITIVE impact of remittances on their financial situation, compared to only
41.2% of the 109 households that don’t receive remittances.

43
Table 10: Perceptions on the remittance impact on the households’ financial situationHouseholds that receive remittances
Households that don’t receive remittances
Total
Financial situation Nr. % Nr. % Nr. %
No improvement 33 3.7 64 58.8 97 9.66A slight improvement 483 54.0 28 25.7 511 60.46
A significant improvement
379 42.3 17 15.6 396 99.90
Total 895 100.0 109 100.0 1004 100.0
Source: De Zwager, N., Gedeshi, I., Germenji, E., Nikas Ch., (2005)
The data below is taken from another household survey by CESS in collaboration with ETF,
this time with 2000 households across 6 prefectures in Albania. These households belong to
two groups: 1000 of them are potential migrants (labeled PM), and 1000 are families with
return migrants (labeled Return). The answers to the question “Is you financial situation
sufficient to meet your basic needs?” are presented in figure 9. Concentrating on the right tail
of the x-axis we see that generally, relatively fewer remittance-receiving households perceive
their financial state to be “insufficient” and “not at all sufficient” (with an exception of return
migrants who receive remittances and think their state is “not at all sufficient” – 1.1%
compared to 0.7% for return migrants that do not receive remittances). We also notice that
relatively more beneficiaries perceive their financial state to be “sufficient” than non-
beneficiaries. There are however no noticeable differences in the other two categories.
Figure 9: Households’ perceptions about their financial situation
Is your finnacial situation sufficient to meet your basic needs?
0
10
20
30
40
50
60
70
More thansufficient
Sufficient Smt sufficient,smt not
Insufficient Not at allsufficient
Pe
rce
nt PM/Rem.
PM/WoRem.
Return/WoRem
Return/Rem.
Source: Internal data from CESS

44
Before drawing conclusions I finally look at the differences between the same set of groups
but for another question, namely how they perceive their economic condition relative to
others. The results are presented in figure 10 below.
Figure 10: Households’ perception about their financial situation compared to others
0
10
20
30
40
50
60
70
Percent
Much better Better Same Worse Much worse
How would you classify your familys economic condition compared to other families in the village?
PM/Rem
PM/WoRem
Return/WoRem
Return/Rem
Source: Internal data from CESS
Here we can distinguish a pattern for households that receive remittances. They seem to be
fewer compared to their counterparts in perceiving their situation as “worse”, “much worse”
or “same” as other families in the village. They are also relatively more who perceive their
situation as “better” – 30.1% Potential migrant households and 30.5% of return migrants
households, both who receive remittances, place themselves as being better off economically
than other families in the village. These figures are 22.4% and 24% for non-beneficiaries.
Again, there are no noticeable differences between households that do and do not receive
remittances when it comes to the better extreme of this ladder. Generally, the pattern holds
and is the same for both of these indicators – remittances seem to have an impact when it
comes to easing households’ financial situation, but do not affect them in such a way as to
distinguish them as being much better off than their counterparts. From this analysis I can
conclude that, among these 2000 households, remittances seem to have a positive impact on
easing poverty, but no noticeable impact on wealth accumulation. This conclusion reinforces
the evidence that remittances are mainly spent on consumer goods to meet basic family needs.

45
6.4 Impact of remittances on inequality
In order to see what kind of effect remittances may have on inequality, the distribution of
remittances across quintiles of per capita expenditure will be viewed. Because quintiles are
affected by the amount of remittances received, I will look at percent of remitters and fraction
of migrants64 for quintiles of per capita consumption net of remittances. Figure 11 shows that
the majority of migrants and remitters come from the fourth quintile. Second in the rank is the
highest quintile, followed by the third, then second and lastly lowest quintile.
Figure 11: Number of Migrants and Remitters, and % of Remitters by Quintile (per
capita expenditure net of remittances)
Source: WB (2007)
Clearly, relatively better off households send out more migrants and receive relatively more
remittances. This can suggest a negative impact of remittances on inequality. However, these
indications are by no means conclusive. In order to assess the real impact of remittances on
for example the GINI coefficient, more qualitative research needs to be undertaken in the
field. Looking at the relation between welfare level and the share of migrants sending
remittances in each quintile we see that the trend is almost flat. It is also interesting to note
64 We are speaking of split-off migrants
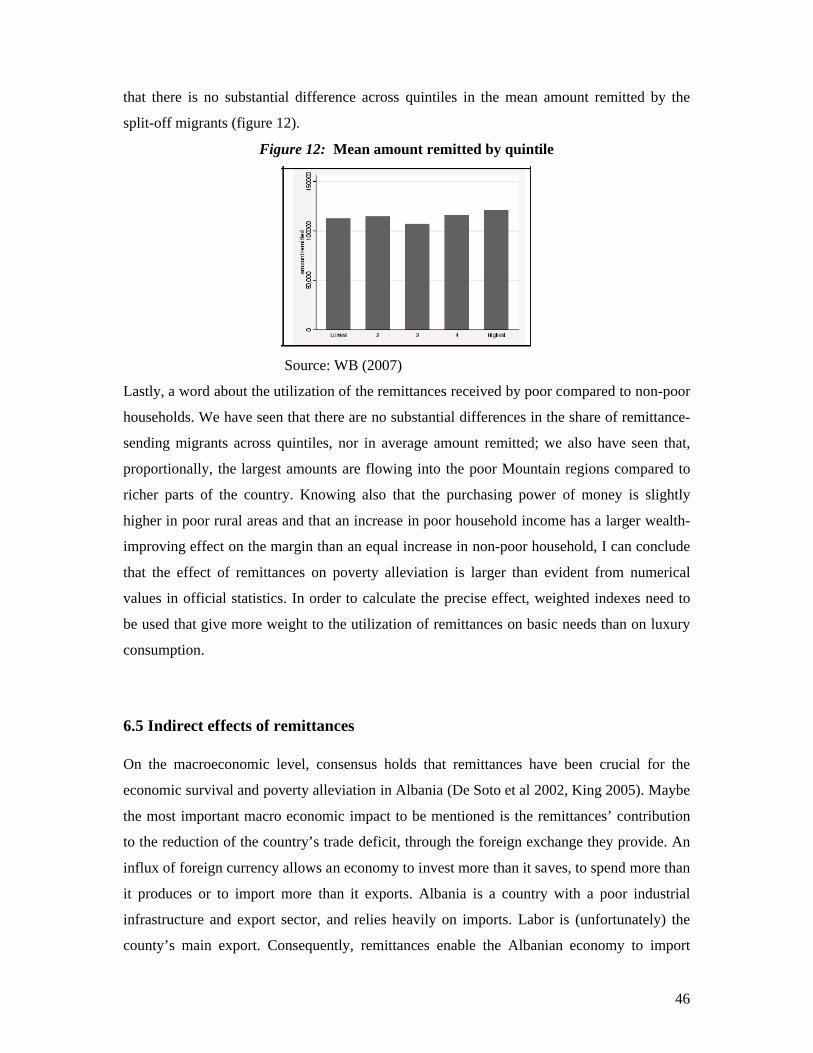
46
that there is no substantial difference across quintiles in the mean amount remitted by the
split-off migrants (figure 12).
Figure 12: Mean amount remitted by quintile
Source: WB (2007)
Lastly, a word about the utilization of the remittances received by poor compared to non-poor
households. We have seen that there are no substantial differences in the share of remittance-
sending migrants across quintiles, nor in average amount remitted; we also have seen that,
proportionally, the largest amounts are flowing into the poor Mountain regions compared to
richer parts of the country. Knowing also that the purchasing power of money is slightly
higher in poor rural areas and that an increase in poor household income has a larger wealth-
improving effect on the margin than an equal increase in non-poor household, I can conclude
that the effect of remittances on poverty alleviation is larger than evident from numerical
values in official statistics. In order to calculate the precise effect, weighted indexes need to
be used that give more weight to the utilization of remittances on basic needs than on luxury
consumption.
6.5 Indirect effects of remittances
On the macroeconomic level, consensus holds that remittances have been crucial for the
economic survival and poverty alleviation in Albania (De Soto et al 2002, King 2005). Maybe
the most important macro economic impact to be mentioned is the remittances’ contribution
to the reduction of the country’s trade deficit, through the foreign exchange they provide. An
influx of foreign currency allows an economy to invest more than it saves, to spend more than
it produces or to import more than it exports. Albania is a country with a poor industrial
infrastructure and export sector, and relies heavily on imports. Labor is (unfortunately) the
county’s main export. Consequently, remittances enable the Albanian economy to import

47
much more than it exports. As can be seen from figure 13, remittances have financed between
50% and 75% of the trade deficit during the period 1996-2005. In recent years there has been
a decline in the financing of trade balance by remittances.
However, since remittances are mostly spent on imported consumer goods, there is an adverse
effect on the balance of payments, but this is hard to measure. An immediate effect following
the financing of the trade deficit is the real appreciation of the local currency - the Lek.
Consequently, the Dutch Disease phenomenon is felt, as the country’s exporters and local
producers are hurt in the face of higher imports and competition. This argument is supported
by De Zwager et al 2005 who argue that Albanian exporters are crowded out as a result of
currency appreciation caused by remittances.
Figure 13: Remittances in relation to trade balance, 1996-2005
Remittances to Trade Balance (%)
74
50
75
56
6560
55 5865 64
0
10
20
30
40
50
60
70
80
1996 1997 1998 1999 2000 2001 2002 2003 2004 2005
Year
Per
cen
tag
e
Source: Bank of Albania 2005
Two sectors that have experienced the highest benefits from remittances are Construction and
Tourism. In 2007 the export earnings from tourism reached a level of 1 billion euro, which is
27 times higher than income from the export of goods.65 The major part of this money comes
from Albanian emigrants who spend their holidays in Albania. According to BOA, economic
growth in Albania since the late 1990s has been led by growth in the tertiary sector, and
remittances have been the main factor contributing to the building industry (BoA, 2003).
Capital formation: Only a few studies have focused on the role of remittances in capital
formation in Albania, and a number of them indicate that remittances have indeed contributed
65 Bank of Albania (2007), Balance of Payments

48
to capital formation in the country. The results from the survey carried out by Kule et al 2002
show that remittances contribute about 17% to the establishment of businesses.
Table 11: Contribution of Capital Sources for the Establishment of Firms in AlbaniaN=190 Mean % Std. Dev
Remittances 17.20 33.59Loan from Albanian banks 4.73 15.71Loan from international banks 1.16 8.13Loan from financial institutions in Albania 0.22 1.70Loan from Family/Relatives 7.52 18.50Loan from friends 8.75 20.31Own capital 55.58 40.52Other sources 4.83 17.16
Source: Kule et al 2002
Another study carried out by Kilic et al 2007 analyzes the impact of past migration of current
household members on business ownership. Using data from a nationally representative
household survey (LSMS 2005), they prove that there is a strong, positive relation between
past (return) migration and business ownership66.
Historically, there is evidence that remittances played a role in financing a series of
investment schemes in Albania between 1995-1997 which promised the investors
unsustainable high returns on and finally collapsed to result in huge socio-economic unrest
and even civil war in some parts of the country. Some argue that remittances drove the
emergence of the pyramid schemes (Korovilas 2005), as the Albanian economy at the time
was far too small to finance such large deposits ( between 1995 and 1996 the schemes
attracted between 1 – 1.3 billion USD, roughly equal to half of Albania’s GDP for 199667).
However it is difficult to measure the amount of remittances injected into these schemes, as a
large amount of foreign currency invested in them came from illegal activities, which
certainly are not to be regarded as remittances, even though official accounts group all foreign
currency entering the country (that does not come from exports) as remittances.
66 However, it can not be concluded that this positive relationship only comes from the contribution of remittances in business establishment, since human capital and skills may also be included.67 Korovilas (2005), page 186

49
6.6 Current issues regarding the impact of remittances on the Albanian economy
Today in Albania, the topic of remittances is very popular and frequently debated on national
media. What is happening now, (mainly) as a result of the world financial crisis, is that
remittances are decreasing substantially due to loss of jobs among emigrants and difficult
days to come. Consequently, the local currency Lek is depreciating in value, causing an
inflationary pressure.68 Since most goods are imports, inflation is now on the rise, and the
group most hurt is the poor population. According to WB, a significant share of the Albanian
population lives just above the poverty line. If the price-level keeps going up, this group of
people will soon find themselves below the national poverty line – poverty will increase. This
situation is a concrete example of the level of dependency on remittances in the Albanian
economy, and the consequences following this dependency. Nikas and King (2005) foresaw
that “a sudden decline in the size of remittances, due to a recession in the countries of
destination for example, could devastate the Albanian economy”.69 As it appears, this
situation is now a living one and has left its first impression. The future will show just how
devastating it will become for the Albanian economy.
68 Note, decline in remittances is not the only cause of this. 69 De Zwager et al. (2005), page 47

50
7. Summary and Conclusions
The flow of remittances into Albania began around 1993, two years after the opening of the
country’s borders for international migration, and has since then been growing at a rapid pace.
Migration has come to characterize the Albanian society and remittances are viewed by many
households as the only escape from poverty. A qualitative assessment by the WB in 2001
concluded that the main factor distinguishing a poor family from non-poor ones is
remittances.
The most common channels for remittance flows to Albania are the informal ones – a
concerning fact given their size and potential benefits if used for intermediation. However,
despite the financial schemes of 1996/97, the use of formal channels to remit money has
actually increased impressively, by almost 40% between 1994-2004, which reflects peoples
confidence in the banking system.
As for the geographic distribution, in absolute terms, the largest flows are to the coastal and
central regions. However, proportionately speaking, more and larger amounts flow into the
Mountain areas, which are also the poorest in the country. At the same time, these are the
regions that experience the highest rates of poverty reduction, after the capital Tirana, and the
only ones to experience a decline in inequality. I believe that the link is more complicated
than simply straightforward, although remittances do play a role in the observed trends. In
order to assess their real impact on poverty reduction and inequality on a regional basis,
models need to be constructed to take into account other influencing factors. This paper also
shows, by comparing migrant to non-migrant households, that remittances from permanent
migration have contributed to higher consumption and lower absolute poverty. As for relative
poverty, recipient families’ perceptions are that remittances have improved their financial
situation.
Attention should be paid to the sustainability of remittances as an income source and
especially their impact on agricultural production of the poor households. Studies indicate that
there are indeed moral hazard problems related to remittances in Albania. They point to
reduced labor efforts, lower farming efficiency and lower household levels of investment in
productivity-enhancing and time-saving technologies in agriculture, as a result of remittances.

51
Remittances represent 47% of household income for recipient households (13% for total
households) and are mainly used to finance living expenses and to some extent for home
improvements. Many view the use of remittances for basic consumption as a concern and
argue that the government should channel this money into productive investment. But, this
argument ignores the very nature of remittances – that they are compensatory. Instead, focus
should be turned to attracting into Albania the formal savings of Albanian migrants abroad,
and use these as a source of capital to finance growth. This is where the real development
potential from migration lies.
The impact of remittances on inequality is somewhat harder to assess. Relatively better off
households receive relatively more remittances than poor households, which can have a
negative impact on inequality. On the other hand, the share of remitting migrants and the
mean amount remitted do not differ much between quintiles.
Because remittances in Albania are a relatively recent phenomenon, their long-term effects
have not yet been assessed. Although the direct impact of remittances has so far been positive
for recipient households, this source of income is not stable and does not constitute a
sustainable mechanism for long-term growth and development. According to predictions the
volume of remittances is expected to gradually diminish in the medium term, and in the case
of Albania they are believed to have reached a stage of maturity. The current micro and macro
situations in the country show high dependency on remittances. Consequently, this decrease is
likely to have some negative effects, both on the individual household level, and on the macro
level. Heavily dependent households will most likely return to poverty, and on a national level
there will be currency depreciation and widening of the trade balance.

52
References
Acosta, P.,Calderon, C., Fajnzylber, P., Lopez, H. (2008)”Do Remittances Lower Poverty Levels in Latin America?”, in Remittances and Development edited by Pablo Fajnzylber, J. Humberto Lopez, The World Bank, Washington, D.C.
Adams, R. (2003), “Remittances and Poverty in Ghana”, World Bank Policy Research Paper3838
Adams, R. (2004) "Remittances and Poverty in Guatemala”, World Bank Policy Research Working Paper 3418
Adams, R. (1991), “The effects of International Remittances on Poverty, Inequality and Development in Rural Egypt”, Research Report 86, International Food Policy Research Institute, Washington DC
Adams, R.; Page, J. (2005): “The Impact of International Migration and Remittances on Poverty”, chapter 14 in Remittances: Development Impact and future prospects, edited by S.M Maimbo, and D. Ratha, The World Bank
Adams, R. , Lopez-Feldman, A. , Mora, J. , Taylor, J.E. (2005) “Remittances, Inequality and Poverty: Evidence from Rural Mexico”, Working paper No. 05-003
Bank of Albania 2003, Annual report 2002, Tirana
Bank of Albania 2005, Annual report 2004, Tirana
Bank of Albania 2006, Annual report 2005, Tirana
Bank of Albania 2008, Annual report 2007, Tirana
Barjaba,K and King, R. (2005) “Introducing and theorizing Albanian migration, in The New Albanian Migration edited by King, R., Mai, N. and Scwander-Sievers, S. (eds)
Birks, J.S., C.A Sinclair, (1980), “International Migration and Development in the Arab Region”. Geneva, ILO
Bourdet, Y, Falck, H. (2006), ”Emigrant’s Remittances and Dutch Disease in Cape Verde”, International Economic Journal, vol. 20, nr. 3.
Carletto, G., Davis, B., Stampini, M. and Zezza, A. (2006) “ A country on the move: international migration in post communist Albania”, International Migation review, 40(4)
Carletto, G., Davis, B., Stampini, M. and Zezza, A. (2004) “ International Mobility and International Migration in Albania”, ESA Working paper 04-13
Chami, R., Fullenkamp, C., Jahjah, S. (2003) “Are Immigrant Remittance Flows a Source of Capital for Development?” IMF working paper 2003
De Zwager, N., Gedeshi, I., Germenji, E., Nikas Ch., (2005) ”Competing for remittances”
53
Gedeshi, I.(2006) “From brain drain to brain gain: Mobilizing Albania’s skilled Diaspora”, chapter 8 in How Migration Can Benefit Development, edited by Kristof Tames and Joakim Palme, Institute for Future Studies
Gedeshi, I. (2008) “The Relationship between Migration and Socio-Economic Changes in Albania” in The Role of Migration and Diaspora in the Political and Socio-Economic Reform and EU Integration Processes in South East Europe, Zeitschaft des Institutes fur den Donauraum und Mitteleuropa 3/2008
Germenji, E. , F.M Swinnen, J. (2005) ” Human Capital, Market Imperfections, Poverty, and Migration: Evidence from Albania”, Research Group on Food Policy, Transition & Development (PRG-Leuven)
Gilali, I. (1981) “Labour Migration from Pakistan to the Middle East and its Impact on the Domestic Economy, Part 1”, Pakistan Institute of Development Economics Research Report Series 126
Glytsos, N.P. (1993), ”Measuring the income Effect of Migrant Remittances: A methodological Approach Applied to Greece”, Economic Development and Cultural Change, Vol. 42
Glytsos, N.P. (2002), ”The Role of Migrant Remittances in Development: Evidence from Mediterranean Countries”, International Migration Vol. 40
Gustafsson, B., Makonenn N., (1993),“Poverty and Remittances in Lesotho”, University of Gothenburg
Hagen-Zanken, J., Siegel, M. (2007) ”A critical discussion of the motivations to remit in Albania and Moldova”, working paper MGSoG/2007/WP007
Hatziprokopiou, H. and Labriandis, L. (2005) “The Albanian migration cycle: migrants tend to return to their country of origin after all” in The New Albanian Migration by King, R., Main, N. and Schwandner-Sievers, S. (edc). Brighton: Sussex University Press
IMF (2005), Chapter two: Two current issues facing development countries, page 69 in “World Economic Outlook”, IMF
INSTAT (2002), Albania in figures
IOM (2007), The Republic of Albania Migration Profile
Keely C.B ; Kritz, M.M (1981), “Introduction” in Global Trends in Migration. Edited by M.M Kritz, C.B. Keely and S.M. Tomasi. Staten Island: Center for Migration Studies
Keely, C.B. ; Tran, B.N ; (1989), “Remittances from Labor Migration: Evaluations, Performance and Implications”
Kilic, T., Carletto G., Davis, B., Zezza, A. (2007) “Investing back home: Return Migration and Business Ownership in Albania”, The World Bank, Policy Research Working Paper 4366

54
Korovilas, J.P. (2005) “Remittances and Pyramind investment schemes in Albania” chapter 9 in Remittances- Development Impact and Future Prospects, edited by Maimbo, S.M, Ratha, D.
Kule, D.,Mancellari A., Papaganos, H., Qirici S., Sanfey, P. (2002) ”The causes and consequences of Albanian emigration during transition: evidence from micro-data. International Migration Review 36 (1), 229-39
Lipton, M. (1980),“Migration from Rural Areas of Poor Countries: The Impact of Rural Productivity and Income Distribution”, Institute of Development Studies, University of Sussex
Lopez-Cordova, E. (2004), “Globalization, Migration and Development: The Role of Mexican Migrant Remittances”, Inter-American Development Bank, Integration and Regional Programs Department, INTAL-ITD, Working paper 20
Mai, N. (2002) Between Losing and Finding Oneself. The Role of Italian Television in the Albanian Immigration to Italy.
Mansuri, G. (2007) ”Does Work Migration Spur Investment in Origin Communities? Entrepreneurship, Schooling, and Child Health in Rural Pakistan”, chapter 3 in International Migration, Economic Development and Policy edited by Caglar Özden, Maurice Schiff
Massey, D.S., Parrado, E. (1994), ”Migradollars: The remittances and savings of Mexican Migrants to the United states”, Population research and policy review, 13:3-30
“National Strategy on Migration” – A project of the Albanian Government managed in cooperation with the I.O.M
OECD (2005), ”Migration, Reittances and Development”
Ratha, D. (2003) “Workers Remittances: An important and stable source of external development finance”, page 20 in Remittances – development impact and future prospects edited by Samuel Munzele Maimbo and Dilip Ratha
Russell, S.S. (1986) “Remittances from international migration: A review in perspective”, World Development, Vol 14, No.6
SIDA (2006) “Migration and pro-poor growth in Albania – An integrated economic analysis”, Country Economic Report 2006:5
Vullnetari, J. (2007) “Albanian Migartion and Development: State of the Art Review”, IMISCOE Working Paper, no.18
World Bank, Development Prospects Group (2005) “Migration and Remittances”.
World Bank (2006), “Global economic prospects 2006”, page 90
World Bank (2007), ”Albania: Urban growth, migration and poverty reduction: A poverty assessment” Report No. 40071-AL

55
Wahaba, J. (2005) “What is the Macroeconomic Impact of International Remittances on the Home country?”, chapter 9 in Migration, Remittances and Development, OECD
Zhu, Y. (2006) ”Migration and the development of source areas: Evidence from China”, chapter 11 in How Migration Can Benefit Development edited by Kristof Tamas and Joakim Palme, Institute for future studies

MINOR FIELD STUDY SERIES (A complete list can be ordered from Department of Economics, University of Lund, Box 7082, S-220 07 Lund, Sweden)
170
Jonas Widmark Nature-Based Tourism in the Cuyabeno Reserve of Ecuador – A Choice Experiment Survey. 2006:2
171
Annika Bergman FDI and spillover effects in the Indian pharmaceutical industry. 2006:3
172 Cecilia Eriksson Annika Persson
Convergence in GDP Growth Rates across the Provinces of China. 2006:4
173
Martin Dahlberg Spillover Effects of FDI in the Service Sector in Morocco – A Case Study of the Emerging Call-Centre Industry. 2006:5
174
Christian Svensson Dynamics of Special Economic Areas in South China – Industrial Upgrading and Improving Working Conditions. 2007:1
175 Josefina Danielsson Johanna Persson
Explaining the Success of the Indian IT Industry. 2007:2
176 Maria Holmlund Income Poverty – A Case Study of Sri Lanka 2007:3
177 Emmylou Tuvhag The Costa Rican Experience of Fair Trade Coffee – Impact on producers and producer organisations 2007:4
178
Mikael Fridell Exploring the Roles of Informal, Formal and Semiformal Microcredit in Jordan. 2007:5
179 Åsa Hindenborg On the Role of Remittances in Microfinance – Creating Transnational Financial Services in El Salvador. 2007:6
180 Linna Palmqvist Corporate Social Responsibility and Development – A case study of the CSR strategies of international companies in India. 2007:7

181 Peter Holmvall Remittances and Poverty – A case study of the Philippines. 2007:8
182 Charlotta Undén Multinational Corporations and Spillovers in Vietnam – Adding Corporate Social Responsibility. 2007:9
183 Emil Samnegård How Does Fairtrade Affect the Market? A Case Study in South Africa. 2007:10
184 Emma Svensson Microfinance, Financial Systems and Economic Growth – A Theoretical Framework and Findings from Bolivia. 2007:11
185 Sonja Luoma Maria Persson
A Path to a Life of Dreams? A Study on Financial Markets, Microcredit and Gender in Uganda. 2008:1
186 Gabriel Andréasson Evaluating the Effects of Economic Sanctions against Burma. 2008:2
187 Katarina Öjteg Socio-economic Determinants of HIV in Zambia – A District-level Analysis. 2009:1
188 Tora Bäckman Fairtrade Coffee and Development – A Field Study in Ethiopia. 2009:2
189 Sara Forssell Rice Price Policy in Thailand – Policy Making and Recent Developments. 2009:3
190 Tora Hammar Trade Facilitation in Vietnam – Recent Progress and Impact. 2009:4
191 Joakim Persson The Impact of a Quota System on Women’s Empowerment – A Field Study in West Bengal, India. 2009:5
192 Erudita Hoti Remittances and Poverty in Albania. 2009:6