remedial investigation/feasibility study sauro’s
TRANSCRIPT

950 Pacific Avenue, Suite 515 Tacoma, WA 98402
(253) 926-2493
August 29, 2014
Prepared for
City of Tacoma Tacoma, Washington
Remedial Investigation/Feasibility Study Sauro’s Cleanerama Site
Tacoma, Washington

8/29/14 Y:\094\048.012\R\RIFS\RI-FS__FINAL.docx LANDAU ASSOCIATES ii
TABLE OF CONTENTS
Page
1.0 INTRODUCTION 1-1 1.1 SITE SETTING 1-1 1.2 SITE BACKGROUND AND HISTORY 1-2 1.3 HYDROGEOLOGIC SETTING 1-3
1.3.1 Site Surface Topography 1-3 1.3.2 Site Soil Conditions 1-4 1.3.3 Site Groundwater Conditions 1-4
1.4 REGULATORY FRAMEWORK 1-5 1.5 PURPOSE 1-6 1.6 REPORT ORGANIZATION 1-6
2.0 PREVIOUS SITE INVESTIGATIONS 2-1 2.1 PRE-REMEDIAL INVESTIGATION RESULTS 2-2
2.1.1 Volatile Organic Compounds 2-2 2.1.1.1 Soil 2-2 2.1.1.2 Groundwater 2-4
2.1.2 Petroleum Hydrocarbons 2-4 2.1.2.1 Sauro’s Property 2-4 2.1.2.2 Other Properties 2-5
2.1.3 Metals 2-5 2.1.3.1 Chromium 2-6 2.1.3.2 Cadmium 2-6 2.1.3.3 Mercury 2-6 2.1.3.4 Lead and Arsenic 2-7
2.2 SUMMARY OF PRE-REMEDIAL INVESTIGATION FINDINGS 2-7
3.0 INTERIM ACTION 3-1 3.1 SUMMARY OF INTERIM ACTION EXCAVATION 3-1 3.2 DEVIATION FROM THE MAXIMUM EXCAVATION DEPTH 3-2 3.3 UNEXPECTED PETROLEUM-CONTAMINATED SOIL 3-3 3.4 CONFIRMATION SAMPLING 3-3 3.5 DECOMMISSIONED WELLS 3-4 3.6 TANK REMOVAL 3-4
4.0 PRELIMINARY SCREENING LEVELS 4-1 4.1 PRELIMINARY CONCEPTUAL SITE MODEL 4-1 4.2 GROUNDWATER SCREENING CRITERIA AND SCREENING LEVELS 4-2
4.2.1 Protection of Indoor Air 4-3 4.2.2 Protection of Most Beneficial Use 4-4
5.0 REMEDIAL INVESTIGATION ACTIVITIES 5-1 5.1 CHRONOLOGY OF SITE INVESTIGATION ACTIVITIES 5-1 5.2 SOIL INVESTIGATION 5-1
5.2.1 2001 Excavation Area Borings 5-1 5.2.2 Additional Onsite Borings 5-1 5.2.3 South End Borings 5-2
5.3 DAVITA DRAIN AND OUTFALL INVESTIGATION 5-3

8/29/14 Y:\094\048.012\R\RIFS\RI-FS__FINAL.docx LANDAU ASSOCIATES iii
5.4 VAPOR INTRUSION ASSESSMENT 5-4 5.5 GROUNDWATER INVESTIGATIONS 5-4
5.5.1 Installation of New Source Area Well 5-4 5.5.2 Dock Street Direct-Push Investigation 5-5
5.6 GROUNDWATER MONITORING 5-5 5.6.1 Groundwater Level Monitoring 5-6 5.6.2 Pre-Interim Action Sampling Program 5-6 5.6.3 Quarterly Remedial Investigation Sampling Program 5-7
5.6.3.1 Quarterly Volatile Organic Sampling 5-7 5.6.3.2 Quarterly Monitored Natural Attenuation Sampling 5-7 5.6.3.3 Sampling of Non-Project Wells 5-8
5.6.4 Water Quality Sampling and Analysis Plan 5-8
6.0 REMEDIAL INVESTIGATION RESULTS 6-1 6.1 SOIL QUALITY 6-1 6.2 DAVITA DRAIN AND OUTFALL WATER QUALITY 6-1 6.3 VAPOR INTRUSION ASSESSMENT RESULTS 6-2 6.4 GROUNDWATER QUALITY 6-2
6.4.1 Dock Street Direct-Push Investigation Results 6-3 6.4.2 Groundwater Monitoring Volatile Organic Compound Results 6-4
6.4.2.1 Plume Extent 6-4 6.4.2.2 Concentration Trends – Primary Plume 6-4 6.4.2.3 Concentration Trends – Secondary Plume 6-5
6.4.3 Monitored Natural Attenuation Parameters 6-6 6.5 CONTAMINANT FATE AND TRANSPORT 6-8
7.0 CLEANUP REQUIREMENTS 7-1 7.1 TERRESTRIAL ECOLOGICAL EVALUATION 7-1 7.2 CLEANUP STANDARDS 7-2
7.2.1 Development of Cleanup Levels 7-2 7.2.1.1 Soil 7-2 7.2.1.2 Groundwater 7-2
7.2.2 Points of Compliance 7-3 7.2.2.1 Soil 7-3 7.2.2.2 Groundwater 7-3
7.3 REMEDIAL ACTION OBJECTIVES 7-4 7.4 APPLICABLE OR RELEVANT AND APPROPRIATE REQUIREMENTS 7-5
8.0 SCREENING OF REMEDIAL TECHNOLOGIES 8-1 8.1 OVERVIEW OF EXISTING REMEDIAL TECHNOLOGY 8-1 8.2 REMEDIAL TECHNOLOGIES 8-1 8.2.1 INSTITUTIONAL CONTROLS 8-1 8.2.2 GROUNDWATER CONTAINMENT 8-2 8.2.3 MONITORED NATURAL ATTENUATION 8-2 8.2.4 ENHANCED IN SITU BIOREMEDIATION 8-3 8.2.5 IN SITU CHEMICAL OXIDATION 8-3 8.2.6 AIR SPARGE / SOIL VAPOR EXTRACTION 8-4 8.2.7 IN-WELL AIR STRIPPING 8-5 8.2.8 ZERO VALENT IRON 8-6 8.2.9 HYDRAULIC CONTROL BY PUMP AND TREAT 8-7 8.2.10 ELECTRICAL RESISTANCE HEATING 8-7

8/29/14 Y:\094\048.012\R\RIFS\RI-FS__FINAL.docx LANDAU ASSOCIATES iv
8.2.11 EXCAVATION 8-8
9.0 DESCRIPTION AND EVALUATION OF ALTERNATIVES 9-1 9.1 ALTERNATIVE 1: MONITORED NATURAL ATTENUATION WITH INSTITUTIONAL
CONTROLS 9-1 9.2 ALTERNATIVE 2: ENHANCED IN SITU BIOREMEDIATION 9-4 9.3 ALTERNATIVE 3: OZONE SPARGING 9-6 9.4 ALTERNATIVE 4: ELECTRICAL RESISTANCE HEATING 9-7
10.0 DETAILED EVALUATION OF ALTERNATIVES 10-1 10.1 MODEL TOXICS CONTROL ACT EVALUATION CRITERIA 10-1
10.1.1 Model Toxics Control Act Threshold Requirements 10-1 10.1.2 Requirement for Permanent Solution to the Maximum Extent Practicable 10-1 10.1.3 Requirement for a Reasonable Restoration Timeframe 10-3 10.1.4 Requirement for Consideration of Public Concerns 10-3
10.2 COMPARATIVE ANALYSIS OF ALTERNATIVES 10-3 10.2.1 Threshold Requirements 10-3 10.2.2 Permanent Solutions to the Maximum Extent Practicable 10-4
10.2.2.1 Protectiveness 10-4 10.2.2.2 Permanence 10-5 10.2.2.3 Effectiveness over the Long-Term 10-6 10.2.2.4 Management of Short-Term Risks 10-7 10.2.2.5 Technical and Administrative Implementability 10-7 10.2.2.6 Consideration of Public Concerns 10-8 10.2.2.7 Cost 10-9
10.2.3 Restoration Timeframe 10-9 10.2.4 Requirement for Consideration of Public Concerns 10-10
10.3 MODEL TOXICS CONTROL ACT DISPROPORTIONATE COST ANALYSIS 10-10 10.3.1 Comparative Evaluation of Alternatives 10-11
10.3.1.1 Protectiveness 10-11 10.3.1.2 Permanence 10-12 10.3.1.3 Effectiveness over the Long-Term 10-12 10.3.1.4 Management of Short-Term Risks 10-13 10.3.1.5 Technical and Administrative Implementability 10-13 10.3.1.6 Consideration of Public Concerns 10-14
10.3.2 Comparison of Overall Benefits (Relative Benefit Scores) 10-14 10.3.3 Disproportionate Cost Analysis 10-14
11.0 SUMMARY AND CONCLUSIONS OF FEASIBILITY STUDY 11-1 11.1 PREFERRED ALTERNATIVE 11-1 11.2 IMPLEMENTATION OF SITE CLEANUP 11-2
12.0 USE OF THIS REPORT 12-1
13.0 REFERENCES 13-1

8/29/14 Y:\094\048.012\R\RIFS\RI-FS__FINAL.docx LANDAU ASSOCIATES v
This page intentionally left blank.

8/29/14 Y:\094\048.012\R\RIFS\RI-FS__FINAL.docx LANDAU ASSOCIATES vi
FIGURES
Figure Title
1-1 Vicinity Map 1-2 Site Location and Surrounding Properties 1-3 Surface Topography and Geologic Cross-section Area 1-4 Geologic Cross-section A-A’ 1-5 Pre-Interim Action Groundwater Elevation Contours April 2009 1-6 Most Recent Groundwater Elevation Contours November 2013 1-7 Groundwater Elevation Hydrograph and Precipitation – Primary Plume 1-8 Groundwater Elevation Hydrograph and Precipitation – Secondary Plume 2-1 Pre-RI Site Explorations 2-2 Pre-RI Site Explorations Soil PCE Concentrations 2-3 Pre-RI Groundwater VOC Plumes PCE Concentrations 2-4 Pre-RI Groundwater VOC Plumes TCE Concentrations 2-5 Pre-RI Groundwater VOC Plumes Cis-1,2-DCE Concentrations 2-6 Pre-RI Groundwater VOC Plumes Vinyl Chloride Concentrations 3-1 Interim Action Excavation 3-2 Interim Action Decommissioned Wells and Tanks 4-1 Conceptual Site Model 5-1 RI Site Explorations 5-2 DaVita Drain Investigation Hydraulic Details 5-3 Dock Street – Direct Push Cross-section B-B’ 5-4 Existing Monitoring Well Network and Cross-section Area 5-5 RI Groundwater Monitoring Locations VOC Sampling 5-6 RI Groundwater Monitoring Locations – MNA Sampling 6-1a RI Groundwater VOC Plumes Most Recent PCE Concentrations 6-1b RI Groundwater VOC Plumes Most Recent TCE Concentrations 6-1c RI Groundwater VOC Plumes Most Recent cis-1,2-DCE Concentrations 6-1d RI Groundwater VOC Plumes Most Recent Vinyl Chloride Concentrations 6-2a Vertical Extent of PCE Most Recent 6-2b Vertical Extent of TCE Most Recent 6-2c Vertical Extent of cis-1,2-DCE Most Recent 6-2d Vertical Extent of Vinyl Chloride Most Recent 6-3a PCE Concentrations vs. Time Select Primary Plume Wells 6-3b TCE Concentrations vs. Time Select Primary Plume Wells 6-3c Cis-1,2-DCE Concentrations vs. Time Select Primary Plume Wells 6-3d Vinyl Chloride Concentrations vs. Time Select Primary Plume Wells 6-4a Select Volatile Organic Compound Concentrations at RNS-MW6 6-4b Select Volatile Organic Compound Concentrations at MW-13 6-4c Select Volatile Organic Compound Concentrations at LAI-MW2 6-4d Select Volatile Organic Compound Concentrations at LAI-MW3 6-4e Select Volatile Organic Compound Concentrations at LAI-MW4 6-5a Select Volatile Organic Compound Concentrations at RNS-MW2 6-5b Select Volatile Organic Compound Concentrations at MW-2 6-6 RI Natural Attenuation Data September 2013 6-7 RI Natural Attenuation Interpretation Summary 6-8a Total Ethenes Concentrations Select Primary Plume Wells 6-8b Total Ethenes Molar Concentrations vs. Time Select Secondary Plume Wells 9-1 Alternative 1 – MNA with Institutional Controls

8/29/14 Y:\094\048.012\R\RIFS\RI-FS__FINAL.docx LANDAU ASSOCIATES vii
9-2 Alternative 2 – EISB 9-3 Alternative 3 – ISCO Ozone Sparging 9-4 Alternative 4 - ERH 10-1 Disproportionate Cost Analysis Relative Cost/Benefit Ratio
TABLES
Table Title
1-1 Monitoring Well Details 2-1 Pre-Remedial Investigation Volatile Organic Compound Soil Analytical Results 2-2 Pre-Remedial Investigation Petroleum Hydrocarbon Soil Analytical Results 2-3 Pre-Remedial Investigation Metals Soil Analytical Results 2-4 Pre-Remedial Investigation Volatile Organic Compound Groundwater Analytical Results 2-5 Pre-Remedial Investigation Petroleum Hydrocarbons Groundwater Analytical Results 2-6 Pre-Remedial Investigation Total Metals Groundwater Analytical Results 3-1 Petroleum Soil Analytical Results 3-2 Final Confirmation Samples Soil Analytical Results 4-1 Groundwater Vapor Intrusion Screening Criteria 4-2 Preliminary Groundwater Screening Levels 5-1 Remedial Investigation Groundwater Elevations Summary 5-2 Remedial Investigation Quarterly Sampling Locations, Depths, and Methods 5-3 Remedial Investigation Quarterly Sampling Laboratory and Field Parameter Details 6-1 Remedial Investigation Soil Summary Stats 6-2 Remedial Investigation Soil Volatile Organic Compound Sampling - Analytical Results 6-3 DaVita Drain and Outfall Water Volatile Organic Compound Analytical Results 6-4 Remedial Investigation Direct-push Investigation Groundwater Volatile Organic Compound
Analytical Results 6-5 Remedial Investigation Quarterly Groundwater Volatile Organic Compound Analytical
Results – Constituents of Concern 6-6 Remedial Investigation Quarterly Groundwater Monitored Natural Attenuation Parameters 6-7 Natural Attenuation Scoring Results Summary 7-1 Groundwater and Soil Preliminary Cleanup Levels 9-1 Alternative 1 – Monitored Natural Attenuation Sampling Plan 9-2 Alternatives Cost Estimate Summary 10-1 Summary of Model Toxics Control Act Alternatives Evaluation and Disproportionate Cost
Alternatives Ranking
APPENDICES
Appendix Title
A Agreed Order B Investigation Timeline and Reference Documents C Pre-Remedial Investigation Soil Borings and Well Logs D Investigation-Derived Waste Disposal Documentation

8/29/14 Y:\094\048.012\R\RIFS\RI-FS__FINAL.docx LANDAU ASSOCIATES viii
E Post-Interim Action Construction As-Builts F Decommissioned Well Logs and Reports G Underground Storage Tank Decommissioning and Removal Documentation H Groundwater Screening Levels for Vapor Intrusion Pathway – Calculations I Remedial Investigation Well and Boring Logs J Remedial Investigation Analytical Results (on DVD) K Vapor Intrusion Assessment Letter and Ecology Approval L September 2013 Quarterly MNA Parameters – MNA Remedy Evaluation Scoring Sheets M Remedial Alternative Cost Estimates

8/29/14 Y:\094\048.012\R\RIFS\RI-FS__FINAL.docx LANDAU ASSOCIATES ix
This page intentionally left blank.

8/29/14 Y:\094\048.012\R\RIFS\RI-FS__FINAL.docx LANDAU ASSOCIATES x
LIST OF ABBREVIATIONS AND ACRONYMS
ºC Degrees Celsius AO Agreed Order AS Air Sparge ARAR Applicable or Relevant and Appropriate Requirement ARI Analytical Resources, Inc. BGS Below Ground Surface BNSF Burlington Northern Santa Fe BTEX Benzene, Toluene, Ethylbenzene, and Xylenes CAP Cleanup Action Plan cfm/sf Cubic Feet per Minute per Square Foot cm/s Centimeters per Second CFR Code of Federal Regulations cis-1,2-DCE Cis-1,2-Dichloroethene City City of Tacoma COC Chemical of Concern CPOC Conditional Point of Compliance CSM Conceptual Site Model CUL Cleanup Level DCA Disproportionate Cost Analysis DRO Diesel-Range Organics Ecology Washington State Department of Ecology EISB Enhanced In situ Bioremediation EPA U.S. Environmental Protection Agency ESA Environmental Site Assessment FS Feasibility Study ft Foot/Feet GAC Granular Activated Carbon GRO Gasoline-Range Organics HBU Highest Beneficial Use IDW Investigation-Derived Waste I 705 Interstate 705 ISCO In situ Chemical Oxidation ISIS Integrated Site Information System (Ecology) IWAS In-Well Air Stripping kwh Kilowatt Hours L/m3 Liters per Cubic Meter L/min Liters per Minute LNAPL Light Non-Aqueous Phase Liquid MCL Maximum Contaminant Level µg/L Micrograms per Liter µg/kg Micrograms per Kilogram µg/m3 Micrograms per Cubic Meter mg/kg Milligrams per Kilogram MNA Monitored Natural Attenuation MSL Mean Sea Level MTCA Model Toxics Control Act NAPL Non-Aqueous Phase Liquid

8/29/14 Y:\094\048.012\R\RIFS\RI-FS__FINAL.docx LANDAU ASSOCIATES xi
NGVD29 National Geodetic Vertical Datum of 1929 nZVI Nano-scale Zero Valent Iron PCE Tetrachloroethene PDB Passive Diffusion Bag PID Photoionization Device PQL Practical Quantitation Limit PRB Permeable Reactive Barriers RAO Remedial Action Objective RCW Revised Code of Washington RI Remedial Investigation RME Reasonable Maximum Exposure ROI Radii of Injection ROW Right-of-Way SDWA Safe Drinking Water Act SEPA State Environmental Policy Act SL Screening Level SLGW Screening Level for Groundwater SLIA Screening Level for Indoor Air SVE Soil Vapor Extraction TCE Trichloroethene TPH-D Diesel-Range Total Petroleum Hydrocarbon TPH-G Gasoline-Range Total Petroleum Hydrocarbon UIC Underground Injection Control USGS U.S. Geological Survey USPS U.S. Postal Service UST Underground Storage Tank VAF Vapor Attenuation Factor VC Vinyl Chloride VCP Voluntary Cleanup Program VI Vapor Intrusion VOC Volatile Organic Compound WAC Washington Administrative Code WARM Washington Ranking Method WSDOT Washington State Department of Transportation ZVI Zero Valent Iron

8/29/14 Y:\094\048.012\R\RIFS\RI-FS__FINAL.docx LANDAU ASSOCIATES 1-1
1.0 INTRODUCTION
This document presents the remedial investigation and feasibility study (RI/FS) for the former
Sauro’s Cleanerama dry cleaner property (Sauro’s property or the property) located at 1401, 1407, and
1409 Pacific Avenue in Tacoma, Washington (Figure 1-1). Historical operations conducted at the former
Sauro’s property resulted in releases of hazardous substances (chlorinated solvents) to soil and
groundwater that impacted adjacent and downgradient properties. Therefore, the overall Site1 evaluated
for this RI/FS includes the Sauro’s property and the surrounding impacted area. The approximate extent
of the Site falls within the project area shown on Figure 1-1.
The City of Tacoma (City) purchased the Sauro’s property from the Sauro Estate on January 9,
2009. Subsequently, on March 30, 2009, the City and Washington State Department of Ecology
(Ecology) entered into AO No. DE 4283. The AO defines the mutual objectives of Ecology and the City
and the associated Site cleanup work needed. Landau Associates was selected by the City to implement
AO requirements including the RI/FS and the draft cleanup action plan (CAP); the CAP will be presented
in a separate document following Ecology approval of the FS and selection of the preferred remedial
alternative. The AO is provided as Appendix A2 . The Ecology issued Facility-Site ID is 4339824 and
the Cleanup Site ID is 3310.
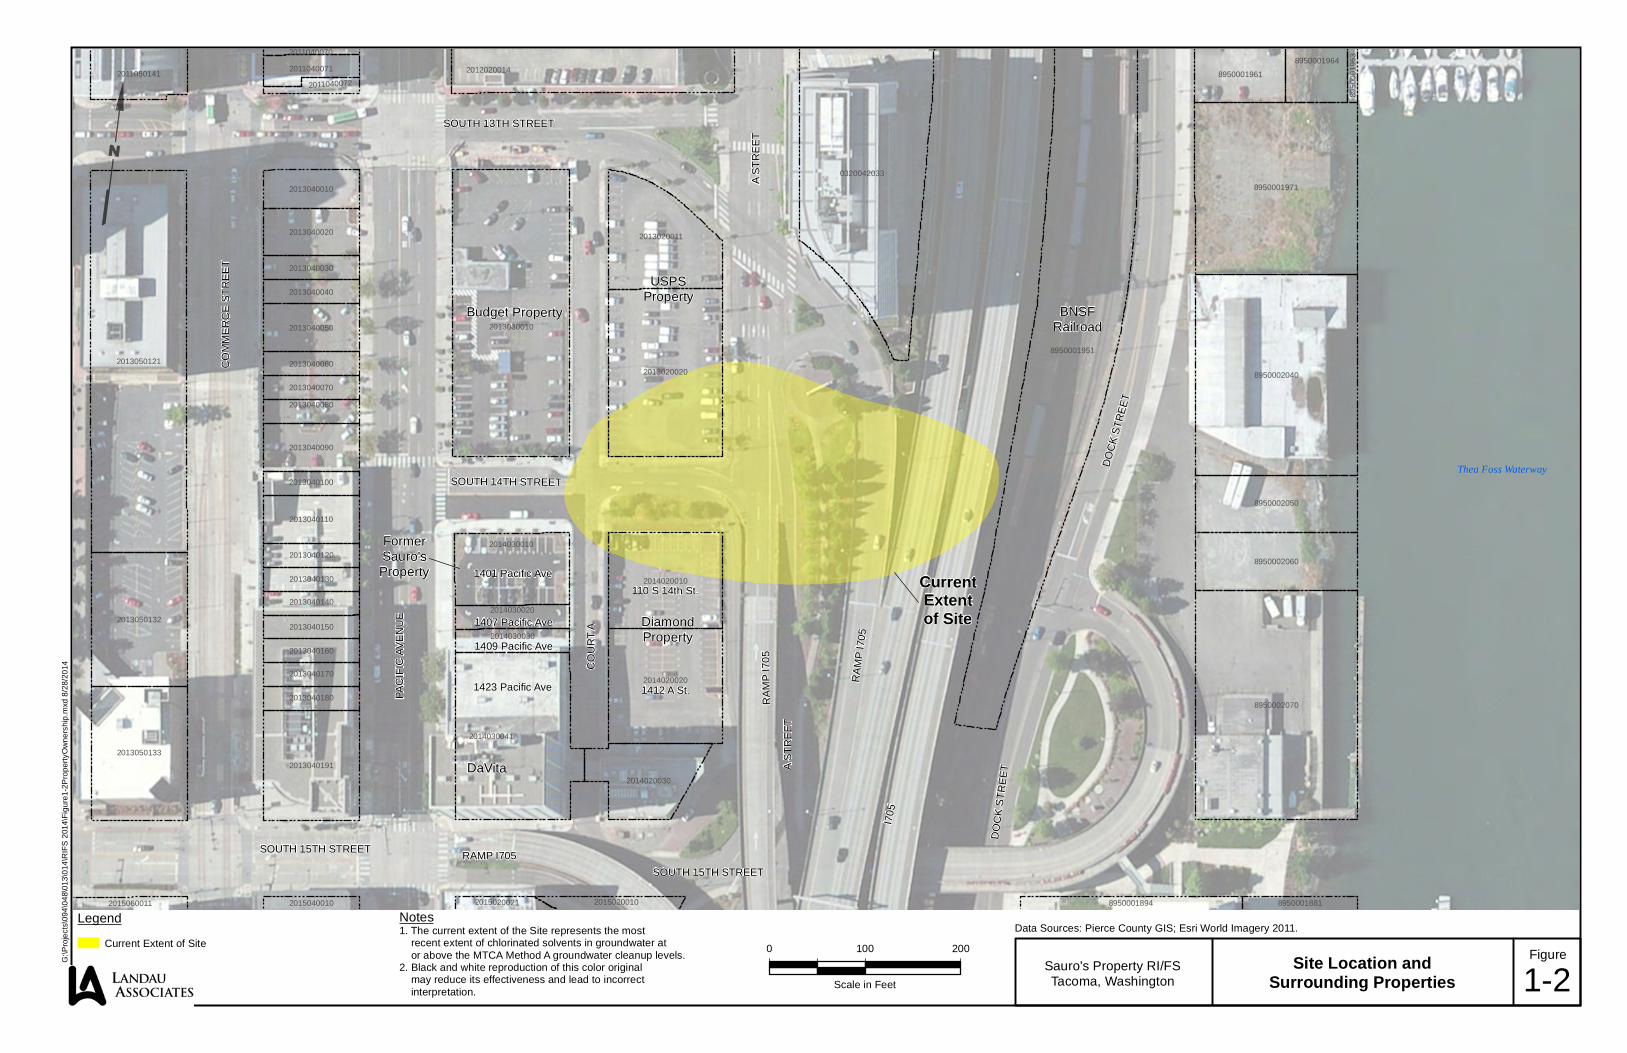
1.1 SITE SETTING The Sauro’s property is located in an urban downtown area that is zoned as Downtown
Commercial Core (City of Tacoma website 2014). The Sauro’s property is surrounded by commercial
office buildings, parking structures, and public right-of-way (ROW). It is bounded to the west by Pacific
Avenue, to the north by South 14th Street, to the east by Court A, and to the south by the DaVita property
(a commercial office building). The Sauro’s property includes three separate addresses and parcels: 1401
(parcel 2014030010; 0.21 acre), 1407 (parcel 2014030020; 0.07 acre), and 1409 (parcel 2014030030;
0.07 acre) Pacific Avenue. Cumulatively, the parcels make up a total of 0.35 acres. The parcels are
currently developed as a surface parking lot that was constructed in 2011. The Sauro’s property and
neighboring properties are shown on Figure 1-2.
The current extent of the Site is defined by recent volatile organic compound (VOC) groundwater
contamination. The Site extends from just northeast of the Sauro’s property along South 14th Street
eastward toward the Thea Foss Waterway. The Site is bounded to the west between Court A and Pacific
1 As defined by the Sauro’s property Agreed Order (AO) No. DE4283, the Site is defined to include both the real property where Sauro’s Cleanerama operated (1401, 1407, and 1409 Pacific Avenue) as well as the extent of contamination caused by the hazardous releases from the former Sauro’s property.
2 The project schedule in the AO was modified three times with Ecology approval to allow for additional RI groundwater characterization. The most recent schedule extension request was approved in December 2012 (Landau Associates 2012a).

8/29/14 Y:\094\048.012\R\RIFS\RI-FS__FINAL.docx LANDAU ASSOCIATES 1-2
Avenue, to the north between South 13th Street and South 14th Street, to the east near Dock Street, and just
to the south of South 14th Street. A number of properties are located within or in close proximity to the
Site boundary. These properties include commercial businesses, City ROW, Washington State
Department of Transportation (WSDOT) ROW [i.e., Interstate 705 (I-705)], and Burlington Northern
Santa Fe (BNSF) ROW (rail lines along Dock Street). The commercial businesses include a parking lots
referred to herein as Budget3 (car rental), U. S. Postal Service (USPS)4, Diamond (public parking), and
DaVita (a commercial building). These properties and the approximate extent of the Site are shown on
Figure 1-2.
1.2 SITE BACKGROUND AND HISTORY Prior to the development of downtown Tacoma, a deep gulch ran across the Sauro’s property in a
southeasterly orientation (Landau Associates 2008a). The gulch was filled as Tacoma was developed.
The Sauro’s property was initially developed in the late 1800s as hotel and lodging facilities. By 1931, a
multi-story commercial building was built on the property that apparently housed a number of businesses
throughout its history, including:
• 1920s: Tokyo Laundry
• 1923 to 1955: North Coast Transportation Co./Central Terminal/Greyhound Lines
• 1940s: Gray Co./Asbestos Materials Co.
• 1947 to 1958: An unnamed dry cleaner at 1409 Pacific Ave. (Saltbush 2000); the dry cleaner that operated at this time appears to be “Vete Sauro Clothes Cleaner” (Landau Associates 2008a)
• 1960s to 1999: Sauro’s Dry Cleaning
• 1942 to 1955: Eastern Electroplating Co.
• 1959 to 1969: Unnamed electroplating facility (Saltbush 2000)
• 1950s: Depot Cleaners & Hatters
• 1962 to 1973: Various taxi companies.
The building on the southern parcel of the Sauro’s property (1409 Pacific Avenue) was listed as
“Vete Sauro Clothes Cleaner” in 1949 (Landau Associates 2008a). In approximately 1959, the building
was demolished and that parcel remained vacant with exposed soil and vegetation until 2011. The
northern two parcels were occupied by the Sauro family5 and operated as a dry cleaning facility called
“Sauro’s Cleanarama” from 1961 to 2000. The building on the northern two parcels (1401 and 1407
Pacific Avenue) was demolished in 2001 leaving a vacant, fenced dirt lot. A detailed history of activities
3 Parking lot previously operated as Budget car rental; its current use appears to be public parking operated by Republic Parking. 4 Parking lot operated by Republic Parking and is partially used by USPS. 5 The potential relationship between the owners of the “Vete Sauro Clothes Cleaner” and “Sauro’s Dry Cleaning” is inconclusive.

8/29/14 Y:\094\048.012\R\RIFS\RI-FS__FINAL.docx LANDAU ASSOCIATES 1-3
conducted at the Sauro’s property prior to 2008 is presented in a Phase I report (Landau Associates
2008a) and is summarized in Section 2.0.
In January 2009, the City purchased the Sauro’s property from the Sauro Estate and entered into
the AO with Ecology, marking the beginning of the RI. An interim action to remove contaminated
vadose zone soil was conducted beginning in the fall of 2009 (2009 interim action) and was completed
January 2010 (Section 3.0). RI investigations and groundwater monitoring activities were conducted just
before and following the interim action through December 2013 (Section 4.0).
During the spring of 2011 the Sauro’s property was redeveloped as a porous asphalt parking lot.
The property was filled with gravel borrow and quarry spalls (an infiltration gallery) and was topped with
a porous asphalt parking lot in accordance with the geotechnical conclusions and recommendations
(Landau Associates 2010a). Since the bottom of the infiltration gallery was not lined, water from the
parking lot infiltrates and migrates down into underlying soil.
1.3 HYDROGEOLOGIC SETTING Hydrogeologic conditions have been defined by multiple site investigations. Currently,
groundwater conditions are monitored at 15 existing project monitoring wells; the details of these
monitoring wells are presented in Table 1-1.
1.3.1 SITE SURFACE TOPOGRAPHY The northwest corner of the Sauro’s property where Pacific Avenue and South 14th Street
intersect is at about elevation 64 feet [ft; National Geodetic Vertical Datum of 1929 (NGVD29)]. Court
A, located along the east side of the Sauro’s property, slopes gradually downward from about elevation 62
ft at the northeast property corner to about elevation 54 ft at the southeast property corner. Prior to
conducting the 2009 interim action, the Sauro’s property was approximately one story lower (elevation 54
ft) than adjacent street grades within the northern half of the property, and up to two stories (elevation 40
ft) lower within the southern half of the property. Since completion of the interim action and the
installation of the porous asphalt parking lot, the Sauro’s property grades are flush with Pacific Avenue at
the high point and maintain a gradual slope to the southeast. The only neighboring property within the
Site with known below-grade construction is the Budget property, which has one story below-grade
parking. The surface topography of the Site and surrounding area was first presented in the Phase 2
Investigation report (Landau Associates 2008b) and is represented here on Figure 1-3.
8/29/14 Y:\094\048.012\R\RIFS\RI-FS__FINAL.docx LANDAU ASSOCIATES 1-4
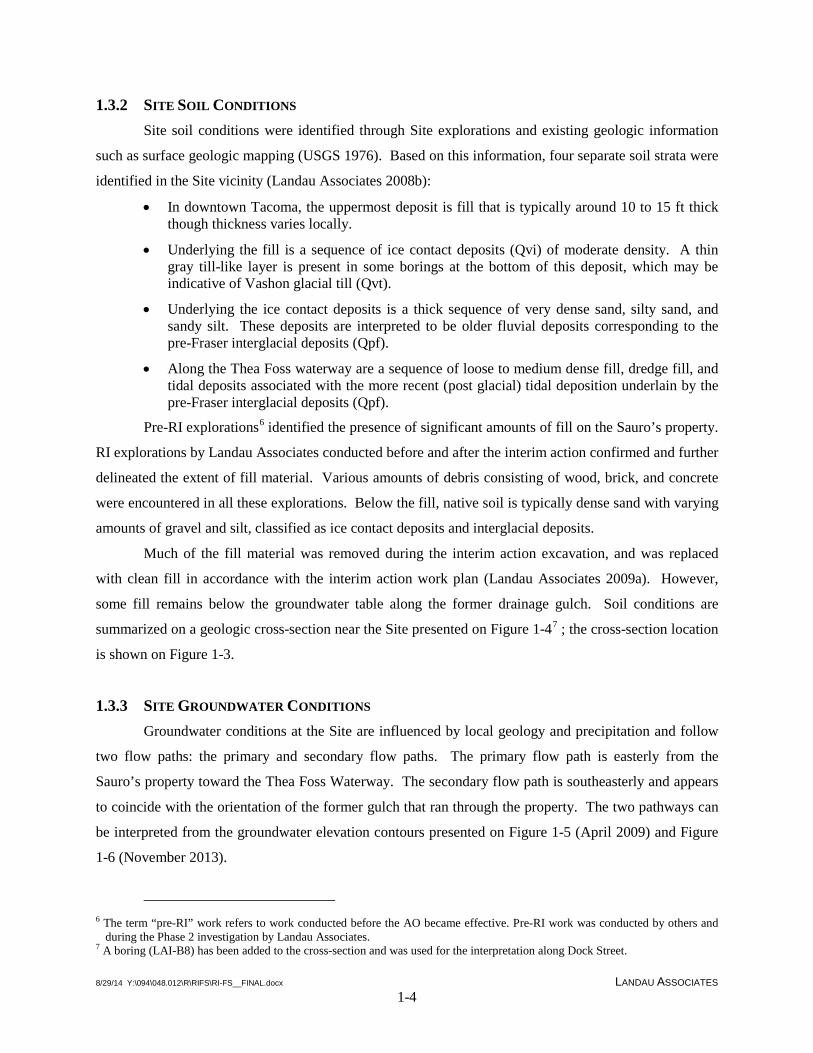
1.3.2 SITE SOIL CONDITIONS Site soil conditions were identified through Site explorations and existing geologic information
such as surface geologic mapping (USGS 1976). Based on this information, four separate soil strata were
identified in the Site vicinity (Landau Associates 2008b):
• In downtown Tacoma, the uppermost deposit is fill that is typically around 10 to 15 ft thick though thickness varies locally.
• Underlying the fill is a sequence of ice contact deposits (Qvi) of moderate density. A thin gray till-like layer is present in some borings at the bottom of this deposit, which may be indicative of Vashon glacial till (Qvt).
• Underlying the ice contact deposits is a thick sequence of very dense sand, silty sand, and sandy silt. These deposits are interpreted to be older fluvial deposits corresponding to the pre-Fraser interglacial deposits (Qpf).
• Along the Thea Foss waterway are a sequence of loose to medium dense fill, dredge fill, and tidal deposits associated with the more recent (post glacial) tidal deposition underlain by the pre-Fraser interglacial deposits (Qpf).
Pre-RI explorations6 identified the presence of significant amounts of fill on the Sauro’s property.
RI explorations by Landau Associates conducted before and after the interim action confirmed and further
delineated the extent of fill material. Various amounts of debris consisting of wood, brick, and concrete
were encountered in all these explorations. Below the fill, native soil is typically dense sand with varying
amounts of gravel and silt, classified as ice contact deposits and interglacial deposits.
Much of the fill material was removed during the interim action excavation, and was replaced
with clean fill in accordance with the interim action work plan (Landau Associates 2009a). However,
some fill remains below the groundwater table along the former drainage gulch. Soil conditions are
summarized on a geologic cross-section near the Site presented on Figure 1-47 ; the cross-section location
is shown on Figure 1-3.
1.3.3 SITE GROUNDWATER CONDITIONS Groundwater conditions at the Site are influenced by local geology and precipitation and follow
two flow paths: the primary and secondary flow paths. The primary flow path is easterly from the
Sauro’s property toward the Thea Foss Waterway. The secondary flow path is southeasterly and appears
to coincide with the orientation of the former gulch that ran through the property. The two pathways can
be interpreted from the groundwater elevation contours presented on Figure 1-5 (April 2009) and Figure
1-6 (November 2013).
6 The term “pre-RI” work refers to work conducted before the AO became effective. Pre-RI work was conducted by others and
during the Phase 2 investigation by Landau Associates. 7 A boring (LAI-B8) has been added to the cross-section and was used for the interpretation along Dock Street.

8/29/14 Y:\094\048.012\R\RIFS\RI-FS__FINAL.docx LANDAU ASSOCIATES 1-5
Groundwater elevations along the primary flow path fluctuate up to approximately 4.5 ft (RNS-
MW6; closest to the Sauro’s property) to 1.51 ft (LAI-MW3; farthest from Sauro’s property).
Groundwater elevations along the secondary flow path fluctuate up to approximately 5.7 ft (RNS-MW2;
closest to the Sauro’s property) to 1.39 ft (RNS-MW3; farthest from Sauro’s property along centerline of
flow path). Groundwater levels along Dock Street are tidally influenced and can fluctuate up to
approximately 2.5 ft (LAI-MW4). Groundwater elevation hydrographs and precipitation over time along
the two pathways are provided in Figure 1-7 and Figure 1-8; these data are from the RI monitoring period
(April 2009 through September 2013).
1.4 REGULATORY FRAMEWORK The previous owner (Sauro Estate) conducted a number of pre-RI field investigation activities as
independent actions beginning in 1992 (Kennedy Jenks 1992). Ecology first listed the “Sauro Estate” in
their Integrated Site Information System (ISIS) on July 12, 2000, marking the date of Site discovery or
receipt of a Site release report (Ecology website 2014a). The Sauro Estate entered the Site into Ecology’s
Voluntary Cleanup Program (VCP) on March 28, 2001. The Site was withdrawn from the VCP on
November 20, 2006, and on February 16, 2007, Ecology informed the Sauro’s Estate that they intended to
address remediation at the Site under a formal process with an AO. From September 6, 2007 to February
6, 2008 Ecology conducted a site hazard assessment and subsequently placed the Site on its Confirmed
and Suspected Contaminated Sites List, and gave the Site a “1” ranking under the Washington Ranking
Method (WARM)8 .
On January 9, 2009, the City purchased the property from the Sauro’s Estate with the intent of
redevelopment for commercial use. On March 19, 2009, the City and Ecology entered into AO No. DE
4283; all investigations conducted since March 19, 2009 are termed RI field investigations (except for the
interim action9 ). The order requires that the City perform an RI/FS and prepare a report, prepare a draft
CAP, and perform Site cleanup in accordance with the Ecology-approved final CAP. Site cleanup,
including this RI/FS, is being accomplished under Revised Code of Washington (RCW) 70.105D.090,
Washington State’s Model Toxics Control Act (MTCA). Ecology holds regulatory authority over MTCA
in the State of Washington.
8 The WARM categorizes contaminated sites between 1 and 5, with 1 representing the highest priority for cleanup. 9 The City elected to conduct the interim action to expedite cleanup of contaminated soil and encourage redevelopment of the
property. The interim action was concluded in January 2010.

8/29/14 Y:\094\048.012\R\RIFS\RI-FS__FINAL.docx LANDAU ASSOCIATES 1-6
1.5 PURPOSE The purpose of the RI/FS is to collect, develop, and evaluate sufficient information to enable the
selection of an appropriate cleanup action for the Site. Specifically, the RI/FS:
• Characterizes the nature and extent of contamination for affected media (i.e., soil and groundwater, surface water, and indoor air)
• Identifies media of concern and preliminary cleanup standards for the media of concern
• Develops and evaluates cleanup action alternatives that protect human health and the environment
• Presents a preferred cleanup action alternative.
This document presents the information collected and the evaluations performed to achieve this purpose.
1.6 REPORT ORGANIZATION This RI/FS report is organized as follows:
• Section 2.0 presents a summary of pre-RI investigative activities
• Section 3.0 describes the 2009 interim action activities
• Section 4.0 presents the preliminary screening levels (SLs) and conceptual site model (CSM)
• Section 5.0 presents a summary of RI activities
• Section 6.0 presents the nature and extent of contamination, contaminant fate and transport, and current CSM
• Section 7.0 presents the development of cleanup standards for the Site, identifies remedial action objectives (RAOs), and identifies potentially applicable laws
• Section 8.0 presents the screening of remedial technologies
• Section 9.0 describes remedial alternatives
• Section 10.0 evaluates the remedial alternatives, including a description of the evaluation criteria, the evaluation of the alternatives against the evaluation criteria, and presentation of the disproportionate cost analysis (DCA)
• Section 11.0 presents the summary and conclusions, including a description of the preferred remedial alternative
• Section 12.0 provides a summary of appropriate use of this report
• Section 13.0 provides complete references cited within the text.

River
Thea Foss Waterway
S Pi
ne S
t
§̈¦705
§̈¦5
ST509
ST167
ST16
N 21st St
Pacific Ave
N 1St
St
Center St
S Pi
ne S
t
S 12th St
S 25th St
Lincoln
Ave
S 19th St
E L St
Puyallup Ave
S Tacoma Way
N 30th St
Jeffe
rson
Ave
Schuster Pky
Delin St
S Sp
ragu
e Av
e
6th Ave Milwaukee Way
Division Ave
Stadium Way
E 11th St
Eells St
BaySt
E 15th St
N Tacoma AveN I St
Mcki n le yAve
S I St
Ruston Way
N Ca
rr St
N 6t
h St
Earnest S Brazi l l StMarket St
E 26th St
Tacoma Ave S
S Ce
dar S
t
ED
S t
SG
St
E Portland Ave
Sa int Paul Ave
OldOldTacomaTacoma
TacomaTacoma
CommencementBay
Puyallup
AllenmorePublic
Golf Course
TacomaDome
Data Source: Esri 2012
Sauro's Property RI/FSTacoma, Washington Vicinity Map
Figure
1-1
0 0.5 1
Miles
G:\P
roje
cts\
094\
048\
013\
014\
RIF
S 2
014\
Figu
re1-
1Vic
Map
.mxd
1/2
9/20
14 N
AD
198
3 S
tate
Plan
e W
ashi
ngto
n N
orth
FIP
S 46
01 F
eet
!
!
!!
!
W a s h i n g t o nW a s h i n g t o nOlympia
TacomaSpokane
EverettSeattle Project
Location
Project Area
Former Sauro's Property
DaVita
FormerSauro'sProperty
Budget Property
SOUTH 15TH STREET
BNSFRailroad
Thea Foss Waterway
DiamondProperty
1401 Pacific Ave
1407 Pacific Ave
1409 Pacific Ave
1423 Pacific Ave
CurrentExtentof Site
DO
CK
STR
EET
CO
UR
T A
USPSProperty
RAMP I705
A S
TRE
ET
110 S 14th St.
1412 A St.
I705
A S
TRE
ET
I705 H
WY S
PAC
IFIC
AV
EN
UE
I705 H
WY N
CO
MM
ER
CE
STR
EE
T
SOUTH 13TH STREET
RAM
P I7
05
DO
CK
STR
EET
RA
MP
I705
SOUTH 14TH STREET
SOUTH 15TH STREET
8950001951
8950002070
2013050121
2013030010
8950002040
0320042033
8950001971
2014030041
2013020020
2014020020
2013050133
2013050132
2012020014
2014020010
2013020011
2013040191
8950002060
8950002050
2014020030
2011050141 8950001961
2013040110
2013040020
2013040050
2013040090
2013040010
8950001964
8950001894
2014030020
2011040071
2013040030
2013040040
2013040060
2013040070
2013040080
2013040100
2013040120
2013040130
2013040140
2013040150
2013040160
2013040170
2013040180
2015020010 89500018812015060011 2015040010
2011040072
2015020021
8950
0019
63
2014030010
2014030030
2011040070
0 100 200
Scale in Feet
Data Sources: Pierce County GIS; Esri World Imagery 2011.
Sauro's Property RI/FSTacoma, Washington
Site Location andSurrounding Properties
Figure
1-2
G:\P
roje
cts\
094\
048\
013\
014\
RIF
S 2
014\
Figu
re1-
2Pro
perty
Ow
ners
hip.
mxd
8/2
8/20
14
Notes1. The current extent of the Site represents the most recent extent of chlorinated solvents in groundwater at or above the MTCA Method A groundwater cleanup levels.2. Black and white reproduction of this color original may reduce its effectiveness and lead to incorrect interpretation.
Legend
Current Extent of Site

0+00
1+00
2+00
3+00
4+00
5+00
6+00
7+00
8+00
9+00
10+0
0
11+0
0
11+3
5
RNS-MW6
LAI-B8
MW-13MW-13MW-13MW-13MW-13
LAI-MW3LAI-MW3LAI-MW3LAI-MW3LAI-MW3
LAI-MW4LAI-MW4LAI-MW4LAI-MW4LAI-MW4
LAI-B1LAI-B1LAI-B1LAI-B1LAI-B1
LAI-B2LAI-B2LAI-B2LAI-B2LAI-B2LAI-B3LAI-B3LAI-B3LAI-B3LAI-B3
LAI-MW2LAI-MW2LAI-MW2LAI-MW2LAI-MW2
MW-6MW-6MW-6MW-6MW-6RNS MW-1RNS MW-1RNS MW-1RNS MW-1RNS MW-1
MW-12MW-12MW-12MW-12MW-12
0 100 200
Scale in Feet
Source: É 2005 Google Earth, Puget Sound LiDAR Consortium 2005
Sauro's Property RI/FSTacoma, Washington
Surface Topography and
Geologic Cross Section Area
FigureRep
ort |
G:\P
roje
cts\
094\
048\
013\
014\
RIF
S 2
014\
Figu
re1-
3_1-
4.dw
g (A
) "Fi
gure
1-3
" 8/2
8/20
14
LegendLandau Boring
Existing Monitoring Well
Decommissioned Monitoring Well
Property Boundary
Geologic Cross Section Location
Former Sauro's Property
Notes
1. Surface Topography from 2005.Topography at Sauro's Property haschange since redevelopment in 2011.
2. Black and white reproduction of this colororiginal may reduce its effectiveness andlead to incorrect interpretation.

ExistingGround Surface
(Offset 53' N)LAI-MW4
Ele
vatio
n in
ft (N
GV
D29
)
Ele
vatio
n in
ft (N
GV
D29
)
Geologic Profile Alignment - (1) (1)
-30
-20
-10
0
10
20
30
40
50
60
70
80
-30
-20
-10
0
10
20
30
40
50
60
70
80
0+001+002+003+004+005+006+007+008+009+0010+0011+0011+35
Dock StreetRailroadI-705 ROWA StreetDiamond ParkingCourt ASauro's PropertyPacific Ave
LAI-MW3
LAI-MW2
MW-13RNS-MW6
LAI-B3MW-12LAI-B2
(Offset 49' N)
(Offset 25' S)
(Offset 32' N)(Offset 14' N)
(Offset 9' S)
(Offset 43' S)
(Offset 41' S)
(Offset 41' S)
(Offset 21' N)
(Offset 54' S)LAI-B1
? ? ? ? ? ? ? ?? ? ? ? ? ? ? ? ? ? ? ? ? ? ?
??
??
? ? ? ? ? ? ? ? ??
??
?
?? ? ? ? ? ? ? ? ? ?
??
?
?
?
?
RNS-MW1
MW-12
MW-6(Offset 43' S)
(Offset 41' S)
(Offset 41' S)
LocomotiveMonument
Park
Road FILL
Dredge FILL
Tidal Deposits
Qvi(Ice Contact)
FILL
Qpf(Pre Fraser)
Qvi(Ice Contact)
FILL
Qpf(Pre Fraser)
2001 Excavation
DiamondExcavation
?
?
??
? ??
??
?
?
?? ? ? ? ? ? ? ? ?
??
?
? ? ? ? ? ? ? ? ? ?
? ?? ? ? ? ? ? ? ? ? ? ?
A
WestA'
East
(Offset 1' S)LAI-B8
?
2009 ExcavationExtents at Historical
Sump Area
ApproximateOld Shoreline
0 100 200
Horizontal Scale: 1"=100'Vertical Scale: 1"=20'
Sauro's Property RI/FSTacoma, Washington Geologic Cross Section A-A'
Figure| G:\P
roje
cts\
094\
048\
013\
014\
RIF
S 2
014\
Figu
re1-
3_1-
4.dw
g (A
) "Fi
gure
1-4
" 8/2
8/20
14
LegendNotes
1. Soil descriptions are generalized, based oninterpretation of field and laboratory data. Stratigraphiccontacts are interpolated between borings and basedon topographic features; actual conditions may vary.
2. See report text for descriptions of geologic units.
3. Profile derived from Puget Sound LiDAR Consortium2005. For cross-section profile location see Figure 1-3.
4. Boring LAI-B8 used for geologic interpretation alongDock Street.
5. Approximate location of shoreline based on AtlasHA-617 (Bortleson, et al).
6. Black and white reproduction of this color original mayreduce its effectiveness and lead to incorrectinterpretation.
? ? ?
Groundwater Level (At time of drilling)
Top of Exploration
Bottom of ExplorationWell Screen Interval (If Installed)Inferred Geologic ContactInferred Groundwater Table
MW-1
(Offset 160' W)Project Exploration DesignationOffset Distance in Feet and Direction
D=14' Depth of Exploration
Approximate Extentsof Excavated Area

&<
&<
&<&<
&<
&<&<
&<
&<
&<
&<
&<
&<
&<
&<
&<
&<
&<
&<
&<
&<
&<
&<
&<
DaVita
Budget Property
USPSProperty
SOUTH 15TH STREET
Thea Foss Waterway
DiamondProperty
FormerSauro'sProperty
55
10
12
20
14
Note1. Black and white reproduction of this color original may reduce its effectiveness and lead to incorrect interpretation.
RNS MW-326.17
RNS MW-721.21
RNS MW-421.43
RNS MW-517.84
RAMP
I705
RAMP
I705
I705
MW-129.26
MW-236.72
RNS MW-237.46
MW-1319.57
RAMP
RAMP I705SOUTH 15TH STREET
SOUTH 14TH STREET
PACI
FIC AV
ENUE
COUR
T A
MW-937.34
MW-8S32.61
MW-828.51
MW-635.67
MW-1033.24
MW-338.52MW-11S
39.85
MW-11D36.11
MW-1238.59
MW-433.51
10
1816
22
12141618
20
2224
26
28
3032343638
38
24
2628
3236 34
RNS MW-623.95
A ST
REET
I705 H
WY N
COMM
ERCE
STRE
ET
SOUTH 13TH STREET
DOCK
STRE
ET
LAI-MW212.02
LAI-MW117.18
LAI-MW310.71 LAI-MW4
1.85
8950001951
8950002070
2013050121
2013030010
8950002040
03200420338950001971
2014030041
2013020020
2014020020
2013050133
2013050132
2014020010
2012020014
2013020011
2013040191
8950002060
8950002050
2014020030
2013040110
2013040020
2013040050
2013040090
89500019612011050141
2013040010
8950001964
2014030030
2011040071
2013040030
2013040040
2013040060
2013040070
2013040080
2013040100
2013040120
2013040130
2013040140
2013040150
2013040160
2013040170
2013040180
2011040072
8950
0019
63
0 100 200
Scale in Feet
Data Source: Pierce County GIS; Sanborn Fire Insurance Map, 1888; Google Earth (Imagery Date: 11/8/2007).
Sauro's Property RI/FSTacoma, Washington
Pre-Interim ActionGroundwater Elevation Contours
April 2009Figure
1-5
G:\P
roje
cts\
094\
048\
013\
014\
RIF
S 2
014\
Figu
re1-
5GW
Con
tour
sApr
il200
9.m
xd 8
/28/
2014
Legend
&< Monitoring Wells
Groundwater Contours
Subject Property
Historic Deep Gulch
Notes1. Water levels shown were collected on 4/28/2009.2. Historic gulch was present as of 1888; it was filled as downtown was developed.3. Black and white reproduction of this color original may reduce its effectiveness and lead to incorrect interpretation.

&<
&<
&<&<
&<
&<
&<
&<
&<
&<
&<
&<
&<
&<
&<
&<
&<
DaVita
Budget Property
USPSProperty
SOUTH 15TH STREET
Thea Foss Waterway
DiamondProperty
FormerSauro'sProperty
MW-338.18
MW-JS22.62
MW-JS2.83
I705
A ST
REET
PACI
FIC AV
ENUE
I705 H
WY N
COUR
T A
COMM
ERCE
STRE
ET
SOUTH 13TH STREET
RAMP
RAMP
I705
DOCK
STRE
ET
RAMP
I705
SOUTH 14TH STREET
SOUTH 15TH STREETRAMP I705
LAI-MW212.33
LAI-MW117.17
LAI-MW310.7
LAI-MW42.48
LAI-MW536.94
MW-1323.14
RNS-MW325.33
RNS-MW235.51
RNS-MW421.41
RNS-MW516.81
RNS-MW624.18
RNS-MW721.36
MW-130.46
MW-235.36
8950001951
8950002070
2013050121
2013030010
8950002040
0320042033
8950001971
2014030041
2013020020
2014020020
2013050133
2013050132
2012020014
2014020010
2013020011
2013040191
8950002060
8950002050
2014030010
2014020030
2011050141 8950001961
2013040110
2013040020
2013040050
2013040090
2013040010
8950001964
2014030020
2014030030
2011040071
2013040030
2013040040
2013040060
2013040070
2013040080
2013040100
2013040120
2013040130
2013040140
2013040150
2013040160
2013040170
2013040180
2011040072
8950
0019
63
3432
3028
26
24
4226820
1018
1216 14
34 32 30 28 26 24
4
22
68
20
1018
12
16 14
0 100 200
Scale in FeetData Sources: Pierce County GIS; Esri World Imagery 2011.
Sauro's Property RI/FSTacoma, Washington
Most RecentGroundwater Elevation Contours
November 2013Figure
1-6
G:\P
roje
cts\
094\
048\
013\
014\
RIF
S 2
014\
Figu
re1-
6GW
Con
tour
sNov
2013
.mxd
8/2
8/20
14
Legend&< Monitoring Wells
Groundwater Contours
Subject Property
Historic Deep Gulch
Notes1. Water levels were collected by City staff on November 3. The measurement from RNS-MW5 was erroneous, and was replaced with a new measurement collected by LAI on November 6.2. To reduce the effects of tidal fluctuation, LAI-MW4, MW-JS, and MW-JS2 were measured within minutes of each other.
3. Historic gulch was present as of 1888; it was filled as downtown was developed.4. Black and white reproduction of this color original may reduce its effectiveness and lead to incorrect interpretation.
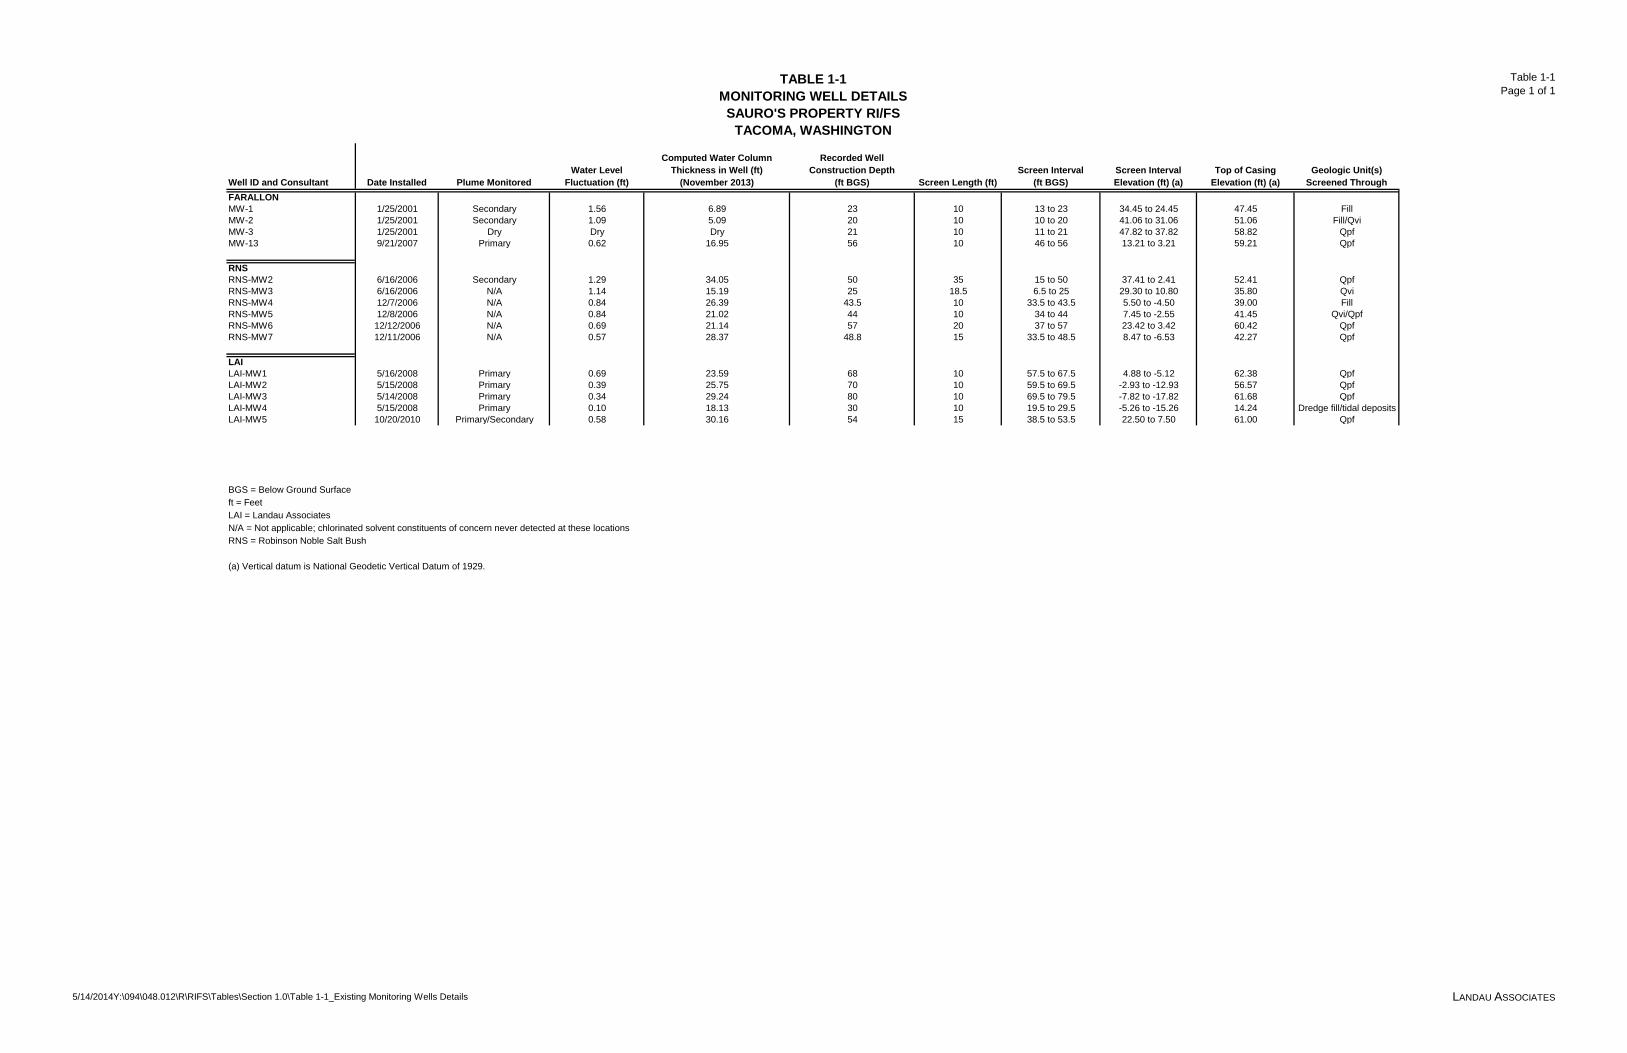
TABLE 1-1MONITORING WELL DETAILSSAURO'S PROPERTY RI/FS
TACOMA, WASHINGTON
Table 1-1Page 1 of 1
5/14/2014Y:\094\048.012\R\RIFS\Tables\Section 1.0\Table 1-1_Existing Monitoring Wells Details LANDAU ASSOCIATES
Well ID and Consultant Date Installed Plume MonitoredWater Level
Fluctuation (ft)
Computed Water Column Thickness in Well (ft)
(November 2013)
Recorded Well Construction Depth
(ft BGS) Screen Length (ft)Screen Interval
(ft BGS)Screen IntervalElevation (ft) (a)
Top of Casing Elevation (ft) (a)
Geologic Unit(s) Screened Through
FARALLONMW-1 1/25/2001 Secondary 1.56 6.89 23 10 13 to 23 34.45 to 24.45 47.45 FillMW-2 1/25/2001 Secondary 1.09 5.09 20 10 10 to 20 41.06 to 31.06 51.06 Fill/QviMW-3 1/25/2001 Dry Dry Dry 21 10 11 to 21 47.82 to 37.82 58.82 QpfMW-13 9/21/2007 Primary 0.62 16.95 56 10 46 to 56 13.21 to 3.21 59.21 Qpf
RNSRNS-MW2 6/16/2006 Secondary 1.29 34.05 50 35 15 to 50 37.41 to 2.41 52.41 QpfRNS-MW3 6/16/2006 N/A 1.14 15.19 25 18.5 6.5 to 25 29.30 to 10.80 35.80 QviRNS-MW4 12/7/2006 N/A 0.84 26.39 43.5 10 33.5 to 43.5 5.50 to -4.50 39.00 FillRNS-MW5 12/8/2006 N/A 0.84 21.02 44 10 34 to 44 7.45 to -2.55 41.45 Qvi/QpfRNS-MW6 12/12/2006 N/A 0.69 21.14 57 20 37 to 57 23.42 to 3.42 60.42 QpfRNS-MW7 12/11/2006 N/A 0.57 28.37 48.8 15 33.5 to 48.5 8.47 to -6.53 42.27 Qpf
LAILAI-MW1 5/16/2008 Primary 0.69 23.59 68 10 57.5 to 67.5 4.88 to -5.12 62.38 QpfLAI-MW2 5/15/2008 Primary 0.39 25.75 70 10 59.5 to 69.5 -2.93 to -12.93 56.57 QpfLAI-MW3 5/14/2008 Primary 0.34 29.24 80 10 69.5 to 79.5 -7.82 to -17.82 61.68 QpfLAI-MW4 5/15/2008 Primary 0.10 18.13 30 10 19.5 to 29.5 -5.26 to -15.26 14.24 Dredge fill/tidal depositsLAI-MW5 10/20/2010 Primary/Secondary 0.58 30.16 54 15 38.5 to 53.5 22.50 to 7.50 61.00 Qpf
BGS = Below Ground Surfaceft = FeetLAI = Landau AssociatesN/A = Not applicable; chlorinated solvent constituents of concern never detected at these locationsRNS = Robinson Noble Salt Bush
(a) Vertical datum is National Geodetic Vertical Datum of 1929.

8/29/14 Y:\094\048.012\R\RIFS\RI-FS__FINAL.docx LANDAU ASSOCIATES 2-1
2.0 PREVIOUS SITE INVESTIGATIONS
A number of pre-RI surface and subsurface investigations have been performed throughout the
Site, both on and off the Sauro’s property, to characterize the environmental impact of historical
operations. These investigations were previously evaluated and presented in the Phase 2 Investigation
Report (Landau Associates 2008b), and are summarized here. The pre-RI investigations were conducted
by the following consultants between 1992 and 2008:
• 1992: Preliminary environmental site assessment (ESA) of 1401 and 1407 Pacific Avenue conducted by Kennedy Jenks Consultants (Kennedy Jenks 1992).
• 1993: Removal of two underground storage tanks (USTs) east of 1423 Pacific Avenue (either 1412 A Street or 110 South 14th Street; records unclear) conducted by Langseth Environmental Services, Inc. (1993)
• 1999: Phase I ESA of 1409 Pacific Avenue conducted by Artifacts Consulting, Inc (Artifacts 1999).
• 2000:
– Phase II ESA of 1409 Pacific Avenue conducted by Saltbush Environmental Services, Inc (Saltbush 2000).
– Subsurface environmental assessment of 1401 Pacific Avenue conducted by GeoEngineers (2000).
• 2001:
– Phase I ESA and supplemental Site exploration of 1423 Pacific Avenue conducted by Environmental Associates (2001).
– Additional subsurface environmental assessment of 1401 Pacific Avenue and removal and excavation of sump conducted by GeoEngineers (2001).
• 2003: Interim cleanup action at 1401 Pacific Avenue conducted by GeoEngineers (2003).
• 2005: Additional subsurface sampling conducted at 1401, 1407, and 1409 Pacific Avenue by Farallon Consulting (Farallon 2005).
• 2006: Additional characterization phase at 1401, 1407, and 1409 Pacific Avenue conducted by Robinson, Nobel, and Saltbush (RNS 2006).
• 2008:
– Additional characterization and FS pilot testing at 1401, 1407, and 1409 Pacific Avenue conducted by Farallon (2008).
– Phase I ESA at the intersection of 14th and A Streets conducted by Parametrix (2008).
– Phase I ESA of nearby properties conducted by Landau Associates (Landau Associates 2008c,d,e).
– Phase I ESA at 1401, 1407, and 1409 Pacific Avenue conducted by Landau Associates (2008a).
– Phase 2 ESA at 1401, 1407, and 1409 Pacific Avenue conducted by Landau Associates (2008b).

8/29/14 Y:\094\048.012\R\RIFS\RI-FS__FINAL.docx LANDAU ASSOCIATES 2-2
A full list of report references for pre-RI Site investigations (and RI Site investigations) and an
associated investigation timeline are presented in Appendix B. The locations of all pre-RI Site
explorations are presented on Figure 2-1. All available pre-RI soil boring logs and monitoring well
boring logs are provided in Appendix C.
2.1 PRE-REMEDIAL INVESTIGATION RESULTS Results from the pre-RI investigations identified surface soil, subsurface soil, and groundwater
that had been impacted by historical activities at the property. The constituents of potential concern
(CPOCs) included chlorinated solvent VOCs, petroleum hydrocarbons, and metals. Pre-RI data was
collected between 1992 and 2008. All pre-RI soil data are presented in Table 2-1 (VOCs), Table 2-2
(petroleum hydrocarbons), and Table 2-3 (metals). All pre-RI groundwater data are presented in Table 2-
4 (VOCs), Table 2-5 (petroleum hydrocarbons), and Table 2-6 (metals).
2.1.1 VOLATILE ORGANIC COMPOUNDS The pre-RI investigations identified significant soil and groundwater impacts primarily related to
the release of chlorinated solvent VOCs. The primary VOC detected is tetrachloroethene (PCE). PCE is
a solvent that has been used extensively in the dry cleaning industry since the 1940s. Other VOCs that
were detected (primarily in groundwater) include trichloroethene (TCE), cis-1,2-dichloroethene (cis-1,2-
DCE), and vinyl chloride (VC). These VOCs were not typically used as dry cleaning solvent liquids
(Doherty 2000a,b). However, all three of these chemicals can occur in soil and groundwater as
biologically mediated breakdown products of PCE (Pankow and Cherry 1996). A summary of pre-RI soil
and groundwater investigation results for VOCs is presented in the following two sections.
2.1.1.1 Soil
Multiple previous investigations were conducted on and around the Sauro’s property starting in
1992 (Table D-1, Appendix D). Ultimately, the most likely source of PCE contamination was identified
as a sump/dry well historically located in the basement of the dry cleaning business (north central portion
of the property) where wastewater and waste dry cleaning liquids were apparently discharged
(GeoEngineers 2001). The sump and surrounding soil were excavated in 2001 (Farallon 2005).
Confirmation samples (CON-1, CON-3, and CON-4)10 collected from the north and east borders of the
excavated area indicated that PCE and TCE remained at concentrations up to 34 milligrams per kilogram
(mg/kg) and 0.77 mg/kg, respectively (Table 2-1).
10 CON-1, CON-3, and CON-4 were originally named samples 1, 3, and 4 by GeoEngineers. The prefixes were added by Landau Associates to clarify and distinguish the samples.

8/29/14 Y:\094\048.012\R\RIFS\RI-FS__FINAL.docx LANDAU ASSOCIATES 2-3
In 2007, additional shallow surface soil sampling was conducted on the Sauro’s property. The
highest PCE soil concentrations were detected near the former sump at 47 mg/kg and 46 mg/kg at depths
of 3 ft below ground surface (BGS) and 13 ft BGS, respectively (Farallon 2008). Aside from the 2001
sump excavation area, the 2007 investigation found that soil contamination was still present over a large
portion of the Sauro’s property. Based on the 2007 investigation sampling results, Farallon estimated that
approximately 3,000 tons (2,000 cubic yards) of VOC-contaminated soil was still present at the Sauro’s
property at concentrations qualifying as hazardous waste (1.9 mg/kg11,12). The 2008 Phase 2 investigation
by Landau Associates detected VOCs at concentrations in soil off of the Sauro’s property to the north
(Pacific Avenue) and west (South 14th Street); however, the concentrations were below MTCA CULs
(Landau Associates 2008a).
VOC-contaminated soil at the Sauro’s property was determined to be an ongoing groundwater
contamination source (Landau Associates 2008b). The Phase 2 investigation report proposed a number of
interim remedial alternatives to address the VOC-contaminated soil mass. Ultimately, the City decided to
employ the excavation interim remedial alternative (the interim action) beginning in 2009. The interim
action is discussed in Section 3.0.
Immediately south of the Sauro’s property is the DaVita property. Environmental Associates
conducted a subsurface investigation of the DaVita property in 2001 consisting of two shallow borings.
Soil analytical results from the investigation indicated that concentrations of PCE were detected in the
soil at both borings B-1 (at 3ft BGS) and B-2 (at 12 ft BGS) above the MTCA Method A CUL of 0.05
mg/kg. The VOC soil analytical results for B-1 and B-2 are presented in Table 2-1 and the boring
locations are shown on Figure 2-2.
Northeast of the Sauro’s property is the USPS property. Parametrix conducted a subsurface
investigation of the USPS property in April 2008. Soil analytical results from the investigation indicated
that low concentrations of PCE were detected in soil on the southern half of the USPS property at borings
PMX-B-2 and PMX-B-3. These PCE detections were from samples collected near the water table
between 43 and 44 ft BGS. Shallower samples (approximately 2 ft BGS and 15 ft BGS) collected from
the same borings did not detect VOCs in soil. Groundwater analytical results from PMX-B2 and PMX-
B3 detected relatively high concentrations of PCE. Soil analytical results from all pre-RI studies
including the Parametrix data are presented in Tables 2-1, 2-2, and 2-3. The locations of the Parametrix
borings are shown on Figure 2-1.
11 The MTCA Method B standard formula cleanup level (CUL) is 1.9 mg/kg; this level is based on direct contact exposure. 12 Farallon (2008) indicated that 1.9 mg/kg represents the level at which excavated soil from the Site would be classified as
hazardous waste based on Ecology’s “contained-in” policy.

8/29/14 Y:\094\048.012\R\RIFS\RI-FS__FINAL.docx LANDAU ASSOCIATES 2-4
2.1.1.2 Groundwater
As part of the Phase 2 investigation, available pre-RI VOC data were combined to define the two
Site VOC groundwater plumes. These two plumes (herein collectively termed pre-RI VOC plumes)
appeared to emanate from the Sauro’s property. The pre-RI primary plume extends east toward the Thea
Foss Waterway and consists of PCE, TCE, and cis-1,2-DCE, with relatively minor concentrations of VC.
The pre-RI secondary plume extends southeast and consists of PCE, TCE, cis-1,2-DCE, and VC. The
pre-RI VOC plumes are presented on Figure 2-3 (PCE plume), Figure 2-4 (TCE plume), Figure 2-5 (cis-
1,2-DCE plume), and Figure 2-6 (VC plume). Groundwater analytical results from all pre-RI studies are
presented in this report in Tables 2-4, 2-5, and 2-6.
Although not incorporated into the delineation of the Pre-RI VOC plumes, a floor drain water
grab sample was collected during pre-RI activities and analyzed for VOCs. The drain is located in the
basement of the DaVita building and apparently captures groundwater along the building foundation; the
drain may have a local influence on groundwater flow (RNS 2006). PCE was not detected. VC was
detected at 2.3 micrograms per liter (µg/L), which is greater than the MTCA Method A groundwater
cleanup level (CUL) of 0.2 µg/L. TCE and cis-1,2-DCE were also detected, but at concentrations below
their applicable CULs. The results are included in Table 2-4 and the approximate location of the drain
access manhole is shown on Figure 2-1. The AO required that the DaVita drain and downstream sewer
outfall be sampled during the RI; this activity is described in Section 5.0 and the results are provided in
Section 6.0.
2.1.2 PETROLEUM HYDROCARBONS Diesel- and oil-range petroleum hydrocarbons (herein collectively petroleum hydrocarbons) and
benzene have been detected in soil and groundwater at the Sauro’s property. Petroleum hydrocarbons are
not currently constituents of concern but the historical presence of these compounds may have affected
the potential for reductive dechlorination of VOCs (ITRC 2008).
2.1.2.1 Sauro’s Property
Petroleum hydrocarbons were identified at the Sauro’s property before and after the 2001 sump
excavation. Prior to the excavation, evidence of a petroleum hydrocarbon release and the presence of
benzene were identified in the vicinity of the sump; these soils were excavated when the sump was
removed. After the sump excavation, low concentrations of petroleum hydrocarbons were detected in soil
samples collected from borings on the Sauro’s property, but the detected concentrations were below
MTCA Method A soil CULs; benzene was not detected in soil after the sump excavation. A UST was
discovered north of the sump (GeoEngineers 2000) beneath 14th Street; this tank was later identified by
8/29/14 Y:\094\048.012\R\RIFS\RI-FS__FINAL.docx LANDAU ASSOCIATES 2-5
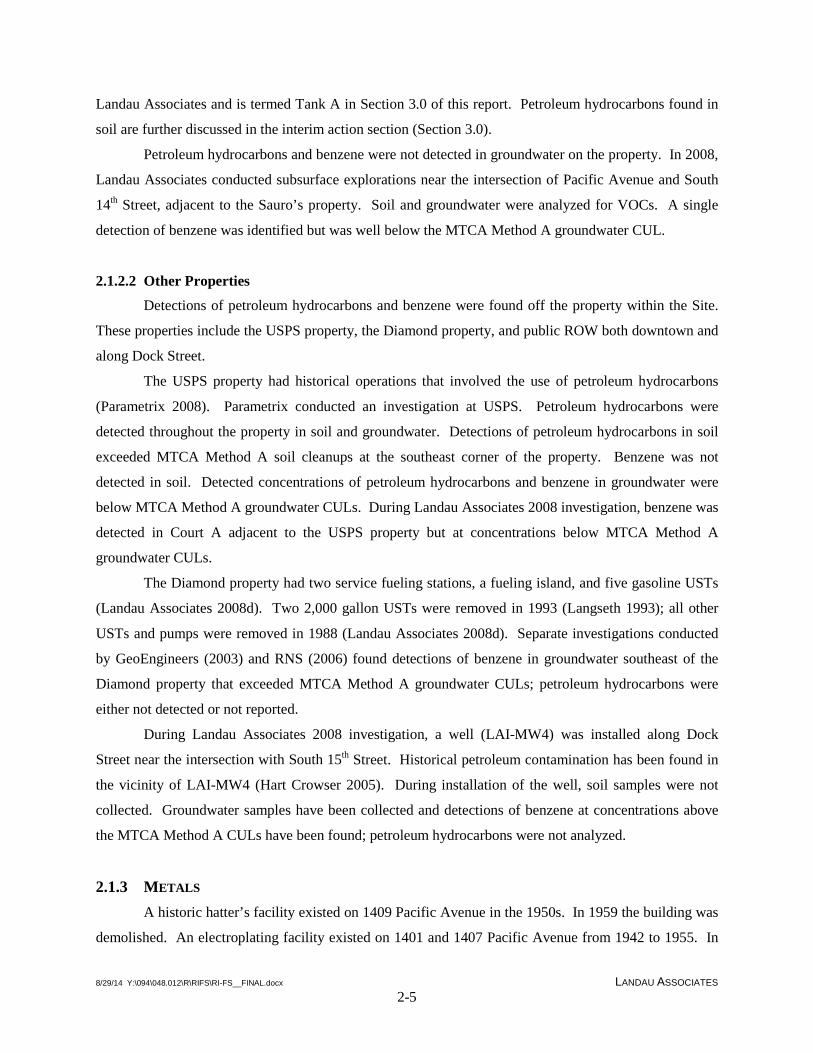
Landau Associates and is termed Tank A in Section 3.0 of this report. Petroleum hydrocarbons found in
soil are further discussed in the interim action section (Section 3.0).
Petroleum hydrocarbons and benzene were not detected in groundwater on the property. In 2008,
Landau Associates conducted subsurface explorations near the intersection of Pacific Avenue and South
14th Street, adjacent to the Sauro’s property. Soil and groundwater were analyzed for VOCs. A single
detection of benzene was identified but was well below the MTCA Method A groundwater CUL.
2.1.2.2 Other Properties
Detections of petroleum hydrocarbons and benzene were found off the property within the Site.
These properties include the USPS property, the Diamond property, and public ROW both downtown and
along Dock Street.
The USPS property had historical operations that involved the use of petroleum hydrocarbons
(Parametrix 2008). Parametrix conducted an investigation at USPS. Petroleum hydrocarbons were
detected throughout the property in soil and groundwater. Detections of petroleum hydrocarbons in soil
exceeded MTCA Method A soil cleanups at the southeast corner of the property. Benzene was not
detected in soil. Detected concentrations of petroleum hydrocarbons and benzene in groundwater were
below MTCA Method A groundwater CULs. During Landau Associates 2008 investigation, benzene was
detected in Court A adjacent to the USPS property but at concentrations below MTCA Method A
groundwater CULs.
The Diamond property had two service fueling stations, a fueling island, and five gasoline USTs
(Landau Associates 2008d). Two 2,000 gallon USTs were removed in 1993 (Langseth 1993); all other
USTs and pumps were removed in 1988 (Landau Associates 2008d). Separate investigations conducted
by GeoEngineers (2003) and RNS (2006) found detections of benzene in groundwater southeast of the
Diamond property that exceeded MTCA Method A groundwater CULs; petroleum hydrocarbons were
either not detected or not reported.
During Landau Associates 2008 investigation, a well (LAI-MW4) was installed along Dock
Street near the intersection with South 15th Street. Historical petroleum contamination has been found in
the vicinity of LAI-MW4 (Hart Crowser 2005). During installation of the well, soil samples were not
collected. Groundwater samples have been collected and detections of benzene at concentrations above
the MTCA Method A CULs have been found; petroleum hydrocarbons were not analyzed.
2.1.3 METALS A historic hatter’s facility existed on 1409 Pacific Avenue in the 1950s. In 1959 the building was
demolished. An electroplating facility existed on 1401 and 1407 Pacific Avenue from 1942 to 1955. In

8/29/14 Y:\094\048.012\R\RIFS\RI-FS__FINAL.docx LANDAU ASSOCIATES 2-6
2001 the building was demolished and the area around the former basement was excavated as part of an
interim action.
Pre-RI investigations since the 2001 interim action found metals in soil and/or groundwater at the
Sauro’s property. The metals found include chromium, cadmium, mercury, lead, and arsenic. During the
2009 interim action, a significant volume of soil was removed (see Section 3.0). A summary of the
metals found prior to the 2009 interim action primarily at the Sauro’s property is discussed in the
following sections.
2.1.3.1 Chromium
Pre-RI investigations detected chromium in soil and groundwater at the Sauro’s property at
concentrations below MTCA Method A CULs for total chromium. Chromium occurs in two valance
states: chromium III, which has low toxicity, and chromium VI, which has high toxicity. Chromium
valance states were not identified in pre-RI investigations. However, since total chromium concentrations
in soil are consistent with natural background levels for chromium13, the detected chromium
concentrations are considered unlikely to represent chromium contamination, and rather reflect naturally
occurring chromium in soil. Chromium is not considered a contaminant of concern.
2.1.3.2 Cadmium
Cadmium was previously sampled at several locations across the Sauro’s property. It was not
detected in groundwater. However, cadmium was detected in soil slightly above the MTCA Method A
soil CUL of 2 mg/kg in one boring on the north parcel of the Sauro’s property (2.1 mg/kg) and at the
sump (8.7 mg/kg; GeoEngineers 2000). Soil in the sump area was removed during the 2001 and 2009
interim actions. Cadmium is not considered a contaminant of concern.
2.1.3.3 Mercury
In 2000, mercury was detected in three soil test pit samples (TP-2, TP-3, and TP-4) collected in
the vicinity of the former location of the historic hatter’s facility at concentrations above MTCA Method
A CULs for soil of 2 mg/kg (Saltbush 2000). In 2009, soil from the vicinity of the test pits was removed
during the interim action (Section 3.0). Several pre-RI groundwater samples were collected throughout
the Sauro’s property and mercury was not detected.
Directly to the south of the Sauro’s property is the DaVita property. In 2001, groundwater
samples from two soil borings (B-1 and B-2) were advanced through the basement floor in the northeast
13 The natural background soil level for chromium is 48 mg/kg (Ecology 1994).
8/29/14 Y:\094\048.012\R\RIFS\RI-FS__FINAL.docx LANDAU ASSOCIATES 2-7
corner of the DaVita property and mercury concentrations were found in groundwater at levels exceeding
the MTCA Method A CUL for groundwater of 2 µg/L (Environmental Associates 2001). However,
mercury was not detected in groundwater at the Sauro’s property, and a number of the samples were
collected near the DaVita property boundary (MW-8, MW-8s, and MW-9). Therefore, the Sauro’s
property is not suspected to be the source of mercury contamination in groundwater collected from
borings B-1 and B-2. Additionally, the groundwater results from B-1 and B-2 appear to represent total
mercury concentrations. Total concentrations include suspended sediment (which can contain adsorbed
contaminant mass) and are often not representative of dissolved-phase metals. Mercury is not considered
to be a contaminant of concern.
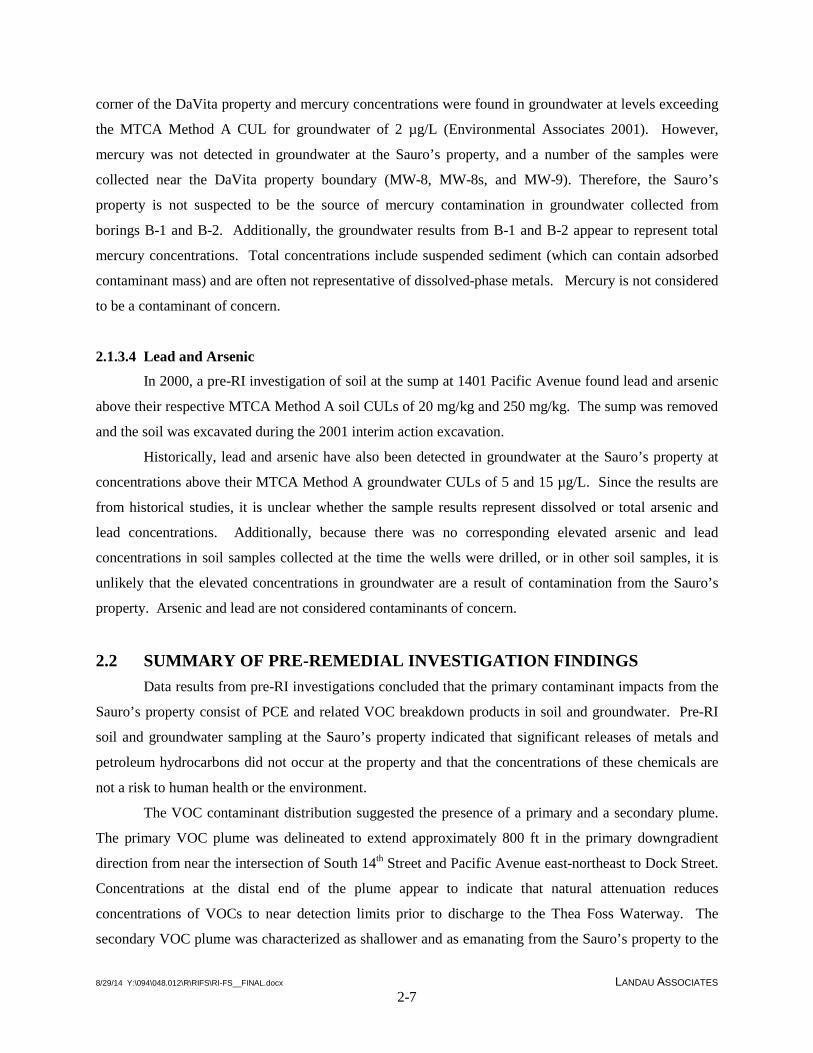
2.1.3.4 Lead and Arsenic
In 2000, a pre-RI investigation of soil at the sump at 1401 Pacific Avenue found lead and arsenic
above their respective MTCA Method A soil CULs of 20 mg/kg and 250 mg/kg. The sump was removed
and the soil was excavated during the 2001 interim action excavation.
Historically, lead and arsenic have also been detected in groundwater at the Sauro’s property at
concentrations above their MTCA Method A groundwater CULs of 5 and 15 µg/L. Since the results are
from historical studies, it is unclear whether the sample results represent dissolved or total arsenic and
lead concentrations. Additionally, because there was no corresponding elevated arsenic and lead
concentrations in soil samples collected at the time the wells were drilled, or in other soil samples, it is
unlikely that the elevated concentrations in groundwater are a result of contamination from the Sauro’s
property. Arsenic and lead are not considered contaminants of concern.
2.2 SUMMARY OF PRE-REMEDIAL INVESTIGATION FINDINGS Data results from pre-RI investigations concluded that the primary contaminant impacts from the
Sauro’s property consist of PCE and related VOC breakdown products in soil and groundwater. Pre-RI
soil and groundwater sampling at the Sauro’s property indicated that significant releases of metals and
petroleum hydrocarbons did not occur at the property and that the concentrations of these chemicals are
not a risk to human health or the environment.
The VOC contaminant distribution suggested the presence of a primary and a secondary plume.
The primary VOC plume was delineated to extend approximately 800 ft in the primary downgradient
direction from near the intersection of South 14th Street and Pacific Avenue east-northeast to Dock Street.
Concentrations at the distal end of the plume appear to indicate that natural attenuation reduces
concentrations of VOCs to near detection limits prior to discharge to the Thea Foss Waterway. The
secondary VOC plume was characterized as shallower and as emanating from the Sauro’s property to the

8/29/14 Y:\094\048.012\R\RIFS\RI-FS__FINAL.docx LANDAU ASSOCIATES 2-8
southeast approximately 200 ft. Natural attenuation appears to cause the shallow plume to dissipate
relatively close to the Sauro’s property, as is evident by a number of downgradient wells without
detections of VOCs.

!O
!?!?
!?
!?!?
!?
!?
!?
!?
!?
!?
!?
!?!?
!?
!?
!?!?
!?
!?
!?
!?
!?!?
!?!?
!?
!? !?
!?
!?!?
!?
!?
!?
!?
!?!? !?
!?!?
!?
!?
!?
!?!?!?
!
!
!
!
!
!!!
!
!
!
!
!
!
!
!
!
!
!
!
!
!
!H
&<
&<
!H
!H
!H
&<
&<
!?
!?
!?!?
&<
MW-7
MW-6
MW-8
MW-10
RNS-MW5
RNS-MW6
MW-1(SP-2)
MW-4(SP-4)
MW-2(SP-2)
RNS-MW1
MW-8S
MW-5/5A
P-7
S-6
S-5
S-4
S-3S-2
S-1
P-6
P-4 P-3
P-2 P-1
B-2B-1
GP-4
SP-7
SP-6
GP-1
GP-3
GP-2
TP-4
TP-3TP-2
TP-1
FB-9
FB-7
FB-6
FB-5 FB-4
P-5
FB-12
FB-11
PMX-B1
PMX-B2
PMX-B4PMX-B3
FB-10
FB-1
FB-2
FB-3
FB-8
GP-5
MW-9
MW-12
MW-13
MW-11SMW-11D
RNS-MW3
RNS-MW2
RNS-MW4
RNS-MW7
MW-1
LAI-MW2
LAI-MW1
LAI-MW3LAI-MW4
A S
TRE
ET
PAC
IFIC
AV
EN
UE
CO
UR
T A
CO
MM
ER
CE
STR
EE
T
SOUTH 13TH STREET
RA
MP
RAM
P I7
05
DO
CK
STR
EET
RA
MP
I705
SOUTH 14TH STREET
SOUTH 15TH STREETSOUTH 15TH STREET
I705
SumpSVE-1
LAI-B2
LAI-B5
LAI-B3
LAI-B1GP-6
P-11P-10
P-8
P-9
MW-3 (SP-3)
CON-3CON-4
CON-1
0 100 200
Scale in FeetData Sources: Pierce County GIS; Esri World Imagery 2011.
Sauro's Property RI/FSTacoma, Washington Pre-RI Site Explorations
Figure
2-1G:\P
roje
cts\
094\
048\
013\
014\
RIF
S 2
014\
Figu
re2-
1Pre
RIS
iteE
xplo
ratio
ns.m
xd 8
/28/
2014
NA
D 1
983
HA
RN
Sta
tePl
ane
Was
hing
ton
Sou
th F
IPS
4602
Fee
t
Legend
&< LAI Monitoring Well
!H LAI Boring
! Existing Monitoring Well
!? Previous Boring, Test Pit, Etc.
2001 Excavation and Sump Removal
Subject Property
Notes1. Results associated with Pre-RI explorations provided in Tables 1-6.2. Black and white reproduction of this color original may reduce its effectiveness and lead to incorrect interpretation.
FormerSauro'sProperty
USPSProperty
BudgetProperty
DaVita
DiamondProperty
Approximate Locationof DaVita Drain

!(!(
!(
!(!(!(
!(
!(
!(
!(
!(
!(
!(!(!(
!(
!(!(
!(
!(
!(
!(
!(!(
!(!(
!(
!( !(
!(
!(!(
!(
!(
!(
!(
!(!(!(
!(!(
!(
!(
!(
!(!(!(
!(
!(
!(
!(
!(
!(!(!(
!(
!(
!(
!(
!(
!(
!(
!(
!(
!(
!(
!(
!(
!(
!(
!(
!(!(
!(
!(
!(!(
!(
!(
!(
!( !(
MW-7
MW-6
MW-8
MW-10
RNS -MW5
RNS -MW6
MW-1(S P-2)
MW-4(S P-4)
MW-2(S P-2)
RNS -MW1
MW-8S
MW-5A
P-7
S -6
S -5
S -4
S -3S -2
S -1
P-6
P-4 P-3
P-2 P-1
B-2B-1
GP-4
S P-7S P-6GP-1
GP-3
GP-2
T P-4
T P-3T P-2T P-1
FB-9
FB-7
FB-6
FB-5 FB-4
P-5FB-12
FB-11
PMX -B1
PMX -B2
PMX -B4PMX -B3
FB-10FB-1
FB-2
FB-3
FB-8
GP-5
MW-9
MW-12
MW-13
MW-11SMW-11D
RNS MW-3
RNS -MW2
RNS -MW4
RNS -MW7
MW-1
LAI-MW2
LAI-MW1
LAI-MW3 LAI-MW4
A STREET
PACIFIC AVENUE
COURT A
COMMERCE STREET
S OU T H 13T H S T REET
RAMP
RAMP I705
DOCK S TREET
RAMP I705
S OU T H 14T H S T REET
S OU T H 15T H S T REETS OU T H 15T H S T REET
I705
S um pS VE-1
LAI-B2
LAI-B5
LAI-B3
LAI-B1GP-6MW-3 (S P-3)
CON-1CON-4
CON-3
P-10 P-11
P-9
P-8
0 100 200
S ca le in FeetDa ta S ources: Pierce Coun ty GIS ; Esri World Im a gery 2011.
S a uro's Property RI/FST a com a , Wa shin gton
Pre-RI Site ExplorationsSoil PCE Concentrations
Figure
2-2G:\Projects\094\048\013\014\RIFS 2014\Figure2-2PreRISiteExplorationsSoilPCE.mxd 8/28/2014 NAD 1983 HARN StatePlane Washington South FIPS 4602 Feet
Legen d!( ≥ 0.5 m g/kg!( ≥ 0.05 m g/kg, < 0.5 m g/kg!( < 0.05 m g/kg!( Non detect!( Not S a m pled
2001 Exca va tion a n d S um p Rem ova lS ub ject Property
Notes1. At b orin gs with m ultiple sa m plin g depths, the grea test con cen tra tion wa s used.2. Refer to T a b le 1 for com plete da ta results.3. T he MT CA Method A S oil Clea n up Level for PCE is 0.05 m ilogra m s per kilogra m (m g/kg).4. Bla ck a n d white reproduction of this color origin a l m a y reduce its effectiven ess a n d lea d to in correct in terpreta tion .
Form erS a uro'sProperty
USPSProperty
BudgetProperty
DaVita
DiamondProperty

!?
!?
!?
!?
!?
&<
&<
!?
!?
!?
&<
&<
&<
!?!?
!?
&<
&<
&<
&<&<
&<&<
&<
&<
&<
&<
&<
&<
&<!?!?
!?!?
!?!?
!?
!?
!?
&<
&<
&<
&<
&<
&<
&<
!?
!?
!?
P-11ND(7/03)
PMX-B10.14(4/08)LAI-B5
<0.2(5/08)
PMX-B258(4/08)
LAI-MW1<0.2(5/08)
LAI-MW366(5/08)
LAI-MW2120(5/08)
MW13420(10/07)
RNS-MW6230(6/07)
PMX-B3460(4/08) PMX-B4
220(4/08)
LAI-B20.7(5/08) LAI-B3
0.6(5/08)
LAI-B1<0.2(5/08)
MW613(6/07)
MW125(6/07)
MW11S37(6/07)
RNS-MW170.3(6/06)
MW11D3.6(6/07)
MW37.2(6/07)
MW5A0.82(5/04)
MW1017(6/07)
MW70.34(5/04) MW4
ND(6/07)MW9
0.27(6/07)MW8S
3.1(6/07)MW8
ND(6/07)
RNS-MW211.1(12/06)
MW20.87(6/07)
B-11.1(10/01)
B-239(10/01)
MW-1ND(6/07)
RNS-MW7ND(12/06)
RNS-MW3ND(6/06)
RNS-MW4ND(12/06)
RNS-MW5ND(6/07)
LAI-MW4<0.2(5/08)
RAMP
I705
I705
A ST
REET
I705 H
WY S
PACI
FIC AV
ENUE
I705 H
WY N
COUR
T A
COMM
ERCE
STRE
ET
SOUTH 13TH STREET
RAMP
RAMP
I705
DOCK
STRE
ET
SOUTH 14TH STREET
SOUTH 15TH STREETSOUTH 15TH STREETRAMP I705
P-71.9(7/03)
P-410(7/03)
P-315(7/03)P-9
19(7/03)
P-83.8(7/03)
P-63.5(7/03)
P-21310(7/03)
P-1158(7/03)
P-57.4(7/08) LAI-MW5
ND(11/10)
8950001951
8950002070
2013050121
2013030010
8950002040
03200420338950001971
2013020020
2014020020
2013050133
2013050132
2012020014
2013020011
2013040191
8950002060
8950002050
2014020030
2011050141 8950001961
2013040110
2013040020
2013040050
2013040090
2013040010
8950001894
89500019642011040071
2013040030
2013040040
2013040060
2013040070
2013040080
2013040100
2013040120
2013040130
2013040140
2013040150
2013040160
2013040170
2013040180
2015020010 89500018812015060011 2015040010 2015020021
2011040072
8950001963
0 100 200
Sc a le in Feet
Da ta Source: Pierce County GIS
Sa uro's Property RI/FSTa c om a , Wa sh ing ton Pre-RI Groundwater VOC Plumes
PCE ConcentrationsFig ure
2-3G:\Projects\094\048\013\014\RIFS 2014\Figure2-3GWPCE.mxd 8/28/2014
N otes1. N D or <0.2 = N ot Detec ted in sa m ple.2. <0.2(5/08) = PCE c oncentra tion in μg /L (m ost recent sa m ples th roug h Ma y 2008).3. Da ta collected prior to 2001 exc a v a tion not inc lud ed .4. Bla c k a nd wh ite reprod uc tion of th is color orig ina l m a y red uce its effectiv eness a nd lea d to inc orrec t interpreta tion.
Primary Plume
Secondary Plume
Legend
Subject Property
PCE Concentration Range (µg/L)
Location Type
!
!
!!
!
ND - <0.2 (Notations for Not Detected)0.2 - 55 - 5050 - 200>200
? Boring Location&< Monitoring Well

!?
&<
&<
!?
!?
!?
&<
&<
!?!?
!?
&<
&<
&<
&<&<
&<&<
&<
&<
&<
&<
&<
&<
&<!H!?
!?!?
!?!?
!?
!?
!?
&<
&<
&<
&<
&<
&<
&<
!?
!?
!?
!?
!?
!?
!?
P-11ND(7/03)
B-29.4(10/01)
B-1<5(10/01)
PMX-B1<1(4/08)
PMX-B224(4/08)
PMX-B3170(4/08) PMX-B4
57(4/08)
I705
A ST
REET
I705 H
WY S
PACI
FIC AV
ENUE
I705 H
WY N
COUR
T A
COMM
ERCE
STRE
ET
SOUTH 13TH STREET
RAMP
RAMP
I705
DOCK
STRE
ET
RAMP
I705
SOUTH 14TH STREET
SOUTH 15TH STREETSOUTH 15TH STREETRAMP I705
LAI-B1<0.2(5/08)
LAI-B2<0.2(5/08)
LAI-B30.4(5/08) LAI-MW2
62(5/08)
LAI-MW10.2(5/08)
LAI-B5<0.2(5/08)
LAI-MW337(5/08)
LAI-MW40.2(5/08)
MW-70.59(5/04)
MW-80.58(6/07)
MW-9ND(6/07)
MW-5AND(5/04)
MW-8S7.3(6/07)
MW-107.3(6/07)
MW-12170(6/07)
MW-13130(10/07)
RNS MW-3ND(6/06)
RNS MW-21.7(12/06)
RNS MW-4ND(12/06)
RNS MW-5ND(6/07)
RNS MW-677(6/07)
RNS MW-7ND(12/06)
MW-1ND(6/07)
MW-22(6/07)
MW-3ND(6/07)
MW-46.8(6/07)
MW-66.9(6/07)
MW-11S0.84(6/07)
MW-11D0.35(6/07)
RNS MW-112(6/06)
P-7ND(7/03)
P-48(7/03)P-9
ND(7/03)
P-8ND(7/03)
P-61.6(7/03)
P-325(7/03)
P-22670(7/03)
P-120(7/03)
P-5ND(7/03)
8950001951
8950002070
2013050121
2013030010
8950002040
03200420338950001971
2014030041
2013020020
2014020020
2013050133
2013050132
2012020014
2014020010
2013020011
2013040191
8950002060
8950002050
2014020030
2013040110
2011050141 8950001961
2013040020
2013040050
2013040090
2013040010
8950001894
89500019642011040071
2013040030
2013040040
2013040060
2013040070
2013040080
2013040100
2013040120
2013040130
2013040140
2013040170
2013040180
2015020010 89500018812015060011 2015040010 2015020021
2011040072
8950001963
0 100 200
Sc a le in Feet
Da ta Source: Pierce County GIS
Sa uro's Property RI/FSTa c om a , Wa sh ing ton
Pre-RI Groundwater VOC PlumesTCE Concentrations
Fig ure
2-4G:\Projects\094\048\013\014\RIFS 2014\Figure2-4GWTCE.mxd 8/28/2014
N otes1. N D or <0.2 = N ot Detec ted in sa m ple.2. <0.2(5/08) = TCE concentra tion in μg /L (m ost recent sa m ples th roug h Ma y 2008).3. Da ta collected prior to 2001 exc a v a tion not inc lud ed .4. Bla c k a nd wh ite reprod uc tion of th is color orig ina l m a y red uce its effectiv eness a nd lea d to inc orrec t interpreta tion.
Primary Plume
Secondary PlumeSubject Property
LegendTCE Concentration Range (µg/L)
Location Type? Boring Location&< Monitoring Well
!
!
!!
ND - <0.2 (Notations for Not Detected)0.2 - 55 - 5050 - 200>200!
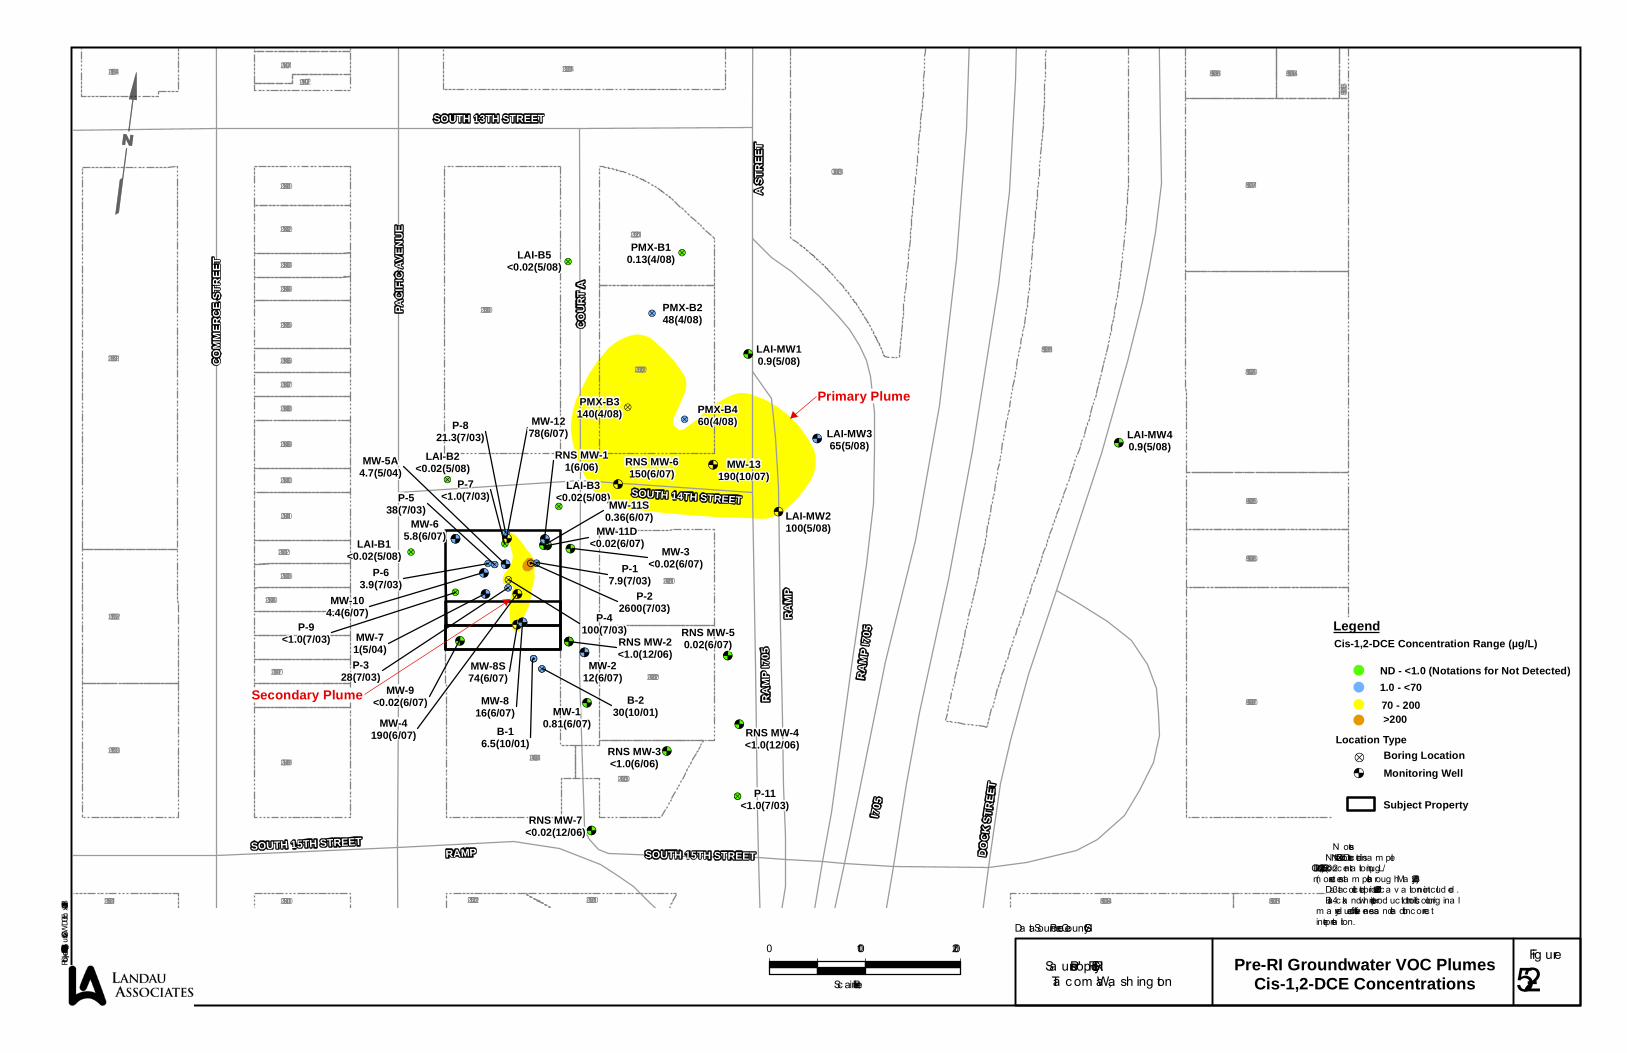
!?
!?
!?
!?
!?!?
!?
&<
&<
&<
&<&<
&<&<&<
&<
&<
&<
&<
&<
&<
&<!H!?
!?!?
!?!?
!?
!?
!?
&<
&<
&<
&<
&<
&<
&<
!?
!?
!?
!?
!?
!?
!?
&<
&<
&<
&<&<
&<
&<
!H!?
!?!H
!?!?
!?
&<
&<
&<
!?
&<
&<
&<
&<
P-11<1.0(7/03)
B-230(10/01)
B-16.5(10/01)
PMX-B10.13(4/08)
PMX-B248(4/08)
PMX-B3140(4/08) PMX-B4
60(4/08)
LAI-MW2100(5/08)
LAI-MW365(5/08)
LAI-MW10.9(5/08)
LAI-MW40.9(5/08)
I705
A ST
REET
I705 H
WY S
PACI
FIC AV
ENUE
I705 H
WY N
COUR
T A
COMM
ERCE
STRE
ET
SOUTH 13TH STREET
RAMP
RAMP
I705
DOCK
STRE
ET
RAMP
I705
SOUTH 14TH STREET
SOUTH 15TH STREETSOUTH 15TH STREETRAMP
LAI-B1<0.02(5/08)
LAI-B2<0.02(5/08)
LAI-B3<0.02(5/08)
LAI-B5<0.02(5/08)
MW-71(5/04)
MW-816(6/07)
MW-9<0.02(6/07)
MW-5A4.7(5/04)
MW-8S74(6/07)
MW-104.4(6/07)
MW-1278(6/07)
MW-13190(10/07)
RNS MW-3<1.0(6/06)
RNS MW-2<1.0(12/06)
RNS MW-4<1.0(12/06)
RNS MW-50.02(6/07)
RNS MW-6150(6/07)
RNS MW-7<0.02(12/06)
MW-10.81(6/07)
MW-212(6/07)
MW-3<0.02(6/07)
MW-4190(6/07)
MW-65.8(6/07)
MW-11S0.36(6/07)
MW-11D<0.02(6/07)
RNS MW-11(6/06)
P-7<1.0(7/03)
P-4100(7/03)P-9
<1.0(7/03)
P-821.3(7/03)
P-63.9(7/03)
P-328(7/03)
P-22600(7/03)
P-17.9(7/03)
P-538(7/03)
8950001951
8950002070
2013050121
2013030010
8950002040
03200420338950001971
2014030041
2013020020
2014020020
2013050133
2013050132
2012020014
2014020010
2013020011
2013040191
8950002060
8950002050
2014020030
2013040110
2011050141 8950001961
2013040020
2013040050
2013040090
2013040010
8950001894
89500019642011040071
2013040030
2013040040
2013040060
2013040070
2013040080
2013040100
2013040120
2013040130
2013040140
2013040170
2013040180
2015020010 89500018812015060011 2015040010 2015020021
2011040072
8950001963
0 100 200
Sc a le in Feet
Da ta Source: Pierce County GIS
Sa uro's Property RI/FSTa c om a , Wa sh ing ton
Pre-RI Groundwater VOC PlumesCis-1,2-DCE Concentrations
Fig ure
2-5G:\Projects\094\048\013\014\RIFS 2014\Figure2-5GWDCE.mxd 8/28/2014
N otes1. N D or <0.2 = N ot Detec ted in sa m ple.2. <0.2(5/08) = Cis-1,2-DCE concentra tion in μg /L (m ost recent sa m ples th roug h Ma y 2008).3. Da ta collected prior to 2001 exc a v a tion not inc lud ed .4. Bla c k a nd wh ite reprod uc tion of th is color orig ina l m a y red uce its effectiv eness a nd lea d to inc orrec t interpreta tion.
Primary Plume
Secondary Plume
Subject Property
LegendCis-1,2-DCE Concentration Range (µg/L)
Location Type? Boring Location&< Monitoring Well
!
!
!!
ND - <1.0 (Notations for Not Detected)1.0 - <7070 - 200>200

!?
&<
&<
!?
!?
!?
&<
&<
!?!?
!?
&<
&<
&<
&<&<
&<&<&<
&<
&<
&<
&<
&<
&<
&<!?!?
!?!?
!?!?
!?
!?
!?
&<
&<
&<
&<
&<
&<
&<
!?
!?
!?
!?
!?
!?
!?
P-11ND(7/03)
B-127(6/07)
B-2ND(6/07)
PMX-B1<1(4/08)
PMX-B20.4(4/08)
PMX-B30.29(4/08)PMX-B4<1(4/08)
I705
A ST
REET
I705 H
WY S
PACI
FIC AV
ENUE
I705 H
WY N
COUR
T A
COMM
ERCE
STRE
ET
SOUTH 13TH STREET
RAMP
RAMP
I705
DOCK
STRE
ET
RAMP
I705
SOUTH 14TH STREET
SOUTH 15TH STREETSOUTH 15TH STREETRAMP I705
LAI-B1<0.2(5/08)
LAI-B2<0.2(5/08)
LAI-B3<0.2(5/08) LAI-MW2
1.4(5/08)
LAI-MW1<0.2(5/08)
LAI-B5<0.2(5/08)
LAI-MW30.5(5/08)
LAI-MW40.6(5/08)
MW-70.73(5/04)
MW-84.2(6/07)
MW-9ND(6/07)
MW-5A17(5/04)
MW-8S47(6/07)
MW-101.1(6/07)
MW-12<1.0(6/07)
MW-13<2.0(10/07)
RNS MW-3ND(6/06)
RNS MW-2ND(12/06)
RNS MW-4ND(12/06)
RNS MW-5ND(6/07)
RNS MW-60.72(12/06)
RNS MW-7ND(12/06)
MW-10.52(6/07)
MW-21.8(6/07)
MW-3ND(6/07)
MW-4230(6/07)
MW-61.3(6/07)
MW-11SND(6/07)
MW-11DND(6/07)
RNS MW-10.28(6/06)
P-7ND(7/03)
P-4ND(7/03)P-9
ND(7/03)
P-8ND(7/03)
P-6ND(7/03)
P-3ND(7/03)
P-2248(7/03)
P-1ND(7/03)
P-5ND(7/03)
8950001951
8950002070
2013050121
2013030010
8950002040
03200420338950001971
2014030041
2013020020
2014020020
2013050133
2013050132
2012020014
2013020011
2013040191
8950002060
8950002050
2014020030
2013040110
2011050141 8950001961
2013040020
2013040050
2013040090
2013040010
8950001894
89500019642011040071
2013040030
2013040040
2013040060
2013040070
2013040080
2013040100
2013040120
2013040130
2013040140
2013040150
2013040160
2013040170
2013040180
2015020010 89500018812015060011 2015040010 2015020021
2011040072
8950001963
0 100 200
Sc a le in Feet
Da ta Source: P ierce County GIS
Sa uro's P roperty RI/FSTa c om a , Wa sh ing ton
Pre-RI Groundwater VOC PlumesVinyl Chloride Concentrations
Fig ure
2-6G:\Projects\094\048\013\014\RIFS 2014\Figure2-6GWVinlyChloride.mxd 8/28/2014
Notes1. ND or <0.2 = Not Detec ted in sa m ple.2. <0.2(5/08) = Vinyl Ch lorid e c oncentra tion in μg /L (m ost recent sa m ples th roug h Ma y 2008).3. Da ta collected prior to 2001 exc a v a tion not inc lud ed .4. Bla c k a nd wh ite reprod uc tion of th is color orig ina l m a y red uce its effectiv eness a nd lea d to inc orrec t interpreta tion.
Primary Plume
Secondary Plume
LegendVC Concentration Range (µg/L)
Location Type? Boring Location&< Monitoring Well
!
!
!
ND - <0.2 (Notations for Not Detected)0.2 - 22 - 20
Subject Property
! > 20

TABLE 2-1PRE-REMEDIAL INVESTIGATION VOLATILE ORGANIC COMPOUND SOIL ANALYTICAL RESULTS
SAURO'S PROPERTY RI/FSTACOMA, WASHINGTON
Table 2-1Page 1 of 3
5/14/2014Y:\094\048.012\R\RIFS\Tables\Section 2.0\Table 2-1 thru 2-3 -Soil Analytical Results – Pre-RI Summary Data LANDAU ASSOCIATES
Tetrachloroethene Trichloroethene cis-1,2-Dichloroethene Vinyl ChlorideCON-1 1-8 GeoEngineers 10/16/2001 8 -- 17 0.21 0.11 --
3-3 GeoEngineers 10/16/2001 3 8.6 0.12 0.1 --3-6 GeoEngineers 10/16/2001 6 2.7 0.11 0.24 --
CON-4 4-6 GeoEngineers 10/16/2001 6 -- 34 0.77 0.64 --B-1 B-1 3 feet Env. Assoc. 10/4/2001 3 6 0.290 <0.5 <0.5 <0.5B-2 B-2 12 feet Env. Assoc. 10/4/2001 12 12 0.130 <0.5 <0.5 <0.5
FB1-3 Farallon 5/23/2007 3 <0.02 <0.02 <0.02 <0.02FB1-13 Farallon 5/23/2007 13 0.07 <0.02 <0.02 <0.02FB2-3 Farallon 5/23/2007 3 0.039 <0.02 <0.02 <0.02FB2-13 Farallon 5/23/2007 13 3.29 0.35 0.25 <0.02FB3-3 Farallon 5/23/2007 3 0.21 <0.02 <0.02 <0.02FB3-8 Farallon 5/23/2007 8 2.13 0.025 <0.02 <0.02FB3-13 Farallon 5/23/2007 13 0.18 <0.02 <0.02 <0.02FB3-16 Farallon 5/23/2007 16 0.3 <0.02 <0.02 <0.02FB4-7 Farallon 5/23/2007 7 0.28 <0.02 <0.02 <0.02FB4-12 Farallon 5/23/2007 12 0.16 <0.02 <0.02 <0.02FB4-16 Farallon 5/23/2007 16 1.38 0.036 <0.02 <0.02FB5-4 Farallon 5/23/2007 4 0.8 0.021 <0.02 <0.02FB5-9 Farallon 5/23/2007 9 0.19 <0.02 <0.02 <0.02FB5-14 Farallon 5/23/2007 14 0.08 <0.02 <0.02 <0.02FB6-3 Farallon 5/23/2007 3 0.12 <0.02 <0.02 <0.02FB6-8 Farallon 5/23/2007 8 1.41 0.031 <0.02 <0.02FB7-3 Farallon 5/23/2007 3 0.45 <0.02 <0.02 <0.02FB7-8 Farallon 5/23/2007 8 1.54 0.064 <0.02 <0.02FB7-13 Farallon 5/23/2007 13 1.26 0.065 <0.02 <0.02FB8-3 Farallon 5/23/2007 3 0.087 <0.02 <0.02 <0.02FB8-8 Farallon 5/23/2007 8 0.25 <0.02 <0.02 <0.02FB8-13 Farallon 5/23/2007 13 0.25 0.062 0.062 <0.02FB9-3 Farallon 5/23/2007 3 0.41 <0.02 <0.02 <0.02FB9-8 Farallon 5/23/2007 8 0.71 <0.02 <0.02 <0.02FB9-13 Farallon 5/23/2007 13 0.28 0.032 <0.02 <0.02FB10-3 Farallon 5/23/2007 3 2.57 0.024 <0.02 <0.02FB10-8 Farallon 5/23/2007 8 2.64 0.045 <0.02 <0.02FB10-13 Farallon 5/23/2007 13 1.22 0.024 <0.02 <0.02FB11-3 Farallon 5/23/2007 3 0.49 <0.02 <0.02 <0.02FB11-8 Farallon 5/23/2007 8 0.14 <0.02 <0.02 <0.02FB11-13 Farallon 5/23/2007 13 0.55 <0.02 <0.02 <0.02FB12-3 Farallon 5/23/2007 3 0.56 <0.02 <0.02 <0.02FB12-8 Farallon 5/23/2007 8 1.8 0.033 <0.02 <0.02FB12-13 Farallon 5/23/2007 13 1.18 <0.02 <0.02 <0.02GP-1-10 GeoEngineers 5/24/2000 10 -- <0.05 <0.05 <0.05 --GP-2-2.5 GeoEngineers 5/24/2000 2.5 16.3 0.15 <0.05 <0.05 --GP-3-5.0 GeoEngineers 5/24/2000 5 0.13 <0.05 <0.05 --GP-3-12.5 GeoEngineers 5/24/2000 12.5 0.65 0.05 <0.05 --GP-4-17.5 GeoEngineers 5/24/2000 17.5 14.8 1.00 0.12 0.24 --GP-5-10 GeoEngineers 5/24/2000 10 3.50 0.09 <0.05 --GP-5-15 GeoEngineers 5/24/2000 15 0.64 <0.05 <0.05 --
LAI-B1* LAI-B1 (22.5-23.0) Landau Associates 5/6/2008 22.5 23.5 0.0045 <0.0007 <0.0007 <0.0007LAI-B2* LAI-B2 (15.75-16.0) Landau Associates 5/6/2008 15.75 30.0 0.0018 <0.0007 <0.0007 <0.0007
--
14.5
14.5
14.5
14
14
--
--
13
--
--
15.5
--
14.5
14.3
Depth to Groundwater
(ft BGS)Soil Analytical Results (mg/kg)2Boring or
WellSample Depth
(ft BGS)1
FB-8
FB-12
FB-11
FB-10
Sampled By Sample Date
FB-3
FB-2
FB-1
CON-3
Sample Number
GP-2
GP-4
FB-7
FB-6
FB-5
FB-4
GP-1
GP-5
FB-9
GP-3

TABLE 2-1PRE-REMEDIAL INVESTIGATION VOLATILE ORGANIC COMPOUND SOIL ANALYTICAL RESULTS
SAURO'S PROPERTY RI/FSTACOMA, WASHINGTON
Table 2-1Page 2 of 3
5/14/2014Y:\094\048.012\R\RIFS\Tables\Section 2.0\Table 2-1 thru 2-3 -Soil Analytical Results – Pre-RI Summary Data LANDAU ASSOCIATES
Tetrachloroethene Trichloroethene cis-1,2-Dichloroethene Vinyl Chloride
Depth to Groundwater
(ft BGS)Soil Analytical Results (mg/kg)2Boring or
WellSample Depth
(ft BGS)1Sampled By Sample DateSample NumberLAI-B3 LAI-B3 (21.5-22.0) Landau Associates 5/6/2008 21.5 22.0 <0.0007 <0.0007 <0.0007 <0.0007MW-1 SP-1-16 GeoEngineers 1/25/2001 16 16.5 <0.10 <0.10 <0.10 <0.10
SP-2-15 GeoEngineers 1/25/2001 15 -- <0.10 <0.10 <0.10 <0.10MW-3 SP-3-20 GeoEngineers 1/25/2001 20 -- <0.10 <0.10 <0.10 <0.10MW-4 SP-4-21 GeoEngineers 1/25/2001 21 17 <0.10 <0.10 0.5 <0.10
SP-5-21 GeoEngineers 1/25/2001 21 18 4.32 3.03 18.6 1.99MW-6-16 GeoEngineers 7/11/2003 16 0.06 0.06 <0.05 <0.02MW-6-24 GeoEngineers 7/11/2003 24 <0.02 <0.02 <0.05 <0.02MW-7-12 GeoEngineers 7/10/2003 12 1.64 0.11 <0.05 <0.02MW-7-20 GeoEngineers 7/10/2003 20 0.27 0.16 0.11 <0.02
MW-8S MW-8S-6.5 Farallon 5/13/2004 5-6.5 7 0.23 0.011 0.0058 <0.0014MW-9-20.0 Farallon 5/12/2004 18-20 6 <0.0011 <0.0011 <0.0011 <0.0011MW-10-12.5 Farallon 5/13/2004 11-12.5 17 1.4 0.014 0.0034 <0.0011MW11S-3 Farallon 5/21/2007 3 0.015 <0.00098 <0.00098 <0.00098MW11S-8 Farallon 5/21/2007 8 0.55 0.0047 0.0014 <0.00096
MW11S-24.5 Farallon 5/21/2007 24.5 <0.0010 <0.0010 <0.0010 <0.0010MW-11D MW11-35 Farallon 5/21/2007 35 -- 0.031 0.0027 0.00091 0.00090
MW12-3 Farallon 5/22/2007 3 47 0.0063 0.0023 <0.00093MW12-13 Farallon 5/22/2007 13 46 <0.046 <0.046 <0.046MW12-25 Farallon 5/22/2007 25 0.30 <0.0021 <0.0021 <0.0021MW12-35 Farallon 5/22/2007 35 0.0026 <0.00096 <0.00096 <0.00096
MW13-35.5 Farallon 9/21/2007 35.5 <0.00095 <0.00095 <0.00095 <0.00095MW-13-45 Farallon 9/21/2007 45 <0.00084 <0.00084 <0.00084 <0.00084
P-1 P-1-14 GeoEngineers 7/9/2003 14 13 <0.02 <0.02 <0.05 <0.02P-2-11 GeoEngineers 7/9/2003 11 1.88 0.05 <0.05 <0.02P-2-22 GeoEngineers 7/9/2003 22 0.31 0.17 0.14 <0.02
P-3 P-3-25 GeoEngineers 7/9/2003 25 20 0.17 0.11 6.54 2.10P-4-13 GeoEngineers 7/9/2003 13 5.19 0.50 0.20 <0.02P-4-22 GeoEngineers 7/9/2003 22 0.14 0.89 6.36 0.90P-5-8 GeoEngineers 7/9/2003 8 2.69 0.14 0.14 <0.02P-5-20 GeoEngineers 7/9/2003 20 3.83 5.6 20.4 10.4P-6-13 GeoEngineers 7/10/2003 13 1.56 0.07 <0.05 <0.02P-6-20 GeoEngineers 7/10/2003 20 0.34 0.10 0.24 <0.02P-7-18 GeoEngineers 7/10/2003 18 <0.02 <0.02 <0.05 <0.02P-7-26 GeoEngineers 7/10/2003 26 <0.02 <0.02 <0.05 <0.02P-8-13 GeoEngineers 7/10/2003 13 33.3 28.8 17.8 <0.02P-8-22 GeoEngineers 7/10/2003 22 0.02 <0.02 <0.05 <0.02
PMX-B-3-2.0 Parametrix 4/28/2008 2 <0.028 <0.018 <0.044 <0.018PMX-B-3-16.0 Parametrix 4/28/2008 16 <0.027 <0.017 <0.043 <0.017PMX-B-3-43.0 Parametrix 4/28/2008 43 0.065 0.009 <0.034 <0.014PMX-B-4-2.0 Parametrix 4/28/2008 2 <0.026 <0.016 <0.041 <0.016PMX-B-4-14.0 Parametrix 4/28/2008 14 <0.021 <0.013 <0.033 <0.013PMX-B-4-16.0 Parametrix 4/28/2008 16 <0.028 <0.018 <0.044 <0.018PMX-B-1-2.0 Parametrix 4/29/2008 2 <0.022 <0.014 <0.034 <0.014PMX-B-1-13.0 Parametrix 4/29/2008 13 <0.021 <0.014 <0.034 <0.014PMX-B-1-44.0 Parametrix 4/29/2008 44 <0.026 <0.016 <0.041 <0.016PMX-B-2-2.5 Parametrix 4/30/2008 2.5 <0.021 <0.014 <0.034 <0.014PMX-B-2-14.5 Parametrix 4/30/2008 14.5 <0.027 <0.017 <0.043 <0.017PMX-B-2-44.0 Parametrix 4/30/2008 44 0.062 0.013 <0.038 <0.015
13
13
16
16
12
18
22
20
47.5
24
24
P-2
P-4
P-5
P-6
P-7
P-8
PMX-B-1
MW-11S
MW-6
MW-12
MW-13
MW-2
MW-5
PMX-B-3
PMX-B-4
PMX-B-2
MW-7
MW-9MW-10

TABLE 2-1PRE-REMEDIAL INVESTIGATION VOLATILE ORGANIC COMPOUND SOIL ANALYTICAL RESULTS
SAURO'S PROPERTY RI/FSTACOMA, WASHINGTON
Table 2-1Page 3 of 3
5/14/2014Y:\094\048.012\R\RIFS\Tables\Section 2.0\Table 2-1 thru 2-3 -Soil Analytical Results – Pre-RI Summary Data LANDAU ASSOCIATES
Tetrachloroethene Trichloroethene cis-1,2-Dichloroethene Vinyl Chloride
Depth to Groundwater
(ft BGS)Soil Analytical Results (mg/kg)2Boring or
WellSample Depth
(ft BGS)1Sampled By Sample DateSample NumberRNSMW-1-11' RNS 6/19/2006 11 0.22 <0.03 <0.02 <0.03RNSMW1-16' RNS 6/19/2006 16 0.41 <0.03 <0.02 <0.03RNSM1-46' RNS 6/19/2006 46 <0.02 <0.03 <0.02 <0.03
RNSMW2-9.5' RNS 6/19/2006 9.5 0.025 <0.03 <0.02 <0.03RNSMW2-14.5' RNS 6/19/2006 14.5 0.02 <0.03 <0.02 <0.03RNSMW-59.5' RNS 6/19/2006 59.5 <0.02 <0.03 <0.02 <0.03RNSMW4-30.5' RNS 12/7/2006 30.5 <0.02 <0.03 <0.02 <0.025RNSMW4-45.0' RNS 12/7/2006 45.0 <0.02 <0.03 <0.02 <0.025RNSMW5-26' RNS 12/8/2006 26 <0.02 <0.03 <0.02 <0.025RNSMW5-46' RNS 12/8/2006 46 <0.02 <0.03 <0.02 <0.025
RNSMW6-36.5' RNS 12/12/2006 36.5 0.062 <0.03 <0.02 <0.025RNSMW6-59.0' RNS 12/12/2006 59 0.055 <0.03 <0.02 <0.025RNSMW7-25' RNS 12/11/2006 25 <0.02 <0.03 <0.02 <0.025RNSMW7-45' RNS 12/11/2006 45 <0.02 <0.03 <0.02 <0.025
RNSMW7-50.5' RNS 12/11/2006 50.5 <0.02 <0.03 <0.02 <0.025SP-6 SP-6-15 GeoEngineers 1/25/2001 15 18.5 <0.10 <0.10 <0.10 <0.10SP-7 SP-7-18 GeoEngineers 1/25/2001 18 -- 2.05 0.266 <0.10 <0.10
SVE1-3 Farallon 5/22/2007 3 0.13 0.0019 <0.00089 <0.00089SVE1-8 Farallon 5/22/2007 8 3.6 0.0063 <0.00083 <0.00083SVE1-13 Farallon 5/22/2007 13 0.48 0.0034 0.0041 <0.0011SVE-17 Farallon 5/22/2007 17 0.39 0.0088 0.0082 0.0022
TP-1 TP-1 RNS 4/13/2000 4.5 4.5 <0.05 -- -- --TP-2 TP-2 RNS 4/13/2000 4 4 <0.05 -- -- --TP-3 TP-3 RNS 4/13/2000 8 8 <0.05 -- -- --TP-4 TP-4 RNS 4/13/2000 6 6 1.10 -- -- --
0.05 0.03 NE NE
Env. Assoc. = Environmental Associates Inc.RNS = Robinson, Noble & Saltbrush, Inc.
-- = not analyzed.< denotes result is less than laboratory practical quantitation limit.Bold = Detected compoundsBox = Concentrations at or above Model Toxics Control Act (MTCA) Method A cleanup levelsNE = Not EstablishedNR = Not Reported
1 Depth in feet below ground surface.2 Analyzed by U.S. Environmental Protection Agency (EPA) Method 8260B.3 Based on MTCA Method A unrestricted land use soil tables.
*Acetone concentrations at LAI-B1 and LAI-B2 were 0.022 milligrams per kilogram (mg/kg) and 0.016 mg/kg, respectively.
Note:Disclaimer: Data in this table was compiled from report tables authored by the respective firm in the 'Sampled By' column. Landau Associates makes no warranties as to the correctness of the original data.
13.5
--
22.5
--
--
15
16
RNSMW6
RNSMW7
MTCA Method A Cleanup Level for Soil3
RNSMW1
RNSMW2
RNSMW4
SVE-1
RNSMW5

TABLE 2-2PRE-REMEDIAL INVESTIGATION PETROLEUM HYDROCARBONS SOIL ANALYTICAL RESULTS
SAURO'S PROPERTY RI/FSTACOMA, WASHINGTON
Table 2-2Page 1 of 4
5/14/2014Y:\094\048.012\R\RIFS\Tables\Section 2.0\Table 2-1 thru 2-3 -Soil Analytical Results – Pre-RI Summary Data LANDAU ASSOCIATES
DRO ORO GRO Benzene* Ethylbenzene* Toluene* Xylenes*CON-1 1-8 GeoEngineers 10/16/2001 8 -- -- -- -- -- -- -- --
3-3 GeoEngineers 10/16/2001 3 -- -- -- -- -- -- --3-6 GeoEngineers 10/16/2001 6 -- -- -- -- -- -- --
CON-4 4-6 GeoEngineers 10/16/2001 6 -- -- -- -- -- -- -- --B-1 B-1 3 feet Env. Assoc. 10/4/2001 3 6 -- -- -- -- -- -- --B-2 B-2 12 feet Env. Assoc. 10/4/2001 12 12 -- -- -- -- -- -- --
FB1-3 Farallon 5/23/2007 3 -- -- -- -- -- -- --FB1-13 Farallon 5/23/2007 13 -- -- -- -- -- -- --FB2-3 Farallon 5/23/2007 3 -- -- -- -- -- -- --FB2-13 Farallon 5/23/2007 13 -- -- -- -- -- -- --FB3-3 Farallon 5/23/2007 3 -- -- -- -- -- -- --FB3-8 Farallon 5/23/2007 8 -- -- -- -- -- -- --FB3-13 Farallon 5/23/2007 13 -- -- -- -- -- -- --FB3-16 Farallon 5/23/2007 16 -- -- -- -- -- -- --FB4-7 Farallon 5/23/2007 7 -- -- -- -- -- -- --FB4-12 Farallon 5/23/2007 12 -- -- -- -- -- -- --FB4-16 Farallon 5/23/2007 16 -- -- -- -- -- -- --FB5-4 Farallon 5/23/2007 4 -- -- -- -- -- -- --FB5-9 Farallon 5/23/2007 9 -- -- -- -- -- -- --FB5-14 Farallon 5/23/2007 14 -- -- -- -- -- -- --FB6-3 Farallon 5/23/2007 3 -- -- -- -- -- -- --FB6-8 Farallon 5/23/2007 8 -- -- -- -- -- -- --FB7-3 Farallon 5/23/2007 3 -- -- -- -- -- -- --FB7-8 Farallon 5/23/2007 8 -- -- -- -- -- -- --FB7-13 Farallon 5/23/2007 13 -- -- -- -- -- -- --FB8-3 Farallon 5/23/2007 3 -- -- -- -- -- -- --FB8-8 Farallon 5/23/2007 8 -- -- -- -- -- -- --FB8-13 Farallon 5/23/2007 13 -- -- -- -- -- -- --FB9-3 Farallon 5/23/2007 3 -- -- -- -- -- -- --FB9-8 Farallon 5/23/2007 8 -- -- -- -- -- -- --FB9-13 Farallon 5/23/2007 13 -- -- -- -- -- -- --FB10-3 Farallon 5/23/2007 3 -- -- -- -- -- -- --FB10-8 Farallon 5/23/2007 8 -- -- -- -- -- -- --FB10-13 Farallon 5/23/2007 13 -- -- -- -- -- -- --FB11-3 Farallon 5/23/2007 3 -- -- -- -- -- -- --FB11-8 Farallon 5/23/2007 8 -- -- -- -- -- -- --FB11-13 Farallon 5/23/2007 13 -- -- -- -- -- -- --FB12-3 Farallon 5/23/2007 3 -- -- -- -- -- -- --FB12-8 Farallon 5/23/2007 8 -- -- -- -- -- -- --FB12-13 Farallon 5/23/2007 13 -- -- -- -- -- -- --GP-1-2.5 GeoEngineers 5/24/2000 2.5 -- -- -- -- -- -- --GP-1-10 GeoEngineers 5/24/2000 10 -- -- <100 <20 <0.05 <0.05 <0.05 <0.05GP-2-2.5 GeoEngineers 5/24/2000 2.5 16.3 -- -- -- <0.05 <0.05 <0.05 <0.05GP-2-17.5 GeoEngineers 5/24/2000 17.5 -- <100 <20 -- -- -- --GP-3-5.0 GeoEngineers 5/24/2000 5 -- -- -- <0.05 <0.05 <0.05 <0.05GP-3-12.5 GeoEngineers 5/24/2000 12.5 -- 250 58 <0.05 <0.05 <0.05 <0.05
14.5
14
14.5
--
14
15.5
--
14.5
14.5
Depth to Groundwater
(ft BGS)
--
--
13
--
--
CON-3
GP-1
GP-2
FB-4
FB-3
FB-2
Soil Analytical Results (mg/kg)2
GP-3
Sample DateSample Depth
(ft BGS)1Boring or
Well Sample Number Sampled By
FB-1
FB-8
FB-7
FB-6
FB-5
FB-9
FB-12
FB-11
FB-10

TABLE 2-2PRE-REMEDIAL INVESTIGATION PETROLEUM HYDROCARBONS SOIL ANALYTICAL RESULTS
SAURO'S PROPERTY RI/FSTACOMA, WASHINGTON
Table 2-2Page 2 of 4
5/14/2014Y:\094\048.012\R\RIFS\Tables\Section 2.0\Table 2-1 thru 2-3 -Soil Analytical Results – Pre-RI Summary Data LANDAU ASSOCIATES
DRO ORO GRO Benzene* Ethylbenzene* Toluene* Xylenes*
Depth to Groundwater
(ft BGS)
Soil Analytical Results (mg/kg)2
Sample DateSample Depth
(ft BGS)1Boring or
Well Sample Number Sampled ByGP-4-15 GeoEngineers 5/24/2000 15 -- -- -- -- -- --
GP-4-17.5 GeoEngineers 5/24/2000 17.5 14.8 -- 200 <20 <0.05 <0.05 <0.05 <0.05GP-5-10 GeoEngineers 5/24/2000 10 -- -- -- <0.05 <0.05 <0.05 <0.05GP-5-15 GeoEngineers 5/24/2000 15 -- <100 <20 <0.05 <0.05 <0.05 <0.05
GP-6 GP-6-25 GeoEngineers 5/24/2000 25 -- <100 <20 -- -- -- --SUMP SUMP @ 4' GeoEngineers 5/24/2000 4 -- >200 >100 0.28 0.77 0.51 6.1LAI-B1 LAI-B1 (22.5-23.0) Landau 5/6/2008 22.5 23.5 -- -- -- <0.0007 <0.0007 <0.0007 <0.0007LAI-B2 LAI-B2 (15.75-16.0) Landau 5/6/2008 15.75 30.0 -- -- -- <0.0007 <0.0007 <0.0007 <0.0007
LAI-B3 LAI-B3 (21.5-22.0)Landau
Associates 5/6/2008 21.5 22.0 -- -- -- <0.0007 <0.0007 <0.0007 <0.0007SP-1-4 GeoEngineers 1/25/2001 4 -- -- -- -- -- -- --SP-1-16 GeoEngineers 1/25/2001 16 16.5 -- -- -- -- -- -- --SP-2-5 GeoEngineers 1/25/2001 5 -- -- -- -- -- -- --SP-2-15 GeoEngineers 1/25/2001 15 14 -- -- -- -- -- -- --
MW-3 SP-3-20 GeoEngineers 1/25/2001 20 -- -- -- -- -- -- -- --MW-4 SP-4-21 GeoEngineers 1/25/2001 21 17 -- -- -- -- -- -- --
SP-5-19 GeoEngineers 1/26/2001 19 -- -- -- -- -- -- --SP-5-21 GeoEngineers 1/26/2001 21 18 -- -- -- -- -- -- --MW-6-16 GeoEngineers 7/11/2003 16 -- -- -- -- -- -- --MW-6-24 GeoEngineers 7/11/2003 24 -- -- -- -- -- -- --
MW-6-24 DUP GeoEngineers 7/11/2003 24 -- -- -- -- -- -- --MW-7-12 GeoEngineers 7/10/2003 12 -- -- -- -- -- -- --MW-7-20 GeoEngineers 7/10/2003 20 -- -- -- -- -- -- --
MW-8 MW-8-26.5 Farallon 5/13/2004 25-26.5 -- -- -- -- -- -- --MW-8S-6.5 Farallon 5/13/2004 5-6.5 7 290 1200 <6.8 <0.014 <0.068 <0.068 <0.136MW-8S-11.5 Farallon 5/13/2004 10-11.5 -- -- -- -- -- -- --
MW-9-9.5 Farallon 5/12/2004 8-9.5 <29 290 <5.9 <0.012 <0.059 <0.059 <0.118MW-9-14.5 Farallon 5/12/2004 13-14.5 -- -- -- -- -- -- --MW-9-20.0 Farallon 5/12/2004 18-20 6 -- -- -- -- -- --MW-10-12.5 Farallon 5/13/2004 11-12.5 17 <140 1100 <5.7 <0.011 <0.057 <0.057 <0.114MW-10-21.5 Farallon 5/13/2004 20-21.5 -- -- -- -- -- -- --MW11S-3 Farallon 5/21/2007 3 -- -- -- -- -- -- --MW11S-8 Farallon 5/21/2007 8 -- -- -- -- -- -- --
MW11S-24.5 Farallon 5/21/2007 24.5 -- -- -- -- -- -- --MW-11D MW11-35 Farallon 5/21/2007 35 -- -- -- -- -- -- -- --
MW12-3 Farallon 5/22/2007 3 -- -- -- -- -- -- --MW12-13 Farallon 5/22/2007 13 150 96 ND -- -- -- --MW12-25 Farallon 5/22/2007 25 -- -- -- -- -- -- --MW12-35 Farallon 5/22/2007 35 -- -- -- -- -- -- --
MW13-35.5 Farallon 9/21/2007 35.5 -- -- -- -- -- -- --MW-13-45 Farallon 9/21/2007 45 -- -- -- -- -- -- --
P-1 P-1-14 GeoEngineers 7/9/2003 14 13 -- -- -- -- -- -- --P-2-11 GeoEngineers 7/9/2003 11 -- -- -- -- -- -- --P-2-22 GeoEngineers 7/9/2003 22 -- -- -- -- -- -- --
P-3 P-3-25 GeoEngineers 7/9/2003 25 20 -- -- -- -- -- -- --
13
13
47.5
22
14.3
16
20
MW-1
MW-2
MW-5
GP-5
MW-6
GP-4
MW-10
MW-7
MW-8S
P-2
MW-9
MW-12
MW-13
MW-11S

TABLE 2-2PRE-REMEDIAL INVESTIGATION PETROLEUM HYDROCARBONS SOIL ANALYTICAL RESULTS
SAURO'S PROPERTY RI/FSTACOMA, WASHINGTON
Table 2-2Page 3 of 4
5/14/2014Y:\094\048.012\R\RIFS\Tables\Section 2.0\Table 2-1 thru 2-3 -Soil Analytical Results – Pre-RI Summary Data LANDAU ASSOCIATES
DRO ORO GRO Benzene* Ethylbenzene* Toluene* Xylenes*
Depth to Groundwater
(ft BGS)
Soil Analytical Results (mg/kg)2
Sample DateSample Depth
(ft BGS)1Boring or
Well Sample Number Sampled ByP-4-13 GeoEngineers 7/9/2003 13 -- -- -- -- -- -- --P-4-22 GeoEngineers 7/9/2003 22 -- -- -- -- -- -- --P-5-8 GeoEngineers 7/9/2003 8 -- -- -- -- -- -- --P-5-20 GeoEngineers 7/9/2003 20 -- -- -- -- -- -- --P-6-13 GeoEngineers 7/10/2003 13 -- -- -- -- -- -- --P-6-20 GeoEngineers 7/10/2003 20 -- -- -- -- -- -- --P-7-18 GeoEngineers 7/10/2003 18 -- -- -- -- -- -- --
P-7-18 DUP GeoEngineers 7/10/2003 18 -- -- -- -- -- -- --P-7-26 GeoEngineers 7/10/2003 26 -- -- -- -- -- -- --P-8-13 GeoEngineers 7/10/2003 13 -- -- -- -- -- -- --P-8-22 GeoEngineers 7/10/2003 22 -- -- -- -- -- -- --
PMX-B-3-2.0 Parametrix 4/28/2008 2 76 650 <4.4 <0.0088 <0.044 <0.044 <0.044PMX-B-3-16.0 Parametrix 4/28/2008 16 <25 <50 <4.3 <0.0086 <0.043 <0.043 <0.043PMX-B-3-43.0 Parametrix 4/28/2008 43 <25 <50 <3.4 <0.0068 <0.034 <0.034 <0.034PMX-B-4-2.0 Parametrix 4/28/2008 2 150 <54 580 <0.0082 0.15 <0.041 0.131PMX-B-4-14.0 Parametrix 4/28/2008 14 220 <51 320 <0.0067 0.89 0.036 1.35PMX-B-4-16.0 Parametrix 4/28/2008 16 <28 <56 57 <0.0089 0.0093 <0.044 <0.044
PMX-FD PMX-FD-042808 Parametrix 4/28/2008 NR <27 <54 1.6 <0.0088 <0.044 <0.044 <0.044PMX-B-1-2.0 Parametrix 4/29/2008 2 <25 <51 1.3 <0.0069 <0.034 <0.034 <0.034PMX-B-1-13.0 Parametrix 4/29/2008 13 <26 <53 0.39 <0.0068 <0.034 <0.034 <0.034PMX-B-1-44.0 Parametrix 4/29/2008 44 <27 <54 <4.1 <0.0082 <0.041 <0.041 <0.041PMX-B-2-2.5 Parametrix 4/30/2008 2.5 <27 21 0.74 <0.0069 <0.034 <0.034 <0.034PMX-B-2-14.5 Parametrix 4/30/2008 14.5 <25 <50 <4.3 <0.0085 <0.043 <0.043 <0.043PMX-B-2-44.0 Parametrix 4/30/2008 44 <25 <50 <3.8 <0.0075 <0.038 <0.038 <0.038RNSMW-1-11' RNS 6/19/2006 11 -- -- -- -- -- <0.02 --RNSMW1-16' RNS 6/19/2006 16 -- -- -- -- -- <0.02 --RNSM1-46' RNS 6/19/2006 46 -- -- -- -- -- <0.02 --
RNSMW2-9.5' RNS 6/19/2006 9.5 -- -- -- -- -- <0.02 --RNSMW2-14.5' RNS 6/19/2006 14.5 -- -- -- -- -- <0.02 --RNSMW-59.5' RNS 6/19/2006 59.5 -- -- -- -- -- <0.02 --RNSMW4-30.5' RNS 12/7/2006 30.5 -- -- -- -- -- -- --
RNSMW4-30.5' Dup3 RNS 12/7/2006 30.5 -- -- -- -- -- -- --RNSMW4-45.0' RNS 12/7/2006 45.0 -- -- -- -- -- -- --RNSMW5-26' RNS 12/8/2006 26 -- -- -- -- -- -- --RNSMW5-46' RNS 12/8/2006 46 -- -- -- -- -- -- --
RNSMW5-46' Dup6 RNS 12/8/2006 46 -- -- -- -- -- -- --RNSMW6-36.5' RNS 12/12/2006 36.5 -- -- -- -- -- -- --RNSMW6-59.0' RNS 12/12/2006 59 -- -- -- -- -- -- --RNSMW7-25' RNS 12/11/2006 25 -- -- -- -- -- -- --RNSMW7-45' RNS 12/11/2006 45 -- -- -- -- -- -- --
RNSMW7-50.5' RNS 12/11/2006 50.5 -- -- -- -- -- -- --S-1 S-1-Vacant Lot-Debris KJC 10/11/1991 NR -- -- -- -- -- -- --S-2 S-2-Plating Shop-Soil KJC 10/11/1991 NR -- -- -- -- -- -- --S-3 S-3-Plating Shop-Soil KJC 10/11/1991 NR -- -- -- -- -- -- --S-4 S-4-Near Sump-Soil KJC 10/11/1991 NR -- -- -- -- -- -- --S-5 S-5-Basement-Debris KJC 10/11/1991 NR -- -- -- -- -- -- --
--
15
16
--
22.5
--
18
24
24
16
12
RNSMW1
RNSMW2
RNSMW5
PMX-B-2
RNSMW6
RNSMW7
P-4
P-5
P-6
P-7
P-8
RNSMW4
PMX-B-3
PMX-B-4
PMX-B-1

TABLE 2-2PRE-REMEDIAL INVESTIGATION PETROLEUM HYDROCARBONS SOIL ANALYTICAL RESULTS
SAURO'S PROPERTY RI/FSTACOMA, WASHINGTON
Table 2-2Page 4 of 4
5/14/2014Y:\094\048.012\R\RIFS\Tables\Section 2.0\Table 2-1 thru 2-3 -Soil Analytical Results – Pre-RI Summary Data LANDAU ASSOCIATES
DRO ORO GRO Benzene* Ethylbenzene* Toluene* Xylenes*
Depth to Groundwater
(ft BGS)
Soil Analytical Results (mg/kg)2
Sample DateSample Depth
(ft BGS)1Boring or
Well Sample Number Sampled ByS-6 S-6-Basement-Paint/Debris KJC 10/11/1991 NR -- -- -- -- -- -- --
SP-6 SP-6-15 GeoEngineers 1/26/2001 15 18.5 -- -- -- -- -- -- --SP-7 SP-7-18 GeoEngineers 1/26/2001 18 -- -- -- -- -- -- -- --
SVE1-3 Farallon 5/22/2007 3 -- -- -- -- -- -- --SVE1-8 Farallon 5/22/2007 8 -- -- -- -- -- -- --SVE-13 Farallon 5/22/2007 13 240 84 ND -- -- -- --SVE-17 Farallon 5/22/2007 17 -- -- -- -- -- -- --
TP-1 TP-1 RNS 4/13/2000 4.5 4.5 -- -- -- -- -- -- --TP-2 TP-2 RNS 4/13/2000 4 4 -- -- -- -- -- -- --TP-3 TP-3 RNS 4/13/2000 8 8 -- -- -- -- -- -- --TP-4 TP-4 RNS 4/13/2000 6 6 -- -- -- -- -- -- --
2000 2000 30/1007 0.030 6 7 9
DRO = Total petroleum hydrocarbons as diesel-range organics, analyzed by Method Northwest diesel-range total petroleum hydrocarbon extended (NWTPH-Dx)Env. Assoc. = Environmental Associates, Inc.GRO= Total petroleum hydrocarbons as gasoline-range organics, analyzed by Method NWTPH-GxORO = Total petroleum hydrocarbons as heavy oil-range organics, analyzed by Method NWTPH-DxRNS = Robinson, Noble & Saltbrush, Inc.
-- = Not analyzed.< = Result is less than laboratory practical quantitation limitBold = Detected compoundsBox = Concentrations at or above Model Toxics Control Act (MTCA) Method A cleanup levelsND = Not detected (by NWTPH-HCID Method)NE = Not EstablishedNR = Not Reported* = Analyzed by U.S. Environmental Protection Agency (EPA) Method 8260B in 2000, and by EPA Method 8021B in 2004** = Analyzed by EPA Method 9060
1 Depth in feet below ground surface.2 Analyzed by EPA Method 8260B.3 Field duplicate of RNSMW4-30.5'.4 Based on MTCA Method A unrestricted land use soil tables. 5 MTCA Method B values are presented for comparison only.6 Field duplicate of RNSMW5-46'.7 If Benzene is present, MTCA cleanup level is 30; If Benzene not present, MTCA cleanup level is 100.
Note:Disclaimer: Data in this table was compiled from report tables authored by the respective firm in the 'Sampled By' column. Landau Associates makes no warranties as to the correctness of the original data.
13.5SVE-1
MTCA Method A Cleanup Level for Soil4

TABLE 2-3PRE-REMEDIAL INVESTIGATION TOTAL METALS SOIL ANALYTICAL RESULTS
SAURO'S PROPERTY RI/FSTACOMA, WASHINGTON
Table 2-3Page 1 of 4
5/14/2014Y:\094\048.012\R\RIFS\Tables\Section 2.0\Table 2-1 thru 2-3 -Soil Analytical Results – Pre-RI Summary Data LANDAU ASSOCIATES
Arsenic Cadmium Chromium Copper Lead Mercury Nickel ZincCON-1 1-8 GeoEngineers 10/16/2001 8 -- -- -- -- -- -- -- -- --
3-3 GeoEngineers 10/16/2001 3 -- -- -- -- -- -- -- --3-6 GeoEngineers 10/16/2001 6 -- -- -- -- -- -- -- --
CON-4 4-6 GeoEngineers 10/16/2001 6 -- -- -- -- -- -- -- -- --B-1 B-1 3 feet Env. Assoc. 10/4/2001 3 6 -- -- -- -- -- -- -- --B-2 B-2 12 feet Env. Assoc. 10/4/2001 12 12 -- -- -- -- -- -- -- --
FB1-3 Farallon 5/23/2007 3 -- -- -- -- -- -- -- --FB1-13 Farallon 5/23/2007 13 -- -- -- -- -- -- -- --FB2-3 Farallon 5/23/2007 3 -- -- -- -- -- -- -- --FB2-13 Farallon 5/23/2007 13 -- -- -- -- -- -- -- --FB3-3 Farallon 5/23/2007 3 -- -- -- -- -- -- -- --FB3-8 Farallon 5/23/2007 8 -- -- -- -- -- -- -- --FB3-13 Farallon 5/23/2007 13 -- -- -- -- -- -- -- --FB3-16 Farallon 5/23/2007 16 -- -- -- -- -- -- -- --FB4-7 Farallon 5/23/2007 7 -- -- -- -- -- -- -- --FB4-12 Farallon 5/23/2007 12 -- -- -- -- -- -- -- --FB4-16 Farallon 5/23/2007 16 -- -- -- -- -- -- -- --FB5-4 Farallon 5/23/2007 4 -- -- -- -- -- -- -- --FB5-9 Farallon 5/23/2007 9 -- -- -- -- -- -- -- --FB5-14 Farallon 5/23/2007 14 -- -- -- -- -- -- -- --FB6-3 Farallon 5/23/2007 3 -- -- -- -- -- -- -- --FB6-8 Farallon 5/23/2007 8 -- -- -- -- -- -- -- --FB7-3 Farallon 5/23/2007 3 -- -- -- -- -- -- -- --FB7-8 Farallon 5/23/2007 8 -- -- -- -- -- -- -- --FB7-13 Farallon 5/23/2007 13 -- -- -- -- -- -- -- --FB8-3 Farallon 5/23/2007 3 -- -- -- -- -- -- -- --FB8-8 Farallon 5/23/2007 8 -- -- -- -- -- -- -- --FB8-13 Farallon 5/23/2007 13 -- -- -- -- -- -- -- --FB9-3 Farallon 5/23/2007 3 -- -- -- -- -- -- -- --FB9-8 Farallon 5/23/2007 8 -- -- -- -- -- -- -- --FB9-13 Farallon 5/23/2007 13 -- -- -- -- -- -- -- --FB10-3 Farallon 5/23/2007 3 -- -- -- -- -- -- -- --FB10-8 Farallon 5/23/2007 8 -- -- -- -- -- -- -- --FB10-13 Farallon 5/23/2007 13 -- -- -- -- -- -- -- --FB11-3 Farallon 5/23/2007 3 -- -- -- -- -- -- -- --FB11-8 Farallon 5/23/2007 8 -- -- -- -- -- -- -- --FB11-13 Farallon 5/23/2007 13 -- -- -- -- -- -- -- --FB12-3 Farallon 5/23/2007 3 -- -- -- -- -- -- -- --FB12-8 Farallon 5/23/2007 8 -- -- -- -- -- -- -- --FB12-13 Farallon 5/23/2007 13 -- -- -- -- -- -- -- --GP-1-2.5 GeoEngineers 5/24/2000 2.5 <10 <1 <20 -- 28 -- -- --GP-1-10 GeoEngineers 5/24/2000 10 -- <10 <1 <20 -- 57 -- -- --GP-2-2.5 GeoEngineers 5/24/2000 2.5 16.3 <10 2.1 <20 -- 69 -- -- --GP-2-17.5 GeoEngineers 5/24/2000 17.5 <10 2.1 <20 -- 67 -- -- --GP-3-5.0 GeoEngineers 5/24/2000 5 -- -- -- -- -- -- -- --GP-3-12.5 GeoEngineers 5/24/2000 12.5 <10 <1 <20 -- 67 -- -- --
CON-3
GP-1
GP-2
FB-12
FB-4
FB-5
FB-11
FB-10
FB-7
FB-6
FB-9
Boring or Well
GP-3
FB-3
FB-2
FB-1
Soil Analytical Results (mg/kg)2
FB-8
Sample Number Sampled By Sample DateSample Depth
(ft BGS)1
Depth to Groundwater
(ft BGS)
--
--
13
--
--
--
14
15.5
--
14.5
14.5
14.5
14
14.5

TABLE 2-3PRE-REMEDIAL INVESTIGATION TOTAL METALS SOIL ANALYTICAL RESULTS
SAURO'S PROPERTY RI/FSTACOMA, WASHINGTON
Table 2-3Page 2 of 4
5/14/2014Y:\094\048.012\R\RIFS\Tables\Section 2.0\Table 2-1 thru 2-3 -Soil Analytical Results – Pre-RI Summary Data LANDAU ASSOCIATES
Arsenic Cadmium Chromium Copper Lead Mercury Nickel ZincBoring or
WellSoil Analytical Results (mg/kg)2
Sample Number Sampled By Sample DateSample Depth
(ft BGS)1
Depth to Groundwater
(ft BGS)GP-4-15 GeoEngineers 5/24/2000 15 <10 1.0 <20 -- 28 -- -- --
GP-4-17.5 GeoEngineers 5/24/2000 17.5 14.8 <10 1.4 <20 -- 99 -- -- --GP-5-10 GeoEngineers 5/24/2000 10 <10 1.0 <20 -- 20 -- -- --GP-5-15 GeoEngineers 5/24/2000 15 <10 1.6 <20 -- 26 -- -- --
GP-6 GP-6-25 GeoEngineers 5/24/2000 25 -- -- -- -- -- -- -- --SUMP SUMP @ 4' GeoEngineers 5/24/2000 4 59 8.7 27 -- 1510 -- -- --LAI-B1 LAI-B1 (22.5-23.0) Landau Associates 5/6/2008 22.5 23.5 -- -- -- -- -- -- -- --LAI-B2 LAI-B2 (15.75-16.0) Landau Associates 5/6/2008 15.75 30.0 -- -- -- -- -- -- -- --LAI-B3 LAI-B3 (21.5-22.0) Landau Associates 5/6/2008 21.5 22.0 -- -- -- -- -- -- -- --
SP-1-4 GeoEngineers 1/25/2001 4 3.61 0.424 42.7 29.7 62.2 0.226 46 69.9SP-1-16 GeoEngineers 1/25/2001 16 16.5 -- -- -- -- -- -- -- --SP-2-5 GeoEngineers 1/25/2001 5 2.09 <0.376 36.5 17.6 23.3 0.245 37 46.6SP-2-15 GeoEngineers 1/25/2001 15 14 -- -- -- -- -- -- -- --
MW-3 SP-3-20 GeoEngineers 1/25/2001 20 -- -- -- -- -- -- -- -- --MW-4 SP-4-21 GeoEngineers 1/25/2001 21 17 -- -- -- -- -- -- -- --
SP-5-19 GeoEngineers 1/26/2001 19 3.24 0.819 28.9 41.1 121 0.177 28.8 99.7SP-5-21 GeoEngineers 1/26/2001 21 18 -- -- -- -- -- -- -- --MW-6-16 GeoEngineers 7/11/2003 16 -- -- -- -- -- -- -- --MW-6-24 GeoEngineers 7/11/2003 24 -- -- -- -- -- -- -- --
MW-6-24 DUP GeoEngineers 7/11/2003 24 -- -- -- -- -- -- -- --MW-7-12 GeoEngineers 7/10/2003 12 -- -- -- -- -- -- -- --MW-7-20 GeoEngineers 7/10/2003 20 -- -- -- -- -- -- -- --
MW-8 MW-8-26.5 Farallon 5/13/2004 25-26.5 -- -- -- -- -- -- -- --MW-8S-6.5 Farallon 5/13/2004 5-6.5 7 <14 <0.68 -- -- 76 1.4 -- --MW-8S-11.5 Farallon 5/13/2004 10-11.5 -- -- -- -- -- -- -- --
MW-9-9.5 Farallon 5/12/2004 8-9.5 <12 <0.59 -- -- <5.9 <0.29 -- --MW-9-14.5 Farallon 5/12/2004 13-14.5 -- -- -- -- -- -- -- --MW-9-20.0 Farallon 5/12/2004 18-20 6 -- -- -- -- -- -- -- --MW-10-12.5 Farallon 5/13/2004 11-12.5 17 <11 <0.57 -- -- 160 0.3 -- --MW-10-21.5 Farallon 5/13/2004 20-21.5 -- -- -- --MW11S-3 Farallon 5/21/2007 3 -- -- -- -- -- -- -- --MW11S-8 Farallon 5/21/2007 8 -- -- -- -- -- -- -- --
MW11S-24.5 Farallon 5/21/2007 24.5 -- -- -- -- -- -- -- --MW-11D MW11-35 Farallon 5/21/2007 35 -- -- -- -- -- -- -- -- --
MW12-3 Farallon 5/22/2007 3 -- -- -- -- -- -- -- --MW12-13 Farallon 5/22/2007 13 -- -- -- -- -- -- -- --MW12-25 Farallon 5/22/2007 25 -- -- -- -- -- -- -- --MW12-35 Farallon 5/22/2007 35 -- -- -- -- -- -- -- --
MW13-35.5 Farallon 9/21/2007 35.5 -- -- -- -- -- -- -- --MW-13-45 Farallon 9/21/2007 45 -- -- -- -- -- -- -- --
P-1 P-1-14 GeoEngineers 7/9/2003 14 13 -- -- -- -- -- -- -- --P-2-11 GeoEngineers 7/9/2003 11 -- -- -- -- -- -- -- --P-2-22 GeoEngineers 7/9/2003 22 -- -- -- -- -- -- -- --
P-3 P-3-25 GeoEngineers 7/9/2003 25 20 -- -- -- -- -- -- -- --P-4-13 GeoEngineers 7/9/2003 13 -- -- -- -- -- -- -- --P-4-22 GeoEngineers 7/9/2003 22 -- -- -- -- -- -- -- --
MW-1
MW-2
MW-5
GP-4
MW-11S
MW-12
MW-8S
MW-10
P-2
P-4
MW-13
MW-9
GP-5
MW-6
MW-7
14.3
16
20
13
13
47.5
22
16

TABLE 2-3PRE-REMEDIAL INVESTIGATION TOTAL METALS SOIL ANALYTICAL RESULTS
SAURO'S PROPERTY RI/FSTACOMA, WASHINGTON
Table 2-3Page 3 of 4
5/14/2014Y:\094\048.012\R\RIFS\Tables\Section 2.0\Table 2-1 thru 2-3 -Soil Analytical Results – Pre-RI Summary Data LANDAU ASSOCIATES
Arsenic Cadmium Chromium Copper Lead Mercury Nickel ZincBoring or
WellSoil Analytical Results (mg/kg)2
Sample Number Sampled By Sample DateSample Depth
(ft BGS)1
Depth to Groundwater
(ft BGS)P-5-8 GeoEngineers 7/9/2003 8 -- -- -- -- -- -- -- --P-5-20 GeoEngineers 7/9/2003 20 -- -- -- -- -- -- -- --
P-6-13 GeoEngineers 7/10/2003 13 18 -- -- -- -- -- -- -- --
P-6-20 GeoEngineers 7/10/2003 20 -- -- -- -- -- -- -- --P-7-18 GeoEngineers 7/10/2003 18 24 -- -- -- -- -- -- -- --
P-7-18 DUP GeoEngineers 7/10/2003 18 -- -- -- -- -- -- -- --P-7-26 GeoEngineers 7/10/2003 26 -- -- -- -- -- -- -- --P-8-13 GeoEngineers 7/10/2003 13 24 -- -- -- -- -- -- -- --P-8-22 GeoEngineers 7/10/2003 22 -- -- -- -- -- -- -- --
PMX-B-3-2.0 Parametrix 4/28/2008 2 3.4 <0.47 33 -- 2.6 0.028 -- --PMX-B-3-16.0 Parametrix 4/28/2008 16 3.2 <0.45 25 -- 2.1 0.034 -- --PMX-B-3-43.0 Parametrix 4/28/2008 43 3.2 <0.49 23 -- 2.1 0.025 -- --PMX-B-4-2.0 Parametrix 4/28/2008 2 4.2 <0.55 40 -- 3.3 0.035 -- --PMX-B-4-14.0 Parametrix 4/28/2008 14 3.6 <0.46 30 -- 2.5 0.026 -- --PMX-B-4-16.0 Parametrix 4/28/2008 16 3.1 <0.4 26 -- 3.2 0.033 -- --
PMX-FD PMX-FD-042808 Parametrix 4/28/2008 NR 3.7 <0.4 32 -- 3.8 0.036 -- --PMX-B-1-2.0 Parametrix 4/29/2008 2 2.7 <0.51 19 -- 1.6 0.022 -- --PMX-B-1-13.0 Parametrix 4/29/2008 13 3.9 <0.48 24 -- 2.3 0.036 -- --PMX-B-1-44.0 Parametrix 4/29/2008 44 3.2 <0.38 29 -- 2.4 0.031 -- --PMX-B-2-2.5 Parametrix 4/30/2008 2.5 3.8 <0.39 21 -- 13 0.027 -- --PMX-B-2-14.5 Parametrix 4/30/2008 14.5 3.6 <0.45 30 -- 2.5 0.031 -- --PMX-B-2-44.0 Parametrix 4/30/2008 44 2.5 <0.37 22 -- 1.5 0.015 -- --RNSMW-1-11' RNS 6/19/2006 11 15 <5 <0.3 10 -- <4 <0.05 -- --RNSMW1-16' RNS 6/19/2006 16 <5 <0.3 25 -- <4 <0.05 -- --RNSM1-46' RNS 6/19/2006 46 <5 <0.3 17 -- <4 <0.05 -- --
RNSMW2-9.5' RNS 6/19/2006 9.5 16 <5 <0.3 26 -- 5 <0.05 -- --RNSMW2-14.5' RNS 6/19/2006 14.5 <5 <0.3 15 -- <4 <0.05 -- --RNSMW-59.5' RNS 6/19/2006 59.5 <5 <0.3 20 -- <4 <0.05 -- --RNSMW4-30.5' RNS 12/7/2006 30.5 -- -- -- -- -- -- -- -- --
RNSMW4-30.5' Dup3 RNS 12/7/2006 30.5 -- -- -- -- -- -- -- --RNSMW4-45.0' RNS 12/7/2006 45.0 -- -- -- -- -- -- -- --RNSMW5-26' RNS 12/8/2006 26 22.5 -- -- -- -- -- -- -- --RNSMW5-46' RNS 12/8/2006 46 -- -- -- -- -- -- -- --
RNSMW5-46' Dup6 RNS 12/8/2006 46 -- -- -- -- -- -- -- --RNSMW6-36.5' RNS 12/12/2006 36.5 -- -- -- -- -- -- -- -- --RNSMW6-59.0' RNS 12/12/2006 59 -- -- -- -- -- -- -- --RNSMW7-25' RNS 12/11/2006 25 -- -- -- -- -- -- -- -- --RNSMW7-45' RNS 12/11/2006 45 -- -- -- -- -- -- -- --
RNSMW7-50.5' RNS 12/11/2006 50.5 -- -- -- -- -- -- -- --S-1 S-1-Vacant Lot-Debris KJC 10/11/1991 NR -- -- 86 96 780 -- 11 660S-2 S-2-Plating Shop-Soil KJC 10/11/1991 NR -- -- 22 46 150 -- 19 130S-3 S-3-Plating Shop-Soil KJC 10/11/1991 NR -- -- 25 16 63 -- 24 47S-4 S-4-Near Sump-Soil KJC 10/11/1991 NR -- -- 26 110 -- -- 24 170S-5 S-5-Basement-Debris KJC 10/11/1991 NR -- -- 69 9100 -- -- 510 1200
P-7
P-8
P-6
RNSMW1
RNSMW2
RNSMW6
RNSMW7
RNSMW4
RNSMW5
PMX-B-2
PMX-B-3
PMX-B-4
PMX-B-1
P-5 12

TABLE 2-3PRE-REMEDIAL INVESTIGATION TOTAL METALS SOIL ANALYTICAL RESULTS
SAURO'S PROPERTY RI/FSTACOMA, WASHINGTON
Table 2-3Page 4 of 4
5/14/2014Y:\094\048.012\R\RIFS\Tables\Section 2.0\Table 2-1 thru 2-3 -Soil Analytical Results – Pre-RI Summary Data LANDAU ASSOCIATES
Arsenic Cadmium Chromium Copper Lead Mercury Nickel ZincBoring or
WellSoil Analytical Results (mg/kg)2
Sample Number Sampled By Sample DateSample Depth
(ft BGS)1
Depth to Groundwater
(ft BGS)S-6 S-6-Basement-Paint/Debris KJC 10/11/1991 NR -- -- 27 620 340 -- 230 1000
SP-6 SP-6-15 GeoEngineers 1/26/2001 15 18.5 -- -- -- -- -- -- -- --SP-7 SP-7-18 GeoEngineers 1/26/2001 18 -- -- -- -- -- -- -- -- --
SVE1-3 Farallon 5/22/2007 3 13.5 -- -- -- -- -- -- -- --SVE1-8 Farallon 5/22/2007 8 -- -- -- -- -- -- -- --SVE-13 Farallon 5/22/2007 13 -- -- -- -- -- -- -- --SVE-17 Farallon 5/22/2007 17 -- -- -- -- -- -- -- --
TP-1 TP-1 RNS 4/13/2000 4.5 4.5 <5 <1 <20 -- <5 <0.1 -- --TP-2 TP-2 RNS 4/13/2000 4 4 >5 <1 <20 -- 36 4.1 -- --TP-3 TP-3 RNS 4/13/2000 8 8 <5 <1 <20 -- 89 2.2 -- --TP-4 TP-4 RNS 4/13/2000 6 6 5.7 <1 <20 -- 120 9.1 -- --
20 2 19/20005 NE 250 2 NE NE
Env. Assoc. = Environmental Associates Inc.RNS = Robinson, Noble & Saltbrush, Inc.
-- = Not analyzed< = Result is less than laboratory practical quantitation limitBold = Detected compoundsBox = Concentrations at or above Model Toxics Control Act (MTCA) Method A cleanup levelsNE = Not EstablishedNR = Not Reported
1 Depth in feet below ground surface.2 Analyzed by U.S. Environmental Protection Agency (EPA) Method 8260B.3 Field duplicate of RNSMW4-30.5'.4 Based on MTCA Method A unrestricted land use soil tables. 5 Cleanup level is 2000 for Chromium(III) and 19 for Chromium(VI). Natural background soil level for total chromium is 48 milligrams per kilogram (mg/kg; Ecology 1994).6 Field duplicate of RNSMW5-46'.
Note:Disclaimer: Data in this table was compiled from report tables authored by the respective firm in the 'Sampled By' column. Landau Associates makes no warranties as to the correctness of the original data.
MTCA Method A Cleanup Level for Soil4
SVE-1

TABLE 2-4PRE-REMEDIAL INVESTIGATION VOLATILE ORGANIC COMPOUND GROUNDWATER ANALYTICAL RESULTS
SAURO'S PROPERTY RI/FSTACOMA, WASHINGTON
Table 2-4Page 1 of 3
5/14/2014Y:\094\048.012\R\RIFS\Tables\Section 2.0\Table 2-4 thru 2-6 - Groundwater Analytic Results - Pre-RI Summary Data LANDAU ASSOCIATES
Tetrachloroethene Trichloroethene cis-1,2-Dichloroethene Vinyl ChlorideB-1 B-1-GW/6-15 ft Env. Assoc. 10/4/2001 6 - 15 1.1 <5 6.5 27B-2 B-2-GW/12-15 ft Env. Assoc. 10/4/2001 12 - 15 39 9.4 30 <0.2
DRAIN DRAIN RNS 8/10/2006 NR8 <1 1.7 7.3 2.3GP-33 GP-3 GeoEngineers 5/23/2000 NR 17 1.9 16 --GP-43 GP-4 GeoEngineers 5/23/2000 NR 3800 490 5600 --GP-53 GP-5 GeoEngineers 5/23/2000 NR 1600 510 4200 --GP-63 GP-6 GeoEngineers 5/23/2000 NR 16 <1.0 2.7 --LAI-B1 LAI-B1 (25-28) Landau Associates 5/6/2008 25 <0.2 <0.2 <0.2 <0.2LAI-B24 LAI-B2 (37-40) Landau Associates 5/6/2008 37 0.7 <0.2 <0.2 <0.2
LAI-B3 (22-24) Landau Associates 5/6/2008 22 0.6 0.4 <0.2 <0.2LAI-B3 (32') Landau Associates 5/6/2008 32 <0.2 <0.2 <0.2 <0.2
LAI-B54 LAI-B5 (31-41) Landau Associates 5/7/2008 31 <0.2 <0.2 <0.2 <0.2LAI-MW1 LAI-MW1 Landau Associates 5/21/2008 >44.85 <0.2 0.2 0.9 <0.2LAI-MW2 LAI-MW2 Landau Associates 5/19/2008 >47.055 120 62 100 1.4LAI-MW3 LAI-MW3 Landau Associates 5/19/2008 >51.25 66 37 65 0.5LAI-MW44 LAI-MW4 Landau Associates 5/19/2008 >12.755 <0.2 0.2 0.9 0.6
MW-1 GeoEngineers 1/25/2001 NR <1 <1 24.7 33.3MW1-052104 Farallon 5/21/2004 20 <0.2 <0.2 2.5 2.1
MW-1 GeoEngineers 1/25/2001 NR <1.0 <1.0 24.7 33.3MW-1 RNS 12/7/2006 NR <1.0 <1.0 1.3 0.4MW-1 RNS 7/14/2006 21 <1 <1 1 7
MW1-060407 Farallon* 6/4/2007 NR <0.020 <0.020 0.81 0.52MW-2 GeoEngineers 1/25/2001 NR 7.37 10.7 134 118
MW2-052104 Farallon 5/21/2004 17 2.6 9.6 83 60MW-2 RNS 12/7/2006 NR 3.4 4.8 42 7.6
MW2-060407 Farallon* 6/4/2007 NR 0.87 2 12 1.8MW-3 GeoEngineers 1/25/2001 NR 20.9 <1 <1 <1
MW3-060407 Farallon* 6/4/2007 NR 7.2 <0.020 <0.020 <0.020MW-4 GeoEngineers 1/25/2001 NR <1 <1 391 394
MW4-052104 Farallon 5/21/2004 20 26 12 410 450MW4-060507 Farallon* 6/5/2007 NR <1.0 6.8 190 230
MW-5 MW-5 GeoEngineers 1/26/2001 NR 277 213 2,310 449MW-5A GeoEngineers 7/11/2003 NR <1 <1 5.5 <0.02
MW5A-052104-2 Farallon 5/21/2004 25 0.82 <0.2 4.7 17MW-6 GeoEngineers 7/11/2003 NR 43 46 21 11
MW6-052004-2 Farallon 5/20/2004 22 16 4.9 4.9 1.7MW-6 RNS 7/14/2006 23 22 9 5 11
MW6-060507 Farallon* 6/5/2007 NR 13 6.9 5.8 1.3MW-7 GeoEngineers 7/11/2003 NR <1 <1 <1 <0.02
MW7-052004-2 Farallon 5/20/2004 28 0.34 0.59 1 0.73MW8S-052004 Farallon 5/20/2004 10 79 28 120 47
MW-8S RNS 6/29/2006 12 8 30.7 87.2 41.6MW8S060507 Farallon* 6/5/2007 NR 3.1 7.3 74 47
Groundwater Analytical Results (µg/L)2Boring or
Well Sample Number Sampled BySample
DateSample Depth
(ft BGS)1
MW-1
LAI-B34
MW-2
MW-3
MW-4
MW-6
MW-7
MW-5a
MW-8s
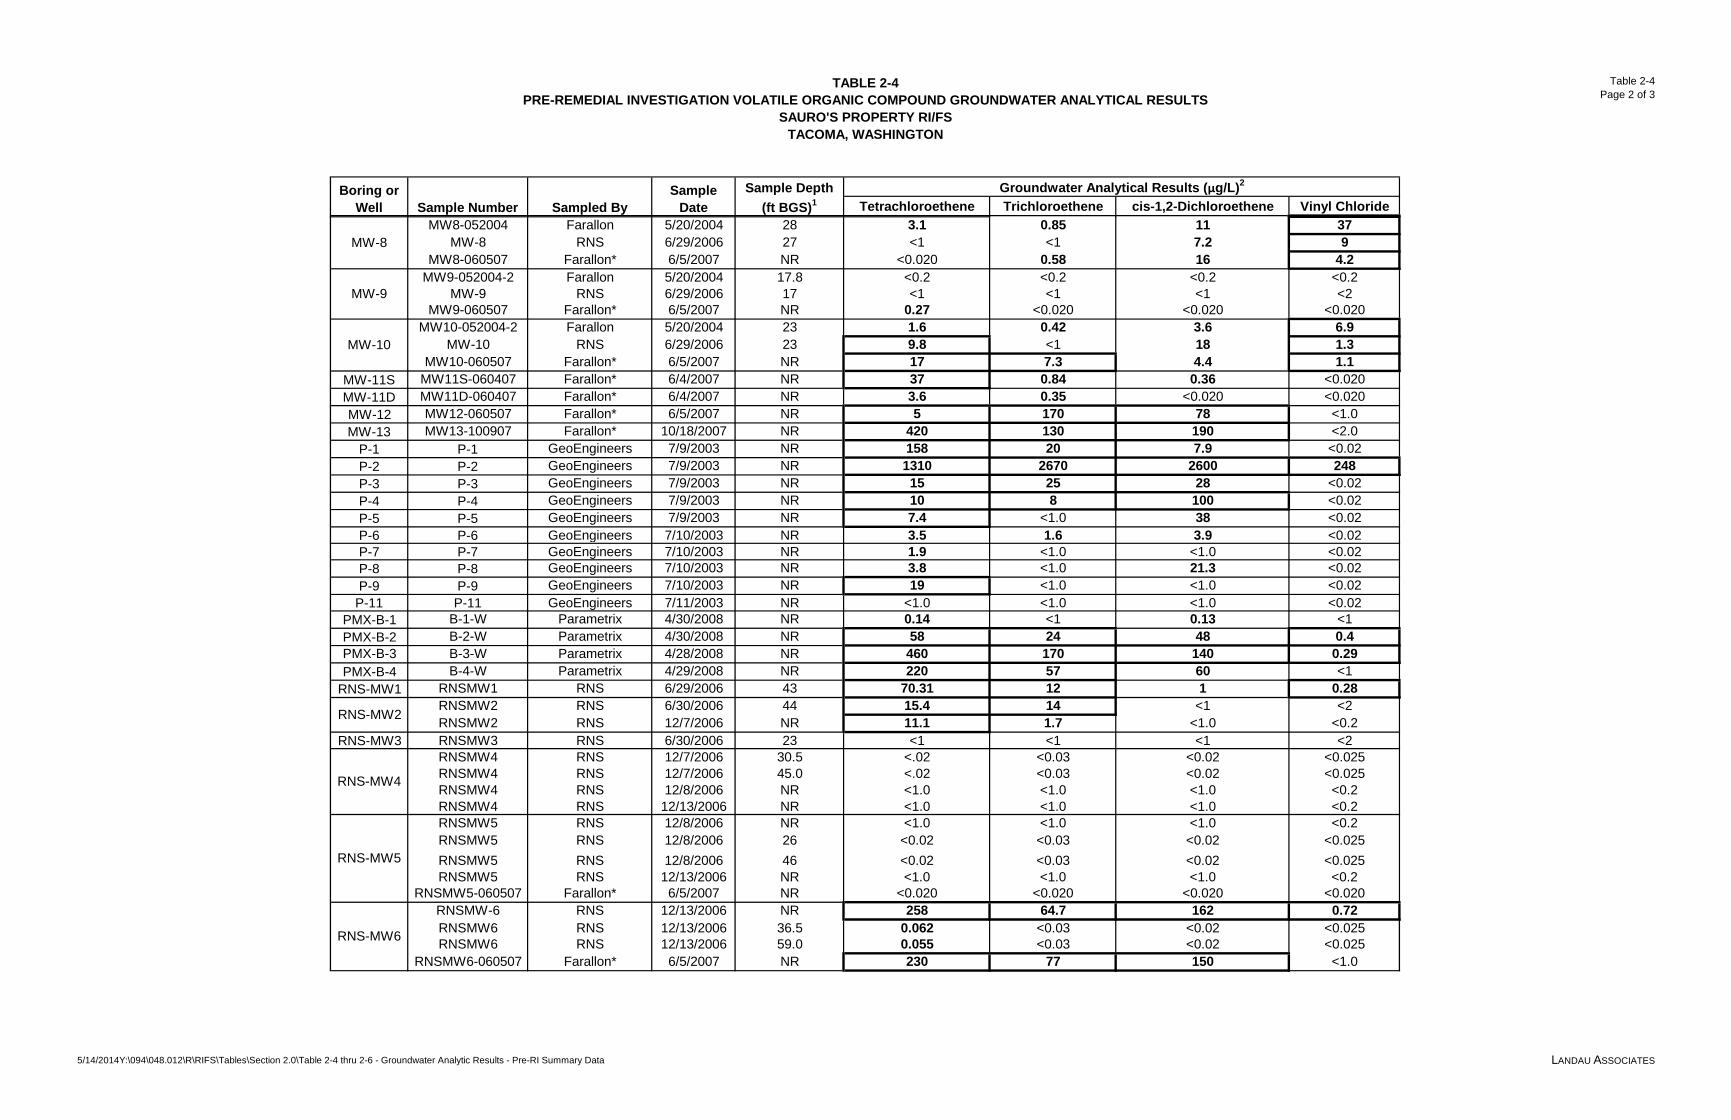
TABLE 2-4PRE-REMEDIAL INVESTIGATION VOLATILE ORGANIC COMPOUND GROUNDWATER ANALYTICAL RESULTS
SAURO'S PROPERTY RI/FSTACOMA, WASHINGTON
Table 2-4Page 2 of 3
5/14/2014Y:\094\048.012\R\RIFS\Tables\Section 2.0\Table 2-4 thru 2-6 - Groundwater Analytic Results - Pre-RI Summary Data LANDAU ASSOCIATES
Tetrachloroethene Trichloroethene cis-1,2-Dichloroethene Vinyl ChlorideGroundwater Analytical Results (µg/L)2
Boring or Well Sample Number Sampled By
Sample Date
Sample Depth (ft BGS)1
MW8-052004 Farallon 5/20/2004 28 3.1 0.85 11 37MW-8 RNS 6/29/2006 27 <1 <1 7.2 9
MW8-060507 Farallon* 6/5/2007 NR <0.020 0.58 16 4.2MW9-052004-2 Farallon 5/20/2004 17.8 <0.2 <0.2 <0.2 <0.2
MW-9 RNS 6/29/2006 17 <1 <1 <1 <2MW9-060507 Farallon* 6/5/2007 NR 0.27 <0.020 <0.020 <0.020
MW10-052004-2 Farallon 5/20/2004 23 1.6 0.42 3.6 6.9MW-10 RNS 6/29/2006 23 9.8 <1 18 1.3
MW10-060507 Farallon* 6/5/2007 NR 17 7.3 4.4 1.1MW-11S MW11S-060407 Farallon* 6/4/2007 NR 37 0.84 0.36 <0.020MW-11D MW11D-060407 Farallon* 6/4/2007 NR 3.6 0.35 <0.020 <0.020MW-12 MW12-060507 Farallon* 6/5/2007 NR 5 170 78 <1.0MW-13 MW13-100907 Farallon* 10/18/2007 NR 420 130 190 <2.0
P-1 P-1 GeoEngineers 7/9/2003 NR 158 20 7.9 <0.02P-2 P-2 GeoEngineers 7/9/2003 NR 1310 2670 2600 248P-3 P-3 GeoEngineers 7/9/2003 NR 15 25 28 <0.02P-4 P-4 GeoEngineers 7/9/2003 NR 10 8 100 <0.02P-5 P-5 GeoEngineers 7/9/2003 NR 7.4 <1.0 38 <0.02P-6 P-6 GeoEngineers 7/10/2003 NR 3.5 1.6 3.9 <0.02P-7 P-7 GeoEngineers 7/10/2003 NR 1.9 <1.0 <1.0 <0.02P-8 P-8 GeoEngineers 7/10/2003 NR 3.8 <1.0 21.3 <0.02P-9 P-9 GeoEngineers 7/10/2003 NR 19 <1.0 <1.0 <0.02
P-11 GeoEngineers 7/11/2003 NR <1.0 <1.0 <1.0 <0.02PMX-B-1 B-1-W Parametrix 4/30/2008 NR 0.14 <1 0.13 <1PMX-B-2 B-2-W Parametrix 4/30/2008 NR 58 24 48 0.4PMX-B-3 B-3-W Parametrix 4/28/2008 NR 460 170 140 0.29PMX-B-4 B-4-W Parametrix 4/29/2008 NR 220 57 60 <1
RNS-MW1 RNSMW1 RNS 6/29/2006 43 70.31 12 1 0.28RNSMW2 RNS 6/30/2006 44 15.4 14 <1 <2RNSMW2 RNS 12/7/2006 NR 11.1 1.7 <1.0 <0.2
RNS-MW3 RNSMW3 RNS 6/30/2006 23 <1 <1 <1 <2RNSMW4 RNS 12/7/2006 30.5 <.02 <0.03 <0.02 <0.025RNSMW4 RNS 12/7/2006 45.0 <.02 <0.03 <0.02 <0.025RNSMW4 RNS 12/8/2006 NR <1.0 <1.0 <1.0 <0.2RNSMW4 RNS 12/13/2006 NR <1.0 <1.0 <1.0 <0.2RNSMW5 RNS 12/8/2006 NR <1.0 <1.0 <1.0 <0.2RNSMW5 RNS 12/8/2006 26 <0.02 <0.03 <0.02 <0.025RNSMW5 RNS 12/8/2006 46 <0.02 <0.03 <0.02 <0.025RNSMW5 RNS 12/13/2006 NR <1.0 <1.0 <1.0 <0.2
RNSMW5-060507 Farallon* 6/5/2007 NR <0.020 <0.020 <0.020 <0.020RNSMW-6 RNS 12/13/2006 NR 258 64.7 162 0.72RNSMW6 RNS 12/13/2006 36.5 0.062 <0.03 <0.02 <0.025RNSMW6 RNS 12/13/2006 59.0 0.055 <0.03 <0.02 <0.025
RNSMW6-060507 Farallon* 6/5/2007 NR 230 77 150 <1.0
MW-10
RNS-MW5
RNS-MW4
RNS-MW6
P-11
RNS-MW2
MW-9
MW-8

TABLE 2-4PRE-REMEDIAL INVESTIGATION VOLATILE ORGANIC COMPOUND GROUNDWATER ANALYTICAL RESULTS
SAURO'S PROPERTY RI/FSTACOMA, WASHINGTON
Table 2-4Page 3 of 3
5/14/2014Y:\094\048.012\R\RIFS\Tables\Section 2.0\Table 2-4 thru 2-6 - Groundwater Analytic Results - Pre-RI Summary Data LANDAU ASSOCIATES
Tetrachloroethene Trichloroethene cis-1,2-Dichloroethene Vinyl ChlorideGroundwater Analytical Results (µg/L)2
Boring or Well Sample Number Sampled By
Sample Date
Sample Depth (ft BGS)1
RNSMW-7 RNS 12/13/2006 NR <1.0 <1.0 <1.0 <0.2RNSMW7 RNS 12/13/2006 25 <0.02 <0.03 <0.02 <0.025RNSMW7 RNS 12/13/2006 45 <0.02 <0.03 <0.02 <0.025RNSMW7 RNS 12/13/2006 50.5 <0.02 <0.03 <0.02 <0.025
SP-63 SP-6 GeoEngineers 1/26/2001 NR 8 16.4 525 159SP-73 SP-7 GeoEngineers 1/27/2001 NR 2 <1.0 80 145
5 5 NE 0.270
Env. Assoc. = Environmental Associates Inc.
RNS = Robinson, Noble & Saltbrush, Inc.
-- = Not analyzed
< = Result is less than laboratory practical quantitation limit
Bold = Detected compoundsBox = Concentrations at or above Model Toxics Control Act (MTCA) Method A cleanup levelsNE = Not EstablishedNR = Not Reported
1 Depth in feet below ground surface.2 Analyzed by U.S. Environmental Protection Agency (EPA) Method 8260B.3 Data collected prior to 2001 excavation.4Acetone concentrations at LAI-B2, LAI-B3(32'), LAI-B5, and LAI-MW4 were 14 micrograms per liter (µg/L), 8.1 µg/L, 4.3 µg/L, and 120 µg/L, respectively.5Sample depth not recorded for these samples. This value represents depth to water at time of drilling.6 Table 720-1 of the MTCA Cleanup Regulation of the Washington Administrative Code, as revised in November 2007.7MTCA Method B Cleanup Level for unrestricted land use8 Sample collected from the DaVita Drain and treated as groundwater.
* Assumed to be sampled by Farallon (data came from Farallon, Table 4, Ecology Summary Letter 2007).
Notes:Disclaimer: Data in this table was compiled from report tables authored by the respective firm in the 'Sampled By' column. Landau Associates makes no warranties as to the correctness of the original data.
RNS-MW7
MTCA Method B Cleanup Level for Groundwater7MTCA Method A Cleanup Level for Groundwater6

TABLE 2-5PRE-REMEDIAL INVESTIGATION PETROLEUM HYDROCARBONS GROUNDWATER ANALYTICAL RESULTS
SAURO'S PROPERTY RI/FSTACOMA, WASHINGTON
Table 2-5Page 1 of 2
5/14/2014Y:\094\048.012\R\RIFS\Tables\Section 2.0\Table 2-4 thru 2-6 - Groundwater Analytic Results - Pre-RI Summary Data LANDAU ASSOCIATES
DRO2 ORO2 GRO3 Benzene4 Ethylbenzene4 Toluene4 Xylenes4
GP-3 GP-3 GeoEngineers 5/23/2000 NR -- -- -- -- -- -- 3.2GP-4 GP-4 GeoEngineers 5/23/2000 NR -- -- -- -- -- -- 1.1GP-5 GP-5 GeoEngineers 5/23/2000 NR -- -- -- -- -- -- <1.0GP-6 GP-6 GeoEngineers 5/23/2000 NR -- -- -- -- -- -- <1.0
LAI-B1 LAI-B1 (25-28) Landau Associates 5/6/2008 25 -- -- -- <0.2 <0.2 0.5 <0.4LAI-B2 LAI-B2 (37-40) Landau Associates 5/6/2008 37 -- -- -- 0.2 <0.2 0.6 <0.4
LAI-B3 (22-24) Landau Associates 5/6/2008 22 -- -- -- <0.2 <0.2 0.4 <0.4LAI-B3 (32') Landau Associates 5/6/2008 32 -- -- -- <0.2 <0.2 <0.2 <0.4
LAI-B5 LAI-B5 (31-41) Landau Associates 5/7/2008 31 -- -- -- 0.5 <0.2 0.6 <0.4LAI-MW1 LAI-MW1 Landau Associates 5/21/2008 >44.85 -- -- -- <0.2 <0.2 <0.2 <0.4LAI-MW2 LAI-MW2 Landau Associates 5/19/2008 >47.055 -- -- -- <0.2 <0.2 <0.2 <0.4LAI-MW3 LAI-MW3 Landau Associates 5/19/2008 >51.25 -- -- -- <0.2 <0.2 <0.2 <0.4LAI-MW4 LAI-MW4 Landau Associates 5/19/2008 >12.755 -- -- -- 9.3 <0.2 <0.2 <0.4
MW1-052104 Farallon 5/21/2004 20 <260 <410 <100 <1 <1 <1 <2MW-1 RNS 7/14/2006 NR NR NR NR <1 <1 1 <2
MW-2 MW2-052104 Farallon 5/21/2004 17 <260 <410 <100 <1 <1 <1 <2MW-4 MW4-052104 Farallon 5/21/2004 20 <260 <410 <100 <1 <1 <1 <2
MW-5A GeoEngineers 7/11/2003 NR -- -- -- <1.0 <1.0 <1.0 <1.0MW5A-052104-1 Farallon 5/21/2004 18.5 <260 <410 <100 <1 <1 <1 <2
MW-6 GeoEngineers 7/11/2003 NR -- -- -- <1.0 <1.0 <1.0 <1.0MW6-052004-1 Farallon 5/20/2004 14.5 <260 <410 <100 <1 <1 <1 <2
MW-6 RNS 7/14/2006 NR NR NR NR <1 <1 <1 <2MW-7 GeoEngineers 7/11/2003 NR -- -- -- <1.0 <1.0 <1.0 <1.0
MW7-052004-1 Farallon 5/20/2004 18.5 <250 <400 <100 <1 <1 <1 <2MW8S-052004 Farallon 5/20/2004 10 <250 <400 <100 <1 <1 <1 <2MW8B-0520046 Farallon 5/20/2004 10 <260 <410 <100 <1 <1 <1 <2
MW-8S RNS 6/29/2006 NR NR NR NR <1 <1 <1 2.6MW8-052004 Farallon 5/20/2004 28 <260 <410 <100 <1 <1 <1 <2
MW-8 RNS 6/29/2006 NR <200 <200 NR <1 <1 <1 <1MW9-052004-1 Farallon 5/20/2004 6 <250 <410 <100 <1 <1 <1 <2
MW-9 RNS 6/29/2006 NR <200 <200 NR <1 <1 <1 <1MW10-052004-1 Farallon 5/20/2004 18 <260 <410 <100 <1 <1 <1 <2
MW-10 RNS 6/29/2006 NR <200 <200 NR <1 <1 <1 <1P-1 GeoEngineers 7/9/2003 NR -- -- -- <1.0 -- -- --
P-1 Dup7 GeoEngineers 7/9/2003 NR -- -- -- <1.0 -- -- --P-2 P-2 GeoEngineers 7/9/2003 NR -- -- -- <1.0 -- -- --P-3 P-3 GeoEngineers 7/9/2003 NR -- -- -- <1.0 -- -- --P-4 P-4 GeoEngineers 7/9/2003 NR -- -- -- <1.0 -- -- --P-5 P-5 GeoEngineers 7/9/2003 NR -- -- -- <1.0 -- -- --P-6 P-6 GeoEngineers 7/10/2003 NR -- -- -- <1.0 -- -- --P-7 P-7 GeoEngineers 7/10/2003 NR -- -- -- <1.0 -- -- --P-8 P-8 GeoEngineers 7/10/2003 NR -- -- -- <1.0 -- -- --P-9 P-9 GeoEngineers 7/10/2003 NR -- -- -- <1.0 -- -- --
MW-5A
MW-7
MW-10
P-1
MW-1
MW-6
MW-8
MW-9
MW-8S
Groundwater Analytical Results (µg/L)Well Number Sample Number Sampled By Sample Date
Sample Depth (ft BGS)1
LAI-B3

TABLE 2-5PRE-REMEDIAL INVESTIGATION PETROLEUM HYDROCARBONS GROUNDWATER ANALYTICAL RESULTS
SAURO'S PROPERTY RI/FSTACOMA, WASHINGTON
Table 2-5Page 2 of 2
5/14/2014Y:\094\048.012\R\RIFS\Tables\Section 2.0\Table 2-4 thru 2-6 - Groundwater Analytic Results - Pre-RI Summary Data LANDAU ASSOCIATES
DRO2 ORO2 GRO3 Benzene4 Ethylbenzene4 Toluene4 Xylenes4
Groundwater Analytical Results (µg/L)Well Number Sample Number Sampled By Sample Date
Sample Depth (ft BGS)1
P-11 GeoEngineers 7/11/2003 NR -- -- -- 3.9 -- -- --PMX-B-1 B-1-W Parametrix 4/30/2008 NR 260 150 28 <1 <1 0.12 0.35PMX-B-2 B-2-W Parametrix 4/30/2008 NR 480 370 170 0.12 <1 0.17 <1PMX-B-3 B-3-W Parametrix 4/28/2008 NR 340 340 270 <1 <1 0.11 <1
B-4-W Parametrix 4/29/2008 NR 330 280 150 0.2 0.18 0.23 0.56B-4-1 Dup8 Parametrix 4/29/2008 NR 340 280 150 0.22 0.18 0.18 0.38
RNS-MW1 RNSMW1 RNS 6/30/2006 NR <200 <200 NR <1 <1 <1 <1RNS-MW2 RNSMW2 RNS 6/30/2006 NR <200 <200 NR <1 <1 <1 <1RNS-MW3 RNSMW3 RNS 6/30/2006 NR <200 <200 NR 56.4 240 33.1 942
500 500 800/1000 10 5 700 1000 1000
DRO = Total petroleum hydrocarbons as diesel-range organicsGRO = Total petroleum hydrocarbons as gasoline-range organicsORO = Total petroleum hydrocarbons as oil range organicsRNS = Robinson, Noble & Saltbush, Inc.
-- = Not analyzed< = Result is less than laboratory practical quantitation limitBold = Detected compoundsBox = Concentrations at or above Model Toxics Control Act (MTCA) Method A cleanup levelsNR = Not Reported
1 Depth in feet below ground surface.2 Analyzed by Washington State Department of Ecology (Ecology) Method Northwest diesel-range total petroleum hydrocarbon extended (NWTPH-Dx).3 Analyzed by Ecology Method NWTPH-Gx.4 Analzyed by U.S. Environmental Protection Agency Method 8021B.5Sample depth not recorded for these samples. This value represents depth to water at time of drilling.6 Field Duplicate of MW8S-052004.7 Field Duplicate of P-1.8 Field Duplicate of B-4-W.9 Table 720-1 of the MTCA Cleanup Regulation of the Washington Administrative Code, as Revised November 2007.10 If benzene is present, 800; if benzene is not present, 1000.
Note:1. Disclaimer: Data in this table was compiled from report tables authored by the respective firm in the 'Sampled By' column. Landau Associates makes no warranties as to the correctness of the original data.
MTCA Method A Cleanup Level for Groundwater9
P-11
PMX-B-4

TABLE 2-6PRE-REMEDIAL INVESTIGATION TOTAL METALS GROUNDWATER ANALYTICAL RESULTS
SAURO'S PROPERTY RI/FSTACOMA, WASHINGTON
Table 2-6Page 1 of 2
5/14/2014Y:\094\048.012\R\RIFS\Tables\Section 2.0\Table 2-4 thru 2-6 - Groundwater Analytic Results - Pre-RI Summary Data LANDAU ASSOCIATES
Arsenic Cadmium Chromium Copper Lead Mercury Nickel ZincB-1 B-1-GW/6-15 ft Env. Assoc. 10/4/2001 6-15 -- -- -- -- -- 8.89 -- --B-2 B-2-GW/12-15 ft Env. Assoc. 10/4/2001 12-15 -- -- -- -- -- 4.62 -- --
LAI-B1 LAI-B1 (25-28) Landau Associates 5/6/2008 25 -- -- -- -- -- -- -- --LAI-B2 LAI-B2 (37-40) Landau Associates 5/6/2008 37 -- -- -- -- -- -- -- --
LAI-B3 (22-24) Landau Associates 5/6/2008 22 -- -- -- -- -- -- -- --LAI-B3 (32') Landau Associates 5/6/2008 32 -- -- -- -- -- -- -- --
LAI-B5 LAI-B5 (31-41) Landau Associates 5/7/2008 31 -- -- -- -- -- -- -- --LAI-MW1 LAI-MW1 Landau Associates 5/21/2008 >44.88 -- -- -- -- -- -- -- --LAI-MW2 LAI-MW2 Landau Associates 5/19/2008 >47.058 -- -- -- -- -- -- -- --LAI-MW3 LAI-MW3 Landau Associates 5/19/2008 >51.28 -- -- -- -- -- -- -- --LAI-MW4 LAI-MW4 Landau Associates 5/19/2008 >12.758 -- -- -- -- -- -- -- --
MW-1 GeoEngineers 1/25/2001 NR 46.2 <1.00 2.18 1.35 <1.00 <1.00 2.96 <1.00MW1-052104 Farallon 5/21/2004 20 11 <4 -- -- <1 <0.5 -- --
MW-1 RNS 7/14/2006 NR 5 <3 15 -- <1 <0.2 -- --MW1-060407 Farallon 6/4/2007 NR 10 -- -- -- <1.0 -- -- --
MW-2 GeoEngineers 1/25/2001 NR 1.88 <1.00 1.23 1.97 <1.00 <1.00 4.1 22MW2-052104 Farallon 5/21/2004 17 10 <4 -- -- <1 <0.5 -- --MW2-060407 Farallon 6/4/2007 NR 5.4 -- -- -- <1.0 -- -- --
MW-3 MW-3 GeoEngineers 1/25/2001 NR <1.00 <1.00 <1.00 <1.00 <1.00 <1.00 3.11 <1.00MW-4 GeoEngineers 1/25/2001 NR 1.08 <1.00 1.1 1.28 <1.00 <1.00 3.32 <1.00
MW4-052104 Farallon 5/21/2004 20 <3 <4 -- -- <1 <0.5 -- --MW4-060507 Farallon 6/5/2007 NR <3.0 -- -- -- <1.0 -- -- --
MW-5 MW-5 GeoEngineers 1/26/2001 NR 2.56 <1.0 1.41 <1.0 1.93 <1.0 6.66 65.8MW-5A MW5A-052104-1 Farallon 5/21/2004 18.5 <3 <4 -- -- <1 <0.5 -- --
MW6-052004-1 Farallon 5/20/2004 14.5 <3 <4 -- -- <1 <0.5 -- --MW-6 RNS 7/14/2006 NR <2 <3 <7 -- 24 <0.2 -- --
MW6-060507 Farallon 6/5/2007 NR <3.0 -- -- -- <1.0 -- -- --MW-7 MW7-052004-1 Farallon 5/20/2004 18.5 <3 <4 -- -- <1 <0.5 -- --
MW8S-052004 Farallon 5/20/2004 10 <3 <4 -- -- 1.2 <0.5 -- --MW8B-0520043 Farallon 5/20/2004 10 <3 <4 -- -- 1.1 <0.5 -- --
MW-8S RNS 7/14/2006 NR 6 <3 <7 -- 20 <0.2 -- --MW8S-060507 Farallon 6/5/2007 NR <3.0 -- -- -- <1.0 -- -- --MW8-052004 Farallon 5/20/2004 28 4.3 <4 -- -- <1 <0.5 -- --
MW-8 RNS 7/14/2006 NR 10 <3 <7 -- 12 <0.2 -- --MW8-0605007 Farallon 6/5/2007 NR 8.9 -- -- -- <1.0 -- -- --MW9-052004-1 Farallon 5/20/2004 6 <3 <4 -- -- <1 <0.5 -- --
MW-9 RNS 7/14/2006 NR 6 <3 <7 -- 11 <0.2 -- --MW9-060507 Farallon 6/5/2007 NR <3.0 -- -- -- <1.0 -- -- --
MW10-052004-1 Farallon 5/20/2004 17.8 4.6 <4 -- -- <1 <0.5 -- --MW-10 RNS 7/14/2006 NR 27 <3 <7 -- 11 <0.2 -- --
MW10-0605007 Farallon 6/5/2007 NR 4.7 -- -- -- <1.0 -- -- --MW-11S MW11S-060407 Farallon 6/4/2007 NR <3.0 -- -- -- <1.0 -- -- --MW-11D MW11D-060407 Farallon 6/4/2007 NR <3.0 -- -- -- <1.0 -- -- --MW-12 MW12-060507 Farallon 6/5/2007 NR 3.4 -- -- -- <1.0 -- -- --
Groundwater Analytical Results (µg/L)2
MW-1
MW-2
MW-4
Sample Depth (ft BGS)1
Well Number Sample Number Sampled By Sample Date
LAI-B3
MW-6
MW-8S
MW-8
MW-9
MW-10

TABLE 2-6PRE-REMEDIAL INVESTIGATION TOTAL METALS GROUNDWATER ANALYTICAL RESULTS
SAURO'S PROPERTY RI/FSTACOMA, WASHINGTON
Table 2-6Page 2 of 2
5/14/2014Y:\094\048.012\R\RIFS\Tables\Section 2.0\Table 2-4 thru 2-6 - Groundwater Analytic Results - Pre-RI Summary Data LANDAU ASSOCIATES
Arsenic Cadmium Chromium Copper Lead Mercury Nickel ZincGroundwater Analytical Results (µg/L)2Sample Depth
(ft BGS)1Well
Number Sample Number Sampled By Sample DatePMX-B-1 B-1-W Parametrix 4/30/2008 NR 0.64 <2.0 <25 -- <2.0 0.094 -- --PMX-B-2 B-2-W Parametrix 4/30/2008 NR 0.82 <2.0 <25 -- 0.24 0.091 -- --PMX-B-3 B-3-W Parametrix 4/28/2008 NR 4.6 <2.0 <25 -- <2.0 0.079 -- --
B-4-W Parametrix 4/29/2008 NR 0.79 <2.0 <25 -- <2.0 <0.2 -- --B-4-1 Dup7 Parametrix 4/29/2008 NR 1 <2.0 <25 -- <2.0 <0.2 -- --
RNS-MW-1 RNSMW1 RNS 7/14/2006 NR 5 <3 12 -- 26 <0.2 -- --RNS-MW-2 RNSMW2 RNS 7/14/2006 NR 17 <4 39 -- 17 <0.3 -- --RNS-MW5 RNSMW5-060507 Farallon 6/5/2007 NR 57 -- -- -- <1.0 -- -- --RNS-MW6 RNSMW6-060507 Farallon 6/5/2007 NR <3.0 -- -- -- <1.0 -- -- --
SP-6 SP-6 GeoEngineers 1/25/2001 NR 2.13 <1.0 <1.0 <1.0 1.34 <1.0 3.77 22.6SP-7 SP-7 GeoEngineers 1/25/2001 NR 1.75 <1.0 2.21 <1.0 <1.0 <1.0 4.96 <10.0
5 5 50 6 NE 15 2 NE NENE NE NE 592 NE NE 320 4,800
Env. Assoc. = Environmental Associates Inc.RNS = Robinson, Noble & Saltbrush, Inc.
-- = Not analyzed< = Result is less than laboratory practical quantitation limitBold = Detected compoundsBox = Concentrations at or above Model Toxics Control Act (MTCA) Method A cleanup levelsNE = Not EstablishedNR = Not Reported
1 Depth in feet below ground surface.2 Analyzed by U.S. Environmental Protection Agency (EPA) Method 6000/7000 Series; 2004 samples analyzed by EPA Method 200.8.3 Duplicate of MW8S-052004.4 MTCA Cleanup Regulation of the Washington State Administrative Code, as amended February 2001.5 Cleanup Levels and Risk Calculations under the MTCA Cleanup Regulation, CLARC, Version 3.1, as amended November 2001.6 50 micrograms per liter (µg/L) for total Chromium7 Field duplicate of B-4-W8 Sample depth not recorded for these samples. This value represents depth to water at time of drilling.
Note:1. Disclaimer: Data in this table was compiled from report tables authored by the respective firm in the 'Sampled By' column. Landau Associates makes no warranties as to the correctness of the original data.
MTCA Method A Cleanup Level for Groundwater4
MTCA Method B Cleanup Level for Groundwater5
PMX-B-4

8/29/14 Y:\094\048.012\R\RIFS\RI-FS__FINAL.docx LANDAU ASSOCIATES 3-1
3.0 INTERIM ACTION
A major source area interim action was conducted throughout the entire Sauro’s property during
the RI from September 2009 through January 2010. The interim action primarily involved soil excavation
and resulted in the removal of approximately 12,700 tons of soil and debris from the Sauro’s property.
Clearcreek Contractors (Clearcreek) performed the interim action under contract to the City.
The intent of the interim action was to expedite cleanup activities at the source area and encourage
redevelopment of the Sauro’s property (Landau Associates 2009a). The scope of work was conducted in
accordance with the final interim action work plan (Landau Associates 2009a). Elements of the interim
action were:
• Shoring the Sauro’s property to support excavation of sidewalls during soil removal
• Decommissioning of existing monitoring wells
• Excavating contaminated soil throughout the vadose zone at the Sauro’s property
• Screening soil and debris waste stream (three categories) per approved plan
• Conducting soil confirmation sampling
• Restoring property with clean fill
• Decommissioning two onsite storage tanks.
3.1 SUMMARY OF INTERIM ACTION EXCAVATION In preparation for the interim action excavation, the City applied for a “contained-in”
determination from Ecology to segregate hazardous soil waste (Category 1), non-hazardous soil waste
(Category 2), and inert waste (Category 3; brick, concrete, and rock) from the Sauro’s property (Landau
Associates 2009b). Ecology approved of the proposed “contained-in” determination for disposal methods
of waste contingent on criteria outlined in the approval letter (Ecology 2009a).
PCE data from past soil investigations on the property were evaluated to categorize soil as
hazardous or non-hazardous; these data were from pre-RI investigations (Section 2.0) and RI
investigations (Section 5.0). Soil with PCE concentrations greater than or equal to 1.9 mg/kg14 (Category
1) was considered hazardous waste and was to be transported directly to a hazardous waste landfill. Soil
with PCE concentrations less than 1.9 mg/kg (Category 2) was to be considered non-hazardous waste and
was transported to a local solid waste landfill. Category 1 and Category 2 soil areas were delineated
(Figure 3-1) and used to guide excavation.
14 Based on discussions between Farallon and Ecology, soil with PCE concentrations below 1.9 mg/kg could be disposed of as
non-hazardous under Ecology’s “contained-in” policy.

8/29/14 Y:\094\048.012\R\RIFS\RI-FS__FINAL.docx LANDAU ASSOCIATES 3-2
Previous samples of inert waste (e.g., bricks and wood) collected in May 2009 were found to not
contain PCE (Appendix D). Therefore, since soil at the Sauro’s property was primarily fill and contained
a considerable amount of inert waste, the inert waste (Category 3) was segregated from the soil using a
sieve and taken to a local inert waste landfill.
Removal of Category 1 and Category 2 soil was done in general accordance with the delineated
areas shown on Figure 3-1. In addition, a small soil stockpile along the northwest wall of the Sauro’s
property and soil from an old access ramp in the southeast corner of the Sauro’s property were designated
and transported off site as Category 1 soil. Category 3 inert waste was segregated at the time of
excavation. A total of 3,493 tons of Category 1 soil, 8,483 tons of Category 2 soil, and 737 tons of
Category 3 inert waste were removed and disposed of from the Sauro’s property. No samples from the
Sauro’s property exceeded the applicable land disposal restrictions for PCE of 60 mg/kg. Results for
waste samples are provided in Appendix D. Upon completion of the soil excavation, confirmation
samples were collected to evaluate the remaining soil left in place. Confirmation sampling is described in
Section 3.5 below.
In addition to soil removal, engineering and design of a shoring system for the Sauro’s property
was a significant component of the interim action. Shoring wall piles were designed to be placed along
the western, northern, and eastern edges of the Sauro’s property as shown on Figure 3-1. Prior to
conducting the interim action, grades at the Sauro’s property were up to two stories (approximately 24 ft)
below street grades in the southern half of the property and one story below street grade (approximately
14 ft) in the northern half of the property. The total volume of soil to be removed was anticipated to be
significant and was ultimately dependent on the depth to groundwater at time of excavation. In total,
approximately 12,700 tons of soil and debris were removed.
Once excavation of contaminated soil was complete, a layer of geotextile fabric was placed to
delineate the limits of contaminated soil on the Sauro’s property. Clean fill material was placed over the
top of the geotextile. The final site grade after excavation is shown on Figure 3-1. As-built details of the
final Sauro’s property grades and shoring design after interim action activities can be found in the
Construction Summary Report (Landau Associates 2010b) and are provided here as Appendix E.
3.2 DEVIATION FROM THE MAXIMUM EXCAVATION DEPTH In order to plan for the maximum excavation depth, several rounds of groundwater levels were
collected in 2009 prior to the interim action. Based on these data, it appeared that the groundwater table
would fluctuate at least up to 5 ft annually. Excavation of contaminated soil was conducted in the fall
when groundwater levels should be near a seasonal low. Excavation had to be terminated between 1 and
2 ft higher than proposed in the interim action work plan because of saturated soil conditions that made

8/29/14 Y:\094\048.012\R\RIFS\RI-FS__FINAL.docx LANDAU ASSOCIATES 3-3
the operation of heavy equipment difficult. The excavation was terminated approximately 3 ft above the
estimated low water table.
3.3 UNEXPECTED PETROLEUM-CONTAMINATED SOIL During excavation, petroleum-contaminated soil was discovered in two small areas (Figure 3-1)
along the north wall of the Sauro’s property. Using the shoring pile numbers marked along the northern
wall from west to east (numbered N1 through N17), test pits or shallow surface soil samples were dug and
soil samples were collected near the following columns:
• N1 (one sample)
• N4/N5 (two samples)
• N13 (one sample).
Soil was sampled for gasoline-range (TPH-G) and diesel-range/motor oil (TPH-D) petroleum
hydrocarbons and benzene, toluene, ethylbenzene, and xylene (BTEX). The sample identification
numbers include the shoring pile number and the test pit number (where applicable). The sample results
are presented in Table 3-1.
There were no detections at the shoring pile N1 sampling location. There were detections of
gasoline-range organics (GRO), diesel-range organics (DRO), and motor oil at the two N4/5 sample
locations. Of the two N4/5 samples, one had detections well below MTCA Method A soil CULs and the
other location had a detection of motor oil that exceeded MTCA Method A soil CULs (2100 mg/kg).
The N13 sample had detections of gasoline range organics, diesel range organics, motor oil, and
ethylbenzene. Of the detections, gasoline (260 mg/kg) and ethylbenzene (52 mg/kg) exceeded MTCA
Method B soil CULs.
Petroleum-contaminated soil from both the northeast and northwest area was segregated as
Category 1 soil, since analytical data had not yet been received when the soil was transported off site.
During confirmation sampling (discussed further in Section 3.4), four samples (LAI-CON-1 through LAI-
CON-4) were collected along the north wall of the Sauro’s property and analyzed for TPH-D, TPH-G,
and BTEX to demonstrate that petroleum-contaminated soil had been removed. The confirmation sample
results were non-detect or below MTCA Method A soil CULs. Confirmation sample results are provided
in Table 3-2.
3.4 CONFIRMATION SAMPLING A total of 13 confirmation soil samples were collected. Samples were more heavily focused on
the northern half of the Sauro’s property (eight samples) where the majority of the Category 1 soil was
located. Samples were collected between 6 and 12 inches BGS. All samples were analyzed for VOCs.

8/29/14 Y:\094\048.012\R\RIFS\RI-FS__FINAL.docx LANDAU ASSOCIATES 3-4
The four samples (LAI-CON-1 through LAI-CON-4) along the north wall were also analyzed for TPH-G,
TPH-D, and BTEX (see Section 3.3). Samples analyzed for VOCs were collected using U.S.
Environmental Protection Agency (EPA) Method 5035. Sample locations are shown on Figure 3-1.
Of the four chlorinated solvent COCs, only PCE and TCE have established MTCA Method A soil
CULs. Confirmation sample results indicate that some residual PCE and/or TCE contamination remained
in soil at the end of excavation at 3 of the 13 sampling locations. PCE was detected at concentrations
exceeding the MTCA Method A soil CUL of 50 micrograms per kilogram (µg/kg) at LAI-CON-4 (56,000
µg/kg) and LAI-CON-8 (790 µg/kg). TCE was detected at concentrations exceeding the MTCA Method
A soil CUL of 30 µg/kg at LAI-CON-8 (340 µg/kg) and LAI-CS-13 (53 µg/kg). The confirmation
sampling results are presented in Table 3-2.
3.5 DECOMMISSIONED WELLS The following 10 monitoring wells on the Sauro’s property were decommissioned during interim
action activities in September 2009:
• SVE-1
• MW-4, MW-6, MW-8S, MW-8, MW-9, MW-10, MW-11S, MW-11D, and MW-12.
Wells were decommissioned in accordance with Washington Administrative Code (WAC) 173-
160 and were filled with bentonite slurry. The well locations are presented on Figure 3-2. The well logs
and the decommission reports are presented in Appendix F.
3.6 TANK REMOVAL Two heating oil tanks (Tank A and Tank B) were located beneath the vaulted sidewalk along the
north side of the Sauro’s property. Tank A was approximately 375 gallons in volume and was resting
atop a pile of dirt and debris under a collapsed portion of the vaulted sidewalk. Based on its location and
position, Tank A would not have been operational in that location and therefore, was likely dumped.
Tank B was approximately 750 gallons and was buried in sand behind a short retaining wall, also under
the vaulted sidewalk. Based on field observations, there is no evidence of a release from this tank. Both
tanks were video surveyed prior to removal and found to be empty except Tank B had a small amount of
sludge in the bottom. Since the tanks were less than 1,000 gallons they were unregulated by the Tacoma-
Pierce County Health Department. Additionally, WAC 173-360-110(2)(o) exempts UST systems located
in underground areas such as the vaulted sidewalks. Tank locations are presented on Figure 3-2.
Clearcreek obtained a UST removal permit from the Tacoma Fire Department on November 20,
2009. Both tanks were rinsed, and removed by Emerald Services on December 14 and 15, 2009. Upon

8/29/14 Y:\094\048.012\R\RIFS\RI-FS__FINAL.docx LANDAU ASSOCIATES 3-5
completion of cleaning and removal, the tanks were disposed of as scrap metal at Seattle Iron and Metals.
Decommissioning and removal documentation is provided in Appendix G.

38
40
4241
39
38
37
36
37
40
39
LAI-CON-5LAI-CON-6
LAI-CON-1
LAI-CON-2LAI-CON-3
LAI-CON-4
LAI-CON-7 LAI-CON-8
LAI-CS-11LAI-CON-10
LAI-CON-12 LAI-CS-13
N14
E18
E21E20
E19
E17
E16
E15
E14
E13
E12
E11
E10
E9
E8
E7
E6
E5
E4
E3
E2
E1
N3
N2
N1
W20
W19
W18
W17
W16
W15
W14
W13
W12
W11
W10
W9
W8
W7
W6
W5
W4
W3
W2
W1
N13
N12
N11
N10
N8
N9
N7
N6
N16N5
N4
N17N15
0 30 60
Scale in Feet
Adapted from: Clearcreek Contractor 2010 (NGVD29)
Legend
Shoring Wall Pile Location and Designation
Sauro's Property RI/FSTacoma, Washington Interim Action Excavation
Figure| G:\P
roje
cts\
094\
048\
013\
014\
RIF
S 2
014\
Figu
re3-
1Int
erim
Site
Pla
n.dw
g (A
) "Fi
gure
3-1
" 8/2
8/20
14
N14
E18
E21E20
E19
E17
E16
E15
E14
E13
E12
E11
E10
E9
E8
E7
E6
E5
E4
E3
E2
E1
N3
N2
N1
W20
W19
W18
W17
W16
W15
W14
W13
W12
W11
W10
W9
W8
W7
W6
W5
W4
W3
W2
W1
N13
N12
N11
N10
N8
N9
N7
N6
N5
N4
N17
N16N15
Davita Building
PA
CIF
IC A
VE
S. 14TH ST.
CO
UR
T A
Foundation Wall
CATEGORY 1
PCE SOIL
CATEGORY 2
PCE SOIL
Shoring Wall
W1
Property Boundary
Petroleum ContaminatedSoil NW Area (Removed)
Petroleum ContaminatedSoil NE Area (Removed)
Contours - Existing Offsite Ground40
Contours - Final Site Grade after Fill 40
LAI-CON-1 Confirmation Sample Location and Designation Category 1 PCE Soil
Category 2 PCE Soil
Note: Final site contours from Clearcreak Contractor are inNGVD29. Offsite contours shown also in NGVD29 for consistency.

MW-6MW-6MW-6MW-6MW-6
MW-4(SP-4)MW-4(SP-4)MW-4(SP-4)MW-4(SP-4)MW-4(SP-4)
MW-8MW-8MW-8MW-8MW-8
SVE-1SVE-1SVE-1SVE-1SVE-1
MW-9MW-9MW-9MW-9MW-9
MW-8SMW-8SMW-8SMW-8SMW-8S
MW-10MW-10MW-10MW-10MW-10
MW-12MW-12MW-12MW-12MW-12
MW-11DMW-11DMW-11DMW-11DMW-11D
0 30 60
Scale in Feet
Source: É Google Earth 2009 É USGS
Legend
Sauro's Property RI/FSTacoma, Washington
Interim Action
Decommissioned Wells and Tanks
Figure| G:\P
roje
cts\
094\
048\
013\
014\
RIF
S 2
014\
Figu
re3-
2Dec
omS
iteP
lan.
dwg
(A) "
Figu
re 3
-2" 8
/28/
2014
Davita Building
PA
CIF
IC A
VE
S. 14TH ST.
CO
UR
T A
Foundation Wall
Shoring Wall
Property Boundary
MW-1
Tanks Beneath Vaulted Sidewalk
Decommissioned Wells
Tank A (375 gal) Tank B (750 gal)
Notes
1. Tanks were decommissioned and removed.
2. Wells were decommissioned and filled withbentonite slurry.
MW-11S

TABLE 3-1PETROLEUM SOIL ANALYTICAL RESULTS
SAURO'S PROPERTY RI/FSTACOMA, WASHINGTON
Table 3-1Page 1 of 1
5/14/2014Y:\094\048.012\R\RIFS\Tables\Section 3.0\Table 3-1_TPH exceedances requiring additional exca LANDAU ASSOCIATES
N4/5(TP-1)WSW N4/5(TP-1)ESW N1(TP-2)SSW N13PV99B PV99C PV99D PV34A
Soil Screening Criteria (a) 11/4/2009 11/4/2009 11/4/2009 11/2/2009TOTAL PETROLEUM HYDROCARBONS (mg/kg) NWTPH-DxDiesel Range Organics 2000 12 1400 9.3 U 410Motor Oil 2000 17 2100 19 U 66NWTPH-GxGasoline Range Organics 30/100 (b) 16 27 27 U 260
VOLATILE ORGANIC COMPOUNDS (µg/kg) BTEXBenzene 0.03 30 U 30 U 68 U 22 UToluene 6 30 U 30 U 68 U 22 UEthylbenzene 7 30 U 30 U 68 U 52m, p-Xylene 61 U 59 U 140 U 45 Uo-Xylene 30 U 30 U 68 U 22 U
U = Indicates the compound was undetected at the reported concentration.Bold = Detected compoundBox = Exceedance of screening criteria
(a) MTCA Method A CULs for Unrestricted Land Uses were used as screening criteria.(b ) Screening criteria is 30 mg/kg if benzene is present and 100 mg/kg if benzene is not present.(c) Screening criteria cannot be exceeded by the sum of individual xylene concentrations.
Note:1. These samples were collected during the 2009 Interim Action excavation work. Confirmation sampling at the end of excavation indicated that petroleum hydrocarbon levelshad been reduced to below MTCA Method A soil cleanup levels.
9 (c)

TABLE 3-2FINAL CONFIRMATION SAMPLES SOIL ANALYTICAL RESULTS
SAURO'S PROPERTY RI/FSTACOMA, WASHINGTON
Table 3-2Page 1 of 2
5/14/2014Y:\094\048.012\R\RIFS\Tables\Section 3.0\Table 3-2_Confirmation Soil Sampling LANDAU ASSOCIATES
LAI-CON-1 LAI-CON-2 LAI-CON-3 LAI-CON-4 LAI-CON-5 LAI-CON-6PX64A PX64B PX64C PX64D PY07B PY07C
11/13/2009 11/13/2009 11/13/2009 11/13/2009 11/16/2009 11/16/2009
VOLATILE ORGANIC COMPOUNDS (µg/kg) SW8260CTetrachloroethene (PCE) 50 1.1 U 4.3 12 56000 1.8 1.1 UTrichloroethene (TCE) 30 1.1 U 1.3 J 1.8 J 25 J 1.2 U 1.1 Ucis-1,2-Dichloroethene (b) 1.1 U 4.6 14000 48 1.2 U 1.1 Utrans-1,2-Dichloroethene (b) 1.1 U 1.0 U 94 0.9 U 1.2 U 1.1 UVinyl Chloride (b) 1.1 U 1.8 J 2900 40 J 1.2 U 1.1 U
BTEXBenzene 0.03 1.1 U 1 U 1.1 U 0.9 U 1.2 U 1.1 UToluene 7 1.1 U 1 U 1.1 U 0.9 U 1.2 U 1.1 UEthylbenzene 6 1.1 U 1 U 1.1 U 0.9 U 1.2 U 1.1 Um, p-Xylene 1.1 U 1 U 1.1 U 0.9 U 1.2 U 1.1 Uo-Xylene 1.1 U 1 U 1.1 U 0.9 U 1.2 U 1.1 UTotal Xylenes 9 (c)
TOTAL PETROLEUM HYDROCARBONS (mg/kg) NWTPH-DxDiesel Range Organics 2000 6.0 U 6.0 U 10 130 - -Lube Oil 2000 12 U 12 U 12 U 12 U - -
NWTPH-GxGasoline Range Organics 30/100 (d) 5.1 U 8.5 U 8.2 U 17 - -
MTCA Method A Soil Cleanup Level for Unrestricted Land
Uses (a)

TABLE 3-2FINAL CONFIRMATION SAMPLES SOIL ANALYTICAL RESULTS
SAURO'S PROPERTY RI/FSTACOMA, WASHINGTON
Table 3-2Page 2 of 2
5/14/2014Y:\094\048.012\R\RIFS\Tables\Section 3.0\Table 3-2_Confirmation Soil Sampling LANDAU ASSOCIATES
VOLATILE ORGANIC COMPOUNDS (µg/kg) SW8260CTetrachloroethene (PCE)Trichloroethene (TCE)cis-1,2-Dichloroethenetrans-1,2-DichloroetheneVinyl Chloride
BTEXBenzeneTolueneEthylbenzenem, p-Xyleneo-XyleneTotal Xylenes
TOTAL PETROLEUM HYDROCARBONS (mg/kg) NWTPH-DxDiesel Range OrganicsLube Oil
NWTPH-GxGasoline Range Organics
LAI-CON-7 LAI-CON-8 LAI-CON-9 LAI-CON-10 LAI-CON-12 LAI-CS-11 LAI-CS-13PY07D PY07E PY07F PY93A PY93B QA16A QA16B
11/16/2009 11/16/2009 11/16/2009 11/23/2009 11/23/2009 12/3/2009 12/3/2009
1.1 U 790 1.8 U 1.5 5.7 17 421.1 U 340 1.8 U 1.0 U 2.1 29 531.1 U 340 1.8 U 25 1.2 U 130 1601.1 U 12 1.8 U 1.0 U 1.2 U 2.7 6.91.2 380 E 1.8 U 8.6 1.2 U 8.8 28
1.1 U 15 1.8 U 1.0 U 1.2 U 1.0 U 1.1 U1.1 U 6.1 1.8 U 1.0 U 1.2 U 1.0 U 1.1 U1.1 U 1.4 U 1.8 U 1.0 U 1.2 U 1.0 U 1.1 U1.1 U 1.4 1.8 U 1.0 U 1.2 U 1.0 U 1.1 U1.1 U 1.4 U 1.8 U 1.0 U 1.2 U 1.0 U 1.1 U
- - - - - - -- - - - - - -
- - - - - - -
- = Not analyzed or not measuredBold = Detected compoundBox = Exceedance of screening criteriaU = Indicates the compound was not detected at the reported preliminary quantitation limit (PQL)J = Indicates the analyte was positively identified; the associated numerical value is the approximate concentration of the analyte in the sampleE = The concentration indicated for this analyte is an estimated value above the calibration range of the instrument. This value is considered an estimate. Laboratory did not run a dilution.
(a) Model Toxics Control Act (MTCA) Method A Cleanup Levels were used as screening criteria. (b) There is not currently a MTCA Method A soil cleanup value for vinyl chloride, cis-1,2-DCE, or trans-1,2-DCE.(c) Screening criteria cannot be exceeded by the sum of individual xylene concentrations. (d) Screening criteria is 30 micrograms per kilogram (µg/kg) if benzene is present and 100 µg/kg if benzene is not present.
Note:1. Samples collected between 6 and 12 inches below ground surface.
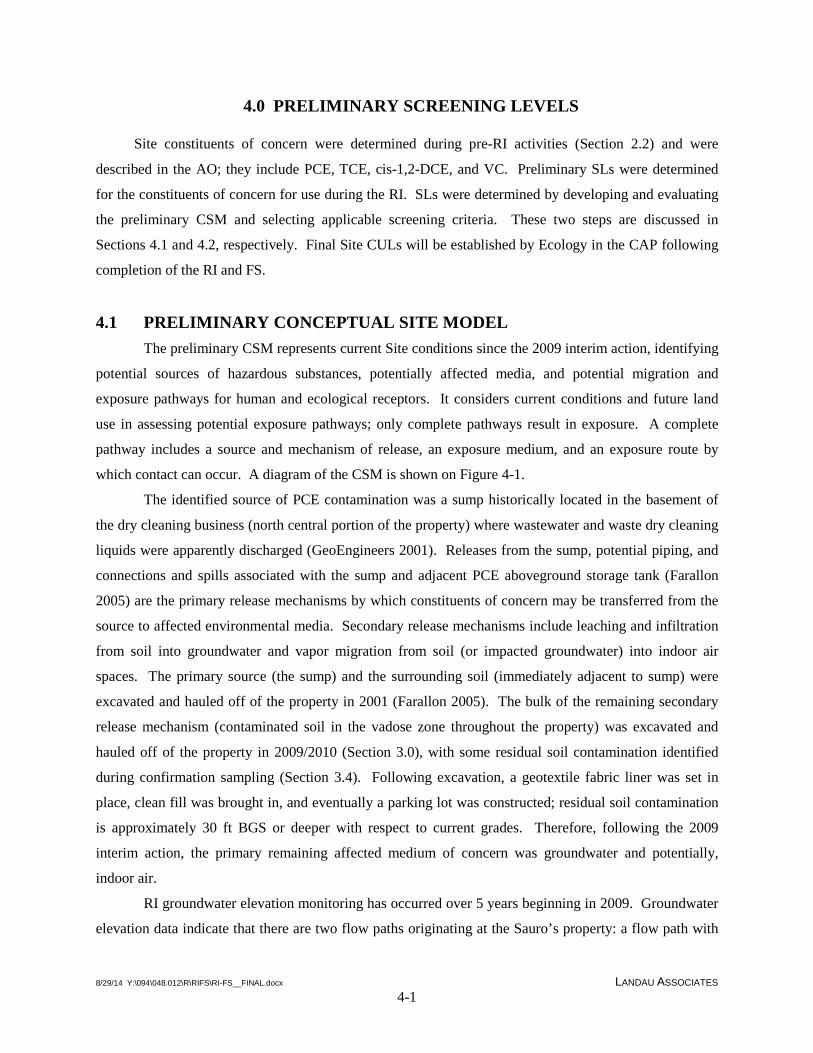
8/29/14 Y:\094\048.012\R\RIFS\RI-FS__FINAL.docx LANDAU ASSOCIATES 4-1
4.0 PRELIMINARY SCREENING LEVELS
Site constituents of concern were determined during pre-RI activities (Section 2.2) and were
described in the AO; they include PCE, TCE, cis-1,2-DCE, and VC. Preliminary SLs were determined
for the constituents of concern for use during the RI. SLs were determined by developing and evaluating
the preliminary CSM and selecting applicable screening criteria. These two steps are discussed in
Sections 4.1 and 4.2, respectively. Final Site CULs will be established by Ecology in the CAP following
completion of the RI and FS.
4.1 PRELIMINARY CONCEPTUAL SITE MODEL The preliminary CSM represents current Site conditions since the 2009 interim action, identifying
potential sources of hazardous substances, potentially affected media, and potential migration and
exposure pathways for human and ecological receptors. It considers current conditions and future land
use in assessing potential exposure pathways; only complete pathways result in exposure. A complete
pathway includes a source and mechanism of release, an exposure medium, and an exposure route by
which contact can occur. A diagram of the CSM is shown on Figure 4-1.
The identified source of PCE contamination was a sump historically located in the basement of
the dry cleaning business (north central portion of the property) where wastewater and waste dry cleaning
liquids were apparently discharged (GeoEngineers 2001). Releases from the sump, potential piping, and
connections and spills associated with the sump and adjacent PCE aboveground storage tank (Farallon
2005) are the primary release mechanisms by which constituents of concern may be transferred from the
source to affected environmental media. Secondary release mechanisms include leaching and infiltration
from soil into groundwater and vapor migration from soil (or impacted groundwater) into indoor air
spaces. The primary source (the sump) and the surrounding soil (immediately adjacent to sump) were
excavated and hauled off of the property in 2001 (Farallon 2005). The bulk of the remaining secondary
release mechanism (contaminated soil in the vadose zone throughout the property) was excavated and
hauled off of the property in 2009/2010 (Section 3.0), with some residual soil contamination identified
during confirmation sampling (Section 3.4). Following excavation, a geotextile fabric liner was set in
place, clean fill was brought in, and eventually a parking lot was constructed; residual soil contamination
is approximately 30 ft BGS or deeper with respect to current grades. Therefore, following the 2009
interim action, the primary remaining affected medium of concern was groundwater and potentially,
indoor air.
RI groundwater elevation monitoring has occurred over 5 years beginning in 2009. Groundwater
elevation data indicate that there are two flow paths originating at the Sauro’s property: a flow path with

8/29/14 Y:\094\048.012\R\RIFS\RI-FS__FINAL.docx LANDAU ASSOCIATES 4-2
steeper gradients to the east (primary plume direction) and a flow path with flatter gradients to the
southeast (secondary plume direction). A more detailed description of Site hydrogeology was presented
in Section 1.3.3.
Potential human and ecological receptors were identified for the Site based on current and
reasonable future Site land use. It is anticipated that the Site will retain its commercial and industrial
character and that future land uses will be consistent with the current zoning and land use regulations.
Potential human receptors include:
• Occupants of Future Structure With Underground Developed Space – Workers or customers who work within or utilize underground developed space (example: parking garage)
• Temporary Construction Workers – Personnel temporarily working within the Site at depths where impacted groundwater is encountered (or soil beneath the geotextile liner at the former Sauro’s property) during future construction activities.
There are no likely potential ecological receptors applicable to the Site. Although MTCA
requires consideration of terrestrial plants and animals that may potentially be exposed to hazardous
substances, the Site is expected to qualify for exclusion from further terrestrial ecological evaluation
under WAC 173-340-7491(1)(b) because virtually any potential residual contaminated soil is or will be
covered by buildings, paved roads, pavement, or other physical barriers that will prevent exposure. An
institutional control, as required by WAC 173-340-440, would have to be established so long as
contamination remains in soil at 15 ft or less BGS. As mentioned, some residual soil contamination was
found at the former Sauro’s property, but is 30 ft BGS or deeper. The residual soil contamination at the
Sauro’s property is effectively capped and is well characterized. Therefore, complete exposure pathways
with a low potential for exposure identified for qualitative evaluation in the RI included only:
• Potential future exposures of underground parking lot occupants (workers and customers) to constituents of concern in air via inhalation
• Potential exposure of temporary construction workers via dermal contact and inhalation of constituents of concern in Site groundwater.
These exposure pathways will be considered in development of screening criteria and preliminary
SLs in the following sections.
4.2 GROUNDWATER SCREENING CRITERIA AND SCREENING LEVELS Groundwater screening criteria for use during the RI were developed for the constituents of
concern based on the preliminary CSM and MTCA requirements. Two sets of preliminary groundwater
screening criteria were developed: 1) criteria protective of indoor air [related to the vapor intrusion (VI)
exposure pathway], and 2) criteria for drinking water beneficial uses. The two sets of preliminary
groundwater screening criteria are summarized below in Section 4.2.1 and 4.2.2, respectively.

8/29/14 Y:\094\048.012\R\RIFS\RI-FS__FINAL.docx LANDAU ASSOCIATES 4-3
4.2.1 PROTECTION OF INDOOR AIR Groundwater screening criteria protective of indoor air were developed for unrestricted land use in
accordance with Ecology’s draft VI guidance document (draft VI guidance; Ecology 2009b). The draft
VI guidance provides guidance on calculating shallow groundwater SLs protective of indoor air,
assuming there is a potential for VI. The draft VI guidance defines shallow groundwater as groundwater
at the water table or in perched zones above the water table. The draft VI guidance provides Equation 1,
Generic Groundwater VI SLs, for the calculation of shallow groundwater SLs (or SLGW), which is as
follows:
SLGW = ___SLIA_____
VAF*UCF*HCC
Where SLGW Screening level in groundwater protective of indoor air, micrograms per liter (µg/L)
SLIA Acceptable indoor air SL, micrograms per cubic meter (µg/m3)
VAF Vapor attenuation factor (VAF; unitless); a default value of 0.001 should be used
UCF Unit conversation factor, 1000 liters per cubic meter (L/m3)
HCC Henry’s Law constant, unitless
The SLGW is a function of the indoor air SL (shown here as SLIA), the Henry’s Law constant
(HCC; which defines the steady-state relationship between liquid and vapor phase concentrations of
volatile chemicals), and a vapor attenuation factor.
In order to calculate SLGW for a given chemical of concern (COC), the associated SLIA for that
chemical must be developed first in accordance with WAC 173 340 750. The Site land use is currently
listed as commercial (Pierce County website 2014). The current zoning is understood to be “Downtown
Commercial Core” (City of Tacoma website 2014). Therefore, the associated SLIA required to calculate
the groundwater screening criteria will be based on the standard MTCA Method B unrestricted land use
CULs rather than industrial.
Of the four COCs, all except cis-1,2-DCE have a MTCA Method B indoor air CULs15; therefore,
SLGW values were developed only for PCE, TCE, and VC. Using the unrestricted land use criteria
provides a conservative evaluation of constituents of concern for initial screening of data and addresses
the potential VI exposure pathway identified in the CSM. The resulting groundwater screening criteria
protective of indoor air are provided in Table 4-1 and the calculations are provided in Appendix H.
15 On May 13, 2010, Ecology released a document entitled Updating Indoor Air Screening Levels in Appendix B of the Vapor
Intrusion Guidance Document in which it removed cis-1,2-DCE from Appendix B due to a lack of inhalation toxicity values (Ecology 2010).
8/29/14 Y:\094\048.012\R\RIFS\RI-FS__FINAL.docx LANDAU ASSOCIATES 4-4
4.2.2 PROTECTION OF MOST BENEFICIAL USE The Method A CULs for groundwater were considered applicable for use as screening criteria for
the Site during pre-RI activities (Landau Associates 2008b). Groundwater throughout the Site is not used
as drinking water; however, to provide a conservative evaluation of constituents, and to address potential
exposure pathways identified in the CSM, screening criteria were based on drinking water as the highest
potential beneficial use for groundwater. Per WAC 173-340-720(3)(b), under MTCA Method A,
groundwater CULs for potable water must be at least as stringent as all of the following:
• MTCA Method A table values (WAC 173-340-900, Table 720-1)
• Concentrations established under state and federal laws, including maximum contaminant levels (MCLs) established under the Safe Drinking Water Act [SDWA; 40 Code of Federal Regulations (CFR) 141], MCL goals for non-carcinogens established under the SDWA; MCLs established by the state board of health (WAC 246-290)
• Concentrations that do not exceed natural background or the practical quantitation limit (PQL) for indicator hazardous substances for which there are no MTCA table values or applicable state and federal laws.
Based on these criteria, the MTCA Method A table values (WAC 173-340-900, Table 720-1) are
applicable as screening criteria for the Site. There is not a Method A table value for cis-1,2-DCE;
therefore, the Federal/State MCL is used for cis-1,2-DCE. MTCA Method A table values are available
for PCE, TCE, and VC. The groundwater screening criteria are presented in Table 4-2.

??
??
?
?? ? ? ? ? ? ? ? ? ?
??
?
?
?
?
?
?? ? ? ? ? ? ? ?
?
??
? ? ? ? ? ? ? ? ? ? ? ??
?
??
?
?
?? ? ? ? ? ? ? ? ? ? ? ? ? ? ? ?
??
?
? ? ? ? ? ? ? ? ? ? ? ? ? ? ? ? ? ?
? ? ? ? ? ? ? ? ? ? ? ? ? ? ??
??
??
?
App
roxi
mat
e D
epth
in F
eet
110
100
90
80
70
60
50
40
30
20
10
0
Thea Foss Waterway
?
??
?
Sauro's Property RI/FSTacoma, Washington Conceptual Site Model
Figure| G:\P
roje
cts\
094\
048\
013\
014\
RIF
S 2
014\
Figu
re4-
1Con
cept
ual.d
wg
(A) "
Figu
re 4
-1" 8
/28/
2014
Legend Notes
1. The current extent of the site represents the most recentextent of chlorinated solvents in groundwater at or abovethe MTCA Method A groundwater cleanup levels.
2. The depth scale, location of geologic contact units, andgroundwater surface are approximate and generallyreflect the cross-section profile location shown on Figure4-3, located north of the former Sauro's property. Moreaccurate hydrogeology is provided on Figure 1-4.
3. Black and white reproduction of this color original mayreduce its effectiveness and lead to incorrectinterpretation.
Approximate Groundwater Elevation -Primary Flow Path
Historic Excavation Area
Current Extent of Site (DissolvedVOC Contaminated Groundwater)
Groundwater Flow Direction
Historic Release
Potential Vapor Migration
Contaminated Groundwater Exposure
Plume and Geologic Cross SectionLocation (See Note 2)
Not to Scale

TABLE 4-1GROUNDWATER VAPOR INTRUSION SCREENING CRITERIA
SAURO'S PROPERTY RI/FSTACOMA, WASHINGTON
Table 4-1Page 1 of 1
5/14/2014Y:\094\048.012\R\RIFS\Tables\Section 4.0\Table 4-1_GW VI SLs LANDAU ASSOCIATES
Groundwater (µg/L)
Constituents
MTCA Method B Standard Formula Value CUL
(Used as Indoor Air Screening Level) Risk (a)Shallow Groundwater SL
Protective of Method B Air CUL
PCE 9.6 Carcinogenic 24
TCE 0.37 Carcinogenic 1.6
VC 0.28 Carcinogenic 0.35
MTCA = Model Toxics Control ActPCE = TetrachloroetheneTCE = TrichloroetheneVC = Vinyl ChlorideCUL = cleanup levelSL = screening levelµg/m3 = micrograms per cubic meterµg/L = micrograms per liter
(a) Both non-carcinogenic and carcinogenic screening criteria were examined. For these constituents of concern, the carcinogenic risk values are the most protective.
Notes:1. MTCA Method B values based on CLARC database (accessed January 25, 2014)2. Supporting calculations for the shallow groundwater screening level are provided in Appendix H.
Unrestricted Land Use Screening Criteria
Indoor Air (µg/m3)

TABLE 4-2PRELIMINARY GROUNDWATER SCREENING LEVELS
SAURO'S PROPERTY RI/FSTACOMA, WASHINGTON
Table 4-2Page 1 of 1
1Y:\094\048.012\R\RIFS\Tables\Section 4.0\Table 4-2_GW SLs LANDAU ASSOCIATES
ConstituentsMTCA Method A Table
Value (µg/L)Federal/State Primary
MCL (µg/L)Preliminary Groundwater Screening Levels (µg/L)
Tetrachloroethene 5 5 5
Trichloroethene 5 5 5
cis-1,2-Dichloroethene NE 70 70
Vinyl Chloride 0.2 2.0 0.2
ARAR = Applicable, Relevant, and Appropriate RequirementsBold = Screening level used for evaluation of groundwater dataMCL = Maximum Contaminant LevelsMTCA = Model Toxics Control Actµg/L = micrograms per literNE = not established
Notes:1. Federal ARARs and MTCA Method A values based on CLARC database (accessed November 25, 2013)2. MTCA Method A Cleanup Levels (CULs) were used as screening criteria.3. Cis-1,2-DCE does not have a MTCA Method A CUL; therefore, the Federal/State primary MCL value of 70 µg/L was used as screening criteria .
Groundwater ARARs

8/29/14 Y:\094\048.012\R\RIFS\RI-FS__FINAL.docx LANDAU ASSOCIATES 5-1
5.0 REMEDIAL INVESTIGATION ACTIVITIES
RI activities are organized into the following sections: Chronology of Site Investigation Activities
(Section 5.1); Soil Investigation (Section 5.2); DaVita Drain and Outfall Sampling (Section 5.3); Vapor
Intrusion Assessment (Section 5.4); Groundwater Investigation (Section 5.5); and Groundwater
Monitoring (Section 5.6). Results and evaluations are presented in Section 6.0.
5.1 CHRONOLOGY OF SITE INVESTIGATION ACTIVITIES
RI activities were conducted from March 2009 to December 2013. Activities included soil
sampling, DaVita drain and associated outfall sampling, a VI assessment, groundwater investigations, and
groundwater monitoring. The following sections summarize the scope of these RI activities. All RI Site
exploration locations are shown on Figure 5-1. Boring logs from RI subsurface investigations are
presented in Appendix I.
5.2 SOIL INVESTIGATION
RI surface and subsurface soil investigation activities were conducted at the Sauro’s property in
2009 to provide additional soil characterization data prior to conducting the interim action. The soil
investigations were conducted in accordance with the RI work plan and work plan addendum,
respectively (Landau Associates 2009c, d) and their results were previously presented in the interim
action work plan (Landau Associates 2009a).
5.2.1 2001 EXCAVATION AREA BORINGS
Seven RI borings (LAI-P1 through LAI-P7) were completed to further characterize the area of the
2001 sump and soil excavation activities to refine the quantity of soil that needed to be disposed of as
hazardous waste during the 2009 interim action. Four samples were collected from each boring, except
for LAI-P6, from which only three samples were collected. A total of 27 soil samples were collected
from LAI-P1 through LAI P-7 and analyzed for VOCs by EPA Method 8260.
5.2.2 ADDITIONAL ONSITE BORINGS
Six additional borings (LAI-P8, LAI-P9, LAI-P9b, LAI-10, LAI-P10b, and LAI-P11) were drilled
across the Sauro’s property, both for archeological purposes (described below) and to fill data gaps. Eight
soil samples were collected from the borings (two samples from LAI-P8 and LAI-P9, one sample from
LAI-P10, and three samples from LAI-P11) and were analyzed for VOCs by EPA Method 8260. Borings
LAI-P9b and LAI-P10b were drilled strictly for archeological purposes and no soil quality samples were
collected from those borings.

8/29/14 Y:\094\048.012\R\RIFS\RI-FS__FINAL.docx LANDAU ASSOCIATES 5-2
Four deep borings (LAI-P8, LAI-P9b, LAI-P10b, and LAI-P11) were completed to accommodate
an archeological investigation. The Sauro’s property was historically underlain by a gulch that extended
southeast toward the Thea Foss waterway. Additionally, the Sauro’s property is in close proximity to a
historical Puyallup Indian village. The Sauro’s property was filled around the turn of the 19th century.
The four deep borings were advanced to the historical paleosurface (i.e., pre-fill surface). An archeologist
was on site during the investigation to assess soil at the paleosurface and to evaluate the presence of
historical artifacts as an indicator of potential historical use by native peoples.
Soil samples from LAI-P1 through LAI-P11 generally consisted of fill, with native soil alluvium
or glacial till underneath the fill (indicative of Vashon glacial till, or Qvt). The fill consisted of both silt
and sand. The fill in these borings contained brick fragments, glass debris, concrete debris and rubble,
crushed rock, and wood debris including wood chunks and logs; no items of archeological significance
were found.
5.2.3 SOUTH END BORINGS
Six hand auger borings were proposed along the south edge of the Sauro’s property to evaluate
soil quality adjacent to the existing building (DaVita) that abuts the south side of the property. Since the
existing building has a cinder block foundation, planned 2009 interim action shoring and excavation up to
this building foundation presented challenges related to the stability of the building and its foundation.
The proposed hand auger boring data was intended to refine the soil quality characterization in this area
with the ultimate goal of minimizing the volume of soil to be excavated during the interim action at the
southern portion of the Sauro’s property.
Prior to the interim action, the topography at the southern end of the Sauro’s property dropped off
steeply. Consequently, the elevation at the southern end of the Sauro’s property was approximately 12 ft
below the elevation of the northern end. Additionally, the groundwater table at the southern end of the
Sauro’s property was relatively shallow (4 to 8 ft BGS). Based on these conditions, borings at the
southern end of the Sauro’s property were initially attempted using a hand auger (HA). Two borings were
attempted with a hand auger (LAI-HA1 and LAI-HA2) and met refusal at approximately 2 ft due to
significant debris content in the soil. Further exploration of location LAI-HA1 was performed with a
direct-push probe (LAI-HA1b), and the remaining five borings (LAI-HA3 through LAI-HA7) were also
completed with a direct push probe instead of the hand auger (although naming designation kept “HA”).
One sample was collected from each boring to evaluate soil quality. Samples were analyzed for VOCs by
EPA Method 8260.

8/29/14 Y:\094\048.012\R\RIFS\RI-FS__FINAL.docx LANDAU ASSOCIATES 5-3
Soil conditions at LAI-HA1 through LAI-HA7 generally consisted of fill. The fill was typically
brown, silty, fine to medium sand. Concrete debris, wood debris, glass fragments, brick fragments, and
ash/charcoal were also present. No native soil was present in LAI-HA1 through LAI-HA7.
5.3 DAVITA DRAIN AND OUTFALL INVESTIGATION The AO required that the DaVita drain be investigated. The investigation included defining the
hydraulic route of the drainage from the DaVita building. Pre-RI investigations had included sampling
drain water and an unsuccessful attempt to map the drainage flow path (RNS 2006). Additionally, City
sewer records do not include details about the flow path.
The DaVita drain is located at the base of a manhole structure located in the basement of the
DaVita building. The depth of the manhole (from the basement floor) to the drain is greater than 20 ft.
As part of the RI, the drainage flow path was determined by City staff using a dye tracer; the dye is
environmentally safe and is routinely used by the City for sewer utilities inflow/infiltration testing. The
dye was poured into the DaVita drain, which was actively collecting groundwater. Field staff monitored
downstream sewer infrastructure and determined that the drain line flows south and connects to the City
stormwater sewer system along South 15th Street. Water from the drain ultimately discharges into Thea
Foss Waterway at the City storm sewer outfall identified by the City as SAP 600026116, located adjacent
to the public dock east of Johnny’s Seafood at 1199 Dock Street. This outfall has a very large storm
drainage basin, with an upwards of 12,000 acres (City of Tacoma website 2014); therefore, a significant
volume of water enters the system and discharges at this outfall. The location of the DaVita drain,
estimated location of the drainline to the City storm sewer, and the City storm sewer pathway to the
outfall are provided on Figure 5-2.
Water samples were collected from both the drain and the outfall on two occasions: once during
the rainy season on April 7, 2009 and once during the dry season on August 24, 2009. The intent of the
drain and outfall sampling was to determine if contaminated water in the drain was making its way to the
waterway. The depth to the bottom of the drain where water was located is more than 20 ft below the
floor of the basement. Due to the depth, a standard sampling pole could not be used; instead, a clean
glass jar was lowered on a string to collect the water sample. The collected water was then poured into
the laboratory prepared sample containers.
The outfall had to be sampled at low tide. The bottom of the outfall is only exposed at tides
lower than approximately 3 ft mean sea level (MSL; approximate elevation -2.0 ft NGVD29). During the
first sampling event, the level of the tide was below the bottom of the outfall and water was collected
16 The outfall was reportedly installed in 1967 (City of Tacoma website 2014).

8/29/14 Y:\094\048.012\R\RIFS\RI-FS__FINAL.docx LANDAU ASSOCIATES 5-4
where it fell from the pipe. During the second sampling event, the tide level was slightly above the
bottom of the outfall, and water was collected from a point located 6 to 8 ft inside the pipe where it was
obvious that no sea water was mixing with discharge from the pipe. All water was collected in a clean
glass jar and then transferred into the laboratory-supplied sample containers. All samples were analyzed
for VOCs by EPA Method 8260.
5.4 VAPOR INTRUSION ASSESSMENT
Landau Associates evaluated the potential for the plumes to effect indoor air quality at
neighboring properties. Contaminants in groundwater (and residual soil) have the potential to partition to
air and enter overlying buildings through preferential pathways, such as cracks in a building’s slab. This
process is called VI, and vapors in indoor air have the potential to impact indoor air quality.
The neighboring properties evaluated include the Budget property (1305 Pacific Avenue) and
former USPS property (1310 and 1320 A Street) both owned by Haub Enterprises. Evaluations were
conducted to determine if the VOC plume would pose a risk to indoor air if an underground parking
structure were placed on the properties. Risk posed by VI is typically evaluated through development of a
conceptual model, followed by use of Site-specific data to model exposure scenarios, in this case the
Johnson and Ettinger model (J&E model). The model parameters were modified for Site-specific
conditions including the depth to groundwater, groundwater concentrations (pre-interim action), proposed
building dimensions including the lateral and vertical extent of below ground structures, air exchange
rates required for parking structures in the State of Washington, and inhalation and exposure frequencies
typical for an office setting. The model also expects that waterproofing materials (a vapor barrier) would
be used beneath the parking structure and elevator shaft, which would help seal indoor air from soil
vapors. The results of the VI assessment are presented in Section 6.0.
5.5 GROUNDWATER INVESTIGATIONS
Two RI groundwater investigations were conducted. The purpose of the first investigation was to
install a new source area monitoring well (Section 5.5.1). The purpose of the second investigation was to
characterize the downgradient extent of the groundwater VOC plume along Dock Street (Section 5.5.2).
These investigations are summarized below.
5.5.1 INSTALLATION OF NEW SOURCE AREA WELL
All pre-existing source area monitoring wells were located on the Sauro’s property. These wells
were decommissioned during the 2009 interim action (Section 3.0). Therefore, on October 20, 2010, a
new source area monitoring well called LAI-MW5 was installed. LAI-MW5 was installed along the
South 14th Street ROW, near the northeast corner of the Sauro’s property. The well has a 15 foot screen

8/29/14 Y:\094\048.012\R\RIFS\RI-FS__FINAL.docx LANDAU ASSOCIATES 5-5
and is screened in the pre-Fraser geologic unit (Qpf). Following installation, VOC groundwater sampling
of LAI-MW5 began on a quarterly basis as part of RI groundwater monitoring (Section 5.6). The location
of LAI-MW5 is shown on Figure 5-1 and the boring log is provided in Appendix I.
5.5.2 DOCK STREET DIRECT-PUSH INVESTIGATION
In November 2013, five additional borings (LAI-B6, LAI-B7, LAI-B8, LAI-B9, and LAI-B10)
were conducted along Dock Street using a direct-push probe rig. The purpose of this additional
investigation was to verify that the leading edge of the plume was adequately characterized. The borings
were located to the north and south of LAI-MW4. Each boring was approximately 25 ft to 30 ft deep.
Two groundwater samples were collected from each boring: one from the approximate depth of the water
table and one from just above the bottom of the boring. Sampling at the top of the water table allows for
conducting a Tier I screening assessment related to VI (Ecology 2009b). The sample collected at the
bottom of the boring represented the approximate depth interval that has been monitored at LAI-MW4
throughout the RI. The work was done in accordance with the Data Gap Groundwater Characterization
Along Dock Street Work Plan (Landau Associates 2013a), with the addition of groundwater samples
collected at the top of the water table. Samples were analyzed for VOCs by EPA Method 8260C. Direct-
push locations are shown on Figure 5-1.
Soil samples from LAI-B6 through LAI-B10 generally consisted of fill, dredge fill, and tidal
deposits. Fragments of shells were found in the dredge fill and (to a greater extent) in the tidal deposit.
The pre-Fraser geologic unit (Qpf) was encountered at the two southernmost borings (LAI-B7 and LAI-
B6). The soil boring lithology is presented on a geologic cross-section Figure 5-3 that is located as shown
on Figure 5-1.
VOC concentrations in soil were measured using a photoionization device (PID) at the time of
drilling and the readings are presented on boring logs (Appendix I). A petroleum odor was observed at all
boring locations, although the PID did not consistently detect volatiles. Due to the lack of volatiles
observed at time of drilling and knowledge of residual impacts from historical operations along Dock
Street (Hart Crowser 2005), the petroleum contamination encountered is assumed to be DRO and motor
oil-range organics (predominately). The investigation-derived waste (IDW; soil cuttings and purge water)
were contained in drums and disposal was overseen by Landau Associates; disposal documentation is
provided in Appendix D.
5.6 GROUNDWATER MONITORING
The RI groundwater monitoring program consisted of groundwater level collection and
groundwater sampling. The RI groundwater monitoring program is described in the following sections.
Monitoring well details were previously presented in Table 1-1.

8/29/14 Y:\094\048.012\R\RIFS\RI-FS__FINAL.docx LANDAU ASSOCIATES 5-6
5.6.1 GROUNDWATER LEVEL MONITORING During the RI, groundwater levels were collected between April 2009 and September 2013. Prior
to the interim action, groundwater elevation data was collected to verify local groundwater flow direction,
and depth to water for interim action construction purposes and to determine which wells to sample.
Following the interim action, water levels were collected routinely during groundwater sampling to
monitor groundwater flow direction. All RI water level data is presented in Table 5-1.
5.6.2 PRE-INTERIM ACTION SAMPLING PROGRAM
The first RI groundwater sampling event (and only pre-interim action event) was conducted in
April/May 2009 and included sampling at most wells present at the time (19 wells sampled; historically
dry wells not sampled17 ). The work was conducted in general accordance with the RI work plan (Landau
Associates 2009c) and included analysis of VOCs (at 18 wells) and monitored natural attenuation (MNA)
parameters (at five wells). Wells that were sampled and the analysis are specified in the table below:
Monitoring Well VOCs MNA Since
Decommissioned
LAI-MW1 x
LAI-MW2 x
LAI-MW3 x x
LAI-MW4 x x
RNS-MW2 x
RNS-MW3 x
RNS-MW4 x
RNS-MW5 x
RNS-MW6 x
RNS-MW7 x
MW-1 x
MW-2 x
MW-8S x x
MW-9 x x
MW-11D x x x
MW-11S x x
MW-12 x x
MW-13 x x
17 The following wells were historically dry during pre-RI groundwater monitoring activities: MW-3, MW-4, MW-6, MW-8, and
MW-10.

8/29/14 Y:\094\048.012\R\RIFS\RI-FS__FINAL.docx LANDAU ASSOCIATES 5-7
5.6.3 QUARTERLY REMEDIAL INVESTIGATION SAMPLING PROGRAM Following the interim action, the monitoring well network decreased to 14 wells after on-property
wells were decommissioned. One additional well, LAI-MW5, was installed after the interim action in
October 2010 to serve as a new source area well. Two quarterly monitoring programs occurred during the
RI (following the interim action). One focused on VOC sampling (Section 5.6.3.1), the other on MNA
sampling (5.6.3.2). The current monitoring well network includes 15 wells and is shown on Figure 5-4.
5.6.3.1 Quarterly Volatile Organic Sampling
The quarterly VOC groundwater sampling program began after the interim action, beginning May
2010 through September 2013. The May 2010 event included sampling nine select wells (LAI-MW1,
LAI-MW2, LAI-MW3, LAI-MW4, MW-1, MW-2, MW-13, RNS-MW2, and RNS-MW6). The July
2010 event included sampling 13 of the 14 wells present at the time; MW-3 was not sampled (and has not
been sampled) because it does not produce an adequate water level for sampling. Upon reviewing results
from the July 2010 event, it was decided that four wells (RNS-MW3, RNS-MW4, RNS-MW5, and RNS-
MW7) had a demonstrated history of non-detect data for Site COCs and thus, removed from the quarterly
sampling program, reducing the sampled group of wells to nine. Once LAI-MW5 was installed in
October 2010, the program increased to 10 wells and has remained unchanged.
Initially, only four quarters of post-interim action sampling events were planned, but initial
variability in VOC concentrations were detected that were attributed to effects of the interim action. The
program was extended another 2½ years to monitor VOC concentration trends, as well as MNA
parameters. A total of 16 quarterly VOC sampling events were conducted. A map showing the 10
quarterly VOC sampling locations is provided as Figure 5-5. Sampling procedures are presented in
Section 5.6.4 and VOC results are presented in Section 6.4.2.
5.6.3.2 Quarterly Monitored Natural Attenuation Sampling
In addition to VOC samples, geochemical data (specifically natural attenuation data) has been
collected to evaluate reductive conditions in groundwater. Natural attenuation parameters measured
include the following: dissolved oxygen, oxygen reduction potential, nitrate, ferrous iron, sulfate, and
total organic carbon. The intent of collecting MNA parameters was to evaluate the potential for reductive
dechlorination to occur at the Site and the potential for MNA to be an effective long-term remedy.
MNA sampling events included 11 wells, all of which are the same as VOC sampling plus RNS-
MW7. Within the existing monitoring well network, there are no wells truly upgradient of the Sauro’s
property and the Site. Well RNS-MW7 is sampled because VOCs have not been detected at this location
and therefore, this well may provide information on aquifer background conditions. A total of five
8/29/14 Y:\094\048.012\R\RIFS\RI-FS__FINAL.docx LANDAU ASSOCIATES 5-8
quarterly MNA sampling events occurred from 2012 through 2013. A map showing the 11 MNA
sampling locations is provided as Figure 5-6. Sampling procedures are presented in Section 5.6.4 and
MNA results are presented in Section 6.4.3.
5.6.3.3 Sampling of Non-Project Wells
In 2013, two wells located downgradient of the Sauro’s property along Dock Street were
discovered (Landau Associates 2014). The two wells appear to be associated with environmental
sampling activities related to waterfront redevelopment efforts near Dock Street and South 15th Street.
Since the wells are located in close proximity to or on the Johnny Seafood property, the wells are referred
to as MW-JS and MW-JS2; the well locations are shown on Figure 5-4. The wells are approximately
21.8 ft deep (MW-JS) and 22.5 ft deep (MW-JS2); screens are estimated to be 10 feet or less. The wells
were sampled for VOCs in June 2013 (MW-JS) and September 2013 (MW-JS2); MW-JS2 was also
sampled for MNA in September 2013. Sampling results were previously provided to Ecology through
two status reports (Landau Associates 2013b; Landau Associates 2014).
5.6.4 WATER QUALITY SAMPLING AND ANALYSIS PLAN VOC sampling methods were re-evaluated during the pre-interim action sampling event.
Traditionally, VOC sampling had been conducted using a peristaltic pump (if depth to water was less than
25 ft BGS) or a GRUNDFOS® pump (if depth to water exceeded capabilities of a peristaltic pump). A
new passive sampling method using passive diffusion bags (PDBs) was piloted to compare the method to
pump methods. PDBs provide an advantage over pump samples because they minimize IDW, minimize
the sampling time, and allow multiple-depth samples to be collected from wells with longer screens.
Minimizing sampling time is important because the urban environment forced placement of a number of
wells in the street where sampling efforts block traffic and present a safety hazard to the samplers.
Additionally, several wells installed by previous consultants at the Site have screens that are 15 ft or
longer; PDBs allow sampling at multiple depths with these long screens.
To compare PDB and traditional pump sample methods, duplicate samples were collected at
MW-11D, MW-13, LAI-MW3, LAI-MW4, RNS-MW2, and RNS-MW6 in 2009; a similar comparison
was done for LAI-MW5 in October 2010 after installation. Comparisons of the data between the PDB
samples and duplicate pump samples show that results of the two sampling methods are comparable.
Overall, PDB sampling techniques showed good results at the Site and were ultimately adopted for the
on-going VOC quarterly monitoring program at all applicable wells except for MW-1 and MW-2.
PDBs cannot be used to collect MNA samples. MNA samples are collected with either a
peristaltic pump or a GRUNDFOS pump. EPA low-flow sampling procedures (Puls and Barcelona 1996)

8/29/14 Y:\094\048.012\R\RIFS\RI-FS__FINAL.docx LANDAU ASSOCIATES 5-9
were used for all pump samples. These procedures include purging the well under low-flow conditions
[<0.5 liters per minute (L/min)] until water quality indicator parameters (pH, specific conductance,
dissolved oxygen, oxidation-reduction potential, and temperature) stabilized to within 10 percent for three
consecutive readings. Dedicated sample tubing was used for each monitoring well.
VOC and MNA samples from 2009, May 2010, and July 2010 were collected by Landau
Associates. Samples were submitted to an Ecology-accredited analytical laboratory [Analytical Resources
Inc. (ARI)]. VOCs were analyzed by EPA Method 8260. MNA field parameters were collected by field
personnel using a YSI water quality meter. Analysis of standard analytes including nitrate, sulfate, and
total organic carbon were submitted to ARI and analyzed for nitrate and sulfate by EPA Method 300.
Beginning in October 2010, quarterly VOC samples were collected by the City and analyzed by
the City’s laboratory. The only exception is the initial LAI-MW5 samples which were collected by
Landau Associates and analyzed by ARI. The analysis used for VOCs is EPA Method 8260. Beginning
in fall 2012, the City conducted quarterly MNA sampling of 11 wells in accordance with the Ecology-
approved MNA work plan (Landau Associates 2012b), which included more analytes than had been
tested prior to the interim action. A sampling matrix listing the quarterly monitoring well locations for
VOC and MNA, sampling methodology, and sampling depths is provided in Table 5-2. Analyses for
MNA are provided in Table 5-3.

&<
!H!H
!H!H!H!H
!H
!O
XW
T
T
#
#
!H
!H !H!H!H!H
!H!H!H
!H!H
!
!
!
!
!
!W
!W
&<
&<
&<&<
&<
&<
&<
&<
&<
&<
&<
&<
&<
&<
LAI-B6
LAI-B7
LAI-B8
LAI-B9
LAI-B10
LAI-HA1a
LAI-HA7
LAI-HA3
LAI-HA4
LAI-HA5
LAI-HA6
LAI-P10LAI-P10b
LAI-P9b
LAI-HA1b
LAI-HA2
LAI-P11
LAI-P6
LAI-P7
LAI-P1LAI-P3
LAI-P2LAI-P5
LAI-P4LAI-P8
LAI-P9
A S
TRE
ET
PAC
IFIC
AV
EN
UE
CO
UR
T A
CO
MM
ER
CE
STR
EE
T
SOUTH 13TH STREET
RA
MP
RAM
P I7
05
DO
CK
STR
EET
RA
MP
I705
SOUTH 14TH STREET
SOUTH 15TH STREETSOUTH 15TH STREET
I705
DiamondProperty
DaVita
BudgetProperty
USPSProperty
LAI-MW5
Approximate Locationof DaVita Drain
Outfall Downstreamof DaVita Drain
B
B' MW-JS2
MW-JS
LAI-MW3LAI-MW4
LAI-MW2
LAI-MW1
MW-13
RNS MW-3
RNS MW-2
RNS MW-4
RNS MW-5
RNS MW-6
RNS MW-7
MW-1(SP-2)
MW-3(SP-3)
MW-2
0 100 200
Scale in FeetData Sources: Pierce County GIS; Esri World Imagery 2011.
Sauro's Property RI/FSTacoma, Washington RI Site Explorations
Figure
5-1G:\P
roje
cts\
094\
048\
013\
014\
RIF
S 2
014\
Figu
re5-
1RIS
iteE
xplo
ratio
ns.m
xd 8
/28/
2014
NA
D 1
983
HAR
N S
tate
Plan
e W
ashi
ngto
n So
uth
FIP
S 46
02 F
eet
Legend
&< LAI Monitoring Well
!H 2009 LAI Boring
! 2013 LAI Boring
!W Other Wells
&< Existing Pre-RI Monitoring Well
2001 Excavation and Sump Removal
Subject Property
Notes1. Soil samples collected at all RI soil boring locations. Samples collected in preparation for the 2009 interim action excavation.2. Wells MW-JS and MW-JS2 are existing wells from a separate project unrelated to Sauro's. One was sampled in June and one was sampled in September 2013 during Sauro's quarterly RI sampling.
FormerSauro'sProperty
3. Black and white reproduction of this color original may reduce its effectiveness and lead to incorrect interpretation.
T T# #Cross Section Location

!
!
!!
!
!O
XW
&<
&<
&<&<
&<
&<
&<
&<
&<
&<
&<
&<
&<
&<
&<
&<
&<
DaVita
Budget Property
USPSProperty
SOUTH 15TH STREET
Thea Foss Waterway
DiamondProperty
FormerSauro'sProperty
MW-338.18
MW-JS22.62
MW-JS2.83
Potential Drainline Location andConnection Point to Public Storm Sewer
Approximate Locationof DaVita Drain
Depth to Water: 20 ft BelowBasement Floor Surface at
Time of Sampling
Storm ManholeInvert Elevation: 31.06 ft
Storm OutfallPipe Diameter: 60 inchInvert Elevation: -2 ft
I705
A ST
REET
I705 H
WY S
PACI
FIC AV
ENUE
I705 H
WY N
COUR
T A
COMM
ERCE
STRE
ET
SOUTH 13TH STREET
RAMP
RAMP
I705
DOCK
STRE
ET
RAMP
I705
SOUTH 14TH STREET
SOUTH 15TH STREETRAMP I705
SOUT
H HOO
D STR
EET
LAI-MW212.33
LAI-MW117.17
LAI-MW310.7
LAI-MW42.48
LAI-MW536.94
MW-1323.14
RNS-MW325.33
RNS-MW235.51
RNS-MW421.41
RNS-MW516.81
RNS-MW624.18
RNS-MW721.36
MW-130.46
MW-235.36
8950001951
8950002070
2013050121
2013030010
8950002040
0320042033
8950001971
2014030041
2013020020
2014020020
2013050133
2013050132
2014020010
2013020011
2013040191
8950002060
8950002050
2014030010
2014020030
2011050141
2013040110
2013040020
2013040050
2013040090
2013040010
2014030020
2014030030
2011040071
2013040030
2013040040
2013040060
2013040070
2013040080
2013040100
2013040120
2013040130
2013040140
2013040150
2013040160
2013040170
2013040180
2011040072
0 100 200
Scale in FeetData Sources: Pierce County GIS; Esri World Imagery 2011.Vertical Datum: NGVD29.
Sauro's Property RI/FSTacoma, Washington
DaVita Drain InvestigationHydraulic Details
Figure
5-2
G:\P
roje
cts\
094\
048\
013\
014\
RIF
S 2
014\
Figu
re5-
2Dav
itaD
rain
Inve
stig
atio
nHyd
raul
icD
etai
ls.m
xd 8
/28/
2014
Legend&< Existing Monitoring Wells
! Storm Manhole
Storm Sewer
Groundwater Contours
Subject Property
Historic Deep Gulch
Notes1. Approximate location of public storm sewer line interpreted from the City of Tacoma Government Made Easy website; storm structure elevations from website.2. Approximate location of private drainline connection from DaVita drain interpreted based on City of Tacoma field staff information.
2525
20
20
15
15 10
10
5
5
35
3530
30
3. Groundwater elevation contours from November 2013.4. Black and white reproduction of this color original may reduce its effectiveness and lead to incorrect interpretation.

D=30'
D=30'
D=28' D=28'
D=25.6'Ele
vatio
n in
ft (N
GV
D29
)
Ele
vatio
n in
ft (N
GV
D29
)
-30
-20
-10
0
10
20
-30
-20
-10
0
10
20
0+00 0+50 1+00 1+50 2+00 2+50 3+00 3+50 4+00 4+50 5+005+00
LAI-B10
(Offset 11'W)
LAI-B9
(Offset 1'E)
LAI-MW4
(Offset 6'E)LAI-B8
(Offset 3'E)LAI-B7
(Offset 2'E) LAI-B6
(Offset 1'E)
D=30'
Existing Ground Surface
Asphalt ConcretePavement
B'
SouthB
North
? ? ? ? ? ? ? ? ? ? ? ? ? ? ? ? ? ? ? ??
??
?? ?
??
?? ? ? ? ? ? ? ? ? ? ? ? ? ? ?
? ? ? ? ? ? ??
??
??
??
?? ? ? ? ? ?
??
?? ? ? ? ? ? ? ? ? ?
??
??
? ? ? ? ? ? ?
? ? ? ? ? ? ? ? ? ? ? ? ? ? ? ? ??
??
??
??
??
??
??
??
??
??
??
??
?? ? ? ?
Dredge Fill
Fill
ATD 0936ATD 1041ATD 1311
ATD 1210
ATD 1504ATD 1423
ATD 0940ATD 0850
ATD 1230ATD 1142
(19')
(30')
(20')
(30')
(25')
(20')
(25')
(20')
(25.6')
(20')
Johnny's Seafood Property Line(Offset 120' East)
Historic Deep Gulch(Offset 200' West)South 15th Street and
Dock Street Intersection
Tidal Deposit
Qpf(Pre-Fraser)
Legend
? ? ?
Groundwater Level (At first measurement)Groundwater Level (At second measurement)
Top of Exploration
Bottom of Exploration
Well Screen Interval (If Installed)Inferred Geologic ContactInferred Groundwater Table
LAI-B10
(Offset 160' W)Project Exploration DesignationOffset Distance in Feet and Direction
Depth of Exploration (ft)D=30'
Descrete Sample Depth (ft)(19')
Notes
1. Soil descriptions are generalized, based oninterpretation of field data. Stratigraphiccontacts are interpolated between borings andbased on topographic features; actual conditionsmay vary. See Landau Associates RI/FS reporttext for descriptions of geologic units.
2. For Cross Section location, see Figure 4-1 .
3. Water level data for borings from November2013.
4. Black and white reproduction of this colororiginal may reduce its effectiveness and lead toincorrect interpretation.
0 50 100
Horizontal Scale: 1"=50'Vertical Scale: 1"=10'
Sauro's Property RI/FSTacoma, Washington
Dock Street - Direct Push
Cross Section B-B'
FigureLAN
DA
U A
SS
OC
IATE
S, I
NC
. | G
:\Pro
ject
s\09
4\04
8\01
3\01
4\R
IFS
201
4\Fi
gure
5-3D
ockS
treet
.dw
g (A
) "Fi
gure
5-2
" 8/2
8/20
14
Source: Puget Sound Lidar Consortium 2005

&<
&<
&<&<
&<
&<
&<
&<
&<
&<
&<
&<
&<
&<
&<
!W
!W
DaVita
Budget Property
USPSProperty
SOUTH 15TH STREET
Thea Foss Waterway
DiamondProperty
FormerSauro'sProperty
MW-3
0+00
1+00
2+00
3+00
4+00
5+00
6+00
7+00
8+00
9+00
10+0
0
11+0
0
11+3
5
AA'
I705
A ST
REET
PACI
FIC AV
ENUE
I705 H
WY N
COUR
T A
COMM
ERCE
STRE
ET
SOUTH 13TH STREET
RAMP
RAMP
I705
DOCK
STRE
ET
RAMP
I705
SOUTH 14TH STREET
SOUTH 15TH STREETRAMP I705
LAI-MW2
LAI-MW1
LAI-MW3 LAI-MW4
LAI-MW5
MW-13
RNS-MW3
RNS-MW2
RNS-MW4
RNS-MW5
RNS-MW6
RNS-MW7
MW-1
MW-2
MW-JS
MW-JS2
8950001951
8950002070
2013050121
2013030010
8950002040
0320042033
8950001971
2014030041
2013020020
2014020020
2013050133
2013050132
2012020014
2014020010
2013020011
2013040191
8950002060
8950002050
2014030010
2014020030
2011050141 8950001961
2013040110
2013040020
2013040050
2013040090
2013040010
8950001964
2014030020
2014030030
2011040071
2013040030
2013040040
2013040060
2013040070
2013040080
2013040100
2013040120
2013040130
2013040140
2013040150
2013040160
2013040170
2013040180
2011040072
8950
0019
63
0 100 200
Scale in Feet
Data Sources: Pierce County GIS; Esri World Imagery 2011.
Sauro's Property RI/FSTacoma, Washington
Existing Monitoring Well Networkand Cross Section Area
Figure
5-4
G:\P
roje
cts\
094\
048\
013\
014\
RIF
S 2
014\
Figu
re5-
4Exi
stin
gMW
June
2013
.mxd
8/2
8/20
14
Cross Section Location
Notes1. MW-3 was too dry to sample.2. Wells MW-JS and MW-JS2 are existing wells from a separate project unrelated to Sauro's. One was sampled in June and one was sampled in September 2013 during Sauro's quarterly RI sampling.
3. Black and white reproduction of this color original may reduce its effectiveness and lead to incorrect interpretation.
Legend
&<Quarterly Sampling RIMonitoring Wells
!W Other Wells
Subject Property

&<
&<
&<&<
&<
&<
&<
&<
&<
&<
&<
&<
&<
&<
&<
DaVita
Budget Property
USPSProperty
SOUTH 15TH STREET
Thea Foss Waterway
DiamondProperty
FormerSauro'sProperty
MW-3(Dry)
I705
A ST
REET
PACI
FIC AV
ENUE
COUR
T A
COMM
ERCE
STRE
ET
SOUTH 13TH STREET
RAMP
RAMP
I705
DOCK
STRE
ET
RAMP
I705
SOUTH 14TH STREET
SOUTH 15TH STREETRAMP I705
LAI-MW2 (65)
LAI-MW1 (63)
LAI-MW3 (75) LAI-MW4 (25)
LAI-MW5 (42; 50)
MW-13 (51.5)
RNS-MW3
RNS-MW2 (21.5; 38.5)
RNS-MW4
RNS-MW5
RNS-MW6 (42.5; 52.5)
RNS-MW7
MW-1 (18)
MW-2 (15)
8950001951
8950002070
2013050121
2013030010
8950002040
03200420338950001971
2014030041
2013020020
2014020020
2013050133
2013050132
2014020010
2013020011
2013040191
2012020014
8950002060
8950002050
2014030010
2014020030
2013040110
2013040020
2013040050
2013040090
89500019612011050141
2013040010
8950001964
2014030020
2014030030
2011040071
2013040030
2013040040
2013040060
2013040070
2013040080
2013040100
2013040120
2013040130
2013040140
2013040150
2013040160
2013040170
2013040180
2011040072
8950
0019
63
0 100 200
Scale in Feet
Data Sources: Pierce County GIS; Esri World Imagery 2011.
Sauro's Property RI/FSTacoma, Washington
RI Groundwater Monitoring LocationsVOC Sampling
Figure
5-5
G:\P
roje
cts\
094\
048\
013\
014\
RIF
S 2
014\
Figu
re5-
5Qua
rterly
GW
VO
C.m
xd 8
/28/
2014
Legend
&< Monitoring Well Sampled (Sample Depth in feet)
&< Other Existing Monitoring Wells
Subject Property
Notes1. Quarterly VOC sampling began in May 2010 and ended in September 2013.2. LAI-MW5 was installed in October 2010 and incorporated into quarterly monitoring by November 2010.3. Black and white reproduction of this color original may reduce its effectiveness and lead to incorrect interpretation.

&<
&<
&<&<
&<
&<
&<
&<
&<
&<
&<
&<
&<
&<
&<
DaVita
Budget Property
USPSProperty
SOUTH 15TH STREET
Thea Foss Waterway
DiamondProperty
FormerSauro'sProperty
MW-3(Dry)
I705
A ST
REET
PACI
FIC AV
ENUE
COUR
T A
COMM
ERCE
STRE
ET
SOUTH 13TH STREET
RAMP
RAMP
I705
DOCK
STRE
ET
RAMP
I705
SOUTH 14TH STREET
SOUTH 15TH STREETRAMP I705
LAI-MW2 (65)
LAI-MW1 (63)
LAI-MW3 (75) LAI-MW4 (25)
LAI-MW5 (46)
MW-13 (51.5)
RNS-MW3
RNS-MW2 (30)
RNS-MW4
RNS-MW5
RNS-MW6 (47.5)
RNS-MW7 (41)
MW-1 (18)
MW-2 (15)
8950001951
8950002070
2013050121
2013030010
8950002040
03200420338950001971
2014030041
2013020020
2014020020
2013050133
2013050132
2014020010
2013020011
2013040191
2012020014
8950002060
8950002050
2014030010
2014020030
2013040110
2013040020
2013040050
2013040090
89500019612011050141
2013040010
8950001964
2014030020
2014030030
2011040071
2013040030
2013040040
2013040060
2013040070
2013040080
2013040100
2013040120
2013040130
2013040140
2013040150
2013040160
2013040170
2013040180
2011040072
8950
0019
63
0 100 200
Scale in Feet
Data Sources: Pierce County GIS; Esri World Imagery 2011.
Sauro's Property RI/FSTacoma, Washington
RI Groundwater Monitoring LocationsMNA Sampling
Figure
5-6
G:\P
roje
cts\
094\
048\
013\
014\
RIF
S 2
014\
Figu
re5-
6Qua
rterly
GW
MN
A.m
xd 8
/28/
2014
Legend
&< Monitoring Well Sampled (Sample Depth in feet)
&< Other Existing Monitoring Wells
Subject Property
Notes1. Quarterly MNA sampling was conducted from October 2012 through September 2013.2. Black and white reproduction of this color original may reduce its effectiveness and lead to incorrect interpretation.

TABLE 5-1REMEDIAL INVESTIGATION GROUNDWATER ELEVATIONS SUMMARY
SAURO'S PROPERTY RI/FSTACOMA, WASHINGTON
Table 5-1Page 1 of 8
5/14/2014Y:\094\048.012\R\RIFS\Tables\Section 5.0\Table 5-1_Monitoring Well Groundwater Elevations LANDAU ASSOCIATES
Well ID Date Water Level Elevation
Top of Casing Elevation
LAI-MW1 4/10/2009 16.92 62.384/28/2009 17.18 62.385/5/2010 18.41 62.387/21/2010 18.46 62.3811/2/2010 17.25 62.381/27/2011 18.44 62.384/21/2011 18.75 62.387/1/2011 18.58 62.38
10/18/2011 17.16 62.381/9/2012 16.98 62.384/11/2012 18.39 62.387/16/2012 19.53 63.389/6/2012 17.98 62.3810/9/2012 17.38 62.38
12/21/2012 17.38 62.381/15/2013 17.88 62.383/21/2013 17.97 62.384/2/2013 16.88 62.384/12/2013 18.07 62.386/18/2013 18.08 62.386/20/2013 18.04 62.389/9/2013 17.28 62.389/11/2013 17.38 62.3811/4/2013 17.17 62.38
LAI-MW2 4/10/2009 11.97 56.574/28/2009 12.02 56.575/5/2010 12.83 56.577/21/2010 12.30 56.5711/2/2010 12.62 56.571/27/2011 12.73 56.574/21/2011 13.80 56.577/1/2011 12.43 56.57
10/18/2011 12.25 56.571/9/2012 12.54 56.574/11/2012 12.50 56.577/3/2012 12.67 56.579/6/2012 11.97 56.5710/9/2012 11.97 56.57
12/21/2012 12.47 56.571/15/2013 13.07 56.573/21/2013 12.32 56.574/2/2013 12.24 56.574/12/2013 12.39 56.576/18/2013 12.27 56.576/19/2013 12.16 56.579/9/2013 11.97 56.579/11/2013 11.93 56.5711/4/2013 12.33 56.57

TABLE 5-1REMEDIAL INVESTIGATION GROUNDWATER ELEVATIONS SUMMARY
SAURO'S PROPERTY RI/FSTACOMA, WASHINGTON
Table 5-1Page 2 of 8
5/14/2014Y:\094\048.012\R\RIFS\Tables\Section 5.0\Table 5-1_Monitoring Well Groundwater Elevations LANDAU ASSOCIATES
Well ID Date Water Level Elevation
Top of Casing Elevation
LAI-MW3 4/14/2009 10.71 61.684/28/2009 10.71 61.684/30/2009 10.79 61.685/1/2009 10.79 61.685/5/2010 11.31 61.687/21/2010 10.99 61.6811/2/2010 11.12 61.681/27/2011 11.23 61.684/21/2011 11.38 61.687/1/2011 11.10 61.68
10/18/2011 10.81 61.681/9/2012 10.96 61.684/11/2012 11.20 61.687/3/2012 10.95 61.689/6/2012 10.88 61.6810/9/2012 10.48 61.68
12/21/2012 11.28 61.681/15/2013 11.18 61.683/21/2013 10.92 61.684/2/2013 9.87 61.684/12/2013 11.00 61.686/18/2013 10.86 61.686/20/2013 10.83 61.689/9/2013 10.61 61.689/11/2013 10.58 61.6811/4/2013 10.70 61.68
LAI-MW4 5/19/2009 1.49 14.244/10/2009 2.24 14.244/28/2009 1.85 14.245/5/2010 2.36 14.247/21/2010 1.79 14.2411/2/2010 2.92 14.241/27/2011 2.80 14.244/21/2011 2.24 14.247/1/2011 2.14 14.24
10/18/2011 2.44 14.241/9/2012 2.71 14.244/10/2012 2.47 14.247/3/2012 1.95 14.249/6/2012 2.14 14.2410/9/2012 1.64 14.24
12/20/2012 4.04 14.241/15/2013 2.54 14.243/21/2013 2.37 14.244/2/2013 2.19 14.244/12/2013 2.64 14.246/18/2013 1.91 14.246/20/2013 1.64 14.249/9/2013 2.69 14.249/11/2013 2.47 14.2411/4/2013 2.48 14.24

TABLE 5-1REMEDIAL INVESTIGATION GROUNDWATER ELEVATIONS SUMMARY
SAURO'S PROPERTY RI/FSTACOMA, WASHINGTON
Table 5-1Page 3 of 8
5/14/2014Y:\094\048.012\R\RIFS\Tables\Section 5.0\Table 5-1_Monitoring Well Groundwater Elevations LANDAU ASSOCIATES
Well ID Date Water Level Elevation
Top of Casing Elevation
LAI-MW5 Well installed 10/20/201011/9/2010 38.27 61.002/16/2011 37.60 61.004/21/2011 37.48 61.004/21/2011 37.48 61.00
7/1/2011 36.50 61.007/1/2011 36.50 61.00
10/18/2011 36.47 61.0010/18/2011 36.47 61.00
1/9/2012 37.26 61.001/9/2012 37.26 61.004/11/2012 37.62 61.004/11/2012 37.62 61.007/3/2012 36.87 61.009/7/2012 36.00 61.0010/9/2012 36.00 61.00
12/19/2012 37.90 61.001/15/2013 37.40 61.003/21/2013 37.16 61.004/2/2013 36.95 61.004/12/2013 37.60 61.006/18/2013 36.82 61.006/19/2013 36.76 61.009/9/2013 36.64 61.009/11/2013 36.58 61.0011/4/2013 36.94 61.00
MW-1 4/10/2009 29.00 47.454/28/2009 29.26 47.455/5/2010 28.40 47.457/21/2010 27.36 47.4511/2/2010 29.57 47.451/27/2011 31.55 47.454/21/2011 31.43 47.457/1/2011 29.22 47.45
10/18/2011 28.96 47.451/9/2012 29.48 47.454/10/2012 31.65 47.457/3/2012 30.78 47.459/6/2012 28.85 47.4510/9/2012 28.25 47.45
12/20/2012 31.05 47.451/15/2013 31.65 47.453/21/2013 31.34 47.454/2/2013 31.15 47.454/11/2013 31.79 47.456/18/2013 30.94 47.456/19/2013 31.01 47.459/9/2013 29.88 47.459/12/2013 29.78 47.4511/4/2013 30.46 47.45

TABLE 5-1REMEDIAL INVESTIGATION GROUNDWATER ELEVATIONS SUMMARY
SAURO'S PROPERTY RI/FSTACOMA, WASHINGTON
Table 5-1Page 4 of 8
5/14/2014Y:\094\048.012\R\RIFS\Tables\Section 5.0\Table 5-1_Monitoring Well Groundwater Elevations LANDAU ASSOCIATES
Well ID Date Water Level Elevation
Top of Casing Elevation
MW-2 3/30/2009 36.60 51.06 4/10/2009 36.62 51.06
4/28/2009 36.72 51.064/29/2009 36.64 51.065/5/2010 35.09 51.067/21/2010 34.68 51.0611/2/2010 34.24 51.061/27/2011 35.89 51.064/21/2011 35.77 51.067/1/2011 35.10 51.06
10/18/2011 34.53 51.061/6/2012 34.86 51.064/10/2012 35.96 51.067/3/2012 35.35 51.069/6/2012 34.26 51.0610/9/2012 34.06 51.06
12/20/2012 36.46 51.061/15/2013 36.06 51.063/21/2013 36.15 51.064/2/2013 35.68 51.064/11/2013 35.16 51.066/18/2013 35.44 51.066/19/2013 35.54 51.069/9/2013 35.12 51.069/12/2013 35.06 51.0611/4/2013 35.36 51.06
MW-3 3/30/2009 38.55 58.824/28/2009 38.52 58.8211/4/2013 38.18 58.82
MW-4 3/30/2009 33.92 49.424/28/2009 33.51 49.42
Decommissioned during Fall 2009 Interim Action
MW-6 3/30/2009 35.67 47.914/28/2009 35.67 47.915/8/2009 35.63 47.915/18/2009 35.75 47.916/30/2009 35.51 47.918/23/2009 35.33 47.91
MW-8 3/30/2009 32.66 38.204/28/2009 28.51 38.20
Decommissioned during Fall 2009 Interim Action
MW-8S 3/30/2009 33.12 37.924/10/2009 32.59 37.924/28/2009 32.61 37.924/30/2009 32.56 37.925/8/2009 33.22 37.925/18/2009 32.82 37.926/30/2009 30.89 37.928/23/2009 30.29 37.92

TABLE 5-1REMEDIAL INVESTIGATION GROUNDWATER ELEVATIONS SUMMARY
SAURO'S PROPERTY RI/FSTACOMA, WASHINGTON
Table 5-1Page 5 of 8
5/14/2014Y:\094\048.012\R\RIFS\Tables\Section 5.0\Table 5-1_Monitoring Well Groundwater Elevations LANDAU ASSOCIATES
Well ID Date Water Level Elevation
Top of Casing Elevation
Decommissioned during Fall 2009 Interim Action
MW-9 3/30/2009 37.40 38.724/28/2009 37.34 38.728/27/2009 36.82 38.72
Decommissioned during Fall 2009 Interim Action
MW-10 3/30/2009 33.62 49.354/28/2009 33.24 49.35
Decommissioned during Fall 2009 Interim Action
MW-11D 3/30/2009 36.16 49.884/10/2009 36.10 49.884/28/2009 36.11 49.88
Decommissioned during Fall 2009 Interim Action
MW-11S 3/30/2009 36.03 49.784/14/2009 40.09 49.784/28/2009 39.85 49.78
Decommissioned during Fall 2009 Interim Action
MW-12 3/30/2009 38.53 50.634/14/2009 38.94 50.634/28/2009 38.59 50.634/30/2009 38.39 50.635/8/2009 38.90 50.635/18/2009 39.00 50.636/30/2009 37.91 50.638/23/2009 37.26 50.63
Decommissioned during Fall 2009 Interim Action
MW-13 4/10/2009 19.40 59.214/28/2009 19.57 59.215/1/2009 19.54 59.215/5/2010 20.60 59.217/21/2010 19.87 59.2111/2/2010 19.79 59.211/27/2011 20.41 59.214/21/2011 20.48 59.217/1/2011 21.15 59.21
10/18/2011 19.69 59.211/9/2012 19.91 59.214/11/2012 20.39 59.217/3/2012 20.41 59.219/7/2012 19.71 59.2110/9/2012 19.51 59.21
12/20/2012 20.11 59.211/15/2013 20.71 59.213/21/2013 20.16 59.214/2/2013 20.03 59.214/11/2013 20.13 59.216/18/2013 20.01 59.216/21/2013 20.01 59.21

TABLE 5-1REMEDIAL INVESTIGATION GROUNDWATER ELEVATIONS SUMMARY
SAURO'S PROPERTY RI/FSTACOMA, WASHINGTON
Table 5-1Page 6 of 8
5/14/2014Y:\094\048.012\R\RIFS\Tables\Section 5.0\Table 5-1_Monitoring Well Groundwater Elevations LANDAU ASSOCIATES
Well ID Date Water Level Elevation
Top of Casing Elevation
9/9/2013 19.61 59.219/10/2013 19.54 59.2111/4/2013 23.14 59.21
RNS-MW2 3/30/2009 37.30 52.414/14/2009 37.49 52.414/28/2009 37.46 52.414/29/2009 37.46 52.415/5/2010 33.77 52.417/21/2010 33.13 52.4111/2/2010 31.76 52.411/27/2011 35.62 52.414/21/2011 35.45 52.414/21/2011 35.45 52.417/1/2011 34.99 52.417/1/2011 34.99 52.41
10/18/2011 34.11 52.4110/18/2011 34.11 52.41
1/9/2012 34.59 52.411/9/2012 34.59 52.414/11/2012 36.19 52.414/11/2012 36.19 52.417/3/2012 35.56 52.419/7/2012 33.51 52.4110/9/2012 33.61 52.41
12/19/2012 36.61 52.411/15/2013 36.41 52.413/21/2013 36.46 52.414/2/2013 35.97 52.414/11/2013 36.59 52.416/18/2013 35.60 52.416/20/2013 35.51 52.419/9/2013 35.17 52.419/10/2013 35.17 52.4111/4/2013 35.51 52.41
RNS-MW3 4/14/2009 26.21 35.84/28/2009 26.17 35.84/29/2009 25.83 35.87/21/2010 26.24 35.83/21/2013 25.99 35.89/12/2013 24.85 35.811/4/2013 25.33 35.8
RNS-MW4 4/14/2009 21.44 39.004/28/2009 21.43 39.004/29/2009 21.18 39.007/21/2010 21.12 39.003/21/2013 21.89 39.009/12/2013 21.05 39.0011/4/2013 21.41 39.00
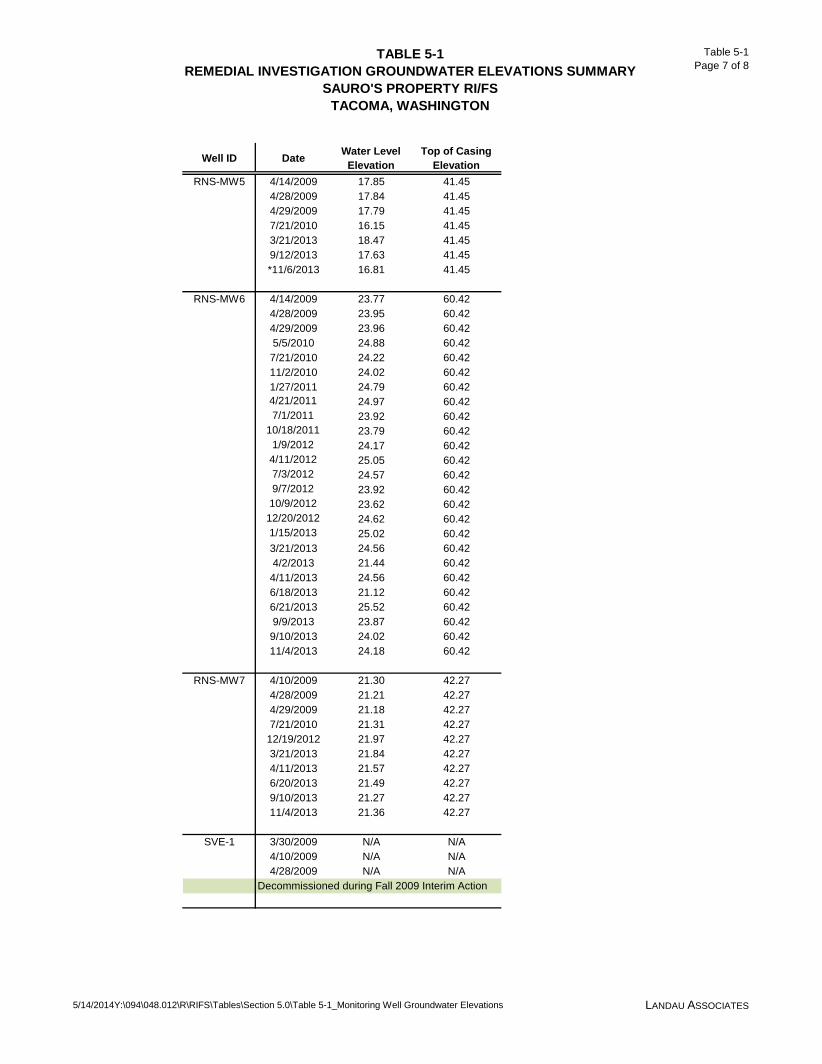
TABLE 5-1REMEDIAL INVESTIGATION GROUNDWATER ELEVATIONS SUMMARY
SAURO'S PROPERTY RI/FSTACOMA, WASHINGTON
Table 5-1Page 7 of 8
5/14/2014Y:\094\048.012\R\RIFS\Tables\Section 5.0\Table 5-1_Monitoring Well Groundwater Elevations LANDAU ASSOCIATES
Well ID Date Water Level Elevation
Top of Casing Elevation
RNS-MW5 4/14/2009 17.85 41.454/28/2009 17.84 41.454/29/2009 17.79 41.457/21/2010 16.15 41.453/21/2013 18.47 41.459/12/2013 17.63 41.45*11/6/2013 16.81 41.45
RNS-MW6 4/14/2009 23.77 60.424/28/2009 23.95 60.424/29/2009 23.96 60.425/5/2010 24.88 60.427/21/2010 24.22 60.4211/2/2010 24.02 60.421/27/2011 24.79 60.424/21/2011 24.97 60.427/1/2011 23.92 60.42
10/18/2011 23.79 60.421/9/2012 24.17 60.424/11/2012 25.05 60.427/3/2012 24.57 60.429/7/2012 23.92 60.4210/9/2012 23.62 60.42
12/20/2012 24.62 60.421/15/2013 25.02 60.423/21/2013 24.56 60.424/2/2013 21.44 60.424/11/2013 24.56 60.426/18/2013 21.12 60.426/21/2013 25.52 60.429/9/2013 23.87 60.429/10/2013 24.02 60.4211/4/2013 24.18 60.42
RNS-MW7 4/10/2009 21.30 42.274/28/2009 21.21 42.274/29/2009 21.18 42.277/21/2010 21.31 42.27
12/19/2012 21.97 42.273/21/2013 21.84 42.274/11/2013 21.57 42.276/20/2013 21.49 42.279/10/2013 21.27 42.2711/4/2013 21.36 42.27
SVE-1 3/30/2009 N/A N/A4/10/2009 N/A N/A4/28/2009 N/A N/A
Decommissioned during Fall 2009 Interim Action

TABLE 5-1REMEDIAL INVESTIGATION GROUNDWATER ELEVATIONS SUMMARY
SAURO'S PROPERTY RI/FSTACOMA, WASHINGTON
Table 5-1Page 8 of 8
5/14/2014Y:\094\048.012\R\RIFS\Tables\Section 5.0\Table 5-1_Monitoring Well Groundwater Elevations LANDAU ASSOCIATES
Well ID Date Water Level Elevation
Top of Casing Elevation
MW-JS 6/4/2013 2.80 13.9110/1/2013 3.69 13.9111/4/2013 2.83 13.91
MW-JS2 9/12/2013 5.66 12.5610/1/2013 3.29 12.5611/4/2013 2.62 12.56
Note:
* RNS-MW5 depth to water was measured by the City of Tacoma on November 4, 2013, but the result was erroneous, so the well was remeasured on November 6, 2013 by Landau Associates.

TABLE 5-2REMEDIAL INVESTIGATION QUARTERLY SAMPLING LOCATIONS, DEPTHS, AND METHODS
SAURO'S PROPERTY RI/FSTACOMA, WASHINGTON
Table 5-2Page 1 of 1
5/15/2014Y:\094\048.012\R\RIFS\Tables\Section 5.0\Table 5-2_Current wells and equip LANDAU ASSOCIATES
Location VOCs Sampling Depth (ft)VOCs Concentration Data Sample Method
MNA ParametersSampling Depth (ft) (c)
MNA Parameters Sample Method
LAI-MW1 63 PDB 63 WAT
LAI-MW2 65 PDB 65 WAT
LAI-MW3 75 PDB 75 WAT
LAI-MW4 25 PDB 25 WAT
LAI-MW5 42 PDBLAI-MW5 50 PDB
MW1-PP 18(b) PP 18(b) PP
MW2-PP 15(b) PP 15(b) PP
MW13 51.5 PDB 51.5 WAT
RNS-MW2 21.5 PDBRNS-MW2 38.5 PDB
RNS-MW6 42.5 PDBRNS-MW6 52.5 PDB
RNS-MW7(a) NS NS 41 WAT
Sample Methods: PP = peristaltic pump w/dedicated tubing PDB = permeable diffusion bag WAT = (dedicated) Waterra foot valve (w/dedicated tubing 5/8" HDPE tubing)
(a) Only sampled for MNA parameters(b) It is assumed that the bottom of the installed dedicated tubing is located at the middle of the well screen(c) For wells with two VOC sampling depths (RNS-MW2, RNS-MW6, and LAI-MW5), the MNA sampling depth is the mid-point between the two VOC sampling depths
46
30
47.5
WAT
WAT
WAT

TABLE 5-3REMEDIAL INVESTIGATION QUARTERLY SAMPLING LABORATORY AND FIELD PARAMETER DETAILS
SAURO'S PROPERTY RI/FSTACOMA, WASHINGTON
Table 5-3Page 1 of 1
5/14/2014Y:\094\048.012\R\RIFS\Tables\Section 5.0\Table 5-3_Lab and field parameters LANDAU ASSOCIATES
Groundwater Analytical Parameters EPA Analytical Method Practical Quantitation Limit Preservation Maximum Holding Time (Days)
Volatile Organic Compounds (VOCs) (a)
Tetrachloroethene 8260C 0.2 µg/L Add HCl to pH<2;Store cool at 6°C 14
Trichloroethene 8260C 0.2 µg/L Add HCl to pH<2;Store cool at 6°C 14
cis-1,2-Dichloroethene 8260C 0.2 µg/L Add HCl to pH<2;Store cool at 6°C 14
Vinyl Chloride 8260C 0.2 µg/L Add HCl to pH<2;Store cool at 6°C 14
Monitored Natural Attenuation (MNA) (b)
Chloride SM 4500-CL-E 1.0 mg/L Store cool at 6°C 28
Nitrate (NO3) (Total) as N 353.2 0.010 mg/L Store cool at 6°C 48 hours
Nitrite (NO2) (Total) as N 353.2 0.0100 mg/L Store cool at 6°C 48 hours
Total Organic Carbon (TOC) SM 5310B 1.00 mg/LAdd 2mL 9N H2SO4
pH<2;Store at 6°C
28
Sulfate (SO4) (Total) SM 4500-SO4 E 5.0 mg/L Store cool at 6°C 28
Sulfide (SO2) (Total) SM 4500-S2 D 0.150 mg/L Store cool at 6°C 7
MEEA (c) RSK 175 0.0050 mg/L Store cool at 6°C 14
Groundwater Field Parameters Data Collection Method Instrument Units
Monitored Natural Attenuation (MNA) (b)
Conductivity Field YSI (b) µS/cm
Dissolved Oxygen (DO) Field YSI mg/L
Oxidation Reduction Potential (ORP) Field YSI units +/- mV
pH Field YSI unitless
Temperature Field YSI (°F)
Ferrous Iron (Fe2+) (d) Field Hach Kit mg/L
Turbidity Field Turbidity Meter NTU
Water Level (e)(f) Field Water Level Indicator 0.01 foot
(a) VOC samples are collected at the following 10 well locations: MW-1, MW-2, MW-13, LAI-MW1, LAI-MW2, LAI-MW3, LAI-MW4, LAI-MW5, RNS-MW2, and RNS-MW6.(b) MNA analytical samples and field parameters are collected at the following 11 well locations: MW-1, MW-2, MW-13, LAI-MW1, LAI-MW2, LAI-MW3, LAI-MW4, LAI-MW5, RNS-MW2, RNS-MW6, and RNS-MW7.(c) Analysis run by Test America; all others by the City of Tacoma's environmental lab(d) YSI shall be recalibrated daily(e) Water levels are collected at all wells during sampling. (f) Each quarter during the VOC or MNA sampling events, water levels will be collected at all 15 well locations. The four well locations that are not sampled but require water level collection include: MW-3, RNS-MW3, RNS-MW4, and RNS-MW5.

8/29/14 Y:\094\048.012\R\RIFS\RI-FS__FINAL.docx LANDAU ASSOCIATES 6-1
6.0 REMEDIAL INVESTIGATION RESULTS
This section presents the results of RI activities, discusses the nature and extent of contamination,
and summarizes contaminant fate and transport. RI data results are screened using the preliminary SLs
presented in Section 4.0. Available RI analytical reports are provided as Appendix J.
6.1 SOIL QUALITY A considerable amount of VOC soil concentration data exist for the Sauro’s property from
previous investigations, RI investigations, and the 2009 interim action (which was presented in Section
3.0). In almost all cases, PCE is the chlorinated VOC compound detected at the highest concentration.
Other VOCs that are detected frequently (greater than 30 percent of the time) in soil are TCE, cis-1,2-
DCE, and acetone18. The occurrence of TCE and cis-1,2-DCE is attributed to in situ reductive
dechlorination of PCE. In some cases, typically above the groundwater table, only the parent compound
PCE was detected in soil. During the interim action described in Section 3.0 of this report, all soil above
the groundwater table was removed. Table 6-1 presents a statistical summary of VOC compounds
detected in soil at the property by Landau Associates (borings, hand augers, stockpile samples, and
confirmation samples). Table 6-2 presents RI boring and hand auger soil data collected by Landau
Associates.
6.2 DAVITA DRAIN AND OUTFALL WATER QUALITY The VOC plume of concern along the DaVita drain, conveyance piping, and the downstream
outfall is the secondary plume. Samples were collected during the rainy season (April 2009) and the dry
season (August 2009), with Ecology’s concurrence (Coleman, M. 2009). Results were compared to
surface water SLs representative of marine surface water applicable or relevant and appropriate
requirements (ARARs). The results and SLs are presented in Table 6-3.
In April 2009, PCE (3.8 µg/L), TCE (5.6 µg/L), cis-1,2-DCE (25 µg/L), and VC (13 µg/L) was
detected in the drain; cis-1,2-DCE (0.4 µg/L) was also detected at the outfall. The PCE and VC detections
in the drain sample exceeded marine surface water ARARs of 3.3 µg/L and 2.4 µg/L, respectively. In
August 2009, PCE (1.2 µg/L), TCE (2.8 µg/L), cis-1,2-DCE (50 µg/L), and VC (36 µg/L) were detected
in the drain sample; cis-1,2-DCE (0.9 µg/L) and VC (0.3 µg/L) were detected at the outfall. Only the VC
detection in the drain sample exceeded marine surface water ARARs (2.4 µg/L for VC).
18 Acetone is not a chlorinated VOC. It occurs as a byproduct of reductive dechlorination of PCE. It is not a persistent chemical
and biodegrades relatively quickly.

8/29/14 Y:\094\048.012\R\RIFS\RI-FS__FINAL.docx LANDAU ASSOCIATES 6-2
These results suggest that the DaVita drain captures contaminated groundwater from the
secondary plume. The decrease in VOC concentrations from the drain to the outfall is likely due to
dilution and mixing as the water travels from the drain to the outfall. Ultimately, the concentrations of
VOCs (cis-1,2-DCE and VC) at the outfall were well below applicable marine surface water ARARs19.
Furthermore, these data were collected prior to the interim action when the secondary plume was larger
and had higher concentrations. Since these samples were collected, the interim action was completed and
the secondary plume has been substantially reduced.
6.3 VAPOR INTRUSION ASSESSMENT RESULTS The VI assessment conducted in 2009 involved evaluating potential future development scenarios
at two neighboring properties using the J&E model. The air exchange rate was the largest single factor
that affected the model results. Enclosed parking structures require air exchange rates of 1.5 cubic feet
per minute per square foot (cfm/sf), which equates to approximately 10 air exchanges per hour for a
structure with 9 ft ceiling heights. Given the ventilation requirements, the model found that VI would not
cause an elevated health risk for workers in the modeled developed scenario. Therefore, no additional
active treatment or engineering controls are needed for the proposed development scenario. During the
design process, designers should be informed of the design considerations for elevator shafts and of the
ventilation rates mentioned above. Additionally, designers should verify with the manufacturer that the
waterproof coatings for submerged portions of any building are compatible with low concentrations of
dissolved VOCs.
A technical memorandum detailing this VI assessment was submitted to Ecology (Landau
Associates 2009e). Ecology subsequently approved the assessment (Ecology 2009c). However, if
development proposals for the adjacent properties change and structures other than parking garages are
proposed at or below ground level, VI should be re-evaluated. A copy of the memo detailing the VI study
and the Ecology response letter are included in Appendix K.
Vapor intrusion was also assessed in 2013 pertaining to the portion of Dock Street located
downgradient of the Site. These results are presented in Section 6.4.1.
6.4 GROUNDWATER QUALITY The following three sections discuss the VOC results from direct-push sampling, VOC results
from monitoring wells, and MNA results from monitoring wells.
19 The applicable VC marine surface water ARAR is 2.4 µg/L. There is no established marine surface water ARAR for cis-1,2-
DCE at this time (Ecology website 2014b).

8/29/14 Y:\094\048.012\R\RIFS\RI-FS__FINAL.docx LANDAU ASSOCIATES 6-3
6.4.1 DOCK STREET DIRECT-PUSH INVESTIGATION RESULTS Five additional borings (LAI-B6, LAI-B7, LAI-B8, LAI-B9, and LAI-B10) were conducted along
Dock Street. Borehole samples were collected at the water table and at the bottom of the boring (less than
30 ft BGS). The Dock Street direct-push results are presented in Table 6-4.
Samples were collected at the top of the water for a VI Tier I screening assessment in accordance
with Ecology’s draft VI guidance document (Ecology 2009b). None of the COCs were detected.
Therefore, VI related to the Sauro’s property does not appear to be a risk along Dock Street.
Samples collected at the bottom of the boring represent the approximate depth interval that has
been monitored at LAI-MW4 throughout the RI. These results were screened against MTCA Method A
groundwater CULs and MTCA Method B groundwater CULs protective of marine surface water (Table
6-4). Between the two, the MTCA Method B values are considered more applicable along Dock Street
since groundwater and surface water interact along the tidal zone, whereas groundwater is not consumed
nor likely to be consumed along Dock Street (discussed further for entire Site in Section 7.0). With the
exception of VC, the MTCA Method B groundwater CULs are more conservative. VC was detected at
one boring (LAI-B7) at a concentration of 0.6 µg/L, which is just above the MTCA Method A
groundwater CUL but below the MTCA Method B groundwater CUL. Low-level detections of PCE (0.2
µg/L), TCE (0.4 µ/L), and cis-1,2-DCE (5.8 µg/L) were found at LAI-B10, but were below MTCA
Method B20 groundwater CULs.
The VC detection at LAI-B7 is somewhat of an anomaly. LAI-B7 is located between LAI-B6
and LAI-B8, which did not detect VC (or any of the COCs). Furthermore, recent VC data from well LAI-
MW4 and non-project wells MW-JS and MW-JS2 have not detected VC; LAI-MW4 has been sampled
quarterly since 2010 and MW-JS and MW-JS2 were each sampled once in 2013. Historically,
concentrations of VC at 0.6 µg/L or slightly more elevated have been detected at LAI-MW4 in 2008
(before the interim action; 0.6 µg/L) and once since the interim action (July 2012; 2.0 µg/L). Therefore,
the detection of VC at LAI-B7 may not relate to the Site and is not considered significant.
The low-level detections of PCE, TCE, and cis-1,2-DCE detected at LAI-B10 do not appear to be
related to the Site. The most notable aspect of the detections at LAI-B10 is that parent compound, PCE
was detected. PCE was not detected at any of the other borings along Dock Street, MW-JS, or MW-JS2,
and has not been detected at LAI-MW4 since January 2012. LAI-MW4 was first sampled in May 2008.
The history of PCE detections at LAI-MW4 shows that PCE was not found at the well until April 2011
and was back to non-detect by April 2012. Since the detection at LAI-B10 appears to be unrelated to the
Site, historical operations within the vicinity of LAI-B10 along Dock Street were reviewed. Background
20 The MTCA Method B groundwater CULs chosen for comparison are protective of marine surface water.

8/29/14 Y:\094\048.012\R\RIFS\RI-FS__FINAL.docx LANDAU ASSOCIATES 6-4
information documented in a draft cleanup action plan for the Thea Foss upland properties indicate that
historical operations near LAI-B10 included (but were not limited to) a steam plant, and a company called
Coast Iron Works (Hart Crowser 2005). Additionally, historical leaking USTs have been identified by
Ecology (Coleman 2014a) and the City, and there is a sanitary sewer line that runs along Dock Street.
The source of PCE could be related to these historical operations and features. Therefore, detections at
LAI-B10 appear to be due to a chemical release unrelated to the Site.
The results of the direct-push investigation were presented to and discussed with Ecology on
January 30, 2014. In accordance with the direct-push work plan (Landau Associates 2013a), the results
were discussed to evaluate if an additional well is needed along Dock Street to serve as a downgradient
well. Following the meeting, Ecology provided confirmation that well LAI-MW4 can continue to be used
as the representative well for the downgradient extent of the plume (Coleman 2014b)
6.4.2 GROUNDWATER MONITORING VOLATILE ORGANIC COMPOUND RESULTS Constituents of concern include PCE, TCE, cis-1,2-DCE, and VC. A concentration summary
table for these four constituents is provided as Table 6-5. The constituents of concern were screened
using the preliminary groundwater SLs defined in Section 4.0. Laboratory reports are presented in
Appendix J.
6.4.2.1 Plume Extent
The extents of the VOC plumes have decreased since the beginning of the RI. The secondary
plume is essentially gone, with relatively minor detections of PCE at RNS-MW2 at the border of the
former Sauro’s property. The estimated extent of the primary plume has shrunk for all four constituents
of concern. Maps showing the historical extent (from Phase 2) and current extent (from September 2013)
of the primary and secondary VOC plumes are provided as Figures 6-1a through 6-1d for PCE, TCE, cis-
1,2-DCE, and VC.
Figures showing the approximate vertical extent of PCE, TCE, cis-1,2-DCE, and VC
representative of the most recent data (September 2013) are provided as Figures 6-2a through 6-2d. The
orientation of the primary plume depicted on these figures runs west-to-east along the axis of the plume,
extending from Pacific Avenue by the former Sauro’s property down to Dock Street.
6.4.2.2 Concentration Trends – Primary Plume
The primary PCE plume is defined mainly by four wells: RNS-MW6, MW-13, LAI-MW2, and
LAI-MW3. With the exception of RNS-MW6, PCE concentration trends appear to be slowly decreasing
since the interim action in 2010. PCE concentration trends for these wells and downgradient well LAI-

8/29/14 Y:\094\048.012\R\RIFS\RI-FS__FINAL.docx LANDAU ASSOCIATES 6-5
MW4 are shown on Figure 6-3a. TCE and cis-1,2-DCE also occur at these wells at approximate
concentrations of between 2 and 6 times less than the PCE concentration, but have similar concentration
trends to PCE. TCE and cis-1,2-DCE concentration trends are shown on Figure 6-3b and 6-3c,
respectively. The laboratory PQL has varied throughout the RI monitoring period and often was greater
than expected VC concentrations. Therefore, concentration trends for VC are not as easy to interpret as
the prior three VOCs of concern. The VC concentration trend is shown on Figure 6-3d.
Well RNS-MW6 defines the upgradient extent of the primary PCE plume and is located just
northeast of the former Sauro’s property. This well has two PDBs installed in a 20 ft screen. VOC
concentrations in both PDBs have been variable throughout the RI monitoring period. Time series
concentration data for RNS-MW6 is shown on Figure 6-4a.
Well MW-13 is located downgradient to the northeast of RNS-MW6. PCE concentrations at
MW-13 have been relatively steady since the 2010 interim action. TCE and cis-1,2-DCE concentrations
show a slow but consistent declining trend. Time series concentration data for MW-13 is shown on
Figure 6-4b.
LAI-MW2 is located southeast of MW-13. PCE concentrations at LAI-MW2 have also been
relatively steady since the interim action was implemented with the exception of an anomalous
concentration decline in April 2012. TCE and cis-1,2-DCE concentrations appear to be declining slowly.
Time series concentration data for LAI-MW2 is shown on Figure 6-4c.
LAI-MW3 is located northeast of LAI-MW2 at the eastern edge of downtown Tacoma along A
Street and within a City park (Locomotive Park). PCE concentrations at this well are similar to trends at
LAI-MW2. Time series concentration data for LAI-MW3 is shown on Figure 6-4d.
LAI-MW4 is located east of LAI-MW3 near the Thea Foss Waterway. PCE concentrations at
this well have generally declined since PCE was first detected in October 2010 and have been below
laboratory reporting limits for the last eight sampling events. TCE and VC were occasionally detected
before and since the interim action, but neither has been detected since July 2012. Cis-1,2-DCE has been
detected consistently since it was installed at low concentrations. VOCs have been intermittently detected
at this well at very low concentrations. Time series concentration data is shown on Figure 6-4e.
6.4.2.3 Concentration Trends – Secondary Plume
Since the interim action, the secondary PCE plume is defined mainly by two wells: RNS-MW2
and MW-2. Well RNS-MW2 defines the upgradient extent of the secondary PCE plume and is located
just southeast of the former Sauro’s property. VOC concentrations are relatively low-level detections (10
µg/L or less), and have been variable since the interim action. PCE, TCE, and cis-1,2-DCE concentration
trends for RNS-MW2 are shown on Figure 6-5a.

8/29/14 Y:\094\048.012\R\RIFS\RI-FS__FINAL.docx LANDAU ASSOCIATES 6-6
Well MW-2 is located just downgradient of RNS-MW2. An initial spike in VOC concentrations
occurred after the interim action, but concentration trends have steadily decreased since. PCE, TCE, and
cis-1,2-DCE concentration trends for MW-2 are shown on Figure 6-5b.
6.4.3 MONITORED NATURAL ATTENUATION PARAMETERS MNA parameters were evaluated using Ecology’s guidance document Guidance on Remediation
of Petroleum-Contaminated Ground Water by Natural Attenuation (Ecology website 2005) and EPA’s
guidance Technical Protocol for Evaluating Natural Attenuation of Chlorinated Solvents in Groundwater
(EPA 1998). Sampling locations and MNA parameter results for the September 2013 (most recent)
sampling event are presented on Figure 6-6. MNA parameter results for all five quarters (and the initial
April 2009 sampling) are presented in Table 6-6.
In accordance with Ecology’s guidance, monitoring locations were designated into one of the
following categories:
• Source area
• Plume centerline
• Downgradient
• Background.
A true background well is not present within the project area, so a cross-gradient well where
chlorinated solvent VOC detections have not occurred was selected (RNS-MW7). LAI-MW5 is
designated the source area well, LAI-MW4 is designated the primary plume downgradient well), and
MW-1 is designated the secondary plume centerline well.
The MNA results were further evaluated based on the EPA MNA scoring guidelines (EPA 1998).
The scores represent the likelihood that biodegradation is occurring at a given well (EPA 1998). From the
EPA MNA scoring guidelines Table 2.4, the MNA scoring interpretation categories (and numerical
ranges) are as follows: strong evidence (>20), adequate evidence (15 to 20), limited evidence (6 to 14), or
inadequate evidence (0 to 5). The results from each well for all five quarters are summarized in Table 6-7
and the average scoring interpretation category per well and the current extent of the Site is shown on
Figure 6-7. To demonstrate the scoring process, a copy of Table 2.3 and Table 2.4 from the EPA MNA
scoring guidelines are provided with the Sauro’s scoring sheets from the most recent event (third quarter
2013) in Appendix L.
Summary Table 6-7 illustrates a number of details and findings. The table lists the quarterly
MNA wells, which plume(s) they monitor, where the well is located with respect to the plume, score and
interpretation, average score over the monitoring period and associated interpretation, and identification
of which wells are within the Site. Most wells earned the same interpretation for all five quarters,
8/29/14 Y:\094\048.012\R\RIFS\RI-FS__FINAL.docx LANDAU ASSOCIATES 6-7
indicating stable conditions; this correlates with the stable nature of the plume observed during the VOC
sampling events from the same five quarters. The wells that did not have the same interpretation were
wells MW-1 and MW-2, and LAI-MW4. MW-1 and MW-2 both earned the interpretation “inadequate”
for the first sampling event in September 2012, but earned “limited” all other events. The reason for the
low score during the first event was that there was insufficient groundwater available at the well during
sampling to allow for collection of all samples and to operate the water quality meter (YSI). LAI-MW4
earned an interpretation of “adequate” during the first sampling event, and earned “limited” during the
remainder of events. The difference between the first and the remainder of the events at LAI-MW4 is that
during the first event, the following conditions were present: 1) VC was detected during the first event,
which earns points for the numeric score as it is a daughter product of PCE and therefore, shows
biodegradation; and 2) the total organic carbon concentration was relatively high, which represents the
presence of an energy source that drives dechlorination (EPA 1998).
The highest numeric score achieved for any well was 17 at well LAI-MW4, which is the well that
received an interpretation of “adequate.” The subsequent scores at this well were within the upper limits
of the “limited” interpretation, nearly earning “adequate.” Given that LAI-MW4 is the primary plume’s
downgradient well (or sentinel well), scoring highest at this location is both significant and promising
from a remedy standpoint.
Wells located outside of the Site (RNS-MW2, MW-2, MW-1, RNS-MW7, and LAI-MW1)
scored as having inadequate evidence that biodegradation is occurring. This interpretation of inadequate
generally corresponds to one or two aspects: 1) some of these wells did not have adequate water during
sampling and therefore, the full set of MNA parameters could not be collected, which unfavorably
impacts the well’s final score; and 2) PCE breakdown products are not generally found at these wells (nor
is PCE), or are below MTCA Method A CULs at these wells (thus outside of Site), which limits the
scoring potential since breakdown products cis-1,2-DCE and VC earn points. However, since these wells
are outside the current extent of the Site and are generally associated with the secondary plume (which
has essentially diminished to the former property boundary), these low scores should not impact MNA’s
potential to be an effective component of a long-term remedy for the Site.
Wells located within the Site (RNS-MW6, MW-13, LAI-MW2, and LAI-MW3) and at the source
area (LAI-MW5) show limited evidence that biodegradation is occurring. Confirmation that some
biodegradation is occurring within the Site is important and supports MNA as a component of a long-term
remedy for the Site. MNA as a component of the final remedy is discussed further in Sections 8.0 through
11.0.

8/29/14 Y:\094\048.012\R\RIFS\RI-FS__FINAL.docx LANDAU ASSOCIATES 6-8
6.5 CONTAMINANT FATE AND TRANSPORT Both the primary and secondary plumes originate near or in the vicinity of the former Sauro’s
property. The primary plume flows from near the northeast property boundary to the east; this plume
occurs almost completely in dense to very dense glacial or glacially consolidated soil. The secondary
plume (largely diminished) was historically oriented from the former sump towards the southeast along
the former gulch alignment. This plume occurs largely in soil deposits used to fill the former gulch. The
source of both plumes is assumed to be releases from historical dry cleaning operations at the Site.
Contaminant migration occurs through advection. Contaminants are attenuated in both plumes through
biodegradation, adsorption and dispersion.
The source of the primary plume from the Sauro’s property appears to be addressed.
Contaminated soil was removed in the interim action and the well directly downgradient of the property,
LAI-MW5 is clean or has very low concentrations. The highest plume concentrations actually occurs
downgradient of LAI-MW5 at well RNS-MW6. The location of this well (downgradient of the property)
suggests that there may have been a release beyond the property boundary, either through a historical
sewer connection or an offsite source. Groundwater concentrations in the primary plume are attenuating
very slowly. Attenuation is occurring through reductive dechlorination, dispersion and advection. These
processes appear to have caused the concentrations to reach conditions where the plume is no longer
expanding but starting to shrink. Spatial and time series data trends indicate that the maximum extent of
the primary plume never reached the Thea Foss waterway. Primary plume total ethenes concentration
trends are shown on Figure 6-8a.
The source of the secondary plume was largely removed during the interim action. Reductive
dechlorination appears to be a stronger process in the secondary plume presumably due to higher levels of
organic material in the non-native soil used to fill the gulch. The secondary plume has largely dissipated
due to source control measures and natural attenuation processes. Secondary plume total ethenes
concentration trends are shown on Figure 6-8b.

&<
&<
&<
&<
&<
&<
&<
&<
&<&<
&<
&<
&<
&<
&<
&<
&<
!>
!>
!>
!>
Pre-RI PCE Plume
LAI-MW1<0.2 (09/13) at 63'
LAI-MW378 (09/13) at 75'
LAI-MW2360 (09/13) at 65'
MW-13430 (09/13) at 51.5'
RNS-MW61100 (09/13) at 42.5'630 (09/13) at 52.5'
MW-3
RNS-MW222 (09/13) at 21.5'23 (09/13) at 38.5'
MW-20.7 (09/13)
MW-1<0.2 (09/13)
RNS-MW7<0.2 (7/10) at 39'
RNS-MW3<2.0 (7/10) at 18'
RNS-MW4<0.2 (4/09)
RNS-MW5<0.2 (7/10) at 39.5'
LAI-MW4<0.2 (09/13) at 25'
RAMP
I705
LAI-MW5<0.2 (09/13) at 42'0.3 (09/13) at 50'
MW-JS2<0.2 (09/13)
MW-JS<0.2 (06/13)
LAI-B10<0.2 (11/13) at 19'0.2 (11/13) at 30'
LAI-B9<0.2 (11/13) at 20'<0.2 (11/13) at 30'
LAI-B8<0.2 (11/13) at 20'<0.2 (11/13) at 25'
LAI-B7<0.2 (11/13) at 20'<0.2 (11/13) at 25'
LAI-B6<0.2 (11/13) at 20'
<0.2 (11/13) at 25.6'
RAMP
I705
A ST
REET
I705 H
WY S
PACI
FIC AV
ENUE
I705 H
WY N
COUR
T A
COMM
ERCE
STRE
ET
SOUTH 13TH STREET
RAMP
I705
DOCK
STRE
ET
SOUTH 14TH STREET
SOUTH 15TH STREETSOUTH 15TH STREETRAMP I705
8950001951
8950002070
2013050121
2013030010
8950002040
0320042033
8950001971
2014030041
2013020020
2014020020
2013050133
2013050132
2012020014
2014020010
2013020011
2013040191
8950002060
8950002050
2014030010
2014020030
2011050141 8950001961
2013040110
2013040020
2013040050
2013040090
2013040010
8950001894
8950001964
2014030020
2014030030
2011040071
2013040030
2013040040
2013040060
2013040070
2013040080
2013040100
2013040120
2013040130
2013040140
2013040150
2013040160
2013040170
2013040180
2015020010 89500018812015060011 2015040010 2015020021
2011040072
8950
0019
63
0 100 200
Scale in Feet
Data Source: Pierce County GIS
Sauro's Property RI/FSTacoma, Washington
RI Groundwater VOC PlumesMost Recent PCE Concentrations
Figure
6-1a
G:\P
roje
cts\
094\
048\
013\
014\
RIF
S 2
014\
Figu
re6-
1aG
WP
CE
_Pre
RIP
lum
es.m
xd 8
/28/
2014
Notes1. <0.2 = Not Detected in Sample2. 360 (09/13) PCE concentration in µg/L (most recent samples through November 2013).3. The preliminary cleanup level for PCE is 5.0 µg/L.4. MW-3 does not produce adequate water for sampling.5. Wells RNS-MW3, RNS-MW4, RNS-MW5, and RNS-MW7 are no longer sampled because Pre-RI sampling data indicated these wells are not impacted by VOCs.6. Depths presented represent sample collection depth below ground surface.7. MW-JS and MW-JS2 are from another project, but were each sampled once in 2013.8. Black and white reproduction of this color original may reduce its effectiveness and lead to incorrect interpretation.
Legend
Subject PropertyPre-RI PCE Plume
PCE Concentration Range (µg/L)
Location Type
!
!
!!
!
<0.20.2 - 55 - 5050 - 200>200
!> 2013 Boring&< Existing Well
Primary Plume

&<
&<
&<
&<
&<
&<
&<
&<
&<&<
&<
&<
&<
&<
&<
&<
&<
!>
!>
!>
!>
LAI-MW5<0.2 (09/13) at 42'<0.2 (09/13) at 50'
Pre-RI TCE Plume
LAI-B10<0.2 (11/13) at 19'0.4 (11/13) at 30'
LAI-B9<0.2 (11/13) at 20'<0.2 (11/13) at 30'
LAI-B8<0.2 (11/13) at 20'<0.2 (11/13) at 25'
LAI-B7<0.2 (11/13) at 20'<0.2 (11/13) at 25'
LAI-B6<0.2 (11/13) at 20'
<0.2 (11/13) at 25.6'
MW-JS2<0.2 (09/13)
MW-JS<0.2 (06/13)
I705
A ST
REET
I705 H
WY S
PACI
FIC AV
ENUE
I705 H
WY N
COUR
T A
COMM
ERCE
STRE
ET
SOUTH 13TH STREET
RAMP
RAMP
I705
DOCK
STRE
ET
RAMP
I705
SOUTH 14TH STREET
SOUTH 15TH STREETSOUTH 15TH STREETRAMP I705
LAI-MW2120 (09/13) at 65'
LAI-MW1<0.2 (09/13) at 63'
LAI-MW334 (09/13) at 75'
LAI-MW4<0.2 (09/13) at 25'
MW-13110 (09/13) at 51.5'
RNS MW-3<2.0 (7/10) at 18'
RNS MW-20.8 (09/13) at 21.5'0.7 (09/13) at 38.5'
RNS MW-4<0.2 (04/09) at 39'
RNS MW-5<0.2 (7/10) at 39.5'
RNS MW-6260 (09/13) at 42.5'130 (09/13) at 52.5'
RNS MW-7<0.2 (7/10) at 39'
MW-1-PP<0.2 (09/13)
MW-2-PP0.6 (09/13)
MW-3
8950001951
8950002070
2013050121
2013030010
8950002040
0320042033
8950001971
2014030041
2013020020
2014020020
2013050133
2013050132
2012020014
2014020010
2013020011
2013040191
8950002060
8950002050
2014030010
2014020030
2013040110
2011050141 8950001961
2013040020
2013040050
2013040090
2013040010
8950001894
8950001964
2014030020
2014030030
2011040071
2013040030
2013040040
2013040060
2013040070
2013040080
2013040100
2013040120
2013040130
2013040140
2013040150
2013040160
2013040170
2013040180
2015020010 89500018812015060011 2015040010 2015020021
2011040072
8950
0019
63
0 100 200
Scale in Feet
Data Source: Pierce County GIS
Sauro's Property RI/FSTacoma, Washington
RI Groundwater VOC PlumesMost Recent TCE Concentrations
Figure
6-1b
G:\P
roje
cts\
094\
048\
013\
014\
RIF
S 2
014\
Figu
re6-
1bG
WTC
E_P
reR
IPlu
mes
.mxd
8/2
8/20
14
Subject PropertyPre-RI TCE Plume
Notes1. <0.2 = Not Detected in Sample2. <0.5 (09/13) TCE concentration in µg/L (most recent samples through November 2013).3. The preliminary cleanup level for TCE is 5.0 µg/L.4. MW-3 does not produce adequate water for sampling.5. Wells RNS-MW3, RNS-MW4, RNS-MW5, and RNS-MW7 are no longer sampled because Pre-RI sampling data indicated these wells are not impacted by VOCs.6. Depths presented represent sample collection depth below ground surface.7. MW-JS and MW-JS2 are from another project, but were each sampled once in 2013.8. Black and white reproduction of this color original may reduce its effectiveness and lead to incorrect interpretation.
LegendTCE Concentration Range (µg/L)
Location Type&< Existing Well
!
!
!!
<0.20.2 - 55 - 5050 - 200>200!
!> 2013 Boring
Primary Plume

&<
&<
&<
&<
&<
&<
&<
&<
&<&<
&<
&<
&<
&<
&<
&<
&<
!>
!>
!>
!>
LAI-MW5<0.2 (09/13) at 42'<0.2 (09/13) at 50'
Pre-RI Cis-1,2-DCE Plume
LAI-B10<0.2 (11/13) at 19'5.8 (11/13) at 30'
LAI-B9<0.2 (11/13) at 20'<0.2 (11/13) at 30'
LAI-B8<0.2 (11/13) at 20'<0.2 (11/13) at 25'
LAI-B7<0.2 (11/13) at 20'<0.2 (11/13) at 25'
LAI-B6<0.2 (11/13) at 20'
<0.2 (11/13) at 25.6'
MW-JS2<0.2 (09/13)
MW-JS<0.2 (06/13)
I705
A ST
REET
I705 H
WY S
PACI
FIC AV
ENUE
I705 H
WY N
COUR
T A
COMM
ERCE
STRE
ET
SOUTH 13TH STREET
RAMP
RAMP
I705
DOCK
STRE
ET
RAMP
I705
SOUTH 14TH STREET
SOUTH 15TH STREETSOUTH 15TH STREETRAMP I705
LAI-MW2160 (09/13) at 65'
LAI-MW1<0.2 (09/13) at 63'
LAI-MW354 (09/13) at 75'
LAI-MW40.6 (09/13) at 25'
MW-13120 (09/13) at 51.5'
RNS MW-3<2.0 (7/10) at 18'
RNS MW-20.3 (09/13) at 21.5'0.2 (09/13) at 38.5'
RNS MW-4<0.2 (04/09) at 39'
RNS MW-5<0.2 (7/10) at 39.5'
RNS MW-6130 (09/13) at 42.5'140 (09/13) at 52.5'
RNS MW-7<0.2 (7/10) at 39'
MW-1-PP0.5 (09/13)
MW-2-PP1.4 (09/13)
MW-3
8950001951
8950002070
2013050121
2013030010
8950002040
0320042033
8950001971
2014030041
2013020020
2014020020
2013050133
2013050132
2012020014
2014020010
2013020011
2013040191
8950002060
8950002050
2014030010
2014020030
2013040110
2011050141 8950001961
2013040020
2013040050
2013040090
2013040010
8950001894
8950001964
2014030020
2014030030
2011040071
2013040030
2013040040
2013040060
2013040070
2013040080
2013040100
2013040120
2013040130
2013040140
2013040150
2013040160
2013040170
2013040180
2015020010 89500018812015060011 2015040010 2015020021
2011040072
8950
0019
63
0 100 200
Scale in Feet
Data Source: Pierce County GIS
Sauro's Property RI/FSTacoma, Washington
RI Groundwater VOC PlumesMost Recent cis-1,2-DCE
ConcentrationsFigure
6-1c
G:\P
roje
cts\
094\
048\
013\
014\
RIF
S 2
014\
Figu
re6-
1cG
WD
CE
_Pre
RIP
lum
es.m
xd 8
/28/
2014
Subject PropertyPre-RI Cis-1,2-DCE Plume
Notes1. <0.2 = Not Detected in Sample2. <0.2 (09/13) Cis-1,2-DCE concentration in µg/L (most recent samples through November 2013).3. The preliminary cleanup level for Cis-1,2-DCE is 70 µg/L.4. MW-3 does not produce adequate water for sampling.5. Wells RNS-MW3, RNS-MW4, RNS-MW5, and RNS-MW7 are no longer sampled because Pre-RI sampling data indicated these wells are not impacted by VOCs.6. Depths presented represent sample collection depth below ground surface.7. MW-JS and MW-JS2 are from another project, but were each sampled once in 2013.8. Black and white reproduction of this color original may reduce its effectiveness and lead to incorrect interpretation.
LegendCis-1,2-DCE Concentration Range (µg/L)
Location Type&< Existing Well
!
!
!!
<1.01.0 - <7070 - 200>200
!> 2013 Boring
Primary Plume

&<
&<
&<
&<
&<
&<
&<
&<
&<&<
&<
&<
&<
&<
&<
&<
&<
!>
!>
!>
!>
LAI-MW5<0.2 (09/13) at 42'<0.2 (09/13) at 50'
Pre-RI Vinyl Chloride Plume
LAI-B10<0.2 (11/13) at 19'<0.2 (11/13) at 30'
LAI-B9<0.2 (11/13) at 20'<0.2 (11/13) at 30'
LAI-B8<0.2 (11/13) at 20'<0.2 (11/13) at 25'
LAI-B7<0.2 (11/13) at 20'0.6 (11/13) at 25'
LAI-B6<0.2 (11/13) at 20'
<0.2 (11/13) at 25.6'
MW-JS2<0.2 (09/13)
MW-JS<0.2 (06/13)
I705
A ST
REET
I705 H
WY S
PACI
FIC AV
ENUE
I705 H
WY N
COUR
T A
COMM
ERCE
STRE
ET
SOUTH 13TH STREET
RAMP
RAMP
I705
DOCK
STRE
ET
RAMP
I705
SOUTH 14TH STREET
SOUTH 15TH STREETSOUTH 15TH STREETRAMP I705
LAI-MW20.8 (09/13) at 65'
LAI-MW1<0.2 (09/13) at 63'
LAI-MW3<0.2 (09/13) at 75'
LAI-MW4<0.2 (09/13) at 25'
MW-130.8 (09/13) at 51.5'
RNS MW-3<2.0 (7/10) at 18'
RNS MW-2<0.2 (09/13) at 21.5'<0.2 (09/13) at 38.5'
RNS MW-4<0.2 (04/09) at 39'
RNS MW-5<0.2 (7/10) at 39.5'
RNS MW-6<0.2 (09/13) at 42.5'0.3 (09/13) at 52.5'
RNS MW-7<0.2 (7/10) at 39'
MW-1-PP<0.2 (09/13)
MW-2-PP0.2 (09/13)
MW-3
8950001951
8950002070
2013050121
2013030010
8950002040
0320042033
8950001971
2014030041
2013020020
2014020020
2013050133
2013050132
2012020014
2014020010
2013020011
2013040191
8950002060
8950002050
2014030010
2014020030
2013040110
2011050141 8950001961
2013040020
2013040050
2013040090
2013040010
8950001894
8950001964
2014030020
2014030030
2011040071
2013040030
2013040040
2013040060
2013040070
2013040080
2013040100
2013040120
2013040130
2013040140
2013040150
2013040160
2013040170
2013040180
2015020010 89500018812015060011 2015040010 2015020021
2011040072
8950
0019
63
0 100 200
Scale in Feet
Data Source: Pierce County GIS
Sauro's Property RI/FSTacoma, Washington
RI Groundwater VOC PlumesMost Recent Vinyl Chloride
ConcentrationsFigure
6-1d
G:\P
roje
cts\
094\
048\
013\
014\
RIF
S 2
014\
Figu
re6-
1dG
WV
C_P
reR
IPlu
mes
.mxd
8/2
8/20
14
Subject PropertyPre-RI VC Plume
Notes1. <0.2 = Not Detected in Sample2. <0.2 (09/13) VC concentration in µg/L (most recent samples through November 2013).3. The preliminary cleanup level for VC is 0.2 µg/L.4. MW-3 does not produce adequate water for sampling.5. Wells RNS-MW3, RNS-MW4, RNS-MW5, and RNS-MW7 are no longer sampled because Pre-RI sampling data indicated these wells are not impacted by VOCs.6. Depths presented represent sample collection depth below ground surface.7. MW-JS and MW-JS2 are from another project, but were each sampled once in 2013.8. Black and white reproduction of this color original may reduce its effectiveness and lead to incorrect interpretation.
LegendVC Concentration Range (µg/L)
Location Type&< Existing Well
!
!
!!
<0.20.2 - 22 - 20>20
!> 2013 Boring
Primary Plume

?
?
??
? ??
??
?
?
?? ? ? ? ? ? ? ? ?
??
?
? ? ? ? ? ? ? ? ? ?
? ?? ? ? ? ? ? ? ? ? ? ?
? ? ? ? ? ? ? ?? ? ? ? ? ? ? ? ? ? ? ? ? ? ?
??
??
? ? ? ? ? ? ? ? ??
??
?
?? ? ? ? ? ? ? ? ? ?
??
?
?
?
?ExistingGround Surface
(Offset 53' N)LAI-MW4
Ele
vatio
n in
ft (N
GV
D29
)
Ele
vatio
n in
ft (N
GV
D29
)
Geologic Profile Alignment - (1) (1)
-30
-20
-10
0
10
20
30
40
50
60
70
80
-30
-20
-10
0
10
20
30
40
50
60
70
80
0+001+002+003+004+005+006+007+008+009+0010+0011+0011+35
Dock StreetRailroadI-705 ROWA StreetDiamond ParkingCourt ASauro's PropertyPacific Ave
LAI-MW3
LAI-MW2
MW-13RNS-MW6(Offset 49' N)
(Offset 25' S)
(Offset 32' N)(Offset 14' N)
LAI-MW5(Offset 20' S)
(0.3)
(<0.2)
(78)
(1100)
LocomotiveMonument
Park
Road FILL
Dredge FILL
Tidal Deposits
Qvi(Ice Contact)
FILL
ApproximateOld Shoreline
DiamondExcavation
(360)
(430)(630)
Qpf(Pre Fraser)
(<0.2)
Geo
logi
c C
ross
Sec
tion
B-B
'
Qvi(Ice Contact)
FILL
Qpf(Pre Fraser)
2001 Excavation
2009 Excavation Extentsat Historical Sump Area
?
Approximate GWE of 39'at Time of Excavation
Approximate Pre-ExcavationElevation at Source Area
0 100 200
Horizontal Scale: 1"=100'Vertical Scale: 1"=20'
Sauro's Property RI/FSTacoma, Washington
Vertical Extent of PCE
Most Recent
Figure| G:\P
roje
cts\
094\
048\
013\
014\
RIF
S 2
014\
Figu
re6-
2abc
dSec
tions
.dw
g (A
) "Fi
gure
6-2
a" 8
/28/
2014
Legend
? ? ?
Groundwater Level
Top of Exploration
Bottom of ExplorationPCE Concentration (ɛg/L)
Inferred Geologic ContactInferred Groundwater Table
MW-1
(Offset 160' W)Project Exploration DesignationOffset Distance in Feet and Direction
Well Screen Interval(##)
PCE Concentration Range (ɛg/L)
Yellow 5 - 50
Orange 50 - 200
Red >200
Notes:
1. Profile derived from Puget Sound LiDAR Consortium2005. Cross-section profile location is shown on Figure4-3, located north of the former Sauro's property.
2. PCE concentration data shown in micrograms per liter(Õg/L). Data from September 2013.
3. Water level data from September 2013.
4. Black and white reproduction of this color original mayreduce its effectiveness and lead to incorrectinterpretation.
Approximate Extentof Excavation Areas

?
?
??
? ??
??
?
?
?? ? ? ? ? ? ? ? ?
??
?
? ? ? ? ? ? ? ? ? ?
? ?? ? ? ? ? ? ? ? ? ? ?
? ? ? ? ? ? ? ?? ? ? ? ? ? ? ? ? ? ? ? ? ? ?
??
??
? ? ? ? ? ? ? ? ??
??
?
?? ? ? ? ? ? ? ? ? ?
??
?
?
?
?ExistingGround Surface
(Offset 53' N)LAI-MW4
Ele
vatio
n in
ft (N
GV
D29
)
Ele
vatio
n in
ft (N
GV
D29
)
Geologic Profile Alignment - (1) (1)
-30
-20
-10
0
10
20
30
40
50
60
70
80
-30
-20
-10
0
10
20
30
40
50
60
70
80
0+001+002+003+004+005+006+007+008+009+0010+0011+0011+35
Dock StreetRailroadI-705 ROWA StreetDiamond ParkingCourt ASauro's PropertyPacific Ave
LAI-MW3
LAI-MW2
MW-13RNS-MW6(Offset 49' N)
(Offset 25' S)
(Offset 32' N)(Offset 14' N)
LAI-MW5(Offset 20' S)
LocomotiveMonument
Park
Road FILL
Dredge FILL
Tidal Deposits
Qvi(Ice Contact)
FILL
Qpf(Pre Fraser)
ApproximateOld Shoreline
DiamondExcavation
(<0.2)
(<0.2)
(34)
(260)
(120)
(110)(130)
(<0.2)
Geo
logi
c C
ross
Sec
tion
B-B
'
Qvi(Ice Contact)
FILL
Qpf(Pre Fraser)
2001 Excavation
2009 Excavation Extentsat Historical Sump Area
?
Approximate GWE of 39'at Time of Excavation
Approximate Pre-ExcavationElevation at Source Area
0 100 200
Horizontal Scale: 1"=100'Vertical Scale: 1"=20'
Sauro's Property RI/FSTacoma, Washington
Vertical Extent of TCE
Most Recent
Figure| G:\P
roje
cts\
094\
048\
013\
014\
RIF
S 2
014\
Figu
re6-
2abc
dSec
tions
.dw
g (A
) "Fi
gure
6-2
b" 8
/28/
2014
Legend
? ? ?
Groundwater Level
Top of Exploration
Bottom of ExplorationTCE Concentration (ɛg/L)
Inferred Geologic ContactInferred Groundwater Table
MW-1
(Offset 160' W)Project Exploration DesignationOffset Distance in Feet and Direction
Well Screen Interval(##)
TCE Concentration Range (ɛg/L)
Yellow 5 - 50
Orange 50 - 200
Red >200
Notes:
1. Profile derived from Puget Sound LiDAR Consortium2005. Cross-section profile location is shown on Figure4-3, located north of the former Sauro's property.
2. TCE concentration data shown in micrograms per liter(Õg/L). Data from September 2013.
3. Water level data from September 2013.
4. Black and white reproduction of this color original mayreduce its effectiveness and lead to incorrectinterpretation.
Approximate Extentof Excavation Areas

??
?
? ? ? ? ? ? ? ? ? ?
?
?
??
? ??
??
?
?
?? ? ? ? ? ? ? ? ?
??
?
? ? ? ? ? ? ? ? ? ?
? ?? ? ? ? ? ? ? ? ? ? ?
? ? ? ? ? ? ? ?? ? ? ? ? ? ? ? ? ? ? ? ? ? ?
??
??
? ? ? ? ? ? ? ? ??
??
?
?? ? ? ? ? ? ? ? ? ?
??
?
?
?
?ExistingGround Surface
(Offset 53' N)LAI-MW4
Ele
vatio
n in
ft (N
GV
D29
)
Ele
vatio
n in
ft (N
GV
D29
)
Geologic Profile Alignment - (1) (1)
-30
-20
-10
0
10
20
30
40
50
60
70
80
-30
-20
-10
0
10
20
30
40
50
60
70
80
0+001+002+003+004+005+006+007+008+009+0010+0011+0011+35
Dock StreetRailroadI-705 ROWA StreetDiamond ParkingCourt ASauro's PropertyPacific Ave
LAI-MW3
LAI-MW2
MW-13RNS-MW6(Offset 49' N)
(Offset 25' S)
(Offset 32' N)(Offset 14' N)
LAI-MW5(Offset 20' S)
LocomotiveMonument
Park
Road FILL
Dredge FILL
Tidal Deposits
Qvi(Ice Contact)
FILL
Qpf(Pre Fraser)
ApproximateOld Shoreline
DiamondExcavation
(<0.2)
(<0.2)
(54)
(130)
(160)
(120)(140)
(<0.2)
Geo
logi
c C
ross
Sec
tion
B-B
'
Qvi(Ice Contact)
FILL
Qpf(Pre Fraser)
2001 Excavation
2009 Excavation Extentsat Historical Sump Area
?
Approximate GWE of 39'at Time of Excavation
Approximate Pre-ExcavationElevation at Source Area
0 100 200
Horizontal Scale: 1"=100'Vertical Scale: 1"=20'
Sauro's Property RI/FSTacoma, Washington
Vertical Extent of cis-1,2-DCE
Most Recent
Figure| G:\P
roje
cts\
094\
048\
013\
014\
RIF
S 2
014\
Figu
re6-
2abc
dSec
tions
.dw
g (A
) "Fi
gure
6-2
c" 8
/28/
2014
Legend
? ? ?
Groundwater Level
Top of Exploration
Bottom of Explorationcis-1,2-DCE Concentration (ɛg/L)
Inferred Geologic ContactInferred Groundwater Table
MW-1
(Offset 160' W)Project Exploration DesignationOffset Distance in Feet and Direction
Well Screen Interval(##)
cis-1,2-DCE Concentration Range (ɛg/L)
Yellow 70-200
Notes:
1. Profile derived from Puget Sound LiDAR Consortium2005. Cross-section profile location is shown on Figure4-3, located north of the former Sauro's property.
2. cis-1,2-DCE concentration data shown in microgramsper liter (Õg/L). Data from September 2013.
3. Water level data from September 2013.
4. Black and white reproduction of this color original mayreduce its effectiveness and lead to incorrectinterpretation.
Approximate Extentof Excavation Areas

?
?
??
? ??
??
?
?
?? ? ? ? ? ? ? ? ?
??
?
? ? ? ? ? ? ? ? ? ?
? ?? ? ? ? ? ? ? ? ? ? ?
? ? ? ? ? ? ? ?? ? ? ? ? ? ? ? ? ? ? ? ? ? ?
??
??
? ? ? ? ? ? ? ? ??
??
?
?? ? ? ? ? ? ? ? ? ?
??
?
?
?
?ExistingGround Surface
(Offset 53' N)LAI-MW4
Ele
vatio
n in
ft (N
GV
D29
)
Ele
vatio
n in
ft (N
GV
D29
)
Geologic Profile Alignment - (1) (1)
-30
-20
-10
0
10
20
30
40
50
60
70
80
-30
-20
-10
0
10
20
30
40
50
60
70
80
0+001+002+003+004+005+006+007+008+009+0010+0011+0011+35
Dock StreetRailroadI-705 ROWA StreetDiamond ParkingCourt ASauro's PropertyPacific Ave
LAI-MW3
LAI-MW2
MW-13RNS-MW6(Offset 49' N)
(Offset 25' S)
(Offset 32' N)(Offset 14' N)
LAI-MW5(Offset 20' S)
LocomotiveMonument
Park
Road FILL
Dredge FILL
Tidal Deposits
Qvi(Ice Contact)
FILL
Qpf(Pre Fraser)
ApproximateOld Shoreline
DiamondExcavation
(<0.2)
(<0.2)
(<0.2)
(<0.2)
(0.8)
(0.8)(0.3)
(<0.2)
Geo
logi
c C
ross
Sec
tion
B-B
'
Qvi(Ice Contact)
FILL
Qpf(Pre Fraser)
2001 Excavation
2009 Excavation Extentsat Historical Sump Area
?
Approximate GWE of 39'at Time of Excavation
Approximate Pre-ExcavationElevation at Source Area
0 100 200
Horizontal Scale: 1"=100'Vertical Scale: 1"=20'
Sauro's Property RI/FSTacoma, Washington
Vertical Extent of Vinyl Chloride
Most Recent
Figure| G:\P
roje
cts\
094\
048\
013\
014\
RIF
S 2
014\
Figu
re6-
2abc
dSec
tions
.dw
g (A
) "Fi
gure
6-2
d" 8
/28/
2014
Legend
? ? ?
Groundwater Level
Top of Exploration
Bottom of ExplorationVinyl Chloride Concentration (ɛg/L)
Inferred Geologic ContactInferred Groundwater Table
MW-1
(Offset 160' W)Project Exploration DesignationOffset Distance in Feet and Direction
Well Screen Interval(##)
Vinyl Chloride Concentration Range (ɛg/L)
Yellow 0.2 - 2
Notes:
1. Profile derived from Puget Sound LiDAR Consortium2005. Cross-section profile location is shown on Figure4-3, located north of the former Sauro's property.
2. Vinyl Chloride concentration data shown in microgramsper liter (Õg/L). Data from September 2013.
3. Water level data from September 2013.
4. Black and white reproduction of this color original mayreduce its effectiveness and lead to incorrectinterpretation.
Approximate Extentof Excavation Areas
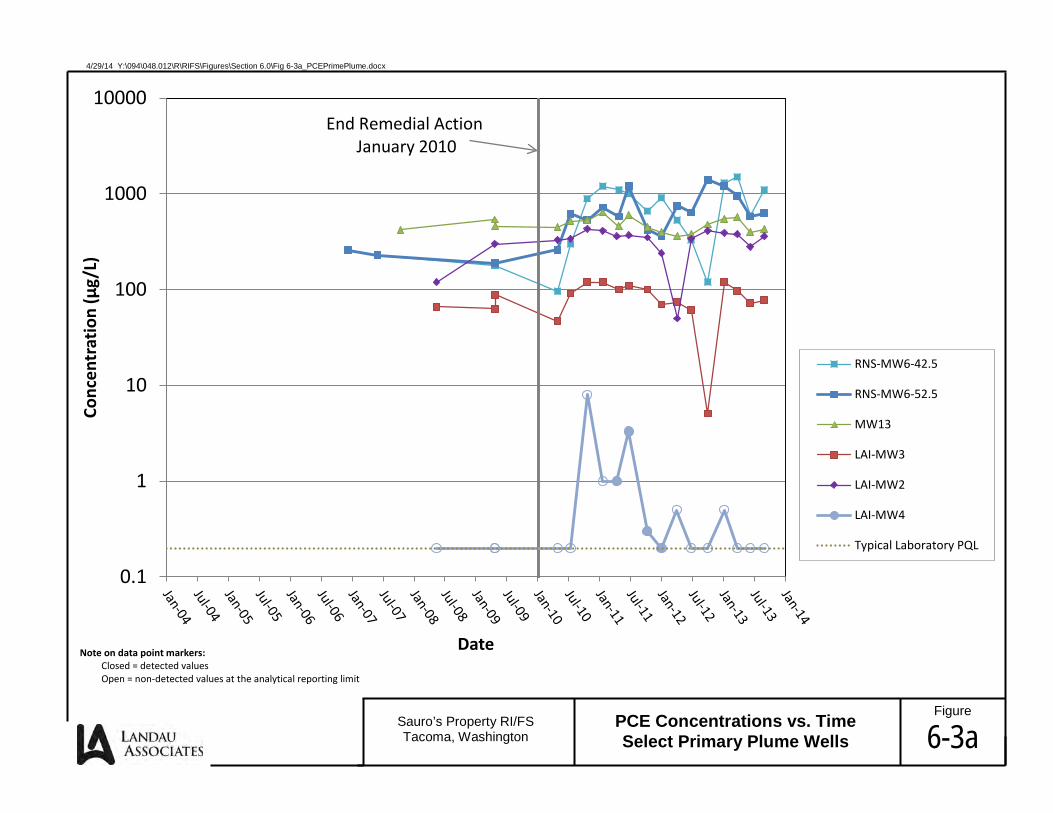
Figure
6-3a PCE Concentrations vs. Time Select Primary Plume Wells
4/29/14 Y:\094\048.012\R\RIFS\Figures\Section 6.0\Fig 6-3a_PCEPrimePlume.docx
Sauro’s Property RI/FS Tacoma, Washington
0.1
1
10
100
1000
10000 Co
ncen
trat
ion
(µg/
L)
Date
RNS-MW6-42.5
RNS-MW6-52.5
MW13
LAI-MW3
LAI-MW2
LAI-MW4
Typical Laboratory PQL
End Remedial Action January 2010
Note on data point markers: Closed = detected values Open = non-detected values at the analytical reporting limit

Figure
6-3b TCE Concentrations vs. Time Select Primary Plume Wells
4/29/14 Y:\094\048.012\R\RIFS\Figures\Section 6.0\Fig 6-3b_TCEPrimPlume.docx
Sauro’s Property RI/FS Tacoma, Washington
0.1
1
10
100
1000
10000 Co
ncen
trat
ion
(µg/
L)
Date
RNS-MW6-42.5 RNS-MW6-52.5 MW13 LAI-MW3 LAI-MW2 LAI-MW4 Typical Laboratory PQL
End Remedial Action January 2010
Note on data point markers: Closed = detected values Open = non-detected values at the analytical reporting limit

Figure
6-3c
Cis-1,2-DCE Concentrations vs. Time Select Primary Plume Wells
4/29/14 Y:\094\048.012\R\RIFS\Figures\Section 6.0\Fig 6-3c_CisPCEPlume.docx
Sauro’s Property RI/FS Tacoma, Washington
0.1
1
10
100
1000
10000 Co
ncen
trat
ion
(µg/
L)
Date
RNS-MW6-42.5 RNS-MW6-52.5 MW13 LAI-MW3 LAI-MW2 LAI-MW4 Typical Laboratory PQL
End Remedial Action January 2010
Note on data point markers: Closed = detected values Open = non-detected values at the analytical reporting limit

Figure
6-3d
Vinyl Chloride Concentrations vs. Time Select Primary Plume Wells
4/29/14 Y:\094\048.012\R\RIFS\Figures\Section 6.0\Fig 6-3d_VCPrimePlume.docx
Sauro’s Property RI/FS Tacoma, Washington
0.1
1
10
100
1000
10000 Co
ncen
trat
ion
(µg/
L)
Date
RNS-MW6-42.5 RNS-MW6-52.5 MW13 LAI-MW3 LAI-MW2 LAI-MW4 Typical Laboratory PQL
End Remedial Action January 2010
Note on data point markers: Closed = detected values Open = non-detected values at the analytical reporting limit

Figure
6-4a Select Volatile Organic Compound
Concentrations at RNS-MW6
4/29/14 Y:\094\048.012\R\RIFS\Figures\Section 6.0\Fig 6-4a_RNS MW6.docx
Sauro’s Property RI/FS Tacoma, Washington
0.1
1
10
100
1000
10000 Co
ncen
trat
ion
(µg/
L)
Date
PCE-42.5 PCE-52.5 TCE-42.5 TCE-52.5 cis-1,2-DCE-42.5 cis-1,2-DCE-52.5 Typical Laboratory PQL
End Remedial Action January 2010

Figure
6-4b Select Volatile Organic Compound
Concentrations at MW-13
4/29/14 Y:\094\048.012\R\RIFS\Figures\Section 6.0\Fig 6-4b_MW13.docx
Sauro’s Property RI/FS Tacoma, Washington
0.1
1
10
100
1000
10000 Co
ncen
trat
ion
(µg/
L)
Date
PCE TCE cis-1,2-DCE Typical Laboratory PQL
End Remedial Action January 2010

Figure
6-4c Select Volatile Organic Compound
Concentrations at LAI-MW2
4/29/14 Y:\094\048.012\R\RIFS\Figures\Section 6.0\Fig 6-4c_LAI MW2.docx
Sauro’s Property RI/FS Tacoma, Washington
0.1
1
10
100
1000
10000 Co
ncen
trat
ion
(µg/
L)
Date
PCE TCE cis-1,2-DCE Typical Laboratory PQL
End Remedial Action January 2010

Figure
6-4d Select Volatile Organic Compound
Concentrations at LAI-MW3
4/29/14 Y:\094\048.012\R\RIFS\Figures\Section 6.0\Fig 6-4d_LAI MW3.docx
Sauro’s Property RI/FS Tacoma, Washington
0.1
1
10
100
1000
10000 Co
ncen
trat
ion
(µg/
L)
Date
PCE TCE cis-1,2-DCE Typical Laboratory PQL
End Remedial Action January 2010

Note on data point markers: Closed = detected values Open = non-detected values at the analytical reporting limit Figure
6-4e Select Volatile Organic Compound
Concentrations at LAI-MW4
4/29/14 Y:\094\048.012\R\RIFS\Figures\Section 6.0\Fig 6-4e_LAI MW4.docx
Sauro’s Property RI/FS Tacoma, Washington
0.1
1
10
100
1000
10000 Co
ncen
trat
ion
(µg/
L)
Date
PCE TCE cis-1,2-DCE VC Typical Laboratory PQL
End Remedial Action January 2010

Note on data point markers: Closed = detected values Open = non-detected values at the analytical reporting limit Figure
6-5a
Select Volatile Organic Compound Concentrations at RNS-MW2
4/29/14 Y:\094\048.012\R\RIFS\Figures\Section 6.0\Fig 6-5a_RNS-MW2.docx
Sauro’s Property RI/FS Tacoma, Washington
0.1
1
10
100
1000
10000 Co
ncen
trat
ion
(µg/
L)
Date
PCE TCE cis-1,2-DCE Typical Laboratory PQL
End Remedial Action January 2010

Figure
6-5b Select Volatile Organic Compound
Concentrations at MW-2
4/29/14 Y:\094\048.012\R\RIFS\Figures\Section 6.0\Fig 6-5b_MW-2.docx
Sauro’s Property RI/FS Tacoma, Washington
0.1
1
10
100
1000
10000 Co
ncen
trat
ion
(µg/
L)
Date
PCE TCE cis-1,2-DCE Typical Laboratory PQL
End Remedial Action January 2010
Note on data point markers: Closed = detected values Open = non-detected values at the analytical

&<
&<
&<&<
&<
&<
&<
&<
&<
&<
&<
&<
&<
&<
&<
&<
&<
DaVita
Budget Property
USPSProperty
SOUTH 15TH STREET
Thea Foss Waterway
DiamondProperty
FormerSauro'sProperty
MW-3
41
41
RAMP
I705
MW-JS
MW-JS2
CurrentExtentof Site
I705
A ST
REET
PACI
FIC AV
ENUE
COUR
T A
COMM
ERCE
STRE
ET
SOUTH 13TH STREET
RAMP
DOCK
STRE
ET
SOUTH 14TH STREET
SOUTH 15TH STREETRAMP I705
LAI-MW2 (65)
41
LAI-MW5 (46)
MW13 (51.5)
RNS-MW3
RNS-MW2 (30)
RNS-MW4
RNS-MW5
RNS-MW6 (47.5)
RNS-MW7 (41)
MW1 (18)
MW2 (15)
8950001951
8950002070
2013050121
2013030010
8950002040
03200420338950001971
2014030041
2013020020
2014020020
2013050133
2013050132
2014020010
2013020011
2013040191
2012020014
8950002060
8950002050
2014030010
2014020030
2013040110
2013040020
2013040050
2013040090
89500019612011050141
2013040010
8950001964
2014030020
2014030030
2011040071
2013040030
2013040040
2013040060
2013040070
2013040080
2013040100
2013040120
2013040130
2013040140
2013040150
2013040160
2013040170
2013040180
2011040072
8950
0019
63
0.21 Acres
0 100 200
Scale in FeetData Source: Pierce County GIS; Esri World Imagery, 2011.
Sauro's Property RI/FSTacoma, Washington
RI Natural Attenuation DataSeptember 2013
Figure
6-6
G:\P
roje
cts\
094\
048\
013\
014\
RIF
S 2
014\
Figu
re6-
6RIN
AD
ataS
epte
mbe
r201
3.m
xd 8
/28/
2014
Legend
&< Other Existing Monitoring Wells
&<Sampled Monitoring Wells(Depth Sampled in Feet)
Subject Property
Current Extent of Site
Notes1. Natural attenuation parameter data shown in milligrams per liter (mg/L).2. DO = Dissolved Oxygen ORP = Oxidation-Reduction Potential NO3 = Nitrate Fe(II) = Iron SO4 = Sulfate M = Methane E1 = Ethane
DO 1.20ORP -31.8NO3 1.40Fe(II) <0.030SO4 25.8M <0.0050E1 <0.0050TOC 11.2
LAI-MW1 (63)
DO 3.00ORP -29.0NO3 0.655Fe(II) <0.030SO4 21.9M <0.0050E1 <0.0050TOC 16.0
LAI-MW3 (75)
DO 2.60ORP -82.6NO3 <0.010Fe(II) 2.52SO4 11.1M 3.0E1 <0.0050TOC 19.6
LAI-MW4 (25)DO 1.28ORP 48.5NO3 1.01Fe(II) 0.240SO4 34.6M 0.0066E1 <0.0050TOC 8.79
MW-13 (51.5)
DO 2.90ORP -44.8NO3 <0.010Fe(II) <0.030SO4 18.9M 0.026E1 <0.0050TOC 12.3
LAI-MW2 (65)
DO 3.72ORP 55.8NO3 0.317Fe(II) 0.180SO4 33.5M 0.068E1 0.0092TOC 11.6
RNS-MW6 (47.5)
DO 0.80ORP 64.3NO3 0.608Fe(II) <0.120SO4 41.3M <0.0050E1 <0.0050TOC 6.06
RNS-MW7 (41)
DO NSORP -113.0NO3 1.63Fe(II) NSSO4 50.3M 0.260E1 <0.0050TOC 6.74
MW-2 (15)
DO NSORP NSNO3 <0.010Fe(II) NSSO4 39.7M 0.25E1 <0.0050TOC 13.4
MW-1 (18)
DO 1.00ORP -69.8NO3 <0.010Fe(II) 2.52SO4 5.3M 11E1 <0.0050TOC 24.4
LAI-MW5 (46)
DO 6.04ORP 66.5NO3 3.02Fe(II) 0.800SO4 33.4M <0.0050E1 <0.0050TOC 6.68
RNS-MW2 (30)
2. TOC = Total Organic Carbon NS = Not Sampled E2 = Ethene A = Acetylene3. E2 and A nondetect at all locations.4. Black and white reproduction of this color original may reduce its effectiveness and lead to incorrect interpretation.
DO 1.40ORP -65.3NO3 <0.010Fe(II) 1.90SO4 15.6M 0.97E1 <0.0050TOC 14.2
MW-JS2

&<
&<
&<&<
&<
&<
&<
&<
&<
&<
&<
DaVita
Budget Property
USPSProperty
SOUTH 15TH STREET
Thea Foss Waterway
DiamondProperty
FormerSauro'sProperty
CurrentExtentof Site
I705
A ST
REET
PACI
FIC AV
ENUE
COUR
T A
COMM
ERCE
STRE
ET
SOUTH 13TH STREET
RAMP
I705
DOCK
STRE
ET
RAMP
I705
SOUTH 14TH STREET
SOUTH 15TH STREETRAMP I705
LAI-MW2
LAI-MW1
LAI-MW3 LAI-MW4
LAI-MW5
MW-13
RNS-MW2
RNS-MW6
RNS-MW7
MW-1
MW-2
8950001951
8950002070
2013050121
2013030010
8950002040
03200420338950001971
2014030041
2013020020
2014020020
2013050133
2013050132
2014020010
2013020011
2013040191
2012020014
8950002060
8950002050
2014030010
2014020030
2013040110
2013040020
2013040050
2013040090
89500019612011050141
2013040010
8950001964
2014030020
2014030030
2011040071
2013040030
2013040040
2013040060
2013040070
2013040080
2013040100
2013040120
2013040130
2013040140
2013040150
2013040160
2013040170
2013040180
2011040072
8950
0019
63
0 100 200
Scale in FeetData Sources: Pierce County GIS; Esri World Imagery 2011.
Sauro's Property RI/FSTacoma, Washington
RI Natural AttenuationInterpretation Summary
Figure
6-7
G:\P
roje
cts\
094\
048\
013\
014\
RIF
S 2
014\
Figu
re6-
7RIN
atur
alAt
tenu
atio
nSco
ringS
umm
ary.
mxd
8/2
8/20
14
Legend
&< Monitoring Well Sampled
Subject Property
Current Extent of Site
! Limited
! Inadequate
Notes1. The monitored natural attenuation (MNA) scores are derived from the U.S. Environmental Protection Agency document Technical Protocol for Evaluating Natural Attenuation of Chlorinated Solvents in Groundwater (EPA 1998).2. The current extent of the site represents the most recent extent of chlorinated solvents in groundwater at or above the MTCA Method A groundwater cleanup levels.
MNA Score: 3. Black and white reproduction of this color original may reduce its effectiveness and lead to incorrect interpretation.

Figure
6-8a Total Ethenes Concentrations Select Primary Plume Wells
4/29/14 Y:\094\048.012\R\RIFS\Figures\Section 6.0\Fig 6-8a_TotalEthenes_prim.docx
Sauro’s Property RI/FS Tacoma, Washington
0.01
0.1
1
10
100 m
icro
mol
es/l
iter
Date
RNS-MW6-42.5
RNS-MW6-52.5
MW-13
LAI-MW3
LAI-MW2
End Remedial Action January 2010

Figure
6-8b
Total Ethenes Molar Concentrations vs. Time Select Secondary Plume
Wells
4/29/14 Y:\094\048.012\R\RIFS\Figures\Section 6.0\Fig 6-8b_TotalEthenes_sec.docx
Sauro’s Property RI/FS Tacoma, Washington
0.01
0.1
1
10
100 m
icro
mol
es/l
iter
Date
RNS-MW2
MW-2
End Remedial Action January 2010

TABLE 6-1REMEDIAL INVESTIGATION SOIL SUMMARY STATISTICS
SAURO'S PROPERTY RI/FSTACOMA, WASHINGTON
Table 6-1Page 1 of 1
5/14/2014Y:\094\048.012\R\RIFS\Tables\Section 6.0\Table 6-1_RI Soil Stats Summary LANDAU ASSOCIATES
All units in µg/kgNumber of Samples
Number of Detects
Frequency of Detection
Minimum Reporting Limit
Maximum Reporting Limit
Minimum Detection
Maximum Detection
Tetrachloroethene 60 54 90% 0.7 46 0.8 56000Acetone 60 32 53% 3.7 1600 11 170Trichloroethene 60 28 47% 0.7 320 0.7 17000cis-1,2-Dichloroethene 60 22 37% 0.6 320 4.6 400000Vinyl Chloride 60 11 18% 0.6 320 1.2 55000Methylene Chloride 60 10 17% 1.4 650 1.6 3.8Toluene 60 7 12% 0.6 320 1.1 12trans-1,2-Dichloroethene 60 7 12% 0.6 320 2.7 2500Benzene 60 6 10% 0.6 320 0.8 15Bromomethane 60 6 10% 0.6 280 120 370Carbon Disulfide 60 6 10% 0.6 320 1.2 15Chloromethane 60 6 10% 0.6 320 1.9 1201,1-Dichloroethene 60 5 8% 0.6 320 1.4 4502-Butanone 60 3 5% 2.8 1600 5.1 7.8m,p-Xylene 60 3 5% 0.6 320 0.8 1.51,1,2-Trichloro-1,2,2-trifluoroethane 60 1 2% 1.1 650 4.2 4.21,2-Dichloroethane 60 1 2% 0.6 320 190 1902-Hexanone 60 1 2% 2.8 1600 110 1104-Isopropyltoluene 60 1 2% 0.6 320 2 2Chlorobenzene 60 1 2% 0.6 320 0.9 0.9Naphthalene 60 1 2% 2.8 1600 11 11sec-Butylbenzene 60 1 2% 0.6 320 2 2

TABLE 6-2REMEDIAL INVESTIGATION SOIL VOLATILE ORGANIC COMPOUND ANALYTICAL RESULTS
SAURO'S PROPERTY RI/FSTACOMA, WASHINGTON
Table 6-2Page 1 of 6
5/14/2014Y:\094\048.012\R\RIFS\Tables\Section 6.0\Table 6-2_RI Soil Analytical Results LANDAU ASSOCIATES
LAI-HA1-3.5LAI-HA1(2) (LAI-HA1b-3.5) LAI-HA2(2) LAI-HA3-3.5 LAI-HA4-3.3 LAI-HA5-3.0 LAI-HA6-4.0 LAI-HA7-4.0 LAI-P1-(5-6) LAI-P1-(10-11) LAI-P1-(15-16) LAI-P1-(18.5-19.5) LAI-P2-(5-6) LAI-P2-(6.5-7.25)
OT00A OU15F OT00B OU15D OU15C OU15B OU15A OU15E OU22I OU22J OU22K OU22L OU22A OU22B3/30/2009 4/3/2009 3/30/2009 4/3/2009 4/3/2009 4/3/2009 4/3/2009 4/3/2009 4/6/2009 4/6/2009 4/6/2009 4/6/2009 4/6/2009 4/6/2009
VOLATILES (ug/kg)Method SW8260BChloromethane 0.8 U 0.7 U 0.8 U 0.8 U 3.3 U 0.7 U 0.8 U 0.8 U 320 U 98 280 U 1.0 U 120 46 UBromomethane 0.8 U 0.7 U 0.8 U 0.8 U 3.3 U 0.7 U 0.8 U 0.8 U 370 160 280 U 1.0 U 240 46 UVinyl Chloride 0.8 U 0.7 U 0.8 U 0.8 U 3.3 U 0.7 U 0.8 U 0.8 U 320 U 52 U 280 U 1.0 U 49 U 1,900Chloroethane 0.8 U 0.7 U 0.8 U 0.8 U 3.3 U 0.7 U 0.8 U 0.8 U 320 U 52 U 280 U 1.0 U 49 U 46 UMethylene Chloride 1.6 2.2 U 3.3 3.0 U 9.4 U 1.6 U 3.2 U 2.7 U 650 U 100 U 560 U 3.4 99 U 91 UAcetone 27 24 89 E 82 170 100 130 23 1,600 U 260 U 1,400 U 55 250 U 230 UCarbon Disulfide 0.8 U 0.7 U 0.8 U 0.8 U 3.3 U 0.7 U 0.8 U 0.8 U 320 U 52 U 280 U 2.5 49 U 46 U1,1-Dichloroethene 0.8 U 0.7 U 0.8 U 0.8 U 3.3 U 0.7 U 0.8 U 0.8 U 320 U 52 U 280 U 1.0 U 49 U 46 U1,1-Dichloroethane 0.8 U 0.7 U 0.8 U 0.8 U 3.3 U 0.7 U 0.8 U 0.8 U 320 U 52 U 280 U 1.0 U 49 U 46 Utrans-1,2-Dichloroethene 0.8 U 0.7 U 4.1 0.8 U 3.3 U 0.7 U 0.8 U 0.8 U 320 U 52 U 280 U 1.0 U 49 U 46 Ucis-1,2-Dichloroethene 0.8 U 0.7 U 330 7.6 36 22 29 0.8 U 320 U 52 U 280 U 1.0 U 62 2,000Chloroform 0.8 U 0.7 U 0.8 U 0.8 U 3.3 U 0.7 U 0.8 U 0.8 U 320 U 52 U 280 U 1.0 U 49 U 46 U1,2-Dichloroethane 0.8 U 0.7 U 0.8 U 0.8 U 3.3 U 0.7 U 0.8 U 0.8 U 320 U 52 U 280 U 1.0 U 49 U 46 U2-Butanone 3.8 U 3.7 U 7.8 3.8 U 17 U 5.1 7.0 4.2 U 1,600 U 260 U 1,400 U 5.1 U 250 U 230 U1,1,1-Trichloroethane 0.8 U 0.7 U 0.8 U 0.8 U 3.3 U 0.7 U 0.8 U 0.8 U 320 U 52 U 280 U 1.0 U 49 U 46 UCarbon Tetrachloride 0.8 U 0.7 U 0.8 U 0.8 U 3.3 U 0.7 U 0.8 U 0.8 U 320 U 52 U 280 U 1.0 U 49 U 46 UVinyl Acetate 3.8 U 3.7 U 4.2 U 3.8 U 17 U 3.5 U 3.8 U 4.2 U 1,600 U 260 U 1,400 U 5.1 U 250 U 230 UBromodichloromethane 0.8 U 0.7 U 0.8 U 0.8 U 3.3 U 0.7 U 0.8 U 0.8 U 320 U 52 U 280 U 1.0 U 49 U 46 U1,2-Dichloropropane 0.8 U 0.7 U 0.8 U 0.8 U 3.3 U 0.7 U 0.8 U 0.8 U 320 U 52 U 280 U 1.0 U 49 U 46 Ucis-1,3-Dichloropropene 0.8 U 0.7 U 0.8 U 0.8 U 3.3 U 0.7 U 0.8 U 0.8 U 320 U 52 U 280 U 1.0 U 49 U 46 UTrichloroethene 0.8 U 0.7 U 2,300 15 34 38 63 0.8 U 320 U 52 U 280 U 1.8 100 120Dibromochloromethane 0.8 U 0.7 U 0.8 U 0.8 U 3.3 U 0.7 U 0.8 U 0.8 U 320 U 52 U 280 U 1.0 U 49 U 46 U1,1,2-Trichloroethane 0.8 U 0.7 U 0.8 U 0.8 U 3.3 U 0.7 U 0.8 U 0.8 U 320 U 52 U 280 U 1.0 U 49 U 46 UBenzene 0.8 0.7 U 5.0 0.8 U 3.3 U 1.4 1.7 0.8 U 320 U 52 U 280 U 1.0 U 49 U 46 Utrans-1,3-Dichloropropene 0.8 U 0.7 U 0.8 U 0.8 U 3.3 U 0.7 U 0.8 U 0.8 U 320 U 52 U 280 U 1.0 U 49 U 46 U2-Chloroethyl vinyl ether 3.8 U 3.7 U 4.2 U 3.8 U 17 U 3.5 U 3.8 U 4.2 U 1,600 U 260 U 1,400 U 5.1 U 250 U 230 UBromoform 0.8 U 0.7 U 0.8 U 0.8 U 3.3 U 0.7 U 0.8 U 0.8 U 320 U 52 U 280 U 1.0 U 49 U 46 U4-Methyl-2-Pentanone (MIBK) 3.8 U 3.7 U 4.2 U 3.8 U 17 U 3.5 U 3.8 U 4.2 U 1,600 U 260 U 1,400 U 5.1 U 250 U 230 U2-Hexanone 3.8 U 3.7 U 4.2 U 110 M 17 U 3.5 U 3.8 U 4.2 U 1,600 U 260 U 1,400 U 5.1 U 250 U 230 UTetrachloroethene 8.8 0.8 27,000 500 340 2,200 2,100 1.9 33,000 5,900 2,100 7.3 3,400 46 U1,1,2,2-Tetrachloroethane 0.8 U 0.7 U 0.8 U 0.8 U 3.3 U 0.7 U 0.8 U 0.8 U 320 U 52 U 280 U 1.0 U 49 U 46 UToluene 1.7 0.7 U 5.2 12 3.3 U 1.1 1.5 0.8 U 320 U 52 U 280 U 1.0 U 49 U 46 U

TABLE 6-2REMEDIAL INVESTIGATION SOIL VOLATILE ORGANIC COMPOUND ANALYTICAL RESULTS
SAURO'S PROPERTY RI/FSTACOMA, WASHINGTON
Table 6-2Page 2 of 6
5/14/2014Y:\094\048.012\R\RIFS\Tables\Section 6.0\Table 6-2_RI Soil Analytical Results LANDAU ASSOCIATES
LAI-HA1-3.5LAI-HA1(2) (LAI-HA1b-3.5) LAI-HA2(2) LAI-HA3-3.5 LAI-HA4-3.3 LAI-HA5-3.0 LAI-HA6-4.0 LAI-HA7-4.0 LAI-P1-(5-6) LAI-P1-(10-11) LAI-P1-(15-16) LAI-P1-(18.5-19.5) LAI-P2-(5-6) LAI-P2-(6.5-7.25)
OT00A OU15F OT00B OU15D OU15C OU15B OU15A OU15E OU22I OU22J OU22K OU22L OU22A OU22B3/30/2009 4/3/2009 3/30/2009 4/3/2009 4/3/2009 4/3/2009 4/3/2009 4/3/2009 4/6/2009 4/6/2009 4/6/2009 4/6/2009 4/6/2009 4/6/2009
Chlorobenzene 0.8 U 0.7 U 0.9 0.8 U 3.3 U 0.7 U 0.8 U 0.8 U 320 U 52 U 280 U 1.0 U 49 U 46 UEthylbenzene 0.8 U 0.7 U 0.8 U 0.8 U 3.3 U 0.7 U 0.8 U 0.8 U 320 U 52 U 280 U 1.0 U 49 U 46 UStyrene 0.8 U 0.7 U 0.8 U 0.8 U 3.3 U 0.7 U 0.8 U 0.8 U 320 U 52 U 280 U 1.0 U 49 U 46 UTrichlorofluoromethane 0.8 U 0.7 U 0.8 U 0.8 U 3.3 U 0.7 U 0.8 U 0.8 U 320 U 52 U 280 U 1.0 U 49 U 46 U1,1,2-Trichloro-1,2,2-trifluoroethane 1.5 U 1.5 U 1.7 U 1.5 U 6.6 U 1.4 U 1.5 U 1.7 U 650 U 100 U 560 U 2.0 U 99 U 91 Um, p-Xylene 0.8 0.7 U 1.5 0.8 U 3.3 U 0.7 U 0.8 U 0.8 U 320 U 52 U 280 U 1.0 U 49 U 46 Uo-Xylene 0.8 U 0.7 U 0.8 U 0.8 U 3.3 U 0.7 U 0.8 U 0.8 U 320 U 52 U 280 U 1.0 U 49 U 46 U1,2-Dichlorobenzene 0.8 U 0.7 U 0.8 U 0.8 U 3.3 U 0.7 U 0.8 U 0.8 U 320 U 52 U 280 U 1.0 U 49 U 46 U1,3-Dichlorobenzene 0.8 U 0.7 U 0.8 U 0.8 U 3.3 U 0.7 U 0.8 U 0.8 U 320 U 52 U 280 U 1.0 U 49 U 46 U1,4-Dichlorobenzene 0.8 U 0.7 U 0.8 U 0.8 U 3.3 U 0.7 U 0.8 U 0.8 U 320 U 52 U 280 U 1.0 U 49 U 46 UAcrolein 38 U 37 U 42 U 38 U 170 U 35 U 38 U 42 U 16,000 U 2,600 U 14,000 U 51 U 2,500 U 2,300 UMethyl Iodide 0.8 U 0.7 U 0.8 U 0.8 U 3.3 U 0.7 U 0.8 U 0.8 U 320 U 52 U 280 U 1.0 U 49 U 46 UBromoethane 1.5 U 1.5 U 1.7 U 1.5 U 6.6 U 1.4 U 1.5 U 1.7 U 650 U 100 U 560 U 2.0 U 99 U 91 UAcrylonitrile 3.8 U 3.7 U 4.2 U 3.8 U 17 U 3.5 U 3.8 U 4.2 U 1,600 U 260 U 1,400 U 5.1 U 250 U 230 U1,1-Dichloropropene 0.8 U 0.7 U 0.8 U 0.8 U 3.3 U 0.7 U 0.8 U 0.8 U 320 U 52 U 280 U 1.0 U 49 U 46 UDibromomethane 0.8 U 0.7 U 0.8 U 0.8 U 3.3 U 0.7 U 0.8 U 0.8 U 320 U 52 U 280 U 1.0 U 49 U 46 U1,1,1,2-Tetrachloroethane 0.8 U 0.7 U 0.8 U 0.8 U 3.3 U 0.7 U 0.8 U 0.8 U 320 U 52 U 280 U 1.0 U 49 U 46 U1,2-Dibromo-3-chloropropane 3.8 U 3.7 U 4.2 U 3.8 U 17 U 3.5 U 3.8 U 4.2 U 1,600 U 260 U 1,400 U 5.1 U 250 U 230 U1,2,3-Trichloropropane 1.5 U 1.5 U 1.7 U 1.5 U 6.6 U 1.4 U 1.5 U 1.7 U 650 U 100 U 560 U 2.0 U 99 U 91 Utrans-1,4-Dichloro-2-butene 3.8 U 3.7 U 4.2 U 3.8 U 17 U 3.5 U 3.8 U 4.2 U 1,600 U 260 U 1,400 U 5.1 U 250 U 230 U1,3,5-Trimethylbenzene 0.8 U 0.7 U 0.8 U 0.8 U 3.3 U 0.7 U 0.8 U 0.8 U 320 U 52 U 280 U 1.0 U 49 U 46 U1,2,4-Trimethylbenzene 0.8 U 0.7 U 0.8 U 0.8 U 3.3 U 0.7 U 0.8 U 0.8 U 320 U 52 U 280 U 1.0 U 49 U 46 UHexachlorobutadiene 3.8 U 3.7 U 4.2 U 3.8 U 17 U 3.5 U 3.8 U 4.2 U 1,600 U 260 U 1,400 U 5.1 U 250 U 230 UEthylene Dibromide 0.8 U 0.7 U 0.8 U 0.8 U 3.3 U 0.7 U 0.8 U 0.8 U 320 U 52 U 280 U 1.0 U 49 U 46 UBromochloromethane 0.8 U 0.7 U 0.8 U 0.8 U 3.3 U 0.7 U 0.8 U 0.8 U 320 U 52 U 280 U 1.0 U 49 U 46 U2,2-Dichloropropane 0.8 U 0.7 U 0.8 U 0.8 U 3.3 U 0.7 U 0.8 U 0.8 U 320 U 52 U 280 U 1.0 U 49 U 46 U1,3-Dichloropropane 0.8 U 0.7 U 0.8 U 0.8 U 3.3 U 0.7 U 0.8 U 0.8 U 320 U 52 U 280 U 1.0 U 49 U 46 UIsopropylbenzene 0.8 U 0.7 U 0.8 U 0.8 U 3.3 U 0.7 U 0.8 U 0.8 U 320 U 52 U 280 U 1.0 U 49 U 46 Un-Propylbenzene 0.8 U 0.7 U 0.8 U 0.8 U 3.3 U 0.7 U 0.8 U 0.8 U 320 U 52 U 280 U 1.0 U 49 U 46 UBromobenzene 0.8 U 0.7 U 0.8 U 0.8 U 3.3 U 0.7 U 0.8 U 0.8 U 320 U 52 U 280 U 1.0 U 49 U 46 U2-Chlorotoluene 0.8 U 0.7 U 0.8 U 0.8 U 3.3 U 0.7 U 0.8 U 0.8 U 320 U 52 U 280 U 1.0 U 49 U 46 U4-Chlorotoluene 0.8 U 0.7 U 0.8 U 0.8 U 3.3 U 0.7 U 0.8 U 0.8 U 320 U 52 U 280 U 1.0 U 49 U 46 Utert-Butylbenzene 0.8 U 0.7 U 0.8 U 0.8 U 3.3 U 0.7 U 0.8 U 0.8 U 320 U 52 U 280 U 1.0 U 49 U 46 Usec-Butylbenzene 0.8 U 0.7 U 0.8 U 0.8 U 3.3 U 0.7 U 0.8 U 0.8 U 320 U 52 U 280 U 1.0 U 49 U 46 U4-Isopropyltoluene 0.8 U 0.7 U 0.8 U 2.0 3.3 U 0.7 U 0.8 U 0.8 U 320 U 52 U 280 U 1.0 U 49 U 46 Un-Butylbenzene 0.8 U 0.7 U 0.8 U 0.8 U 3.3 U 0.7 U 0.8 U 0.8 U 320 U 52 U 280 U 1.0 U 49 U 46 U1,2,4-Trichlorobenzene 3.8 U 3.7 U 4.2 U 3.8 U 17 U 3.5 U 3.8 U 4.2 U 1,600 U 260 U 1,400 U 5.1 U 250 U 230 UNaphthalene 3.8 U 3.7 U 4.2 U 3.8 U 17 U 3.5 U 3.8 U 4.2 U 1,600 U 260 U 1,400 U 5.1 U 250 U 230 U1,2,3-Trichlorobenzene 3.8 U 3.7 U 4.2 U 3.8 U 17 U 3.5 U 3.8 U 4.2 U 1,600 U 260 U 1,400 U 5.1 U 250 U 230 U

TABLE 6-2REMEDIAL INVESTIGATION SOIL VOLATILE ORGANIC COMPOUND ANALYTICAL RESULTS
SAURO'S PROPERTY RI/FSTACOMA, WASHINGTON
Table 6-2Page 3 of 6
5/14/2014Y:\094\048.012\R\RIFS\Tables\Section 6.0\Table 6-2_RI Soil Analytical Results LANDAU ASSOCIATES
VOLATILES (ug/kg)Method SW8260BChloromethaneBromomethaneVinyl ChlorideChloroethaneMethylene ChlorideAcetoneCarbon Disulfide1,1-Dichloroethene1,1-Dichloroethanetrans-1,2-Dichloroethenecis-1,2-DichloroetheneChloroform1,2-Dichloroethane2-Butanone1,1,1-TrichloroethaneCarbon TetrachlorideVinyl AcetateBromodichloromethane1,2-Dichloropropanecis-1,3-DichloropropeneTrichloroetheneDibromochloromethane1,1,2-TrichloroethaneBenzenetrans-1,3-Dichloropropene2-Chloroethyl vinyl etherBromoform4-Methyl-2-Pentanone (MIBK)2-HexanoneTetrachloroethene1,1,2,2-TetrachloroethaneToluene
LAI-P2-(10-11) LAI-P2-(15-16) LAI-P3-(5-6) LAI-P3-(7-8) LAI-P3-(10-11) LAI-P3-(13.5-14.5) LAI-P4-3.0 LAI-P4-8.0 LAI-P4-13.0 LAI-P4-18.0 LAI-P5-3.0 LAI-P5-8.7 LAI-P5-11.0 LAI-P5-14.0 LAI-P6-4.0OU22C OU22D OU22E OU22F OU22G OU22H OU15G OU15H OU15I OU15J OU16A OU16B OU16C OU16D OU16E4/6/2009 4/6/2009 4/6/2009 4/6/2009 4/6/2009 4/6/2009 4/3/2009 4/3/2009 4/3/2009 4/3/2009 4/3/2009 4/3/2009 4/3/2009 4/3/2009 4/3/2009
48 U 64 U 48 U 52 U 81 U 120 0.6 U 0.7 U 0.6 U 1.3 U 36 U 35 U 39 U 50 U 70 U48 U 64 U 48 U 52 U 81 U 220 0.6 U 0.7 U 0.6 U 1.3 U 36 U 35 U 39 U 50 U 70 U48 U 64 U 48 U 52 U 81 U 55 U 0.6 U 0.7 U 0.6 U 26 36 U 35 U 39 U 50 U 70 U48 U 64 U 48 U 52 U 81 U 55 U 0.6 U 0.7 U 0.6 U 1.3 U 36 U 35 U 39 U 50 U 70 U96 U 130 U 96 U 100 U 160 U 110 U 1.8 U 2.7 U 1.9 U 3.9 U 270 U 270 U 310 U 360 U 450 U
240 U 320 U 240 U 260 U 400 U 270 U 12 44 25 73 180 U 170 U 190 U 250 U 350 U48 U 64 U 48 U 52 U 81 U 55 U 0.6 U 0.7 U 0.6 UJ 15 36 U 35 U 39 U 50 U 70 U48 U 64 U 48 U 52 U 81 U 55 U 0.6 U 0.7 U 0.6 UJ 1.3 U 36 U 35 U 39 U 50 U 70 U48 U 64 U 48 U 52 U 81 U 55 U 0.6 U 0.7 U 0.6 U 1.3 U 36 U 35 U 39 U 50 U 70 U48 U 64 U 48 U 52 U 81 U 55 U 0.6 U 0.7 U 0.6 U 2.9 36 U 35 U 39 U 50 U 70 U48 U 110 48 U 52 U 81 U 55 U 0.6 U 9.7 7.0 43 36 U 35 U 39 U 50 U 70 U48 U 64 U 48 U 52 U 81 U 55 U 0.6 U 0.7 U 0.6 U 1.3 U 36 U 35 U 39 U 50 U 70 U48 U 64 U 48 U 52 U 81 U 55 U 0.6 U 0.7 U 0.6 U 1.3 U 36 U 35 U 39 U 50 U 70 U
240 U 320 U 240 U 260 U 400 U 270 U 3.0 U 3.4 U 2.8 U 6.6 U 180 U 170 U 190 U 250 U 350 U48 U 64 U 48 U 52 U 81 U 55 U 0.6 U 0.7 U 0.6 U 1.3 U 36 U 35 U 39 U 50 U 70 U48 U 64 U 48 U 52 U 81 U 55 U 0.6 U 0.7 U 0.6 U 1.3 U 36 U 35 U 39 U 50 U 70 U
240 U 320 U 240 U 260 U 400 U 270 U 3.0 U 3.4 U 2.8 U 6.6 U 180 U 170 U 190 U 250 U 350 U48 U 64 U 48 U 52 U 81 U 55 U 0.6 U 0.7 U 0.6 U 1.3 U 36 U 35 U 39 U 50 U 70 U48 U 64 U 48 U 52 U 81 U 55 U 0.6 U 0.7 U 0.6 U 1.3 U 36 U 35 U 39 U 50 U 70 U48 U 64 U 48 U 52 U 81 U 55 U 0.6 U 0.7 U 0.6 U 1.3 U 36 U 35 U 39 U 50 U 70 U48 U 350 48 U 52 U 81 U 55 U 0.7 12 6.6 24 36 U 35 U 39 U 50 U 70 U48 U 64 U 48 U 52 U 81 U 55 U 0.6 U 0.7 U 0.6 U 1.3 U 36 U 35 U 39 U 50 U 70 U48 U 64 U 48 U 52 U 81 U 55 U 0.6 U 0.7 U 0.6 U 1.3 U 36 U 35 U 39 U 50 U 70 U48 U 64 U 48 U 52 U 81 U 55 U 0.6 U 0.7 U 0.6 U 2.1 36 U 35 U 39 U 50 U 70 U48 U 64 U 48 U 52 U 81 U 55 U 0.6 U 0.7 U 0.6 U 1.3 U 36 U 35 U 39 U 50 U 70 U
240 U 320 U 240 U 260 U 400 U 270 U 3.0 U 3.4 U 2.8 U 6.6 U 180 U 170 U 190 U 250 U 350 U48 U 64 U 48 U 52 U 81 U 55 U 0.6 U 0.7 U 0.6 UJ 1.3 U 36 U 35 U 39 U 50 U 70 U
240 U 320 U 240 U 260 U 400 U 270 U 3.0 U 3.4 U 2.8 U 6.6 U 180 U 170 U 190 U 250 U 350 U240 U 320 U 240 U 260 U 400 U 270 U 3.0 U 3.4 U 2.8 UJ 6.6 U 180 U 170 U 190 U 250 U 350 U
1,800 7,300 580 730 480 570 32 1,500 750 76 420 830 320 1,100 1,70048 U 64 U 48 U 52 U 81 U 55 U 0.6 U 0.7 U 0.6 U 1.3 U 36 U 35 U 39 U 50 U 70 U48 U 64 U 48 U 52 U 81 U 55 U 0.6 U 0.7 U 0.6 U 1.4 36 U 35 U 39 U 50 U 70 U

TABLE 6-2REMEDIAL INVESTIGATION SOIL VOLATILE ORGANIC COMPOUND ANALYTICAL RESULTS
SAURO'S PROPERTY RI/FSTACOMA, WASHINGTON
Table 6-2Page 4 of 6
5/14/2014Y:\094\048.012\R\RIFS\Tables\Section 6.0\Table 6-2_RI Soil Analytical Results LANDAU ASSOCIATES
ChlorobenzeneEthylbenzeneStyreneTrichlorofluoromethane1,1,2-Trichloro-1,2,2-trifluoroethanem, p-Xyleneo-Xylene1,2-Dichlorobenzene1,3-Dichlorobenzene1,4-DichlorobenzeneAcroleinMethyl IodideBromoethaneAcrylonitrile1,1-DichloropropeneDibromomethane1,1,1,2-Tetrachloroethane1,2-Dibromo-3-chloropropane1,2,3-Trichloropropanetrans-1,4-Dichloro-2-butene1,3,5-Trimethylbenzene1,2,4-TrimethylbenzeneHexachlorobutadieneEthylene DibromideBromochloromethane2,2-Dichloropropane1,3-DichloropropaneIsopropylbenzenen-PropylbenzeneBromobenzene2-Chlorotoluene4-Chlorotoluenetert-Butylbenzenesec-Butylbenzene4-Isopropyltoluenen-Butylbenzene1,2,4-TrichlorobenzeneNaphthalene1,2,3-Trichlorobenzene
LAI-P2-(10-11) LAI-P2-(15-16) LAI-P3-(5-6) LAI-P3-(7-8) LAI-P3-(10-11) LAI-P3-(13.5-14.5) LAI-P4-3.0 LAI-P4-8.0 LAI-P4-13.0 LAI-P4-18.0 LAI-P5-3.0 LAI-P5-8.7 LAI-P5-11.0 LAI-P5-14.0 LAI-P6-4.0OU22C OU22D OU22E OU22F OU22G OU22H OU15G OU15H OU15I OU15J OU16A OU16B OU16C OU16D OU16E4/6/2009 4/6/2009 4/6/2009 4/6/2009 4/6/2009 4/6/2009 4/3/2009 4/3/2009 4/3/2009 4/3/2009 4/3/2009 4/3/2009 4/3/2009 4/3/2009 4/3/2009
48 U 64 U 48 U 52 U 81 U 55 U 0.6 U 0.7 U 0.6 U 1.3 U 36 U 35 U 39 U 50 U 70 U48 U 64 U 48 U 52 U 81 U 55 U 0.6 U 0.7 U 0.6 U 1.3 U 36 U 35 U 39 U 50 U 70 U48 U 64 U 48 U 52 U 81 U 55 U 0.6 U 0.7 U 0.6 U 1.3 U 36 U 35 U 39 U 50 U 70 U48 U 64 U 48 U 52 U 81 U 55 U 0.6 U 0.7 U 0.6 U 1.3 U 36 U 35 U 39 U 50 U 70 U96 U 130 U 96 U 100 U 160 U 110 U 1.2 U 1.3 U 1.1 U 2.6 U 72 U 69 U 77 U 99 U 140 U48 U 64 U 48 U 52 U 81 U 55 U 0.6 U 0.7 U 0.6 U 1.3 U 36 U 35 U 39 U 50 U 70 U48 U 64 U 48 U 52 U 81 U 55 U 0.6 U 0.7 U 0.6 U 1.3 U 36 U 35 U 39 U 50 U 70 U48 U 64 U 48 U 52 U 81 U 55 U 0.6 U 0.7 U 0.6 U 1.3 U 36 U 35 U 39 U 50 U 70 U48 U 64 U 48 U 52 U 81 U 55 U 0.6 U 0.7 U 0.6 U 1.3 U 36 U 35 U 39 U 50 U 70 U48 U 64 U 48 U 52 U 81 U 55 U 0.6 U 0.7 U 0.6 U 1.3 U 36 U 35 U 39 U 50 U 70 U
2,400 U 3,200 U 2,400 U 2,600 U 4,000 U 2,700 U 30 U 34 U 28 U 66 U 1,800 U 1,700 U 1,900 U 2,500 U 3,500 U48 U 64 U 48 U 52 U 81 U 55 U 0.6 U 0.7 U 0.6 U 1.3 U 36 U 35 U 39 U 50 U 70 U96 U 130 U 96 U 100 U 160 U 110 U 1.2 U 1.3 U 1.1 U 2.6 U 72 U 69 U 77 U 99 U 140 U
240 U 320 U 240 U 260 U 400 U 270 U 3.0 U 3.4 U 2.8 U 6.6 U 180 U 170 U 190 U 250 U 350 U48 U 64 U 48 U 52 U 81 U 55 U 0.6 U 0.7 U 0.6 U 1.3 U 36 U 35 U 39 U 50 U 70 U48 U 64 U 48 U 52 U 81 U 55 U 0.6 U 0.7 U 0.6 U 1.3 U 36 U 35 U 39 U 50 U 70 U48 U 64 U 48 U 52 U 81 U 55 U 0.6 U 0.7 U 0.6 U 1.3 U 36 U 35 U 39 U 50 U 70 U
240 U 320 U 240 U 260 U 400 U 270 U 3.0 U 3.4 U 2.8 U 6.6 U 180 U 170 U 190 U 250 U 350 U96 U 130 U 96 U 100 U 160 U 110 U 1.2 U 1.3 U 1.1 U 2.6 U 72 U 69 U 77 U 99 U 140 U
240 U 320 U 240 U 260 U 400 U 270 U 3.0 U 3.4 U 2.8 U 6.6 U 180 U 170 U 190 U 250 U 350 U48 U 64 U 48 U 52 U 81 U 55 U 0.6 U 0.7 U 0.6 UJ 1.3 U 36 U 35 U 39 U 50 U 70 U48 U 64 U 48 U 52 U 81 U 55 U 0.6 U 0.7 U 0.6 U 1.3 U 36 U 35 U 39 U 50 U 70 U
240 U 320 U 240 U 260 U 400 U 270 U 3.0 U 3.4 U 2.8 U 6.6 U 180 U 170 U 190 U 250 U 350 U48 U 64 U 48 U 52 U 81 U 55 U 0.6 U 0.7 U 0.6 U 1.3 U 36 U 35 U 39 U 50 U 70 U48 U 64 U 48 U 52 U 81 U 55 U 0.6 U 0.7 U 0.6 U 1.3 U 36 U 35 U 39 U 50 U 70 U48 U 64 U 48 U 52 U 81 U 55 U 0.6 U 0.7 U 0.6 U 1.3 U 36 U 35 U 39 U 50 U 70 U48 U 64 U 48 U 52 U 81 U 55 U 0.6 U 0.7 U 0.6 U 1.3 U 36 U 35 U 39 U 50 U 70 U48 U 64 U 48 U 52 U 81 U 55 U 0.6 U 0.7 U 0.6 UJ 1.3 U 36 U 35 U 39 U 50 U 70 U48 U 64 U 48 U 52 U 81 U 55 U 0.6 U 0.7 U 0.6 UJ 1.3 U 36 U 35 U 39 U 50 U 70 U48 U 64 U 48 U 52 U 81 U 55 U 0.6 U 0.7 U 0.6 UJ 1.3 U 36 U 35 U 39 U 50 U 70 U48 U 64 U 48 U 52 U 81 U 55 U 0.6 U 0.7 U 0.6 UJ 1.3 U 36 U 35 U 39 U 50 U 70 U48 U 64 U 48 U 52 U 81 U 55 U 0.6 U 0.7 U 0.6 UJ 1.3 U 36 U 35 U 39 U 50 U 70 U48 U 64 U 48 U 52 U 81 U 55 U 0.6 U 0.7 U 0.6 U 1.3 U 36 U 35 U 39 U 50 U 70 U48 U 64 U 48 U 52 U 81 U 55 U 0.6 U 0.7 U 0.6 U 1.3 U 36 U 35 U 39 U 50 U 70 U48 U 64 U 48 U 52 U 81 U 55 U 0.6 U 0.7 U 0.6 U 1.3 U 36 U 35 U 39 U 50 U 70 U48 U 64 U 48 U 52 U 81 U 55 U 0.6 U 0.7 U 0.6 U 1.3 U 36 U 35 U 39 U 50 U 70 U
240 U 320 U 240 U 260 U 400 U 270 U 3.0 U 3.4 U 2.8 U 6.6 U 180 U 170 U 190 U 250 U 350 U240 U 320 U 240 U 260 U 400 U 270 U 3.0 U 3.4 U 2.8 U 11 180 U 170 U 190 U 250 U 350 U240 U 320 U 240 U 260 U 400 U 270 U 3.0 U 3.4 U 2.8 U 6.6 U 180 U 170 U 190 U 250 U 350 U
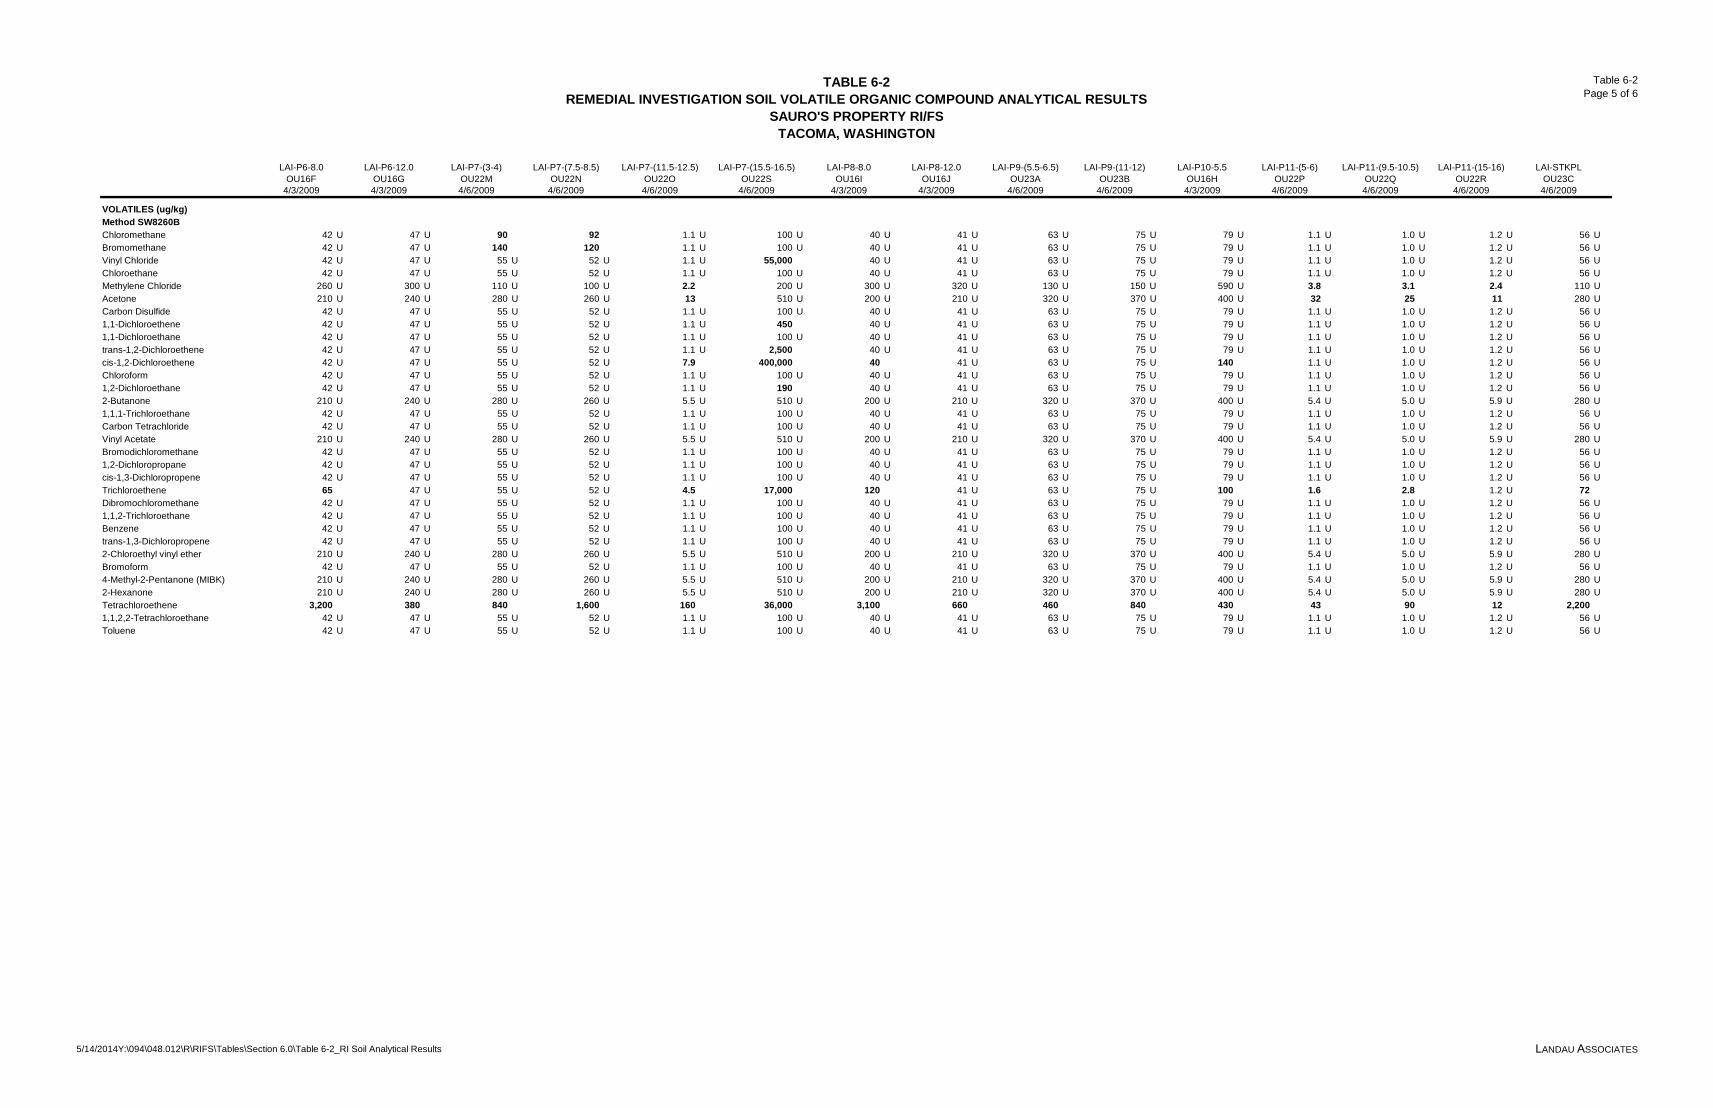
TABLE 6-2REMEDIAL INVESTIGATION SOIL VOLATILE ORGANIC COMPOUND ANALYTICAL RESULTS
SAURO'S PROPERTY RI/FSTACOMA, WASHINGTON
Table 6-2Page 5 of 6
5/14/2014Y:\094\048.012\R\RIFS\Tables\Section 6.0\Table 6-2_RI Soil Analytical Results LANDAU ASSOCIATES
VOLATILES (ug/kg)Method SW8260BChloromethaneBromomethaneVinyl ChlorideChloroethaneMethylene ChlorideAcetoneCarbon Disulfide1,1-Dichloroethene1,1-Dichloroethanetrans-1,2-Dichloroethenecis-1,2-DichloroetheneChloroform1,2-Dichloroethane2-Butanone1,1,1-TrichloroethaneCarbon TetrachlorideVinyl AcetateBromodichloromethane1,2-Dichloropropanecis-1,3-DichloropropeneTrichloroetheneDibromochloromethane1,1,2-TrichloroethaneBenzenetrans-1,3-Dichloropropene2-Chloroethyl vinyl etherBromoform4-Methyl-2-Pentanone (MIBK)2-HexanoneTetrachloroethene1,1,2,2-TetrachloroethaneToluene
LAI-P6-8.0 LAI-P6-12.0 LAI-P7-(3-4) LAI-P7-(7.5-8.5) LAI-P7-(11.5-12.5) LAI-P7-(15.5-16.5) LAI-P8-8.0 LAI-P8-12.0 LAI-P9-(5.5-6.5) LAI-P9-(11-12) LAI-P10-5.5 LAI-P11-(5-6) LAI-P11-(9.5-10.5) LAI-P11-(15-16) LAI-STKPLOU16F OU16G OU22M OU22N OU22O OU22S OU16I OU16J OU23A OU23B OU16H OU22P OU22Q OU22R OU23C
4/3/2009 4/3/2009 4/6/2009 4/6/2009 4/6/2009 4/6/2009 4/3/2009 4/3/2009 4/6/2009 4/6/2009 4/3/2009 4/6/2009 4/6/2009 4/6/2009 4/6/2009
42 U 47 U 90 92 1.1 U 100 U 40 U 41 U 63 U 75 U 79 U 1.1 U 1.0 U 1.2 U 56 U42 U 47 U 140 120 1.1 U 100 U 40 U 41 U 63 U 75 U 79 U 1.1 U 1.0 U 1.2 U 56 U42 U 47 U 55 U 52 U 1.1 U 55,000 40 U 41 U 63 U 75 U 79 U 1.1 U 1.0 U 1.2 U 56 U42 U 47 U 55 U 52 U 1.1 U 100 U 40 U 41 U 63 U 75 U 79 U 1.1 U 1.0 U 1.2 U 56 U
260 U 300 U 110 U 100 U 2.2 200 U 300 U 320 U 130 U 150 U 590 U 3.8 3.1 2.4 110 U210 U 240 U 280 U 260 U 13 510 U 200 U 210 U 320 U 370 U 400 U 32 25 11 280 U
42 U 47 U 55 U 52 U 1.1 U 100 U 40 U 41 U 63 U 75 U 79 U 1.1 U 1.0 U 1.2 U 56 U42 U 47 U 55 U 52 U 1.1 U 450 40 U 41 U 63 U 75 U 79 U 1.1 U 1.0 U 1.2 U 56 U42 U 47 U 55 U 52 U 1.1 U 100 U 40 U 41 U 63 U 75 U 79 U 1.1 U 1.0 U 1.2 U 56 U42 U 47 U 55 U 52 U 1.1 U 2,500 40 U 41 U 63 U 75 U 79 U 1.1 U 1.0 U 1.2 U 56 U42 U 47 U 55 U 52 U 7.9 400,000 40 41 U 63 U 75 U 140 1.1 U 1.0 U 1.2 U 56 U42 U 47 U 55 U 52 U 1.1 U 100 U 40 U 41 U 63 U 75 U 79 U 1.1 U 1.0 U 1.2 U 56 U42 U 47 U 55 U 52 U 1.1 U 190 40 U 41 U 63 U 75 U 79 U 1.1 U 1.0 U 1.2 U 56 U
210 U 240 U 280 U 260 U 5.5 U 510 U 200 U 210 U 320 U 370 U 400 U 5.4 U 5.0 U 5.9 U 280 U42 U 47 U 55 U 52 U 1.1 U 100 U 40 U 41 U 63 U 75 U 79 U 1.1 U 1.0 U 1.2 U 56 U42 U 47 U 55 U 52 U 1.1 U 100 U 40 U 41 U 63 U 75 U 79 U 1.1 U 1.0 U 1.2 U 56 U
210 U 240 U 280 U 260 U 5.5 U 510 U 200 U 210 U 320 U 370 U 400 U 5.4 U 5.0 U 5.9 U 280 U42 U 47 U 55 U 52 U 1.1 U 100 U 40 U 41 U 63 U 75 U 79 U 1.1 U 1.0 U 1.2 U 56 U42 U 47 U 55 U 52 U 1.1 U 100 U 40 U 41 U 63 U 75 U 79 U 1.1 U 1.0 U 1.2 U 56 U42 U 47 U 55 U 52 U 1.1 U 100 U 40 U 41 U 63 U 75 U 79 U 1.1 U 1.0 U 1.2 U 56 U65 47 U 55 U 52 U 4.5 17,000 120 41 U 63 U 75 U 100 1.6 2.8 1.2 U 7242 U 47 U 55 U 52 U 1.1 U 100 U 40 U 41 U 63 U 75 U 79 U 1.1 U 1.0 U 1.2 U 56 U42 U 47 U 55 U 52 U 1.1 U 100 U 40 U 41 U 63 U 75 U 79 U 1.1 U 1.0 U 1.2 U 56 U42 U 47 U 55 U 52 U 1.1 U 100 U 40 U 41 U 63 U 75 U 79 U 1.1 U 1.0 U 1.2 U 56 U42 U 47 U 55 U 52 U 1.1 U 100 U 40 U 41 U 63 U 75 U 79 U 1.1 U 1.0 U 1.2 U 56 U
210 U 240 U 280 U 260 U 5.5 U 510 U 200 U 210 U 320 U 370 U 400 U 5.4 U 5.0 U 5.9 U 280 U42 U 47 U 55 U 52 U 1.1 U 100 U 40 U 41 U 63 U 75 U 79 U 1.1 U 1.0 U 1.2 U 56 U
210 U 240 U 280 U 260 U 5.5 U 510 U 200 U 210 U 320 U 370 U 400 U 5.4 U 5.0 U 5.9 U 280 U210 U 240 U 280 U 260 U 5.5 U 510 U 200 U 210 U 320 U 370 U 400 U 5.4 U 5.0 U 5.9 U 280 U
3,200 380 840 1,600 160 36,000 3,100 660 460 840 430 43 90 12 2,20042 U 47 U 55 U 52 U 1.1 U 100 U 40 U 41 U 63 U 75 U 79 U 1.1 U 1.0 U 1.2 U 56 U42 U 47 U 55 U 52 U 1.1 U 100 U 40 U 41 U 63 U 75 U 79 U 1.1 U 1.0 U 1.2 U 56 U
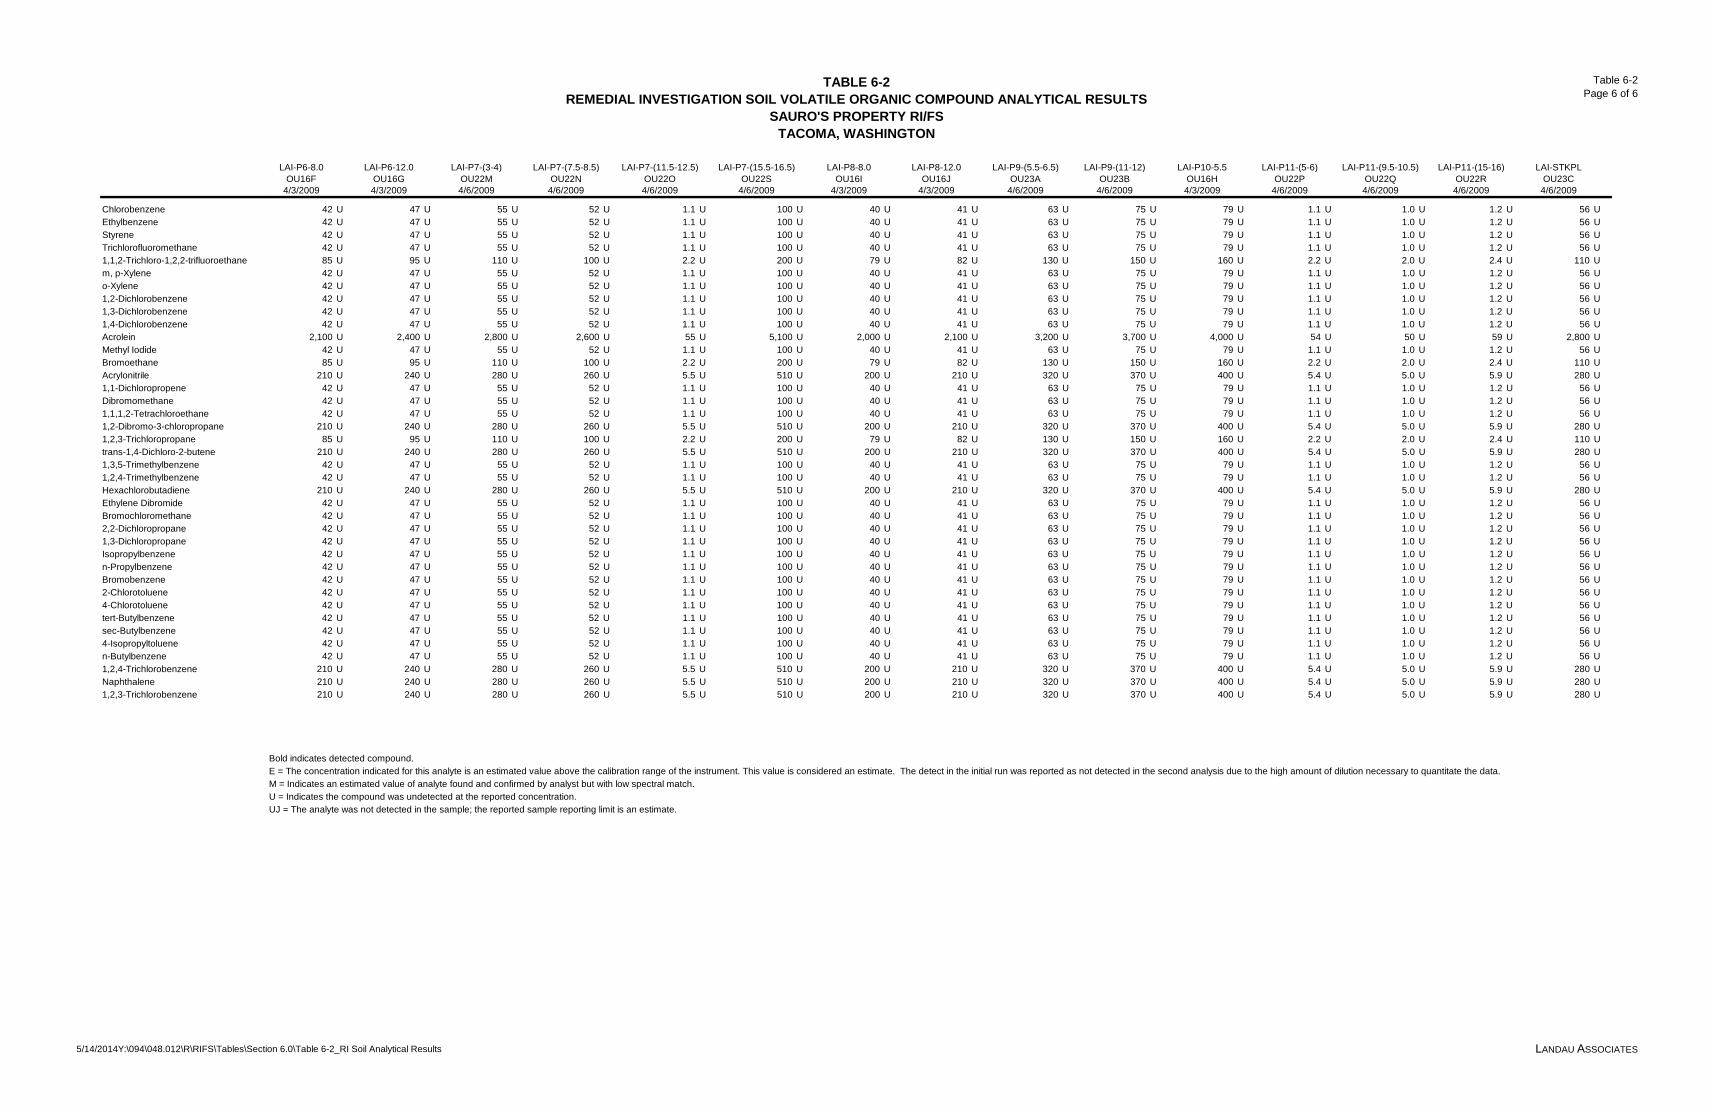
TABLE 6-2REMEDIAL INVESTIGATION SOIL VOLATILE ORGANIC COMPOUND ANALYTICAL RESULTS
SAURO'S PROPERTY RI/FSTACOMA, WASHINGTON
Table 6-2Page 6 of 6
5/14/2014Y:\094\048.012\R\RIFS\Tables\Section 6.0\Table 6-2_RI Soil Analytical Results LANDAU ASSOCIATES
ChlorobenzeneEthylbenzeneStyreneTrichlorofluoromethane1,1,2-Trichloro-1,2,2-trifluoroethanem, p-Xyleneo-Xylene1,2-Dichlorobenzene1,3-Dichlorobenzene1,4-DichlorobenzeneAcroleinMethyl IodideBromoethaneAcrylonitrile1,1-DichloropropeneDibromomethane1,1,1,2-Tetrachloroethane1,2-Dibromo-3-chloropropane1,2,3-Trichloropropanetrans-1,4-Dichloro-2-butene1,3,5-Trimethylbenzene1,2,4-TrimethylbenzeneHexachlorobutadieneEthylene DibromideBromochloromethane2,2-Dichloropropane1,3-DichloropropaneIsopropylbenzenen-PropylbenzeneBromobenzene2-Chlorotoluene4-Chlorotoluenetert-Butylbenzenesec-Butylbenzene4-Isopropyltoluenen-Butylbenzene1,2,4-TrichlorobenzeneNaphthalene1,2,3-Trichlorobenzene
LAI-P6-8.0 LAI-P6-12.0 LAI-P7-(3-4) LAI-P7-(7.5-8.5) LAI-P7-(11.5-12.5) LAI-P7-(15.5-16.5) LAI-P8-8.0 LAI-P8-12.0 LAI-P9-(5.5-6.5) LAI-P9-(11-12) LAI-P10-5.5 LAI-P11-(5-6) LAI-P11-(9.5-10.5) LAI-P11-(15-16) LAI-STKPLOU16F OU16G OU22M OU22N OU22O OU22S OU16I OU16J OU23A OU23B OU16H OU22P OU22Q OU22R OU23C
4/3/2009 4/3/2009 4/6/2009 4/6/2009 4/6/2009 4/6/2009 4/3/2009 4/3/2009 4/6/2009 4/6/2009 4/3/2009 4/6/2009 4/6/2009 4/6/2009 4/6/2009
42 U 47 U 55 U 52 U 1.1 U 100 U 40 U 41 U 63 U 75 U 79 U 1.1 U 1.0 U 1.2 U 56 U42 U 47 U 55 U 52 U 1.1 U 100 U 40 U 41 U 63 U 75 U 79 U 1.1 U 1.0 U 1.2 U 56 U42 U 47 U 55 U 52 U 1.1 U 100 U 40 U 41 U 63 U 75 U 79 U 1.1 U 1.0 U 1.2 U 56 U42 U 47 U 55 U 52 U 1.1 U 100 U 40 U 41 U 63 U 75 U 79 U 1.1 U 1.0 U 1.2 U 56 U85 U 95 U 110 U 100 U 2.2 U 200 U 79 U 82 U 130 U 150 U 160 U 2.2 U 2.0 U 2.4 U 110 U42 U 47 U 55 U 52 U 1.1 U 100 U 40 U 41 U 63 U 75 U 79 U 1.1 U 1.0 U 1.2 U 56 U42 U 47 U 55 U 52 U 1.1 U 100 U 40 U 41 U 63 U 75 U 79 U 1.1 U 1.0 U 1.2 U 56 U42 U 47 U 55 U 52 U 1.1 U 100 U 40 U 41 U 63 U 75 U 79 U 1.1 U 1.0 U 1.2 U 56 U42 U 47 U 55 U 52 U 1.1 U 100 U 40 U 41 U 63 U 75 U 79 U 1.1 U 1.0 U 1.2 U 56 U42 U 47 U 55 U 52 U 1.1 U 100 U 40 U 41 U 63 U 75 U 79 U 1.1 U 1.0 U 1.2 U 56 U
2,100 U 2,400 U 2,800 U 2,600 U 55 U 5,100 U 2,000 U 2,100 U 3,200 U 3,700 U 4,000 U 54 U 50 U 59 U 2,800 U42 U 47 U 55 U 52 U 1.1 U 100 U 40 U 41 U 63 U 75 U 79 U 1.1 U 1.0 U 1.2 U 56 U85 U 95 U 110 U 100 U 2.2 U 200 U 79 U 82 U 130 U 150 U 160 U 2.2 U 2.0 U 2.4 U 110 U
210 U 240 U 280 U 260 U 5.5 U 510 U 200 U 210 U 320 U 370 U 400 U 5.4 U 5.0 U 5.9 U 280 U42 U 47 U 55 U 52 U 1.1 U 100 U 40 U 41 U 63 U 75 U 79 U 1.1 U 1.0 U 1.2 U 56 U42 U 47 U 55 U 52 U 1.1 U 100 U 40 U 41 U 63 U 75 U 79 U 1.1 U 1.0 U 1.2 U 56 U42 U 47 U 55 U 52 U 1.1 U 100 U 40 U 41 U 63 U 75 U 79 U 1.1 U 1.0 U 1.2 U 56 U
210 U 240 U 280 U 260 U 5.5 U 510 U 200 U 210 U 320 U 370 U 400 U 5.4 U 5.0 U 5.9 U 280 U85 U 95 U 110 U 100 U 2.2 U 200 U 79 U 82 U 130 U 150 U 160 U 2.2 U 2.0 U 2.4 U 110 U
210 U 240 U 280 U 260 U 5.5 U 510 U 200 U 210 U 320 U 370 U 400 U 5.4 U 5.0 U 5.9 U 280 U42 U 47 U 55 U 52 U 1.1 U 100 U 40 U 41 U 63 U 75 U 79 U 1.1 U 1.0 U 1.2 U 56 U42 U 47 U 55 U 52 U 1.1 U 100 U 40 U 41 U 63 U 75 U 79 U 1.1 U 1.0 U 1.2 U 56 U
210 U 240 U 280 U 260 U 5.5 U 510 U 200 U 210 U 320 U 370 U 400 U 5.4 U 5.0 U 5.9 U 280 U42 U 47 U 55 U 52 U 1.1 U 100 U 40 U 41 U 63 U 75 U 79 U 1.1 U 1.0 U 1.2 U 56 U42 U 47 U 55 U 52 U 1.1 U 100 U 40 U 41 U 63 U 75 U 79 U 1.1 U 1.0 U 1.2 U 56 U42 U 47 U 55 U 52 U 1.1 U 100 U 40 U 41 U 63 U 75 U 79 U 1.1 U 1.0 U 1.2 U 56 U42 U 47 U 55 U 52 U 1.1 U 100 U 40 U 41 U 63 U 75 U 79 U 1.1 U 1.0 U 1.2 U 56 U42 U 47 U 55 U 52 U 1.1 U 100 U 40 U 41 U 63 U 75 U 79 U 1.1 U 1.0 U 1.2 U 56 U42 U 47 U 55 U 52 U 1.1 U 100 U 40 U 41 U 63 U 75 U 79 U 1.1 U 1.0 U 1.2 U 56 U42 U 47 U 55 U 52 U 1.1 U 100 U 40 U 41 U 63 U 75 U 79 U 1.1 U 1.0 U 1.2 U 56 U42 U 47 U 55 U 52 U 1.1 U 100 U 40 U 41 U 63 U 75 U 79 U 1.1 U 1.0 U 1.2 U 56 U42 U 47 U 55 U 52 U 1.1 U 100 U 40 U 41 U 63 U 75 U 79 U 1.1 U 1.0 U 1.2 U 56 U42 U 47 U 55 U 52 U 1.1 U 100 U 40 U 41 U 63 U 75 U 79 U 1.1 U 1.0 U 1.2 U 56 U42 U 47 U 55 U 52 U 1.1 U 100 U 40 U 41 U 63 U 75 U 79 U 1.1 U 1.0 U 1.2 U 56 U42 U 47 U 55 U 52 U 1.1 U 100 U 40 U 41 U 63 U 75 U 79 U 1.1 U 1.0 U 1.2 U 56 U42 U 47 U 55 U 52 U 1.1 U 100 U 40 U 41 U 63 U 75 U 79 U 1.1 U 1.0 U 1.2 U 56 U
210 U 240 U 280 U 260 U 5.5 U 510 U 200 U 210 U 320 U 370 U 400 U 5.4 U 5.0 U 5.9 U 280 U210 U 240 U 280 U 260 U 5.5 U 510 U 200 U 210 U 320 U 370 U 400 U 5.4 U 5.0 U 5.9 U 280 U210 U 240 U 280 U 260 U 5.5 U 510 U 200 U 210 U 320 U 370 U 400 U 5.4 U 5.0 U 5.9 U 280 U
Bold indicates detected compound.E = The concentration indicated for this analyte is an estimated value above the calibration range of the instrument. This value is considered an estimate. The detect in the initial run was reported as not detected in the second analysis due to the high amount of dilution necessary to quantitate the data.M = Indicates an estimated value of analyte found and confirmed by analyst but with low spectral match.U = Indicates the compound was undetected at the reported concentration.UJ = The analyte was not detected in the sample; the reported sample reporting limit is an estimate.

TABLE 6-3DAVITA DRAIN AND OUTFALL WATER VOLATILE ORGANIC COMPOUND ANALYTICAL RESULTS
SAURO'S PROPERTY RI/FSTACOMA, WASHINGTON
Table 6-3Page 1 of 2
5/14/2014Y:\094\048.012\R\RIFS\Tables\Section 6.0\Table 6-3_RI drain&outfall water sample results LANDAU ASSOCIATES
Surface Water Screening Levels DRAIN-20090407 DRAIN-20090824 OUTFALL-20090408 OUTFALL-20090824Marine Surface Water ARARs OU69A PL79A OU69B PL79B
for COCs (µg/L) 04/07/09 08/24/09 4/8/2009 08/24/09
VOLATILES (µg/L)Method SW8260BChloromethane 0.2 U 0.5 U 0.2 U 0.5 UBromomethane 0.5 U 0.5 U 0.5 U 0.5 UVinyl Chloride 2.4 (a) 13 36 0.2 U 0.3Chloroethane 0.2 U 0.2 U 0.2 U 0.2 UMethylene Chloride 0.5 U 0.5 U 0.5 U 0.5 UAcetone 2.5 U 5 U 2.5 U 5 UCarbon Disulfide 0.2 U 0.2 U 0.2 U 0.2 U1,1-Dichloroethene 0.2 U 0.2 0.2 U 0.2 U1,1-Dichloroethane 0.2 U 0.2 U 0.2 U 0.2 Utrans-1,2-Dichloroethene 10000 (a) 1.1 2.6 0.2 U 0.2 Ucis-1,2-Dichloroethene NE 25 50 0.4 0.9Chloroform 0.2 U 0.2 U 0.2 U 0.2 U1,2-Dichloroethane 0.2 U 0.2 U 0.2 U 0.2 U2-Butanone 2.5 U 5 U 2.5 U 5 U1,1,1-Trichloroethane 0.2 U 0.2 U 0.2 U 0.2 UCarbon Tetrachloride 0.2 U 0.2 U 0.2 U 0.2 UVinyl Acetate 1.0 U 1 U 1.0 U 1 UBromodichloromethane 0.2 U 0.2 U 0.2 U 0.2 U1,2-Dichloropropane 0.2 U 0.2 U 0.2 U 0.2 Ucis-1,3-Dichloropropene 0.2 U 0.2 U 0.2 U 0.2 UTrichloroethene 30 (a) 5.6 2.8 0.2 U 0.2 UDibromochloromethane 0.2 U 0.2 U 0.2 U 0.2 U1,1,2-Trichloroethane 0.2 U 0.2 U 0.2 U 0.2 UBenzene 0.2 U 0.2 U 0.2 U 0.2 Utrans-1,3-Dichloropropene 0.2 U 0.2 U 0.2 U 0.2 U2-Chloroethylvinylether 1.0 U 1 U 1.0 U 1 UBromoform 0.2 U 0.2 U 0.2 U 0.2 U4-Methyl-2-Pentanone (MIBK) 2.5 U 5 U 2.5 U 5 U2-Hexanone 2.5 U 5 U 2.5 U 5 UTetrachloroethene 3.3 (a) 3.8 1.2 0.2 U 0.2 U1,1,2,2-Tetrachloroethane 0.2 U 0.2 U 0.2 U 0.2 UToluene 0.2 U 0.2 U 0.2 U 0.2 UChlorobenzene 0.2 U 0.2 U 0.2 U 0.2 UEthylbenzene 0.2 U 0.2 U 0.2 U 0.2 UStyrene 0.2 U 0.2 U 0.2 U 0.2 UTrichlorofluoromethane 0.2 U 0.2 U 0.2 U 0.2 U1,1,2-Trichloro-1,2,2-trifluoroethane 0.2 U 0.2 U 0.2 U 0.2 Um, p-Xylene 0.4 U 0.4 U 0.4 U 0.4 Uo-Xylene 0.2 U 0.2 U 0.2 U 0.2 U1,2-Dichlorobenzene 0.2 U 0.2 U 0.2 U 0.2 U1,3-Dichlorobenzene 0.2 U 0.2 U 0.2 U 0.2 U1,4-Dichlorobenzene 0.2 U 0.2 U 0.2 U 0.2 UAcrolein 5.0 UJ 5 U 5.0 UJ 5 U

TABLE 6-3DAVITA DRAIN AND OUTFALL WATER VOLATILE ORGANIC COMPOUND ANALYTICAL RESULTS
SAURO'S PROPERTY RI/FSTACOMA, WASHINGTON
Table 6-3Page 2 of 2
5/14/2014Y:\094\048.012\R\RIFS\Tables\Section 6.0\Table 6-3_RI drain&outfall water sample results LANDAU ASSOCIATES
Surface Water Screening Levels DRAIN-20090407 DRAIN-20090824 OUTFALL-20090408 OUTFALL-20090824Marine Surface Water ARARs OU69A PL79A OU69B PL79B
for COCs (µg/L) 04/07/09 08/24/09 4/8/2009 08/24/09
Methyl Iodide 1.0 U 1 U 1.0 U 1 UBromoethane 0.2 U 0.2 U 0.2 U 0.2 UAcrylonitrile 1.0 U 1 U 1.0 U 1 U1,1-Dichloropropene 0.2 U 0.2 U 0.2 U 0.2 UDibromomethane 0.2 U 0.2 U 0.2 U 0.2 U1,1,1,2-Tetrachloroethane 0.2 U 0.2 U 0.2 U 0.2 U1,2-Dibromo-3-chloropropane 0.5 U 0.5 U 0.5 U 0.5 U1,2,3-Trichloropropane 0.5 U 0.5 U 0.5 U 0.5 Utrans-1,4-Dichloro-2-butene 1.0 U 1 U 1.0 U 1 U1,3,5-Trimethylbenzene 0.2 U 0.2 U 0.2 U 0.2 U1,2,4-Trimethylbenzene 0.2 U 0.2 U 0.2 U 0.2 UHexachlorobutadiene 0.5 U 0.5 U 0.5 U 0.5 UEthylene Dibromide 0.2 U 0.2 U 0.2 U 0.2 UBromochloromethane 0.2 U 0.2 U 0.2 U 0.2 U2,2-Dichloropropane 0.2 U 0.2 U 0.2 U 0.2 U1,3-Dichloropropane 0.2 U 0.2 U 0.2 U 0.2 UIsopropylbenzene 0.2 U 0.2 U 0.2 U 0.2 Un-Propylbenzene 0.2 U 0.2 U 0.2 U 0.2 UBromobenzene 0.2 U 0.2 U 0.2 U 0.2 U2-Chlorotoluene 0.2 U 0.2 U 0.2 U 0.2 U4-Chlorotoluene 0.2 U 0.2 U 0.2 U 0.2 Utert-Butylbenzene 0.2 U 0.2 U 0.2 U 0.2 Usec-Butylbenzene 0.2 U 0.2 U 0.2 U 0.2 U4-Isopropyltoluene 0.2 U 0.2 U 0.2 U 0.2 Un-Butylbenzene 0.2 U 0.2 U 0.2 U 0.2 U1,2,4-Trichlorobenzene 0.5 U 0.5 U 0.5 U 0.5 UNaphthalene 0.5 U 0.5 U 0.5 U 0.5 U1,2,3-Trichlorobenzene 0.5 U 0.5 U 0.5 U 0.5 U
ARAR = Applicable, Relevant, and Appropriate RequirementsBold = Detected compoundBox = Exceedance of screening criteriaµg/L = micrograms per literNE = not establishedU = Indicates the compound was undetected at the reported concentration.UJ = The analyte was not detected in the sample; the reported sample reporting limit is an estimate. The presence or absence of the analyte cannot be verified.
(a) Applicable ARAR is the marine surface water ARAR from the Clean Water Act 304 protective of human health. ARAR determined from Ecology's CLARC data base on 1/26/14.

TABLE 6-4REMEDIAL INVESTIGATION DIRECT-PUSH GROUNDWATER VOLATILE ORGANIC COMPOUND ANALYTICAL RESULTS
SAURO'S PROPERTY RI/FSTACOMA, WASHINGTON
Table 6-4Page 1 of 1
5/14/2014Y:\094\048.012\R\RIFS\Tables\Section 6.0\Table 6-4_VOC 2013 DP Data Table LANDAU ASSOCIATES
Location Lab IDDate
Collected
LAI-B6 (20) T311194-01 11/26/2013 0.2 UJ 0.2 UJ 0.2 UJ 0.2 UJLAI-B6 (20) DUP T311194-07 11/26/2013 0.2 UJ 0.2 UJ 0.2 UJ 0.2 UJLAI-B6 (25.6) T311194-10 11/26/2013 0.2 UJ 0.2 UJ 0.2 UJ 0.2 UJLAI-B7 (20) T311194-02 11/26/2013 0.2 UJ 0.2 UJ 0.2 UJ 0.2 UJLAI-B7 (25) T311194-11 11/26/2013 0.2 UJ 0.2 UJ 0.2 UJ 0.6 JLAI-B8 (20) T311194-03 11/26/2013 0.2 UJ 0.2 UJ 0.2 UJ 0.2 UJLAI-B8 (25) T311194-12 11/26/2013 0.2 UJ 0.2 UJ 0.2 UJ 0.2 UJLAI-B9 (20) T311194-04 11/26/2013 0.2 UJ 0.2 UJ 0.2 UJ 0.2 UJLAI-B9 (30) T311194-13 11/26/2013 0.2 UJ 0.2 UJ 0.2 UJ 0.2 UJLAI-B10 (19) T311194-05 11/26/2013 0.2 UJ 0.2 UJ 0.2 UJ 0.2 UJLAI-B10 (30) T311194-14 11/26/2013 0.2 J 0.4 J 5.8 J 0.2 UJ
Screening Criteria (µg/L)
MTCA Method A Groundwater CUL 5 5 NE 0.2
3.3 3 640 2.4
Bold indicates detected compound.Box indicates exceeds Model Toxics Control Act (MTCA) Method B groundwater cleanup level (CUL) protective of marine surface waterNE = Not establishedJ = Indicates the analyte was positively identified; the associated numerical value is the approximate concentration of the analyte in the sample.UJ = The analyte was not detected in the sample; the reported sample reporting limit is an estimate.
(a) All Method B CULs presented are based on risk of individual contaminants only (i.e., cummulative risk not considered)(b) Using federal fish consumption rate (FCR) = 17.5 gallons per day
Note:All samples were collected using peristaltic pump
MTCA Method B Groundwater CUL Protective of Marine Surface Water (a)(b)
VOLATILES (µg/L)
EPA Method 8260C
Vinyl Chloridecis-1,2-DichloroetheneTrichloroetheneTetrachloroethene

TABLE 6-5REMEDIAL INVESTIGATION QUARTERLY GROUNDWATER
VOLATILE ORGANIC COMPOUND ANALYTICAL RESULTS - CONSTITUENTS OF CONCERN SAURO'S PROPERTY RI/FS
TACOMA, WASHINGTON
Table 6-5Page 1 of 5
5/14/2014 Y:\094\048.012\R\RIFS\Tables\Section 6.0\Table 6-5_VOC data RI wells_box exceedances LANDAU ASSOCIATES
Location Lab IDDate
Collected Tetrachloroethene Trichloroethenecis-1,2-Dichloroethene
Vinyl Chloride
LAI-MW1 MX72A 5/21/2008 0.2 U 0.2 0.9 0.2 ULAI-MW1 (63) OX16J 4/28/2009 0.2 U 0.2 U 0.2 U 0.2 ULAI-MW1 (63) QV52I 5/5/2010 0.2 U 0.2 U 0.2 U 0.2 ULAI-MW1 (63) RF48I 7/21/2010 0.2 U 0.8 0.2 U 0.2 ULAI-MW1 (63) 2010-12739 10/27/2010 8.0 U 8.0 U 8.0 U 8.0 ULAI-MW1 (63) 2011-00970 1/27/2011 2.1 0.5 J 0.4 J 0.2 ULAI-MW1 (63) T104125-04 4/21/2011 1.8 0.5 0.2 0.2 ULAI-MW1 (63) T107004-04 7/1/2011 4.5 1.0 0.5 J 1.0 ULAI-MW1 (63) T110107-04 10/18/2011 0.6 0.2 U 0.1 U 0.07 ULAI-MW1 (63) T201046-04 1/9/2012 0.4 J 0.5 U 0.5 U 0.5 ULAI-MW1 (63) T204007-05 4/11/2012 0.5 U 0.5 U 0.5 U 0.5 ULAI-MW1 (63) T207012-05 7/16/2012 1.1 J 0.5 U 0.2 U 0.2 ULAI-MW1 (63) T210008-05 10/9/2012 0.2 U 0.07 U 0.1 U 0.1 ULAI-MW1 (63) T301121-05 1/15/2013 0.5 U 0.2 U 0.5 U 0.2 ULAI-MW1 (63) T304010-05 4/2/2013 0.2 U 0.2 U 0.2 U 0.2 ULAI-MW1 (63) T306134-05 6/18/2013 0.2 U 0.2 U 0.2 U 0.2 ULAI-MW1 (63) T309065-05 9/9/2013 0.2 U 0.2 U 0.2 U 0.2 U
LAI-MW2 MX18C 5/19/2008 120 62 100 1.4LAI-MW2 (65) OX16K 4/28/2009 300 130 180 1.2LAI-MW2 (65) QV52F 5/5/2010 330 150 190 1.0LAI-MW2 (65) RF48E 7/21/2010 340 120 160 2.0 ULAI-MW2 (65) 2010-12740 10/27/2010 430 160 200 8.0 ULAI-MW2 (65) 2011-00971 1/27/2011 410 150 180 1.3LAI-MW2 (65) T104125-05 4/21/2011 360 130 150 1.0LAI-MW2 (65) T107004-05 7/1/2011 370 140 160 1.0LAI-MW2 (65) T110107-05 10/18/2011 350 120 160 1.0LAI-MW2 (65) T201046-05 1/9/2012 240 J 100 150 5.0 ULAI-MW2 (65) T204007-06 4/11/2012 50 89 110 0.9LAI-MW2 (65) T207012-06 7/3/2012 340 110 140 3.0 JLAI-MW2 (65) T210008-06 10/9/2012 410 140 150 0.8LAI-MW2 (65) T301121-06 1/15/2013 390 130 140 0.8LAI-MW2 (65) T304010-06 4/2/2013 380 110 100 0.7LAI-MW2 (65) T306134-06 6/18/2013 280 J 87 J 120 J 0.8LAI-MW2 (65) T309065-06 9/9/2013 360 120 160 J 0.8
LAI-MW3 MX18B 5/19/2008 66 37 65 0.5LAI-MW3 (75) OX30B 4/30/2009 63 45 76 0.4LAI-MW3-GF OX30F 5/1/2009 88 40 71 0.3LAI-MW3 (75) QV52H 5/5/2010 47 35 52 0.2 ULAI-MW3 (75) RF48F 7/21/2010 91 39 52 0.6 ULAI-MW3 (75) 2010-12741 10/27/2010 120 53 73 8.0 ULAI-MW3 (75) 2011-00972 1/27/2011 120 52 64 0.3LAI-MW3 (75) T104125-06 4/21/2011 100 46 59 0.2 ULAI-MW3 (75) T107004-06 7/1/2011 110 42 52 1.0 ULAI-MW3 (75) T110107-06 10/18/2011 100 39 51 0.1 JLAI-MW3 (75) T201046-06 1/9/2012 70 J 37 56 0.1 JLAI-MW3 (75) T204007-07 4/11/2012 74 37 51 0.2 JLAI-MW3 (75) T207012-07 7/3/2012 61 16 23 0.2 ULAI-MW3 (75) T210008-07 10/9/2012 5.1 4.2 15 0.1 ULAI-MW3 (75) T301121-07 1/15/2013 120 37 48 0.1 JLAI-MW3 (75) T304010-07 4/2/2013 97 33 36 0.2 ULAI-MW3 (75) T306134-07 6/18/2013 72 J 27 44 0.2 ULAI-MW3 (75) T309065-07 9/9/2013 78 34 54 0.2 U
LAI-MW4 MX18A 5/19/2008 0.2 U 0.2 0.9 0.6LAI-MW4-PP OX16M 4/28/2009 0.2 U 0.2 U 0.5 0.5
VOLATILES (µg/L) Method SW8260B

TABLE 6-5REMEDIAL INVESTIGATION QUARTERLY GROUNDWATER
VOLATILE ORGANIC COMPOUND ANALYTICAL RESULTS - CONSTITUENTS OF CONCERN SAURO'S PROPERTY RI/FS
TACOMA, WASHINGTON
Table 6-5Page 2 of 5
5/14/2014 Y:\094\048.012\R\RIFS\Tables\Section 6.0\Table 6-5_VOC data RI wells_box exceedances LANDAU ASSOCIATES
Location Lab IDDate
Collected Tetrachloroethene Trichloroethenecis-1,2-Dichloroethene
Vinyl Chloride
VOLATILES (µg/L) Method SW8260B
LAI-MW4 (25) OX16L 4/28/2009 0.2 U 0.2 U 0.6 0.3LAI-MW4 (25) QV52G 5/5/2010 0.2 U 0.2 U 0.4 0.2LAI-MW4 (25) RF48D 7/21/2010 0.2 U 1.0 0.6 0.2LAI-MW4 (25) 2010-12742 10/27/2010 8.0 U 8.0 U 8.0 U 8.0 ULAI-MW4 (25) 2011-00973 1/27/2011 1.0 U 0.3 J 0.7 J 0.2 ULAI-MW4 (25) T104125-07 4/21/2011 1.0 0.3 0.6 0.2 ULAI-MW4 (25) T107004-07 7/1/2011 3.3 0.7 J 0.7 J 0.2 JLAI-MW4 (25) T110107-07 10/18/2011 0.3 J 0.2 U 0.5 0.07 ULAI-MW4 (25) DUP T110107-15 10/18/2011 0.6 0.2 U 0.5 0.07 ULAI-MW4 (25) T201046-07 1/9/2012 0.2 J 0.5 U 0.5 U 0.5 ULAI-MW4 (25) T204007-08 4/10/2012 0.5 U 0.5 U 0.6 0.2 JLAI-MW4 (25) DUP T204007-15 4/10/2012 0.5 U 0.5 U 0.5 0.2LAI-MW4 (25) T207012-08 7/3/2012 0.2 U 0.5 U 0.5 2.0 JLAI-MW4 (25) T210008-08 10/9/2012 0.2 U 0.07 U 0.8 J 0.1 ULAI-MW4 (25) T301121-08 1/15/2013 0.5 U 0.2 U 0.3 J 0.2 ULAI-MW4 (25) T304010-08 4/2/2013 0.2 U 0.2 U 0.3 0.2 ULAI-MW4 (25) T306134-08 6/18/2013 0.2 U 0.2 U 0.3 0.2 ULAI-MW4 (25) T309065-08 9/9/2013 0.2 U 0.2 U 0.6 0.2 U
LAI-MW5 RV86A 11/9/2010 0.2 U 0.2 U 0.2 U 0.2 ULAI-MW5 T102071-01 2/15/2011 0.2 U 0.2 U 0.2 U 0.2 ULAI-MW5 T110107-08 10/18/2011 0.2 U 0.2 U 0.1 U 0.07 ULAI-MW5 T201046-08 1/9/2012 0.5 U 0.5 U 0.5 U 0.5 ULAI-MW5 T204007-09 4/11/2012 0.5 U 0.5 U 0.5 U 0.5 U
LAI-MW5 (42) T104125-08 4/21/2011 0.4 0.2 U 0.2 U 0.2 ULAI-MW5 (42) T107004-08 7/1/2011 1.9 0.4 J 0.3 J 1.0 ULAI-MW5 (42) T110107-08 10/18/2011 0.2 U 0.2 U 0.1 U 0.07 ULAI-MW5 (42) T201046-08 1/9/2012 0.5 U 0.5 U 0.5 U 0.5 ULAI-MW5 (42) T204007-09 4/11/2012 0.5 U 0.5 U 0.5 U 0.5 ULAI-MW5 (42) T207012-09 7/3/2012 0.2 U 0.5 U 0.2 U 0.3 JLAI-MW5 (42) T210008-09 10/9/2012 0.2 U 0.07 U 0.1 J 0.1 JLAI-MW5 (42) T301121-09 1/15/2013 0.5 U 0.2 U 0.5 U 0.2 ULAI-MW5 (42) DUP T301121-15 1/15/2013 0.5 U 0.2 U 0.5 U 0.2 ULAI-MW5 (42) T304010-09 4/2/2013 0.4 0.2 U 0.2 U 0.2 ULAI-MW5 (42) T306134-09 6/18/2013 0.2 U 0.2 U 0.2 U 0.2 ULAI-MW5 (42) T309065-09 9/9/2013 0.2 U 0.2 U 0.2 U 0.2 U
LAI-MW5 (50) T104125-09 4/21/2011 0.2 U 0.2 U 0.2 U 0.2 ULAI-MW5 (50) DUP T104125-15 4/21/2011 3.3 0.5 0.3 0.2 ULAI-MW5 (50) T107004-09 7/1/2011 1.2 J 0.2 J 0.1 J 1.0 ULAI-MW5 (50) DUP T107004-15 7/1/2011 8.3 1.3 0.5 J 0.07 JLAI-MW5 (50) T110107-09 10/18/2011 0.2 U 0.2 U 0.1 U 0.07 ULAI-MW5 (50) T201046-09 1/9/2012 0.5 UJ 0.5 U 0.5 U 0.5 ULAI-MW5 (50) T204007-10 4/11/2012 0.5 U 0.5 U 0.5 U 0.5 ULAI-MW5 (50) T207012-10 7/3/2012 0.2 U 0.5 U 0.2 U 0.2 ULAI-MW5 (50) T210008-10 10/9/2012 0.2 U 0.07 U 0.1 J 0.1 ULAI-MW5 (50) T301121-10 1/15/2013 0.5 U 0.2 U 0.5 U 0.2 ULAI-MW5 (50) T304010-10 4/2/2013 0.2 U 0.2 U 0.2 U 0.2 ULAI-MW5 (50) T306134-10 6/18/2013 0.2 U 0.2 U 0.2 U 0.2 ULAI-MW5 (50) T309065-10 9/9/2013 0.3 0.2 U 0.2 U 0.2 U
MW-1 GeoEngineers 1/25/2001 1 U 1 U 24.7 33.3MW1 (20) Farallon 5/21/2004 0.2 U 0.2 U 2.5 2.1MW-1 RNS 7/14/2006 1 U 1 U 1 7MW-1 RNS 12/7/2006 1 U 1 U 1.3 0.4MW1 Farallon 6/4/2007 0.020 U 0.020 U 0.81 0.52MW1-PP OX16G 4/28/2009 0.2 U 0.2 U 0.5 0.2 UMW-1 QV52M 5/5/2010 0.2 U 0.2 U 0.5 0.2 U

TABLE 6-5REMEDIAL INVESTIGATION QUARTERLY GROUNDWATER
VOLATILE ORGANIC COMPOUND ANALYTICAL RESULTS - CONSTITUENTS OF CONCERN SAURO'S PROPERTY RI/FS
TACOMA, WASHINGTON
Table 6-5Page 3 of 5
5/14/2014 Y:\094\048.012\R\RIFS\Tables\Section 6.0\Table 6-5_VOC data RI wells_box exceedances LANDAU ASSOCIATES
Location Lab IDDate
Collected Tetrachloroethene Trichloroethenecis-1,2-Dichloroethene
Vinyl Chloride
VOLATILES (µg/L) Method SW8260B
MW1-PP RF48N 7/21/2010 0.2 U 0.2 U 0.2 U 0.2 UMW1-PP 2010-13068 11/3/2010 8.0 U 8.0 U 8.0 U 8.0 UMW1-PP 2011-00967 1/27/2011 0.6 J 0.2 U 0.3 J 0.2 UMW1-PP T104125-01 4/21/2011 0.2 U 0.2 U 0.2 U 0.2 UMW1-PP T107004-01 7/1/2011 1.0 U 1.0 U 0.2 J 0.07 JMW1-PP T110107-01 10/18/2011 0.2 U 0.2 U 0.6 0.07 UMW1-PP T201046-01 1/9/2012 0.5 UJ 0.5 U 1.0 0.5 UMW1-PP T204007-02 4/10/2012 0.5 U 0.5 U 0.2 J 0.5 UMW1-PP T207012-02 7/3/2012 0.2 U 0.5 U 0.2 U 0.2 UMW1-PP DUP T207012-15 7/3/2012 0.2 U 0.5 U 0.2 U 0.2 UMW1-PP T210008-02 10/9/2012 0.2 U 0.07 U 0.6 0.1 UMW1-PP T301121-02 1/15/2013 0.5 U 0.2 U 0.2 J 0.2 UMW1-PP T304010-02 4/2/2013 0.2 U 0.2 U 0.3 0.2 UMW1-PP T306134-02 6/18/2013 0.2 U 0.2 U 0.3 0.2 UMW1-PP T309065-02 9/9/2013 0.2 U 0.2 U 0.5 0.2 U
MW-2 GeoEngineers 1/25/2001 7.37 10.7 134 118MW2 (17) Farallon 5/21/2004 2.6 9.6 83 60MW-2 RNS 12/7/2006 3.4 4.8 42 7.6MW2 Farallon 6/4/2007 0.87 2 12 1.8MW2-PP OX16H 4/29/2009 1.0 1.6 7.4 0.2MW-2 QV52E 5/5/2010 0.3 0.9 5.5 0.4MW2-PP RF48O 7/21/2010 0.2 U 0.3 1.0 0.2 UMW2-PP 2010-13069 11/3/2010 8.0 U 8.0 U 8.0 U 8.0 UMW2-PP 2011-00968 1/27/2011 2 1.5 4.2 1.2MW2-PP T104125-02 4/21/2011 1.0 1.3 3.9 0.2 UMW2-PP T107004-02 7/1/2011 1.7 1.4 3.4 1.0 UMW2-PP T110107-02 10/18/2011 0.9 0.9 2.4 0.6MW2-PP T201046-02 1/6/2012 0.8 J 1.0 J 3.8 J 0.7 JMW2-PP T204007-03 4/10/2012 1.0 0.8 2.4 0.1 JMW2-PP T207012-03 7/3/2012 0.2 U 0.5 U 1.6 0.2 UMW2-PP T210008-03 10/9/2012 0.9 1.0 2.3 0.2MW2-PP T301121-03 1/15/2013 0.5 0.8 3.1 1.4MW2-PP T304010-03 4/2/2013 0.5 J 0.7 J 1.2 J 0.2 UJMW2-PP T306134-03 6/18/2013 0.7 0.8 2.7 0.3MW2-PP T309065-03 9/9/2013 0.7 0.6 1.4 0.2
MW13 Farallon 10/18/2007 420 130 190 2.0 UMW-13 (51.5) OX16E 4/28/2009 540 190 180 1.5MW13-GF OX30G 5/1/2009 460 140 170 0.8MW-13 (51.5) QV52J 5/5/2010 450 160 170 1.1MW13 (51.5) RF48H 7/21/2010 520 160 150 2.0 UMW13 (51.5) 2010-12738 10/27/1020 530 150 160 8.0 UMW13 (51.5) 2011-00969 1/27/2011 640 180 170 1.3MW13 (51.5) T104125-03 4/21/2011 460 130 120 0.8MW13 (51.5) T107004-03 7/1/2011 600 160 160 1.0MW13 (51.5) T110107-03 10/18/2011 450 120 120 0.8MW13 (51.5) T201046-03 1/9/2012 400 J 130 140 1.7MW13 (51.5) T204007-04 4/11/2012 360 100 100 1.0MW13 (51.5) T207012-04 7/3/2012 380 100 120 2.7 JMW13 (51.5) T210008-04 10/9/2012 480 140 120 0.8MW13 (51.5) DUP T210008-15 10/9/2012 500 120 0.7MW13 (51.5) T301121-04 1/15/2013 550 120 110 0.8MW13 (51.5) T304010-04 4/2/2013 570 130 98 0.7MW13 (51.5) T306134-04 6/18/2013 400 J 96 J 110 J 0.8MW13 (51.5) T309065-04 9/9/2013 430 110 120 J 0.8
RNS-MW2 (44) RNS 6/30/2006 15.4 14 1 U 2 U

TABLE 6-5REMEDIAL INVESTIGATION QUARTERLY GROUNDWATER
VOLATILE ORGANIC COMPOUND ANALYTICAL RESULTS - CONSTITUENTS OF CONCERN SAURO'S PROPERTY RI/FS
TACOMA, WASHINGTON
Table 6-5Page 4 of 5
5/14/2014 Y:\094\048.012\R\RIFS\Tables\Section 6.0\Table 6-5_VOC data RI wells_box exceedances LANDAU ASSOCIATES
Location Lab IDDate
Collected Tetrachloroethene Trichloroethenecis-1,2-Dichloroethene
Vinyl Chloride
VOLATILES (µg/L) Method SW8260B
RNSMW2 RNS 12/7/2006 11.1 1.7 1.0 U 0.2 URNSMW2-PP OX15D 4/29/2009 16 1.6 0.6 0.2 URNS-MW2 (21.5) OX15A 4/29/2009 16 1.5 0.5 0.2 URNS-MW2 (32.5) OX15B 4/29/2009 16 1.5 0.5 0.2 URNS-MW2 (38.5) OX15C 4/29/2009 13 1.4 0.5 0.2 URNS-MW2 (21.5) QV52B 5/5/2010 13 0.7 0.4 0.2 URNS-MW2 (38.5) QV52D 5/5/2010 8.1 0.6 0.4 0.2 URNS-MW2 (21.5) RF48J 7/21/2010 12 0.7 0.4 0.2 URNS-MW2 (38.5) RF48L 7/21/2010 8.5 0.6 0.3 0.2 URNS-MW2 (21.5) 2010-12743 10/27/2010 20 J 8.0 U 8.0 U 8.0 URNS-MW2 (38.5) 2010-12744 10/27/2010 16 J 8.0 U 8.0 U 8.0 URNS-MW2 (21.5) 2011-00974 1/27/2011 16 1.4 0.7 J 0.2 URNS-MW2 (38.5) 2011-00975 1/27/2011 14 1.1 0.6 J 0.2 URNS-MW2 (21.5) T104125-10 4/21/2011 9.2 0.9 0.4 0.2 URNS-MW2 (38.5) T104125-11 4/21/2011 8.6 0.5 0.3 0.2 URNS-MW2 (21.5) T107004-10 7/1/2011 8.8 0.8 J 0.5 J 1.0 URNS-MW2 (38.5) T107004-11 7/1/2011 9.4 0.7 J 0.3 J 1.0 URNS-MW2 (21.5) T110107-10 10/18/2011 25 1.2 0.6 0.07 URNS-MW2 (21.5) T201046-10 1/9/2012 13 J 1.0 1.0 0.5 URNS-MW2 (21.5) T204007-11 4/11/2012 9.8 0.8 0.5 0.5 URNS-MW2 (38.5) T110107-11 10/18/2011 23 1.2 0.7 0.07 URNS-MW2 (38.5) T201046-11 1/9/2012 14 J 0.9 0.8 0.5 URNS-MW2 (38.5) T204007-12 4/11/2012 14 0.6 0.2 J 0.5 URNS-MW2 (21.5) T207012-11 7/3/2012 8.8 0.5 U 0.2 U 0.2 URNS-MW2 (38.5) T207012-12 7/3/2012 11 0.5 U 0.2 U 0.2 URNS-MW2 (21.5) T210008-11 10/9/2012 28 1.0 0.3 0.1 URNS-MW2 (38.5) T210008-12 10/9/2012 25 1.0 0.2 0.1 URNS-MW2 (21.5) T301121-11 1/15/2013 17 0.9 J 0.4 J 0.2 URNS-MW2 (38.5) T301121-12 1/15/2013 16 0.9 0.3 J 0.2 URNS-MW2 (21.5) T304010-11 4/2/2013 14 0.7 0.4 0.2 URNS-MW2 (38.5) T304010-12 4/2/2013 11 0.8 0.2 0.2 URNS-MW2 (21.5) T306134-11 6/18/2013 7.8 0.4 0.2 0.2 URNS-MW2 (38.5) T306134-12 6/18/2013 9.6 0.4 0.2 0.2 URNS-MW2 (21.5) T309065-11 9/9/2013 22 0.8 0.3 0.2 URNS-MW2 (38.5) T309065-12 9/9/2013 23 0.7 0.2 0.2 U
RNS-MW3 (23) RNS 6/30/2006 1 U 1 U 1 U 2 URNS-MW3 (14) OX15I 4/29/2009 0.2 U 0.2 U 0.2 U 0.2 URNS-MW3 (19) OX15J 4/29/2009 0.2 U 0.2 U 0.2 U 0.2 URNS-MW3 (18) RF48C 7/21/2010 2.0 U 2.0 U 2.0 U 2.0 U
RNSMW4 RNS 12/8/2006 1.0 U 1.0 U 1.0 U 0.02 URNSMW4 RNS 12/13/2006 1.0 U 1.0 U 1.0 U 0.02 URNS-MW4 (39) OX15H 4/29/2009 0.2 U 0.2 U 0.2 U 0.2 URNS-MW4 (25) RF48B 7/21/2010 100 U 100 U 100 U 100 U
RNSMW5 RNS 12/8/2006 1.0 U 1.0 U 1.0 U 0.2 URNSMW5 (26) RNS 12/8/2006 0.02 U 0.03 U 0.02 U 0.025 URNSMW5 (46) RNS 12/8/2006 0.02 U 0.03 U 0.02 U 0.025 URNSMW5 RNS 12/13/2006 1.0 U 1.0 U 1.0 U 0.2 URNSMW5 Farallon 6/5/2007 0.020 U 0.020 U 0.020 U 0.020 URNS-MW5 - (39.5) OX15G 4/29/2009 0.2 U 0.2 U 0.2 U 0.2 URNS-MW5 - (39.5) RF48A 7/21/2010 0.2 U 0.2 U 0.2 U 0.2 U
RNSMW6 RNS 12/13/2006 258 64.7 162 0.72RNSMW6 (36.5) RNS 12/13/2006 0.062 0.03 U 0.02 U 0.025 URNSMW6 (59) RNS 12/13/2006 0.055 0.03 U 0.02 U 0.025 U

TABLE 6-5REMEDIAL INVESTIGATION QUARTERLY GROUNDWATER
VOLATILE ORGANIC COMPOUND ANALYTICAL RESULTS - CONSTITUENTS OF CONCERN SAURO'S PROPERTY RI/FS
TACOMA, WASHINGTON
Table 6-5Page 5 of 5
5/14/2014 Y:\094\048.012\R\RIFS\Tables\Section 6.0\Table 6-5_VOC data RI wells_box exceedances LANDAU ASSOCIATES
Location Lab IDDate
Collected Tetrachloroethene Trichloroethenecis-1,2-Dichloroethene
Vinyl Chloride
VOLATILES (µg/L) Method SW8260B
RNSMW6 Farallon 6/5/2007 230 77 150 1.0 URNS-MW6 (42.5) OX15E 4/29/2009 180 87 100 0.4RNS-MW6 (52.5) OX15F 4/29/2009 190 98 150 0.9RNS-MW6 (42.5) QV52K 5/5/2010 96 70 37 0.2 URNS-MW6 (52.5) QV52L 5/5/2010 260 110 89 0.3RNS-MW6 (42.5) RF48G 7/21/2010 300 110 36 2.0 URNS-MW6 (52.5) RF48P 7/21/2010 620 130 78 0.4RNS-MW6 (42.5) 2010-12745 10/27/2010 890 160 90 8.0 URNS-MW6 (52.5) 2010-12746 10/27/2010 530 120 140 8.0 URNS-MW6 (42.5) 2011-00976 1/27/2011 1100 250 93 0.3 JRNS-MW6 (52.5) 2011-00977 1/27/2011 720 170 140 0.9 JRNS-MW6 (42.5) T104125-12 4/21/2011 1100 200 73 0.3RNS-MW6 (52.5) T104125-13 4/21/2011 580 130 100 0.7RNS-MW6 (42.5) T107004-12 7/1/2011 1000 96 96 0.4 JRNS-MW6 (52.5) T107004-13 7/1/2011 1200 130 130 0.8 JRNS-MW6 (42.5) T110107-12 10/18/2011 660 120 72 0.2 JRNS-MW6 (42.5) T201046-12 1/9/2012 910 J 170 60 0.5 URNS-MW6 (42.5) T204007-13 4/11/2012 530 110 88 0.8RNS-MW6 (52.5) T110107-13 10/18/2011 580 88 92 0.7RNS-MW6 (52.5) T201046-13 1/9/2012 360 J 83 89 0.7RNS-MW6 (52.5) T204007-14 4/11/2012 750 140 73 0.6RNS-MW6 (42.5) T207012-13 7/3/2012 330 93 37 0.2 URNS-MW6 (52.5) T207012-14 7/3/2012 640 120 120 2.7 JRNS-MW6 (42.5) T21008-13 10/9/2012 120 43 21 0.1 URNS-MW6 (52.5) T21008-14 10/9/2012 1400 250 93 0.1 JRNS-MW6 (42.5) T301121-13 1/15/2013 1300 210 79 0.2 URNS-MW6 (52.5) T301121-14 1/15/2013 1200 160 110 0.2RNS-MW6 (42.5) T304010-13 4/2/2013 1500 J 240 89 2.0 URNS-MW6 (52.5) T304010-14 4/2/2013 950 150 89 0.5RNS-MW6 (42.5) T306134-13 6/18/2013 590 J 190 J 85 J 0.5RNS-MW6 (52.5) T306134-14 6/18/2013 580 J 170 J 81 J 0.5RNS-MW6 (42.5) T309065-13 9/9/2013 1100 260 130 J 0.2 URNS-MW6 (52.5) T309065-14 9/9/2013 630 130 140 J 0.3
RNS-MW7 RNS 12/13/2006 1.0 U 1.0 U 1.0 U 0.2 URNS-MW7 (25) RNS 12/13/2006 0.02 U 0.03 U 0.02 U 0.025 URNS-MW7 (45) RNS 12/13/2006 0.02 U 0.03 U 0.02 U 0.025 URNS-MW7 (50.5) RNS 12/13/2006 0.02 U 0.03 U 0.02 U 0.025 URNS-MW7 (39) OX15K 4/29/2009 0.2 U 0.2 U 0.2 U 0.2 URNS-MW7 (39) RF48M 7/21/2010 0.2 U 0.2 U 0.2 U 0.2 U
5 5 70 0.2
Bold indicates detected compound.Box indicates the compound exceeds its preliminary cleanup levelJ = Indicates the analyte was positively identified; the associated numerical value is the approximate concentration of the analyte in the sample.U = Indicates the compound was undetected at the reported concentration.NA = Not analyzed.UJ = The analyte was not detected in the sample; the reported sample reporting limit is an estimate.
Sample Methods:Pump = pump unknownPP = peristaltic pumpGF = grundfos submersible pumpPDB = permeable diffusion bagGrab = sample of purge water collected from drum
Preliminary Groundwater Screening Levels (µg/L):
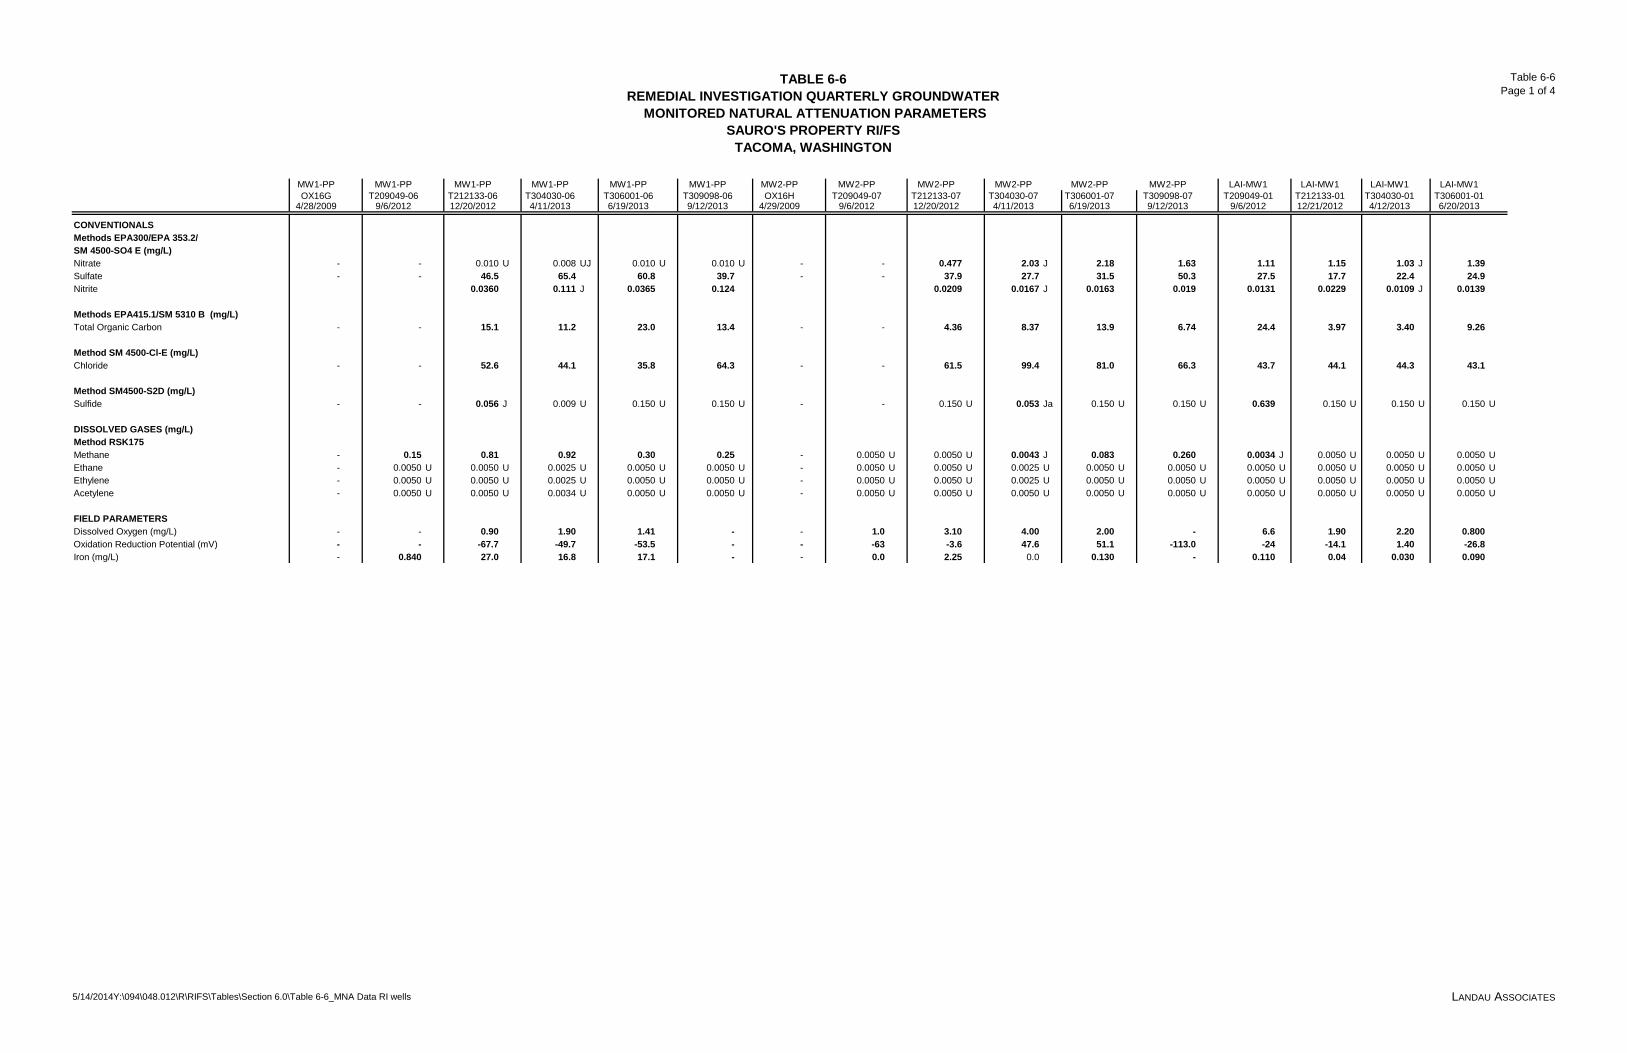
TABLE 6-6REMEDIAL INVESTIGATION QUARTERLY GROUNDWATER
MONITORED NATURAL ATTENUATION PARAMETERSSAURO'S PROPERTY RI/FS
TACOMA, WASHINGTON
Table 6-6Page 1 of 4
5/14/2014Y:\094\048.012\R\RIFS\Tables\Section 6.0\Table 6-6_MNA Data RI wells LANDAU ASSOCIATES
MW1-PP MW1-PP MW1-PP MW1-PP MW1-PP MW1-PP MW2-PP MW2-PP MW2-PP MW2-PP MW2-PP MW2-PP LAI-MW1 LAI-MW1 LAI-MW1 LAI-MW1OX16G T209049-06 T212133-06 T304030-06 T306001-06 T309098-06 OX16H T209049-07 T212133-07 T304030-07 T306001-07 T309098-07 T209049-01 T212133-01 T304030-01 T306001-01
4/28/2009 9/6/2012 12/20/2012 4/11/2013 6/19/2013 9/12/2013 4/29/2009 9/6/2012 12/20/2012 4/11/2013 6/19/2013 9/12/2013 9/6/2012 12/21/2012 4/12/2013 6/20/2013
CONVENTIONALSMethods EPA300/EPA 353.2/SM 4500-SO4 E (mg/L)Nitrate - - 0.010 U 0.008 UJ 0.010 U 0.010 U - - 0.477 2.03 J 2.18 1.63 1.11 1.15 1.03 J 1.39Sulfate - - 46.5 65.4 60.8 39.7 - - 37.9 27.7 31.5 50.3 27.5 17.7 22.4 24.9Nitrite 0.0360 0.111 J 0.0365 0.124 0.0209 0.0167 J 0.0163 0.019 0.0131 0.0229 0.0109 J 0.0139
Methods EPA415.1/SM 5310 B (mg/L)Total Organic Carbon - - 15.1 11.2 23.0 13.4 - - 4.36 8.37 13.9 6.74 24.4 3.97 3.40 9.26
Method SM 4500-Cl-E (mg/L)Chloride - - 52.6 44.1 35.8 64.3 - - 61.5 99.4 81.0 66.3 43.7 44.1 44.3 43.1
Method SM4500-S2D (mg/L)Sulfide - - 0.056 J 0.009 U 0.150 U 0.150 U - - 0.150 U 0.053 Ja 0.150 U 0.150 U 0.639 0.150 U 0.150 U 0.150 U
DISSOLVED GASES (mg/L)Method RSK175Methane - 0.15 0.81 0.92 0.30 0.25 - 0.0050 U 0.0050 U 0.0043 J 0.083 0.260 0.0034 J 0.0050 U 0.0050 U 0.0050 UEthane - 0.0050 U 0.0050 U 0.0025 U 0.0050 U 0.0050 U - 0.0050 U 0.0050 U 0.0025 U 0.0050 U 0.0050 U 0.0050 U 0.0050 U 0.0050 U 0.0050 UEthylene - 0.0050 U 0.0050 U 0.0025 U 0.0050 U 0.0050 U - 0.0050 U 0.0050 U 0.0025 U 0.0050 U 0.0050 U 0.0050 U 0.0050 U 0.0050 U 0.0050 UAcetylene - 0.0050 U 0.0050 U 0.0034 U 0.0050 U 0.0050 U - 0.0050 U 0.0050 U 0.0050 U 0.0050 U 0.0050 U 0.0050 U 0.0050 U 0.0050 U 0.0050 U
FIELD PARAMETERSDissolved Oxygen (mg/L) - - 0.90 1.90 1.41 - - 1.0 3.10 4.00 2.00 - 6.6 1.90 2.20 0.800Oxidation Reduction Potential (mV) - - -67.7 -49.7 -53.5 - - -63 -3.6 47.6 51.1 -113.0 -24 -14.1 1.40 -26.8Iron (mg/L) - 0.840 27.0 16.8 17.1 - - 0.0 2.25 0.0 0.130 - 0.110 0.04 0.030 0.090

TABLE 6-6REMEDIAL INVESTIGATION QUARTERLY GROUNDWATER
MONITORED NATURAL ATTENUATION PARAMETERSSAURO'S PROPERTY RI/FS
TACOMA, WASHINGTON
Table 6-6Page 2 of 4
5/14/2014Y:\094\048.012\R\RIFS\Tables\Section 6.0\Table 6-6_MNA Data RI wells LANDAU ASSOCIATES
CONVENTIONALSMethods EPA300/EPA 353.2/SM 4500-SO4 E (mg/L)NitrateSulfateNitrite
Methods EPA415.1/SM 5310 B (mg/L)Total Organic Carbon
Method SM 4500-Cl-E (mg/L)Chloride
Method SM4500-S2D (mg/L)Sulfide
DISSOLVED GASES (mg/L)Method RSK175MethaneEthaneEthyleneAcetylene
FIELD PARAMETERSDissolved Oxygen (mg/L)Oxidation Reduction Potential (mV)Iron (mg/L)
LAI-MW1 LAI-MW2 LAI-MW2 LAI-MW2 LAI-MW2 LAI-MW2 LAI-MW3-GF LAI-MW3 LAI-MW3 LAI-MW3 LAI-MW3 LAI-MW3 LAI-MW4-PP LAI-MW4 LAI-MW4T309098-01 T209049-02 T212133-02 T304030.02 T306001-02 T309098-02 OX30F T209049-03 T212133-03 T304030-03 T306001-03 T309098-03 OX16M T209049-04 T212133-049/11/2013 9/6/2012 12/21/2012 4/12/2013 6/19/2013 9/11/2013 5/1/2009 9/6/2012 12/21/2012 4/12/2013 6/20/2013 9/11/2013 4/28/2009 9/6/2012 12/20/2012
1.40 0.010 U 0.010 U 0.008 UJ 0.018 0.010 U 0.5 0.506 0.165 0.416 J 0.647 0.655 0.1 UJ 0.017 0.010 U25.8 25.4 11.3 17.5 17.2 18.9 29.5 25.5 8.3 24.1 23.3 21.9 7.6 6.0 4.0 J
0.025 0.0100 U 0.0161 0.0575 J 0.0100 U 0.0150 0.0169 0.0357 0.0184 J 0.0129 0.020 0.0069 J 0.0480
11.2 28.4 2.38 4.11 10.3 12.3 - 27.8 4.36 6.35 11.8 16.0 3.34 34.9 10.7
47.8 12.4 8.99 U 10.0 10.8 13.0 - 15.3 5.36 U 13.8 17.1 19.3 - 36.0 33.1
0.150 U 0.132 J 0.285 0.150 U 0.150 U 0.150 U - 0.171 J 0.076 J 0.069 Ja 0.150 U 0.150 U - 0.118 J 0.029 J
0.0050 U 0.051 0.037 0.043 0.043 0.026 - 0.0050 U 0.0050 U 0.0050 U 0.0050 U 0.0050 U - 3.0 2.8 J0.0050 U 0.0035 J 0.005 U 0.0050 U 0.0050 U 0.0050 U - 0.0050 U 0.0050 U 0.0050 U 0.0050 U 0.0050 U - 0.0050 U 0.0050 U0.0050 U 0.0050 U 0.005 U 0.0050 U 0.0050 U 0.0050 U - 0.0050 U 0.0050 U 0.0050 U 0.0050 U 0.0050 U - 0.0050 U 0.0050 U0.0050 U 0.0050 U 0.005 U 0.0050 U 0.0050 U 0.0050 U - 0.0050 U 0.0050 U 0.0050 U 0.0050 U 0.0050 U - 0.0050 U 0.0050 U
1.20 9.3 3.06 2.80 1.50 2.90 0.33 10 5.36 3.77 1.30 3.00 0.08 4.8 2.52-31.8 -24 -19.2 -28.9 32.7 -44.8 22.6 -23 -28.1 -7.10 -34.9 -29.0 -140.7 -44 -75.0
0.0 0.100 0.05 0.280 0.0 0.030 0.8 0.230 0.03 0.160 0.080 0.030 4.0 1.98 4.70

TABLE 6-6REMEDIAL INVESTIGATION QUARTERLY GROUNDWATER
MONITORED NATURAL ATTENUATION PARAMETERSSAURO'S PROPERTY RI/FS
TACOMA, WASHINGTON
Table 6-6Page 3 of 4
5/14/2014Y:\094\048.012\R\RIFS\Tables\Section 6.0\Table 6-6_MNA Data RI wells LANDAU ASSOCIATES
CONVENTIONALSMethods EPA300/EPA 353.2/SM 4500-SO4 E (mg/L)NitrateSulfateNitrite
Methods EPA415.1/SM 5310 B (mg/L)Total Organic Carbon
Method SM 4500-Cl-E (mg/L)Chloride
Method SM4500-S2D (mg/L)Sulfide
DISSOLVED GASES (mg/L)Method RSK175MethaneEthaneEthyleneAcetylene
FIELD PARAMETERSDissolved Oxygen (mg/L)Oxidation Reduction Potential (mV)Iron (mg/L)
LAI-MW4 LAI-MW4 LAI-MW4 LAI-MW5-PP LAI-MW5 LAI-MW5 DUP LAI-MW5 LAI-MW5 LAI-MW5 LAI-MW5 MW-11D-PP MW-13-GF MW-13 MW-13 MW-13T304030-04 T306001-04 T309098-04 RV86A T209049-05 T209049-12 T212133-05 T304030-05 T306001-05 T309098-05 OX16B OX30G T209049-08 T212133-08 T304030-084/12/2013 6/20/2013 9/11/2013 11/9/2010 9/7/2012 9/7/2012 12/19/2012 4/12/2013 6/19/2013 9/11/2013 04/28/09 5/1/2009 9/7/2012 12/20/2012 4/11/2013
0.008 UJ 0.019 0.010 U 0.1 U 0.010 U 0.010 U 0.010 U 0.008 UJ 0.010 U 0.010 U 0.1 U 0.9 1.06 0.306 0.869 J6.9 11.3 11.1 0.1 11.2 15.3 5.4 13.6 10.1 5.3 34.9 39.2 35.8 24.1 33.1
0.0319 J 0.0090 0.0550 J 0.0203 0.0100 U 0.0490 0.138 J 0.0373 0.092 J 0.0187 0.0168 0.0709 J
6.73 17.8 19.6 1.5 35.7 34.3 10.0 10.5 17.8 24.4 1.50 U - 25.9 4.51 5.78 J
31.3 32.2 32.6 - 62.3 62.3 58.4 57.5 59.7 56.3 - - 9.43 8.28 U 8.16
0.150 U 0.150 U 0.150 U - 0.414 0.250 U 0.150 U 0.131 Ja 0.150 U 0.150 U - - 0.037 J 0.150 U 0.150 U
3.7 3.4 3.0 - 5.7 4.7 5.2 6.6 10 11 - - 0.013 0.006 0.00650.0050 U 0.0050 U 0.0050 U - 0.0050 U 0.0050 U 0.0050 U 0.0050 U 0.0050 U 0.0050 U - - 0.0050 U 0.0050 U 0.0050 U0.0050 U 0.0050 U 0.0050 U - 0.0050 U 0.0050 U 0.0050 U 0.0050 U 0.0050 U 0.0050 U - - 0.0050 U 0.0050 U 0.0050 U0.0050 U 0.0050 U 0.0050 U - 0.0050 U 0.0050 U 0.0050 U 0.0050 U 0.0050 U 0.0050 U - - 0.0050 U 0.0050 U 0.0050 U
1.86 1.84 2.60 - 7.0 - 2.32 2.00 1.70 1.00 1.04 0.10 4.5 3.20 1.48-87.3 -62.4 -82.6 -88.9 -35 - -12.2 -64.9 -28.2 -69.8 -69.2 -13.5 -8.8 -1.1 -0.8005.55 6.4 2.52 2.0 5.15 - 6.32 10.0 7.95 2.52 1.2 0.05 0.0 0.28 0.550

TABLE 6-6REMEDIAL INVESTIGATION QUARTERLY GROUNDWATER
MONITORED NATURAL ATTENUATION PARAMETERSSAURO'S PROPERTY RI/FS
TACOMA, WASHINGTON
Table 6-6Page 4 of 4
5/14/2014Y:\094\048.012\R\RIFS\Tables\Section 6.0\Table 6-6_MNA Data RI wells LANDAU ASSOCIATES
CONVENTIONALSMethods EPA300/EPA 353.2/SM 4500-SO4 E (mg/L)NitrateSulfateNitrite
Methods EPA415.1/SM 5310 B (mg/L)Total Organic Carbon
Method SM 4500-Cl-E (mg/L)Chloride
Method SM4500-S2D (mg/L)Sulfide
DISSOLVED GASES (mg/L)Method RSK175MethaneEthaneEthyleneAcetylene
FIELD PARAMETERSDissolved Oxygen (mg/L)Oxidation Reduction Potential (mV)Iron (mg/L)
MW-13 MW-13 MW-13-DUP RNS-MW2 RNS-MW2 RNS-MW2 RNS-MW6 RNS-MW6 RNS-MW6 RNS-MW6 RNS-MW6 RNS-MW7 RNS-MW7 RNS-MW7 RNS-MW7 RNS-MW7T306001-08 T309098-08 T304030-12 T304030-09 T306001-09 T309098-09 T209049-10 T212133-10 T304030-10 T306001-10 T309098-10 T209049-11 T212133-11 T304030-11 T306001-11 T309098-116/21/2013 9/10/2013 4/11/2013 4/11/2013 6/20/2013 9/10/2013 9/7/2012 12/20/2012 4/11/2013 6/21/2013 9/10/2013 9/6/2012 12/19/2012 4/11/2013 6/20/2013 9/10/2013
1.12 1.01 J 0.778 J 2.17 J 2.99 3.02 J 0.442 0.049 0.206 J 0.454 0.317 J 0.656 0.352 0.465 J 0.613 0.608 J51.3 34.6 33.6 37.0 77.3 33.4 68.6 25.4 32.8 40.9 J 33.5 43.9 33.4 43.0 43.7 41.3
0.0136 0.018 J 0.138 J 0.234 J 0.0080 0.0200 J 0.0050 J 0.0333 0.0917 J 0.0097 0.022 J 0.0100 U 0.0293 0.0576 J 0.0074 0.012 J
7.30 8.79 J 7.18 J 3.65 11.6 6.68 25 4.63 8.75 10.5 11.6 13.1 2.25 2.95 4.57 6.06
9.91 10.2 8.63 25.8 31.8 18.5 17.3 17.0 18.3 20.2 21.0 30.4 28.9 27.6 28.4 28.8
0.150 U 0.150 U 0.150 U 0.150 U 0.150 U 0.150 U 0.432 0.150 U 0.083 Ja 0.150 U 0.150 U 0.250 U 0.150 U 0.150 U 0.150 U 0.150 U
0.0093 0.0066 0.0063 0.0050 U 0.0050 U 0.0050 U 0.045 0.036 0.036 0.0076 J 0.068 0.0050 U 0.0050 U 0.0050 U 0.0050 U 0.0050 U0.0050 U 0.0050 U 0.0050 U 0.0050 U 0.0050 U 0.0050 U 0.0046 J 0.0050 U 0.0041 J 0.0050 U 0.0092 0.0050 U 0.0050 U 0.0050 U 0.0050 U 0.0050 U0.0050 U 0.0050 U 0.0050 U 0.0050 U 0.0050 U 0.0050 U 0.0050 U 0.0050 U 0.0050 U 0.0050 U 0.0050 U 0.0050 U 0.0050 U 0.0050 U 0.0050 U 0.0050 U0.0050 U 0.0050 U 0.0050 U 0.0050 U 0.0050 U 0.0050 U 0.0050 U 0.0050 U 0.0050 U 0.0050 U 0.0050 U 0.0050 U 0.0050 U 0.0050 U 0.0050 U 0.0050 U
3.30 1.28 - 8.60 5.97 6.04 5.7 2.75 3.12 3.70 3.72 8.6 1.94 0.840 2.12 0.80077.0 48.5 - 134 -21.1 66.5 -49 -6.8 16.8 58.9 55.8 -66 -23.9 -24.0 -17.7 64.3
0.150 0.240 - 0.150 0.55 0.800 0.0 0.0 0.150 0.030 0.180 1.00 0.030 U 0.250 0.150 0.120
- = Not analyzed or not measured.Bold = Detected compound.U = Indicates the compound was not detected at the reported preliminary quantitation limit (PQL).J = Indicates the analyte was positively identified; the associated numerical value is the approximate concentration of the analyte in the sample.

TABLE 6-7NATURAL ATTENUATION SCORING RESULTS SUMMARY
SAURO'S PROPERTY RI/FSTACOMA, WASHINGTON
Table 6-7Page 1 of 1
5/14/2014 Y:\094\048.012\R\RIFS\Tables\Section 6.0\Tbl6-7_MNA Scoring Summary_ongoing LANDAU ASSOCIATES
WellPlume
MonitoredOrientationto Plume Score (a) Interpretation Score Interpretation Score Interpretation Score Interpretation Score Interpretation Score Interpretation
Well Within Site?
LAI-MW1 Primary Crossgradient 2 Inadequate 3 Inadequate 1 Inadequate 1 Inadequate 1 Inadequate 2 Inadequate No
LAI-MW2 Primary Centerline 8 Limited 11 Limited 11 Limited 11 Limited 11 Limited 10 Limited Yes
LAI-MW3 Primary Centerline 8 Limited 8 Limited 7 Limited 7 Limited 9 Limited 8 Limited Yes
LAI-MW4 Primary Downgradient 17 Adequate 13 Limited 13 Limited 13 Limited 13 Limited 14 Limited No
LAI-MW5 Primary & Secondary Source Area 12 Limited 13 Limited 13 Limited 13 Limited 13 Limited 13 Limited Yes
MW-1 (b) Secondary Downgradient 2 Inadequate (c) 11 Limited 11 Limited 10 Limited 6 Limited 8 Limited No
MW-2 (b) Secondary Historical centerline 4 Inadequate (c) 14 Limited 7 Limited 8 Limited 10 Limited 9 Limited No
MW-13 Primary Centerline 9 Limited 9 Limited 9 Limited 6 Limited 7 Limited 8 Limited Yes
RNS-MW2 Secondary Centerline -2 Inadequate 4 Inadequate 1 Inadequate 2 Inadequate 1 Inadequate 1 Inadequate No
RNS-MW6 Primary Centerline 8 Limited 11 Limited 9 Limited 8 Limited 8 Limited 9 Limited Yes
RNS-MW7 Neither Background 3 Inadequate 3 Inadequate 3 Inadequate 3 Inadequate 2 Inadequate 3 Inadequate No
= Primary plume= Secondary plume= Background or Source Area
Notes:(a) The monitored natural attenuation (MNA) scores are derived from the U.S. Environmental Protection Agency docment Technical Protocol for Evaluating Natural Attenuation of Chlorinated Solvents in Groundwater , publication No. EPA/600/R-98/128, September 1998. The scores are defined as follows: 0-5 = Inadequate evidence of anaerobic biodegradation of chlorinated organics 6-14 = Limited evidence of anaerobic biodegradation of chlorinated organics 15-20 = Adequate evidence of anaerobic biodegradation of chlorinated organics(b) Well locations MW-1 and MW-2 are documented in the field and thus in laboratory results as "MW1PP" and "MW2PP", but are identified as MW-1 and MW-2 on figures and in text.(c) MW-1 and MW-2 were relatively dry during September 2012 sampling so limited MNA samples could be collected, which resulted in a score of inadequate; more samples were able to be collected in the quarters that followed leading to a higher score.
Quarterly Monitoring Event AverageSeptember 2013September 2012 December 2012 April 2013 June 2013

8/29/14 Y:\094\048.012\R\RIFS\RI-FS__FINAL.docx LANDAU ASSOCIATES 7-1
7.0 CLEANUP REQUIREMENTS
This section identifies regulatory cleanup requirements through the development of preliminary
cleanup standards, RAOs, and the identification of other potentially applicable laws and regulations.
Cleanup requirements are addressed for Site groundwater and for residual soil at the former Sauro’s
property. The COCs include PCE, TCE, cis-1,2-DCE, and VC.
7.1 TERRESTRIAL ECOLOGICAL EVALUATION Unless exclusion applies to a Site, a terrestrial ecological evaluation is required by MTCA. A
terrestrial ecological evaluation determines whether a release of hazardous substances to soil may pose a
threat to the terrestrial environment; characterizes threats to terrestrial plants or animals; and establishes
Site-specific cleanup standards for the protection of terrestrial plants and animals.
The Site is located in a downtown urban core area. Most of the Site is paved (asphalt and
concrete) or is covered with buildings and is likely to continue to be under current and future land uses.
The Site qualifies for an exclusion under 173-340-7491(1)(c)(i) because there is less than 1.5 acres of
contiguous undeveloped land on the Site or within 500 ft of the Site, so a terrestrial ecological evaluation
is not required.
Furthermore, contaminated soil at the Sauro’s property was excavated during the interim action to
the top of the water table, which was approximately 30 ft BGS throughout the property. The property was
then filled with clean soil and a pervious parking lot was constructed. Outside of the Sauro’s property,
soil contamination identified during the RI did not typically exceed MTCA Method A CULs within 25 ft
of ground surface, except around soil borings B-1 and B-2 (immediately adjacent to the south of the
Sauro’s property) where concentrations of PCE were found above CULs at 3 and 12 ft BGS. However,
this location is beneath the DaVita building. Therefore, soil contamination is either beneath a building or
below the standard point of compliance for soil of 15 ft BGS for terrestrial ecological receptors [WAC
173-340-7490(4)(b)]. Based on these factors, uptake of constituents by terrestrial plants or animals from
Site soil is not considered a potential exposure pathway and contamination is below the depth to where
terrestrial animals are likely to be present, so direct contact by animals is unlikely to occur.
No further evaluation is required if a site meets any of the exclusion criteria under WAC 173-
340-7491(1)(a) through (d). Because the Site meets at least one of these criteria, the cleanup standards
for the Site do not include any terrestrial ecological considerations or criteria.

8/29/14 Y:\094\048.012\R\RIFS\RI-FS__FINAL.docx LANDAU ASSOCIATES 7-2
7.2 CLEANUP STANDARDS This section develops preliminary Site cleanup standards for chemical constituents that were
detected in affected Site media. Cleanup standards consist of 1) CULs defined by regulatory criteria that
are adequately protective of human health and the environment and, 2) the point of compliance at which
the CULs must be met. The cleanup standards are used as the basis for developing media-specific RAOs
(Section 7.3) for the cleanup action.
7.2.1 DEVELOPMENT OF CLEANUP LEVELS The CULs for affected media will be selected or approved by Ecology and presented in the CAP.
However, it is necessary to identify proposed (or preliminary) CULs to develop, and evaluate the
effectiveness of cleanup action alternatives for the FS.
CULs for affected media developed under MTCA represent the concentration of COCs that are
protective of human health and the environment for identified potential exposure pathways, based on the
highest beneficial use (HBU) and the reasonable maximum exposure (RME) for each affected media.
The process for developing CULs consists of identifying the HBU and RME for affected media,
determining those that represent the greatest risk to human health or the environment, and determining the
CULs for the COC in affected media.
Numerical CULs are developed for soil and groundwater because these are the only media that
are affected by Site releases. MTCA Method A CULs are adequately protective for the Site. CULs are
presented below and summarized in Table 7-1.
7.2.1.1 Soil
The highest beneficial use of soil for current and future land use is considered unrestricted land
use. The remediation of soil is evaluated in the FS in the context of protecting the direct contact and
leaching to groundwater pathways. Because they are considered protective of groundwater, the MTCA
Method A CULs will continue to be used as preliminary CULs for soil. The COCs in residual soil at the
former Sauro’s property include PCE and breakdown products. The applicable preliminary CULs for
these COCs are provided in Table 7-1.
7.2.1.2 Groundwater
As described in Section 4.2.2, the highest beneficial use for groundwater is considered drinking
water. The MTCA Method A CULs for groundwater are considered applicable and are used as
preliminary CULs. MTCA regulations (WAC 173-340-704) indicates that “Method A may be used to
establish CULs at sites that have few hazardous substances and . . . sites where numerical standards are

8/29/14 Y:\094\048.012\R\RIFS\RI-FS__FINAL.docx LANDAU ASSOCIATES 7-3
available in this chapter for applicable state and federal laws for all indicator hazardous substances in the
media for which the Method A CUL is being used.” Per Section 4.0, the COC in groundwater includes
PCE and breakdown products. These COCs and their associated preliminary CULs21 are provided in
Table 7-1.
7.2.2 POINTS OF COMPLIANCE Under MTCA, the point of compliance is the point or location on the Site where the CULs must
be attained. The point(s) of compliance for affected media will be selected by Ecology and presented in
the Site CAP. However, it is necessary to identify proposed point(s) of compliance to develop and
evaluate the effectiveness of cleanup action alternatives in the FS. As a result, the anticipated points of
compliance for soil and groundwater are identified in this section.
7.2.2.1 Soil
The point of compliance for soil, as established under WAC 173-340-740(6) for sites where soil
CULs are based on the protection of groundwater, is throughout the Site. For the purposes of this
document, soil cleanup will be evaluated based on achieving groundwater cleanup standards and soil
cleanup standards. MTCA recognizes that for those cleanup actions that involve containment of
hazardous substances, the soil CULs will typically not be met throughout the site [WAC 173-340-
740(6)(f)]. However, MTCA also recognizes that such cleanup actions may still comply with cleanup
standards. The determination of the adequacy of soil cleanup will be based on the remedial action
alternative’s ability to comply with groundwater cleanup standards for the Site, to meet performance
standards designed to minimize human or environmental exposure to affected soil, and to provide
practicable treatment of affected soil. Performance standards to minimize human and environmental
exposure to affected soil may include institutional controls that limit activities that interfere with the
protectiveness of the remedial action. Specific remedial alternatives are described in Section 8.0.
7.2.2.2 Groundwater
The standard point of compliance for groundwater, as established under WAC 173-340-720(8), is
typically throughout the site when the HBU is drinking water. There are no existing drinking water wells
within the Site or immediate surrounding area (Ecology website 2014c). The Site is in Tacoma, where
the public water purveyor, Tacoma Water, supplies potable water service throughout the Site and
surrounding area. In accordance with Tacoma Water’s Customer Service Policy Section 4.0 and the
21 Cis-1,2-DCE does not have a MTCA Method A value; therefore, the Federal/State MCL, 70 µg/L, is used as a preliminary
CUL.

8/29/14 Y:\094\048.012\R\RIFS\RI-FS__FINAL.docx LANDAU ASSOCIATES 7-4
Tacoma Municipal Code Title 12.10, customers within the City limits shall have water service provided
to them by Tacoma Water. Therefore, customers (property owners) within the Site would not be allowed
to install private drinking water supply wells. Since there are no drinking water wells and new ones
cannot be installed, groundwater may not be used as a potable drinking water source within the Site or the
immediate surrounding area. However, because MTCA Method A is being used, this assumes protection
of groundwater; therefore, the point of compliance will be throughout the Site. The compliance
monitoring locations will be determined during development of the CAP and/or remedial design.
7.3 REMEDIAL ACTION OBJECTIVES RAOs define the goals of the cleanup that must be achieved to adequately protect human health
and the environment. RAOs must address all affected media, and a cleanup alternative must achieve all
RAOs to be considered a viable cleanup action. RAOs can be either action-specific or media-specific.
Action-specific RAOs are based on actions required for environmental protection that are not intended to
achieve specific chemical criteria. Media-specific RAOs incorporate the preliminary CULs (presented in
Section 7.2). Based on the CSM initially presented in Section 4.0 and further refined in Section 6.0, and
the cleanup standards developed in Sections 7.1 and 7.2, the action-specific and media-specific RAOs
identified for the Site consist of:
• RAO-1: Prevent direct human contact with soil containing hazardous constituents above the direct contact soil CUL.
• RAO-2: Prevent human ingestion of Site groundwater containing concentrations of COC above the groundwater CULs.
• RAO-3: Prevent contaminated soil containing concentrations of COC above soil CULs from impacting groundwater.
• RAO-4: Prevent groundwater containing concentrations of COCs above surface water CULs from discharging to the Thea Foss waterway
• RAO-5: Obtain groundwater CULs at the point of compliance within a reasonable time frame.
Each of these RAOs can be achieved through treatment (including active treatment and/or natural
attenuation), or by preventing exposure to the contaminated media through institutional controls and
physical barriers. Each of the cleanup action alternatives described in Section 9.0 achieve these RAOs
and meet all of the MTCA threshold requirements (described in Section 10.1); therefore, each alternative
is a viable cleanup alternative under MTCA. The degree to which each cleanup action alternative meets
the threshold requirements and other requirements listed in WAC 173-340-360(2) will be determined by
applying the specific evaluation criteria identified in the MTCA (Sections 10.5 and 10.6).

8/29/14 Y:\094\048.012\R\RIFS\RI-FS__FINAL.docx LANDAU ASSOCIATES 7-5
7.4 APPLICABLE OR RELEVANT AND APPROPRIATE REQUIREMENTS In accordance with MTCA, all cleanup actions conducted under MTCA shall comply with
applicable state and federal laws [WAC 173-340-710(1)]. MTCA defines applicable state and federal
laws to include legally applicable requirements and those requirements that are relevant and appropriate.
Collectively, these requirements are referred to as ARARs. This section provides a brief overview of
potential ARARs for Site cleanup. The primary ARAR is the MTCA cleanup regulation (WAC 173-340)
especially with respect to the development of CULs and procedures for development and implementation
of a cleanup under MTCA. The primary ARARs that may be applicable to the cleanup action include the
following:
• Federal MCLs (40 CFR Part 141)
• Washington Clean Air Act, Chapter 70.94 RCW
• Washington Water Pollution Control Act and the following implementing regulation: Water Quality Standards for Surface Waters (WAC 173-201A). These regulations establish water quality standards for surface waters of the State of Washington consistent with public health and the propagation and protection of fish, shellfish, and wildlife. These standards are used in the development of groundwater CULs for the Site, as discussed in Section 5.0.
• Washington Hazardous Waste Management Act (Chapter 70.105 RCW) and the following implementing regulation: Dangerous Waste Regulations (WAC 173-303). These regulations establish a comprehensive statewide framework for the planning, regulation, control, and management, of dangerous waste. The regulation designates those solid wastes which are dangerous or extremely hazardous to the public health and environment. The management of excavated contaminated soil from the Site would be conducted in accordance with these regulations to the extent that any dangerous wastes are discovered or generated during the cleanup action.
• Washington Solid Waste Management Act (Chapter 70.95 RCW) and the following implementing regulation: Minimum Functional Standards for Solid Waste Handling (WAC 173-304). These regulations establish a comprehensive statewide program for solid waste management including proper handling and disposal. The management of excavated contaminated soil from the Site would be conducted in accordance with these regulations to the extent that this soil could be managed as solid waste instead of dangerous waste.
• Hazardous Waste Operations (WAC 296-843). Establishes safety requirements for workers providing investigation and cleanup operations at Sites containing hazardous materials. These requirements would be applicable to onsite cleanup activities and would be addressed in a Site health and safety plan prepared specifically for these activities.
• Solid and Hazardous Waste Management (RCW 70.105; Chapter 173-303 WAC; 40 CFR 241, 257; Chapter 173-350 and 173-351 WAC) and Land Disposal Restrictions (40 CFR 268; WAC 173-303-340)
• Washington Industrial Safety and Health Act (RCW 49.17) and the Federal Occupational Safety and Health Act (29 CFR 1910, 1926)
• State Environmental Policy Act (SEPA; RCW 43.21C and Chapter 197-11 WAC)

8/29/14 Y:\094\048.012\R\RIFS\RI-FS__FINAL.docx LANDAU ASSOCIATES 7-6
• State and federal groundwater criteria are considered in the development of CULs. State Dangerous Waste Regulations may be applicable to contaminated soil or groundwater removed from the Site during cleanup activities due to contamination characteristics. Substantive SEPA requirements will be addressed concurrent with the Site CAP to the degree applicable for the selected cleanup action.

TABLE 7-1GROUNDWATER AND SOIL PRELIMINARY CLEANUP LEVELS
SAURO'S PROPERTY RI/FSTACOMA, WASHINGTON
Table 7-1Page 1 of 1
5/14/2014Y:\094\048.012\R\RIFS\Tables\Section 7.0\Tbl 7-1_CULs GW & Soil LANDAU ASSOCIATES
Groundwater Federal/State Primary MCL
PCE TCE cis-1,2-DCE VC cis-1,2-DCE
Groundwater µg/L 5 5 NE 0.2 70 Throughout Site
Soil - direct contact µg/kg Ground surface to 15 ft BGS
Soil - protective of groundwater (d) µg/kg Throughout Site
MCL = Maximum Contaminant LevelsMTCA = Model Toxics Control ActNE = not establishedµg/L = micrograms per literµg/kg = micograms per kilogram
(a) Cis-1,2-DCE does not have a Model Toxics Control Act (MTCA) Method A cleanup level (CUL) for groundwater; therefore, the Federal/State primary MCL value of 70 µg/L is used as a cleanup level .
Note:Federal ARARs and MTCA Method A values based on CLARC database (accessed November 25, 2013)
Medium
Groundwater and SoilMTCA Method A CUL or Screening Level
Units
NE
Point of Compliance
50 30 NE NE

8/29/14 Y:\094\048.012\R\RIFS\RI-FS__FINAL.docx LANDAU ASSOCIATES 8-1
8.0 SCREENING OF REMEDIAL TECHNOLOGIES
The purpose of the FS is to develop and evaluate cleanup action alternatives to enable an
appropriate cleanup action to be selected for the Site. This FS complies with the requirements under
MTCA for performance of an FS (WAC 173-340-350) and selection of a cleanup action (WAC 173-340-
360). This FS is organized into the following sections: Screening of Remedial Technologies (Section 8.0;
this section); Description of Remedial Alternatives (Section 9.0); Detailed Evaluation of Alternatives
(Section 10.0); and Summary and Conclusion of Feasibility Study (Section 11.0).
8.1 OVERVIEW OF EXISTING REMEDIAL TECHNOLOGY The existing remedial technology applied at the property is a cap, which partially addresses the
residual onsite soil contamination. The cap is considered a physical component of the remedial
technology “institutional controls,” which also requires a restrictive covenant. An environmental
covenant has not yet been created for the property, and will be discussed in Section 10.0 and in the draft
CAP as a component of the remedy.
Site groundwater contamination (and potential accompanying saturated soil contamination) is the
primary focus of this FS. Site groundwater is located beneath City ROW and two properties owned by a
private investor; the current Site extent is presented in Figure 2-1.
8.2 REMEDIAL TECHNOLOGIES Cleanup action alternatives are an assemblage of one or more cleanup activities that, taken as a
whole, will achieve all the RAOs. This section discusses the breadth of remedial technologies considered
for implementation and identifies technologies carried forward for development of cleanup action
alternatives. The following remedial technologies or response actions were screened for consideration in
development of cleanup action alternatives.
8.2.1 INSTITUTIONAL CONTROLS This approach would utilize environmental covenants to administratively prevent or appropriately
limit intrusive activities that could expose workers to contaminated soil and prevent groundwater
extraction for drinking water. Institutional controls may be applied to maintain the onsite containment
layer; this could achieve RAO-1. RAO-2 is achieved by the de facto institutional control that requires
new drinking water uses to use the City municipal supply. However, institutional controls cannot address
RAO-3, the soil leaching pathway; RAO-4, protection of the Thea Foss; or RAO-5, cleanup of
groundwater to CULs. Therefore, institutional controls are not carried forward as a standalone remedial

8/29/14 Y:\094\048.012\R\RIFS\RI-FS__FINAL.docx LANDAU ASSOCIATES 8-2
alternative, though institutional controls may be incorporated with other technologies as an element of a
remedial alternative.
8.2.2 GROUNDWATER CONTAINMENT Groundwater containment is used to prevent the spread or further migration of contaminated
groundwater, or to protect specific receptors or pathways by installing a barrier to groundwater flow
around the affected area or between the affected area and a specific receptor. Groundwater extraction
might also be required to maintain hydraulic containment. The hydraulic barrier could be constructed
using different technologies, such as sheet pile or bentonite slurry cutoff walls. However, existing RI data
indicate that the groundwater contamination plume does not appear to be migrating (i.e., is stable) and
does not discharge to surface water. Therefore, this technology does not appear necessary or applicable to
protect receptors and to achieve the RAOs. Additionally, the implementability of a cutoff wall would be
very low due to the depth to groundwater, public utilities, and other obstructions. As a result, physical
containment of groundwater was not carried forward for further evaluation in the FS.
8.2.3 MONITORED NATURAL ATTENUATION MNA describes a reduction of contaminant toxicity, volume, concentration, mobility, and/or
bioavailability through natural physical, chemical, or biological processes that occur without human
intervention. Synonyms include intrinsic remediation, natural recovery, and natural assimilation. MNA
is not a “no action” approach, but requires demonstration that attenuation is occurring, an understanding
of Site-specific and contaminant-specific attenuation mechanisms, and performance monitoring. MNA is
appropriate for sites with a low potential for contaminant migration (i.e., stable plumes) and where natural
attenuation processes will achieve RAOs in a reasonable timeframe compared to more active treatment.
Source control is often required before MNA can be implemented as a remedial measure, and was
implemented through historical source removal actions and interim action excavations presented in
Section 2.0 and 3.0.
Natural attenuation includes biological, chemical, and physical processes. Biological processes
include biological degradation, transformation, and stabilization. Chemical processes include abiotic
degradation, transformation, and stabilization. Physical processes include dispersion, dilution, sorption,
volatilization, and radioactive decay. Processes that destroy or degrade contaminants are typically
preferred to allow for removal of contaminant mass, rather than simply dispersing the mass. Since the
2009 interim action excavation, the contaminant mass has decreased (Section 6.5).
MNA monitoring data collected throughout the Site suggest natural attenuation is likely occurring
in various areas of the Site. Also, the groundwater plume appears stable and existing Site conditions do

8/29/14 Y:\094\048.012\R\RIFS\RI-FS__FINAL.docx LANDAU ASSOCIATES 8-3
not appear to present an immediate or imminent threat to human health or the environment. Since source
area soil has been removed from the Sauro’s property, given sufficient time, MNA would likely be
effective for achieving RAO-2 and RAO-3 Site-wide, and RAO-1 where soil contamination exists
beneath the groundwater table. Therefore, MNA is carried forward for additional evaluation in the FS.
8.2.4 ENHANCED IN SITU BIOREMEDIATION Enhanced in situ bioremediation (EISB) expands on the MNA technology above by enhancing
natural biological degradation of chlorinated solvents to more rapidly achieve RAO-2 and RAO-3. In
general terms, EISB involves enhancement or stimulation of naturally occurring biological processes
through the introduction of electron donors or electron acceptors and necessary nutrients to increase
degradation rates.
Biological treatment of chlorinated VOCs requires anaerobic aquifer conditions. Micro-
organisms present in the aquifer are stimulated by the addition (e.g., injection) of electron donor
substrates (i.e., food) and nutrients to the aquifer. Electron donor substrates are organic compounds that
ferment to hydrogen (e.g., sugar, cheese whey, lactate, vegetable oil, wood mulch). Aquifer micro-
organisms obtain energy by using electron donors to reduce electron acceptors, which consist of natural
occurring acceptors (e.g., oxygen, nitrate, manganese, iron, sulfate, carbon dioxide) and contaminants
(e.g., PCE, TCE, cis-1,2-DCE, VC). Properly implemented EISB of Site-specific COCs can result in
complete dechlorination to innocuous end products (e.g., ethane/ethene).
EISB at the Site would most likely involve injecting liquid electron donor substrates to stimulate
a biologically active zone for contaminant treatment. Injection fluids would most likely be delivered to
the aquifer through injection wells. A passive approach, whereby donor is injected and then moves
downgradient with groundwater flow, would likely be effective. An active approach to bioremediation
involves recirculation of donor in the aquifer treatment zone using injection and extraction wells. A
passive approach to EISB is under consideration for the Site.
EISB would achieve RAO-2 and RAO-3 Site-wide, and RAO-1 where soil contamination exists
beneath the groundwater table. Because MNA Site data indicates that biological processes may already
be under way in various areas of the Site and EISB may be reasonably implemented at the Site, EISB is
carried forward for additional evaluation in the FS. EISB may require a pilot study prior to full
implementation.
8.2.5 IN SITU CHEMICAL OXIDATION In situ chemical oxidation (ISCO) describes a group of technologies that involve various oxidants
and delivery techniques (e.g., injection, soil mixing) to mineralize organic compounds. Chemical

8/29/14 Y:\094\048.012\R\RIFS\RI-FS__FINAL.docx LANDAU ASSOCIATES 8-4
oxidants most commonly used include permanganate, ozone, peroxide (Modified Fenton’s), and
persulfate. Contact between these oxidants and many organic compounds results in rapid and complete
mineralization (i.e., oxidization to carbon dioxide and water, and in the case of chlorinated solvents,
inorganic chloride). The oxidation reaction rates are dependent on many variables, including temperature,
pH, contaminant concentration, catalysts, reaction by-products, natural organic matter, and oxidant
scavengers (ITRC 2005). Delivery and distribution of the oxidant to the formation is also a key
consideration for the use of ISCO technology, as the oxidant must come into contact with the contaminant
for the oxidation reaction to occur. ISCO is typically delivered by injecting the desired liquid/slurry
oxidant for contaminant treatment by a direct-push injection program or through injection wells; or
sparging with gaseous oxidant (i.e., ozone). The target treatment is down in ice contact deposits and pre-
Fraser, which are too dense for direct-push drilling technology; therefore, the ISCO option carried
forward is ozone sparging using injection wells.
Ozone is applied continuously rather than in batch (ITRC 2005) and takes advantage of the higher
gas-phase permeability for soil. Ozone can be generated from oxygen contained in a vessel
(concentration of 5 to10 percent by weight) or from atmospheric air (concentration of about 1 percent by
weight; ITRC 2005). ISCO has the potential to address each of the RAOs depending on the oxidant
selected and a carefully thought-out delivery/distribution method; therefore, ISCO is carried forward for
additional evaluation in the FS. ISCO would likely require a pilot study prior to full implementation.
8.2.6 AIR SPARGE / SOIL VAPOR EXTRACTION Air Sparge (AS)/Soil Vapor Extraction (SVE) is a proven technology combination for
remediation of VOCs in groundwater and vadose zone soils, both in the dissolved phase and as light non-
aqueous phase liquid (LNAPL), by injecting compressed air below the groundwater table to strip volatile
constituents out of groundwater followed by extraction of the volatilized gasoline constituents. These
technologies take advantage of the inherently volatile nature of VOCs and provide an avenue for phase
change and thus, contaminant removal.
AS is a physical treatment method used primarily to remove or degrade volatile contaminants
from groundwater. Air is injected into a contaminated aquifer through a well screened beneath the zone
of groundwater contamination. Air bubbles move upward through the aquifer and volatile compounds
(e.g., PCE, TCE) are transferred from the aqueous phase to the vapor phase according to Henry’s Law.
The primary challenge to successful application of AS is achieving uniform distribution of air in the target
treatment zone. Preferential flow paths can limit the effectiveness of AS treatment. Fairly high hydraulic
conductivity [>10-3 centimeters per second (cm/sec)] and relatively homogeneous aquifer conditions are
preferred to maximize uniformity of airflow (Battelle 2001).

8/29/14 Y:\094\048.012\R\RIFS\RI-FS__FINAL.docx LANDAU ASSOCIATES 8-5
SVE complements AS by applying a vacuum to the subsurface and induces subsurface airflow to
capture vapors generated by AS and to volatilize and remove VOCs from vadose zone soil. Collected
vapors are treated using conventional methods, including granular activated carbon (GAC) and thermal
oxidation. SVE is a proven technology for remediation of VOCs through the extraction of volatilized
contaminants; however, similar to AS, use and effectiveness of the technology is limited by the pneumatic
permeability and homogeneity of the soil at the Site.
An additional challenge to successful application of AS is the depth of wells and well spacing
required to achieve overlapping zones of influence within the treatment zone. The zone of influence from
each sparge well consists of an inverted cone (i.e., smallest radius of influence at the bottom of each
well). Therefore, wells must be installed deeper than the target treatment zone to achieve overlapping
zones of influence from adjacent wells over the treatment interval. Although high permeability and near-
homogeneity is desired to maximize uniformity of treatment, these conditions also minimize the radius of
influence from each sparge well, requiring more closely spaced wells.
Based on the depth of groundwater and the associated contaminant plume, the size of the plume,
heterogeneous soil conditions including some low permeability soil, and the number of wells that would
be required, implementability of AS/SVE is not feasible at the Site; therefore, AS/SVE is not carried
forward for additional evaluation.
8.2.7 IN-WELL AIR STRIPPING In-well air stripping (IWAS) is a physical treatment method used primarily to remove or degrade
volatile contaminants from groundwater. IWAS is typically achieved by injecting air into the bottom of a
well that is constructed with two screens, one at the bottom of the well and the other just above the water
table (Miller and Roote 1997). Air injection at the bottom of the well decreases the density of the water
column within the well casing, causing it to rise inside the well; this is known as air lift pumping. Air lift
causes groundwater to be drawn into the lower screen. As aerated water moves upward in the well
casing, volatile contaminants (e.g., PCE, TCE) are transferred from the aqueous phase to the vapor phase
according to Henry’s Law. As water in the casing reaches the upper screen at the water table, treated
water is discharged back into the aquifer and contaminant vapors are recovered under vacuum for ex situ
treatment. The combination of groundwater extraction at the bottom of the well and mounding at the
water table results in vertical recirculation within the aquifer between the top and bottom well screens. A
modified approach adds a stripping reactor within the well casing at the water table to enhance the
removal of volatiles (DOE 2002; Simon 1996). The stripping reactor consists of fluted and channelized
columns that facilitate increased contact time and reduce coalescence of air bubbles to improve phase
8/29/14 Y:\094\048.012\R\RIFS\RI-FS__FINAL.docx LANDAU ASSOCIATES 8-6
transfer. IWAS does not achieve complete treatment in a single pass, and groundwater recirculation
continues until satisfactory contaminant removal is achieved.
IWAS treats aqueous-phase contaminants only and as a result, it has many limitations to its
effectiveness, similar to pump and treat systems. The ineffectiveness of IWAS for treatment of
chlorinated solvent source zones is due to low aqueous solubility and preferential partitioning of mass to
solid phase organic matter, resulting in slow desorption/dissolution of sorbed and/or non-aqueous phase
liquid (NAPL) mass to groundwater extracted for treatment. Based on these factors and difficulty of
implementing the remedy across the areas that it would be effective, IWAS is not carried forward for
further evaluation.
8.2.8 ZERO VALENT IRON Zero valent iron (ZVI) is a strong reducing agent. Treatment using ZVI typically consists of iron
granules and various scales (macro or nano scale) or other iron-bearing minerals for the treatment of
chlorinated contaminants such as chlorinated solvents, metal, and explosive compounds (including
perchlorate). As the iron is oxidized, a chlorine atom is removed from the compound by one or more
reductive dechlorination mechanism, using electrons supplied by the oxidation of iron. The iron is
dissolved by the process, but macro scale iron granules used in barrier walls disappear so slowly that the
remediation barriers can be expected to remain effective for many years, possibly even decades.
Nano-scale ZVI (nZVI) is typically used in injection programs as it can be dispersed into the
formation, but is highly reactive and its lifespan is short lived (1 to 2 years). Passive ZVI permeable
reactive barriers (PRBs)/treatment walls are generally intended for long-term operation to control
migration of contaminants in ground water, whereas injections of nZVI are used for direct in situ source
zone treatment. Alternative injection technologies include pressurized nitrogen gas or water as carrying
fluids to help the iron powders disperse into the subsurface.
For ZVI PRBs, typical limiting factors and cost considerations are residence multiplied by the
contaminants within the treatment zone (within the treatment wall) and depth of installation. For nZVI,
the relatively small radius of influence and injection spacing and the materials cost are typically limiting
factors. Because the plume appears stable and there is no significant flow or migration of contaminants
passing a given location, combined with the relatively large depth to groundwater that would make
implementation very difficult and expensive, ZVI PRBs are not carried forward for further evaluation.
The option of nZVI injection is also not carried forward as the relative cost of the material is
disproportionately costly to other similar injectable materials with similar effectiveness (e.g., chemical
oxidants or electron donors for bioremediation).

8/29/14 Y:\094\048.012\R\RIFS\RI-FS__FINAL.docx LANDAU ASSOCIATES 8-7
8.2.9 HYDRAULIC CONTROL BY PUMP AND TREAT Groundwater pump and treat (pump and treat) would involve installation of groundwater
extraction wells with submersible pumps, above ground (ex situ) groundwater (and possibly air) treatment
and discharge infrastructure, and a discharge location for the treated water. Potentially applicable ex situ
groundwater treatment technologies and discharge options are numerous and require a separate cost and
engineering evaluation.
An appropriate number and spacing of extraction wells would be used to ensure hydraulic
containment of groundwater exceeding applicable CULs. In pump and treat applications where hydraulic
containment is the primary objective (i.e., mass removal is secondary), extraction may be targeted in
lower concentration areas downgradient from high concentration areas to minimize the concentrations of
resulting discharge groundwater that may be costly to treat or that threatens the ability of the treatment
system to meet discharge limits.
The effectiveness of the pump and treat alternative for treatment of chlorinated solvent source
zones is limited for chlorinated VOCs due to low aqueous solubility and preferential partitioning of mass
to solid phase organic matter, resulting in slow desorption/dissolution of sorbed and/or NAPL mass to
groundwater extracted for treatment. Based on these factors and difficulty of implementing the remedy
across the areas where it would be effective, pump and treat is not carried forward for further evaluation.
8.2.10 ELECTRICAL RESISTANCE HEATING Thermal treatment involves heating of an aquifer or vadose zone to boil, mobilize, or carry off
aqueous-phase and sorbed-phase contaminants, collecting contaminant vapors in the vadose zone, and
treating the vapors. Volatilization increases with temperature due to increasing vapor pressure of the
contaminant and an increase in the Henry’s Law constant. Rates of abiotic degradation (e.g., hydrolysis
of PCE and breakdown products) increase significantly with temperature, resulting in relatively short
half-lives under elevated temperatures (Beyke 2006; Jeffers et al. 1989). Where the contaminant and
aquifer conditions are conducive to biological degradation, these rates also increase under moderate
heating achieved during startup and following shutdown of a thermal treatment system.
At elevated temperatures, hydrolysis can also be a significant mechanism for the destruction of
some contaminants, including chlorinated VOCs. Thermal treatment is typically applied in source zone
areas where high contaminant concentrations result in a favorable ratio of mass removed per unit of
energy consumed (i.e., not typically used for treatment of dissolved-phase plumes). There are a number
of thermal treatment technologies that could be effective in treating the COCs at the Site, including steam
enhanced extraction, conductive heating, and electrical resistance.

8/29/14 Y:\094\048.012\R\RIFS\RI-FS__FINAL.docx LANDAU ASSOCIATES 8-8
Electrical resistance heating (ERH) is an in situ, polyphase electrical heating technology that uses
commonly available electricity and applies it in the subsurface through vertically constructed electrodes,
and uses the natural resistive properties of soil to generate heat to boil or vaporize volatile contaminants.
Subsurface zones with the highest electrical conductivity are heated preferentially due to a greater flow of
electrical current in those zones. Advantageously, high electrical conductivity zones include low
permeability silt or clay and areas of dense non-aqueous phase liquid (DNAPL) or high concentration
aqueous-phase contamination. As a result, ERH targets those zones typically most difficult to remediate
by other technologies. The boiling points of various VOC/water mixtures are reached in the following
order: separate-phase NAPL in contact with water or soil moisture, followed by aqueous-phase VOCs,
and finally uncontaminated groundwater (Beyke and Fleming 2005). This order of boiling results from
Dalton’s Law of Partial Pressures, which describes how the boiling point of a VOC immersed in water or
in contact with moist soil is depressed below the individual boiling points for water or the VOC. For
example, a mixture of PCE in water boils at 88 degrees Celsius (°C), compared to the 121°C boiling point
of pure PCE and the 100°C boiling point of water. This order of volatilization is obviously advantageous,
as contaminated water will tend to boil off before uncontaminated water, reducing the time and energy
required to complete treatment.
Generated steam also serves to sweep NAPL and aqueous-phase contamination toward recovery
wells. Recovery wells, typically co-located with the electrodes maintain a vacuum during ERH
operations to ensure capture and treatment of vapors and steam from the subsurface (TRS website 2014).
Extracted vapors and steam are cooled to ambient temperature and vapors are treated using conventional
methods, including granular-activated carbon and thermal oxidation. Experience indicates that of the
various thermal treatment options, ERH tends to be the most effective of these technologies for treating
chlorinated VOCs as it heats soils relatively uniformly, is not significantly affected by soil type or
permeability, can be implemented in both the vadose zone and saturated zone, and has a very high rate of
success. ERH systems can be safely installed beneath buildings, operating facilities, and in the presence
of buried utilities. Although ERH tends to be relatively expensive, the rapid and effective rate at which
CULs can be achieved (i.e., very short restoration timeframe) often makes ERH an attractive technology.
Implementation may be a challenge at the Site, but if directed at higher concentration areas and potential
secondary soil source areas, ERH could still achieve all RAOs and is therefore, carried forward for
additional evaluation as a viable remedial alternative.
8.2.11 EXCAVATION Excavation and offsite disposal or treatment of PCE-impacted soil is a permanent soil
remediation technology that would achieve RAO-1 and contribute to the achievement of all the other

8/29/14 Y:\094\048.012\R\RIFS\RI-FS__FINAL.docx LANDAU ASSOCIATES 8-9
RAOs by removing contaminated soils. Excavation of the Sauro’s property source area was already
successfully performed and no other vadose zone source areas have been identified. Performance of
excavation of soils in the saturated zone is not technically feasible for the Site based on the depth to
groundwater and the limited areas where excavation could be performed with City-controlled property
(i.e., City ROWs). Therefore, this technology is not carried forward for additional evaluation.

8/29/14 Y:\094\048.012\R\RIFS\RI-FS__FINAL.docx LANDAU ASSOCIATES 9-1
9.0 DESCRIPTION AND EVALUATION OF ALTERNATIVES
This section provides a detailed evaluation of the remedial technologies considered applicable for
use at the Site and packages these technologies into Site-wide remedial alternatives; the remedy specific
to the former Sauro’s property is assumed to be institutional controls and is therefore, only addressed in
Alternative 1. Sufficient detail is provided for each alternative to provide the reader a conceptual
understanding of the design intent and to provide an adequate basis for developing the associated cost
estimates. The development of the remedial alternatives accounted for the impacted media, potential
receptor pathways, preliminary cleanup standards, and applicable RAOs. If implemented, Alternatives 2
through 4 would likely be combined with and transition at some point to MNA and institutional controls
(Alternative 1) to achieve all RAOs, but with a reduced monitoring period. The remedial alternatives are
as follows:
• Alternative 1: MNA with Institutional Controls
• Alternative 2: EISB
• Alternative 3: Ozone Sparging
• Alternative 4: ERH.
A description of each alternative is presented below.
9.1 ALTERNATIVE 1: MONITORED NATURAL ATTENUATION WITH INSTITUTIONAL CONTROLS Alternative 1 includes MNA as the primary remedial technology and institutional controls as the
secondary remedial technology. The major components of these two remedial technologies are described
below:
• MNA (Groundwater): Implementing an MNA remedy to demonstrate that naturally occurring in situ attenuation processes are effective in reducing the plume extent.
• Institutional Controls (Soil and Groundwater): Establishing institutional controls in City-controlled areas of the Site and the former Sauro’s property, preventing or limiting intrusive activities that would bring workers into contact with contaminated soil.
The primary component of the MNA remedy includes monitoring chemical concentrations and
natural attenuation parameters in groundwater from existing monitoring wells on an ongoing basis to
achieve the following:
• Ensure that human health and the environment continue to be protected
• Evaluate the behavior of the plume (i.e., expanding, contracting, or stabilizing)
• Determine whether natural chemical or biological degradation continues to occur, reducing the contaminant mass and associated concentrations

8/29/14 Y:\094\048.012\R\RIFS\RI-FS__FINAL.docx LANDAU ASSOCIATES 9-2
• Evaluate whether Site cleanup will continue to progress toward cleanup in a reasonable restoration timeframe.
The City conducted quarterly MNA sampling from fall 2012 to fall 2013, yielding 5 quarters of
data (presented in Section 6.4.2). The quarterly MNA sampling events were collected within a month or
so of quarterly VOC sampling events. The results for both MNA and VOC sampling were presented
quarterly, thus effectively representing an MNA remedy program. The program included almost the
complete monitoring well network and looked at two wells not associated with the project as well. The
results have been evaluated in the context of how a future MNA remedy sampling program may be
designed. The data indicate that a future program would be very similar, but would be optimized and
enhanced by:
• Removing wells MW-1 and RNS-MW7:
– MW-1 is screened only in the fill and the VOC results have been below preliminary CULs since April 2009 (see Table 6-5). MW-2 is adequately representative of the area where MW-1 and MW-2 are located. It is just upgradient of MW-1, is screened in the fill and just into the Qvi, and results for VC (only) are occasionally at or above the preliminary CUL; cis-1,2-DCE is the other COC detected, but its concentrations are close to non-detect and well below the preliminary CUL.
– RNS-MW7 was included in the quarterly MNA sampling (not ever part of RI VOC sampling) to see if it may serve as a reasonable background well location. The MNA results from this well have not been that different from some other cross-gradient wells and have not been proven useful. Generally speaking, groundwater in this part of Tacoma was fairly industrial historically, so locating the perfect background well is not feasible. It is proposed that this well no longer be sampled.
• Reducing sample depths at LAI-MW5 and RNS-MW2 to one depth per well:
– LAI-MW5: VOC results at the two sample depths are nearly identical and both are located within in the pre-Fraser geologic unit. The following is proposed: 1) remove the upper sample depth and keep the lower sample depth; and 2) replace the MNA sample depth (which had been the midpoint between the two VOC sampling depths) to be equivalent to the lower VOC sample depth.
– RNS-MW2: VOC results at the two sample depths are approximately the same. The upper sample depth is within the Qvi geologic unit whereas the lower is understood to be within the pre-Fraser geologic unit. The following is proposed: 1) remove the upper sample depth and keep the lower sample depth; and 2) replace the MNA sample depth (which had been the midpoint between the two VOC sampling depths) to be equivalent to the lower VOC sample depth.
The above considerations have been incorporated into a new groundwater sampling plan (Table
9-1) to support this remedy. Based on knowledge gained from previous MNA and VOC sampling, the
MNA remedy would consist of conducting groundwater monitoring at nine existing monitoring wells
(LAI-MW1 through LAI-MW5, MW-2, MW-13, RNS-MW2, and RNS-MW6), shown on Figure 9-1.
Sampling would focus on collection of the Site COCs (the four VOCs), which provide the best
documentation of natural attenuation. The MNA remedy would be used to demonstrate that naturally

8/29/14 Y:\094\048.012\R\RIFS\RI-FS__FINAL.docx LANDAU ASSOCIATES 9-3
occurring in situ attenuation processes are effective in limiting the plume extent to its current extent, that
discharge to surface water is not occurring, and that contaminant concentrations are stable or declining. A
number of factors provide evidence that natural attenuation processes are effectively limiting plume
migration: 1) completion of the 2009 interim soil removal action at the former Sauro’s property; 2)
existing groundwater monitoring data indicates that the secondary plume has diminished to the former
Sauro’s property line along Court A; and 3) knowledge of the age of the release (as old as 50 years).
Ongoing monitoring will be conducted per EPA guidance (EPA 1998). For costing purposes, Alternative
1 assumes that groundwater monitoring would be conducted per the recommended MNA performance
monitoring schedule in Ecology guidance (Ecology 2005); i.e., the wells indicated above will be
monitored on the following schedule:
• 1st year: quarterly (this component effectively covered in 2012 through 2013)
• 2nd and 3rd years: semi-annually
• Subsequent years (assume years 4 – 30): annually.
The secondary component of the remedy (institutional controls) would be established to achieve the
following:
• Prohibit the use of Site groundwater as a potable water supply (already addressed by City ordinance)
• Restrict intrusive activities on City-owned property or ROWs
• Require that proper safety measures and soil management practices be implemented as part of any project involving disturbance of soils at the Site (in accordance with WAC 173-340-440).
For the City-owned property, the institutional controls would be conveyed as a restrictive
covenant on the City property and recorded on the deeds registered with Pierce County/City of Tacoma.
This covenant would be binding on the owner’s successors and assignees. Documented administrative
procedures would need to be established to ensure that redevelopment and utility maintenance activities
on City property are coordinated carefully to prevent unacceptable exposure of subsurface contamination
to temporary construction contractors.
Regarding the impacted private properties, the current owner (private investor) purchased the two
properties since the AO was signed and is aware of the subsurface impacts and the City’s commitment to
adhering to the AO requirements. The City should provide an update on the project and status of
subsurface impacts to the current owner of the private properties. A documented administrative
procedure should be established to ensure that redevelopment of the two private properties provide
coordination with the City. The work would be performed in such a manner that the City could address
any necessary environmental monitoring of dewatering or excavation that could generate contaminated
waste and ensure that worker health and safety was adequately protected.

8/29/14 Y:\094\048.012\R\RIFS\RI-FS__FINAL.docx LANDAU ASSOCIATES 9-4
The physical component of institutional controls (physical barriers, including liners and
pavement) is already in place at the former Sauro’s property (overlies the residual soil contamination) and
throughout much of the Site (extent of impacted groundwater above preliminary CULs). The existing
institutional controls prevent activities that would result in risk to human health and the environment. As
mentioned, the administrative components of the institutional control remedy are not yet in place.
Alternative 1 achieves the RAOs presented in Section 7.3 through a combination of natural
attenuation and institutional controls. RAO-1 and RAO-2 would be achieved in the near term through
institutional controls preventing human contact with residual contaminated soil or using groundwater as a
potable water source. Long-term achievement of RAO-1 and RAO-2 would be through natural
attenuation of saturated zone soil and groundwater contamination. RAO-3 has been achieved to the
extent feasible through the soil interim soil removal action on the Sauro’s property.
The estimated present worth cost to implement Alternative 1 is approximately $400,000, as
summarized on Table 9-2. All costs presented in this FS are considered to have a relative accuracy within
the range of -30 to +50 percent, as shown in Table 9-2, and should be used primarily as a basis for
comparison of costs between alternatives. More reliable costs will be developed during the design and
implementation phases of the cleanup.
9.2 ALTERNATIVE 2: ENHANCED IN SITU BIOREMEDIATION Alternative 2 utilizes EISB to achieve RAOs for cleanup of groundwater and soil below the water
table and to achieve cleanup standards. A conceptual layout of the EISB remedy is shown on Figure 9-2.
Alternative 2 addresses groundwater and saturated soil simultaneously in accordance with the following
description:
Soil and Groundwater: Inject electron donor and nutrients into the saturated zone to treat contaminated groundwater and stimulate enhanced desorption processes in soil. Infrequent injections are repeated until rebound from contaminated soils no longer results in groundwater concentrations above cleanup standards (2 to 3 injection events anticipated). Alternative 2 would enhance naturally occurring biological processes to achieve remediation of
contaminated groundwater and aquifer soil. The biologically active zone would be created/enhanced and
maintained by periodically injecting electron donor solution through rows of wells located in and
hydraulically upgradient of the highest concentration portion of the plume. Each injection well would
receive an adequate injection volume to create overlapping radii of injection (ROI) between adjacent
wells. The injection volume required to achieve the design ROI corresponds to the length of the target
treatment interval and the aquifer effective porosity.

8/29/14 Y:\094\048.012\R\RIFS\RI-FS__FINAL.docx LANDAU ASSOCIATES 9-5
For purposes of this alternative, assume that two rows of injection wells would be created with a
200-ft long row along Court A and a 150-ft long row along A Street, totaling in 70 wells. Well spacing as
tight as 10 ft may be required to achieve overlapping ROI along the length of each injection row. Well
screens would target the aquifer interval from approximately 35 to 75 ft BGS, representing a target
treatment zone with a thickness of up to 40 ft. Injected donor substrates and fermentation byproducts
(e.g., volatile fatty acids and hydrogen) would be carried downgradient by groundwater flow. These two
injection rows are assumed to create, with time, a continuous treatment zone between the two rows
(located 160 ft apart) and over a similar distance downgradient. It is estimated that this conceptual layout
would create a zone of active bioremediation that would fully encompass the portion of the plume with
concentrations greater than 200 µg/L and most of plume area with concentrations greater than 50 µg/L.
Concentration reduction in the lower concentration fringes of the plume would result from mass
destruction in the high concentration core of the plume and from natural attenuation mechanisms.
To facilitate reasonably uniform distribution of injected donor solution across the 40-ft target
treatment interval, each injection well would consist of more than one well screen nested in a single
boring or a single well with multiple separate screens that would be separated by packers during injection.
Typically, vertical treatment intervals greater than 15 to 20 ft should utilize more than one injection well
screen to achieve acceptable uniformity of donor placement over the treatment interval (Parsons 2004).
Despite injection well construction for uniform distribution of injected donor, it is inevitable that donor
will be preferentially distributed to higher hydraulic conductivity flow paths within each injected interval.
This distribution of donor may be beneficial for full plume treatment, as most of the groundwater (and
contaminant) flux occurs in these more permeable zones.
Combined use of fast- and slow-release donor substrates can result in several months to more
than a year of longevity, depending on the mass of donor injected, the continuing flux of contaminant, and
the mass of natural electron acceptors within the treatment zone. It is anticipated that 2 to 3 injection
events over a 2- or 3-year period would result in 4 to 5 years of optimal bioremediation, with residual
treatment extending for an additional similar period. It has been demonstrated that electron donor
injection commonly results in periods of residual treatment (i.e., enhanced MNA) that extend well beyond
the period of active injection (Sleep, et al. 2005, Adamson and Newell 2009).
Underground injection control (UIC) registration would be required for the injection of donor
substrates. Long-term groundwater monitoring would be required to verify continued reduction of
contaminants. If cleanup standards are not achieved through EISB, contingent MNA may need to be
implemented after completion of active remediation to achieve RAOs. For cost estimating purposes,
costs assume one baseline monitoring event before injecting, 6 months of monthly monitoring over the

8/29/14 Y:\094\048.012\R\RIFS\RI-FS__FINAL.docx LANDAU ASSOCIATES 9-6
course of the three injections, and an additional 6 quarters of compliance groundwater monitoring after
completion of the injection programs.
Alternative 2 is anticipated to achieve RAO-1 and RAO-2 and would be achieved by
bioremediation of contamination in saturated soil and groundwater. RAO-3 has been achieved to the
extent feasible through the interim soil removal action on the former Sauro’s property.
The estimated cost to implement Alternative 2 is approximately $1,300,000, as summarized on
Table 9-2. All costs presented in this FS are considered to have a relative accuracy within the range of -
30 to +50 percent, as shown in Table 9-2, and should be used primarily as a basis for comparison of costs
between alternatives. More reliable costs will be developed during the design and implementation phases
of the cleanup. This estimate does not include implementation of contingent MNA.
9.3 ALTERNATIVE 3: OZONE SPARGING Alternative 3 involves injecting a strong oxidant into the subsurface for rapid VOC mass
reduction in groundwater and enhanced desorption in contaminated saturated soil using ozone sparging, a
type of ISCO. A conceptual layout of the ozone sparge well network is shown on Figure 9-3. Alternative
3 addresses groundwater and saturated soil simultaneously in accordance with the following description:
Soil and Groundwater: Sparge ozone into the saturated zone to treat contaminated groundwater and stimulate enhanced desorption processes in soil. Process is continuous, and occurs until rebound from contaminated soils no longer results in groundwater concentrations above cleanup standards. Note that if cleanup standards are not achieved Site-wide through ozone sparging, contingent
MNA may need to be implemented after completion of active remediation to complete Site remediation.
Ozone sparging would be applied via sparge wells to treat contamination in the saturated zone, as
shown in Figure 9-3. The sparge well network would consist of a grid of injection points within the
property controlled and accessible to the City. For the purposes of this FS, it is assumed that sparge wells
would be installed at approximately 30 ft spacing (based on assumed ROI of approximately 20 ft for each
sparge point) within the ROWs of South 14th Street, Court A, and A Street within the footprint of the PCE
plume. This would result in installation of approximately 50 sparge wells screened from approximately 35
to 75 ft BGS to provide a cone of influence that captures the width of the plume at the maximum depth of
contamination (approximately 75 ft BGS) to target the known extent of contamination within the ROW.
Ozone generator/sparge units will inject ozone to a manifold system which directs ozone to the
sparge well networks. For cost estimating purposes, it is assumed that the manifold and wellheads would
have to be completed below grade so that the ROW can remain open during active remediation. The
ozone generator/sparge unit is an automated system that generates ozone from atmospheric or
containerized oxygen and injects the ozone to the subsurface in a continuous stream. Since the ozone

8/29/14 Y:\094\048.012\R\RIFS\RI-FS__FINAL.docx LANDAU ASSOCIATES 9-7
generator/sparging unit is automated, it is anticipated to require minimal operations and maintenance. It
is estimated that (collectively) all areas would be treated within 2 to 3 years. An ozone system trailer can
be rented or purchased, but due to the treatment time estimate, it assumed that purchase of the trailer
would be less expensive than renting one.
Costs also assume three performance groundwater monitoring events would be conducted during
the treatment period with an additional 6 quarters of compliance groundwater monitoring after completion
of the injection programs.
Using ozone sparging, Alternative 3 achieves the RAOs presented in Section 7.3 through in situ
destruction of saturated soil and groundwater contamination. RAO-1 and RAO-2 would be achieved in
the saturated zone through oxidation of dissolved phase VOCs and enhanced desorption of contaminants
sorbed to soil. RAO-3 has been achieved to the extent feasible through the interim soil removal action on
the former Sauro’s property.
The estimated cost to implement Alternative 3 is $2,300,000, as summarized on Table 9-2. All
costs presented in this FS are considered to have a relative accuracy within the range of -30 to +50
percent, as shown in Table 9-2, and should be used primarily as a basis for comparison of costs between
alternatives. More reliable costs will be developed during the design and implementation phases of the
cleanup. This estimate does not include implementation of contingent MNA.
9.4 ALTERNATIVE 4: ELECTRICAL RESISTANCE HEATING Alternative 4 utilizes ERH to treat contaminated groundwater and saturated soil (and vadose zone
soil if needed). A conceptual layout of the ERH remedy is shown on Figure 9-4. Alternative 4 addresses
soil and groundwater simultaneously in accordance with the following description:
• Soil: Conducting ERH in saturated zone soils (and in vadose zone soils in the event any contamination is discovered outside the former Sauro’s property)
• Soil and Groundwater: Conducting ERH in the saturated zone volatilizes or boils off sorbed or dissolved phase chlorinated VOCs in both saturated soil and groundwater, which is captured and treated ex situ.
ERH uses heat generated by the resistance of the soil matrix to the flow of electrical current to
raise subsurface temperatures up to the boiling point of water. The electrodes direct electrical current into
the target subsurface depth interval where volatile compounds are converted to the vapor phase and are
captured by a vapor recovery system. ERH is equally effective in saturated and unsaturated soil and is
unfazed by low permeability or heterogeneous soil or by concentrations indicative of DNAPL (TRS
website 2014). The ERH technology uses conventional alternating current and the electrodes/vapor
recovery wells are constructed using conventional drilling techniques (USACE 2007).

8/29/14 Y:\094\048.012\R\RIFS\RI-FS__FINAL.docx LANDAU ASSOCIATES 9-8
An ERH system would be installed in the contaminated saturated zone (and vadose zone if
needed) to promote volatilization of chlorinated VOCs dissolved in water and sorbed to soil, and the
vapors and steam collected through co-located vapor recovery wells. At the surface, the steam is
condensed to water and a catalytic oxidation system or granular activated carbon would be used to treat
the extracted vapors prior to discharge to the atmosphere.
For the purposes of this FS, it is assumed that electrodes and co-located vapor recovery wells
would be installed at approximately 15 ft spacing within the ROWs of South 14th Street, Court A, and A
Street within the footprint of the PCE plume. This would result in installation of approximately 95
electrodes and co-located vapor recovery wells. For cost estimating purposes it is assumed that the
electrode/vapor well heads, conduit, cables, and vapor extraction piping would have to be completed
below grade so that the ROW can remain open during active remediation, and that subgrade installations
would have to be removed and pavement restored upon completion of remediation. Costs also assume an
estimated total heating treatment period of up to 180 days and a total energy delivery of approximately
7.8 million kilowatt hours (kwh).
Alternative 4 achieves RAO-1 and ROA-2 through volatilization/boiling, extraction, and
treatment of chlorinated solvents dissolved in groundwater and sorbed to soil. Regular sampling and
analysis of the ERH treatment system intake vapors would identify trends in subsurface conditions and
provide an indicator for when active heating could be terminated. RAO-3 has been achieved to the extent
feasible through the soil interim soil removal action on the Sauro’s property; however, if residual vadose
zone contamination were identified in the proposed ERH treatment area, the ERH design and
implementation could be modified to address contamination in those soils.
The estimated cost to implement Alternative 2 is $5,100,000, as summarized on Table 9-2. All
costs presented in this FS are considered to have a relative accuracy within the range of -30 to +50
percent, as shown in Table 9-2, and should be used primarily as a basis for comparison of costs between
alternatives. More reliable costs will be developed during the design and implementation phases of the
cleanup. This estimate does not include implementation of contingent MNA.

&<
&<
&<&<
&<
&<
&<
&<
&<
&<
&<
&<
&<
&<
&<
DaVita
Budget Property
USPSProperty
SOUTH 15TH STREET
Thea Foss Waterway
DiamondProperty
FormerSauro'sProperty
MW-3(Dry)
A ST
REET City Park Vacated South
14th Street(Steep Slope)
I705
A ST
REET
PACI
FIC AV
ENUE
COUR
T A
COMM
ERCE
STRE
ET
SOUTH 13TH STREET
RAMP
RAMP
I705
DOCK
STRE
ET
RAMP
I705
SOUTH 14TH STREET
SOUTH 15TH STREETRAMP I705
LAI-MW2 (65)
LAI-MW1 (63)
LAI-MW3 (75)LAI-MW4 (25)
LAI-MW5 (50)
MW-13 (51.5)
RNS-MW3
RNS-MW2 (38.5)
RNS-MW4
RNS-MW5
RNS-MW6 (42.5; 52.5)
RNS-MW7
MW-1
MW-2 (15)
8950001951
8950002070
2013050121
2013030010
8950002040
03200420338950001971
2014030041
2013020020
2014020020
2013050133
2013050132
2014020010
2013020011
2013040191
2012020014
8950002060
8950002050
2014030010
2014020030
2013040110
2013040020
2013040050
2013040090
89500019612011050141
2013040010
8950001964
20140300202014030030
2011040071
2013040030
2013040040
2013040060
2013040070
2013040080
2013040100
2013040120
2013040130
2013040140
2013040150
2013040160
2013040170
2013040180
2011040072
8950
0019
63
0 100 200
Scale in FeetData Sources: Pierce County GIS; Esri World Imagery 2011.
Sauro's Property RI/FSTacoma, Washington
Alternative 1 - MNA withInstitutional Controls
Figure
9-1
G:\P
roje
cts\
094\
048\
013\
014\
RIF
S 2
014\
Figu
re9-
1Alte
rnat
ive1
MN
AIn
stitu
tiona
lCon
trols
.mxd
8/2
8/20
14
Legend
&< MNA Remedy Monitoring Wells (Sample Depth in feet)
&< Other Existing Monitoring Wells
Properties for Institutional Controls
Current Extent of Site
Notes1. There are nine MNA remedy wells. Actual frequency of sampling to be determined with Ecology.2. Physical institutional controls are generally in place. Administrative controls to be established.3. Black and white reproduction of this color original may reduce its effectiveness and lead to incorrect interpretation.

&<
&<
&<
&<
&<
&<
&<
&<
&<
&<
&<
&<
&<
&<
&<
&<
!>
!>
!>
!>
!>
!I
!I
!I
!I
!I
!I
!I
!I
!I
!I
!I
!I
!I
!I
!I
!I
!I
!I
!I
!I
!I
!I
!I
!I
!I
!I
!I
!I
!I
!I
!I
!I
!I
!I
!I
!I
!I
!I
Pre-RI PCE Plume
LAI-MW1
LAI-MW3
LAI-MW2
MW-13RNS-MW6
MW-3
RNS-MW2MW-2
MW-1
RNS-MW3
RNS-MW4
RNS-MW5
LAI-MW4
RAMP
I705
LAI-MW5
MW-JS2<0.2 (09/13)
MW-JS<0.2 (06/13)
LAI-B10
LAI-B9
LAI-B8
LAI-B7
LAI-B6
RAMP
RAMP
I705
COUR
T A
PACI
FIC AV
ENUE
SOUTH 14TH STREET
A ST
REET
I705
DOCK
STRE
ET
8950001951
8950002070
2013030010
8950002040
2014030041
2013020020
2014020020
2014020010
2013020011
2013040191
8950002060
8950002050
2014030010
2014020030
2013040110
2013040090
2014030020
2014030030
2013040060
2013040070
2013040080
2013040100
2013040120
2013040130
2013040140
2013040150
2013040160
2013040170
2013040180
0 60 120
Scale in Feet
Data Source: Pierce County GIS
Sauro's Property RI/FSTacoma, Washington Alternative 2 - EISB
Figure
9-2
G:\P
roje
cts\
094\
048\
013\
014\
RIF
S 2
014\
Figu
re9-
2Alte
rnat
ive2
EIS
B.m
xd 8
/28/
2014
Notes1. <0.2 = Not Detected in Sample2. 360 (09/13) PCE concentration in µg/L (most recent samples through November 2013).3. The preliminary cleanup level for PCE is 5.0 µg/L.4. Black and white reproduction of this color original may reduce its effectiveness and lead to incorrect interpretation.
Primary Plume
Legend
Subject PropertyPre-RI PCE Plume
PCE Concentration Range (µg/L)
Location Type
!
!
!!
!
<0.20.2 - 55 - 5050 - 200>200
!> 2013 Boring&< Existing Well
!IEISB Injection Well Pair
(or 2-Screen Nested Well)

&<
&<
&<
&<
&<
&<
&<
&<
&<
&<
&<
&<
&<
&<
&<
&<
!>
!>
!>
!>
!>
!I
!I
!I
!I
!I
!I
!I
!I
!I
!I
!I
!I
!I
!I
!I
!I
!I
!I
!I
!I
!I
!I
!I
!I
!I
!I
!I
!I
!I
!I
!I
!I
!I
!I
!I
!I
!I
!I
!I!I
!I !I
Pre-RI PCE Plume
LAI-MW1
LAI-MW3
LAI-MW2
MW-13
RNS-MW6
MW-3
RNS-MW2
MW-2
MW-1
RNS-MW3
RNS-MW4
RNS-MW5
LAI-MW4
RAMP
I705
LAI-MW5
MW-JS2<0.2 (09/13)
MW-JS<0.2 (06/13)
LAI-B10
LAI-B9
LAI-B8
LAI-B7
LAI-B6
RAMP
RAMP
I705
COUR
T A
PACI
FIC AV
ENUE
SOUTH 14TH STREET
EquipmentCompound
A ST
REET
I705
DOCK
STRE
ET
8950001951
8950002070
2013030010
8950002040
2014030041
2013020020
2014020020
2014020010
2013020011
2013040191
8950002060
8950002050
2014030010
2014020030
2013040110
2013040090
2014030020
2014030030
2013040060
2013040070
2013040080
2013040100
2013040120
2013040130
2013040140
2013040150
2013040160
2013040170
2013040180
0 60 120
Scale in Feet
Data Source: Pierce County GIS
Sauro's Property RI/FSTacoma, Washington
Alternative 3 - ISCOOzone Sparging
Figure
9-3
G:\P
roje
cts\
094\
048\
013\
014\
RIF
S 2
014\
Figu
re9-
3Alte
rnat
ive3
ISC
O.m
xd 8
/28/
2014
Notes1. <0.2 = Not Detected in Sample2. 360 (09/13) PCE concentration in µg/L (most recent samples through November 2013).3. The preliminary cleanup level for PCE is 5.0 µg/L.4. Black and white reproduction of this color original may reduce its effectiveness and lead to incorrect interpretation.
Primary Plume
Legend
Subject PropertyPre-RI PCE Plume
PCE Concentration Range (µg/L)
Location Type
!
!
!!
!
<0.20.2 - 55 - 5050 - 200>200
!> 2013 Boring&< Existing Well
!I Ozone Sparge Well

&<
&<
&<
&<
&<
&<
&<
&<
&<
&<
&<
&<
&<
&<
&<
&<
!>
!>
!>
!>
!>
!D!D
!D!D
!D!D
!D
!D
!D
!D
!D
!D
!D!D
!D
!D
!D
!D
!D!D !D !D !D !D !D !D
!D
!D
!D
!D
!D
!D
!D!D!D
!D!D
!D!D
!D!D
!D!D
!D!D
!D!D
!D
!D
!D
!D
!D
!D
!D
!D!D
!D
!D
!D
!D
!D
!D
!D
!D
!D
!D
!D
!D
!D
!D
!D!D
!D
!D
!D!D!D!D!D!D !D !D !D !D
!D!D!D!D!D
!D!D
!D!D
!D!D
!D!D!D!D!D
!D
!D
!D!D
!D
!D
!D!D
!D
!D!D
!D
!D!D
!D!D
!D
!D
!D !D
!D
!D!D
Pre-RI PCE Plume
LAI-MW1
LAI-MW3
LAI-MW2
MW-13
RNS-MW6
MW-3
RNS-MW2
MW-2
MW-1
RNS-MW3
RNS-MW4
RNS-MW5
LAI-MW4
RAMP
I705
LAI-MW5
MW-JS2<0.2 (09/13)
MW-JS<0.2 (06/13)
LAI-B10
LAI-B9
LAI-B8
LAI-B7
LAI-B6
RAMP
RAMP
I705
COUR
T A
PACI
FIC AV
ENUE
SOUTH 14TH STREET
EquipmentCompound
A ST
REET
I705
DOCK
STRE
ET
8950001951
8950002070
2013030010
8950002040
2014030041
2013020020
2014020020
2014020010
2013020011
2013040191
8950002060
8950002050
2014030010
2014020030
2013040110
2013040090
2014030020
2014030030
2013040060
2013040070
2013040080
2013040100
2013040120
2013040130
2013040140
2013040150
2013040160
2013040170
2013040180
0 60 120
Scale in Feet
Data Source: Pierce County GIS
Sauro's Property RI/FSTacoma, Washington Alternative 4 - ERH
Figure
9-4
G:\P
roje
cts\
094\
048\
013\
014\
RIF
S 2
014\
Figu
re9-
4Alte
rnat
ive4
ER
H.m
xd 8
/28/
2014
Notes1. <0.2 = Not Detected in Sample2. 360 (09/13) PCE concentration in µg/L (most recent samples through November 2013).3. The preliminary cleanup level for PCE is 5.0 µg/L.4. Black and white reproduction of this color original may reduce its effectiveness and lead to incorrect interpretation.
Primary Plume
Legend
Subject PropertyPre-RI PCE Plume
PCE Concentration Range (µg/L)
Location Type
!
!
!!
!
<0.20.2 - 55 - 5050 - 200>200
!> 2013 Boring&< Existing Well
!D ERH Electrode

TABLE 9-1ALTERNATIVE 1 - MONITORED NATURAL ATTENUATION SAMPLING PLAN
SAURO'S PROPERTY RI/FSTACOMA, WASHINGTON
Table 9-1Page 1 of 1
5/14/2014Y:\094\048.012\R\RIFS\Tables\Section 9.0\Table 9-1_MNA Samp Plan LANDAU ASSOCIATES
LocationVOCs
Sampling Depth (ft)VOCs Concentration Data
Sample MethodMNA Parameters
Sampling Depth (ft) MNA Parameters Sample Method
LAI-MW1 63 PDB 63 WAT
LAI-MW2 65 PDB 65 WAT
LAI-MW3 75 PDB 75 WAT
LAI-MW4 25 PDB 25 WAT
LAI-MW5 42 PDB
LAI-MW5 (a) 50 PDB
MW1-PP 18(b) PP 18 PP
MW2-PP 15(b) PP 15 PP
MW13 51.5 PDB 51.5 WAT
RNS-MW2 21.5 PDB
RNS-MW2 (a) 38.5 PDB
RNS-MW6 (b) 42.5 PDB
RNS-MW6 (b) 52.5 PDB
RNS-MW7 NPS NPS 41 WAT
Sample point from RI to be discontinuedRevised sample depth
NPS = not previously sampledPP = peristaltic pump w/dedicated tubingPDB = permeable diffusion bagQ = quarterlySA = semiannualWAT = (dedicated) Waterra foot valve (w/dedicated tubing 5/8" HDPE tubing)
(a) The Monitored Natural Attenuation (MNA) sampling depth has been revised to be the same as the remaining volatile organic compound (VOC) sampling depth.(b) For RNS-MW6, where there is two VOC sampling depths, the MNA sampling depth is the mid-point between the two VOC sampling depths.
50
38.5
47.5
WAT
WAT
WAT

TABLE 9-2ALTERNATIVES COST ESTIMATE SUMMARY
SAURO'S PROPERTY RI/FSTACOMA, WASHINGTON
Table 9-2Page 1 of 1
8/28/2014Y:\094\048.012\R\RIFS\Tables\Section 9.0_rev\Table 9-2_Cost Summary_rev LANDAU ASSOCIATES
Remedial Alternative Number Remedial Alternative Name Estimated Cost (b) Active Time Frame Performance Monitoring
1 (a) Monitored Natural Attenuation with Institutional Controls $ 402,000 -- 30 years
2 Enhanced In Situ Bioremediation $ 1,334,000 3 years 1.5 years
3 In Situ Chemical Oxidation - Ozone Sparging $ 2,256,000 3 years 1.5 years
4 Electrical Resistance Heating $ 5,136,000 0.5 years 1.5 years
-- = Not Applicable(a) For Alternative 1, the estimated costs represent present worth based on a discount rate of 3% for long-term operation, monitoring, and maintenance tasks.
(b) All estimated costs are considered order of magnitude estimates with a relative accuracy range of -30 to +50 percent. Use should be limited to the comparative evaluation of alternatives. More accurate costs will be developed during the design and implementation phases of the cleanup.

8/29/14 Y:\094\048.012\R\RIFS\RI-FS__FINAL.docx LANDAU ASSOCIATES 10-1
10.0 DETAILED EVALUATION OF ALTERNATIVES
The following sections describe the process of evaluating and selecting a cleanup action per WAC
173-340-360. Section 10.1 presents a description of the evaluation criteria against which the alternatives
are evaluated. Section 10.2 presents an evaluation of the alternatives against these criteria. Section 10.3
presents the DCA conducted to determine which alternative is permanent to the maximum extent
practicable.
10.1 MODEL TOXICS CONTROL ACT EVALUATION CRITERIA MTCA requires that cleanup alternatives be compared to a number of criteria to evaluate the
adequacy of each alternative in achieving the intent of the regulations, and as a basis for comparing the
relative merits of the developed cleanup alternatives.
An evaluation of the cleanup action alternatives against these criteria is then presented in sections
10.2 and 10.3. Each of the cleanup action alternatives described in Section 9.0 achieve the three RAOs
identified for Site cleanup in Section 7.0, and meet all of the MTCA threshold requirements (described in
Section 10.1.1); each alternative is therefore, a viable cleanup alternative under MTCA.
10.1.1 MODEL TOXICS CONTROL ACT THRESHOLD REQUIREMENTS As specified in WAC 173-340-360(2), all cleanup actions are required to meet the following
threshold requirements:
• Protect human health and the environment
• Comply with cleanup standards specified under MTCA
• Comply with applicable state and federal laws
• Provide for compliance monitoring.
It is assumed that compliance with MTCA cleanup standards will ensure protection of human
health and the environment and that any cleanup action performed in accordance with the requirements of
MTCA will be in compliance with applicable state and federal laws. Compliance monitoring is a
component of all four alternatives.
10.1.2 REQUIREMENT FOR PERMANENT SOLUTION TO THE MAXIMUM EXTENT PRACTICABLE WAC 173-340-200 defines a permanent solution as one in which cleanup standards of WAC 173-
340-700 through 173-340-760 can be met without further action being required at the original Site or any
other site involved with the cleanup action, other than the approved disposal of any residue from the
treatment of hazardous substances. MTCA recognizes that permanent solutions may not be practicable

8/29/14 Y:\094\048.012\R\RIFS\RI-FS__FINAL.docx LANDAU ASSOCIATES 10-2
for all sites and provides criteria for determining whether a cleanup action is permanent to the “maximum
extent practicable” in WAC 173 340-360(3)(f). These criteria include:
• Protectiveness. Overall protectiveness of human health and the environment, including the degree to which Site risks are reduced, time required to reduce risk at the facility and attain cleanup standards, risks during implementation, and improvement of overall environmental quality.
• Permanence. The degree of reduction in toxicity, mobility, and volume of hazardous substances, including the reduction or elimination of hazardous substance releases and sources of releases.
• Cost to implement the remedy including capital costs and operation and maintenance costs.
• Effectiveness over the long-term. Long-term effectiveness, including 1) the degree of certainty that the alternative will be successful, 2) the reliability of the alternative during site cleanup, 3) the magnitude of residual risk with the alternative in place, and 4) the effectiveness of controls required to manage treatment residues and remaining waste. The following types of cleanup action components may be used as a guide, in descending order, when assessing the relative degree of long-term effectiveness: Reuse or recycling; destruction or detoxification; immobilization or solidification; onsite or offsite disposal in an engineered, lined, and monitored facility; onsite isolation or containment with attendant engineering controls; and institutional controls and monitoring.
• Management of short-term risks. The risk to human health and the environment during construction and implementation, and the effectiveness of measures to manage the risk.
• Technical and administrative implementability. Implementability, including consideration of whether the alternative is technically possible; the availability of necessary offsite facilities, services, and materials; administrative and regulatory requirements; scheduling, size, and complexity of construction; monitoring requirements; access for construction, operations, and monitoring; and integration with existing facility operations.
• Consideration of public concerns. Whether the community has concerns and the extent to which those concerns are addressed.
The DCA [WAC 173-340-360(3)(e)] is used to determine whether a cleanup action is permanent
to the maximum extent practicable. The purpose of the DCA is to determine if the incremental increase
in cost of a cleanup alternative over that of a lower cost alternative is justified by the incremental increase
in benefits to human health and the environment. If the incremental increase in costs is determined to be
disproportionate to the benefits, the more expensive alternative is considered impracticable and the lower
cost alternative is determined to be permanent to the maximum extent practicable. This process provides
a mechanism for balancing the permanence of the cleanup action with its costs, while ensuring that
human health and the environment are protected.
Alternative 4 is considered the most permanent alternative developed in this FS. Alternative 4
consists of ERH treatment of contaminated soil and groundwater. Alternative 4 was selected as the most
permanent alternative over Alternatives 2 and 3 because Alternative 4 permanently removes or destroys
contamination from both groundwater and soil (both saturated zone and vadose zone, if necessary) and

8/29/14 Y:\094\048.012\R\RIFS\RI-FS__FINAL.docx LANDAU ASSOCIATES 10-3
provides the most rapid restoration timeframe; therefore, it is considered a more permanent alternative per
WAC 173-340-360(3)(e)(ii)(B).
10.1.3 REQUIREMENT FOR A REASONABLE RESTORATION TIMEFRAME WAC 173-340-360(6)(a) specifies that the following factors be considered when determining
whether a cleanup action provides for a reasonable restoration timeframe:
• Potential risks to human health and the environment
• Practicability of achieving a shorter restoration timeframe
• Current use of the site, surrounding areas, and associated resources that are, or may be affected by releases from the site
• Availability of alternate water supplies
• Likely effectiveness and reliability of institutional controls
• Ability to control and monitor migration of hazardous substances from the site
• Toxicity of the hazardous substances at the site
• Natural processes that reduce concentrations of hazardous substances and have been documented to occur at the site or under similar site conditions.
10.1.4 REQUIREMENT FOR CONSIDERATION OF PUBLIC CONCERNS Consideration of public concerns is an inherent part of the Site cleanup process under MTCA (see
WAC 173-340-600). Prior to implementation of a cleanup action, Ecology will issue a draft CAP for
public comment as specified in WAC 173-340-380. Under this process, Ecology will publish a notice in
the site registry regarding the availability of this RI/FS document for public review and comment.
10.2 COMPARATIVE ANALYSIS OF ALTERNATIVES This section evaluates and compares the adequacy of each alternative relative to the criteria
discussed in Section 4.1. As previously discussed, each of the cleanup action alternatives achieves the
RAOs and meets all of the MTCA threshold requirements; each alternative is therefore, a viable and
appropriate cleanup alternative under MTCA. The comparative analysis of the alternatives is organized
by criteria, and is presented in the following sections.
10.2.1 THRESHOLD REQUIREMENTS In order for an alternative to achieve the threshold requirements it must adequately protect human
health and the environment, comply with cleanup standards, comply with state and federal laws, and
provide for compliance monitoring. Each of the four alternatives achieves the threshold requirements as
follows:

8/29/14 Y:\094\048.012\R\RIFS\RI-FS__FINAL.docx LANDAU ASSOCIATES 10-4
• Protection of human health and the environment: Each of the four alternatives is protective of human health and the environment because no complete exposure pathway likely exists under current conditions. Vadose zone soils have been remediated during the 2009 interim action, so no direct contact exposure pathway exists and leaching to groundwater does not appear to be occurring; groundwater is not (and may not be) extracted for potable uses; contaminated groundwater is not discharging to surface water; and VI does not appear to be an applicable pathway. Each alternative provides measures to maintain and/or monitor this level of protection. A comparative analysis between the four alternatives with respect to protection of human health and the environment is provided in Section 10.3.1 as part of the disproportionate cost analysis.
• Compliance with cleanup standards under MTCA: Each of the four alternatives complies with the cleanup standards. Alternative 1 achieves the groundwater cleanup standards through natural attenuation and institutional controls. Alternatives 2, 3, and 4 achieve the groundwater cleanup standards through in situ biological, chemical, and thermal treatment technologies, respectively. Each of the alternatives currently meet soil cleanup standards, assuming the interim action successfully removed all vadose zone soil contamination.
• Compliance with applicable state and federal laws: Each of the four alternatives comply with applicable state and federal laws
• Provisions for compliance monitoring: Each of the four alternatives includes compliance monitoring. Alternative 1 includes ongoing groundwater monitoring to evaluate natural attenuation processes and confirm that conditions do not change in a manner that would adversely impact human health or the environment. Alternatives 2 and 3 include at least 4 quarters of groundwater monitoring to assess progress in achieving groundwater CULs. Alternative 4 includes 4 quarters of groundwater monitoring to confirm attainment of the groundwater cleanup standards.
10.2.2 PERMANENT SOLUTIONS TO THE MAXIMUM EXTENT PRACTICABLE A DCA is performed to determine whether a cleanup action is permanent to the maximum extent
practicable. The purpose of the DCA is to determine if the costs of a cleanup action are disproportionate
to human health and environmental benefits achieved by the cleanup action, thus rendering the alternative
impracticable. In accordance with the procedures and criteria identified in Section 10.1.2, this section
presents a qualitative comparison of the costs and benefits of Alternatives 1 through 3 to the most
permanent alternative (Alternative 4).
10.2.2.1 Protectiveness
As indicated in Section 10.1.2, overall protectiveness is a measure of the degree to which Site
risks are reduced, the time required to reduce risk at the facility and attain cleanup standards, risks during
implementation, and improvement of overall environmental quality. The overall protectiveness and
associated considerations for each alternative are as follows:
• Alternative 1: Medium
– While Site risks are reduced through the gradual reduction in contaminant concentrations, the improvement in overall environmental quality is (restoration timeframe) very slow to

8/29/14 Y:\094\048.012\R\RIFS\RI-FS__FINAL.docx LANDAU ASSOCIATES 10-5
moderate because of the long duration of the remedy and the potential for future exposure during redevelopment on impacted property not owned by the City. Risk during implementation is very low due to limited contact with contaminated media and no active remediation activities.
• Alternative 2: Medium High
– Alternative 2 significantly reduces long-term risk relatively rapidly and provide a significant improvement in overall environmental quality through the reduction in contaminant mass by in situ treatment. Alternative 2 has limited risk during implementation because treatment will primarily occur in situ and involves materials (electron donors) with low risk to human health and the environment, which minimizes the potential exposure of workers.
• Alternative 3: Medium High
– Alternative 3 also significantly reduces long-term risk relatively rapidly and provides a significant improvement in overall environmental quality through the reduction in contaminant mass by chemical oxidation of contaminants. Alternative 3 has a minimal risk because treatment will primarily occur in situ and involves generation of ozone for injection on site (i.e., no transport or handling of chemical oxidants) with low risk to human health and the environment, which minimizes the potential exposure of workers.
• Alternative 4: High
– Alternative 4 is high because it rapidly and nearly completely reduces the contaminant mass, and provides even greater improvement in overall environmental quality than Alternatives 1, 2, and 3 through the reduction in contaminant mass through in situ thermal treatment. Alternative 4 has a minimal risk because treatment will primarily occur in situ which minimizes the potential exposure of workers. Although electrical hazards are a potential risk, health and safety procedures involving the ERH technology are rigorous. The technology also requires no transport or handling of chemical materials for treatment.
10.2.2.2 Permanence
As indicated in Section 10.1.2, permanence is the degree of reduction in toxicity, mobility, and
volume of hazardous substances, including the reduction or elimination of hazardous substance releases
and sources of releases. The overall permanence and associated considerations for each alternative are as
follows:
• Alternative 1: Medium
– Alternative 1 provides a moderate level of permanence because it eventually results in a reduction in contaminant mass through natural attenuation. Mobility and toxicity of the contaminants are not significantly altered through MNA until the contaminant is naturally degraded.
• Alternative 2: Medium High
– Alternative 2 provides in situ treatment of VOC-contaminated groundwater through enhanced biological processes, and provides a medium high level of permanence through the permanent reduction in contaminant mass; thereby, reduction of toxicity and mobility.
• Alternative 3: Medium High

8/29/14 Y:\094\048.012\R\RIFS\RI-FS__FINAL.docx LANDAU ASSOCIATES 10-6
– Alternative 3 provides in situ treatment of VOC-contaminated groundwater through chemical oxidation, and provides a medium high level of permanence through the permanent reduction in contaminant mass; thereby, reduction of toxicity and mobility.
• Alternative 4: High
– Alternative 4 provides rapid in situ treatment of VOC-contaminated groundwater and saturated soils through thermal processes, and provides a high level of permanence through the permanent reduction in contaminant mass; thereby, reduction of toxicity and mobility.
10.2.2.3 Effectiveness over the Long-Term
As indicated in Section 10.1.2, long-term effectiveness includes 1) the degree of certainty that the
alternative will be successful, 2) the reliability of the alternative during site cleanup, 3) the magnitude of
residual risk with the alternative in place, and 4) the effectiveness of controls required to manage
treatment residues and remaining waste. All four cleanup alternatives would be effective in the long-
term. The overall effectiveness over the long term and associated considerations for each alternative are
as follows:
• Alternative 1: Medium
– Alternative 1 has a moderate degree of certainty that the remedy will be successful based on evaluation of MNA parameters at the Site and observations of a stable or shrinking plume. Under this alternative, residual risk is managed through institutional controls which cannot be applied and/or monitored with certainty for property not controlled by the City.
• Alternative 2: Medium High
– Alternative 2 has a relatively high level of certainty for long-term effectiveness because it will degrade groundwater contaminants in situ and stimulates natural biological activity already occurring at the Site. Treatment provides for longer term/ongoing groundwater treatment of contaminants that will desorb from contaminated saturated soils, so rebound in groundwater contaminant concentrations is less likely to be observed. However, without additional provision of electron donor, biological activity will eventually tail off.
• Alternative 3: Medium High
– Alternative 3 has a relatively high level of certainty for long-term effectiveness because it will oxidize groundwater contaminants in situ. However, treatment provides only short duration treatment and may not adequately address contaminants that will desorb from contaminated saturated soils. So without additional treatment, rebound in groundwater contaminant concentrations is more likely to be observed.
• Alternative 4: High
– Alternative 4 has a very high degree of certainty for long-term effectiveness because most, if not all, residual risk will be eliminated through in situ thermal treatment of groundwater and saturated soil contamination.

8/29/14 Y:\094\048.012\R\RIFS\RI-FS__FINAL.docx LANDAU ASSOCIATES 10-7
10.2.2.4 Management of Short-Term Risks
As indicated in Section 10.1.2, management of short-term risks include the risk to human health
and the environment during construction and implementation, and the effectiveness of measures to
manage the risk. The management of short-term risks and associated considerations for each alternative
are as follows:
• Alternative 1: High
– The management of short-term risks associated with Alternative 1 is high because short-term risks related to long-term groundwater monitoring are minimal.
• Alternative 2: Medium High
– The management of short-term risks associated Alternative 2 is relatively high because short-term risks are primarily associated with worker safety during injection well drilling and electron donor injection events that include non-toxic, non-hazardous substances. Injection pressures present the highest risk, but can be managed with proper health and safety procedures.
• Alternative 3: Medium
– The management of short-term risks associated Alternative 3 is moderate because short-term risks are associated with worker safety during injection well drilling as well as oxidant injections which utilize liquid or gaseous oxidants which can be hazardous to human health. However, these risks can be managed with proper health and safety procedures.
• Alternative 4: Medium
– Management of short-term risks for Alternative 4 is moderate because short-term risks are associated with worker safety during electrode/vapor recovery well drilling as well as electrical hazards associated with the technology. However, these risks can be managed with proper health and safety procedures.
The short-term risks associated with each alternative can be effectively managed through
appropriate design and construction controls, including implementation of a Site-specific health and
safety plan during construction.
10.2.2.5 Technical and Administrative Implementability
As indicated in Section 10.1.2, technical and administrative implementability includes
consideration of whether the alternative is technically possible; the availability of necessary offsite
facilities, services, and materials; administrative and regulatory requirements; scheduling, size, and
complexity of construction; monitoring requirements; access for construction, operations, and monitoring;
and integration with existing facility operations. All four cleanup alternatives would be technically and
administratively implementable. The overall level of implementability and associated considerations for
each alternative are as follows:
• Alternative 1: High

8/29/14 Y:\094\048.012\R\RIFS\RI-FS__FINAL.docx LANDAU ASSOCIATES 10-8
– Technical: Alternative 1 has few technical challenges beyond basic groundwater sample collection and analysis; thus, easily implemented.
– Administrative: The biggest challenge administratively is implementing institutional controls on both City-owned/controlled property and privately owned property. Careful and conscientious planning of how such controls will be implemented on private property to allow the City to monitor or provide protective measures for potential future land actions is necessary.
• Alternative 2: Medium
– Technical: Alternative 2 has a number of technical challenges including installation of a moderate number of injection wells within the City ROW, and providing adequate coverage (horizontally and vertically) and density that the groundwater plume will be adequately treated, especially since access to all areas of the plume is not available due to its location on private property. Delivery of electron donor to the subsurface can also be a challenge due to soil conditions and preferential pathways.
– Administrative: Administrative challenges for Alternative 2 include obtaining UIC permits and recurring access and temporary closures to the City ROWs.
• Alternative 3: Medium
– Technical: Alternative 3 has a number of technical challenges including installation of a relatively high number of injection wells within the City ROW, and providing adequate coverage (horizontally and vertically) and density that the groundwater plume will be adequately treated, especially since access to all areas of the plume is not available due to its location on private property. Delivery of oxidant to the subsurface can also be a challenge due to soil conditions and preferential pathways. If gaseous oxidant (ozone) is used, installation of a delivery network in the ROW for ongoing injection is an additional challenge.
– Administrative: Administrative challenges for Alternative 3 include obtaining underground injection control (UIC) permits and recurring access and temporary closures to the City ROWs.
• Alternative 4: Medium Low
– Technical: Alternative 4 has a number of technical challenges including installation of a relatively high number of electrodes/vacuum recovery wells and thermocouples within the City ROW; providing adequate coverage (horizontally and vertically); and that the treatment zone is adequately covered and heated, especially since access to all areas of the plume is not available due to its location on private property. Installation of a power delivery and vacuum recovery network in the ROW for operation of the ERH system will also be a significant technical challenge.
– Administrative: Administrative challenges for Alternative 4 include obtaining underground electrical, air, and sewer discharge permits and recurring access and temporary to long term closures to the City ROWs.
10.2.2.6 Consideration of Public Concerns
As indicated in Section 10.1.2, the criteria for consideration of public concerns includes whether
the community has concerns and the extent to which those concerns are addressed. Public concerns will
be identified and addressed through the public participation process that is an integral part of MTCA. The
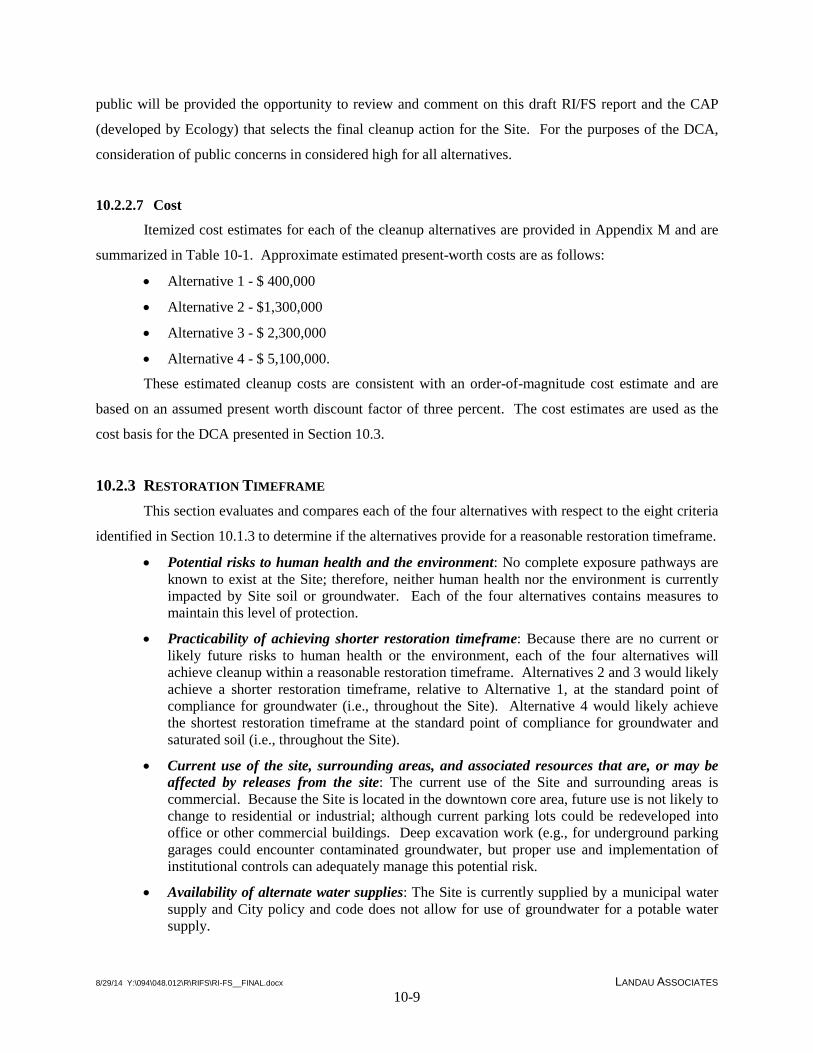
8/29/14 Y:\094\048.012\R\RIFS\RI-FS__FINAL.docx LANDAU ASSOCIATES 10-9
public will be provided the opportunity to review and comment on this draft RI/FS report and the CAP
(developed by Ecology) that selects the final cleanup action for the Site. For the purposes of the DCA,
consideration of public concerns in considered high for all alternatives.
10.2.2.7 Cost
Itemized cost estimates for each of the cleanup alternatives are provided in Appendix M and are
summarized in Table 10-1. Approximate estimated present-worth costs are as follows:
• Alternative 1 - $ 400,000
• Alternative 2 - $1,300,000
• Alternative 3 - $ 2,300,000
• Alternative 4 - $ 5,100,000.
These estimated cleanup costs are consistent with an order-of-magnitude cost estimate and are
based on an assumed present worth discount factor of three percent. The cost estimates are used as the
cost basis for the DCA presented in Section 10.3.
10.2.3 RESTORATION TIMEFRAME This section evaluates and compares each of the four alternatives with respect to the eight criteria
identified in Section 10.1.3 to determine if the alternatives provide for a reasonable restoration timeframe.
• Potential risks to human health and the environment: No complete exposure pathways are known to exist at the Site; therefore, neither human health nor the environment is currently impacted by Site soil or groundwater. Each of the four alternatives contains measures to maintain this level of protection.
• Practicability of achieving shorter restoration timeframe: Because there are no current or likely future risks to human health or the environment, each of the four alternatives will achieve cleanup within a reasonable restoration timeframe. Alternatives 2 and 3 would likely achieve a shorter restoration timeframe, relative to Alternative 1, at the standard point of compliance for groundwater (i.e., throughout the Site). Alternative 4 would likely achieve the shortest restoration timeframe at the standard point of compliance for groundwater and saturated soil (i.e., throughout the Site).
• Current use of the site, surrounding areas, and associated resources that are, or may be affected by releases from the site: The current use of the Site and surrounding areas is commercial. Because the Site is located in the downtown core area, future use is not likely to change to residential or industrial; although current parking lots could be redeveloped into office or other commercial buildings. Deep excavation work (e.g., for underground parking garages could encounter contaminated groundwater, but proper use and implementation of institutional controls can adequately manage this potential risk.
• Availability of alternate water supplies: The Site is currently supplied by a municipal water supply and City policy and code does not allow for use of groundwater for a potable water supply.

8/29/14 Y:\094\048.012\R\RIFS\RI-FS__FINAL.docx LANDAU ASSOCIATES 10-10
• Likely effectiveness and reliability of institutional controls: The institutional controls that are to be included in Alternative 1 are expected to be effective at preventing future groundwater use and direct contact with contaminated soil or groundwater.
• Ability to control and monitor migration of hazardous substances from the site: Monitoring data indicates that the groundwater plume is stable or shrinking and significant migration of hazardous substances at the Site is not occurring. Each alternative includes monitoring to verify that this condition remains unchanged.
• Toxicity of hazardous substances at the site: The main COCs at the Site are chlorinated solvents. The toxicity of these constituents at the levels present is moderate; however, as indicated above, there are currently no complete exposure pathways for human or ecological receptors.
• Natural processes that reduce concentrations of hazardous substances and have been documented to occur at the site or under similar site conditions: Site data indicates that natural processes are effectively containing contaminated groundwater from migrating beyond the current known limits of the plume. Additionally, MNA data evaluated to date suggest that natural attenuation processes are occurring throughout the Site.
In summary, Alternative 4 will likely achieve CULs at the standard point of compliance sooner
than the other three alternatives; and Alternatives 2 and 3 will achieve cleanup sooner than Alternative 1.
However, because of the low risk to human health or the environment under current and future land uses,
each of the four alternatives will achieve Site cleanup within a reasonable restoration timeframe.
10.2.4 REQUIREMENT FOR CONSIDERATION OF PUBLIC CONCERNS Public concerns for each of the alternatives will be addressed through comments received on the
draft RI/FS and CAP documents as part of the cleanup process under MTCA.
10.3 MODEL TOXICS CONTROL ACT DISPROPORTIONATE COST ANALYSIS As discussed in Section 10.1.2, MTCA requirements for remedy selection include the
requirement to use permanent solutions to the maximum extent practicable. MTCA defines permanent
cleanup actions as those in which cleanup standards are met without further action being required.
MTCA specifies that the evaluation of whether or not a cleanup action uses permanent solutions to the
maximum extent practicable be based on a DCA consistent with the requirements of WAC 173-340-
360(3)(e). In that analysis, cleanup alternatives are arranged from least to most permanent based on the
criteria specified in WAC 173-340-360(3)(f).
The DCA then compares the relative environmental benefits of each alternative against those
provided by the most permanent alternative evaluated. Costs are disproportionate to benefits if the
incremental cost of an alternative over that of a lower cost alternative exceed the incremental degree of
benefits achieved by the alternative over that of the lower cost alternative [WAC 173-340-360(3)(e)(i)].

8/29/14 Y:\094\048.012\R\RIFS\RI-FS__FINAL.docx LANDAU ASSOCIATES 10-11
Where the benefits of two alternatives are equivalent, MTCA specifies that Ecology select the least costly
alternative [WAC 173-340-360(e)(ii)(c)].
The DCA is performed below, using the information presented in Section 10.2 and in Table 10-1.
The alternatives are first compared to the most permanent cleanup alternative, and the benefits of each
alternative are ranked under the criteria of the DCA [WAC 173-340-360(f)] in Section 10.3.1. The costs
are then compared against these benefits and the relationship between the benefits and costs evaluated in
Section 10.3.2. This analysis then defines which alternative is permanent to the maximum extent
practicable.
Relative rankings for the alternatives were determined by assigning a value on a scale from 1 to
10, where 10 is the highest benefit/value, for each criterion, multiplying each value by a weighting factor,
and summing the weighted values to determine an overall alternative-benefits-ranking score. Weighting
factors are the same as those used by Ecology in other Puget Sound area sites. The six evaluation criteria
and associated weighting factors are:
• Protectiveness: 30 percent
• Permanence: 20 percent
• Long-term effectiveness: 20 percent
• Short-term risk management: 10 percent
• Implementability: 10 percent
• Considerations of public concerns: 10 percent.
Relative rankings of each alternative for the benefits criteria are discussed below and summarized in
Table 10-1.
10.3.1 COMPARATIVE EVALUATION OF ALTERNATIVES The DCA is based on a comparative analysis of the alternatives against the six evaluation criteria.
Relative rankings of each alternative for the six criteria are discussed below and summarized in Table 10-
1 for each Alternative. The following provides the comparative evaluation of the alternatives and
compares Alternatives 1 through 3 to the most permanent alternative, Alternative 4.
10.3.1.1 Protectiveness
All four alternatives are protective of human health and the environment. The differences lie
within the technologies used to achieve that protectiveness. Alternative 4 achieves protection through in
situ thermal treatment of groundwater and saturated soils. Alternative 2 achieves protection through in
situ enhanced biological treatment of groundwater. Alternative 2 is similar to Alternative 3, but achieves
protection through in situ treatment of groundwater through chemical oxidation. Alternative 1 achieves

8/29/14 Y:\094\048.012\R\RIFS\RI-FS__FINAL.docx LANDAU ASSOCIATES 10-12
cleanup through long-term monitoring of natural attenuation processes (with institutional control to
prevent potential human ingestion or direct contact with groundwater).
Alternative 4 was ranked the highest for protectiveness with a ranking of 9 based on the complete
removal/treatment of contaminates from groundwater and saturated soil; this alternative was not given a
ranking of 10 because there is some potential that CULs will not be achieved in groundwater where direct
treatment of groundwater could not be completed on property not owned/controlled by the City.
Alternatives 2 and 3 were given a ranking of 8 based on the expectation that in situ treatment of
contaminated groundwater will achieve groundwater CULs given sufficient time for treatment; however,
both technologies have the potential to not adequately treat contamination sorbed to saturated soil and
similar to Alternative 4, treatment of groundwater could not be completed on property not
owned/controlled by the City. Alternative 1 is given a ranking of 6 because natural attenuation processes
will likely result in cleanup of the entire Site; however, the timeframe of the cleanup is significantly
longer than the other alternatives, and the alternative relies on institutional controls to prevent potential
future exposure scenarios that may arise during potential redevelopment of impacted private property.
10.3.1.2 Permanence
As indicated previously, Alternative 4 is considered the most permanent alternative because it
removes/treats both contaminated groundwater and saturated soil. Alternatives 2 and 3 provide
reductions in contaminant mass through biological and chemical processes, respectively, but are
susceptible to rebound because they do not directly treat contaminants sorbed to saturated soil.
Alternative 1 slowly and steadily reduces contaminant mass through natural biological and physical
processes.
Alternative 4 was ranked highest for permanence (9) because it quickly and permanently
treats/removes contaminated groundwater and saturated soil. Alternatives 2 and 3 are each given a
permanence ranking of 8 because of the potential for rebound from contaminated saturated soils which
are not directly treated by the technology. Alternative 1 was given a ranking of 6 because the long
restoration timeframe and the potential that contamination in areas where natural attenuation processes
are not as active as others may persist.
10.3.1.3 Effectiveness over the Long-Term
Alternative 4 is considered the most effective in the long-term because it removes/treats most, if
not all, contamination from both groundwater and saturated soil. Alternatives 2 and 3 are considered
moderately effective because both technologies are proven to treat groundwater, but are both susceptible
to rebound. Alternative 1 is considered somewhat less effective in the long-term because of the slow rate

8/29/14 Y:\094\048.012\R\RIFS\RI-FS__FINAL.docx LANDAU ASSOCIATES 10-13
of reduction of the contaminant mass and, because it relies on institutional controls, it retains the risk of
losing effectiveness if the institutional controls are not properly followed.
Alternative 4 is ranked the highest for long-term effectiveness (9) because most of the
contamination (if not all) would be removed from groundwater and saturated soil (and vadose zone soil if
necessary); it is not given a 10 because there are privately owned areas of the Site where it may not be
implementable. Alternative 2 is ranked slightly lower (8) because it is susceptible to rebound in
groundwater because saturated soils are not directly treated by the technology; however, the stimulation
of biologically active zones can be induced in areas downgradient of injections locations, including
property not directly under City control. Alternative 3 is given a slightly lower ranking (7) than
Alternative 2 because oxidants must come into direct contact with contaminants to be effective and the
technology is also susceptible to rebound. Alternative 1 is given a ranking of 6 because it does not
rapidly reduce contaminant mass and relies on institutional controls.
10.3.1.4 Management of Short-Term Risks
Alternative 1 is ranked the highest (10) with respect to management of short-term risk because
there are minimal risks associated with simple long-term groundwater monitoring. Alternative 2 is
ranked lower (8) because of the risks to workers associated with installation of a moderate number of
injection wells and the injection of electron donor potentially under pressure. Alternatives 3 and 4 are
each given rankings of 6 due to the relatively high number of injection wells and electrodes required for
each, respectively, and the risk of working with oxidants and high voltage electricity, respectively.
10.3.1.5 Technical and Administrative Implementability
Alternative 1 is ranked the highest (9) for implementability because it requires no construction; it
poses some administrative implementation challenges related to filing and implementing the institutional
controls related to non-City owned/controlled property. The other alternatives are all ranked significantly
lower due to the amount of work and infrastructure necessary within City ROWs and the inability to
install the technologies on private property. Of the remaining alternatives (Alternatives 2 through 4),
Alternative 2 is given the highest ranking of 6 because it involves drilling and installation of less
infrastructure and is not as limited by property line restrictions (i.e., it can be used to treat areas
downgradient of injection points). Alternative 3 is given a ranking of 5 because of the high number of
injection points required and the need for construction a distribution network for ozone in the ROW.
Alternative 4 is given a ranking of 4 because of the high number of electrodes/vapor recovery points
required, the need for construction of a distribution network for power and vapor recovery in the ROW,
and additional permitting needs (air permit, wastewater discharge permit).

8/29/14 Y:\094\048.012\R\RIFS\RI-FS__FINAL.docx LANDAU ASSOCIATES 10-14
10.3.1.6 Consideration of Public Concerns
Specific public concerns regarding the cleanup alternatives are not yet known; however, it is
assumed that the greatest public concern would be protection of human health and the environment. This
concern is reflected in the other criterion above such as Protectiveness and Permanence. The other
concerns described in Section 10.1.4 are readily managed and do not necessarily favor one alternative
over another. Therefore, for the purposes of completing this draft RI/FS for public review, all alternatives
are given a ranking of 10 for consideration of public concerns. Evaluation of alternatives against the
Consideration of Public Concerns criterion is subject to change based on public comments received on
this document.
10.3.2 COMPARISON OF OVERALL BENEFITS (RELATIVE BENEFIT SCORES) Based on higher overall scores in the areas of protectiveness, permanence, and long-term
effectiveness, Alternative 4 has the highest weighted score. The rank and relative benefit scores for each
alternative are presented in Table 10-1, and are as follows:
• Alternative 1 Relative Benefit Score: 7.1
• Alternative 2 Relative Benefit Score: 8.0
• Alternative 3 Relative Benefit Score: 7.5
• Alternative 4 Relative Benefit Score: 8.3.
10.3.3 DISPROPORTIONATE COST ANALYSIS The estimated costs and benefits presented in Section 10.3.1 are summarized for each alternative
in Table 10-1. Table 10-1 also summarizes the overall benefits and costs for each alternative using the
relative benefit score developed for each alternative in Section 10.3.2.
Figure 10-1 provides a graphical comparison between the costs of each alternative and the
relative benefits, using the costs developed in Appendix M and benefit rankings developed in Table 10-1.
A comparison of the relative benefit-to-cost ratios between the alternatives is also depicted on the figure.
The relative benefit versus cost ratios have been escalated by a scaling factor of 400,000 so that the ratios
can be presented in comparison to the ranges-of-scale provided by the relative benefit ranking axis.
The DCA indicates that Alternative 4 (ERH) yields the greatest overall benefit of the four
alternatives evaluated, as indicated in the previous section. Therefore, per WAC 173-340-360(3)(e)(ii)(B),
Alternative 4 is considered the most permanent solution and shall be considered the baseline cleanup
action alternative against which the other alternatives are compared.
However, even though Alternative 4 has the highest overall benefit ranking, Alternatives 1, 2, and
3 each have a higher benefit to cost ratio than Alternative 4 due to their considerably lower comparative

8/29/14 Y:\094\048.012\R\RIFS\RI-FS__FINAL.docx LANDAU ASSOCIATES 10-15
costs (i.e., 56 to 92 percent lower costs). Therefore, the incremental cost of Alternative 4 is considered
substantial and disproportionate to its incremental benefits and is considered impracticable. Alternative 2
then becomes the most practicable permanent solution remaining because it has the highest benefit score
of the remaining alternatives. Alternative 3 has both a lower benefit and higher cost than Alternative 2;
therefore, it is removed from further consideration due to the disproportionate cost of this alternative to its
incremental benefits and is considered impracticable.
Alternative 1 has an 11 percent lower overall benefits ranking than Alternative 2 (7.1 compared to
8.0); however, costs about 70 percent ($900,000) less. This results in a correspondingly higher
benefit/cost ratio (7.1 compared to 2.5), based on the benefit divided by the cost adjusted using the
400,000 scaling factor [i.e., Benefit/Cost Alternative 1 = (7.1/400,000)*400,000 = 7.1]. Because the
incremental increase in cost of Alternative 2 compared to Alternative 1 is large, and the incremental
increase in benefit is small, the incremental cost of Alternative 2 is considered substantial and
disproportionate to its incremental benefits. This substantial increase in the benefit to cost ratio of
Alternative 1 compared to Alternative 2 (as well as Alternatives 3 and 4) is illustrated in Figure 10-1. As
a result, Alternative 1 is the alternative considered permanent to the maximum extent practicable for the
Site.

Figure
10-1 Disproportionate Cost Analysis
Relative Cost/Benefit Ratio
5/15/14 Y:\094\048.012\R\RIFS\Figures\Section 10.0\Fig10-1_DCA.docx
Sauro’s Property RI/FS Tacoma, Washington
7.1
8.0
7.5
8.3
$400
$1,300
$2,300
$5,200
7.1
2.5
1.3
0.6
$0
$1,000
$2,000
$3,000
$4,000
$5,000
$6,000
0
1
2
3
4
5
6
7
8
9
1 2 3 4
Prob
able
Cos
t (Th
ousa
nd $
)
Rela
tive
Bene
fit R
anki
ng
Remedial Alternative
Benefit
Cost
Relative Benefit/Cost

TABLE 10-1SUMMARY OF MODEL TOXICS CONTROL ACT ALTERNATIVES EVALUATION AND
DISPROPORTIONATE COST ALTERNATIVES RANKINGSAURO'S PROPERTY RI/FS
TACOMA, WASHINGTON
Table 10-1Page 1 of 1
5/14/2014Y:\094\048.012\R\RIFS\Tables\Section 10.0\Table 10-1_DCA Summary LANDAU ASSOCIATES
Alternative Number
Alternative Name
Alternative Description
Individual Ranking Criteria
1 Meets Remedial Action Objectives Yes Yes Yes Yes
2 Compliance With MTCA Threshold Criteria [WAC 173-340-360(2)(a)]
-Protect human health and the environment Yes Yes Yes Yes-Comply with cleanup standards Yes Yes Yes Yes-Comply with applicable state/federal laws Yes Yes Yes Yes-Provide for compliance monitoring Yes Yes Yes Yes
3 Restoration Time Frame 30 years Approximately 5 years 2-3 years 1 year [WAC 173-340-360(2)(b)(ii) and WAC 173-340-360(4)]
-Potential risk to human health and environment Low Low Low Low-Practicability of achieving shorter restoration time See DCA below See DCA below See DCA below See DCA below-Current use of site, surrounding area, and resources Commercial - Unrestricted Land Use Commercial - Unrestricted Land Use Commercial - Unrestricted Land Use Commercial - Unrestricted Land Use -Future use of site, surrounding area, and resources Commercial - Unrestricted Land Use Commercial - Unrestricted Land Use Commercial - Unrestricted Land Use Commercial - Unrestricted Land Use -Availability of alternative water supplies Yes Yes Yes Yes-Likely effectiveness/reliability of institutional controls High Not Applicable Not Applicable Not Applicable-Ability to monitor migration of hazardous substances High High High High-Toxicity of hazardous substances at the site Moderate to High Moderate to High Moderate to High Moderate to High-Natural processes that reduce concentrations Yes Yes Yes Yes-Overall Reasonable Restoration Time Frame Yes Yes Yes Yes
Comparative Overall Benefit Comparative Benefit Rating
Sco
re
Wei
ghtin
g Fa
ctor
Wei
ghte
d S
core
Comparative Benefit Rating
Sco
re
Wei
ghtin
g Fa
ctor
Wei
ghte
d S
core
Comparative Benefit Rating
Sco
re
Wei
ghtin
g Fa
ctor
Wei
ghte
d S
core
Comparative Benefit Rating
Sco
re
Wei
ghtin
g Fa
ctor
Wei
ghte
d S
core
-Overall Protectiveness Medium 6 0.3 1.8 Medium High 8 0.3 2.4 Medium High 8 0.3 2.4 High 9 0.3 2.7-Permanence Medium 6 0.2 1.2 Medium High 8 0.2 1.6 Medium High 8 0.2 1.6 High 9 0.2 1.8-Long Term Effectiveness Medium 6 0.2 1.2 Medium High 8 0.2 1.6 Medium High 7 0.2 1.4 High 9 0.2 1.8-Manageability of Short Term Risk High 10 0.1 1 Medium High 8 0.1 0.8 Medium 6 0.1 0.6 Medium 6 0.1 0.6-Implementability High 9 0.1 0.9 Medium 6 0.1 0.6 Medium 5 0.1 0.5 Medium Low 4 0.1 0.4-Consideration of Public Concerns High 10 0.1 1 High 10 0.1 1 High 10 0.1 1 High 10 0.1 1
Overall Weighted Benefit Score 7.1 8.0 7.5 8.3
5 Disproportionate Cost AnalysisOverall Weighted Benefit ScoreEstimated Remedy Cost (including interim action)Most Permanent SolutionLowest Cost AlternativeRelative Benefit/Cost Ratio*
Costs Disproportionate to Incremental BenefitsRemedy Permanent to the Maximum Extent Practicable?
Preferred Alternative
*Benefit/Cost Ratio scaled by $400,000 in order to compare ranges similar in scale to comparative overall benefit, as presented on Figure 10-1.
Electrical Resistance Heating (ERH)
Alternative 1 Alternative 4Alternative 3Alternative 2
In Situ Chemical Oxidation (ISCO)Monitored Natural Attenuation (MNA) w/Institutional Controls
Enhanced In Situ Bioremediation (EISB)
4 Relative Benefits Ranking for DCA [WAC 173-340-360(2)(b)(i) and WAC 173-340-36093)(f)]
-92% -75% -56%
No No
7.1 2.5 1.3
Incremental Increase/Decrease in Relative Benefit to Next Most Expensive Alternative -11% 7% -10%
7.1 8.0 7.5 8.3$400,000 $1,300,000 $2,300,000 $5,200,000
YesYes No No NoNo
0.6Incremental Increase/Decrease in Relative Benefit to Most Permanent Alternative -14% -4% -10% 0%
11%
Incremental Increase/Decrease in Cost Compared to Most Permanent Alternative
Incremental Increase/Decrease in Cost Compared to Next Most Expensive Alternative -69% -43% -56% 0%
0%
Yes No No No
No Yes Yes YesYes No No No

8/29/14 Y:\094\048.012\R\RIFS\RI-FS__FINAL.docx LANDAU ASSOCIATES 11-1
11.0 SUMMARY AND CONCLUSIONS OF FEASIBILITY STUDY
The RI defined physical characteristics, source areas, the nature and extent of impacted media, and
the migration pathways and potential receptors for contaminants. Data from the RI and previous
investigations were used in the FS process to develop and evaluate remedial alternatives for the Site.
The FS developed remedial alternatives for the Site for cleanup of contaminated media defined in
the RI, evaluated the alternatives against criteria defined by MTCA, provided a comparative analysis of
the alternatives to determine the relative environmental benefits of each, and compared the relative
benefits of each against their costs to determine the alternative that uses permanent solutions to the
maximum extent practicable.
11.1 PREFERRED ALTERNATIVE The preferred alternative for the Site addresses Site COCs in a reasonable restoration timeframe,
meets MTCA threshold criteria, meets RAOs, is protective of human health and the environment, and is
permanent to the maximum extent practicable. The preferred alternative is Alternative 1 – MNA and
Institutional Controls, and was selected based on the DCA presented in Section 10.2.3.
MNA includes monitoring groundwater contaminant concentrations and natural attenuation
parameters from Site monitoring wells per the recommended MNA performance monitoring schedule in
Ecology guidance (Ecology 2005). Selected wells will be monitoring on the following schedule:
• 1st year: quarterly
• 2nd and 3rd years: semi-annually
• Subsequent years (assume years 4 – 30): annually.
Institutional controls will be established that restrict intrusive activities on City-owned property
or ROWs and require that proper safety measures and soil management practices be implemented as part
of any project involving disturbance of soils at the Site (in accordance with WAC 173-340-440). The
institutional controls would be conveyed as a restrictive covenant on the City property deed(s) and would
be recorded on the deed registered with Pierce County/City of Tacoma. This covenant would be binding
on the owner’s successors and assignees. In addition, the City maintains an ordinance that requires
businesses and residences within city limits to be connected to the municipal water supply (Section
7.2.2.2).
Additionally, documented administrative procedures will be established so that redevelopment on
private property where subsurface contamination is still present would be conducted cooperatively with
the City and performed in such a manner that the City could address any necessary environmental

8/29/14 Y:\094\048.012\R\RIFS\RI-FS__FINAL.docx LANDAU ASSOCIATES 11-2
monitoring of dewatering or excavation that could generate contaminated waste and ensure that worker
health and safety was adequately protected.
11.2 IMPLEMENTATION OF SITE CLEANUP After considering public comment, the RI/FS will be finalized and a cleanup action alternative for
the Site will be selected by Ecology. The selected cleanup action will be presented in the Site CAP,
which will be an exhibit to the AO. The Site CAP will describe the cleanup action and specify cleanup
standards and compliance monitoring requirements. Following public review of the AO and CAP, the
cleanup will progress in a series of implementation phases, including engineering and design (negligible
for this cleanup), implementation of institutional controls, and performance and compliance monitoring.
Long term performance/compliance monitoring is the primary activity related to this cleanup action.
Monitoring of potential property sale/acquisition and redevelopment activities at private property within
the Site boundaries and enforcement of institutional controls and restrictive covenants will also be a
critical element for success of this cleanup action.
8/29/14 Y:\094\048.012\R\RIFS\RI-FS__FINAL.docx LANDAU ASSOCIATES 12-1
12.0 USE OF THIS REPORT
This remedial investigation/feasibility study report has been prepared for the exclusive use of the
City of Tacoma for specific application to the former Sauro’s Cleanerama Site. No other party is entitled
to rely on the information, conclusions, and recommendations included in this document without the
express written consent of Landau Associates. Further, the reuse of information, conclusions, and
recommendations provided herein for extensions of the project or for any other project, without review
and authorization by Landau Associates, shall be at the user’s sole risk. Landau Associates warrants that
within the limitations of scope, schedule, and budget, our services have been provided in a manner
consistent with that level of care and skill ordinarily exercised by members of the profession currently
practicing in the same locality under similar conditions as this project. We make no other warranty, either
express or implied.
This document has been prepared under the supervision and direction of the following
environmental key staff.
LANDAU ASSOCIATES, INC. Rachel M. Morgan, E.I.T. Senior Staff Engineer Piper M. Roelen, P.E. Senior Associate Engineer Eric F. Weber, L.Hg., CWRE Principal RRM/LKK/PMR/EFW/jrc

8/29/14 Y:\094\048.012\R\RIFS\RI-FS__FINAL.docx LANDAU ASSOCIATES 13-1
13.0 REFERENCES
Adamson, D.T. and C.J. Newell. 2009. “Support of Source Zone Bioremediation through Endogenous Biomass Decay and Electron Donor Recycling.” Bioremediation Journal. 13(1): 29-40. Artifacts Consulting, Inc. 1999. Phase I Environmental Site Assessment, 1409 Pacific Avenue Project, Tacoma, Pierce County, Washington. December 23. Battelle. 2001. Final: Air Sparging Guidance Document. Naval Facilities Engineering Service Center Technical Report TR-2193-ENV. August 31. Beyke, G. 2006. Greg Beyke, Thermal Remediation Services. Personal communication with C. Jacob, Landau Associates. Re: ERH costs for volatilization vs. hydrolysis. September 14-18. Beyke, G. and D. Fleming. 2005. “In situ Thermal Remediation of DNAPL and LNAPL Using Electrical Resistance Heating.” Remediation. 15 (3): 5-22. Coleman, M. 2014a. Email message from Marv Coleman, Toxics Cleanup Program, Washington State Department of Ecology, to Lauren McIntire, Landau Associates. Re: Fw: Dock St. Reports. (Attachments: Work plan, regulatory correspondence, and analytical data from City of Tacoma.) February 6. Coleman, M. 2014b. Email message from Marv Coleman, Toxics Cleanup Program, Washington State Department of Ecology, to Lauren McIntire, Landau Associates. Re: LAI MW4 – Sauro’s. (Attachments: documentation pertaining to removal of an underground storage tank at Dock Street and South 15th Street.) January 31. Coleman, M. 2009. Email message from Marv Coleman, Toxics Cleanup Program, Washington State Department of Ecology, to Jennifer Wynkoop, Landau Associates. Re: FW: OU69 sauro water vocs. April 29. City of Tacoma website. 2014. City of Tacoma goveME.org. http://www.govme.org/ Common/gMap/MGMain.aspx. Accessed January 23. Doherty, R. E. 2000a. “A History of the Production and Use of Carbon Tetrachloride, Tetrachloroethylene, Trichloroethylene, and 1,1,1-Trochloroethane in the United States: Part I – Historical Background; Carbon Tetrachloride and Tetrachloroethylene.” Journal of Environmental Forensics 1(2): 69-81. Doherty, R. E. 2000b. “A History of the Production and Use of Carbon Tetrachloride, Tetrachloroethylene, Trichloroethylene, and 1,1,1-Trochloroethane in the United States: Part II – Trichloroethylene and 1,1,1-Trichloroethane.” Journal of Environmental Forensics 1(2): 83-93. Ecology website. 2014a. Toxics Cleanup Program Web Reporting. https://fortress.wa.gov/ ecy/tcpwebreporting/report.aspx. Washington State Department of Ecology. Accessed April 25. Ecology website. 2014b. Cleanup Levels and Risk Calculations. https://fortress.wa.gov/ecy/ clarc/CLARCHome.aspx. January 25.

8/29/14 Y:\094\048.012\R\RIFS\RI-FS__FINAL.docx LANDAU ASSOCIATES 13-2
Ecology website. 2014c. Washington State Well Log Viewer. https://fortress.wa.gov/ecy/ waterresources/map/WCLSWebMap/default.aspx. Washington State Department of Ecology. Accessed February 25. Ecology. 2010. Updating Infoor Air Screening Levels in Appendix B of the CVapor Intrusion Guidance Document. Washington State Department of Ecology. May 13. Available at: http://www.ecy.wa.gov/programs/tcp/policies/VaporIntrusion/VIG_WorkGroup/mtg_100513/updatingIndoorAirScreenin%20Levels.pdf. Ecology. 2009a. Letter: Contained-In Determination For Soils Contaminated With F002-Listed Dangerous Waste Constituents At Sauro's Cleanerama, 1401 Pacific Avenue, Tacoma, Washington, TCP Site ID 4339824, EPA ID No. WAD027550722. From Ava Edmonson, Washington State Department of Ecology, to Calvin Taylor, City of Tacoma. August 20. Ecology. 2009b. Guidance for Evaluating Soil Vapor Intrusion in Washington State: Investigation and Remedial Action. Washington State Department of Ecology Toxics Cleanup Program. Publication no. 09-09-047. October. Available at: http://www.ecy.wa.gov/programs/tcp/policies/pol_main.html. Ecology. 2009c. Letter: Soil Vapor Intrusion Associated with Sauro’s Cleanerama. From Marv Coleman, Washington State Department of Ecology, to Jennifer Wynkoop, Landau Associates. August 28. Ecology website. 2005. Guidance on Remediation of Petroleum-Contaminated Ground Water By Natural Attenuation. Washington State Department of Ecology. Publication No. 05-09-091 (Version 1.0). July. Available at: https://fortress.wa.gov/ecy/publications/ publications/0509091.pdf. Accessed January 2014. Ecology. 1994. Natural Background Soil Metals Concentrations in Washington State. Washington State Department of Ecology, Publication No. 94-115. October. Available at: https://fortress.wa. gov/ecy/publications/summarypages/94115.html. Accessed May 21, 2014. DOE. 2002. Innovative Technology Summary Report: In-Well Vapor Stripping Technology. DOE/EM-0626. Prepared for U.S. Department of Energy. March. Environmental Associates. 2001. Report: Supplemental Site Exploration, TRC Building, 1423 Pacific Avenue, Tacoma, Washington. October 16. EPA. 1998 . Technical Protocol for Natural Attenuation of Chlorinated Solvents in Groundwater. U.S. Environmental Protection Agency, Office of Research and Development. EPA/600/R-98/128. September. Farallon Consulting, Inc. 2008. Letter Report: Additional Characterization and Pilot Feasibility Testing, Former Sauro’s Cleanerama Site, Tacoma, Washington. From Jeffrey Kaspar, Senior Project Manager, and Clifford Schmitt, Principal, Farallon Consulting, LLC, to Marv Coleman, Washington State Department of Ecology. January 11. Farallon Consulting, Inc. 2005. Draft Technical Memorandum: Summary of Additional Subsurface Investigation, Former Sauro’s Cleanerama, Tacoma, Washington. From Lauren G. Carroll, L.G., L.H. G. and Clifford Schmitt, L.G., L.H.G., Farallon Consulting LLC, to Betty Schindele. August 25. GeoEngineers, Inc. 2003. Draft Report: Subsurface Environmental Assessment, Sauro’s Cleanerama, 1401 Pacific Avenue, Tacoma, Washington. November 11.

8/29/14 Y:\094\048.012\R\RIFS\RI-FS__FINAL.docx LANDAU ASSOCIATES 13-3
GeoEngineers, Inc. 2001. Report: Subsurface Environmental Assessment, Sauro’s Cleanerama, 1401 Pacific Avenue, Tacoma, Washington. March 21. GeoEngineers, Inc. 2000. Report: Subsurface Environmental Assessment, Sauro’s Cleanerama, 1401 Pacific Avenue, Tacoma, Washington. October 27. Hart Crowser 2005. Draft Site-Specific Cleanup Action Plan (SCAP) Dock Street North Right of Way (ROW), Thea Foss Upland Properties, Consent Decree 94-109176. Prepared for the City of Tacoma Public Work Engineering. June 15. ITRC. 2005. Technical and Regulatory Guidance for In situ Chemical Oxidation of Contaminated Soil and Groundwater. Interstate Technology & Regulatory Council. January. ITRC. 2008. Technical/Regulatory Guidance: In situ Bioremediation of Chlorinated Ethene: DNAPL Source Zones. Interstate Technology & Regulatory Council Bioremediaion of DNAPLs Team. June. Jeffers, P.M., L.M. Ward, L.M. Woytowitch, and N.L. Wolfe. 1989. Homogeneous Hydrolysis Rate Constant for Selected Chlorinated Methanes, Ethanes, Ethenes, and Propanes. Environmental Science and Technology. 23: 965-969. Kennedy/Jenks Consultants. 1992. Report: Preliminary Environmental Assessment, Sauro’s Cleanerama, Tacoma, Washington. October 27. Langseth Environmental Services, Inc. 1993. Site Characterization and Final Lust Report, HR&H Properties, 1423 Pacific Ave., Tacoma, WA. December 2. Landau Associates. 2014. Technical Memorandum: Status Report No. 5, Former Sauro’s Cleanerama Site, Site ID 4339824. Prepared for Washington State Department of Ecology on behalf of the City of Tacoma. January 15. Landau Associates. 2013a. Letter: Data Gap Groundwater Characterization Along Dock Street Work Plan, Sauro’s Cleanerama Site, Site ID 4339824. From Lauren Knickrehm and Eric Weber, Landau Associates, to Marv Coleman, Washington State Department of Ecology. July 26. Landau Associates. 2013b. Technical Memorandum: Status Report No. 4, Former Sauro’s Cleanerama Site, Site ID 4339824. Prepared for Washington State Department of Ecology on behalf of the City of Tacoma. October 3. Landau Associates. 2012a. Letter: Remedial Investigation/Feasibility Study Schedule Status and Extension Request, Former Sauro’s Cleanerama Site, Tacoma, Washington, Site ID:4339824. From Lauren Knickrehm, Landau Associates, to Marv Coleman, Toxics Cleanup Program, Washington State Department of Ecology. December 14. Landau Associates. 2012b. Technical Memorandum: Monitored Natural Attenuation Remedy Evaluation Sampling Work Plan, Sauro’s Cleanarama Site, Site ID 4339824. From Lauren McIntire and Piper Roelen, Landau Associates, on behalf of Calvin Taylor, City of Tacoma, to Marv Coleman, Washington State Department of Ecology. September 6. Landau Associates. 2010a. Letter: Sauro’s Parking Lot, 1401 Pacific Avenue, Tacoma, Washington. From Brian Bennetts and Edward Heavey, Landau Associates, to Chris Storey, City of Tacoma. December 21.

8/29/14 Y:\094\048.012\R\RIFS\RI-FS__FINAL.docx LANDAU ASSOCIATES 13-4
Landau Associates. 2010b. Construction Summary Report, 1401, 1407 & 1409, Pacific Avenue, Sauro’s Property, Tacoma, Washington. Prepared for the City of Tacoma. February 3. Landau Associates. 2009a. Interim Cleanup Action Work Plan, 1401, 1407 & 1409, Pacific Avenue, Sauro’s Property, Tacoma, Washington. May 18. Landau Associates. 2009b. Letter: Request For Contained-In Determination Sauro’s Cleanerama Site (Site ID 4339824). From Jennifer Wynkoop, Landau Associates, to Ms. Seiler and Ms. Peterson, Washington State Department of Ecology. July 28. Landau Associates. 2009c. Draft: Remedial Investigation Work Plan, Sauro’s Property, 1401 Pacific Avenue, Tacoma, Washington. February 23. Landau Associates. 2009d. Letter: Remedial Investigation Work Plan Addendum, Sauro Site. From Jennifer Wynkoop and Eric Weber, Landau Associates, to Calvin Taylor, City of Tacoma. March 26. Landau Associates. 2009e. Technical Memorandum: Soil Vapor Intrusion Evaluation of Neighboring Properties, Sauro’s Cleanerama. From Jennifer Wynkoop, Landau Associates, to Marv Coleman, Washington State Department of Ecology. August 19. Landau Associates. 2008a. Report: Phase I ESA, Sauro Property–1401, 1407 & 1409, Pacific Avenue, Tacoma, Washington. June 26. Landau Associates. 2008b. Report: Phase 2 Investigation Report, Sauro Property – 1401, 1407 & 1409 Pacific Avenue, Tacoma, Washington. Prepared for the City of Tacoma. June 17. Landau Associates. 2008c. Report: Phase I ESA, Diamond Property, 1412 A Street & 110 South 14th Street, Pacific Avenue, Tacoma, Washington. Prepared for the City of Tacoma. June 26. Landau Associates. 2008d. Report: Phase I ESA, USPS Property – 1310 & 1320 A Street, Tacoma, Washington. Prepared for the City of Tacoma. June 27. Landau Associates. 2008e. Report: Phase I ESA, Budget Property – NE of the Intersection of South 14th Street & Pacific Avenue, Tacoma, Washington. Prepared for the City of Tacoma. June 27. Miller, R.R. and D.S., Roote. 1997. In-well Vapor Stripping. Technology Overview Report TO-97-01. Prepared for Groundwater Remediation Technologies Analysis Center. February. Available at: http://www.epa.gov/tio/download/remed/inwellvp.pdf. Pankow, J. F. and Cherry, J. A. 1996. Dense Chlorinated Solvents and Other DNAPLs in Groundwater. Waterloo Press, Portland, Oregon. Parametrix. 2008. Letter: Summary of Results, Phase I Environmental Site Assessment, U.S. Postal Service Property, Intersection of 14th and A Streets, Parcels 2013020011 and 2013020020, Pierce County, Tacoma, Washington. From Michael R. Warfel, Parametrix, to Mr. John Barline, Williams Kastner. March 17. Parsons. 2004. Principles and Practices of Enhanced Anaerobic Bioremediation of Chlorinated Solvents. Prepared for Air Force Center of Environmental Excellence, Naval Facilities Engineering Service Center, and Environmental Security Technology Certification Program. August.

8/29/14 Y:\094\048.012\R\RIFS\RI-FS__FINAL.docx LANDAU ASSOCIATES 13-5
Pierce County website. 2014. Assessor-Treasurer website. http://epip.co.pierce.wa.us/cfapps /atr/epip/summary.cfm?parcel=2014030010. Accessed January 23. Puls, R.W. and M. J. Barcelona, 1996. Low-Flow (Minimal Drawdown) Ground-Water Sampling Procedures. EPA/540/S-95/504. April. Available at: http://nepis.epa.gov/Adobe/PDF/2000G23N.pdf. RNS. 2006. Report: Additional Groundwater Characterization, Former Sauro’s Cleanerama Site, Tacoma, Washington. Robinson, Noble, & Saltbush, Inc. August. Saltbush Environmental Services, Inc. 2000. Report: Phase II Environmental Assessment (Limited Soil Sampling and Testing), The 1409 Pacific Avenue Project, Tacoma, Pierce County, Washington. April 25. Simon, M. 1996. “Air Lift/Air Stripping Combine to Clean Aquifers.” pg. 1. In: Ground Water Currents. U.S. Environmental Protection Agency. EPA-542-N-96-001. Issue No. 14. January. Available at: http://www.epa.gov/tio/download/newsltrs/gwc0196.pdf. Sleep, B.E, A.J. Brown, and B.S. Lollar. Long-term tetrachloroethene degradation sustained by endogenous cell decay. Journal of Environmental Engineering and Science. 4: 11-17. TRS website. 2014. http://www.thermalrs.com/technology/faq.php#F17. TRS Group, Inc. Accessed March 13. USACE. 2007. In situ Thermal Remediation (Electrical Resistance Heating), East Gate Disposal Yard, Ft. Lewis, Washington. Cost and Performance Report. U.S. Army Corps of Engineers. August 17. Available at: http://www.thermalrs.com/technology/whitePapers/TAC02%20CP%20Report.pdf. USGS. 1976. Geological Map of Western Whatcom County, Washington. Folio of Whatcom County, Washington. Map I-854-B. Geology by D.J. Easterbrook, Western Washington State College, Bellingham, Washington. Department of the Interior, U.S. Geological Survey, Branch of Distribution, Denver, CO.