religare health trust - listed...
TRANSCRIPT

Religare Health Trust STRICTLY PRIVATE AND CONFIDENTIAL

This presentation is focused on comparing actual results from the period from 1 October 2013 to 31 December 2013 (“3Q
FY 2014”) versus the projected figures for the financial year 2014. No other comparative figures will be presented as the
acquisition of the Portfolio of RHT as well as listing on the Singapore Stock Exchange was completed on 19 October 2012.
This presentation may contain forward-looking statements that involve risks and uncertainties. Actual future performance,
outcomes and results may differ materially from those expressed in forward-looking statements as a result of a number of
risks, uncertainties and assumptions. Representative examples of these factors include (without limitation) general industry
and economic conditions, interest rate trends, cost of capital and capital availability, competition from other developments or
companies, shifts in expected levels of income and occupancy rate, changes in operating expenses (including employee
wages, benefits and training), governmental and public policy changes and the continued availability of financing in the
amounts and the terms necessary to support future business. Investors are cautioned not to place undue reliance on these
forward-looking statements.
The Indian Rupee and Singapore Dollar are defined herein as “INR” and “S$” respectively. Any discrepancy between
individual amounts and total shown in this presentation is due to rounding. Unless otherwise stated, all Indian Rupee
amounts in this set of slides have been translated into Singapore dollars based on the fixed exchange rate of ₹49.62 =
S$1.00.
Disclaimer

Agenda
3Q FY 2014 Key Highlights & Financial Review
Portfolio Highlights
Acquisition of Mohali Clinical Establishment
Growth Strategy
Peer Analysis

Religare Health Trust
Issuer Religare Health Trust (“RHT”)
Sponsor Fortis Healthcare Ltd (“Fortis” or the “Sponsor”)
Trustee-Manager Religare Health Trust Trustee Manager Pte Ltd (“TM”)
Sponsor Stake 28.0% Sponsor stake (220.7 m units) Lock-up of 6 months (100%) and further 6 months (50%) from 19 October 2012
Funds Raised at IPO S$510 mil 567.5 m units (72.0% of total units)
Distribution Yield based on unit price of S$0.775 (1) 10.5% (Projection Year 2014)
Listing Exchange Mainboard of SGX-ST
Notes:(1) Projected yields excludes distributions to Sponsor, which has committed to waiving rights to distribution until Mar 31, 2014 in favor of holders of Common Units. Based on
unit price of S$ 0.775 as at 31 December 2013
Listed on 19 October 2012
4
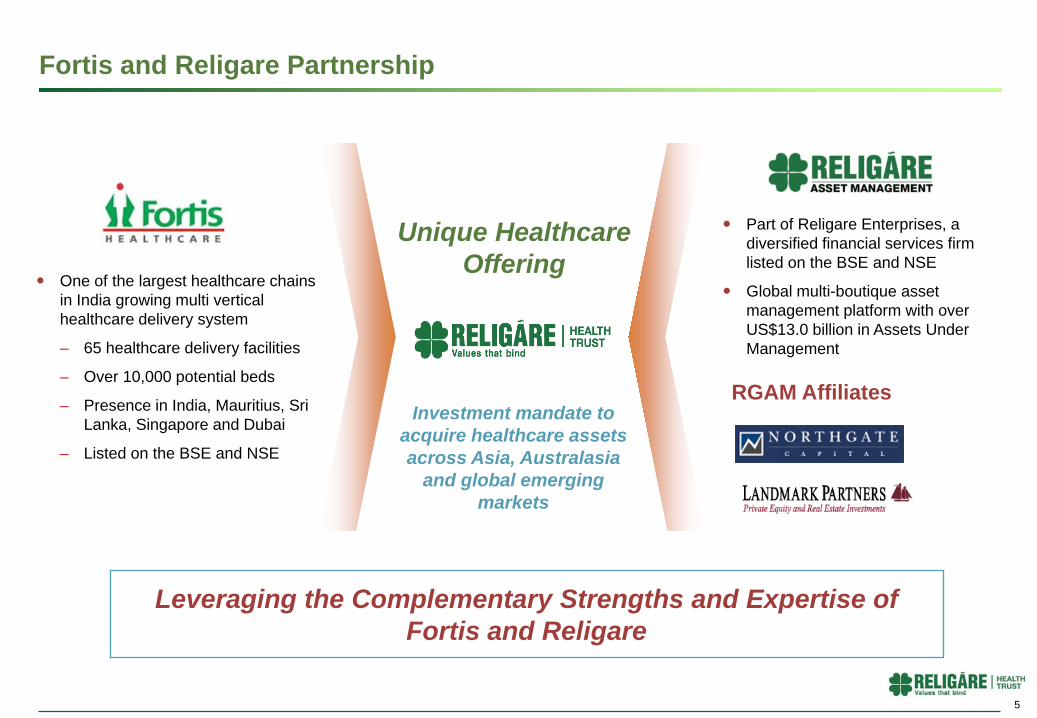
Fortis and Religare Partnership
One of the largest healthcare chains in India growing multi vertical healthcare delivery system
– 65 healthcare delivery facilities
– Over 10,000 potential beds
– Presence in India, Mauritius, Sri Lanka, Singapore and Dubai
– Listed on the BSE and NSE
Part of Religare Enterprises, a diversified financial services firm listed on the BSE and NSE
Global multi-boutique asset management platform with over US$13.0 billion in Assets Under Management
RGAM AffiliatesInvestment mandate to
acquire healthcare assets across Asia, Australasia
and global emerging markets
Leveraging the Complementary Strengths and Expertise of Fortis and Religare
Unique Healthcare Offering
5

Fortis – An Overview
– Amongst the largest healthcare service providers in India with ~4,100(1) operational beds across 62 healthcare
facilities and total potential bed capacity of over 9,500(2) beds
– Leader in the organized diagnostics segment with 12 Reference Labs, over 245 network laboratories and a
footprint spanning over 5000 Collection points across 450 cities in India.
– Amongst the largest private diagnostic and imaging companies in Singapore
– A state of the art Greenfield specialty hospital for colorectal treatment in Singapore
International Business
6

Fortis – Specialty Revenue Split & Procedure Volume for FY 2013
Source: Fortis Healthcare website, results presentation slides
7

Overview of Religare Health Trust
Notes:(1) Independently valued by DTZ in INR as at March 31, 2013 based on S$1 = INR 43.75. Valuation of operating assets based on DCF and Hospital and
Medical Services Agreements (“HMSAs”) as relevant; valuation of greenfield assets based on Market Value.
Fortis Healthcare (“Sponsor”)
Institutional & Public Investors
Trustee-Manager
Current Portfolio
S$773m total valuation (1)
• 11 Clinical Establishments• 4 Greenfield Clinical
Establishments• 2 hospitals managed and
operated by RHT
Fortis Operating
Companies
28.0% 72.0%
OwnershipDistributions
Service Fee
Clinical Establishment
Services
TM Fees
Acts on behalf of unitholders and
provides management
services
HMSA Overview
15 year Hospital and Medical Services Agreements (“HMSA”) with Fortis over the Initial Portfolio, with extension of further 15 years on mutual agreement
Service Fee
Base Service Fee Fixed quarterly payments with 3%
escalation per annum Upward revision for any capex/
expansion
Variable Service Fee 7.5% of the Fortis Operating
Companies’ Operating Revenue for each quarter
Sponsor ROFR
Right of First Refusal (“ROFR”) over Sponsor’s medical and healthcare infrastructure located in Asia, Australasia and emerging markets in the rest of the world
RHT Structure
Singapore
India
8

Dr Virender SobtiChief Operating Officer
India
Experienced Board and Management Team Majority independent directors with proven track record in healthcare and funds management
Executive Directors / Management Religare Health Trust
Gurpreet Singh DhillonExecutive Director & CEO
Eng Meng LeongIndependent Director
Michael Hwang S.CIndependent Director
Peter Joseph Seymour RoweAudit & Risk Committee Chairman
Independent Director
Pawanpreet SinghExecutive Director & CFO
Tan Suan HuiHead of Compliance / IR
Dr. Yogendra Nath MathurLead Independent Director
Ravi MehrotraExecutive Chairman
9
Naveen BhatiaHead, Finance & Accounts
India
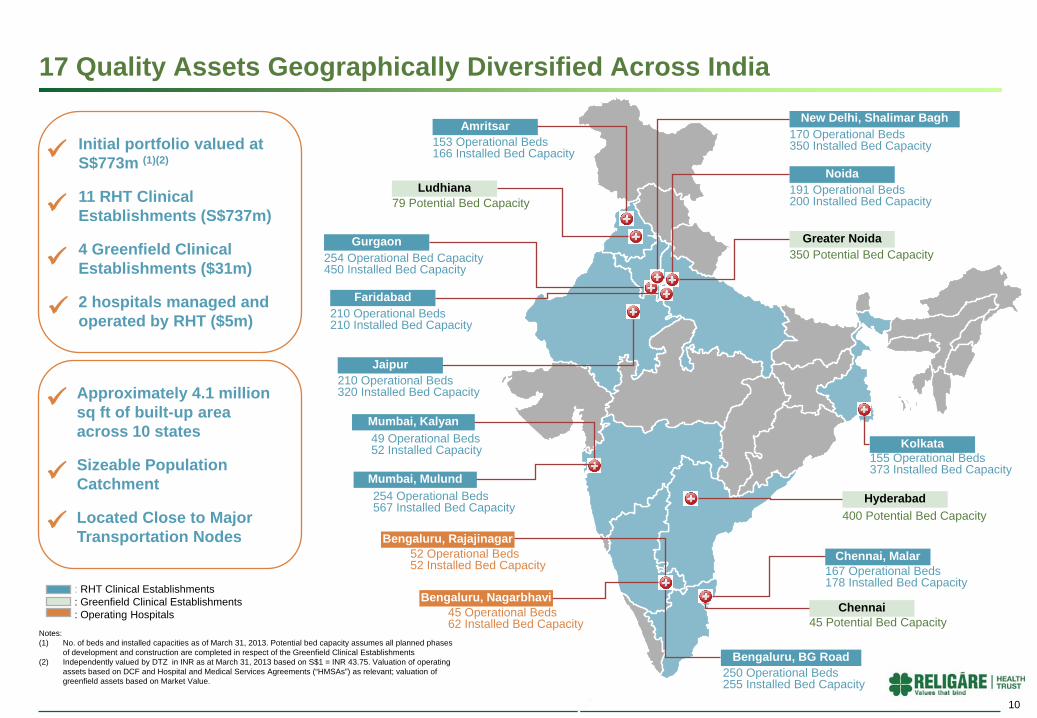
17 Quality Assets Geographically Diversified Across India
: RHT Clinical Establishments: Greenfield Clinical Establishments: Operating Hospitals
Notes:(1) No. of beds and installed capacities as of March 31, 2013. Potential bed capacity assumes all planned phases
of development and construction are completed in respect of the Greenfield Clinical Establishments (2) Independently valued by DTZ in INR as at March 31, 2013 based on S$1 = INR 43.75. Valuation of operating
assets based on DCF and Hospital and Medical Services Agreements (“HMSAs”) as relevant; valuation of greenfield assets based on Market Value.
Initial portfolio valued at S$773m (1)(2)
11 RHT Clinical Establishments (S$737m)
4 Greenfield Clinical Establishments ($31m)
2 hospitals managed and operated by RHT ($5m)
Approximately 4.1 million sq ft of built-up areaacross 10 states
Sizeable Population Catchment
Located Close to Major Transportation Nodes
400 Potential Bed Capacity
Amritsar
Ludhiana
153 Operational Beds166 Installed Bed Capacity
79 Potential Bed Capacity
Faridabad
Gurgaon
Jaipur210 Operational Beds320 Installed Bed Capacity
210 Operational Beds210 Installed Bed Capacity
254 Operational Bed Capacity450 Installed Bed Capacity
Mumbai, Mulund
Mumbai, Kalyan
254 Operational Beds567 Installed Bed Capacity
49 Operational Beds52 Installed Capacity
250 Operational Beds255 Installed Bed Capacity
Bengaluru, BG Road
Bengaluru, Nagarbhavi45 Operational Beds62 Installed Bed Capacity
Bengaluru, Rajajinagar52 Operational Beds52 Installed Bed Capacity
Chennai, Malar
Chennai
167 Operational Beds178 Installed Bed Capacity
45 Potential Bed Capacity
Hyderabad
Noida
Kolkata
New Delhi, Shalimar Bagh
155 Operational Beds373 Installed Bed Capacity
191 Operational Beds200 Installed Bed Capacity
170 Operational Beds350 Installed Bed Capacity
Greater Noida350 Potential Bed Capacity
10

Financial Highlights
Distributable income 4.2% higher compared to the last quarter and 4.9% higher than projected
DPU of 2.14 cents translates to an annualised yield of 11.0%
Tighter cost controls helped improve the operating margin
Hedging helps provide stability to Distribution
Both Current Yield and P/B are based on unit price of S$0.775 as at 31 December 2013
Figures for Current Yield and Projected Yield based on a total number of Common Units of 570,341,000 and results for the quarter ended 31 December 2013
P/B is based on NAV per unit of S$0.80 as of 31 December 2013
11.0%
10.5%
Current Yield Projected Yield (FY 2014)
YieldCurrent Yield Projected Yield (FY 2014)
Current Yield
(annualised) 11.0%
Gearing ratio, 7.9.%
P/B, 0.96
RHT
11DPU of 2.14 cents as against 2.04 cents projected, translating to a 11.0% annualised yield as against 10.5% projected

Continued growth in DPU
2
2.06
2.14
FY14 1Q 2Q 3Q
3%3.9%
12
DPU (Singapore Cents)
0.8
11,35211,719
12,210
1Q FY14 2Q 3Q
Distributable Income (S$ '000)
3.2%
Distributions are paid on a semi-annual basis for the six-month periods ending 31 March and 30 September of each year.
4.2%

Review of FY14 Quarter Comparisons
Actual FY14 3Q ActualFY14 2Q
ProjectedFY14 3Q
Total Revenue (S$ ‘000) 26,862 26,505 27,363
Net Service and Hospital Income (S$ ‘000) 15,843 15,394 16,529
Distributable Income (S$ ‘000) 12,210 11,719 11,651
*Exchange rate for actual FY14 YTD was S$ 1 = ₹ 48.19, Exchange rate for actual FY13 YTD was S$1 = ₹ 47.79. Exchange rate for projected FY14 YTD was S$1 = ₹ 46.7
13
Actual FY14 YTD Actual FY13 YTD ProjectedFY14 YTD
Total Revenue (S$ ‘000) 81,339 21,932 82,089
Net Service and Hospital Income (S$ ‘000) 47,492 13,892 49,591
Distributable Income (S$ ‘000) 35,281 9,394 34,956
^Actual FY14 3Q against Projected FY14 3Q
*Actual FY14 YTD against Projected FY14 YTD
^Exchange rate for actual FY14 3Q was S$ 1 = ₹ 49.62, Exchange rate for actual FY14 2Q was S$1 = ₹ 49.69. Exchange rate for projected FY14 3Q was S$1 = ₹ 46.7
Actual FY14 3Q ActualFY14 2Q
Variance (%)
Total Revenue (S$ ‘000) 26,862 26,505 1.3
Net Service and Hospital Income (S$ ‘000) 15,843 15,394 2.9
Distributable Income (S$ ‘000) 12,210 11,719 4.2
Actual FY14 3Q against Actual FY14 2Q

FY 14 3QActual
FY14 3Q Projection Variance
S$'000 S$'000 S$'000
Service fee 23,816 25,569 (1,753) Hospital income 1,800 1,311 489 Other income 1,246 483 763 Total revenue 26,862 27,363 (501)
Total service fee and hospital expenses (11,019) (10,834) (185)
Finance income 195 5 190 Finance expenses (647) (566) (81) Trustee-Manager fee (1,310) (1,217) (93) Other trust expenses (252) (368) 116 Foreign exchange gain 2,007 - 2,007 Total expenses (11,026) (12,980) 1,954
Profit before changes in fair value of financial derivatives 15,836 14,383 1,453
Fair value loss on financial derivatives (3,262) - (3,262) Profit Before Taxes 12,574 14,383 (1,809)
Taxes (5,026) (3,216) (1,810) Net Profit 7,548 11,167 (3,619)
Variance from Forecast Statement
For the quarter ended 31 December 2013
14

FY 14 3QActual
FY 14 3QProjection Variance
S$'000 S$'000 S$'000Net profit for the period attributable to unitholders of the Trust 7,548 11,167 (3,619)
Distribution Adjustments:Impact of non-cash Straight Lining (2,888) (3,079) 191 Technology Renewal Fee (151) (164) 13 Depreciation and Amortisation 3,282 2,794 488 Amortisation of debt arrangement fee 196 158 38 Trustee-Manager Fees payable in Units 656 608 48 Foreign exchange differences 1,764 - 1,764 Deferred Tax 1,803 167 1,636 Total distributable income attributable to the unitholders of the Trust 12,210 11,651 559
Variance from Forecast Statement
15
For the quarter ended 31 December 2013
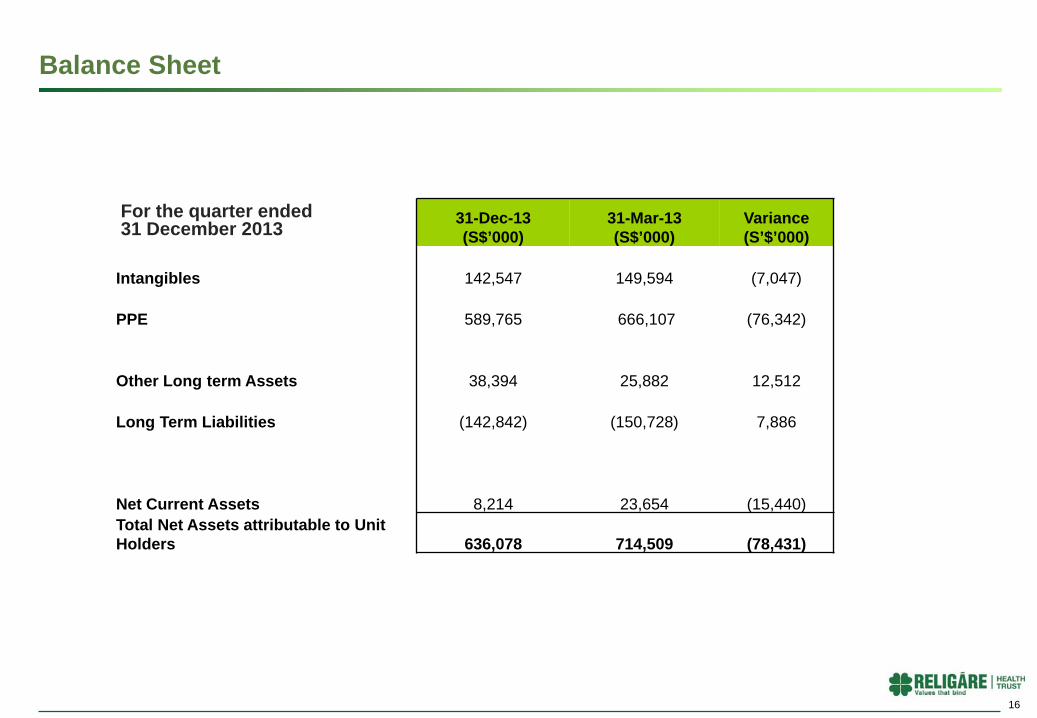
Balance Sheet
16
For the quarter ended 31 December 2013 31-Dec-13
(S$’000)31-Mar-13(S$’000)
Variance (S’$’000)
Intangibles 142,547 149,594 (7,047)
PPE 589,765 666,107 (76,342)
Other Long term Assets 38,394 25,882 12,512
Long Term Liabilities (142,842) (150,728) 7,886
Net Current Assets 8,214 23,654 (15,440)Total Net Assets attributable to Unit Holders 636,078 714,509 (78,431)

Portfolio
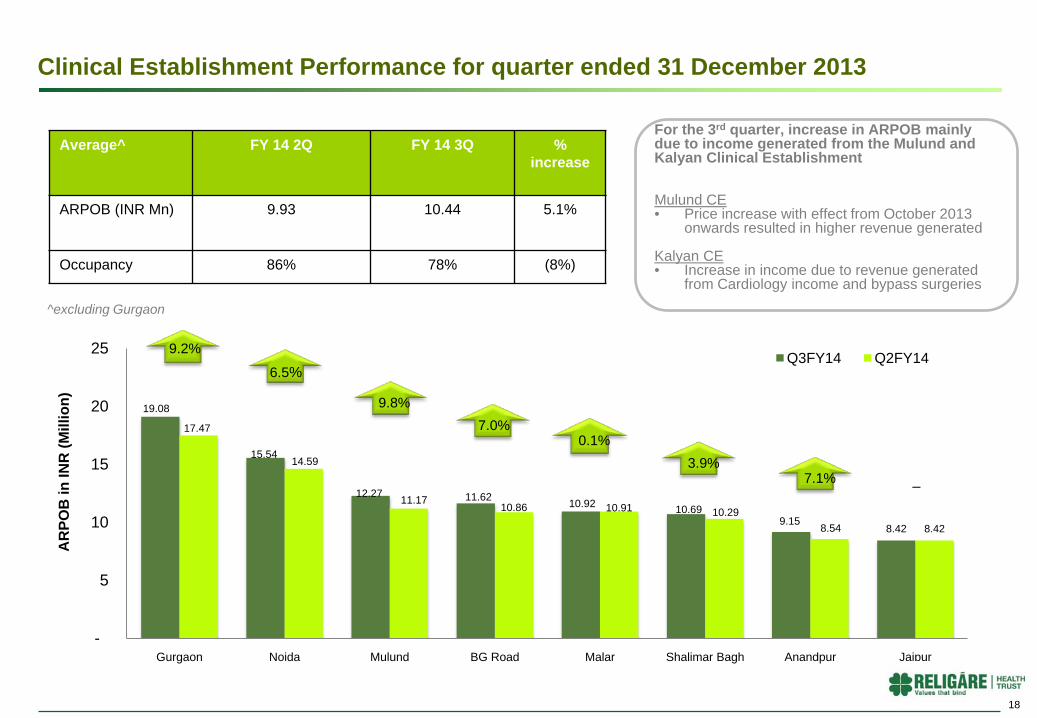
19.08
15.54
12.27 11.62 10.92 10.699.15
8.42
17.47
14.59
11.1710.86 10.91 10.29
8.54 8.42
-
5
10
15
20
25
Gurgaon Noida Mulund BG Road Malar Shalimar Bagh Anandpur Jaipur
AR
POB
in IN
R (M
illio
n)
Q3FY14 Q2FY149.2%
0.1%
6.5%
9.8%7.0%
3.9%7.1% –
Average^ FY 14 2Q FY 14 3Q % increase
ARPOB (INR Mn) 9.93 10.44 5.1%
Occupancy 86% 78% (8%)
^excluding Gurgaon
Clinical Establishment Performance for quarter ended 31 December 2013
18
For the 3rd quarter, increase in ARPOB mainly due to income generated from the Mulund and Kalyan Clinical Establishment
Mulund CE• Price increase with effect from October 2013
onwards resulted in higher revenue generated
Kalyan CE• Increase in income due to revenue generated
from Cardiology income and bypass surgeries

49%
79% 79%
83%
89%88%
84%
61%
254 254250
191210
170 155 167
450
567
255
200
320
350373
178
0
100
200
300
400
500
600
Gurgaon Mulund BG Road Noida Jaipur Shalimarbagh Anandpur Malar
Occupancy Operating Bed Capacity Installed Bed Capacity
Strong Portfolio Occupancy
Figures as of 31 December 2013
Occupancy for the period ended 31 December 201319

Current Portfolio for quarter ended 31 December 2013
20
Hospitals Operational Bed Capacity Installed Bed Capacity
Amritsar 153 166
Anandapur, Kolkata 155 373
BG Road, Bengaluru 250 255
Gurgaon 254 450
Faridabad 210 210
Jaipur 210 320
Kalyan, Mumbai 49 52
Malar, Chennai 167 178
Mulund, Mumbai 254 567
Nagarbhavi, Bengaluru 45 62
Noida 191 200
Rajajinagar, Bengaluru 52 52
Shalimar Bagh, New Delhi 170 350
Total 2,164 3,235

Development Project Status
Ground Breaking Ceremony held on 16 January 2014
21
Ludhiana BG Road
Estimated Time of Completion
2016 2016
No. of Beds Planned 79 200
Specialities Obstetrics & Gynaecology, IVF services, Cosmetology, Neonatology, Health Checks
Oncology, OT
Current Status Government approval process has been initiated and will take at least a month. Demolition work started on 6 January 2014 and will take 45 days to complete. Ground Breaking Ceremony was held on 16 January 2014
Revised layout designs see an increase of 200 in Bed Capacity. Government approvals will take at least 3 months for approval.

Hedging - Foreign currency exposure
Particulars Minimum Hedging (percentage to total exposure)
Semi-annual distributions 100% (on one year forward basis)
RHT has hedged the following foreign exchange exposures
Contracted rate SettlementINR 47.79 to SGD 1 15-May-14INR 53.36 to SGD 1 05-Dec-14
Forward contracts already entered
22

Ample Debt Headroom Post Acquisition
Gearing remains low with ample headroom for future growth opportunities
^Net of Cash (Based on audited financial statements of RHT Group as of 31 December 2013)
Actual^ (S$ millions)
54.7
Debt Headroom (without credit rating) to 40%
Current Gearing:
7.9%
Headroom of approximately
S$ 314.1 million
Debt Headroom (with credit rating) to 60%Headroom of
approximatelyS$843.3 million
23

About Mohali Clinical Establishment
Fortis Hospital, Mohali
Operator Fortis Healthcare Limited (“Fortis”)
Nature of Interest Freehold
Care Type Tertiary
Operational Bed Capacity(as of 31 December 2013)
298
Installed Bed Capacity(as of 31 December 2013)
355 (including new Oncology block)
Independent Valuationas at 31 December 2013
INR 2,867 million
Purchase Price^ S$ 58.1 million(₹2,850 million )
Breakdown of Purchase Price:
Sale Deed ConsiderationBusiness Transfer Agreement ConsiderationAsset Transfer Deed Consideration
₹2,700 million
₹38.8 million ₹111.5 million
Asset Overview
24
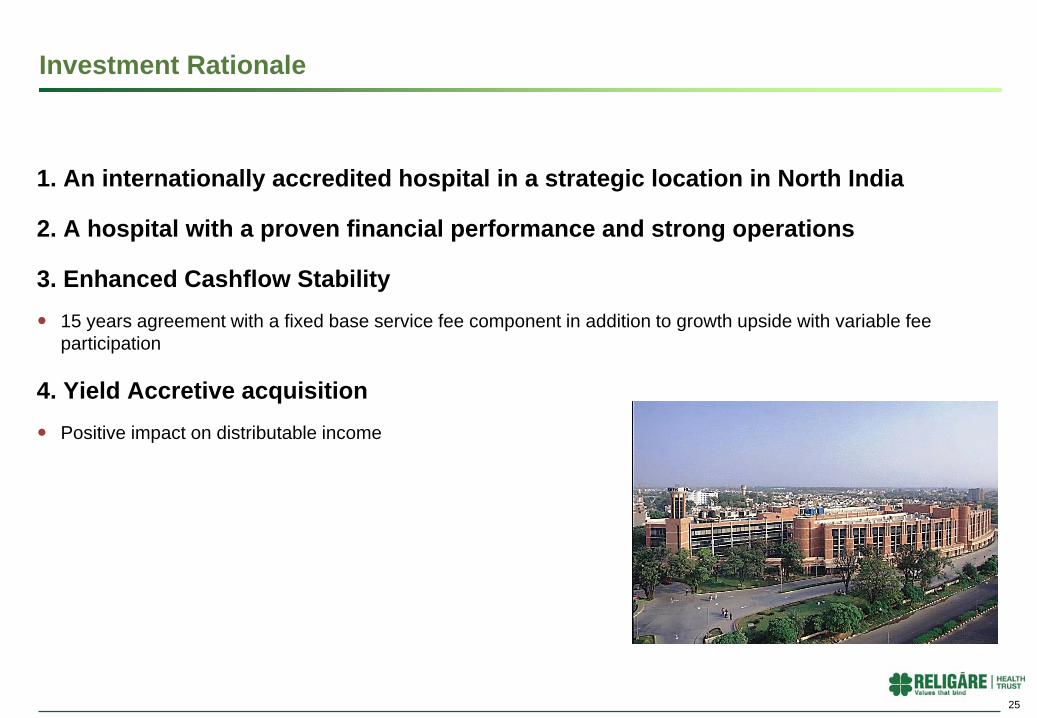
Investment Rationale
1. An internationally accredited hospital in a strategic location in North India
2. A hospital with a proven financial performance and strong operations
3. Enhanced Cashflow Stability 15 years agreement with a fixed base service fee component in addition to growth upside with variable fee
participation
4. Yield Accretive acquisition Positive impact on distributable income
25

More about MohaliOncology BlockOPD
CCU Patient Room
26

Historical Financial Performance (Q-o-Q)
Note: Figures for quarters ending March are not available as Fortis releases full year figures in March.
Figure for September 2012 and December 2012 were not publicly released by Fortis.
Revenue has been converted at SGD 1 = ₹49.62 as of 31 December 2013
Source: Results presentation slides from Fortis website
Average operating margin for the quarters above ~ 23.2%
0
2
4
6
8
10
12
14
16
18
20
Jun '09 Sep '09 Dec '09 Jun '10 Sep '10 Dec '10 Jun '11 Sep '11 Dec '11 Jun '12 Jun '13
Mohali Hospital Revenue (S$ million)
Revenue
27

Peer Analysis

Name Currency Last Price Open Close Change (%) Total Volume* Daily Average Volume*
Religare Health Trust SGD 0.775 0.795 0.775 (2.52) 97,840,000 1,553,016
First Real Estate Investment Trust SGD 1.06 1.11 1.06 (4.50) 58,314,000 925,619
Ascendas India Trust SGD 0.68 0.625 0.68 8.80 53,540,000 849,841
Parkway Life REIT SGD 2.35 2.32 2.35 1.29 21,987,000 349,000
Source: Miraqle
Figures as of 31 December 2013
Unit Price Performance
29
85%
90%
95%
100%
105%
110%
115%
01 Oct 13 10 Oct 13 22 Oct 13 31 Oct 13 11 Nov 13 20 Nov 13 29 Nov 13 10 Dec 13 19 Dec 13 31 Dec 13
RHT FTSE REIT STI AIT First REIT Plife REIT
RHT’s release of financial results for FY14

Comparative Analysis – Financial Analysis
Yield figures as at 13 January 2014 (OCBC Investment Research Weekly SREITs), Gearing figures are as announced by respective REIT/BT
RHT figures based on actual numbers, annualised yield and using share price of $0.775 as at 31 December 2013
P/B is based on NAV per unit of S$0.80 as of 31 December 2013
Figures for First Reit based on press release of their FY13 Q4 results released on 17 January 2014
7.9% 4.6% 7.0%11.0%
20%
33% 33%
7.9%
1.20
1.49
1.10
0.96
AIT Plife First Reit RHT
Yield Gearing ratio P/B
30

7.9% 7.6%
3.1% 2.9%
Actual Yr 2014 (annualised)
Projection Yr 2014
Financial Projection FY2014
Notes:(1) Exchange rate for annualised actual FY14 was S$ 1 = ₹ 49.62, Exchange rate for projected FY14 was S$1 = ₹ 46.7(2) Includes straight lining of Base Service Fee.(3) DPU calculated based on unit price of S$ 0.775 as at 31 December 2013(4) Annualised figures based on results for the quarter ended 31 December 2013
Revenue (1)(2)
(S$m)DPU Yield (3)
107.5109.4
Distributable Income (1)
(S$m)
11.0%
Gearing: 7.9%
Sponsor Waiver
4.7%
31
95.3
102.3
7.2
5.25
1.9
Actual Year 2014 (annualised)
Projection Year 2014
Service Fee Hospital Income Other Income
48.8
46.6
Actual Year 2014 (annualised)
Projection Year 2014
10.5%

Appendix

Awards & Accolades
Fortis Jaipur awarded ‘Six Sigma Healthcare Excellence Awards – 2013’ for Best Hospital in Patient Care, Best Hospital in Patient Safety and Best Hospital in Quality Initiatives.
Fortis Hospital, Anandpur has been ranked as No.2 Best Hospital in Multi-specialty category in Kolkata in a survey conducted by AC Nielson for The Week Magazine (Source: Fortis 3Q FY14 Presentation slides)
Fortis Hospital, Bannerghatta Road (BG Road), Bengaluru, has been ranked No. 4 on the 2013 World's Best Hospitals list for Medical Tourists. – The hospital has been recognised for the fourth consecutive year by the Medical Travel Quality Alliance
(MTQUA).
Fortis Healthcare Ltd has been conferred with the ‘Best Integrated Healthcare’ award for 2013 by Today’s Traveller.
33

Fortis – a stronger balance sheet Sale of international assets in 2013
Australia- Dental Corp for AUD 270 million
Vietnam- Hoan My Medical Medical Corp for US$80 million
Hong Kong- Quality Healthcare for US$355 million
Public Issue of Foreign Currency Convertible Bonds (FCCBs)
Issue of US$30 million listed on Singapore Exchange Ltd (SGX)
International Financial Corporation (IFC)
Invested a total of US$100 million through a mix of preferential allotment and FCCBs
Preferential Allotment of Equity Shares – Standard Chartered
3.7 million equity shares to Standard Chartered Pvt Equity Mauritius III (SCPE)
US$5.5 million raised
Gearing
Net Debt-to-Equity ratio stood at 0.2 (Dec’13) vs 0.6(Sep ‘13)1
1 Source: Fortis Q3 FY14 Presentation Slides
34

• 0.5% - 1.0% of acquisition price
• 0.5% of the sale price (Divestment to 3rd party)
• No divestment fee (Divestment to Sponsor)
Performance based management fees designed to align Management’s interests with Unitholders
Base fee Performance fee Acquisition / divestment fee
• 0.4% p.a. of the value of the Trust Property
• 50% to be paid in Units (1)• 4.5% p.a. of Distributable Income (2)
• 50% to be paid in Units (1)
• 2.0% of total development project costs• Payable in the form of cash and/ or units
Development fee Asset management fee
Fee Structure
• 1.0% of gross revenue• Paid quarterly in arrears• No asset management fee paid for assets
operated by Sponsor
Note (1) For the Forecast Year 2013 and Projection Year 2014(2) Distributable Income means the distributable amount determined by the Trustee-Manager in accordance with the terms of the Trust Deed
to be distributable for the relevant distribution period (pro-rated if applicable based on the number of months the relevant financial quarter bears to such distribution period) 35

Efficient Trust Structure
Note:(1) Promoters comprise Malvinder Mohan Singh, Shivinder Mohan Singh and their associates.
India Singapore
Acts on behalf ofUnitholders and provides
management servicesDistributions
Others New Unitholders Trustee-Manager
~19%~81%
Hospital and Medical Services Agreements(“HMSAs”)
Fortis Operating Companies
(“FOCs”) CCD Interest paymentsand dividends
Investments in CompulsoryConvertible Debentures
(“CCDs”) and equity shares
TM Fees
Distributions
100%
Hospital operatingcapabilities
Ownership of medical andhealthcare infrastructure facilities
Dividends 100%
28.0%
72.0%
Promoters (1)
Fortis Global Healthcare
InfrastructureService Fees
Clinical Establishment
Services Hospital Services
Companies (“HSCs”)
Fortis Health International Limited
(Mauritius)
100%
Dividends
36

Term of Agreement
15 years with option to extend by another 15 years by mutual consent
Primary Obligations of HSCos
Making available and maintaining the Clinical Establishments
Provision of outpatient services
Provision of radio diagnostic services
Primary Obligations of FOCs
Provision of healthcare services at the Clinical Establishments
Pay to HSCos the Services Fees and Commitment Deposits
Services Fee
Base Service Fee– Increased by 3% p.a.– Upward revision for any capex / expansion– Provision for capex to replace medical equipment
(“Technology Renewal Fee”) added to Base Fee (2)
– HSCos entitled to request for an advance of up to 60% of the Base Service Fee
Variable Service Fee– 7.5% of the operating income of the FOC
Commitment Deposits
FOC to pay to HSCo 25% of cost for expansions of capacity / modification of Fortis Hospitals as an interest free refundable commitment deposit
Income Secured Through Long Term Working Agreements
Mechanics of the HMSA Key Terms of the HMSA
Services Fees
Fortis OperatingCompany
Clinical Establishment
Operated by
Hospital Services Company
Ownership
Services
B
AC
Ancillary Services
Ownership Earnings
Commitment Deposits
D+
Public
Source: TMNotes:(1) Fortis has signed commitment agreements to enter into similar HMSAs for the greenfield healthcare infrastructure assets.(2) Technology Renewal Fee will be paid into a Technology Renewal Fund to be maintained by Fortis.
A
B
C
D
Prior to listing, the Hospital Services Companies (“HSCos”) will enter into Hospital and Medical Services Agreements (“HMSAs”) with the Fortis Operating Companies (“FOCs” ) to operate the healthcare infrastructure assets (1).
37

Thank You
38