religare corporate presentation · 3 sunil godhwani, cmd – religare enterprises (joined religare...
TRANSCRIPT

Religare Enterprises Limited Corporate Overview
June 2016

Leading financial services platform
Religare Enterprises Limited (REL) through its
subsidiaries has established itself in some of the
most promising verticals within Financial Services,
viz. Lending, Health Insurance and Capital Markets
Nationwide distribution footprint
Subsidiaries service over 1.14 mn. clients from
over 1,450 locations with more than 7,200
employees
Professional management team
Stable team with average senior management
tenure of ~7 years and experience of ~18 years
Key Financials (as at/quarter ended 31-Mar-2016)
Net worth: ₹3,863 cr. (USD 584 mn.)
Total assets: ₹27,429 cr. (USD 4.15bn.)
Total revenues: ₹4,503 cr. (USD 689 mn.)
Pre-exceptional PAT: ₹225 cr. (USD 34.5 mn.)
Market information
Listed on NSE and BSE: market capitalization of
₹5,109 cr. (~USD 773 mn.) as of 31-Mar-2016
Religare Overview Religare is focused on the most promising opportunities in the financial services space in India
1
Business Lines Religare Snapshot
Note: REL has exited the India Asset Management business in April 2016 and is in the process of exiting the Global Asset Management business
Lending
Leading SME-focused NBFC with deep domain knowledge
SMEs are constrained by lack of funding; the gap presents a lucrative opportunity for specialist financiers
Tapping the growing opportunity in lending for affordable housing
Capital Markets
Large retail broking platform, open architecture wealth management platform a and mid-market focused
institutional equities and investment banking platform
Immense opportunity from structurally high savings and low penetration of financial assets; equities in particular to benefit
Health Insurance
One of five standalone health insurers in India
Low insurance density; health insurance in particular growing rapidly due to rising cost of healthcare and disproportionate share of out-of-
pocket expenditure
Each of the verticals has attained critical scale and is proposed to be independently listed on the stock exchanges in order to sharpen focus on the individual businesses,
simplify structure and unlock value for stakeholders

Proposed Independent Listing of Verticals REL proposes to simplify its corporate by reorganizing itself into three independently listed companies
2
# Certain segments of the Capital Markets business are separately regulated and therefore operated through different legal entities
Current Structure
Religare Enterprises Limited
Proposed Structure (Indicative)
Shareholders
Religare Finvest Limited
Religare Housing Development Finance Corporation Limited
Religare Securities Limited
Operating Subsidiaries#
Lending Health Insurance Capital Markets
Shareholders
Housing Finance Operating Subsidiaries#
Len
din
g
• All stakeholders are likely to benefit from the simplification of structure
Each business able to define growth strategy independently; direct
management accountability for accomplishment of strategic objectives
Increased customer focus as each business will operate in one segment
Greater shareholder choice as shareholders will be able to participate to
different extents in different businesses
• REL’s Board has appointed a Management Committee to examine and
evaluate all aspects of the plan; the Committee will drive the preparation of a
detailed scheme of arrangement
• The plan is subject to final approval by the Board, shareholders, regulators and
judicial authorities
Highlights of the Proposed Reorganization
Ca
pit
al
Ma
rket
s
↑ Listed
↓ Unlisted
Religare Health Insurance Company Limited
Hea
lth
In
sura
nce
3
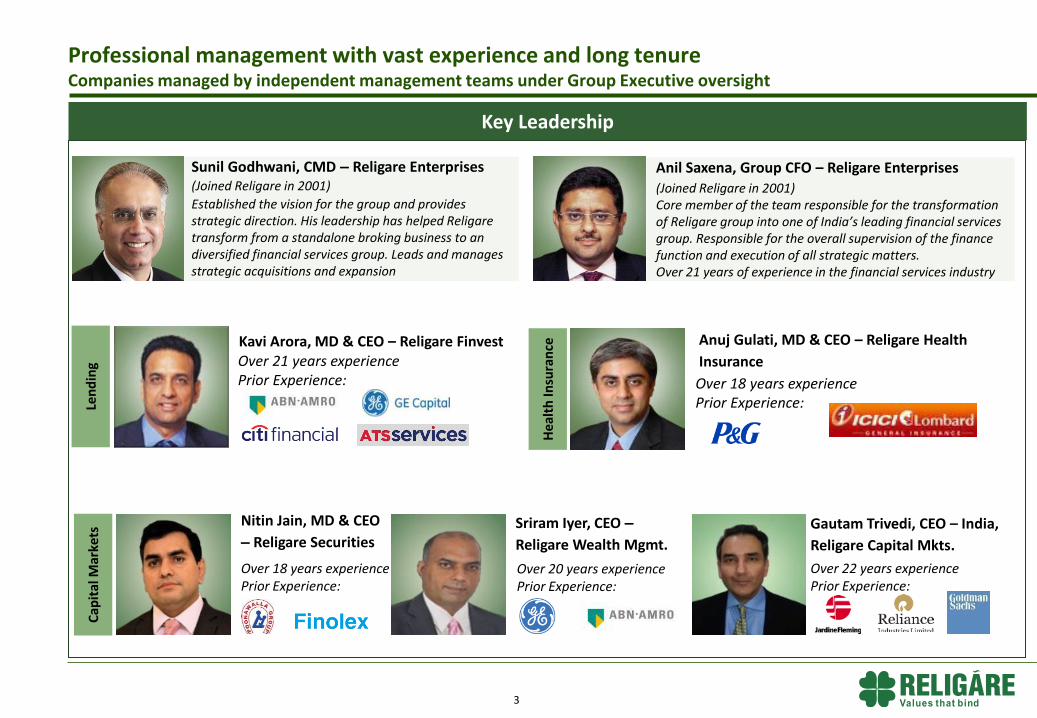
Sunil Godhwani, CMD – Religare Enterprises (Joined Religare in 2001)
Established the vision for the group and provides strategic direction. His leadership has helped Religare transform from a standalone broking business to an diversified financial services group. Leads and manages strategic acquisitions and expansion
Anil Saxena, Group CFO – Religare Enterprises
(Joined Religare in 2001) Core member of the team responsible for the transformation of Religare group into one of India’s leading financial services group. Responsible for the overall supervision of the finance function and execution of all strategic matters. Over 21 years of experience in the financial services industry
Professional management with vast experience and long tenure Companies managed by independent management teams under Group Executive oversight
Len
din
g C
apit
al M
arke
ts
Hea
lth
Insu
ran
ce
Kavi Arora, MD & CEO – Religare Finvest Over 21 years experience Prior Experience:
Anuj Gulati, MD & CEO – Religare Health
Insurance
Over 18 years experience Prior Experience:
Nitin Jain, MD & CEO
– Religare Securities
Over 18 years experience Prior Experience:
Sriram Iyer, CEO –
Religare Wealth Mgmt.
Over 20 years experience Prior Experience:
Gautam Trivedi, CEO – India,
Religare Capital Mkts.
Over 22 years experience Prior Experience:
Key Leadership

4
Robust platform in place to capture opportunities in financial services Multi-product manufacturing capabilities and distribution network
All data as at/for the quarter ended 31-Mar-2016
Lending
SME-focused Lending • Balance sheet size of ₹21,049 cr. (USD 3.18 bn.)
• High quality portfolio: net NPA of 2.31% (90-day basis)
• Capital adequacy (CRAR) of 16.7%
Affordable Housing Finance
• Loan book of ₹829 cr. (USD 126 mn.)
Capital Markets
Retail Broking Distribution across more than 440 cities, 1,320
locations and catering to over 1.14 mn. clients
Wealth Management Advisory-led open architecture platform
Institutional Equities and Investment Banking India institutional research team covers 155 stocks
Empanelled with more than 450 clients globally
Health Insurance
Health Insurance Leveraging group’s healthcare assets
GWP of ₹161 cr. (USD ~24 mn.); QOQ growth of 43%
4,869 hospitals in provider network
Multi-channel distribution including significant online
presence

Religare is poised to capture the buoyancy in Financial Services Financial Services highly correlated to economic growth and will gain from India’s superior growth trajectory
5
Leading financial services
platform with presence
across three verticals
Focus on servicing entire
customer spectrum
Judicious mix of balance
sheet-led and fee-based
businesses
Capital Markets Channelising risk capital to the markets
Retail and Mass Retail Higher savings from rising incomes
HNIs Allocating growing wealth across asset classes
Lending Providing debt capital to power growth of SMEs and affordable housing
Relig
are
Op
era
tin
g B
usin
esses
Targ
et C
usto
mer S
eg
men
ts
Health Insurance Protection for individuals, SMEs
Financial Institutions Capital flows tracking superior returns
SME & Mid-corporates Debt financing, equity raise, M&A, ECM
Financial Services businesses are highly correlated with economic growth; at India’s current stage of development, Financial Services is likely to grow at a multiple of the broader economy, unlocking the structural potential across the spectrum
The Indian economy is the fastest growing large economy; set to sustain world leadership in GDP growth rate

Key Businesses
Overview

Lending Business Overview
One of India’s largest Non-Banking
Financial Companies,
focusing on the SME segment
Business Highlights
Improve ROE
Grow Book Size
Ensure High Quality Portfolio
Strategic Priorities
8% 62%
Offerings
NBFC Balance Sheet of
₹21,049 cr. (USD 3.18 bn.)
Affordable Housing Finance book of
₹829 cr. (USD 126 mn.)
(as of 31-Mar-2016)
SME Lending
Capital Market
Lending
Affordable Housing Finance
7
Recognition CIBIL ‘Fast and
Upcoming’ Data Quality
Award - 2016

8
Non-Performing Assets§
Growth capital provider focused
on fast-growing SME segment
• The sector contributes 17%
to India’s GDP, 45% to
manufacturing output and
40% to the total value of
exports
Strong performance across credit
and operating benchmarks
• Secured asset finance
portfolio over 83%
• Net NPA of 2.31% on 90-day
basis and 1.77% on 150-day
basis as at 31-Mar-2016
Significant headroom for
operating leverage through
tested management strength,
processes and systems
Winner of ‘The Most Innovative
Risk Management Strategy’ at the
ERM Leadership Summit and
CIBIL ‘Fast and Upcoming’ Data
Quality Award
Key highlights Continued traction in SME-Secured segment: book size up 29% YOY
12.6
64.6
20.9
13.5
66.1
22.3 23.5
66.2
15.0
23.2
58.7
14.4
21.6
51.8
17.6
Religare Finvest SME-Secured drives growth in book size
(₹ cr.)
*Net of portfolio assigned to other lenders § NPAs are recognised at 90 days since Oct 2011 whereas regulations require transitioning from 180-day NPA recognition to 90-day recognition by 31-Mar-2018
285076118150
31-Mar-16
16,313
1,080
13,259
1,946
31-Dec-15
15,536
1,092
12,698
1,696
30-Sep-15
14,631
1,169
11,966
1,420
30-Jun-15
13,890
1,425
11,121
1,226
31-Mar-15
13,274
1,762
10,250
1,112
Capital Market Lending
SME-Secured*
Others
SME-Unsecured*
3.07%
3.49%
2.95%2.86%
2.24%
2.31%
2.78%
2.29%2.21%
1.69%
2.44%
1.77%
2.17%
1.65% 1.64%1.46%
1.19%
31-Dec-15 30-Sep-15
1.99%
30-Jun-15 31-Mar-15
1.19%
1.63%
31-Mar-16
NNPA 90 dpd
GNPA 90 dpd
NNPA 180 dpd
GNPA 180 dpd
NNPA 150 dpd
GNPA 150 dpd
Borrowing programme supported by superior ratings
NIM and Opex to ANR
4.23%4.13%4.54%
4.74%4.59%
2.06%2.42%2.37%
2.19%2.47%
Q4FY16 Q3FY16 Q2FY16 Q1FY16 Q4FY15
Opex/ ANR NIM
Additionally obtained Long Term rating of ‘CARE AA-’ for ₹1,400 mn. [~USD 212 mn]
Rating Type Rating Agency Amount
₹ cr. USD mn.
Commercial Paper [ICRA] A1+ ICRA 2,700 408 ST Debt [ICRA] A1+ ICRA 1,000 151 ST Bank Loans [ICRA] A1+ ICRA 600 91 LT Debt [ICRA] AA- (stable) ICRA 3,400 514 LT Bank Loans [ICRA] AA- (stable) ICRA 11,400 1,725 Market-Linked Deb. ICRA pp-MLD AA- ICRA 100 15 Tier-2 Sub. Debt IND AA- (stable) Ind-Ra 750 113 Commercial Paper IND A1+ Ind-Ra 3,000 454 ST Bank Loans IND A1+ Ind-Ra 3,000 454 LT Debt IND AA - (stable) Ind-Ra 3,000 454 LT Bank Loans IND AA - (stable) Ind-Ra 10,000 1,513
2.2 2.1 2.2 2.2 2.47 (USD bn.)
9
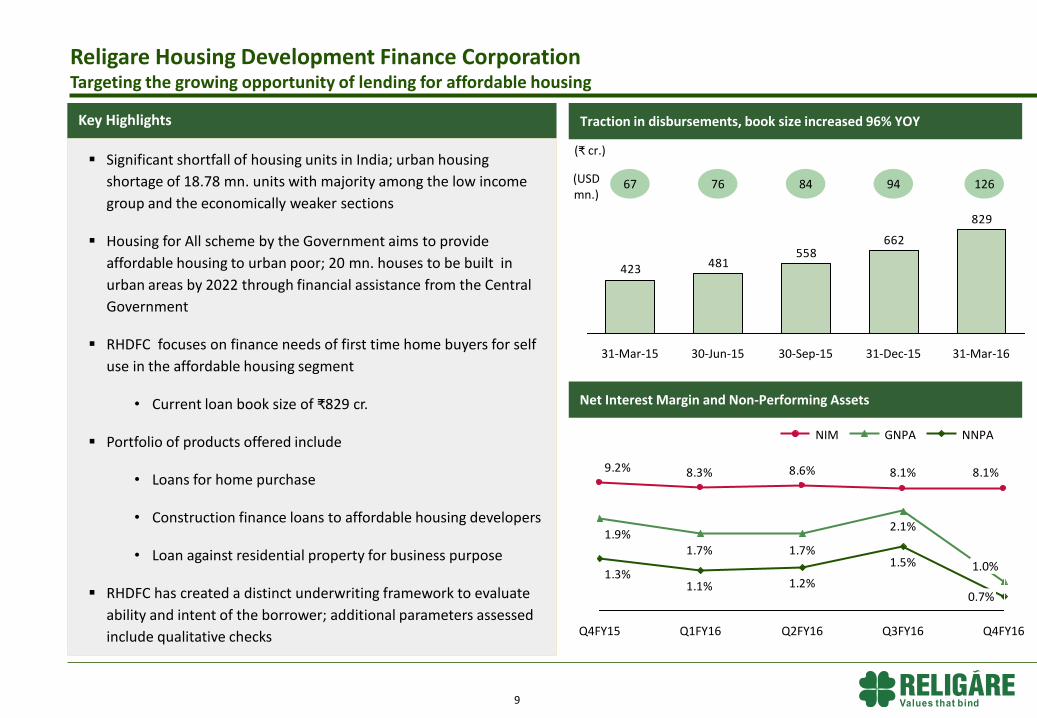
Traction in disbursements, book size increased 96% YOY
12.6
64.6
20.9
Religare Housing Development Finance Corporation Targeting the growing opportunity of lending for affordable housing
829
662558
481423
31-Mar-16 30-Jun-15 30-Sep-15 31-Dec-15 31-Mar-15
Net Interest Margin and Non-Performing Assets
2.1%
1.7%1.7%1.9%
1.5%
1.1%1.3%
1.2%
8.1%8.1%8.6%9.2% 8.3%
Q2FY16 Q3FY16
1.0%
Q4FY16
0.7%
Q1FY16 Q4FY15
Significant shortfall of housing units in India; urban housing
shortage of 18.78 mn. units with majority among the low income
group and the economically weaker sections
Housing for All scheme by the Government aims to provide
affordable housing to urban poor; 20 mn. houses to be built in
urban areas by 2022 through financial assistance from the Central
Government
RHDFC focuses on finance needs of first time home buyers for self
use in the affordable housing segment
• Current loan book size of ₹829 cr.
Portfolio of products offered include
• Loans for home purchase
• Construction finance loans to affordable housing developers
• Loan against residential property for business purpose
RHDFC has created a distinct underwriting framework to evaluate
ability and intent of the borrower; additional parameters assessed
include qualitative checks
Key Highlights
(₹ cr.)
67 (USD mn.)
76 84 94 126
NNPA GNPA NIM

10
Health Insurance Business Overview
Positioned to capture
significant Group Synergies
Retail & Group Health Plans
Retail & Group Accident Plans
International Travel Plan
GWP of
₹503 cr. (USD 77 mn.) in
FY16
4,869 hospitals in
provider network
(as of 31-Mar-2016)
Grow GWP with
efficient use of
Capital
‘FICCI Healthcare
Excellence Award –
2015’
Recognition
Business Highlights
Strategic Priorities
Offerings
11
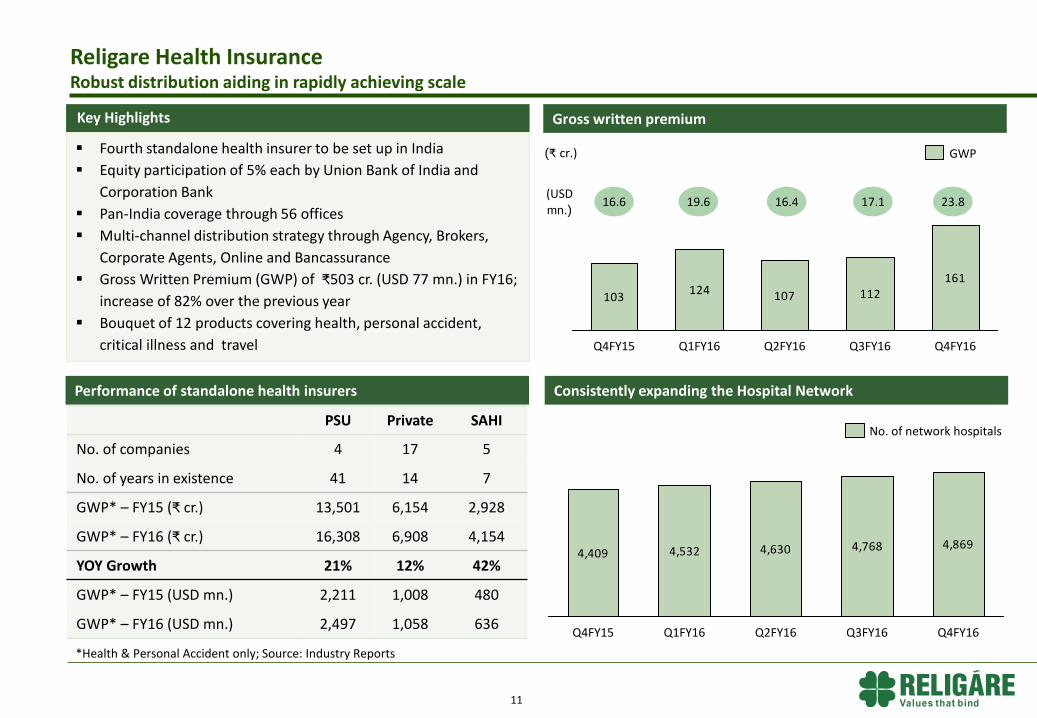
Performance of standalone health insurers
Religare Health Insurance Robust distribution aiding in rapidly achieving scale
Key Highlights
Fourth standalone health insurer to be set up in India
Equity participation of 5% each by Union Bank of India and
Corporation Bank
Pan-India coverage through 56 offices
Multi-channel distribution strategy through Agency, Brokers,
Corporate Agents, Online and Bancassurance
Gross Written Premium (GWP) of ₹503 cr. (USD 77 mn.) in FY16;
increase of 82% over the previous year
Bouquet of 12 products covering health, personal accident,
critical illness and travel
Gross written premium
Consistently expanding the Hospital Network
103124 107 112
161
Q2FY16 Q3FY16 Q4FY16 Q4FY15 Q1FY16
GWP
4,409 4,532 4,630 4,768 4,869
Q4FY16 Q1FY16 Q4FY15 Q2FY16 Q3FY16
No. of network hospitals PSU Private SAHI
No. of companies 4 17 5
No. of years in existence 41 14 7
GWP* – FY15 (₹ cr.) 13,501 6,154 2,928
GWP* – FY16 (₹ cr.) 16,308 6,908 4,154
YOY Growth 21% 12% 42%
GWP* – FY15 (USD mn.) 2,211 1,008 480
GWP* – FY16 (USD mn.) 2,497 1,058 636
(₹ cr.)
16.4 16.6 19.6 17.1 23.8 (USD
mn.)
*Health & Personal Accident only; Source: Industry Reports

12
Capital Markets Business Overview
A formidable capital markets platform with
extensive distribution capabilities
1.14 mn. Retail
Broking clients
Wealth Mgmt. AUM ₹4,055 cr. (USD
613 mn.) 155 stocks under
Research coverage
(q.e. 31-Mar-2016)
Retail Broking
Wealth Mgmt
Institutional Equities and
Investment Banking
Generate Superior
ROE
Attain Sustainable Profitability
Business Highlights
Strategic Priorities
Offerings Recognition
“Leveraging Digital and Technology for Business Growth”
Award at the Skoch BSE Award For
Aspiring India 2015
13
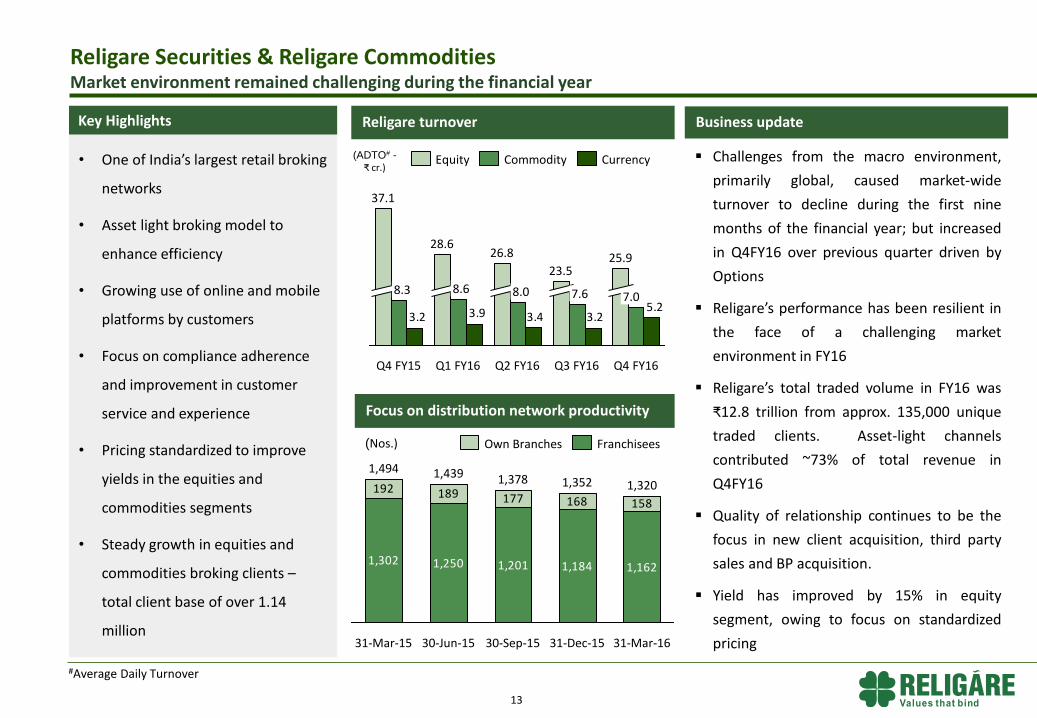
• One of India’s largest retail broking
networks
• Asset light broking model to
enhance efficiency
• Growing use of online and mobile
platforms by customers
• Focus on compliance adherence
and improvement in customer
service and experience
• Pricing standardized to improve
yields in the equities and
commodities segments
• Steady growth in equities and
commodities broking clients –
total client base of over 1.14
million
Key Highlights Religare turnover
Religare Securities & Religare Commodities Market environment remained challenging during the financial year
333
935
292
995
313
1,015
260
940
270
950
(ADTO# - ₹ cr.)
Focus on distribution network productivity
(Nos.)
Business update
#Average Daily Turnover
1,302 1,250 1,201 1,184 1,162
192 189 177 168 158
31-Mar-16
1,320
31-Dec-15
1,352
30-Sep-15
1,378
30-Jun-15
1,439
31-Mar-15
1,494
Franchisees Own Branches
Challenges from the macro environment,
primarily global, caused market-wide
turnover to decline during the first nine
months of the financial year; but increased
in Q4FY16 over previous quarter driven by
Options
Religare’s performance has been resilient in
the face of a challenging market
environment in FY16
Religare’s total traded volume in FY16 was
₹12.8 trillion from approx. 135,000 unique
traded clients. Asset-light channels
contributed ~73% of total revenue in
Q4FY16
Quality of relationship continues to be the
focus in new client acquisition, third party
sales and BP acquisition.
Yield has improved by 15% in equity
segment, owing to focus on standardized
pricing
5.23.23.43.93.2
Q4 FY16
7.0
25.9
Q3 FY16
7.6
23.5
Q2 FY16
8.0
26.8
Q1 FY16
8.6
28.6
Q4 FY15
8.3
37.1
Currency Equity Commodity

14
Key value proposition of
‘Simplified Wealth Solutions’ for
the customers
Seen as trusted advisors to
clients, enabled by our tripod
delivery model
Active advisory calls helping
clients position portfolios to gain
from high-impact events
Expanding product solutions to
enhance ability to win clients
across the group
Size and scale aligned to market
Focus on Relationship Manager
productivity
Key Highlights Client Base
Relationship Manager productivity Business update
4,492
4,972
4,687 4,662 4,631
₹ cr.
AUM
Religare Wealth Management Differentiating through a focused idea-driven approach
Inflows into Equity PMS schemes has become
one of the key contributors to the business,
with significant traction also having been built
up in Structured Products and Real Estate
backed high-yielding NCDs
Incrementally equity MF sales have declined
given the mood in the market. All the same,
trail income contribution to revenue has
improved significantly as an outcome of the
focus on building an annuity book
(₹ cr.)
3,945 4,029 4,008 4,0554,400
31-Mar-15 31-Mar-16 31-Dec-15 30-Sep-15 30-Jun-15
Total AUM
703 (USD mn.) 620 609 606 613
16.0 (USD mn.)
13.5 12.2 13.2 12.7
848781
86100
31-Mar-16 31-Dec-15 30-Sep-15 30-Jun-15 31-Mar-15
4,5144,4774,5074,5234,549
30-Sep-15 31-Mar-16 31-Dec-15 30-Jun-15 31-Mar-15
No. of Clients

Jan 2016 ₹120 cr.
Mar 2016 ₹118 cr.
Jan 2016 ₹250 cr.
Religare Capital Markets Poised to capitalise on multi-decade growth story in India
• Mid-market focused institutional equities and
investment banking platform
• Investment Banking platform offers life-cycle
investment banking services i.e. growth capital raise to
IPO to QIP to Block placements
• Closed calendar year 2015 as the No. 2 QIP manager in
India for transactions of more than USD 10 mn.
(excluding transactions for BFSI companies)
• Equity transactions of size aggregating to ₹940 cr. (USD
144 mn.) successfully executed during FY16
• Syndicated multiple debt issues aggregating to ₹440 cr.
(USD 67 mn.) during FY16
• 20 analysts in India’s Institutional Research team cover
155 stocks
• Equities businesses serve 452 clients globally with
differentiated research
Key Highlights
15
Select deals completed during FY2016
Block
Sole Placement Agent
Debt Syndication
Arranger
Aug 2015 ₹235 cr.
Open Offer
Lead Manager
Block
Sole Placement Agent
Crompton Greaves
Differentiating through original, on-the-ground research

Financial Services Opportunity in India

17
SMEs constitute a large contributor to national output and exports
SME Lending
Share of SMEs in India’s manufacturing
output
40%
Share of SMEs in India’s total exports
Source: CRISIL
Credit flow to the sector has improved in recent years as the potential of the sector is better understood
45%
6,8405,2804,860
3,6602,5802,160
1,260
2013 2009 2012 2011 2007 2008 2010
+33%
24.0% 16.5% Share of SMEs in banks’ industry and services portfolio
Outstanding SME credit as % of total outstanding bank credit
The SME sector is one of the largest generators of employment in India, employing 73 million people. The sector has been observed to outpace GDP growth in years of high growth.
However, providing credit to the sector commensurate with its contribution to national output is too daunting a task for banks
Bank credit to SMEs (₹ billion)
SMEs are the backbone of India’s economy but are constrained by lack of funding; specialist NBFCs with deep understanding of the workings of SMEs are crucial for bridging the gap
Gap in funding for SMEs presents a lucrative opportunity for specialist financiers

Health Insurance is on a high growth trajectory
18
532
33027824714589665428
DE KR BR IN ZA RU JP US
1,259
CN UK
xx% GWP as % of GDP Total premium (USD bn.)
1% 15% 4% 12% 7% 3% 12% 11% 8% 4%
Out-of-Pocket as % of Total Healthcare Expenditure
59%
35%35%31%
11%9%
CN IN RU BR US UK
Healthcare spend as a % of GDP
Source: Reserve Bank of India, World Bank, Economist Intelligence Unit, India Brand Equity Foundation, Karvy, Industry reports, Swiss Re, IRDAI SG=Singapore, MY=Malaysia, KR=S. Korea, JP= Japan, TH=Thailand, IN=India, ID=Indonesia, CN=China, RU=Russia, ZA=South Africa, DE=Germany, UK=United Kingdom, US= United States
Non-life insurance penetration in India is a mere 0.7% and Health Insurance is growing rapidly as healthcare costs are spiraling and share of out-of-pocket expense is among the highest
Health Insurance
17.90%
9.40%9.30%
6.30%5.40%
4.00%
RU CN IN US BR UK
248204
176153132
1128466513222
27%
FY08 FY07 FY06 FY09 FY16 FY15 FY14 FY13 FY12 FY11 FY10
Health Insurance GWP (₹ bn.)

Source: Reserve Bank of India, World Bank, Economist Intelligence Unit, India Brand Equity Foundation, Karvy, Industry reports Market Capitalization for US is of NYSE and for China of Shanghai Stock Exchange; Cash Trading velocity is defined as annual cash turnover divided by market capitalisation; Data for 31-Dec-2013 for all countries except India which is for 31-Mar-2014 SG=Singapore, MY=Malaysia, KR=S. Korea, JP= Japan, TH=Thailand, IN=India, ID=Indonesia, CN=China;
Surge in wealth and reallocation across asset classes to revive interest in Equities
19
274061
929395
160
252
MY SG CN ID IN TH JP KR
Market cap*/GDP (%)
32.254.6
25.3
45.5
24.3
63.7
0.90.49.13.5
5.2
43.2
18.9
228.4
109.9
2013
11.4
2018E
Provident Fund
Others
Mutual Funds
Small Savings/Cash
Insurance
Bank Deposits/ Bonds
Equity Distribution of individual wealth in India invested in financial assets (₹ trillion)
Capital Markets
38% xx% Cash Trading Velocity
Wealth Management
10%
39%17%26%
35%73%
59%
26%
15%
US Asia-Pacific India
51–65
Over 65
Under 50
177
94
2020E 2015E
+89% Total wealth of Ultra High Net Worth Individuals in India (₹ trillion)
Distribution of Ultra High Net Worth Individuals by Age Group
+162%
30%
104% 143% 106% 45% 33% 304%
Equity-related businesses to benefit from tailwinds as India is under-penetrated c.f. regional peers and a
correction to under-ownership of equities is imminent
Total wealth of UHNIs set to grow nearly 90% in 5 years; younger UHNI age profile provides opportunity to
innovate and make intense use of technology
Religare Enterprises Limited
A - 3,4,5, GYS Global, Sector - 125, Noida, U.P. – 201301, India